
EUROPEAN COMMISSION
DIRECTORATE-GENERAL
CLIMATE ACTION
Directorate C – Climate Strategy, Governance and Emissions from non-trading sectors
Unit C.2 – Governance and Effort Sharing
Guidance Document
The Monitoring and Reporting Regulation –
Guidance on Sampling and Analysis
MRR Guidance document No. 5,
Updated version of 7 October 2021
This document is part of a series of documents provided by the Commission services
for supporting the implementation of the “Monitoring and Reporting Regulation” (the
“MRR” or “M&R Regulation”) for the EU ETS (the European greenhouse gas Emission
Trading System). A new version of the MRR has been developed for the use in the 4
th
phase of the EU ETS, i.e. Commission Implementing Regulation (EU) 2018/2066 of 19
December 2018 in its current version
1
.
The guidance represents the views of the Commission services at the time of publica-
tion. It is not legally binding.
This guidance document takes into account the discussions within meetings of the in-
formal Technical Working Group on MRVA (Monitoring, Reporting, Verification and Ac-
creditation) under the WG III of the Climate Change Committee (CCC), as well as writ-
ten comments received from stakeholders and experts from Member States. This guid-
ance document was unanimously endorsed by the representatives of the Member
States of the Climate Change Committee by written procedure ending on 28
th
of Sep-
tember 2021.
All guidance documents and templates can be downloaded from the Commission’s web-
site at the following address:
https://ec.europa.eu/clima/policies/ets/monitoring_en#tab-0-1.
1
Updated by Commission Implementing Regulation (EU) 2020/2085 of 14 December 2020 amending and
correcting Implementing Regulation (EU) 2018/2066 on the monitoring and reporting of greenhouse gas
emissions pursuant to Directive 2003/87/EC of the European Parliament and of the Council; the
consolidated MRR can be found here:
https://eur-lex.europa.eu/legal-content/EN/TXT/?uri=CELEX%3A02018R2066-20210101.
Note: as some amendments to the MRR will start to apply on 1 January 2022 (see section 1.2 of GD 1
“What is new in the MRR”), they do not appear in the consolidated version in 2021. The complete
amendment can be found under https://eur-lex.europa.eu/eli/reg_impl/2020/2085/oj
2
TABLE OF CONTENTS
1 INTRODUCTION ............................................................................ 4
1.1 About this document ................................................................................. 4
1.2 How to use this document ........................................................................ 4
1.3 Where to find further information ............................................................ 5
2 OVERVIEW .................................................................................... 8
2.1 Overview of this document....................................................................... 8
2.2 Calculation factors – Principles ............................................................... 8
2.3 General requirements for laboratory analyses .................................... 10
2.4 Procedures for analytical methods ....................................................... 11
3 SAMPLING PLAN ........................................................................ 13
3.1 Introduction to sampling ........................................................................ 13
3.2 Sampling plan requirements of the MRR .............................................. 18
3.3 Preparing a sampling plan...................................................................... 21
4 FREQUENCY OF ANALYSES ..................................................... 23
4.1 Minimum frequency of analyses (Annex VII of the MRR) .................... 23
4.2 The “1/3” rule ........................................................................................... 24
4.3 Incurrence of unreasonable costs ......................................................... 26
4.4 Analyses frequency for specific situations .......................................... 27
5 LABORATORIES ......................................................................... 28
6 ONLINE GAS ANALYSERS ......................................................... 31
7 ANNEX I: ACRONYMS AND LEGISLATION ............................... 32
7.1 Acronyms used ........................................................................................ 32
7.2 Legislative texts ....................................................................................... 32
8 ANNEX II: EXAMPLE FOR A SAMPLING PLAN TEMPLATE ..... 33
9 ANNEX III – FREQUENTLY ASKED QUESTIONS ...................... 38
9.1 Supplier data: What if the supplier does not provide sufficient
information for demonstrating compliance with the required tiers? . 38
9.2 Online gas analysers: What is the (initial) validation and how can it be
performed? ............................................................................................... 39
9.3 How can it be determined whether a sample taken is “representative”?
................................................................................................................... 40
9.4 How to proceed if the application of tier 3, i.e. analysis in accordance
with Articles 32 to 35, incurs unreasonable costs? ............................. 41

3
Version History
Date
Version status
Remarks
5 Oct 2012
published
Endorsed by CCC on 28 September 2012
27 November
2017
re-published
Correct reference to updated Annex VII of the MRR;
update of references to standard and legislation;
wording updates (e.g. chapter 5 on equivalence of la-
boratories)
7 October 2021
Updated version
endorsed by
CCC
Revision: move from MRR 2012 to MRR 2018, includ-
ing its revision in 2020, i.e. revision for use in the 4th
phase of the EU ETS
Clarification on the “1/3” rule in section 4.2
Clarification in chapter 6 on the relation between
online gas analysers and the provisions in Articles 33
to 35
Inclusion of Frequently Asked Questions

4
1 INTRODUCTION
1.1 About this document
This document is part of a series of guidance documents provided on specific topics of
monitoring and reporting under the EU ETS. While Guidance Document No. 1 provides
a general overview on monitoring and reporting of emissions from installations under
the EU ETS, this document (Guidance Document No. 5) explains in more detail the
requirements for laboratory analyses. It has been written to support the M&R Regulation
as well as the Guidance Document No. 1, by explaining its requirements in a non-legis-
lative language. However, it should always be remembered that the Regulation is the
primary requirement.
This document interprets the Regulation regarding requirements for installations. It
builds on guidance and best practice identified during earlier phases of the EU ETS.
It also takes into account the valuable input from the task force on monitoring and re-
porting established under the EU ETS Compliance Forum, and from the informal Tech-
nical Working Group on Monitoring, Reporting, Verification and Accreditation (TWG on
MRVA) of Member State experts established under the Working Group 3 (WG III) of the
Climate Change Committee.
1.2 How to use this document
Where article numbers are given in this document without further specification, they
always refer to the M&R Regulation (MRR) in its current version
2
.For acronyms, refer-
ences to legislative texts and links to further important documents, please see the An-
nex.
This document only refers to emissions starting from 2021 (with the exception of bio-
mass-related topics, which will apply in full only from 2022). A “New!” symbol (such as
on the margin here) indicates where changes to requirements compared to the MRR
2012 have taken place.
This symbol points to important hints for operators and competent authorities.
This indicator is used where significant simplifications to the general requirements of
the MRR are promoted.
The light bulb symbol is used where best practices are presented.
The small installation symbol is used to guide the reader to topics which are applicable
for installations with low emissions.
The tools symbol tells the reader that other documents, templates or electronic tools are
available from other sources (including those still under development).
The book symbol points to examples given for the topics discussed in the surrounding
text.
2
Implementing Regulation (EU) 2018/2066; The consolidated MRR can be found here:
https://eur-lex.europa.eu/eli/reg/2018/2066
small

5
1.3 Where to find further information
All guidance documents and templates provided by the Commission on the basis of the
M&R Regulation and the A&V Regulation can be downloaded from the Commission’s
website at the following address:
https://ec.europa.eu/clima/policies/ets/monitoring_en#tab-0-1
The following documents are provided
3
:
“Quick guides” as introduction to the guidance documents below. Separate docu-
ments are available for each audience:
Operators of stationary installations;
Aircraft operators;
Competent Authorities;
Verifiers;
National Accreditation Bodies.
Guidance document No. 1: “The Monitoring and Reporting Regulation – General
guidance for installations”. This document outlines the principles and monitoring
approaches of the MRR relevant for stationary installations.
Guidance document No. 2: “The Monitoring and Reporting Regulation – General
guidance for aircraft operators”.
Guidance document No. 3: “Biomass issues in the EU ETS”: This document dis-
cusses the application of sustainability criteria for biomass, as well as the require-
ments of Articles 38 and, 39 of the MRR. This document is relevant for operators of
installations as well as useful background information for aircraft operators.
Guidance document No. 4: “Guidance on Uncertainty Assessment”. This document
for installations gives information on assessing the uncertainty associated with the
measurement equipment used, and thus helps the operator to determine whether
he can comply with specific tier requirements.
Guidance document No. 4a: “Exemplar Uncertainty Assessment”. This document
contains further guidance and provides examples for carrying out uncertainty as-
sessments and how to demonstrate compliance with tier requirements.
Guidance document No. 5: “Guidance on Sampling and Analysis” (only for installa-
tions). This document deals with the criteria for the use of non-accredited laborato-
ries, development of a sampling plan, and various other related issues concerning
the monitoring of emissions in the EU ETS (this document).
Guidance document No. 5a: “Exemplar Sampling Plan”. This document provides
an example sampling plan for a stationary installation.
Guidance document No. 6: “Data flow activities and control system”. This document
discusses possibilities to describe data flow activities for monitoring in the EU ETS,
3
This list reflects the status at the time of writing this updated guidance. Further documents may be added
later.

6
the risk assessment as part of the control system, and examples of control activities.
It is relevant to installations as well as for aircraft operators.
Guidance document No. 6a: “Risk Assessment and control activities – examples”.
This document provides further guidance and an example for a risk assessment.
Guidance document No. 7: “Continuous Emissions Monitoring Systems (CEMS)”.
For stationary installations, this document gives information on the application of
measurement-based approaches where GHG emissions are measured directly in
the stack, and thus helps the operator to determine which type of equipment has to
be used and whether he can comply with specific tier requirements.
Guidance document No. 8: “EU ETS Inspections”. This document provides guid-
ance for competent authorities for carrying out inspections. It mainly focusses on
site-visit inspections of stationary installations.
The Commission furthermore provides the following electronic templates:
Template No. 1: Monitoring plan for the emissions of stationary installations
Template No. 2: Monitoring plan for the emissions of aircraft operators
Template No. 3: Monitoring plan for the tonne-kilometre data of aircraft operators
Template No. 4: Annual emissions report of stationary installations
Template No. 5: Annual emissions report of aircraft operators
Template No. 6: Tonne-kilometre data report of aircraft operators
Template No. 7: Improvement report of stationary installations
Template No. 8: Improvement report of aircraft operators
There are furthermore the following tools available for operators:
Unreasonable costs determination tool;
Tool for the assessment of uncertainties;
Frequency of Analysis Tool;
Tool for operator risk assessment.
The following MRR training material is available for operators:
Roadmap through M&R Guidance
Uncertainty assessment
Unreasonable costs
Sampling plans
Data gaps
Round Robin Test
Besides these documents dedicated to the MRR, a separate set of guidance documents
on the A&V Regulation is available under the same address.
All EU legislation is found on EUR-Lex: http://eur-lex.europa.eu/
The most important legislation is furthermore listed in the Annex of this document.

7
Also, competent authorities in the Member States may provide useful guidance on their
own websites. Operators of installations should in particular check if the competent au-
thority provides workshops, FAQs, helpdesks etc.

8
2 OVERVIEW
2.1 Overview of this document
Note: This document is only relevant for installations which determine calculation
factors by analyses, or – regarding the competence requirements of laboratories
– apply on-line gas analysers or continuous emission measurement systems
(CEMS).
This document provides an overview of the importance of sampling and analysis and
how this topic is treated in the MRR. In particular, the MRR uses the term “analyses in
accordance with Article 32 to 35” on several occasions where calculation factors are to
be determined by analysis (usually in the context of high tier approaches). Section 2.2
provides an introduction to this topic. Section 2.3 then gives a more detailed summary
of the MRR’s requirements for analyses, and explains also how those requirements
relate to situations where the MRR allows the use of “industry best practice”.
Chapter 3 gives guidance on the requirements of Article 33 for preparing a sampling
plan. Chapter 4 discussed how to determine the appropriate frequency of analyses
based on Article 35.
Thereafter the requirements for laboratories used to carry out analyses for the determi-
nation of calculation factors as laid down in Article 34 are elaborated in Chapter 5. This
focusses particularly on the possibilities to demonstrate equivalence to an accredited
service, if the laboratory is not accredited in accordance with EN ISO/IEC 17025.
Annex II supplements Chapters 3 and 4 by providing an example of a sampling plan
template.
2.2 Calculation factors – Principles
[This section is based on section 6.2 of Guidance Document 1 (general guidance for
installations). It is included here for reasons of completeness and to allow this to be read
as a self-standing document.]
Calculation factors are the focus of this paper. These factors are:
In the case of the standard methodology for combustion of fuels, or fuels used as
process input: Emission factors, net calorific values, oxidation factors and biomass
fractions;
In the case of the standard methodology for process emissions (in particular de-
composition of carbonates): Emission factors and conversion factors;
For mass balances: Carbon contents and, if applicable, the biomass fractions and
net calorific values.
The following formula shows how the calculation factors relate to the calculation of emis-
sions. The example relates to the most common case, i.e. emissions from the combus-
tion of fuels, using the standard calculation method in accordance with Article 24(1):

9
Example: Calculation-based monitoring of combustions of fuels
)1( BFOFEFNCVADEm
Where:
Em ...... Emissions [t CO
2
]
AD ....... Activity data (= fuel quantity) [t or Nm
3
]
Calculation factors:
NCV .... Net Calorific Value [TJ/t or TJ/Nm
3
]
EF ....... Emission factor [t CO
2
/TJ, t CO
2
/t or t CO
2
/Nm
3
]
OF ....... Oxidation factor [dimensionless]
BF ....... Biomass fraction [dimensionless]
According to Article 30(1) of the MRR, these factors can be determined by one of the
following principles:
a. from default values (see section 6.2.1 of guidance document No. 1); or
b. by laboratory analyses.
The applicable tier will determine which of these options is used. Lower tiers allow for
default values, i.e. for values which are kept constant throughout the years, and updated
only when more accurate data becomes available. The highest tier defined for each
parameter in the MRR is usually the laboratory analysis, which is more demanding, but
of course more accurate. The result of the analysis is valid for each batch from which
the sample has been taken, while a default value is usually an average or conservative
value determined on the basis of big quantities of that material. For example, emission
factors for coal as used in national inventories might be applicable to a country-wide
average of several (or even many) coal types as used also in energy statistics, while an
MRR analysis will be valid for the particular batch analysed (one coal type).
Important note: In all cases, the operator must ensure that activity data and all calcu-
lation factors are used consistently. Where a fuel’s quantity is determined in the wet
state before entering the boiler, the calculation factors must also refer to the wet state.
Where analyses are carried out in the laboratory from the dry sample, the moisture must
be taken into account appropriately, for arriving at calculation factors applicable for the
wet material.
Operators must also be careful not to mix up parameters of inconsistent units. Where
the amount of fuel is determined per volume, also the NCV and/or emission factor must
refer to volume rather than mass
4
.
With respect to biomass source streams, the operator has to determine the biomass
fractions only for mixed fuels or materials. For the biomass fraction of all other fuels or
materials, the operator may use either a default value of 100% where the fuel or material
consists exclusively of biomass, or a default value of 0% for fossil fuels or material.
However, Article 38(5) stipulates that the operator may only apply an emission factor of
4
See section 4.3.1 of guidance document No. 1

10
zero (i.e. a biomass fraction of 100%) for biomass if he can demonstrate that biofuels,
bioliquids and biomass fuels used for combustion comply with the sustainability and the
greenhouse gas emissions saving criteria of the RES Directive
5
. For further guidance
on biomass related topics, please see section 6.3.5 of Guidance Document 1 and Guid-
ance Document 3.
2.3 General requirements for laboratory analyses
Where the MRR refers to determination “in accordance with Article 32 to 35”, this
means that a parameter must be determined by (chemical) laboratory analyses. The
MRR imposes relatively strict rules for such analyses, in order to ensure valid and com-
parable results at a high quality level. In particular, the following points need consider-
ation:
The laboratory must demonstrate its competence. This is achieved by one of the
following approaches:
An accreditation in accordance with EN ISO/IEC 17025, where the analysis
method required is within the accreditation scope; or
Demonstrating that the criteria listed in Article 34(3) are satisfied. This is con-
sidered reasonably equivalent to the requirements of EN ISO/IEC 17025. Note
that this approach is allowed only where use of an accredited laboratory is
shown to be technically not feasible or involving unreasonable costs.
The way samples are taken from the material or fuel to be analysed is considered
crucial for receiving representative results.
6
Therefore, operators have to develop
sampling plans in the form of written procedures (see Chapter 3) and get them
approved by the competent authority. Note that this applies also where the operator
does not carry out the sampling himself, but treats it as an outsourced process.
Analytical methods usually have to follow international or national standards
7
.
Note that the above is usually related to the highest tiers for calculation factors. There-
fore, these rather demanding requirements are rarely applicable to smaller installations.
In particular operators of installations with low emissions may use “any laboratory that
is technically competent and able to generate technically valid results using the relevant
analytical procedures, and that provides evidence for quality assurance measures as
referred to in Article 34(3)”. In fact, the minimum requirements would be that the labor-
atory demonstrates that it is technically competent and “capable of managing its per-
sonnel, procedures, documents and tasks in a reliable manner”, and that it demon-
strates quality assurance measures and corrective actions, if needed, for calibration and
5
For this purpose, the “RED II” (Directive (EU) 2018/2001 of the European Parliament and of the Council of
11 December 2018 on the promotion of the use of energy from renewable sources (recast)) will have to be
used from 1 January 2022. In 2021, the RED I (Directive 2009/28/EC) still applies. For more details, see
guidance document No. 3.
6
Question 4.3 of the FAQ document may provide further helpful information on how to determine whether a
sample is “representative”. The FAQs can be downloaded under the following link: https://ec.eu-
ropa.eu/clima/sites/clima/files/ets/monitoring/docs/faq_mmr_en.pdf
7
For the use of standards, Article 32(1) defines the following hierarchy: “The operator shall ensure that any
analyses, sampling, calibrations and validations for the determination of calculation factors are carried out
by applying methods based on corresponding EN standards.
Where such standards are not available, the methods shall be based on suitable ISO standards or national
standards. Where no applicable published standards exist, suitable draft standards, industry best practice
guidelines or other scientifically proven methodologies shall be used, limiting sampling and measurement
bias.”
small

11
test results
8
. However, it is in the operator’s interest to receive reliable results from the
laboratory. Therefore, operators should strive to comply with the requirements of Article
34 to the highest degree feasible.
Furthermore, it is important to note that the MRR, in the activity specific requirements
of Annex IV, allows the use of “industry best practice guidelines” for some lower tiers.
In some cases, this is the lowest tier where no default values are applicable. In such
cases, where despite approval to apply a lower tier methodology analyses are still re-
quired, it may not be appropriate or possible to apply Articles 32 to 35 in full. However,
the competent authority should deem the following as minimum requirements:
Where the use of an accredited laboratory is technically not feasible or would lead
to unreasonable costs, the operator may use any laboratory that is technically com-
petent and able to generate technically valid results using the relevant analytical
procedures, and that provides evidence for quality assurance measures and cor-
rective actions, if needed, as referred to in Article 34(3).
The operator should submit a sampling plan in accordance with Article 33.
The operator should determine the frequency of analysis in accordance with Article
35.
2.4 Procedures for analytical methods
Annex I of the MRR requires that a monitoring plan shall contain, if applicable, a list of
the analytical methods to be used for the determination of all relevant calculation factors
for each source streams, and a description of the written procedures for those analyses.
How such procedures can be described in the monitoring plan is shown by the following
example.
Example of the required MP summary for an analysis procedure:
Item according to
Article 12(2)
Possible content (examples)
Title of procedure
Analysis of NCV of solid and liquid fuels.
Reference for proce-
dure
Solid fuels: ANA 1-1/UBA; Liquid fuels: ANA 1-2/UBA; Compari-
son by external (accredited) laboratory: ANA 1-3/ext
Diagram reference
(where applicable)
N.A.
Brief description of
procedure
Bomb calorimeter method is used. Appropriate amount of sample
is based on experience from earlier measurements of similar ma-
terials.
Samples are used in dry state (dried at 120°C for at least 6h).
NCV is corrected for moisture content by calculation.
Solid fuels: as in standard. Liquid fuels: Only slightly adapted from
standard; samples are not dried.
Post or department
responsible for the
procedure and for any
data generated
Company's Laboratory - Head of department. Deputy: HSEQ man-
ager.
8
Examples for such measures are given in Article 34(3), point (j): regular participation in proficiency testing
schemes, applying analytical methods to certified reference materials, or inter-comparison with an
accredited laboratory.

12
Location where rec-
ords are kept
Hardcopy: Laboratory Office, shelf 27/9, Folder identified “ETS 01-
ANA-yyyy” (where yyyy is the current year).
Electronically: “P:\ETS_MRV\labs\ETS_01-ANA-yyyy.xls”
Name of IT system
used (where applica-
ble).
Internal log of the lab (MS Access database): sample numbers
and origin/name of sample are tracked together with the results.
List of EN or other
standards applied
(where relevant)
EN 14918:2009 with modifications for using also for non-biomass
and liquid fuels.

13
3 SAMPLING PLAN
3.1 Introduction to sampling
“Frequency of Sampling” versus “Frequency of Analyses”
The MRR refers to “Frequency of Analyses” in Article 35 (see chapter 4). Depending on
the specific situation the resulting requirement in the approved monitoring plan for the
operator may be e.g. that the minimum frequency of analyses of the emission factor of
a certain source stream is four times a year.
This term “Frequency of Analyses” must not be confused with the “Frequency of Sam-
pling”, i.e. the frequency of taking samples or increments from a batch or delivery of a
fuel or material. In general, a lot more samples/increments than four have to be taken
over the year to obtain representative results. This Chapter 3 and its sections only deal
with the frequency of taking samples.
The following example should help to clarify.
Example: A coal firing plant is burning 500,000 tonnes of coal a year. In accordance
with Annex VII (also see section 4.1), the operator is required as a minimum to analyse
every 20,000 tonnes of coal. This will at least result in 25 different laboratory samples
that are analysed each year. The main objective of the sampling plan, which also in-
cludes the frequency of sampling, is to prepare (at least) 25 laboratory samples that are
representative for each of the 20,000 tonne batches. In order to have representative
laboratory samples more than just one sample/increment will have to be taken from
each 20,000 tonne batch.
Sampling is a very important task wherever something is to be analysed in a laboratory.
It is crucial to develop and apply a reproducible methodology (the sampling plan) which
ensures that the sample taken is representative of the whole batch or delivery from
which the sample is taken. The sampling plan describes the overall aims and objectives;
it includes specific and practical instructions on what is going to be sampled, how it will
be sampled, at what frequency, what the sample will be analysed for and by whom. It
covers all steps from drawing the sample until the sample is being analysed. An appro-
priate sampling plan provides transparency to all users and will not only improve the
reliability of the results and the level of assurance; it may also help to reduce costs for
analyses and verification.
The complexity of the sampling plan will to a large extent depend on the degree of
heterogeneity of the fuel or material. In general, it might be useful in complex cases to
put some effort into the preparation of an elaborate sampling plan. However, it should
also be noted that the use of highly heterogeneous materials is not a very common
practice in EU ETS installations. Therefore, few installations will have to develop so-
phisticated sampling plans. In many cases it may happen that sampling used for other
purposes (such as quality or process control) can be used (as it is) without further ad-
aptation, as the examples show.
The development of a sampling plan is explained in section 3.3. Sampling is more com-
plicated the more heterogeneous the material is. For a very homogeneous material (e.g.
a liquid fuel which is homogenised in a tank by stirring) a simple sample of 50 ml may
well be representative for the whole 500 tonnes in the tank. At the other end of the

14
spectrum, some waste fractions (e.g. electronic scrap) may consist of items each be-
yond 50 kg mass, while a laboratory analysis usually needs only samples of some grams
or even in some cases micrograms (µg).
The aim of every sampling exercise is that the final sample in the laboratory is as rep-
resentative of the whole delivery period or batch of fuel or material as possible. It is a
statistical exercise to determine how many “increments” (smaller samples which are
combined into a bigger sample) must be picked from a batch, and how big the incre-
ments must be, in order to obtain a reasonably representative “composite sample”. The
increments must be considerably bigger than the particle size, and the locations of sam-
pling should be spread over the whole area to be sampled. The number of increments
must be high enough to allow a meaningful average.
Example 1: An installation is burning clay delivered by storage tanks on trucks.
To determine the properties of this source stream, e.g. the EF, each delivery is
sampled and treated according to industry best practise.
Example 2: A power plant is firing coal. Sampling is done by an automatic sam-
pler from the onsite coal stockpile.
In both examples, the provision of a written procedure for the sampling plan may
well be an exercise of documenting what is already being done in the past rather
than implementing any new process steps.
Example 3: A cement clinker producing installation is exclusively firing petcoke.
The operator intends to additionally burn waste tyres and other solid recovered
fuels.
In this case, the operator is well advised to carefully study relevant standard doc-
uments (see below) to prepare a transparent sampling plan accompanied by the
underpinning procedure. The accredited laboratory that will be engaged for the
analyses may also be consulted for the purpose of preparing an appropriate sam-
pling approach.
Example:
Figure 1 shows a population that consists of a physical mixture of two compo-
nents that are different in the one material property of interest (indicated by the
two different colours), e.g. the NCV. The average value of the property of the
population is of interest. It is assumed that only increments sizes of 2x2 boxes
(bold frames) can be taken.
This example should help the understanding that even rather simple cases re-
quire some effort to prepare an appropriate sampling plan providing representa-
tive results after analyses.
Although in the population there are as many green boxes as red ones, each
2x2 increment may contain different numbers of green and red ones. Due to this
problem where, in practice, the material may not show visible differences, one
of the main tasks of a sampling plan would be to determine the number of incre-
ments necessary to obtain sufficiently representative overall results (i.e. to have
an equal number of green and red boxes for analysis).

15
Figure 1: Example of a random two-component mixture with highly uniform particle size
distribution. The bold squares illustrate possible samples to be taken.
Furthermore, sampling often requires several consecutive steps of picking increments
from a pile, mixing these to a new sample, reducing the particle size, taking new
(smaller) samples, mixing again and reducing the size etc., until a final laboratory sam-
ple can be obtained. As indicated at the beginning, this process needs more effort the
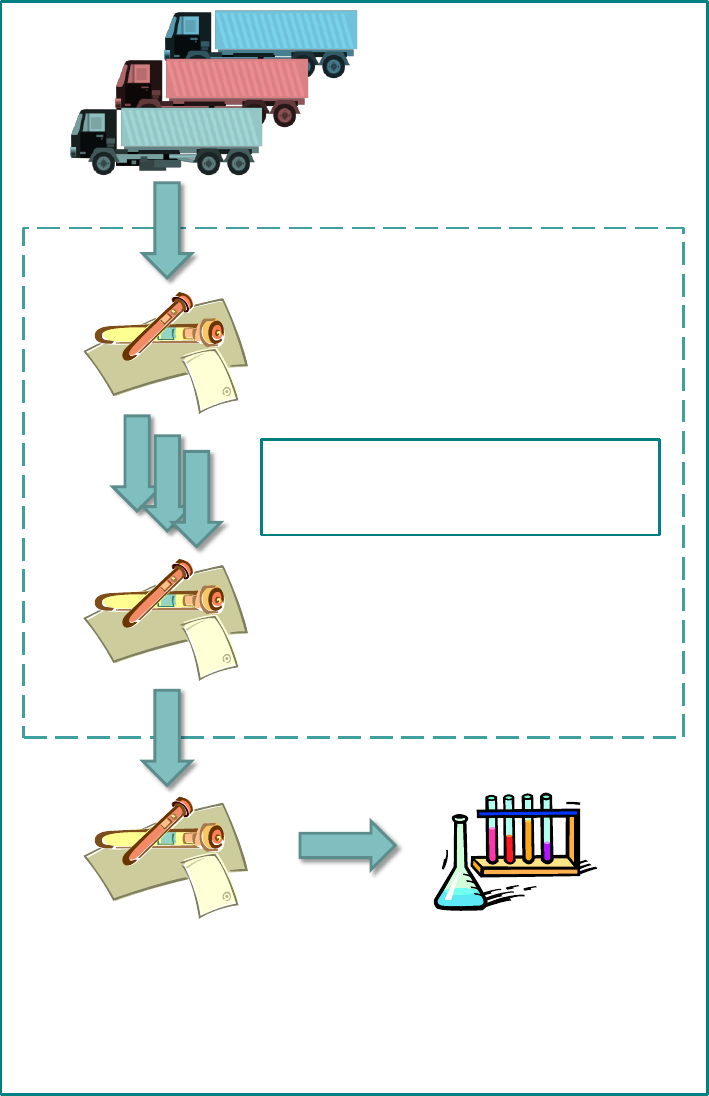
more heterogeneous a material is and the bigger the individual particles are. Figure 2
shows an example of a flow chart to help understand the role of sampling in the deter-
mination of calculation factors. Figure 3 shows a more detailed example of a sampling
plan.
16
Figure 2: Example of a flow sheet for sampling and analyses
(Composite) sample: e.g. increment or
sample taken from every truck delivery
(1 g to 100 kg scale)
Storage, mixing, sub-sampling, (particle
size reduction) and homogenisation of the
samples in installation‘s own laboratory
Final (sub)-sample : e.g. laboratory
sample analysed on the analytical
device (µg to mg scale)
the (weighted) average of all
analytical values in the reporting
period will be used for the
determination of the calculation factor
Mixed samples: combined samples
from several different trucks and from
different points in time
Process steps within the
boundaries of the sampling plan
Sample in accredited laboratory
Truck deliveries in the reporting
period
Transfer to accredited
laboratory
17
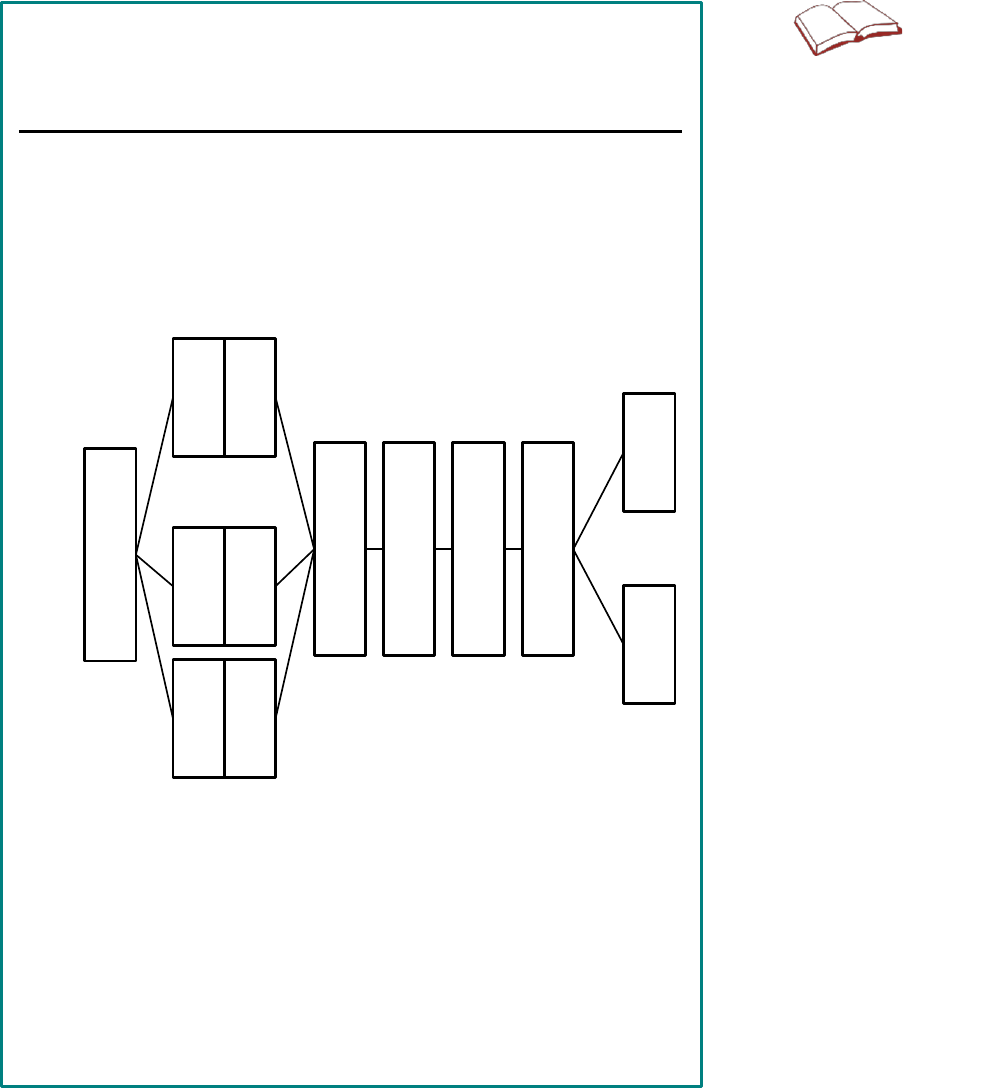
Figure 3. Example of a sampling plan flow sheet for the determination of the carbonate
content of clay
25,000 kg
Delivered amount
per truck
60 kg
30 kg
15 kg
1 kg
1 g 1 g
Increments
Combined samples
Sub-sample 1
Sub-sample 2
Sub-sample delivered
to laboratory
Analytical sample analysed
by the laboratory
1
5 kg
2
5 kg
12
5 kg
…
Grinding, mixing, dividing
Grinding, mixing, dividing
Dividing
Grinding, mixing, dividing
50 mm
50 mm
5 mm
1 mm
1 mm
0.06 mm
Particle
size
Treatment

18
Generally, all standards containing provisions for preparing sampling plans are suitable,
in particular those related to the specific type of source stream, e.g. coal. The following
standards and technical reports may be considered when preparing a sampling plan, in
particular for more complex cases:
EN 932-1: Tests for general properties of aggregates - Part 1: Methods for sam-
pling
EN ISO 10715: Natural gas - Sampling guidelines
ISO 13909-2: Hard coal and coke -- Mechanical sampling -- Part 2: Coal -- Sam-
pling from moving streams
EN 14899: Characterization of waste – Sampling of waste materials – Frame-
work for the preparation and application of a sampling plan
CEN/TR 15310: Characterization of waste – Sampling of waste materials
This technical report consisting of five parts assists and supple-
ments EN 14899
EN 15442: Solid recovered fuels – Methods for sampling
EN 15443: Solid recovered fuels – Methods for the preparation of the laboratory
sample
EN 14778: Solid biofuels - Sampling
Some of these standards and technical reports focus on waste materials. However, solid
waste materials are often very heterogeneous. Therefore, the approaches for preparing
a sampling plan related to waste materials presented in the standards and technical
reports can be considered to cover even the most complex non-waste cases as well. In
the absence of a suitable standard for the specific fuel, considerable simplifications may
be possible if the fuel or material is more homogeneous.
In some cases, analytical results may show that the heterogeneity of the fuel or material
significantly deviates from the information on heterogeneity on which the original sam-
pling plan for that specific fuel or material has been based. In such cases, Article 33(2)
requires the operator to adapt the relevant elements of the sampling plan. Those adap-
tations shall be in agreement with the laboratory carrying out the analysis for the re-
spective fuel or material (see Chapter 5) and subject to the approval of the competent
authority.
An example for a sampling plan template can be found in Annex II.
3.2 Sampling plan requirements of the MRR
For putting the above into practice in a practical and consistent manner, Article 33 re-
quires the operator to submit a sampling plan to the competent authority for approval
for each fuel or material for which calculation factors are to be determined by analyses.
If only tiers using default values or purchasing records are applied for the determination
of calculation factors, this requirement (and consequently this guidance document) is
not relevant.

19
The sampling plan shall be in form of a written procedure containing the following infor-
mation:
Methodologies for the preparation of samples
Responsibilities
Locations
Frequencies
Quantities
Methodology for the storage and transport of samples.
Furthermore, the MRR contains provisions that the sampling plan has to be updated
regularly if any changes of source streams or of the properties of source streams occur
over time. This is achieved by requiring that the operator puts in place a procedure
attached to the monitoring plan related to the revision of the appropriateness of the
sampling plan.
The ultimate goal of a sampling plan in the MRR is to ensure that samples analysed are
representative for the relevant batches and that the cumulated results of analytical val-
ues thereof allow the determination of representative calculation factors, e.g. that sam-
pling and analysis of the carbon content
9
of a source stream is representative for that
material over the whole reporting period.
In many cases, the requirement to have a sampling plan and an underpinning procedure
in place does not impose any additional requirements to current practice at the installa-
tion. In any case, the MRR requires that relevant elements of the sampling plan shall be
agreed with the laboratory carrying out the analysis for the respective fuel or material,
and evidence of that agreement shall be included in the sampling plan. This is in partic-
ular relevant in cases of rather heterogeneous material having properties that vary spa-
tially and temporally.
In some cases, sampling itself may be carried out by a third party, e.g. the fuel/material
supplier. In such a case, it is still the operator’s responsibility to demonstrate compliance
with the requirements in the MRR for sampling plans. This may be achieved by obtaining
information and evidence about the sampling plan by the third party
10
. In any event, the
operator is responsible for correct sampling defined in an appropriate sampling plan in
accordance with Article 33 regardless whether sampling or analysis is carried out by the
operator or by third parties.
9
As pointed out in section 6.3.1 of Guidance document No. 1, the emission factor is based on the carbon
content of a fuel or material. Carbon content is the primary object of analysis.
10
See FAQ 1 in section 9.1)

20
Example for a relatively simple sampling plan procedure:
Item according to Article 12(2)
Possible content (examples)
Title of the procedure
Sampling Plan for waste oil
Traceable and verifiable reference for
identification of the procedure
ETS 01-SP
Post or department responsible for imple-
menting the procedure and the post or
department responsible for the manage-
ment of the related data (if different)
Head of the waste department of the installa-
tion’s laboratory
11
Brief description of the procedure
12
1000 ml samples are taken from each
truck’s storage tank (about 250 trucks a
year).
Responsible person makes arrangement
that sampling is supervised (weekly spot
checks) by the responsible shift manager or
a representative nominated by the man-
ager.
Samples are collected in tight bottles clearly
marked with date and time, fuel supplier ID,
and name of the person who took the sam-
ple.
Samples are stored in room LA-007 of the
laboratory (at room temperature).
When 10 samples have been collected,
they are mixed and homogenised to give “a
composite sample”. This results in approxi-
mately 6 composite samples each quarter.
Once per quarter the composite samples
are sent to the accredited laboratory identi-
fied in the Monitoring plan.
Location of relevant records and infor-
mation
Hardcopy: Laboratory Storage Room, shelf
27/9, Folder identified “ETS 01-SP”.
Electronically:
“P:\ETS_MRV\Analyses\ETS_01-SP.xls”
Name of the computerised system used,
where applicable
N.A. (Normal network drives)
List of EN standards or other standards
applied, where relevant
EN 14899
11
Note that this is the installation’s own laboratory and not the accredited laboratory used to carry out the
analyses.
12
This description is required to be sufficiently clear to allow the operator, the competent authority and the
verifier to understand the essential parameters and operations performed.
21
3.3 Preparing a sampling plan
The following section outlines a step-by-step approach for preparing a sampling plan,
including a brief description of the steps. This approach is taken from CEN/TR 15310-
1.
1. Specify the objective of the Testing Programme
This should be a general statement on the overall purpose and this is an essential
first step. However, it will usually be at a rather high-level and too non-specific to
lead directly to detailed instructions for a sampling plan.
In most cases, this objective will simply be something like “to determine the average
carbon content” or “to determine the average emission factor of a material over the
whole reporting period”.
2. Develop the Technical Goals from the objective
(a) Define the population to be sampled
Population is a statistical term for defining the total volume of material or fuel
about which information is required through sampling. This should be one of the
first steps. In the most general case, the population will refer to the total amount
of material or fuel consumed within a reporting period. Sub-populations may,
for example, be defined as single batches (e.g. each delivery, or as a volume
as given by the analysis frequency in Annex VII of the MRR) or as fuel con-
sumed each month in case of a continuous source stream.
(b) Assess variability
Variability can be distinguished between
Spatial variability
This term refers to the heterogeneity of a material depending on the loca-
tion, e.g. the heterogeneity within one single batch.
Temporal variability
This term takes into account changes of properties over time, e.g. the var-
iability of the net calorific values between a batch consumed in March and
a batch consumed in November.
(c) Select the sampling approach
This can be distinguished between
Probabilistic sampling
This means that each element within the population to be assessed has an
equal chance of being selected. This approach is therefore preferable to
obtain representative results and eliminates one source for committing sys-
tematic errors.
Judgmental sampling
Due to practical or costs reasons a probabilistic sampling is not always
possible. Judgmental sampling will result in sampling sub-populations, e.g.
due to technical reasons only samples from the top of a storage tank are
being taken.
(d) Identify the scale
The scale defines the minimum quantity of material below which variations are
judged to be unimportant.
(e) Choose the required statistical approach
The relevant statistical parameters will be the mean values as well as the stand-
ard deviation. Although only the mean value over the whole reporting value is

22
to be reported and no specific uncertainty thresholds are mentioned in the MRR
for those mean values, the deviation provides information about the appropri-
ateness of the sampling plan to improve the level of assurance.
(f) Choose the desired reliability
Reliability refers to “bias”, “precision” and “confidence”. Choices must be made
on the confidence level, and to the extent that random and systematic errors in
sampling can be minimised.
3. Determine the practical instructions
(a) Choose the sampling pattern
The sampling pattern defines when, where and how samples are selected.
(b) Determine the increment/sample size
An increment is the amount of material that is obtained through one single sam-
pling action. It is not analysed as an individual unit, but is combined with other
increments to form a composite sample. A simple “sample” is defined as a lot
that is analysed individually.
The increment/sample size should depend on properties like heterogeneity or
particle size.
(c) Determine the use of composite or individual samples
This selection depends inter alia on costs and the statistical parameters. As in
general the mean value will be of particular interest, usually composite samples
will be used.
4. Determine required number of samples
This is a statistical exercise taking into account any standard deviations between
increments, samples, composites etc. This point is relevant for the reliability of re-
sults but also for cost-efficiency.
After all relevant decisions have been made the sampling plan can be put down on
paper. At least the following elements should be covered:
Who is responsible for each step?
Where and when are samples taken?
How are the samples taken? E.g. it might be necessary to first clean pipes where
residues from previous samples might still be contained, etc.
Which instruments are used, if relevant? Describe automatic sampling equipment,
but also describe the tools for manual sampling. It might also be important how
samples can be picked out from sufficiently deep in a pile of several metres height.
How will the identity of the samples be ensured?
How are the samples stored (dry, cool, dark, inert atmosphere, etc.)?
How and when are increments combined?
When are the samples analysed, are remaining samples stored after analysis, etc.?
As further help for the development of a sampling plan, the Annex of this document
contains an example of a template for a sampling plan.

23
4 FREQUENCY OF ANALYSES
According to Article 35 the operator has to consider the following options when deter-
mining the minimum frequency of analyses:
Applying the minimum frequency for relevant fuels and materials listed in Annex
VII of the MRR (see Table 1 in section 4.1);
Analysis frequencies different from those listed in that table may be allowed where
the operator demonstrates one of the following:
Based on historical data, any variation in the analytical values for the respec-
tive fuel or material does not exceed 1/3 of the uncertainty value to which the
operator has to adhere with regard to the activity data determination of the
relevant fuel or material (see section 4.2);
Applying the minimum frequency listed in Table 1 would incur unreasonable
costs (see section 4.3);
Where an installation operates for part of the year only, or where fuels or ma-
terials are delivered in batches that are consumed over more than one calen-
dar year, the competent authority may agree with the operator a more appro-
priate schedule for analyses. However, this approach has to result in a com-
parable uncertainty as the approach based on the “1/3” rule presented above
(see section 4.4).
4.1 Minimum frequency of analyses (Annex VII of the MRR)
Table 1 lists the minimum frequency of analyses for relevant fuels and materials as laid
down in Annex VII of the MRR.
Table 1: Minimum frequency of analyses
Fuel/material
Minimum Frequency of Analyses
Natural gas
At least weekly
Other gases, in particular synthesis gas
and process gases such as refinery
mixed gas, coke oven gas, blast-fur-
nace gas, convertor gas, oilfield and
gasfield gas
At least daily - using appropriate procedures at
different parts of the day
Fuel oil (for example light, medium,
heavy fuel oil, bitumen)
Every 20,000 tonnes and at least six times a
year
Coal, coking coal, coke, petroleum
coke, peat
Every 20,000 tonnes and at least six times a
year
Other fuels
Every 10,000 tonnes of fuel and at least four
times a year
Untreated solid waste (pure fossil or
mixed biomass/fossil)
Every 5,000 tonnes and at least four times a
year
Liquid waste, pre-treated solid waste
Every 10,000 tonnes and at least four times a
year
Carbonate minerals (including lime-
stone and dolomite)
Every 50,000 tonnes and at least four times a
year

24
Fuel/material
Minimum Frequency of Analyses
Clays and shales
Amounts of material corresponding to 50,000
tonnes of CO
2
and at least four times a year
Other materials (primary, intermediate
and final product)
Depending on the type of material and the vari-
ation, amounts of material corresponding to
50,000 tonnes of CO
2
and at least four times a
year
4.2 The “1/3” rule
An operator may apply a different frequency to that listed in Table 1 (see section 4.1) if
any variation in the analytical values
13
for the respective fuel or material does not exceed
1/3 of the uncertainty value to which the operator has to adhere with regard to the ac-
tivity data determination of the relevant fuel or material. The determination of this varia-
tion has to be based on historical data, including analytical values for the respective
fuels or materials in the reporting period immediately preceding the current reporting
period.
Any variation in the analytical value may be determined as the overall uncertainty of
uncorrelated input quantities (see Annex III of Guidance Document 4 on Uncertainty):
n
nn
xxx
xuxuxu
u
...
)(...)()(
21
22
22
2
11
total
where:
u
i
.......... relative uncertainty of the analytic value of sample i
x
i
.......... sample size of sample i
Under the assumptions that the uncertainty of the analytic value of each sample is the
same and all sample sizes are similar, the formula simplifies to:
n
u
n
n
uu
i
i
total
where:
n .......... number of analysed samples
If the total uncertainty related to the analytic values is known (in most cases it is a direct
result of the standard deviation of the analytical values) the required minimum number
of samples can be determined as:
13
The term ‘variation of the analytical values’ in this section comprises all of the following three elements: 1)
the variation of the actual value over time, 2) the analytical error to determine the value and 3) the sampling
and any further errors. No distinction is made as to which of those contributes the most to the historic variation
observed. Further background information can be found in the training material on sampling, which can be
downloaded from:
https://ec.europa.eu/clima/sites/default/files/ets/monitoring/docs/sampling_training_material_en.pdf

25
2
total
2
u
u
n
i
This approach has been successfully implemented in an Excel based tool provided by
the Netherlands. It can be downloaded from https://ec.europa.eu/clima/poli-
cies/ets/monitoring_en#tab-0-1
Example:
A category B installation is burning heavy fuel oil. In the monitoring plan the heavy
fuel oil is listed as a major source stream to be monitored by a calculation-based
approach. The MRR (and approved monitoring plan) requires it to meet tier 4 (±1.5%)
for activity data and to determine the calculation factors emission factor (EF) and net
calorific value (NCV) by laboratory analyses in accordance with Articles 32 to 35. The
“1/3” rule requires that the uncertainty related to the determination of the calculation
factors does not exceed 0.5% (This u
total
is the input parameter for determining the
number of samples).
Table 1 (see section 4.1) would require analysing at least six times a year. From
historic analyses the operator demonstrates that the uncertainty related to the deter-
mination of the NCV is 1.00%. The following table displays the results from historic
samples.
# of sample
NCV [GJ/t]
1
42,28
2
42,41
3
42,35
4
42,68
5
42,44
6
42,4
7
42,68
8
42,6
9
42,02
10
42,33
11
42,41
12
42,2
average
42.4
Uncertainty u
i
1.00%
The uncertainty is determined as the standard deviation of the data series (0.45%)
multiplied by the Student t-factor for 12 values and a 95% confidence interval
(=2.201). The application of this factor is required because uncertainty as defined in

26
Article 3(6)
14
always refers to a confidence interval of 95%. The minimum frequency
of analysis to meet the requirements of the “1/3” rule is then calculated by:
4
%5.0
%0.1
2
2
n
Therefore, in this case, the operator may be allowed to apply a lower frequency of
analysis of four times per year instead of six times for NCV determination. For the
emission factor a similar test can be carried out whether these requirements are ful-
filled with 4 samples per year as well.
It is important to note that the “1/3” rule also offers the operator an option to deviate
from carrying out analyses in accordance with Article 32 to 35. The MRR, in the defini-
tion of tiers for calculation factors in Annex II, under specific situations allows the use of
the empirical correlation as specified for Tier 2b in sections 2.1 and 3.1 of Annex II to
be regarded as Tier 3. However, in such cases the uncertainty of that empirical correla-
tion may not exceed 1/3 of the uncertainty value to which the operator has to adhere
with regard to the activity data determination of the relevant fuel or material. The oper-
ator has to demonstrate to the satisfaction of the competent authority that he complies
with this provision.
4.3 Incurrence of unreasonable costs
An operator is also allowed to deviate from applying the minimum requirements for fre-
quency of analyses in Table 1 (see section 4.1) or applying minimum frequency of anal-
yses resulting from the “1/3” rule if he can demonstrate they would incur unreasonable
costs.
Article 18(1) defines costs as unreasonable if they exceed the benefit. The benefit shall
be calculated by multiplying an improvement factor by a reference price of 20 euro per
allowance and costs shall include an appropriate depreciation period based on the eco-
nomic lifetime of the equipment. Article 18(3) defines this improvement factor as 1% of
the average annual emissions of the respective source streams in the three most recent
reporting periods. For further guidance on unreasonable costs, please see section 4.6.1
of Guidance Document 1 (General Guidance for Installations).
Example: The heavy fuel oil source stream above emits about 40,000 tonnes of CO
2
annually. The costs for the analyses have to exceed the benefit in order to be re-
garded as unreasonable. If the costs are lower they are not unreasonable:
IFAEmPC
14
Article 3(6): ‘uncertainty’ means a parameter, associated with the result of the determination of a quantity,
that characterises the dispersion of the values that could reasonably be attributed to the particular quantity,
including the effects of systematic as well as of random factors, expressed in per cent, and describes a con-
fidence interval around the mean value comprising 95% of inferred values taking into account any asymmetry
of the distribution of values;

27
where:
C ......... Costs [€/year]
P ......... specified allowance price = 20 € / t CO
2(e)
AEm .... Average emissions from related source stream(s) [t CO
2(e)
/year]
IF ......... improvement factor = 1%
It is assumed that one analysis costs 1,000 €. As the benefits are 8,000 € / year (20
x 40,000 x 1%) the costs for six analyses per year cannot be regarded as unreason-
able.
Question 4.4 of the FAQ document
15
may provide further helpful information on how to
proceed if the application of tier 3, i.e. analysis in accordance with Articles 32 to 35,
incurs unreasonable costs. Furthermore, the Commission has published a tool (“Unrea-
sonable costs determination tool”) on the MRVA website (see link in section 1.3).
4.4 Analyses frequency for specific situations
Article 35(2) gives the operator another option to deviate from the minimum frequency
listed in Annex VII of the MRR (see section 4.1). However, this option may only be
applied in either of the following situations:
an installation operates for part of the year only;
fuels or materials are delivered in batches that are consumed over more than
one calendar year.
In these special situations, the competent authority may agree with the operator a more
appropriate schedule for analyses. Nonetheless, it has to be assured that the approach
the operator and the competent authority agree upon will result in an uncertainty com-
parable to an uncertainty achieved if the approach based on the “1/3” rule were used
(see section 4.2).
15
https://ec.europa.eu/clima/sites/clima/files/ets/monitoring/docs/faq_mmr_en.pdf

28
5 LABORATORIES
Pursuant to Article 34 all analyses for the determination of calculation factors shall be
carried out by laboratories that are accredited for the relevant analytical methods in
accordance with EN ISO/IEC 17025. However, operators may deviate from this require-
ment if it can be demonstrated to the satisfaction of the competent authority that access
to accredited laboratories is technically not feasible or would incur unreasonable costs.
In this case also non-accredited laboratories may be used provided that they meet the
requirements listed in Article 34(3). Those requirements are considered appropriate to
demonstrate competence equivalent to accreditation in accordance with EN ISO/IEC
17025.
The equivalent requirements concern the quality management and technical compe-
tence of the laboratory, and should be demonstrated in the form of procedures attached
to the monitoring plan.
With respect to quality management, the operator may demonstrate the competence
by an accredited certification of the laboratory in conformity with EN ISO/IEC 9001, or
other certified quality management systems that cover the laboratory. In the absence of
such certified quality management systems, the operator shall provide other appropriate
evidence that the laboratory is capable of managing in a reliable manner its
personnel,
procedures,
documents and
tasks.
With respect to technical competence, the operator shall provide evidence that the
laboratory is competent and able to generate technically valid results using the relevant
analytical procedures. Article 34(3) lists the topics on which evidence is to be provided.
Table 2 lists elements which the competent authority should take into account when
assessing an operator’s proposed evidence on the laboratory he uses.
Note: Article 47(7) allows operators of installations with low emissions to use any labor-
atory to determine calculation factors by analyses that is technically competent and able
to generate technically valid results using the relevant analytical procedures. Evidence
only needs to be provided for the quality assurance measures referred to in point j of
Table 2.
Table 2: Elements for demonstrating equivalent technical competence to an accreditation for
laboratories
Element of Article 34(3), on
which competence needs to
be demonstrated
Important elements for the competent authority to
assess (non-exhaustive)
(a) Management of the per-
sonnel’s competence for the
specific tasks assigned
Is the personnel executing the sampling and analysis
authorised for their job by the management?
Can the competence of the personnel be proven by
records of their education, training and experience?
Is an adequate procedure for training and supervision
of personnel implemented (especially for new person-
nel)?

29
Element of Article 34(3), on
which competence needs to
be demonstrated
Important elements for the competent authority to
assess (non-exhaustive)
(b) suitability of accommoda-
tion and environmental condi-
tions
Is the building and the laboratory area sufficiently
heated / air-conditioned, safe, secure and clean for
the purpose?
Is access to and use of areas affecting the quality of
the tests and/or calibrations controlled and are
measures taken to ensure good housekeeping?
Are environmental conditions monitored, controlled
and recorded as required by the relevant specifica-
tions, methods and procedures, or where they influ-
ence the quality of the results, and are tests and cali-
brations stopped when the environmental conditions
jeopardise the results?
(c) selection of analytical
methods and relevant stand-
ards
Is an adequate procedure in use to ensure that the lat-
est valid edition of a standard is used?
Is the procedure for the selection of a method docu-
mented and is the procedure actually used for the se-
lection of appropriate methods?
Is the reporting of deviations from the standardised
method ensured?
(d) where applicable, manage-
ment of sampling and sample
preparation, including control
of sample integrity
Are adequate procedures for representative sampling
of substances, materials or products implemented?
Are deviations from the required sampling procedures
recorded?
(e) where applicable, develop-
ment and validation of new
analytical methods or applica-
tion of methods not covered
by international or national
standards
Note: These requirements only apply if the operator’s
monitoring plan requires analyses which are not yet es-
tablished, or where no standards are available.
When non-standard methods are used, are these
methods well described?
Are the methods used for the determination of the cal-
culation factor(s) validated?
Where new methods are used or developed, at least
the following performance characteristics must be
known or be determined: sensitivity of the method, re-
peatability and/or reproducibility, cross-sensitivity
against interference from the matrix of the sample/test
object.
(f) uncertainty estimation
Does the procedure for the estimation of the uncer-
tainty include all components of uncertainty?
Are previous experiences and the results of the valida-
tion of the applied method included in the estimation
of the uncertainty?
(g) management of equip-
ment, including procedures for
calibration, adjustment,
maintenance and repair of
equipment, and record keep-
ing thereof
Are records maintained of each item of equipment and
its software?
Does the laboratory apply procedures for safe han-
dling, transport, storage, use and planned mainte-
nance of the measuring equipment to ensure proper
functioning?
Is there a scheme for calibration and maintenance of
the equipment and its software implemented?
Can the state of calibration be proven with certifi-
cates?
Is there an adequate procedure to ensure that calibra-
tion factors are correctly implemented in time?

30
Element of Article 34(3), on
which competence needs to
be demonstrated
Important elements for the competent authority to
assess (non-exhaustive)
(h) management and control
of data, documents and soft-
ware
Is an adequate procedure for checking calculations
and data transfer on a regular basis implemented and
are the corrective actions in case of encountered mis-
takes specified?
(i) management of calibration
items and reference materials
Is there a programme and procedure for calibration
concerning the handling of the reference standards, or
for regular purchase of new standards?
Are the reference materials used, where possible,
traceable to international standards?
Are adequate procedures for intermediate checking of
the calibration status documented and implemented
on a regular basis?
Are procedures implemented for safe handling,
transport, storage and use of reference standards and
reference materials?
Are procedures implemented for safe transportation,
receipt, handling, protection, storage, retention and/or
disposal of calibration items?
Is a system used, which enables unambiguous identi-
fication of calibration items and reference materials?
(j) quality assurance for cali-
bration and test results, in-
cluding regular participation in
proficiency testing schemes,
applying analytical methods to
certified reference materials,
or inter-comparison with an
accredited laboratory
Does the laboratory apply procedures to monitor the
validity of the test and calibration results?
Are the results of these checks recorded, stored and,
where practicable, statistically evaluated?
Does the laboratory participate in inter-laboratory com-
parison or proficiency testing programmes?
If the laboratory participates in inter-laboratory com-
parison or proficiency testing programmes, how will
appropriate corrective action be taken in case differ-
ences are observed between laboratories?
Which other measures has the laboratory imple-
mented for quality assurance of calibration and test re-
sults?
(k) management of out-
sourced processes
Only relevant where processes are outsourced (e.g. cali-
bration of instruments, analyses by external laboratories
etc.)
Does the laboratory have a procedure implemented
which guarantees that the purchased services and
supplies are within the required specifications?
Are the required specifications included in each order
and is each delivery checked against those require-
ments?
(l) management of assign-
ments, customer complaints,
and ensuring timely corrective
action
Is the laboratory willing to cooperate with customers in
clarifying the customer's request, in monitoring the la-
boratory’s performance in relation to the work per-
formed and in seeking feedback from its customers?
Does the laboratory have a procedure for handling
complaints, non-conformities in the application of the
methods and mistakes in data handling and calcula-
tion methods, including keeping a documentation
thereof?
Does this procedure include an analysis of the source
of errors or complaints, and identification of corrective
actions as well as the timely implementation of the
corrective actions?

31
6 ONLINE GAS ANALYSERS
Gaseous fuel or material streams may contain organic carbon substances that give rise
to emissions and vary in composition over time. The most common gaseous source
stream is natural gas which might exhibit fluctuating composition depending on the
Member State or region the installation is situated. There are analytical methods based
on chromatographic separation of these substances and subsequent detection of each
substance. The most common detectors are e.g. the flame ionisation detector (FID)
16
or the mass spectrometry detector. These allow determination of the composition of the
gas online and thus calculation of relevant parameters such as NCV or EF
17
.
Article 32(2) requires the operator to obtain the competent authority’s approval for the
use of equipment where online gas chromatographs or extractive or non-extractive gas
analysers are used to determine emissions. To obtain approval the relevant information
might best be addressed by using a procedure describing the equipment, the method
used for sampling and analysis and the relevant standards. The use of these systems
is limited to the determination of composition data of gaseous fuels and materials. As
minimum quality assurance measures, the MRR requires that the operator shall ensure
that an initial validation and annually repeated validations of the instrument are per-
formed
18
.
It is recommended that the operator meets the requirements of EN ISO 9001 and that
calibration services and the suppliers of calibration gases are accredited in accordance
with EN ISO/IEC 17025. Also, where applicable, the initial and annually repeated vali-
dation of the instrument should be carried out by a laboratory accredited in accordance
with EN ISO/IEC 17025.
The following standards may be considered:
EN ISO 10723: Natural gas – Performance evaluation for on-line analytical systems;
EN 12619: Stationary source emissions – Determination of the mass concen-
tration of total gaseous organic carbon – Continuous flame ionisa-
tion detector method;
EN ISO 6976: Natural gas – Calculation of calorific values, density, relative density
and Wobbe index from composition;
ISO 6974: Natural gas – Determination of composition and associated uncer-
tainty by gas chromatography – Part 6: Determination of hydrogen,
helium, oxygen, nitrogen, carbon dioxide and C1 to C8 hydrocar-
bons using three capillary columns;
16
The detection principle of the FID is the oxidation/ionisation of substances. As CO
2
is fully oxidised carbon
the FID is insensitive to CO
2
. Therefore this detector is not suitable to detect inherent CO
2
which should be
part of the fuels emission factor according to Article 48.
17
Note that Articles 33 to 35 still apply here as well, subject to the tiers required, the technical feasibility and
no incurrence of unreasonable costs. For instance, this means that the sampling frequency would have to
follow the provisions in Article 35 and Annex VII. It should furthermore often easily be possible to demon-
strate that using an accredited laboratory (Article 34) would incur unreasonable costs.
18
For more information on the initial validation see FAQ No.2, section 9.2.

32
7 ANNEX I: ACRONYMS AND LEGISLATION
7.1 Acronyms used
CA .............. Competent Authority
CEMS ......... Continuous Emission Measurement System
EF ............... Emission factor
EU ETS ...... EU Emission Trading Scheme
GD .............. Guidance Document
MP .............. Monitoring Plan
MRR ........... Monitoring and Reporting Regulation (M&R Regulation)
MRV ........... Monitoring, Reporting and Verification
MRVA ......... Monitoring, Reporting, Verification and Accreditation
MS .............. Member State(s)
NCV............ Net calorific value
7.2 Legislative texts
EU ETS Directive: Directive 2003/87/EC of the European Parliament and of the Council
of 13 October 2003 establishing a system for greenhouse gas emission allowance trad-
ing within the Community and amending Council Directive 96/61/EC, as amended.
Download of the consolidated version:
https://eur-lex.europa.eu/eli/dir/2003/87/2020-01-01
M&R Regulation: Commission Implementing Regulation (EU) No. 2018/2066 of 19 De-
cember 2018 on the monitoring and reporting of greenhouse gas emissions pursuant to
Directive 2003/87/EC of the European Parliament and of the Council and amending
Commission Regulation (EU) No. 601/2012. Download under: https://eur-lex.eu-
ropa.eu/eli/reg_impl/2018/2066/oj and latest amendment under:
https://eur-lex.europa.eu/eli/reg_impl/2020/2085/oj
A&V Regulation: Commission Implementing Regulation (EU) No. 2018/2067 of 19 De-
cember 2018 on the verification of data and on the accreditation of verifiers pursuant to
Directive 2003/87/EC of the European Parliament and of the Council, as amended.
Download of consolidated version:
https://eur-lex.europa.eu/eli/reg_impl/2018/2067/2021-01-01
RES Directive (RED II): Directive (EU) 2018/2001 of the European Parliament and of
the Council of 11 December 2018 on the promotion of the use of energy from renewable
sources (recast). Download under:
https://eur-lex.europa.eu/eli/dir/2018/2001/oj

33
8 ANNEX II: EXAMPLE FOR A SAMPLING PLAN
TEMPLATE
1. General information
Operator name:
Installation ID:
Fill in the installation ID (as used by your competent authority)
Title of sampling plan:
Reference of procedure:
2. Responsibilities
Sampling plan completed by:
Fill in the name of the author of the sampling plan
Post or department responsible for sampling:
Fill in the name of the post or department responsible for the actual sampling
Post or department responsible for sampling data:
Fill in the name of the post or department that is responsible for the collection of
sampling data
Laboratory responsible for analysis:
Fill in the name of the laboratory that is responsible for analysis of the sample
Other parties:
If applicable, fill in the names of other parties involved in sampling and describe
their relevance

34
3. Sampling objectives
Sampling objectives:
Describe the objective(s) of the sampling, e.g. determination of net calorific
value, emission factor, oxidation factor
Analysis required:
Describe what the laboratory is testing for, e.g. identify constituents to be tested.
4. Specifications of source stream
Name of material or fuel:
Fill in the name of the source stream, as used in the monitoring plan
Characteristics of the source stream:
Describe the relevant characteristics, such as its phase (gas, liquid or solid), if
relevant common or maximum particle size of the fuel or material, density, vis-
cosity, temperature, etc., if those properties are relevant for the sampling proce-
dure
Source and origin of the material or fuel:
Describe the source and origin of the source stream, e.g. is the source stream
delivered continuously, in batches, produced on site, etc.?
Heterogeneity of the fuel or material and causes of variability (spatial and
in time):
Describe the heterogeneity of the fuel or material, both spatial and in time, and
justify (e.g. origin of source stream, stability of manufacturing process).
5. Sampling methodology
Sampling frequency:
Describe the sampling frequency (e.g. “every Monday morning”, “every 3 hours”,
“once per truck load”, “once every 200 tonnes”, etc.)
Relevant standards:
Describe the relevant standards for the sampling methodology
Define place and point of sampling:

35
Specify the place (e.g. the stockpile) and point of sampling (e.g. after delivery or
after completion of a deposit). Please note that the sample should be as repre-
sentative as possible
Equipment used for sampling:
Describe the equipment used for sampling
Sampling approach:
Describe how the sample is taken, e.g. by probabilistic or judgmental approach
Sampling pattern:
Define how the sample is taken, e.g. in the case of random sampling describe
how inaccessible parts of the population are dealt with; define how a probabilis-
tic approach is implemented, and/or how decisions are made for a judgmental
approach
Sample composition:
Describe whether each increment (amount of material obtained through one sin-
gle sample action) is analysed individually, or combined with other increments to
form a composite sample
Number of increments to be collected:
Describe the number of increments that make up a sample
Increment and sample size:
Describe the size of one increment (the amount of material that is obtained
through one single sampling action). The increment size should accommodate
all particle sizes present. Describe the minimum sample size. The minimum
sample size must take into account the level of heterogeneity of individual parti-
cles, to ensure representativeness of the sample.
Sample reduction or sub sampling (if applicable):
If the overall sample is too large for transport to a laboratory, a sub-sample
should be prepared in such a way that the integrity of the sample is protected. If
relevant, describe this procedure and justify the representativeness of the final
sample
Justification of representativeness:
Give a justification that the chosen approach leads to a representative sample.
Take into account the source stream information and characteristics of the pop-
ulation (i.e. the amount of fuel or material represented by the sample)

36
Access, health and safety:
Identify access problems or restrictions that may affect the sampling pro-
gramme. Identify health and safety precautions
6. Procedures for packaging, preservation, storage and transport
Packaging:
Briefly describe the size, shape and material of the containers used, taking into
account the risk of adsorption/absorption/reaction
Sample coding methodology:
Describe how samples are coded. All sample containers should be marked with
a unique identifier that is recognized by sampler and laboratory
Preservation:
Justify how samples are packed and transported in such a way that the condi-
tions at the time of sampling are preserved
Storage:
Describe how the sample is stored on site and in the laboratory
Transport:
Describe relevant conditions during storage. Describe or refer to a chain of cus-
tody form that should be completed and sent with each sample
Data storage system:
Briefly describe the location and functioning of the data storage system and the
information it contains, such as sample date, sample code, stockpile reference
number, product type, specific location, size, etc.

37
7. Analytical laboratory
Company:
Fill in the name of the laboratory responsible for analyses of the sample
EN ISO/IEC 17025 Accreditation:
Justify to what extent the scope of accreditation of the laboratory covers analy-
sis of samples described in this sampling plan. If the laboratory is not accred-
ited, please refer to the provided evidence that it meets the relevant criteria of
Article 34(3)
Contact details:
Fill in contact details of the analytical laboratory
Analyses carried out:
Describe the properties to be analysed (e.g. net calorific value, emission factor,
oxidation factor, carbon content)
Standards used:
Describe the relevant standards used for each parameter analysed
8. Signatures
Operator and laboratory have agreed on the content of this sampling plan; in
case of evidence that the described heterogeneity of the source stream differs
significantly from the information described above, the sampling plan will be up-
dated and notified to the competent authority
Name
Signature
Date
Operator
Analytical labora-
tory
38
9 ANNEX III – FREQUENTLY ASKED
QUESTIONS
9.1 Supplier data: What if the supplier does not provide
sufficient information for demonstrating compliance
with the required tiers?
In some cases operators may want to use calculation factors, e.g. NCV, EF, car-
bon content etc. provided by the supplier of a fuel or material. Sampling and anal-
ysis is carried out by the supplier. However, in such a case it is still the operator’s
responsibility to demonstrate compliance with the requirements of Articles 32 to
35. This may be achieved by obtaining information and evidence surrounding the
sampling plan applied by the third party and evidence that representative sam-
ples have been analysed by an accredited laboratory using appropriate stand-
ards. If the laboratory is not accredited to EN ISO/IEC 17025, evidence for meet-
ing equivalent requirements has to be provided. If an operator wants to use sup-
plier data for calculation factors the following steps may be taken:
1. Can evidence be provided that an appropriate sampling plan is in place and
that analyses are carried out by an accredited laboratory or by a laboratory
meeting the equivalent requirements?
2. If yes, then the operator shall be deemed to meet tier 3 for all relevant calcu-
lation factors for which this evidence has been provided.
3. If no, then the analytical values obtained from the supplier cannot be consid-
ered to meet tier 3. The operator then can either choose:
(a) To analyse himself in accordance with Articles 32 to 35, OR
(b) To use available default values. If the tier required for this source stream
is lower than tier 3, e.g. in case of a category A installation, then those
default values should be used without any further action. If the MRR re-
quires application of tier 3 for the source stream, default values may only
be used if the operator can demonstrate that analysing himself would incur
unreasonable costs or is technically not feasible.
Please note that before taking into account any justification for not meeting
tier 3 in general it has to be assessed whether applying tier 3 but with a
lower frequency of analysis (Article 35 and Annex VII) might avoid the in-
currence of unreasonable costs.
Where suitable default values are not available and the operator is not able
to meet at least tier 1, suggesting that a fall-back approach is required, the
operator again has to demonstrate that using his own analyses (in accord-
ance with the required tiers) would incur unreasonable costs or not be tech-
nically feasible.
Operators are also required to manage their use of supplier data under their writ-
ten procedure required for control of out-sourced processes under Article 59(3)(f)
according to the specific requirements of Article 65.

39
9.2 Online gas analysers: What is the (initial) validation and
how can it be performed?
Article 32(2) of the MRR states: “Where online gas chromatographs or extractive
or non-extractive gas analysers are used to determine emissions, the operator
shall obtain the competent authority’s approval for the use of such equipment.
The equipment shall be used only with regard to composition data of gaseous
fuels and materials. As minimum quality assurance measures, the operator shall
ensure that an initial validation and annually repeated validations of the instru-
ment are performed.”
Article 32(1) requires validations for the determination of calculation factors to be
carried out by applying methods based on corresponding EN standards. For the
use of online chromatographs, this includes EN ISO 10723:2012 Natural gas –
performance evaluation for online analytical systems.
This gives the operator some freedom to demonstrate compliance. However, the
minimum quality assurance measures for the use of online gas chromatographs,
as stated in Article 32(2), are an initial validation and annually repeated valida-
tions. The approach described in section 13.5.3 of Annex I of MRG 2007 is still
considered appropriate for carrying out initial and ongoing validations. It stated:
“Where applicable, an initial and annually repeated validation of the instrument
shall be carried out by a laboratory accredited against EN ISO 17025:2005 using
EN ISO 10723:1995 “Natural gas – Performance evaluation for online analytical
systems”. In all other cases, the operator shall commission an initial validation
and annual inter-comparison:
a) Initial validation
The validation shall be carried out [before the start of the reporting period or be-
fore approval of a new monitoring plan using such online gas analysers]
19
or as
part of the commissioning of a new system. It includes an appropriate number of
repetitions of the analysis of a set of at least five samples representative for the
expected value range including a blank sample for each relevant parameter and
fuel or material in order to characterise the repeatability of the method and to
derive the calibration curve of the instrument;
b) Annual inter-comparison
The inter comparison of the results of analytical methods shall be executed once
a year by a laboratory accredited according to EN ISO 17025: 2005 involving an
appropriate number of repetitions of the analysis of a representative sample using
the reference method for each relevant parameter and fuel or material; The op-
erator shall apply conservative adjustments (i.e. avoiding under-estimation of
emissions) to all relevant data of the respective year in cases in which a differ-
ence is observed between the results derived by the results of the gas analyser
or gas chromatograph and the accredited laboratory which might lead to an un-
der-estimation of emissions. Any statistically significant (2
) differences between
the end results (e.g. the composition data) of the gas analyser or gas-chromato-
graph and the accredited laboratory shall be notified to the competent authority
19
The MRG 2007 here referred to the beginning of the 2
nd
trading period only.

40
and be immediately resolved under supervision of a laboratory accredited accord-
ing to EN ISO 17025: 2005.”
This alternative initial method is quite onerous requiring at least 5 representative
samples measured several times to check the “calibration curve”. The calibration
curve can change significantly with time and the approach outlined in the initial
validation should be adopted in the annual inter-comparison. Any statistical devi-
ation (2σ) determined from the inter-comparison could be corrected for if a per-
formance evaluation in line with EN ISO 10723 or a 5 point check were per-
formed. Laboratories carrying out the validations should be used in accordance
with Article 34.
Where operators seek approval by the CA using any other approach than the one
provided in the MRG 2007, the CA may evaluate the proposal in the light of the
hierarchy in Article 32(1):
Apply methods based on corresponding EN standards,
Where such standards are not available, the methods shall be based on suit-
able ISO standards or national standards.
Note that section 6 of this guidance document provides a non-exhaustive list of
such standards.
Where no applicable published standards exist, suitable draft standards, in-
dustry best practice guidelines or other scientifically proven methodologies
shall be used, limiting sampling and measurement bias.
9.3 How can it be determined whether a sample taken is
“representative”?
It must be kept in mind that representativeness is of utmost importance. The fol-
lowing steps have to be considered:
Analytical samples analysed in a laboratory must be representative for the
samples submitted to the laboratory.
Samples submitted to the laboratory must be representative of the batch
20
of
fuel or material they are taken from. For example, a combined sample obtained
from mixing individual increments/samples must be representative; weighted
instead of simple averages need to be calculated.
Samples taken from, for example, one batch must be representative for the
whole batch.
The integrity of a sample must be maintained throughout the whole sampling
and analysis process (combination of increments/samples, sub-sampling,
transport and storage, analytical clean-up/pre-treatment, etc.).
Only if each step is fulfilled, representative values, i.e. valid weighted averages,
can be obtained from the analyses.
20
Article 3(33): “batch means an amount of fuel or material representatively sampled and character-
ised, and transferred as one shipment or continuously over a specific period of time”
41
The appropriate sampling approach to obtain representative samples will depend
on material properties, e.g. the homogeneity/inhomogeneity of the material in
terms of variability in time or space of the carbon content as well as on sampling
techniques, e.g. judgemental or probabilistic sampling, minimum sample size,
etc. It has to be noted that the appropriate sampling approach depends on the
purpose of the analyses. Determining trace metal contaminations will lead to a
different sampling approach than determining the carbon content as the main
objective (see section 3.3. of this guidance document).
Therefore, the sampling plan for obtaining representative samples should be pre-
pared according to fuel or material specific standards. Where such standards are
not available, EN 14899 for sampling waste and the supplementing technical re-
ports CEN/TR 15310 as well as EN 15442 can be considered as suitable starting
points for preparing a sampling plan. In the case of doubt or a lack of experience
with the fuel or material, it is recommended to take more samples at first and then
assess on the basis of analyses and growing experience whether combining sam-
ples or taking less samples per batch is appropriate without a significant loss of
accuracy.
Furthermore, it is recommended to keep a sampling record documenting any de-
viations from the sampling plan and observations made during sampling (e.g.
colour, odour,..). The sampling record, along with the “chain of custody” docu-
ment that accompanies the samples that are sent to the laboratory for analysis,
are all traceable back to the sampling plan. It is advisable to check with the cho-
sen analytical laboratory that the packaging, transportation and storage proce-
dures are appropriate to protect the integrity of the sample. CEN/TR 14310-4 is
a useful source of guidance on sample packaging, storage, preservation,
transport and delivery.
Please note that although those standards are suitable sources for sampling solid
or liquid materials, they may fail to provide proper guidance for sampling gaseous
fuels. Sampling gaseous fuels is problematic since those fuels cannot be stored
easily. In most cases sampling is directly coupled to analysis, e.g. by the use of
an online gas analyser. In particular, in the case of highly fluctuating gas flows
and changes of the composition, continuous sampling is required to obtain rep-
resentative results (e.g. by the use of EN ISO 10723:2012 “Natural gas – Perfor-
mance evaluation for online analytical systems”). If sampling continuously is tech-
nically not feasible or would incur unreasonable costs, the proposed alternative
sampling approach providing representative results can be based on e.g. proven
correlations such as that a high volume flow or a specific composition occur under
certain conditions during a production process or cycle.
9.4 How to proceed if the application of tier 3, i.e. analysis
in accordance with Articles 32 to 35, incurs
unreasonable costs?
If an operator is required to use tier 3 for calculation factors and demonstrates
that the application of Articles 32 to 35 would incur unreasonable costs, the fol-
lowing steps have to be taken:

42
Check if the application of a lower frequency of analyses than the one required
by Annex VII or determined by the “1/3”-rule would still incur unreasonable
costs. Note that recital 16 of the MRR requires operators to always strive to
reach highest achievable tier. Therefore, even if the application of the “1/3”-
rule or the incurrence of unreasonable costs results in analysing just once a
year
21
this may still be considered to be a more accurate and reliable monitor-
ing approach than deferring to lower tiers since site-specific values are ob-
tained.
It should be stressed here that only those costs that are additional to a refer-
ence system should be taken into account (For details see Guidance document
No.1 and the FAQs contained therein). This means that e.g. costs related to
sampling can only be taken into account if it is not already done for other pur-
poses. Note that costs up to 2,000 € per year (500 € for installations with low
emissions) cannot be considered to incur unreasonable costs. Furthermore, it
has to be noted that a lower frequency of analyses may lead to a revision of
the sampling plan. This is because the analytical values still have to be repre-
sentative for the batches or time period which samples are taken from. This
makes the preparation of composite samples and sub-sampling more demand-
ing.
If carrying out analyses in accordance with Articles 32 to 35 and a frequency
of at least once per year still incurs unreasonable costs, the operator is allowed
to consider lower tiers, i.e. tier 2 or tier 1 default values.
Only if no suitable default values are available, the operator has to propose an
appropriate fall-back methodology.
21
Please note that analysing once a year must not be confused with sampling just once a year, i.e.
the frequency of taking samples or increments from a batch or delivery of a fuel or material. In
general a lot more samples/increments have to be taken over the year to obtain representative
results.
