www.saas-capital.com
PAGE 1
RESEARCH BRIEF 28: RETENTION
ϭϬϬй
ϭϬϮй
ϭϬϯй
ϭϬϱй
ϭϬϳй
ϭϭϬй
ϵϬй ϵϬй
ϵϮй
ϵϯй ϵϯй ϵϯй
ϴϱй
ϵϬй
ϵϱй
ϭϬϬй
ϭϬϱй
ϭϭϬй
ϭϭϱй
>ĞƐƐƚŚĂŶ
ΨϭϮŬ
ΨϭϮŬƚŽ
ΨϮϱŬ
ΨϮϱŬƚŽ
ΨϱϬŬ
ΨϱϬŬƚŽ
ΨϭϬϬŬ
ΨϭϬϬŬƚŽ
ΨϮϱϬŬ
DŽƌĞƚŚĂŶ
ΨϮϱϬŬ
DĞĚŝĂŶZĞƚĞŶƚŝŽŶ
s
DĞĚŝĂŶEĞƚĂŶĚ'ƌŽƐƐZĞǀĞŶƵĞZĞƚĞŶƚŝŽŶďLJs
EĞƚZĞǀĞŶƵĞZĞƚĞŶƚŝŽŶ 'ƌŽƐƐZĞǀĞŶƵĞZĞƚĞŶƚŝŽŶ
ΞϮϬϮϯͲ ^ĂĂ^ĂƉŝƚĂů
Figure 1
Excludes Companies with less than $1M ARR
In Q1 of each year, SaaS Capital conducts a survey of B2B SaaS company metrics. This year’s study marked our 12th annual survey, with more than 1,500
private B2B SaaS companies responding, making it the largest survey of its kind. Below are our ndings on retention.
2023 B2B SAAS RETENTION BENCHMARKS
As we have noted for many years, revenue retention
is one of the most important metrics for ensuring
medium- to long-term business health due to its
compounding eect on growth.
The relationship of new sale bookings to revenue
retention is the SaaS version of “oense wins games,
defense wins championships.” Below is our most
recent survey data cross-referenced against other
important gures like growth rate, funding, and scale.
Denitions and formulas for key terms are at the end
of the report.
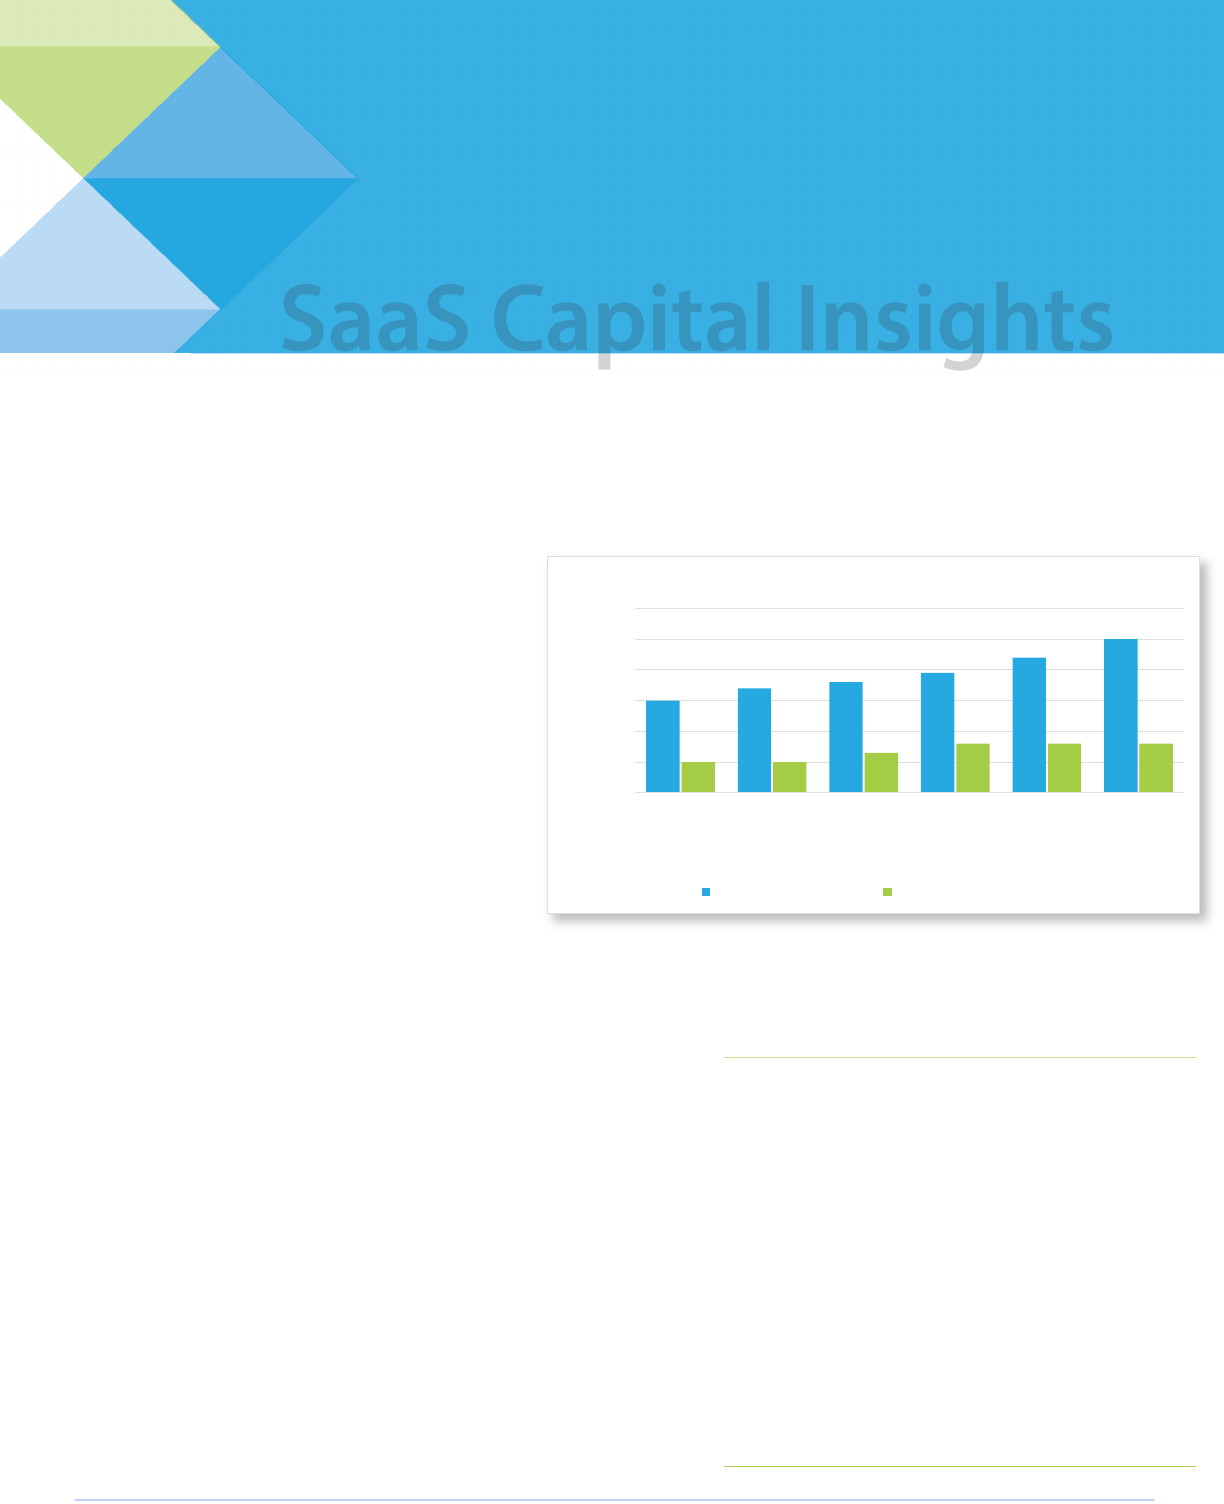
Retention by AnnuAl ContRACt VAlue
Figure 1 shows median net revenue retention (NRR)
and median gross revenue retention (GRR) across a
range of annual contract values (ACVs). For retention, benchmarking by ACV is the best starting point. More than by company
age, revenue level, or industry, companies that share a similar selling price have the most in common. They will be organized
similarly, go to market similarly, and support customers similarly. The opposite is true of two companies selling a $19.99/month
product versus a $250,000/year product.
While ACV is the best starting point for benchmarking retention, it’s worth
noting that the relationship has evolved over time. Prior to our 2020 survey,
higher gross retention was directly correlated with higher ACVs while net
retention was fairly consistent across all ACVs. Beginning with the 2020
survey, the data showed that while the companies with the very highest
ACVs still had the highest gross retention, higher net retention was starting
to correlate with higher ACVs. This year’s survey clearly illustrates the
relationship with median net revenue retention rising as ACVs increase.
Companies with ACVs above $25,000 show median gross revenue retention
of ~93%, while companies below $25,000 show 90% median gross revenue
retention. This relationship makes intuitive sense. Higher-priced solutions
often involve a longer sales cycle, in-depth scoping and implementation,
and dedicated support and account management, all of which yield a
stickier product.
“For retention, benchmarking
by ACV is the best starting
point. More than by company
age, revenue level, or
industry, companies that
share a similar selling price
have the most in common.”
www.saas-capital.com
PAGE 2
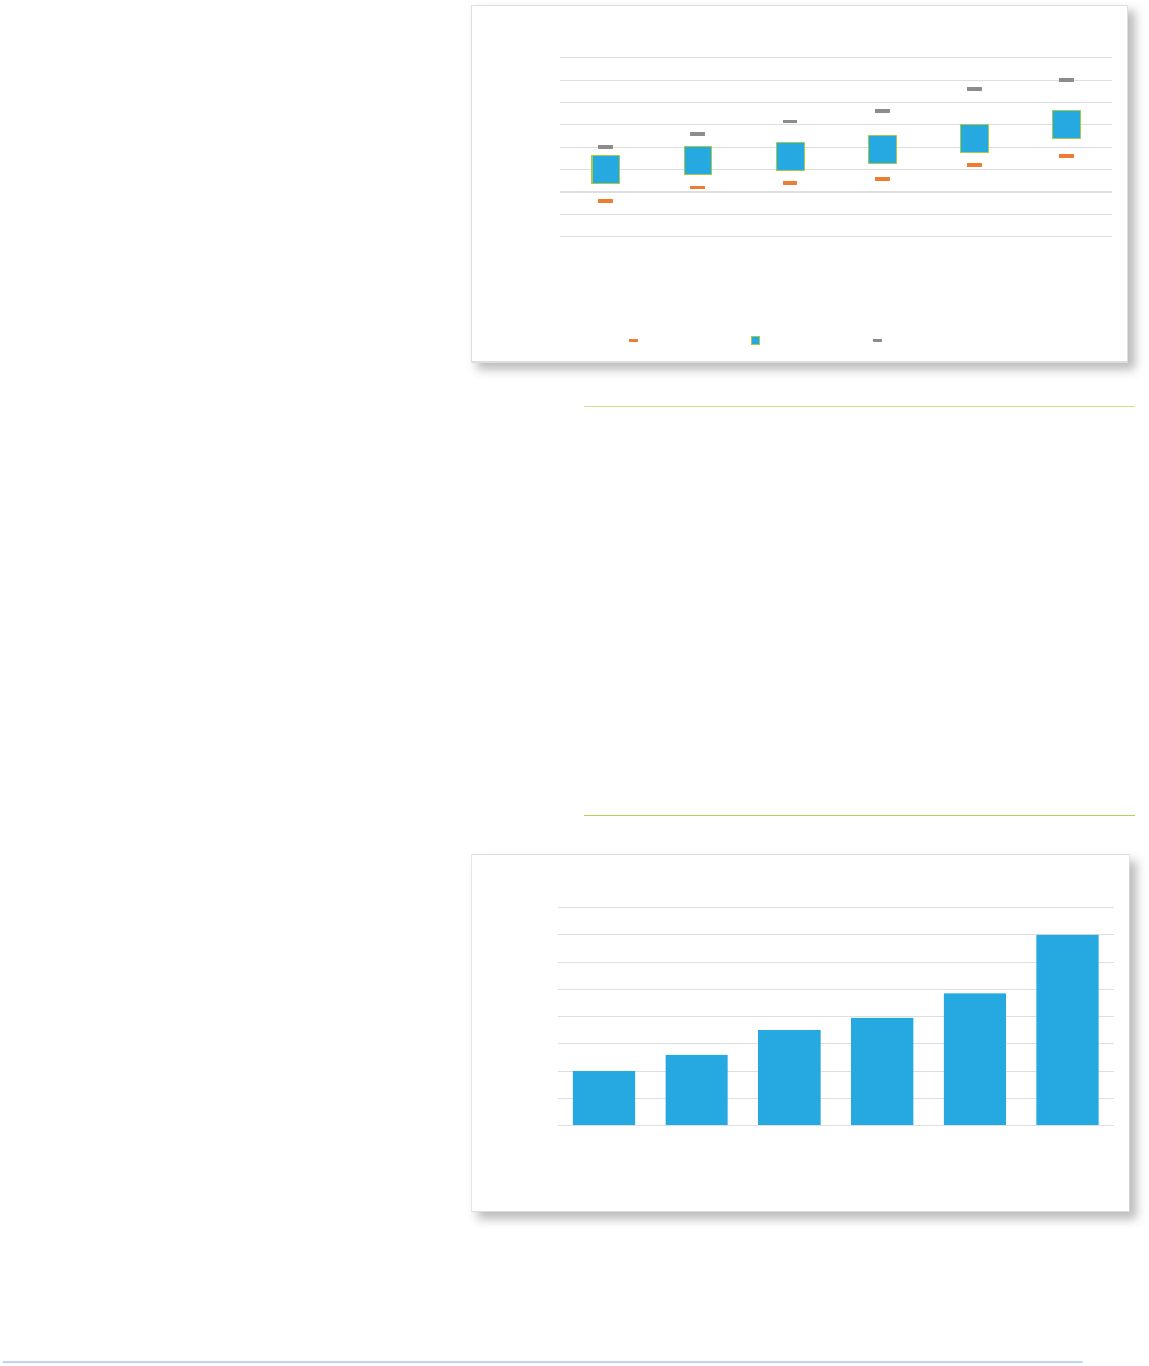
net ReVenue QuARtiles
Digging deeper into the net revenue benchmarks,
Figure 2 shows NRR broken into quartiles for the same
ACV categories. Companies with ACVs above $25,000
show median net revenue retention of at least 103%.
However, as the chart shows, even the 25th percentile
for these companies report NRR of 97% to 103%. Top-
quartile companies with ACVs north of $100,000 report
NRR of 118% to 120%.
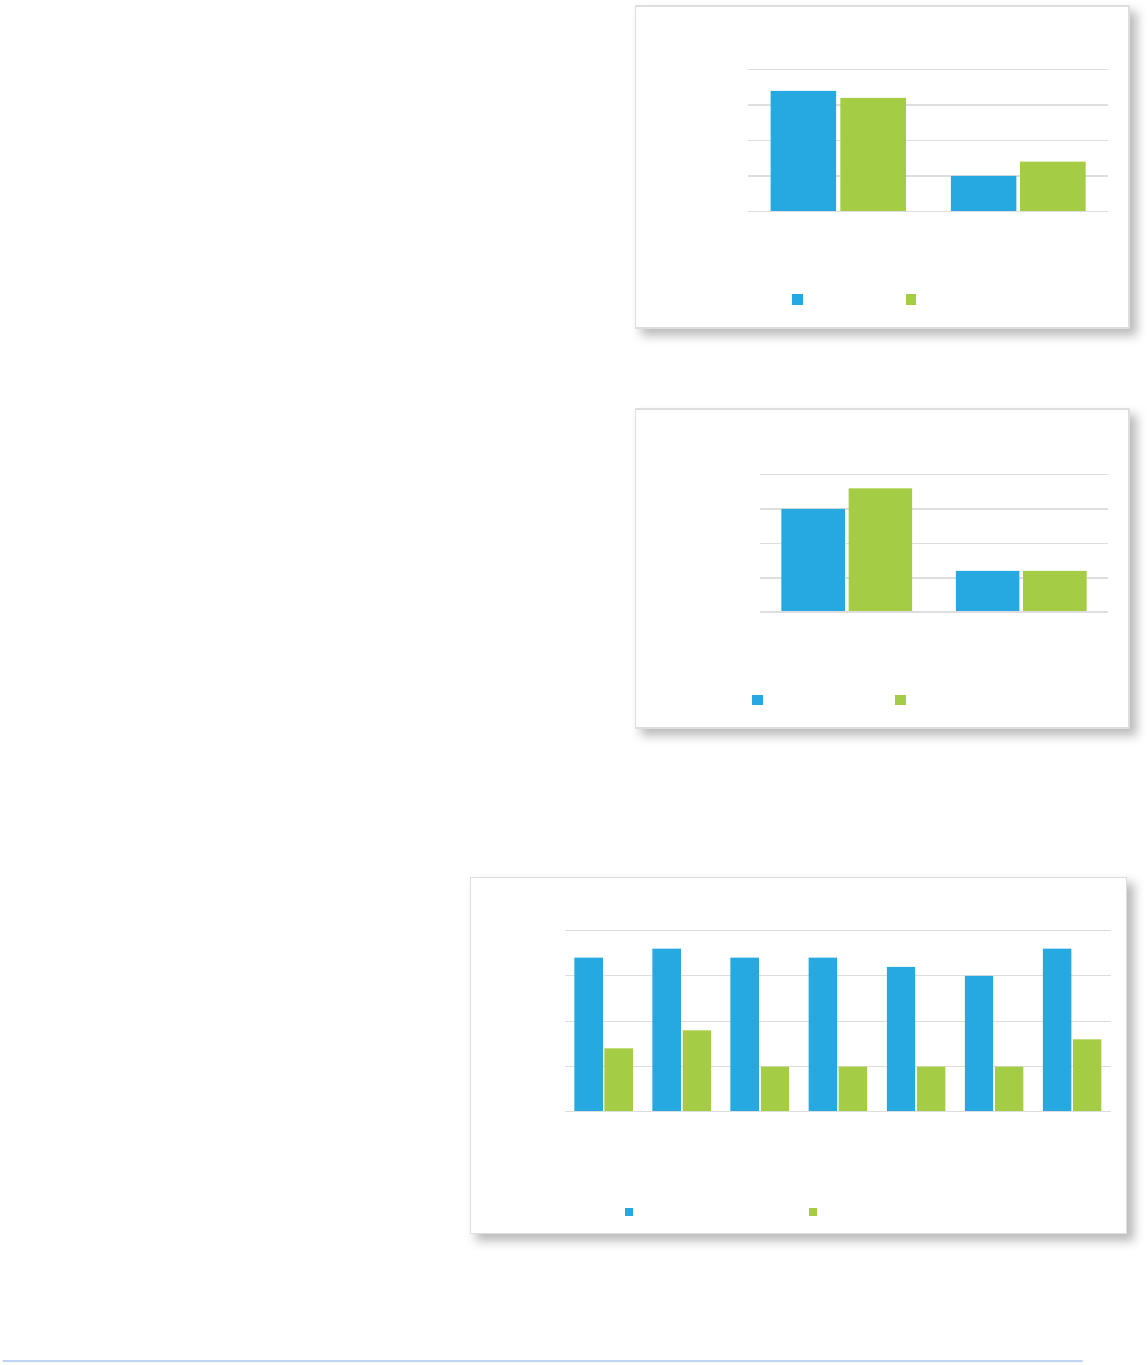
Retention And GRowth RAte
Generally speaking, higher growth is associated with
higher retention and vice versa. This is the “leaky
bucket” metaphor. The higher your retention, the
easier it is to grow that much faster because you don’t
have to rst rell the bucket before adding to it. The impact of
retention is also cumulative as it repeats and expands on itself year
after year. The opposite is also true.
There is a strong and exponential correlation between net revenue
retention and growth. The correlation between growth and NRR is
intuitive, as net retention includes what are essentially new “sales”
in the form of price increases, upgrades, upsells, and cross-sells,
all of which help grow revenue year-over-year. The cumulative
compounding nature of NRR is clearly evident in the chart.
Across the entire survey sample of companies with more than $1
million in annual recurring revenue (ARR)
1
, the median growth rate
was 34%.
The growth rates for groups of companies with NRR of
at least 110% were higher than the population median,
and the growth rate for companies with NRR below
100% was lower than the population median.
Figure 3 shows that increasing NRR from the 90% to
100% range to the 100% to 110% range improves
growth rate by 9 percentage points.
Companies with the highest NRR report median
growth that is double the population median. This is a
rare example of increasing returns from investment in
upsells and cross-sells.
The relationship between gross revenue retention and
growth is not as direct and is more binary. Companies
with gross retention below 90% reported growth
below the population median of 34%.
ϮϬй
Ϯϲй
ϯϱй
ϰϬй
ϰϵй
ϳϬй
Ϭй
ϭϬй
ϮϬй
ϯϬй
ϰϬй
ϱϬй
ϲϬй
ϳϬй
ϴϬй
ĞůŽǁ
ϵϬй
ϵϬйƚŽ
ϭϬϬй
ϭϬϬйƚŽ
ϭϭϬй
ϭϭϬйƚŽ
ϭϮϬй
ϭϮϬйƚŽ
ϭϯϬй
ďŽǀĞ
ϭϯϬй
DĞĚŝĂŶ'ƌŽǁƚŚZĂƚĞ
EĞƚZĞǀĞŶƵĞZĞƚĞŶƚŝŽŶ
'ƌŽǁƚŚZĂƚĞďLJDĞĚŝĂŶEĞƚZĞǀĞŶƵĞZĞƚĞŶƚŝŽŶ
ΞϮϬϮϯͲ ^ĂĂ^ĂƉŝƚĂů
Figure 3
Excludes Companies with less than $1M ARR
“The growth rates for groups
of companies with NRR of at
least 110% was higher than the
population median, and the
growth rate for companies with
NRR below 100% was lower than
the population median.”
ϵϯй
ϵϲй
ϵϳй
ϵϴй
ϭϬϭй
ϭϬϯй
ϭϬϬй
ϭϬϮй
ϭϬϯй
ϭϬϱй
ϭϬϳй
ϭϭϬй
ϭϬϱй
ϭϬϴй
ϭϭϭй
ϭϭϯй
ϭϭϴй
ϭϮϬй
ϴϱй
ϵϬй
ϵϱй
ϭϬϬй
ϭϬϱй
ϭϭϬй
ϭϭϱй
ϭϮϬй
ϭϮϱй
>ĞƐƐƚŚĂŶ
ΨϭϮŬ
ΨϭϮŬƚŽ
ΨϮϱŬ
ΨϮϱŬƚŽ
ΨϱϬŬ
ΨϱϬŬƚŽ
ΨϭϬϬŬ
ΨϭϬϬŬƚŽ
ΨϮϱϬŬ
DŽƌĞƚŚĂŶ
ΨϮϱϬŬ
EĞƚZĞǀĞŶƵĞZĞƚĞŶƚŝŽŶ
s
EĞƚZĞǀĞŶƵĞZĞƚĞŶƚŝŽŶďLJYƵĂƌƚŝůĞďLJs
ϮϱƚŚWĞƌĐĞŶƚŝůĞ ϱϬƚŚWĞƌĐĞŶƚŝůĞ ϳϱƚŚWĞƌĐĞŶƚŝůĞ
ΞϮϬϮϯͲ ^ĂĂ^ĂƉŝƚĂů
Figure 2
Excludes Companies with less than $1M ARR
1
We frequently exclude data from companies with less than $1 mill in ARR because of the small revenue
denominator in growth rate calculations.
www.saas-capital.com
PAGE 3
Retention foR hoRizontAl Vs. VeRtiCAl solutions
Looking at whether a company sells a vertically focused product (e.g.,
dental oce management software) versus a horizontal product (e.g.,
new hire applicant tracking) reveals only minor, and mixed, dierences.
During the pandemic, we saw that vertically focused companies
reported better retention than horizontally focused companies but that
relationship has faded.
Figure 4 shows median net revenue retention is slightly higher for
horizontally focused companies while vertically focused companies
show slightly higher median gross retention.
Retention in VC-bACked Vs. bootstRApped CompAnies
The dynamic between bootstrapped companies and equity-backed
companies has also evolved over time. Historically we had seen that
equity-backed companies showed markedly higher net and gross
retention.
Figure 5 shows equity-backed companies are reporting slightly higher
NRR while there is no dierence in GRR.
The erosion of the previous pattern of equity-backed companies
reporting notably higher NRR and GRR suggests that best practices
in customer success are now fully disseminated throughout the SaaS
industry.
Whereas previously, customer success was a niche concept advocated
by experienced executives-turned-venture capitalists advising their
portfolio companies or only seen as a nice-to-have employed by
externally funded companies and not worth bootstrapped companies
allocating money toward. Whatever the reason, CS is now clearly a SaaS
best practice in 2023.
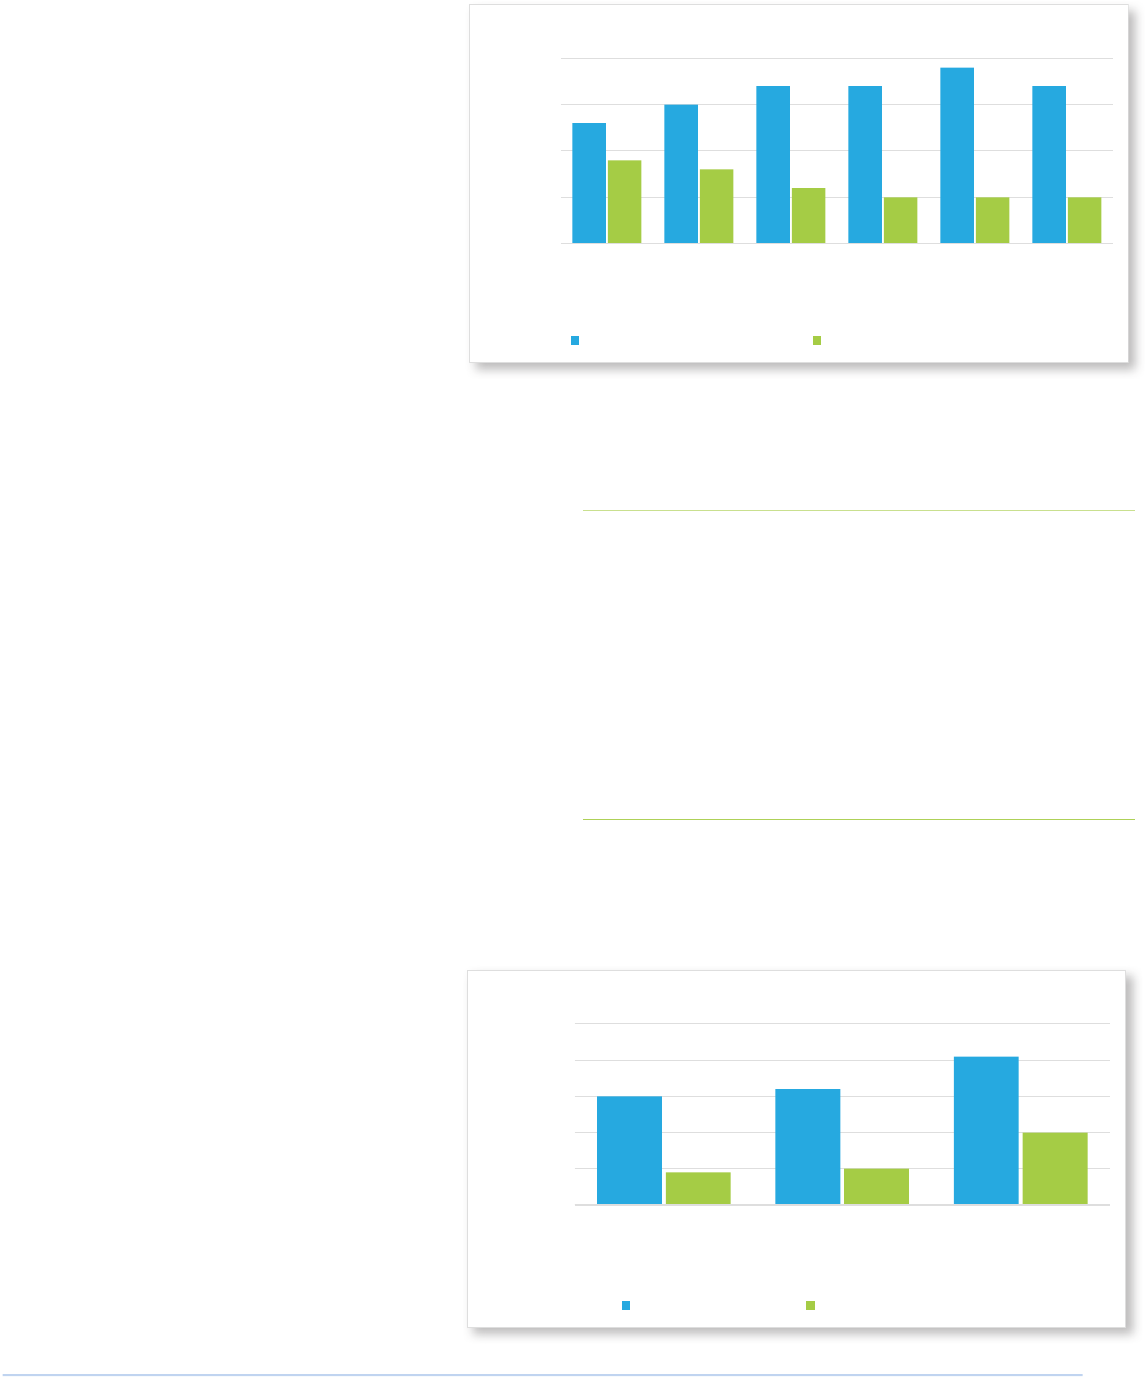
Retention by CompAny AGe
For the most part, company age isn’t a factor in
retention, especially net retention. However, there is
an important exception related to gross retention. A
point we have made in the past is that younger SaaS
companies tend to show inated gross retention
numbers because their customers haven’t yet had a
chance to churn.
Figure 6 illustrates this point. Companies less than 5
years old report median gross retention of 92% to
94%. As they enter their “scale-up” and growth phases,
retention slips and eventually stabilizes around 90%.
It is important for management teams and boards to
understand this retention “lifecycle” as SaaS companies
scale.
ϭϬϮй
ϵϬй
ϭϬϭй
ϵϮй
ϴϱй
ϵϬй
ϵϱй
ϭϬϬй
ϭϬϱй
EĞƚZĞǀĞŶƵĞ
ZĞƚĞŶƚŝŽŶ
'ƌŽƐƐZĞǀĞŶƵĞ
ZĞƚĞŶƚŝŽŶ
DĞĚŝĂŶZĞƚĞŶƚŝŽŶ
ZĞƚĞŶƚŝŽŶďLJsĞƌƚŝĐĂůǀƐ͘,ŽƌŝnjŽŶƚĂů
,ŽƌŝnjŽŶƚĂů sĞƌƚŝĐĂů
ΞϮϬϮϯ Ͳ ^ĂĂ^ĂƉŝƚĂů
Figure 4
Excludes Companies with less than $1M ARR
ϭϬϮй
ϭϬϯй
ϭϬϮй ϭϬϮй
ϭϬϭй
ϭϬϬй
ϭϬϯй
ϵϮй
ϵϰй
ϵϬй ϵϬй ϵϬй ϵϬй
ϵϯй
ϴϱй
ϵϬй
ϵϱй
ϭϬϬй
ϭϬϱй
>ĞƐƐƚŚĂŶ
ϯzĞĂƌƐ
ϯƚŽϱ
zĞĂƌƐ
ϲƚŽϴ
zĞĂƌƐ
ϵƚŽϭϭ
zĞĂƌƐ
ϭϮƚŽϭϰ
zĞĂƌƐ
ϭϱƚŽϭϳ
zĞĂƌƐ
KǀĞƌϭϳ
zĞĂƌƐ
DĞĚŝĂŶZĞƚĞŶƚŝŽŶ
ŽŵƉĂŶLJŐĞ
ZĞƚĞŶƚŝŽŶďLJŽŵƉĂŶLJŐĞ
EĞƚZĞǀĞŶƵĞZĞƚĞŶƚŝŽŶ 'ƌŽƐƐZĞǀĞŶƵĞZĞƚĞŶƚŝŽŶ
ΞϮϬϮϯͲ ^ĂĂ^ĂƉŝƚĂů
Figure 6
Excludes Companies with less than $1M ARR
ϭϬϬй
ϵϭй
ϭϬϯй
ϵϭй
ϴϱй
ϵϬй
ϵϱй
ϭϬϬй
ϭϬϱй
EĞƚZĞǀĞŶƵĞ
ZĞƚĞŶƚŝŽŶ
'ƌŽƐƐZĞǀĞŶƵĞ
ZĞƚĞŶƚŝŽŶ
DĞĚŝĂŶZĞƚĞŶƚŝŽŶ
ZĞƚĞŶƚŝŽŶďLJ&ƵŶĚŝŶŐdLJƉĞ
ŽŽƚƐƚƌĂƉƉĞĚ ƋƵŝƚLJͲĂĐŬĞĚ
ΞϮϬϮϯͲ ^ĂĂ^ĂƉŝƚĂů
Figure 5
Excludes Companies with less than $1M ARR
www.saas-capital.com
PAGE 4
Retention by ARR
Following the point about company age, another
way to measure maturity is by the size of a company.
Figure 7 shows both median net revenue retention
and median gross retention by ARR.
Gross revenue retention by ARR echoes the data in
Figure 6. We know from other analysis that it typically
takes a company on average six years to reach $1
million in ARR, so the curve here is consistent with
companies having slightly overstated GRR until year
ve or six and ARR of $3 to $5 million, before entering
their scale phase.
Note that in both Figure 6 and Figure 7 the dierences
between each cohort are slight, but we have seen a
similar shape to the data for numerous years. The positively correlated relationship between median net revenue retention and
ARR is one that emerged in our 2022 survey. Historically, net revenue retention was largely the same across all company sizes. We
now see an emerging pattern of NRR increasing as companies scale.
A possible explanation for this could be the convergence of two
points noted above. First, net retention has a strong, cumulative,
and compounding impact on growth year-on-year-on-year.
Second, data elsewhere in this analysis indicates companies are
now fully embracing customer success as a table-stakes SaaS
strategy, with positive results.
Retention by ContRACtinG lenGth
A frequently asked question is whether contract length impacts
retention. It makes intuitive sense that longer-term contracts
would reduce churn.
Figure 8 shows companies that primarily use month-to-month terms and annual contracts show median net revenue retention
and median gross revenue retention that is essentially the same at 100% and ~90%, respectively.
Companies primarily utilizing multi-year contracts
show higher median net revenue retention and
median gross revenue retention, which seems
to support the idea that long-term contracts are
conducive to reducing churn.
However, it should be noted that this is not a
relationship that has been consistent in previous
survey results. Historically, net revenue retention
showed little correlation with contract length while
the 2022 survey was the rst year to show higher
gross revenue retention with multi-year contracts.
Given the economic slowdown in 2022, this might
be a situation where multi-year contracts haven’t yet
come up for renewal and therefore had a chance to
churn.
ϵϴй
ϭϬϬй
ϭϬϮй ϭϬϮй
ϭϬϰй
ϭϬϮй
ϵϰй
ϵϯй
ϵϭй
ϵϬй ϵϬй ϵϬй
ϴϱй
ϵϬй
ϵϱй
ϭϬϬй
ϭϬϱй
>ĞƐƐƚŚĂŶΨϭ
DŝůůŝŽŶ
ΨϭͲΨϯDŝůůŝŽŶ ΨϯͲΨϱDŝůůŝŽŶ ΨϱͲΨϭϬ
DŝůůŝŽŶ
ΨϭϬͲΨϮϬ
DŝůůŝŽŶ
DŽƌĞƚŚĂŶΨϮϬ
DŝůůŝŽŶ
DĞĚŝĂŶZĞƚĞŶƚŝŽŶ
ZZ
DĞĚŝĂŶEĞƚĂŶĚ'ƌŽƐƐZĞǀĞŶƵĞZĞƚĞŶƚŝŽŶďLJZZ
DĞĚŝĂŶEĞƚZĞǀĞŶƵĞZĞƚĞŶƚŝŽŶ DĞĚŝĂŶ'ƌŽƐƐZĞǀĞŶƵĞZĞƚĞŶƚŝŽŶ
ΞϮϬϮϯͲ ^ĂĂ^ĂƉŝƚĂů
Figure 7
“Historically, net revenue retention
was largely the same across
all company sizes. We now see
an emerging pattern of NRR
increasing as companies scale.”
ϭϬϬ͘Ϭй
ϭϬϭ͘Ϭй
ϭϬϱ͘ϱй
ϴϵ͘ϱй
ϵϬ͘Ϭй
ϵϱ͘Ϭй
ϴϱ͘Ϭй
ϵϬ͘Ϭй
ϵϱ͘Ϭй
ϭϬϬ͘Ϭй
ϭϬϱ͘Ϭй
ϭϭϬ͘Ϭй
EŽĐŽŶƚƌĂĐƚƐŽƌŵŽŶƚŚͲƚŽͲ
ŵŽŶƚŚ
ŶŶƵĂů DƵůƚŝͲLJĞĂƌ
DĞĚŝĂŶZĞƚĞŶƚŝŽŶ
WƌŝŵĂƌLJ/ŶŝƚŝĂůŽŶƚƌĂĐƚ>ĞŶŐƚŚ
ZĞƚĞŶƚŝŽŶďLJŽŶƚƌĂĐƚ>ĞŶŐƚŚ
EĞƚZĞǀĞŶƵĞZĞƚĞŶƚŝŽŶ 'ƌŽƐƐZĞǀĞŶƵĞZĞƚĞŶƚŝŽŶ
ΞϮϬϮϯͲ ^ĂĂ^ĂƉŝƚĂů
Figure 8

www.saas-capital.com
PAGE 5
ConClusions And tAkeAwAys
• Across all SaaS companies, the 2023 median net
retention is 102%, which is unchanged from 2022.
Median gross retention is 91%, also unchanged from
the previous year’s survey.
• One of the biggest takeaways this year is the
evolving relationship between median net revenue
retention and ACVs. Historically, the data showed
little correlation. Over the last few years, we have seen
signs that the highest ACVs showed higher median
net revenue retention. This year’s data showed a
direct, positive relationship with median net revenue
retention rising as ACVs increase.
• Higher-ACV products show higher net and gross
retention. For companies with ACVs below $25k, 90% gross retention is the norm. Higher ACV companies should
benchmark to 93%.
• Growth rate continues to be positively and exponentially correlated with net revenue retention, while gross revenue
retention is a “table stakes” benchmark – to have a shot at performance parity with your peers, GRR must be at least 90%.
• While the median NRR is 102% across the entire survey, the benchmark to target for median growth rate of 34% is NRR of
at least 100%.
• Gross retention during the rst 5 years of a company’s life may be articially elevated until customers have had enough
time to churn. GRR by ARR corroborates this point, and, while the changes are slight, GRR declines as companies reach $3
million of ARR, then stablizes.
• Equity-backed companies report slightly higher net revenue retention than bootstrapped companies while there was no
reported dierence in gross retention. Historically, VC-backed companies have had higher retention across both metrics
and the erosion of that relationship suggests that best practices in customer success are now fully disseminated.
• Whether a company sells a vertically focused product or a horizontal product shows only minor, and mixed, dierences.
• Contracting length shows a potentially developing relationship where multi-year contracts show higher median net
revenue retention and median gross revenue retention.
Retention definitions And foRmulAs
We asked companies to report their net and gross annual revenue retention data. Customer account retention may be a useful
metric for you to track, but our focus in the survey, and generally the retention metric we think is the most important, is based on
dollars of revenue. We dene net retention as:
(Monthly Recurring Revenue in December of 2022 only from customers who were customers in December 2021)
÷
(Total MRR in December 2021)
This number can be anything from 0% to well above 100%, as it includes upsells, new product cross-sells, and price increases.
Annual gross retention is the same formula, excluding the upsells, cross-sells, and price increases. (For easy calculation, set each
customer’s 2021 MRR to be less than or equal to their 2021 MRR.) For this reason, gross retention cannot exceed 100%.
“Growth rate is positively and
exponentially correlated with net
revenue retention, while gross
revenue retention is a “table stakes”
benchmark – to have a shot at
performance parity with your peers,
GRR must be at least 90%.”

www.saas-capital.com
PAGE 6
SaaS Capital is the leading provider of growth debt designed explicitly for B2B SaaS companies. SaaS Capital’s growth debt is
structured to provide a signicant source of committed funding, deployment exibility, and lower overall cost of capital, all while
avoiding the loss of control associated with selling equity. SaaS Capital was the rst to oer lending alternatives to SaaS businesses
based on their future recurring revenue. Since 2007, SaaS Capital has committed more than $375 million in growth debt facilities to
deliver better outcomes for our 110+ clients, resulting in more than $2 billion in total enterprise value created.
Benets of SaaS Capital’s unique, SaaS-focused approach:
• Higher advance rates - Capital availability is based on a multiple of your
monthly recurring revenue (MRR) – typically 5x to 8x MRR
• Capital availability that grows with your business - The amount of
capital that you can draw increases automatically as your revenue grows
• Long-term source of capital - The capital is drawn down over 2 years
under the committed line of credit, and then either renewed, or repaid
over the following 3 to 4 years
• Ecient use of capital - Capital is drawn down only as your business
needs it, thereby reducing your interest expense
• Cost is simple and transparent - Interest rate of 12% to 14%, a 1.0% to
1.5% commitment fee, and a nominal penny warrant
• Flexibility - No balance sheet covenants or cash reserve requirements
SaaS Capital is best able to assist companies with the following
attributes:
• Sell a SaaS-based solution
• Seeking $2M to $20M in growth capital
• $250,000, or above, in MRR
• Have a minimum of 85% retention
• Registered and principally banked in the U.S., Canada, or UK
• Revenue growth above 15% per year
Your business does NOT need to be:
• Venture Backed
• Protable
• Billing your customers monthly
Visit www.saas-capital.com to learn more.
1311 VINE STREET | CINCINNATI, OH, 45202
7900 E GREENLAKE DRIVE NE, SUITE 206 | SEATTLE, WA 98103
WWW.SAASCAPITAL.COM
ROB BELCHER | MANAGING DIRECTOR | RBELCHERSAASCAPITAL.COM | 3038709529
STEVE JAFFEE | MANAGING DIRECTOR | SJAFFEESAASCAPITAL.COM | 6145062770
RANDALL LUCAS | MANAGING DIRECTOR | RLUCASSAASCAPITAL.COM | 6179057467
STEPHANIE FORTENER | MANAGING DIRECTOR| SFORTENERSAASCAPITAL.COM | 6144256519
About SaaS Capital
