
SaaS Sales
Compensation
Policies & Practices
Report
January 2021

Introduction
Plan Designs
Sales Crediting
Policy
Demographics
About Us
Caps
Accelerators
Multi-Year
SPIFFs
Front Line Managers
Recognition & Timing
Splits
Early Renewals
Non-Recurring Revenue
New Logos
Tools
Mega Deals
New Hire Ramp
Contents
It’s not about going
back; it’s about preparing
for the future.

3
Introduction
Many SaaS organizations have closed out
their year and have recently gone through
compensation planning for this scal year.
Nearly every organization will evaluate their
sales compensation programs as a part of
this process. As organizations evaluate their
design, they’ll likely focus on the performance
metrics, accelerator tables, quotas, and pay
levels. All of which are important design
elements, and each with many available
industry benchmarks. However, many
organizations will not address the policies
and practices that govern the overall
compensation plan.
Policies and practices are often the toughest
questions related to the plan design. They’re
situational. They can be specic to your
industry sector. They were likely put in place
by legacy team members. They don’t often
change every year. It can be difcult to know
if your company even needs certain policies.
But your plan’s policies and practices can
have a huge impact on the behavior and
performance of your sales team.
Specically, our research addressed the most
common questions we received related to:
• Sales Crediting
• Mega Deals
• Accelerators
• New Hire Compensation
• And of course, Spiffs
The goal of our research is to help your
organization drive smarter decisions around
these policies and practices. Simply put, we
want to capture better insights on these
questions with answers that typically start
with “it depends…”.
68%
67%
49%
have no policy governing
‘Mega Deals’
utilize Spiffs in their
compensation Plan
of respondents don’t have
a mechanism in place to
compensate deals that are
renewed early
4
Plan Design: Caps
Caps are not a widely used practice in SaaS sales compensation,
especially for companies with smaller ACVs.
While companies with larger ACVs ($50k+) are 2x more likely to use
caps than companies with smaller ACVs, only 25% of companies with
larger ACVs have caps.
The hard cap limits upside versus the soft cap that pays a lower rate
at a certain performance level.
Does your plan have a cap? What is your cap based on?
The most common practice of caps is to limit the performance
to goal (i.e. at 200% of goal paid reduced/no amount) versus
performance to variable (i.e. 3x target variable).
11%
25%
63%
12%
6%
83%
Hard Cap Performance to goal
Reects SaaS participants
who use caps
Performance to variable Per Deal Cap Soft Cap No Cap
5
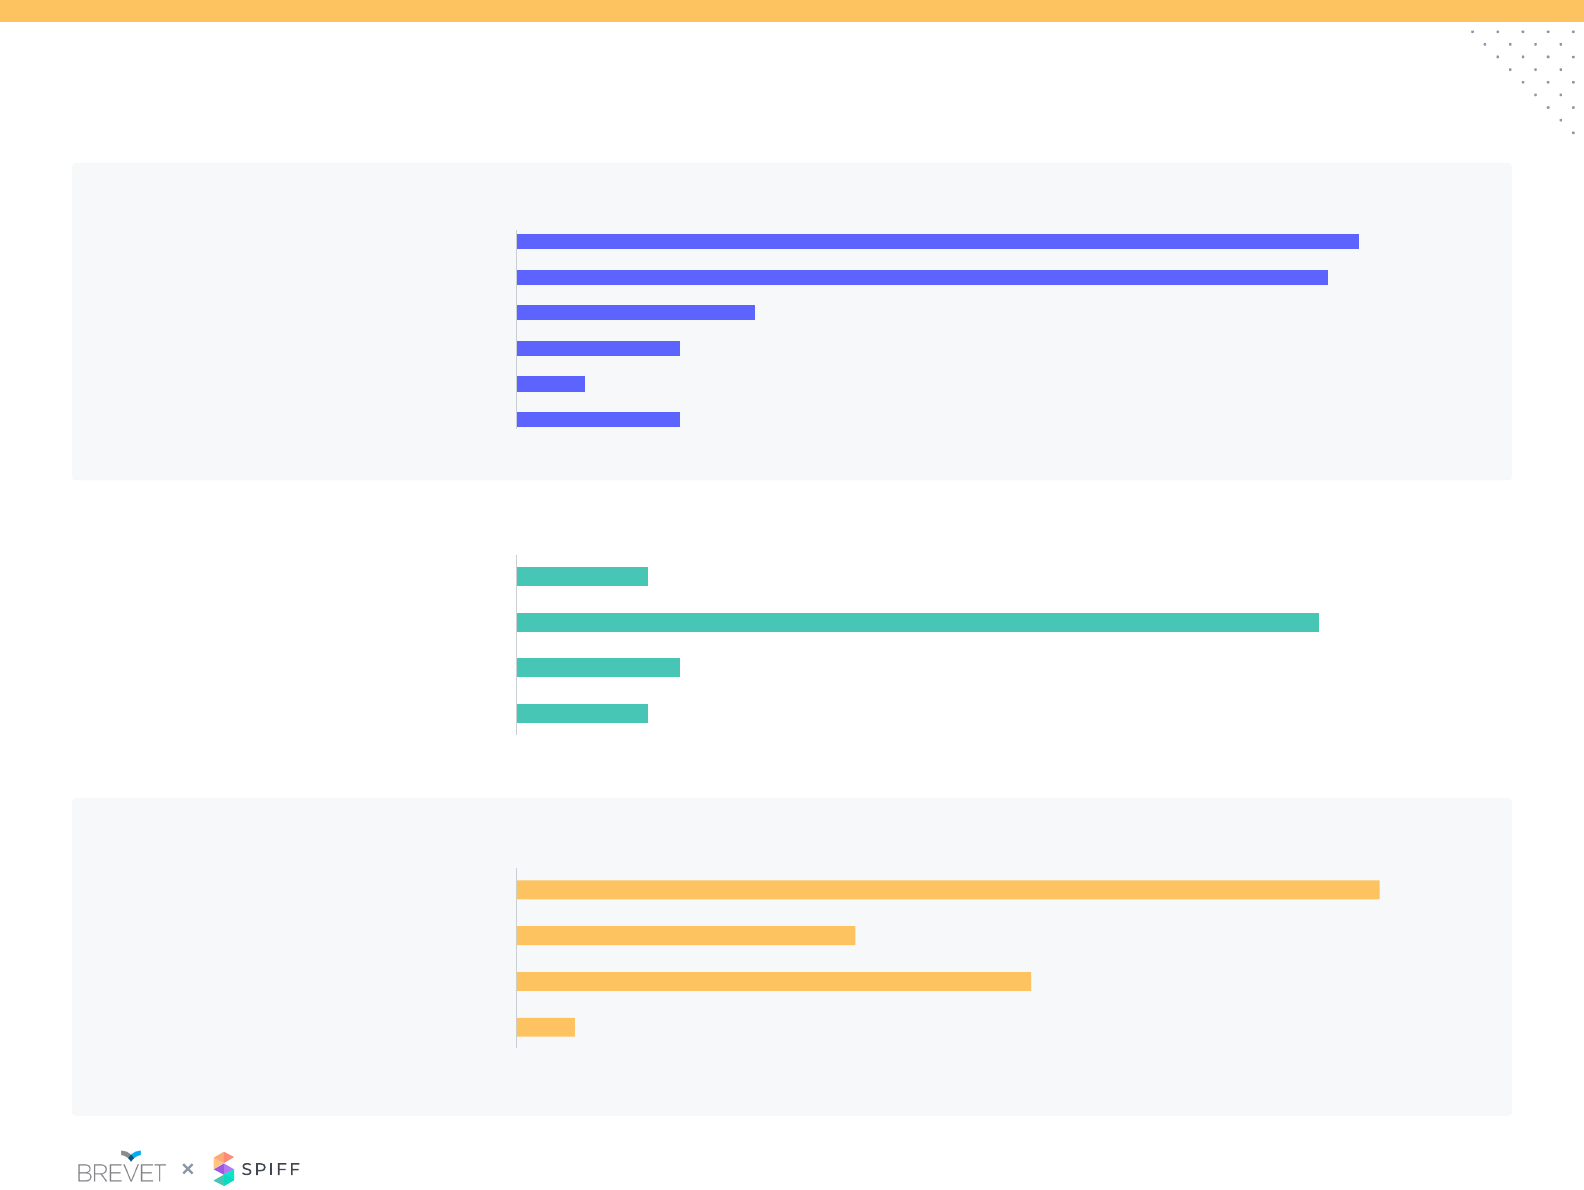
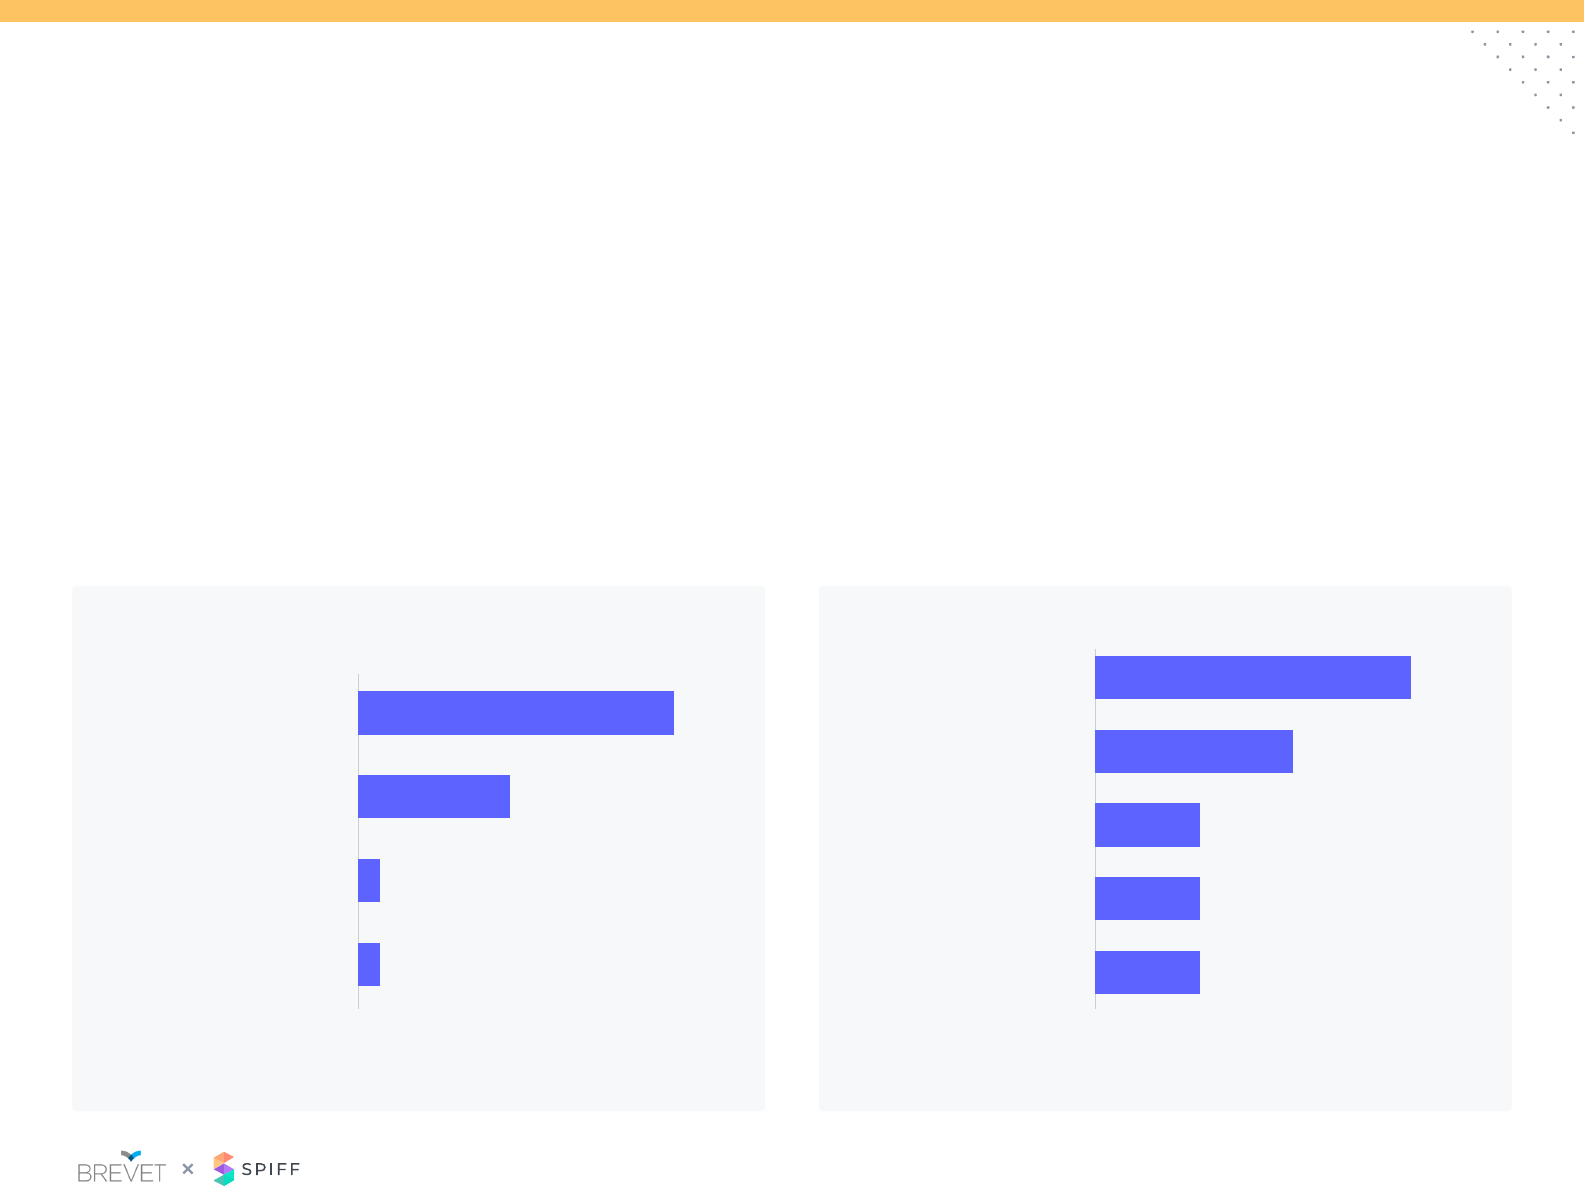
Plan Design: Multipliers
Multipliers are often used in incentive plans (60%) to accelerate quota
retirement and/or accelerate incentives.
75% of companies with ACVs greater than $25k use multipliers in
some fashion in their compensation plans.
Does your sales incentive plan use multipliers to
accelerate quota retirement or incentives?
What do you pay multipliers on? (Check all that apply)
The most common strategic reasons to use multipliers is to extend
contract length, obtain new accounts/markets, or promote new/
strategic products.
The practice of multipliers needs to be reassessed on regular basis as
it adds complexity to the sales incentive plan.
30%
40%
30%
20%
10%
30%
40%
50%
Deal
duration
Net New
accounts
Certain
products
Spiff Up-sell /
Cross-sell
Growth
year
Renewals Other
44%
34%
25%
22%
19%
15%
9% 9%
0%
Multipliers accelerate quota retirement
Multipliers accelerate incentives or SPIFFs Multipliers not used
6
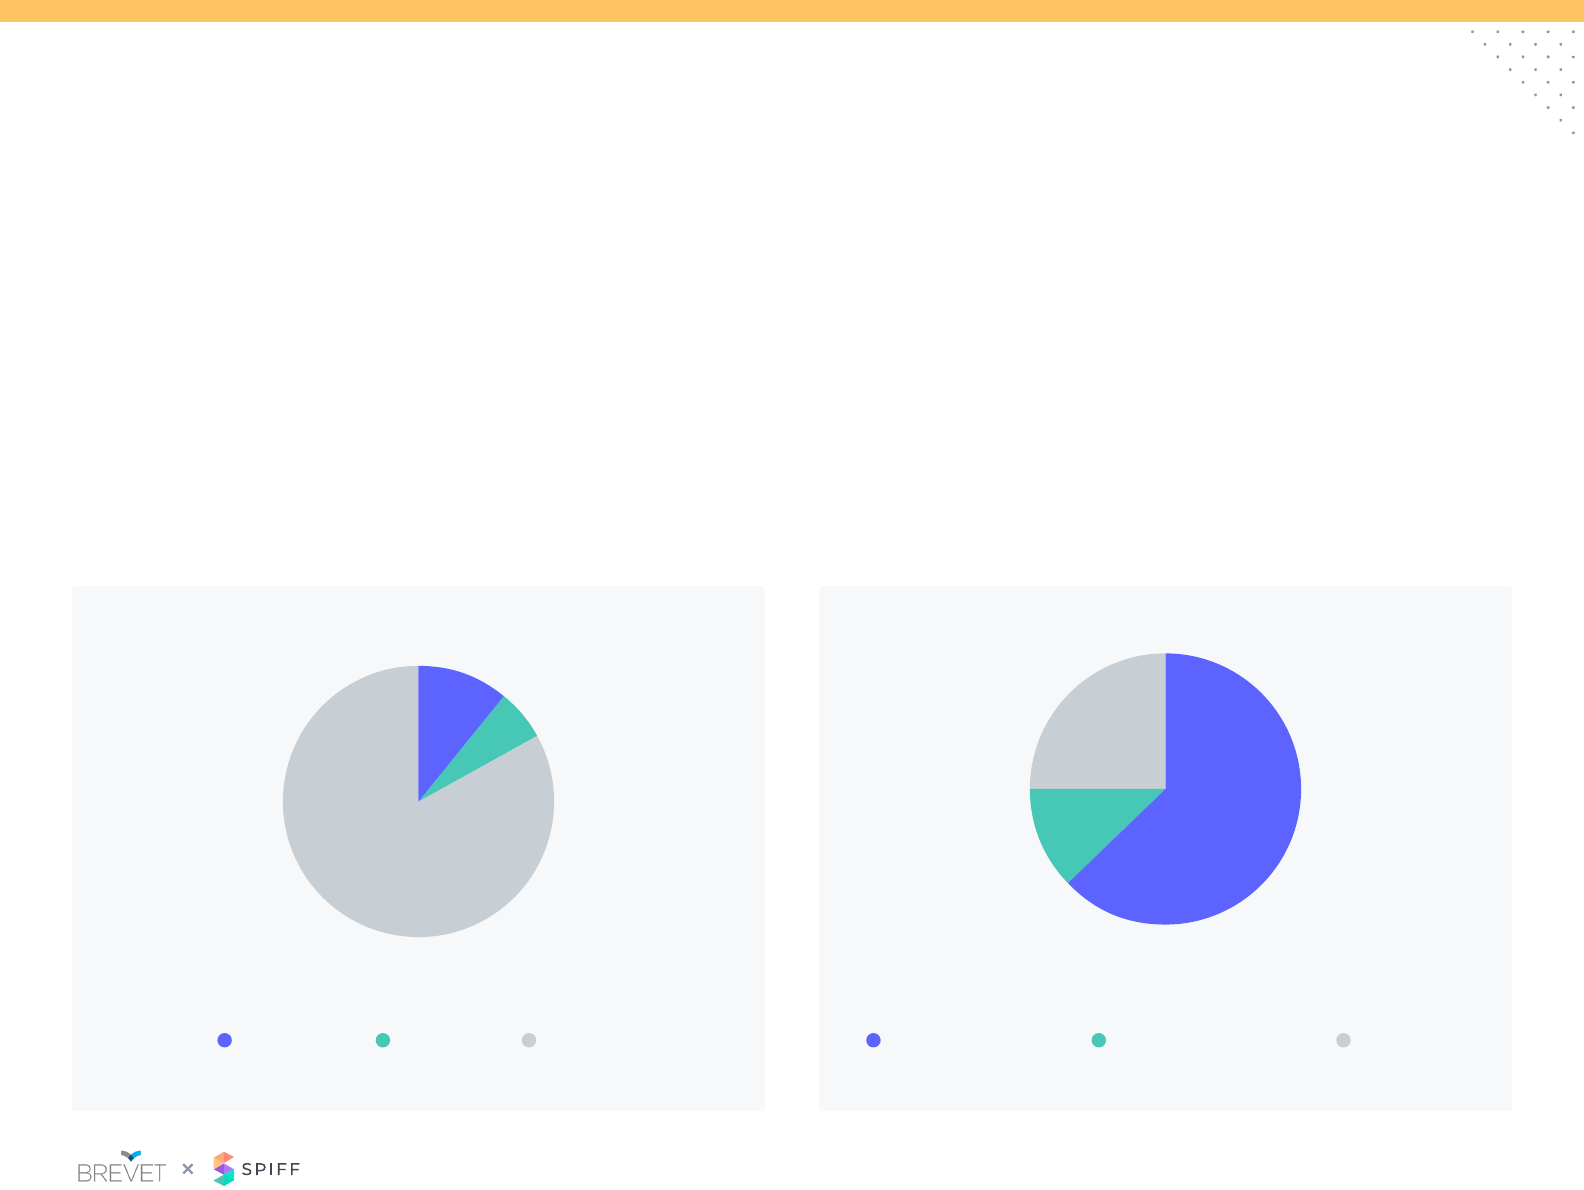
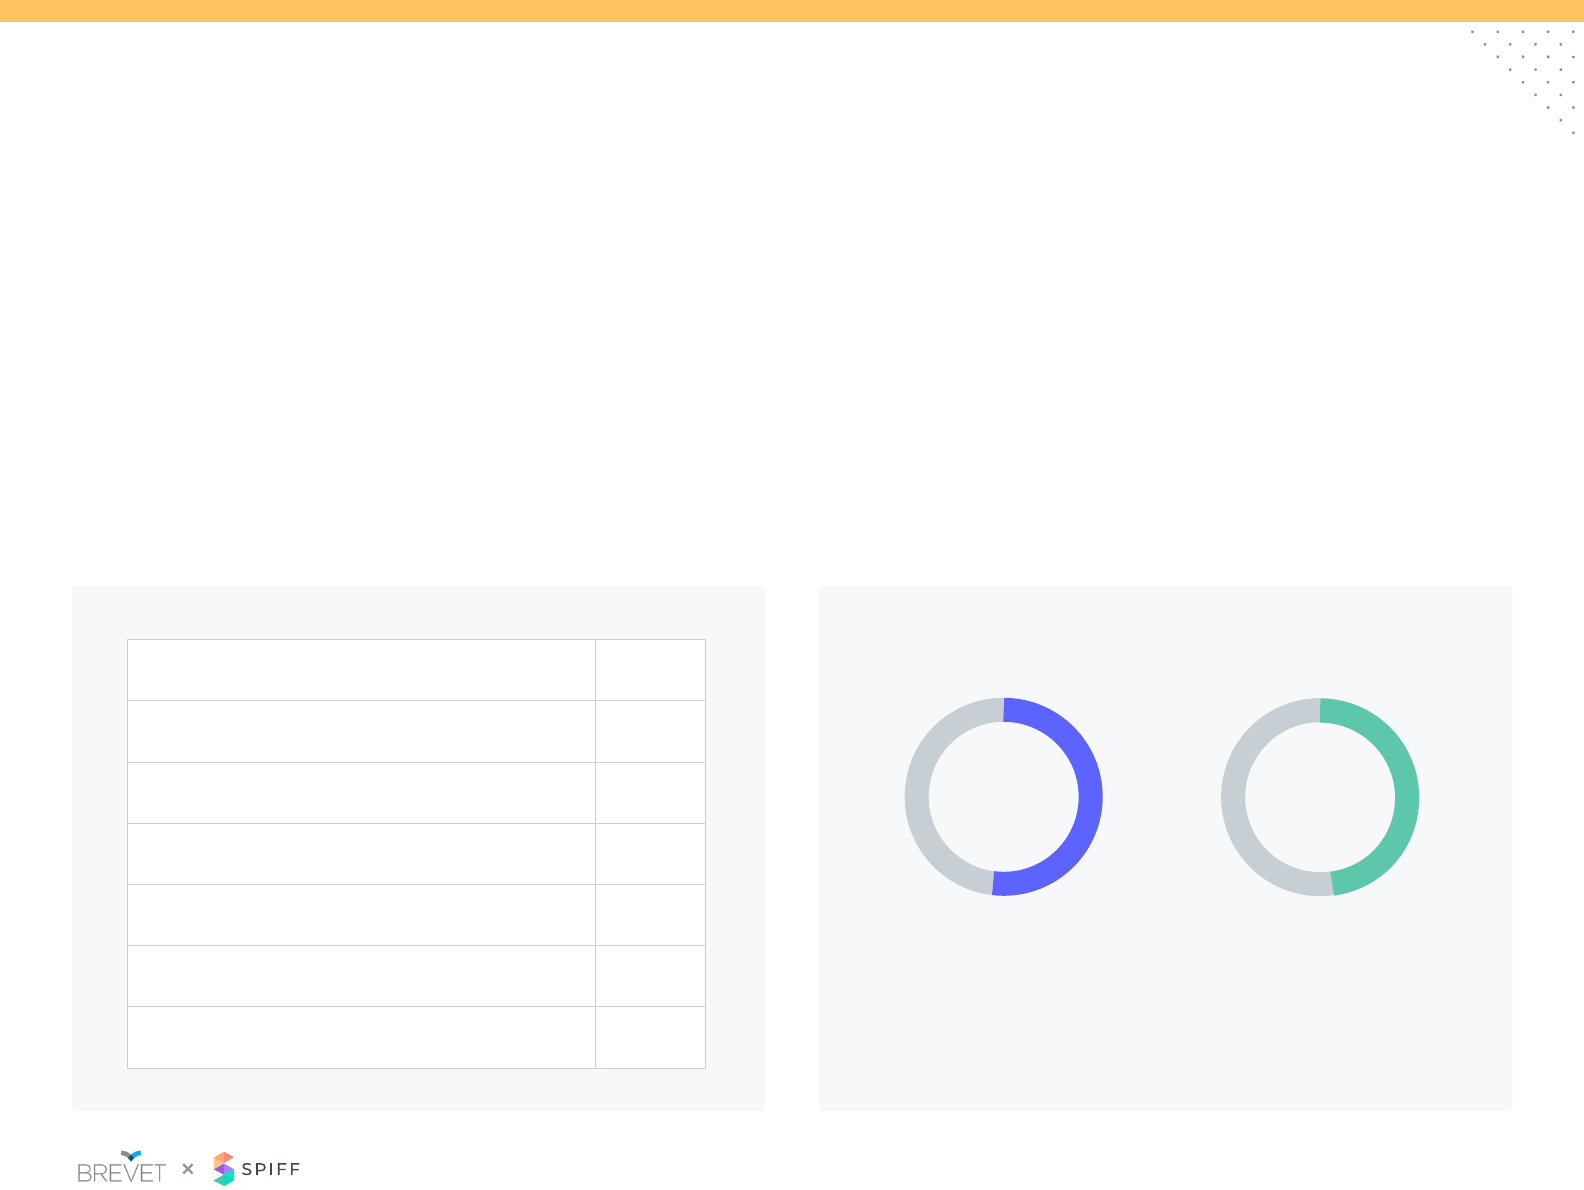
Plan Design: Accelerators
Sellers are eligible for accelerated rates of incentive on varying time
frames. Quarterly is the most common approach as it aligns with the
sales cycle and compensation payout.
How are accelerators paid?Accelerator Frequency
The most common approach to applying accelerators is through a
tiered structure. This allows for only net dollars above a specic goal
to be eligible for the higher rate.
Only 1/3 of companies apply the acceleration on the full amount.
Tiered structure, accelerators only
applied to amount over goal
Quarterly
Semi-Annually
Annually
No Accelerators
Monthly
Other
Retroactive, accelerators
applied to all revenue generated
62% 31%
7%
0% 10% 20% 30% 40%
23%
37%
5%
26%
9%
7
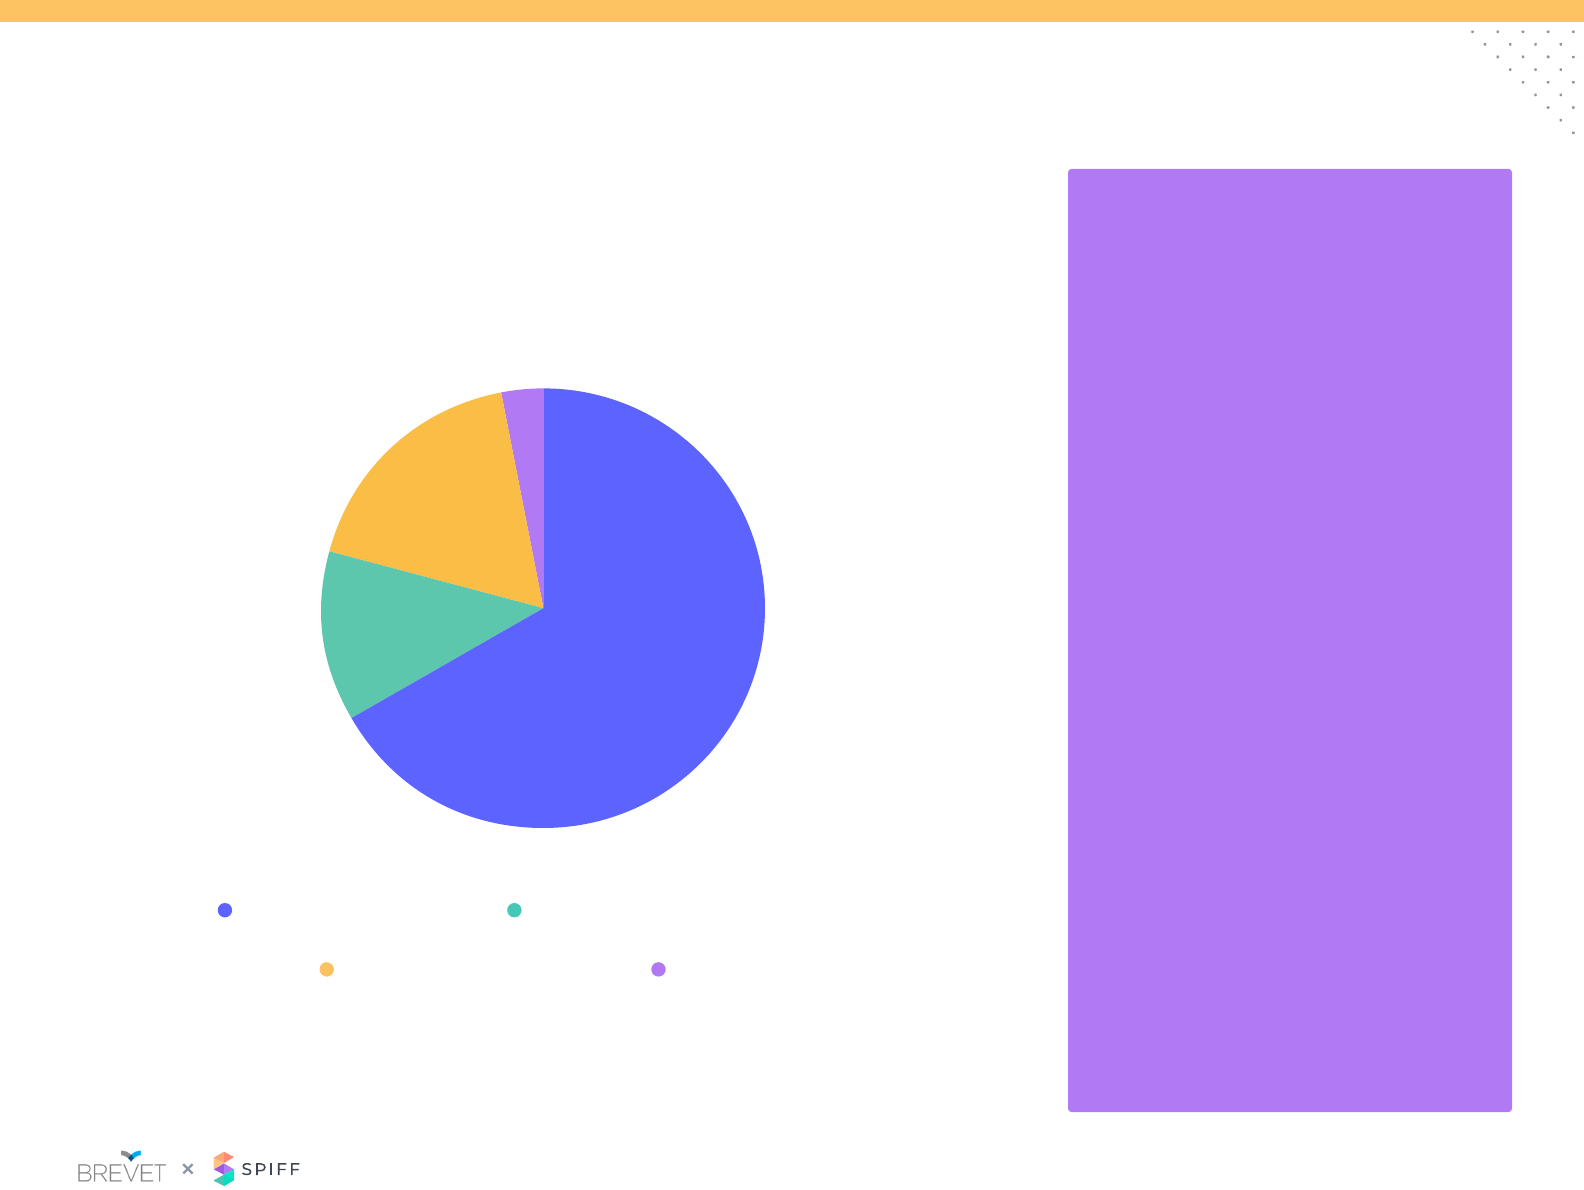
Plan Design: Multi-Year Deal Compensation
20%
10%
30%
40%
50% 48%
26%
11%
9%
7%
Annual
Contract
Value
Annual Contract
Value Multiplier
based on length
of contract
Total Contract
Value
Bonus (Flat or %)
paid for
multi-year
No
compensation
paid
0%
76%
1.5x
<40%
use ACV in some capacity to determine
compensation on multi-year deals
is average multiplier on contracts
>12 months. Multipliers on multi-years
range from 1.15x – 1.75x on two-year deals
and 1.1x – 2.5x on three-year deals
contracts signed are greater than
12 months
8
Plan Design: SPIFFS
Sales of specied product
Monthly
1-2%
Achievement of individual goal
Quarterly
3-4%
Multiple SPIFF targets
Semi-Annually
5-10%
Achievement of team goal
Annually
10%+
Maintain pricing / not discounting
Other
0%
0%
0%
10%
18%
13%
20%
35%
25%
Why SPIFFs?
SPIFF Frequency
Percentage of Total Incentive Budget for SPIFFs
37%
11%
48%
19%
30%
4%
64%
11%
14%
35%
11%
7%
7%
3%
30%
53%
38%
40%
70%
50%
9
Plan Design: Front Line Managers
65%
32%
17%
Sales incentive based
Have managers with
Hybrid teams^
Mix of sales and
non-sales incentive
compensation
Which of the following best describes your front-line sales
manager plan?
68%
3%
18%
13%
Team’s roll up performance
Other
Mix of overall and specic targets*
Mix of revenue targets and KPIs
10
Sales Credit: Recognition & Payout Period
More than half of respondents pay for the sale at booking, leaving the
company at risk if the invoice is not paid. Yet only 39% of respondents
issue claw backs in their incentive plans
Over the past 2 years, there has been a shift to credit upon payment
receipt (27%). This policy works more effectively for shorter revenue
cycles.
When do you process the payment of incentives? When do you credit quota retirement for the sale?
Processing incentive payments within 30 days has become the norm
and expectation.
Delaying incentive payments longer than 60 days can lead to a
disconnect between work and reward.
54% 60%
14%
8%
10%
8%
27%
13%
4%
2%
100% at booking 30 days in arrears
90 days in arrears Other
45 days in arrears 60 days in arrears
Split at booking and at invoicing
Following testing and client acceptance
100% at payment receipt
100% at invoicing
11
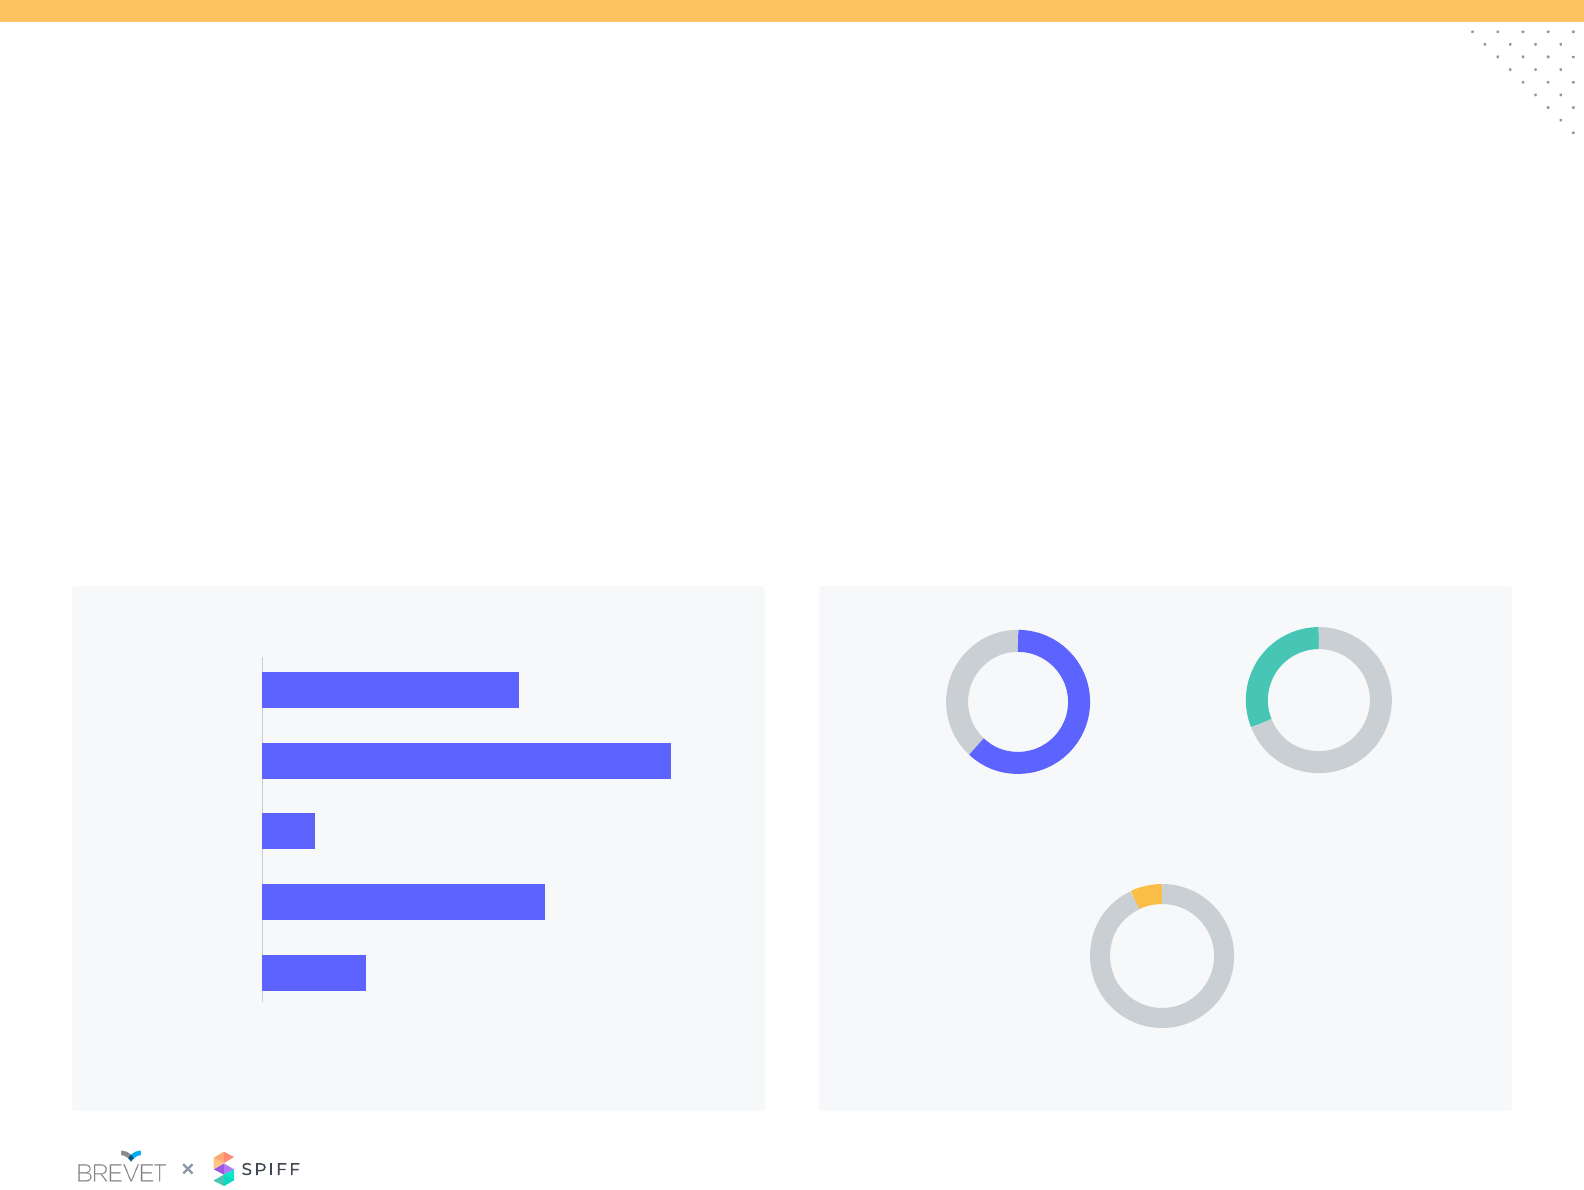
Sales Credit: Splits
Almost 1/3 of participants do not split sales credit and/or have no split
policy.
Splitting credit is commonplace, who gets the split credit is not. For
those participants, that do split credits it is primarily due to territory
and/or account changes as relationships transition. There is an
increase in splits for collaborative sales between reps.
How are splits determined? (Check all that apply) When do you split sales credit? (Check all that apply)
Very few SaaS participants have a specic criterion to determine
splits. Most respondents determine splits on a situational basis.
Allowing the involved reps negotiate splits allows management to
stay unbiased but can lead to awkward situations where imbalances
of seniority and negotiation skills can create tension.
Dened rates based on role,
contribution or % quota assigned
Dened rates based on role,
contribution or % quota assigned
Negotiated splits
between involved roles
Reects SaaS participants who have split policy
33% 42%
42%
Territory or account transitions
Sellers in the same role
Seller and specialist*
Manager and seller
Pod structure – AE, SDR, CSM
Don’t split credit
0% 10% 20% 30% 40%
37%
33%
31%
14%
12%
12%
12
Sales Credit: Early Renewals
The policy on handling early renewals has received a lot of attention
in the last few years. There is mixed reaction on recognizing early
renewals.
Surprisingly, the majority of participants do not recognize early
renewals at this time and/or treat early renewal the same as standard
renewal. For those companies that do recognize early renewals, the
AE and assigned CSM are most likely to receive credit.
How is early renewal credit determined?Who Receives Credit for Early Renewals?
For the participants that have specic early renewals policies, the
amount of credit is split between new contract only vs. the net of
the new contract and original contract. In some cases, the quota is
adjusted to incorporate the new contract.
New Contract Only New Contract Less
Remaining Contract
52% 48%
No credit for early renewal 50%
14%
12%
8%
8%
4%
4%
AE receives credit
CSM rep receives credit
AM receives credit
Multi-credit between roles (AE and CSM)
CSM team receives credit
Other
Reects SaaS participants who recognize/pay for early renewals only

13
Sales Credit/Comp: Non-Recurring Revenue
Paid at lower rate than
licensed revenue
Paid at same rate as
licensed revenue
Paid at higher rate than
licensed revenue
Separate services quota retired
Commission isn’t paid
Other
0% 13% 25% 38% 50%
44%
24%
4%
4%
18%
6%
As SaaS companies continue to expand their product offerings, the
question of how to compensate non-recurring offerings such as
professional services, implementation fees.
Similar to renewals, non-recurring review is often paid at a lower
commission rate then recurring revenue.
Commission on Services Revenue
82%
of respondents recognize and incent
for non-recurring revenue, such as
services or implementation fees
14
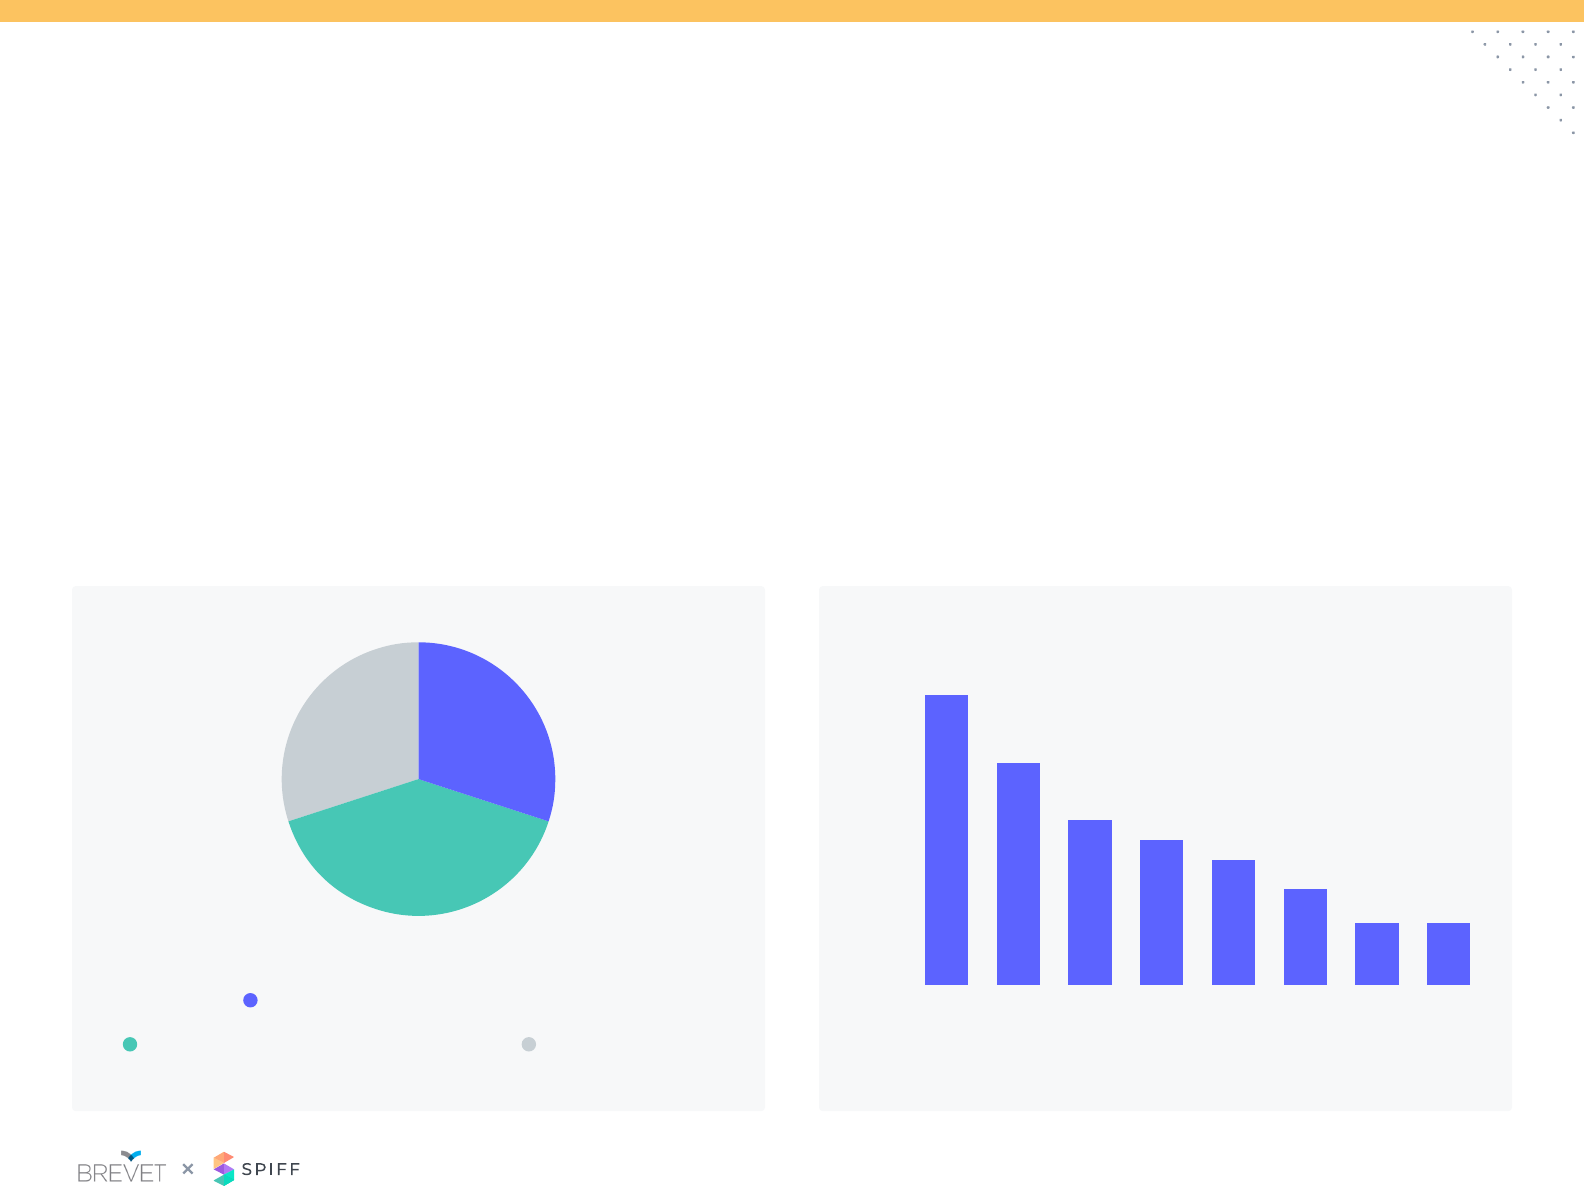
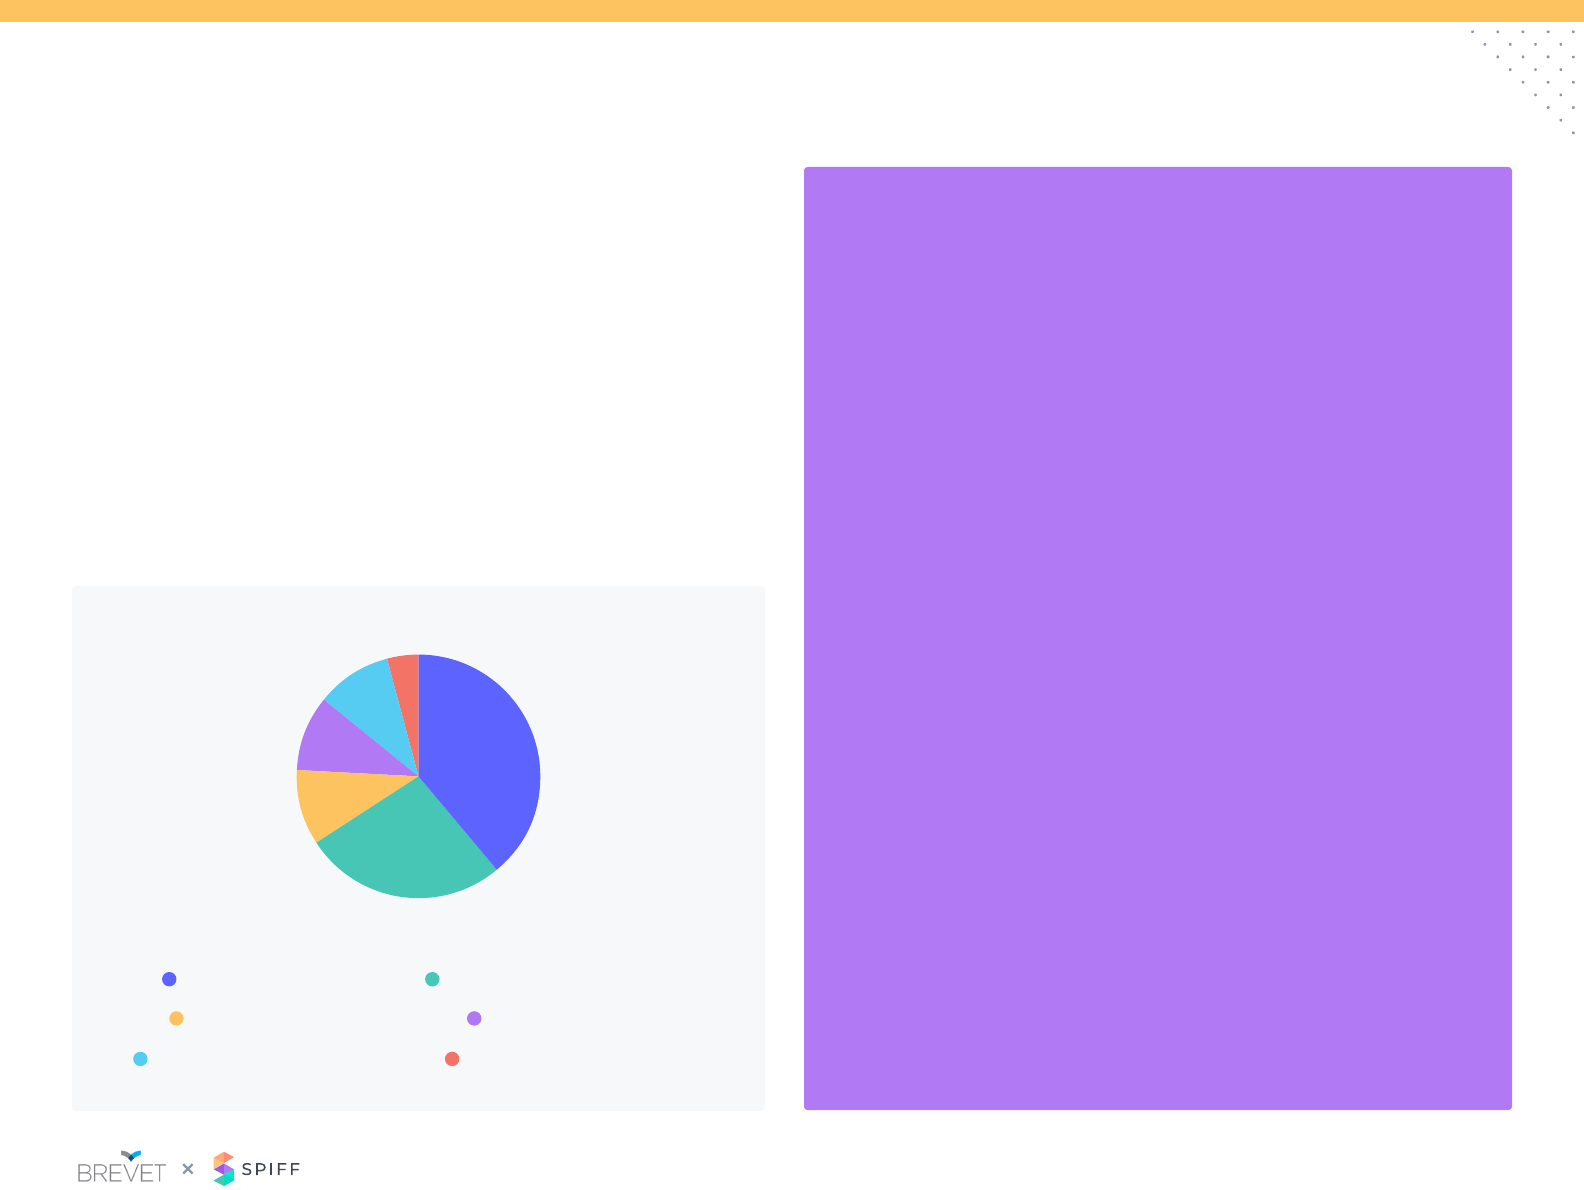
Sales Credit: New Logos
83%
31%
of respondents with >$100k ACV offer no
additional compensation for new logos
of respondents with <$25k ACV offer no
additional compensation for new logos
Almost 40% of Account Executives do not receive any additional
recognition for new customer logos (a $ of revenue is the same
regardless the type of customer).
New Logo Sales Credit
27%
39%
10%
10%
10%
4%
No additional recognition Separate new business quota
A multiplier is applied
Credit against a SPIFF program AE only focuses on new logos
A separate bonus is provided

15
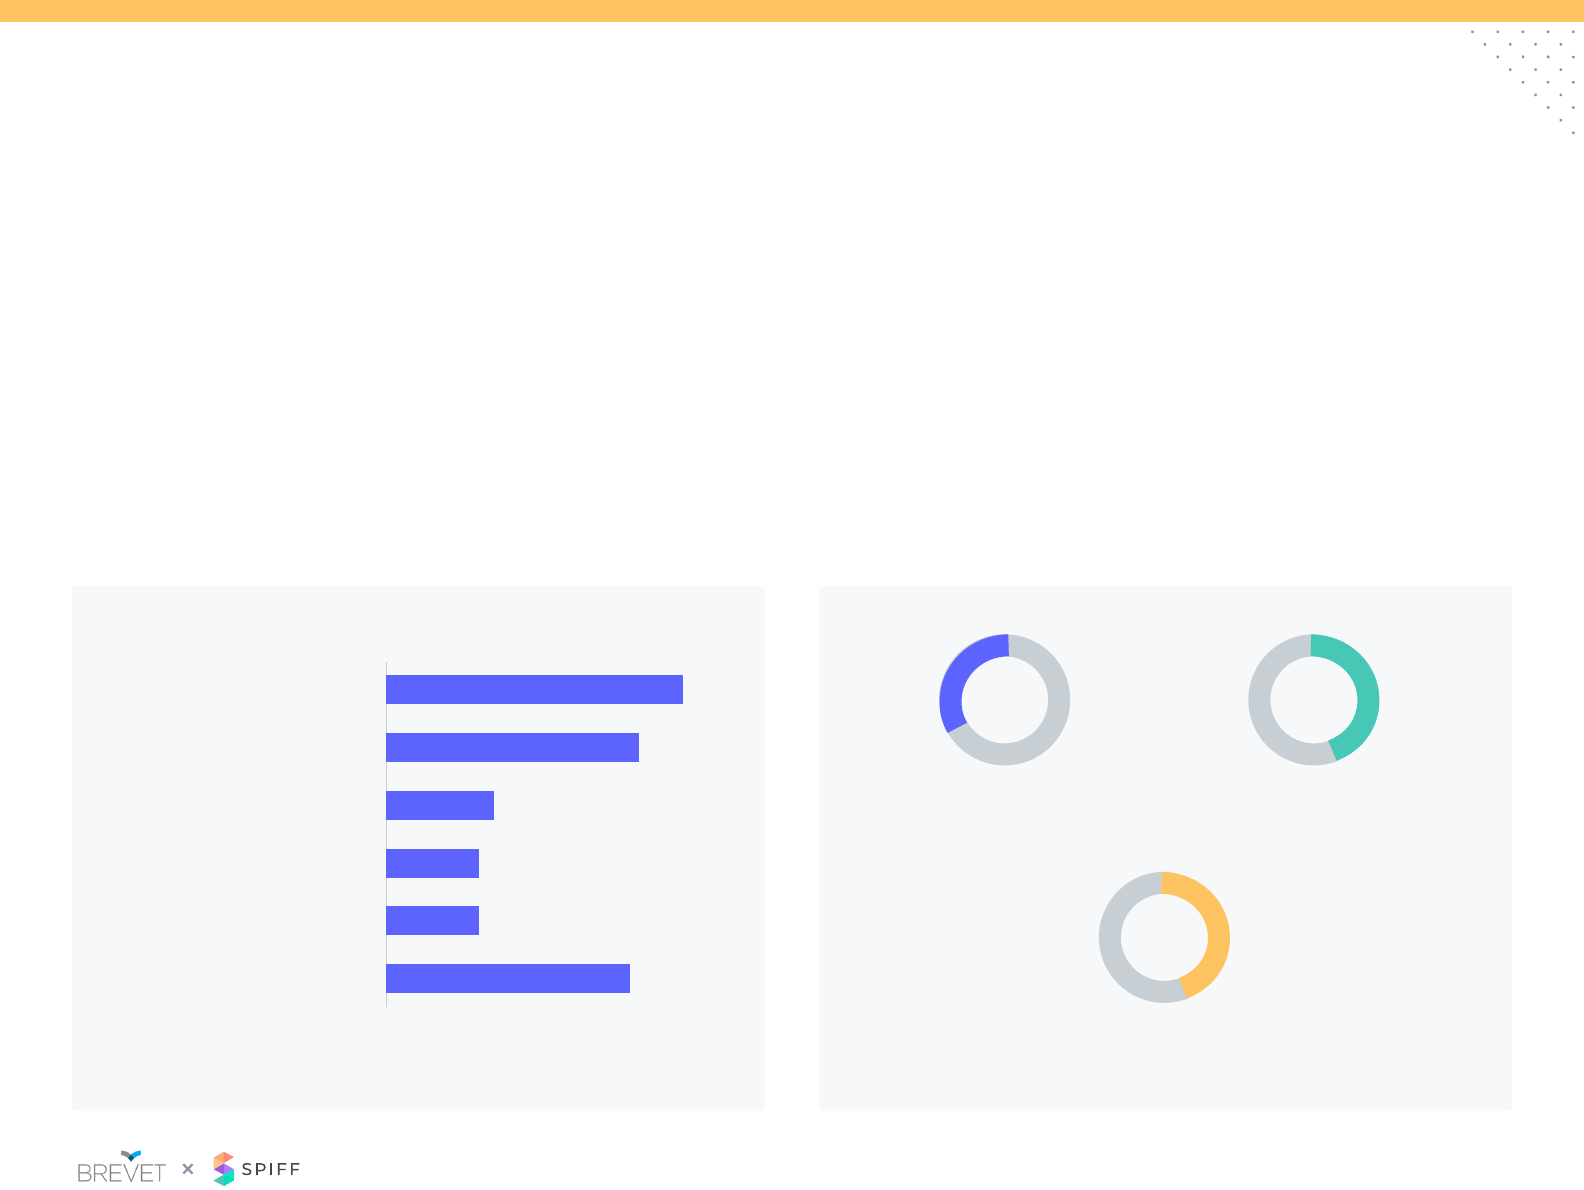
Sales Crediting: Tools
Excel and CRM easily
outpace any other workow tool
to capture sales crediting, likely due
to familiarity and legacy
of companies with a sales
force <200 use Excel or CRM to
administer sales crediting
75%
20%
10%
30%
40%
38%
32%
15%
11%
4%
Excel CRM Incentive
management
software
Payroll / HR
software
Other
0%
16
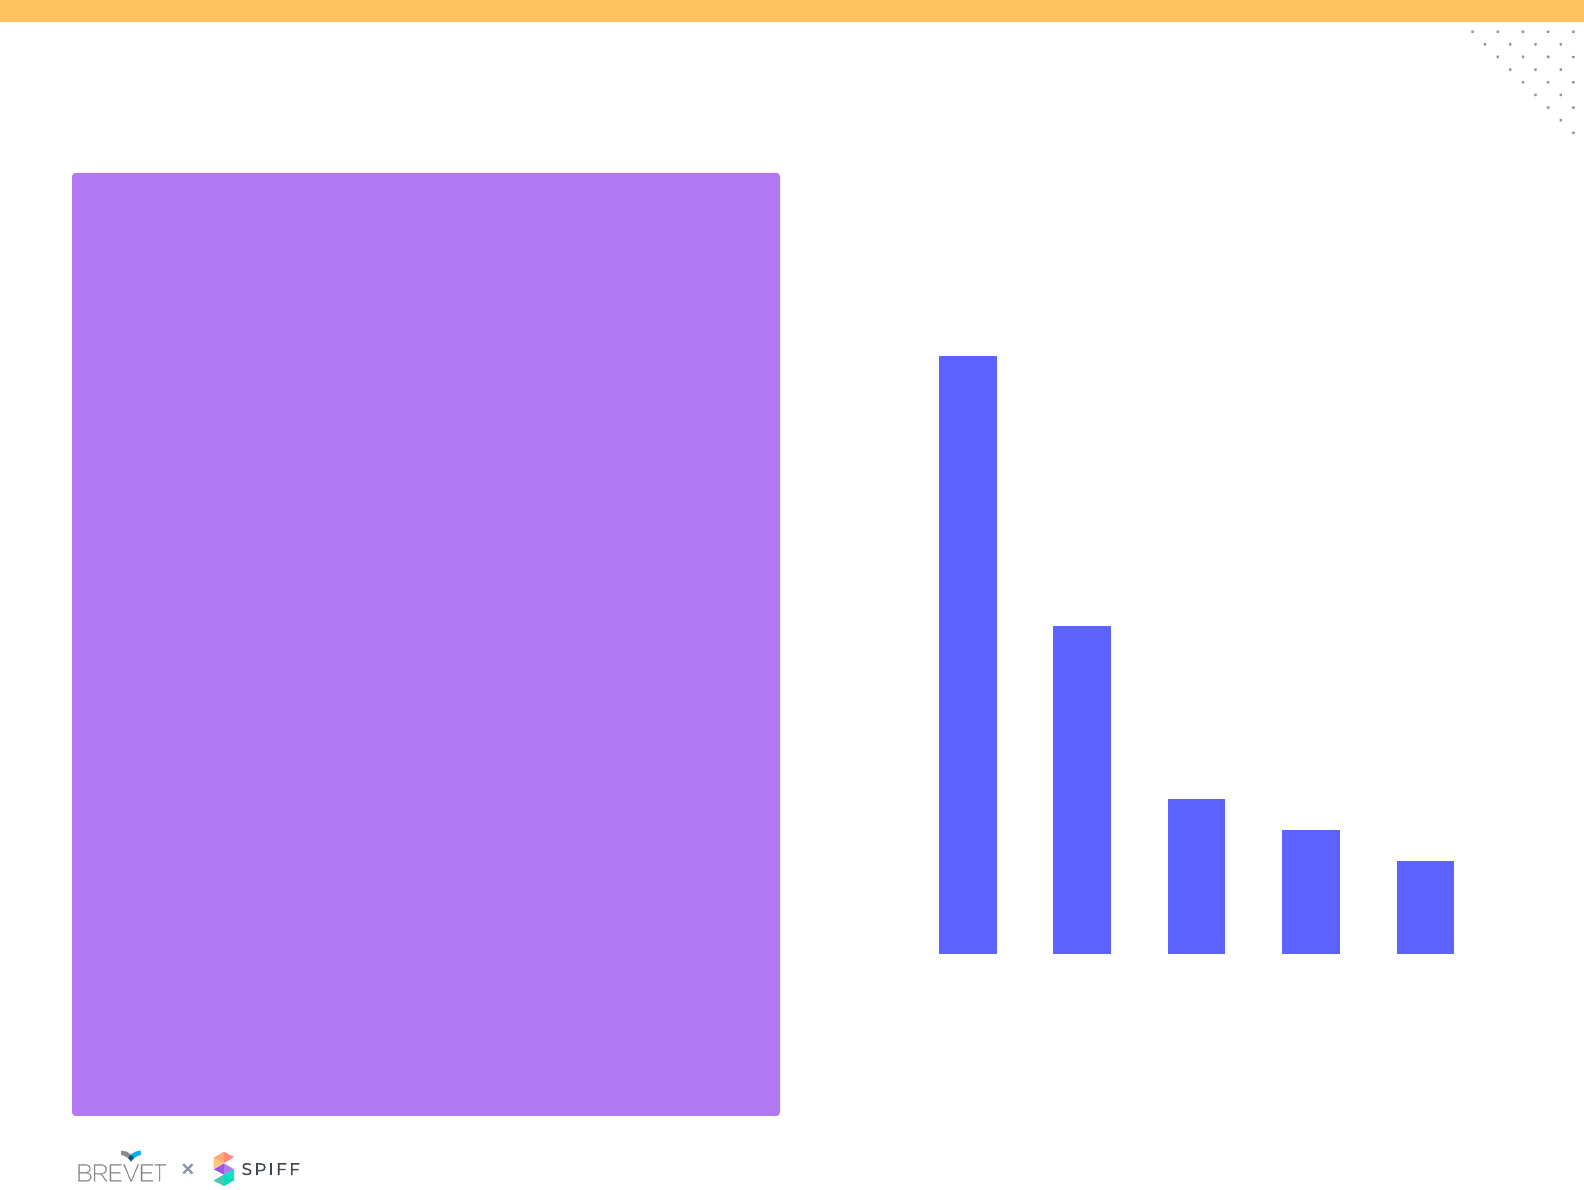
Policy: Mega Deals
The denition of Mega Deal varies from company to company.
Companies with >$50k ACV deals are signicantly more likely to have
an established Mega Deal policy. .
If you use specic criteria, what criteria makes a
Mega Deal?
How do you pay on Mega Deals?
Those companies with have dened criteria often consider a Mega
Deal as % of individual’s quota (i.e. 50+%) or a deal with a specic
dollar amount (>$500K ACV)
We do not have a policy for
Mega Deals (large deals)
Deals over certain % quota
Deals over certain $ value
Deals over certain % OTE
Other
Deals that drive certain
incentive value
Formulaic scale and/or
specic criteria
Management discretion
Relative contribution from
the broader sales team
(SDR, AE, SC, CSM)
0% 0%18% 10%35% 20%53% 30%70% 40%
68%
38%
25%
12%
12%
12%
19%
9%
4%
4%
17
Policy: New Hire Ramp
Lower quota expectations
Guarantee OTE for a period of time
Guarantee less than OTE for a period of time
Incentives for completing on-boarding activities
Best of guaranteed pay or actual earnings
Other
0% 13% 25%
New hire compensation adjustment
Quota adjustment period Compensation adjustment period
45%
32%
11%
5%
5%
3%
38% 50%
1-3 months <1 month 3-6 months 1-3 months
9-12 months 6-9 months Not applicable 9-12 months Not applicable
6-9 months 3-6 months
26%
3%
38%
38%
3%
3%
15%
44%
10%
5%
15%
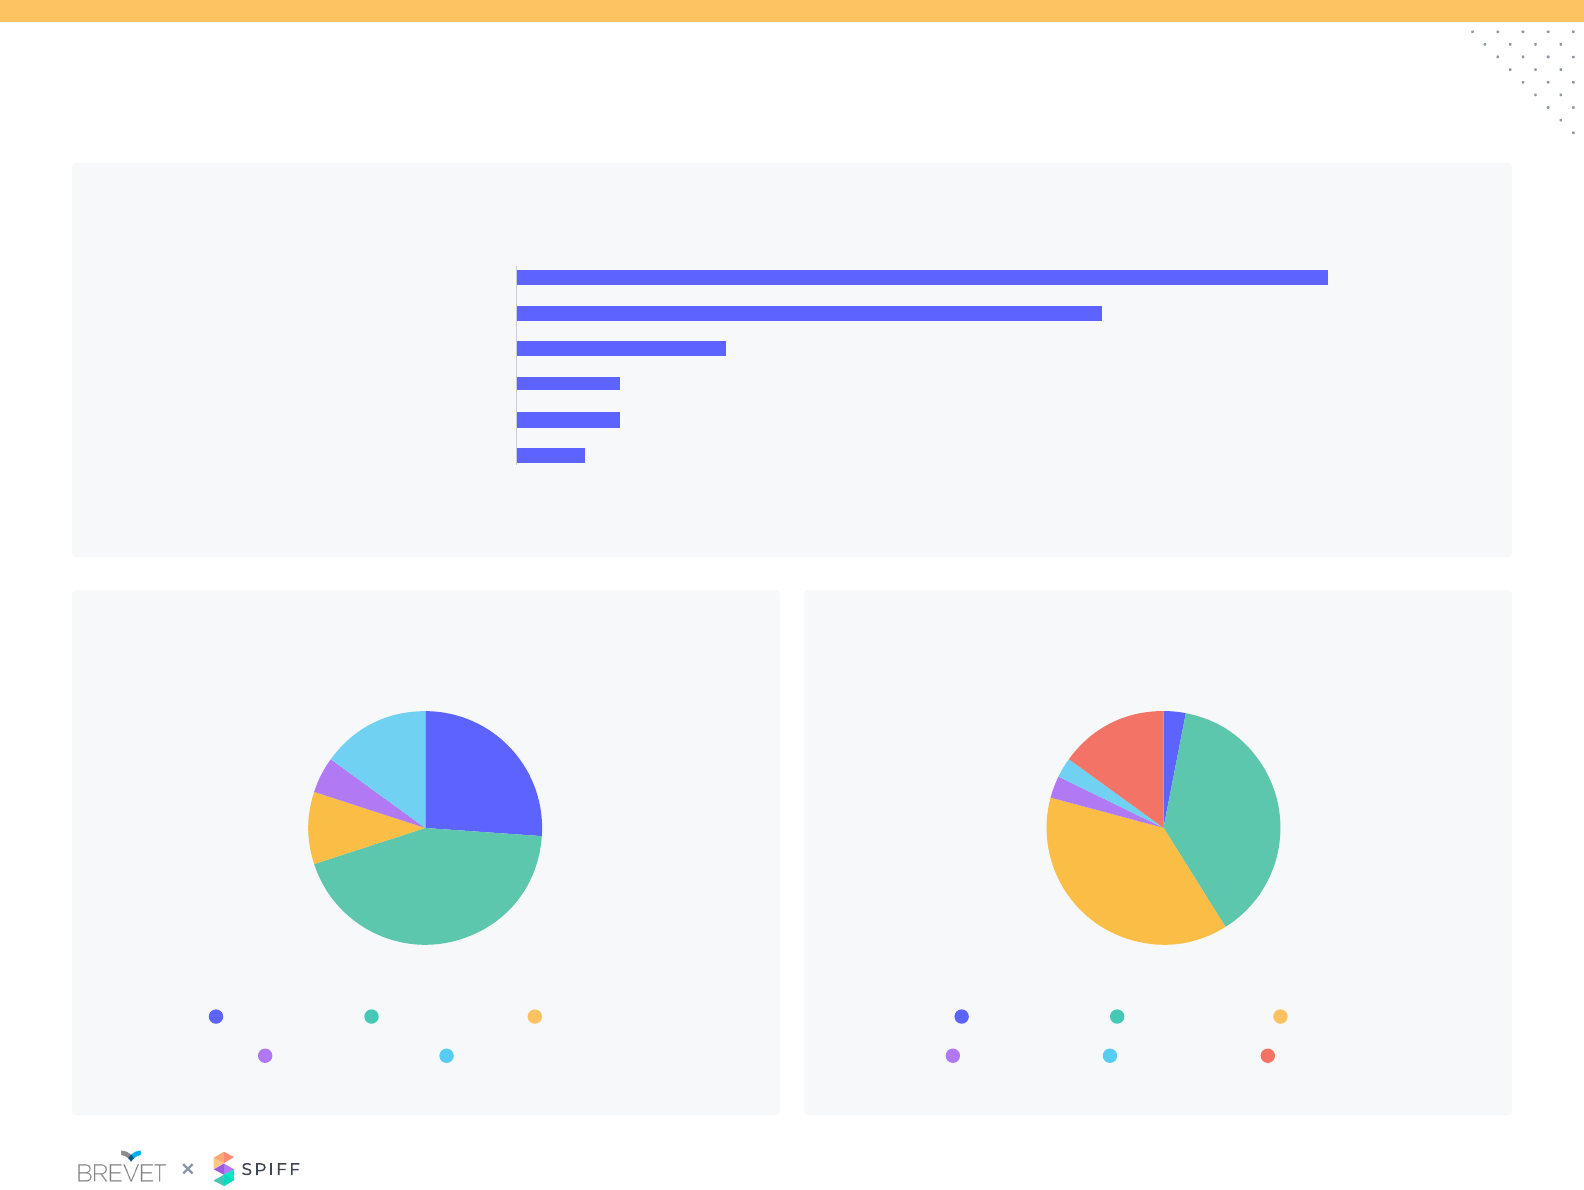
18
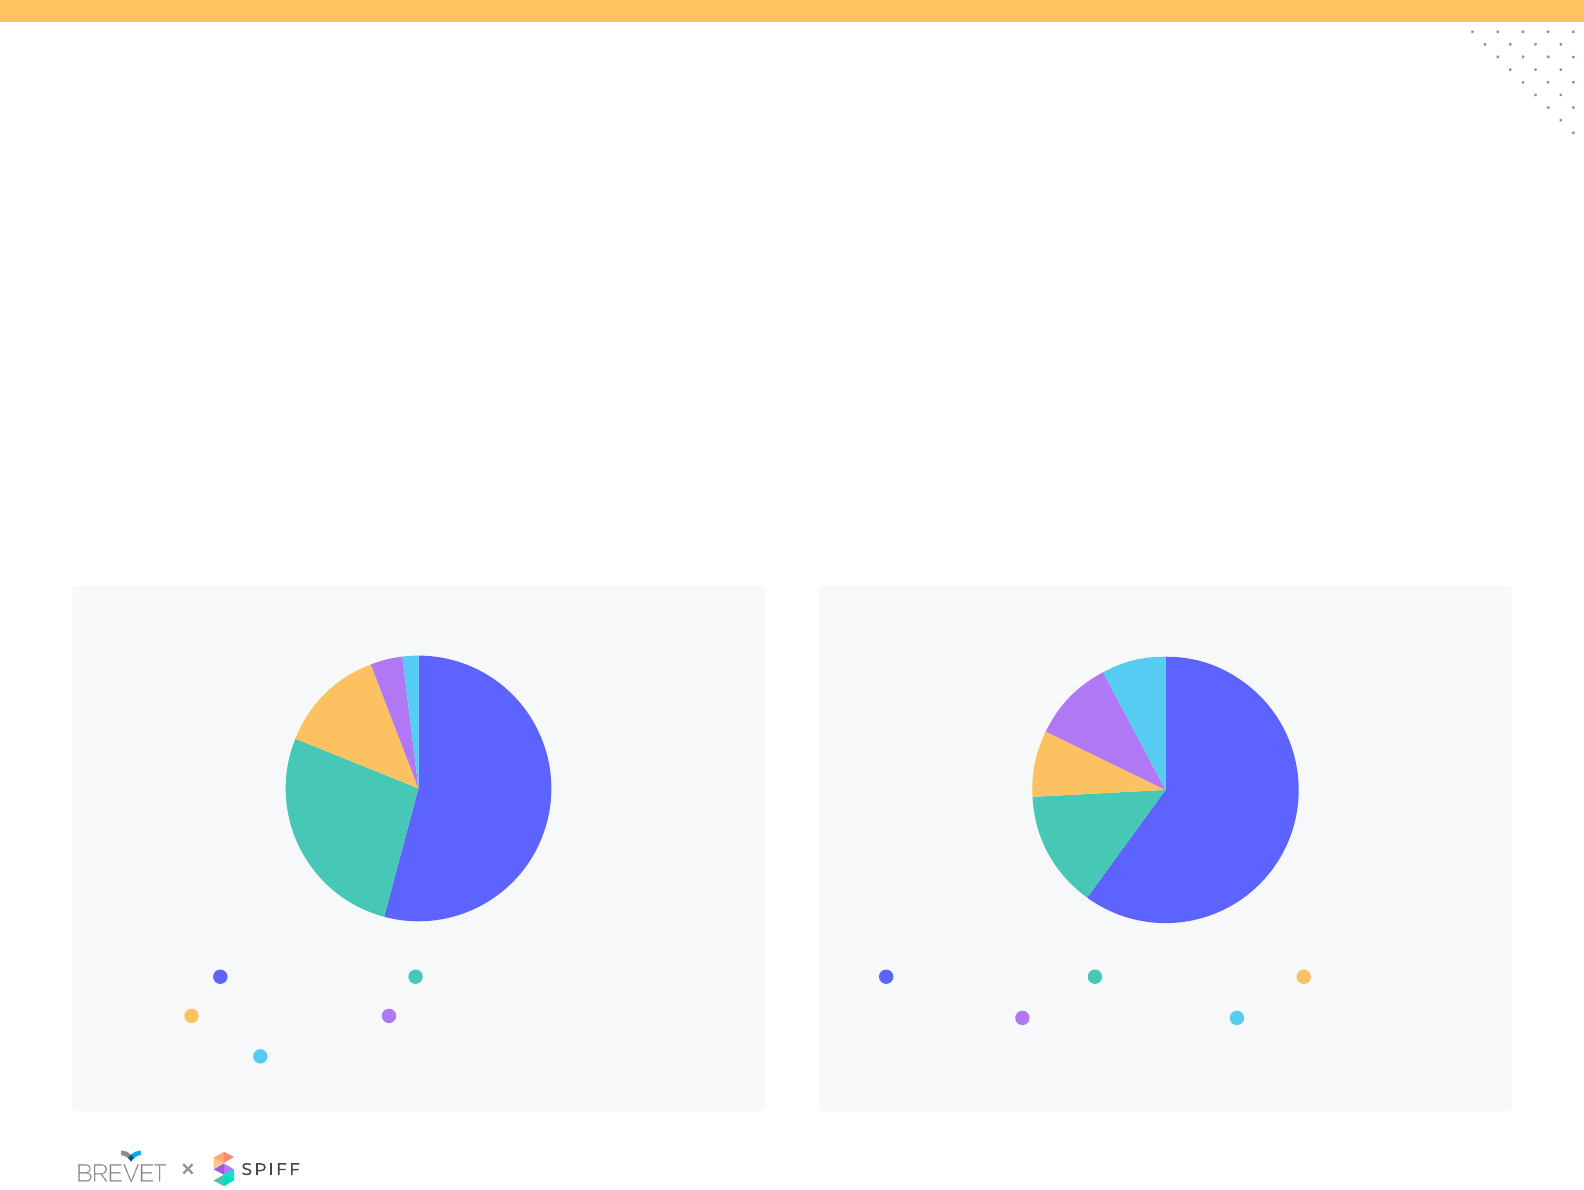
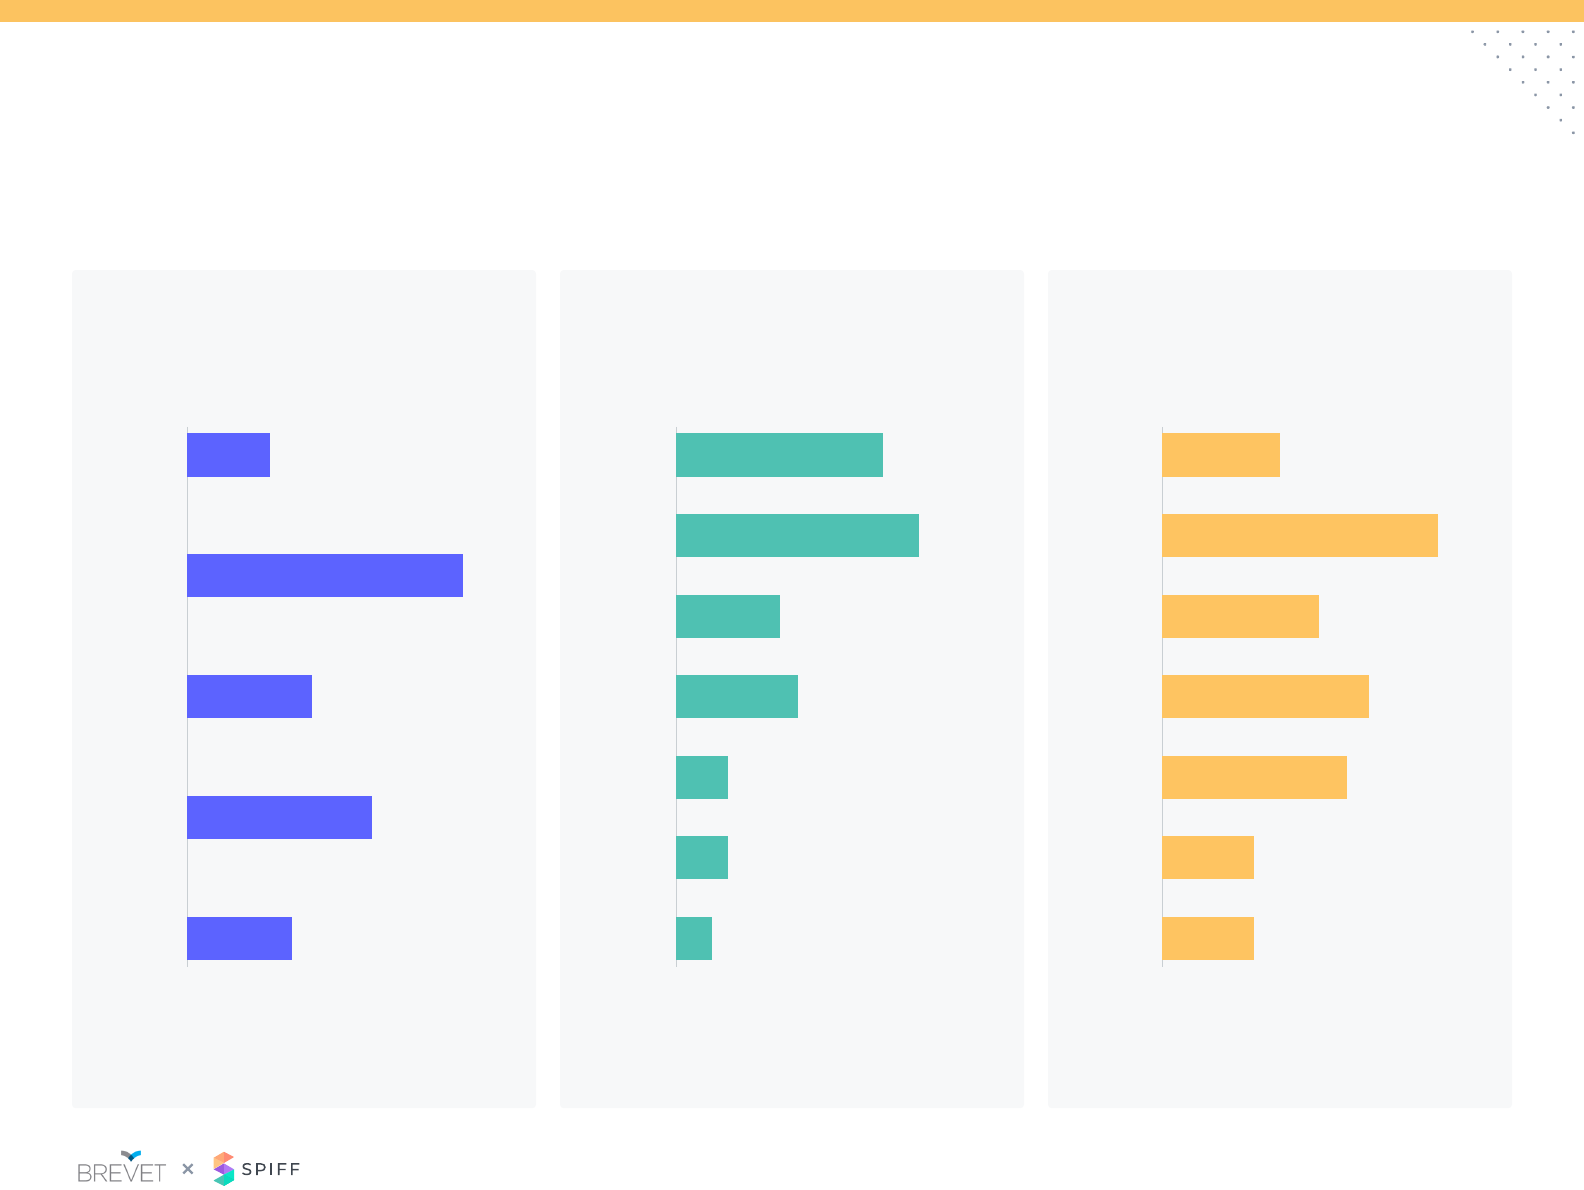
Participant Demographics
• Survey was conducted in December 2020 via online survey tool
• 93 participants from broad spectrum of companies
ACV Size of Sales Team Annual Revenue
<$5k <10 <$5M
$5-25k
11-50
$5-
20M
$25-50k 101-200
$50-
100M
51-100
$20-
50M
$50-100k
501-1,000
$250-
500M
201-500
$100-
250M
$100k+ 1,001+ $500M+
0% 0% 0%10% 10% 7%20% 20% 13%30% 30% 20%40% 40% 26%
8% 27% 11%
24%
14%
19%
16%
8%
8%
32%
11%
16%
5%
5%
3%
38%
14%
24%
16%

COVID has had a direct
impact on SaaS sales practices
The pandemic and the shift to virtual selling has highlighted so
many challenges for organizations and is forcing a reckoning. For
many teams, COVID has put a new spotlight on known, but long-
ignored gaps in their sales compensation.
SaaS companies are no longer waiting for their annual review to
tweak their compensation plans and policies. Questions continue
to arise about plan design, sales crediting, and quota setting.
The Brevet Group and SPIFF are having these conversations every
day within the industry and are here to help you design and
formalize your sales compensation plans and policies. We also
have a network of your counterparts, who are looking to share
ideas with you.
www.thebrevetgroup.com
Info@thebrevetgroup.com
If you’re inexible or
resistant to change,
2020 isn’t the year
for you.
Contact Us:
