
1
Animation Production Sustainability: A Case Study
FINAL REPORT
Prepared for:
Canadian Media Producers’ Association of British Columbia
Prepared by:
AnaLaura Giacomel and Melissa Felder
Earth Angel Sustainable Production Services LLC.
November 16
th
2023

2
Table of Contents
1
Table of Contents 2
Executive Summary 5
1. Introduction 12
1.1 The environmental impact of animation 12
1.2 Energy audits, waste audits, and the carbon footprint 14
1.3 Report Structure 15
2. Methodology 17
2.1 Waste and energy audits 17
2.2 Carbon footprint 18
2.3 Proposed sustainability action plan 20
3. Description of Operational Processes 21
3.1 AS animation production process 21
3.2 Building envelope and operational energy use 23
3.2.1 Building envelope 23
3.2.2 Operational energy 25
3.3 Waste production and management 31
3.3.1 Waste management 32
3.3.2 Kitchens and break rooms 34
3.3.3 Electronic waste 35
3.3.4 Material sourcing 36
3.4 Other areas of impact 36
4. Carbon footprint: Pulling it all together 38
4.1 Summary table of environmental impact 38
4.2 Building facility estimate 41
4.3 Data centre and supporting large equipment estimate 42
4.4 Remote work and supporting equipment estimate 43
3
4.5 Other areas of impact 44
5. Sustainability Best Practices for AS Studios 46
5.1 Proposed action plan for zero waste operations 46
5.1.1 Waste Management 46
5.1.2 Kitchens/Break Rooms 47
5.1.3 Material Sourcing 47
5.1.4 Other areas of impact 48
5.2 Proposed action plan for higher energy efficiency 49
5.2.1 Building envelope 49
5.2.2 Operational Energy 51
6. Conclusion & Next Steps 56
Appendix A: Data Collection Questions 58
Appendix B: Computer types for executive and administrative functions 63
Appendix C: Energy and Emission Factors 64
Appendix D: Approach, values, assumptions and limitations to the calculations 65
D.1 Building Facility Emissions Calculations 65
D.2 Computers/Data Centre Calculations (subset of D1 total emissions) 67
D.3 Remote Work Calculations 68
Appendix E: Certificates of Electronics Recycling 70
4
Acknowledgement
We are proud to have the opportunity to develop this sustainability case study of a Canadian
animation studio and to contribute to the advancement of industry learnings into environmental
impacts of animation. Earth Angel would like to extend its gratitude to the CMPA-BC, to Telefilm
Canada, and in particular, to the AS team who provided valuable insights and input into the
development of this project.
We hope this report will be useful to the Canadian animation industry and to driving deeper
conversations on how to strive towards making the animation industry greener.
Disclaimer
Any opinions, findings, conclusions, or recommendations expressed in this material are those of
the author(s) and do not necessarily reflect the views of Telefilm Canada or the Government of
Canada. The author(s) are not mandataries or representatives of Telefilm Canada or the
Government of Canada and Telefilm Canada and the Government of Canada are in no way
bound by the recommendations contained in this document.

5
Executive Summary
Animation is a historically under-studied genre of film and television production regarding
measurement and reduction of its environmental impact. The Canadian Media Producers
Association, British Columbia Branch (“CMPA-BC”), in partnership with a Vancouver-based
animation studio (“AS”), commissioned Earth Angel Sustainable Production Services (“EA) to
create a sustainability case study of a Canadian animation studio. The study was made possible
through the additional support of Telefilm Canada. The case study work was developed to
identify an animation studio’s environmental impacts, estimate its carbon emission footprint, and
recommend best practices to reduce environmental impact.
1
Supporting activity spanned Spring to Fall 2023 and involved the collection of primary and
secondary data on the studio’s operating practices, its energy consumption profile, and waste
management activity for the year 2022. Biweekly meetings were held with the AS executive and
team to gain understanding of the nature of the production process and aspects specific to the
AS facilities. Questionnaires focused on capturing the energy and waste footprint were prepared
and relevant information was collected from the AS team and facilities personnel. Two in-person
site visits were conducted to more closely examine waste and energy use practices at the AS.
Qualitative and quantitative data were then compiled to provide a profile of the AS waste and
energy footprint, followed by the calculation and analysis of the AS carbon footprint using
available numerical data coupled with commodity prices (ie. electricity, natural gas) and
emissions factors. The estimated carbon footprint for the AS case study is shared in Table ES.1
for a total of ~403 metric tonnes emitted in 2022.
2
As this footprint is specific to the AS reviewed
in this case study, it is most relevant to animation studios sharing similar characteristics such as
size of workforce, operating procedures, and geographic location.
3
1
One additional area of relevance for AS is the environmental impact associated with a hybrid working model, where employees
have the option to work from home and/or at the office. This is a growing practice for the company, and for the sector overall. Where
possible, efforts were made to capture the impact of the hybrid working model (i.e. such as the energy consumption associated with
working from home).
2
This estimate excludes the lifecycle analysis of the equipment used in animation, including its manufacture and the associated
resource and energy consumption. Along with the consumption of water and rare metals involved, almost 80% of the greenhouse
gas emissions emitted by digital equipment is in its manufacturing, even before its initial use. Also excluded from the analysis were
the downstream impacts from distribution, merchandising, and streaming which can be significant.
3
As geographic location will have bearing on the emissions impact associated with electricity consumption, due to the type of
regional electricity grid in play (e.g.if the grid has mostly hydropower or renewables, vs. being coal or fossil-fuel based).

6
Table ES.1 Carbon footprint
Category
Tonnes CO
2
emissions/yr
Office facility
Range of emissions, based on AS
as well as full building utility invoices
35 - 76
Utility invoice billed on square footage, not usage.Total facility
emissions (shared with eight other tenants) approximates 174
tonnes in 2022.
AS office facility estimate
56 tonnes/yr
Average of both estimates
Data Centre (included within building energy estimates above)
Racks
10
Racks are assumed to account for 90% of operational draw of
machines and rendering.
Scalar Tape Processing
0.1
One quantum unit.
Mechanical Cooling
23
Does not account for efficiency rating.
Data centre estimate (already
included as subset of facility
emissions above)
33 tonnes/yr*
*This estimate is embedded within the building energy / emission
value in this table and is included here to provide a directional
estimate of the energy draw/emissions impact from the data
centre. Note the value does not include estimates from
condensers or chilling units.
Remote workers
Equipment (PCs, monitors and zero
clients)
4
Approximating PCs for all offsite staff, two standard monitors,
and a subset of zero clients.
Electricity (space conditioning)
6
Assuming 80% of workers live in apartments and the remainder
in single family dwellings, given the majority of the AS employee
base is under 30.
Natural gas (space conditioning)
258
Assuming 50% of offsite workers heat their homes with natural
gas (average profile for consumption in B.C. is 50% heating with
natural gas).
Remote workers
268 tonnes/yr
Not accounting for broadband or data transfer. Accounting for
home office space conditioning (by assuming 30% of estimated
electricity and natural gas typically used within residences).
Other areas of impact
Personal vehicles
3
The albert carbon calculator was used to calculate a best
estimate of emissions stemming from transportation methods by
staff commutes to the office and from shipping of electronic
equipment purchases.
Public transit
2
Air travel
46 - 96
Lower range tabulated through EA using albert calculator, upper
range applied from a third party company (Corporate Traveller).
Business class (proportion of
emissions
85 to 90%
Of air travel emissions. Range reflects the approach cited above.
AS air travel estimate
71
Average applied for total
Couriers
3
Using list of purchases with associated distributor and weight of
freight. Shipment distances were calculated using the
distributor’s final distribution center. Where this information was
not available, a best estimate of shipment origin was utilized.

7
Cloud storage
0.5
Used generally across the organization, for general
administrative and office functions (e.g. email). Estimated
emissions generated from third party provider.
Other areas of impact
79 tonnes/yr
Total estimated emissions
403 tonnes/yr
Per user emissions (all)
0.7 tonnes/year
On the whole, the AS studio exhibits best in class practice in many areas, including building
energy efficiency, appliance upgrades, lighting (and in particular daylighting), comprehensive
waste management practice, and end-of-life material management.
Due to the remote nature of AS’s workforce activity, the footprint is estimated to skew most
heavily to remote worker’s use of fossil-fuelled resources in space conditioning, and in particular
the use of natural gas for heating residential office space.
4
Remote work activity is estimated to
make up 65% of the total footprint estimated, suggesting that, for companies with a large remote
workforce, initiatives focused on addressing energy efficiency in the home office environment
may be of value to explore. Other areas of impact include air travel, at approximately 20% of
total emissions. Reducing air travel and shifting to economy flights offer potential to significantly
address this emissions stream. Lastly, and although carbon emission estimates for the data
centre are rudimentary, the current data centre still has an estimated material impact on overall
facility emissions. This is likely partially attributable to the nature of its current cooling system,
which is affected by the age and size of the current AS data centre facility.
5
This finding
supports the greater use of purpose-built data centres, and in particular innovations that can
repurpose waste heat for other applications.
The work and analysis to date suggests that activity in the following areas are most pertinent to
AS (Table ES.2), as well as other leading edge studios in the animation area that share similar
characteristics to the AS case study undertaken. Further sector-based work in this area would
benefit from extending the environmental impact evaluation to additional animation studio types,
sizes and locations. This would better capture a range of potential impacts based on different
studio sizes, practices, and operating jurisdictions, and in so doing, help inform deeper
4
We note that this impact would be likely offset by the minimal travel undertaken by employees currently, compared to pre-
pandemic commuting activity. Understanding of the pre-pandemic baseline would be needed to estimate the nature and direction of
this offset.
5
The specific consumption associated with outdoor condensers and chillers was not calculated.

8
understanding of the environmental impact of this sector in Canada as well as opportunities to
help mitigate such impacts. Such action can ultimately help inform broader and cross-cutting
partnerships and initiatives to support Canadian animation companies in optimizing their
environmental performance, and in minimizing the climate impacts of animation production.
Table ES.2 Best practice checklist
Waste Management
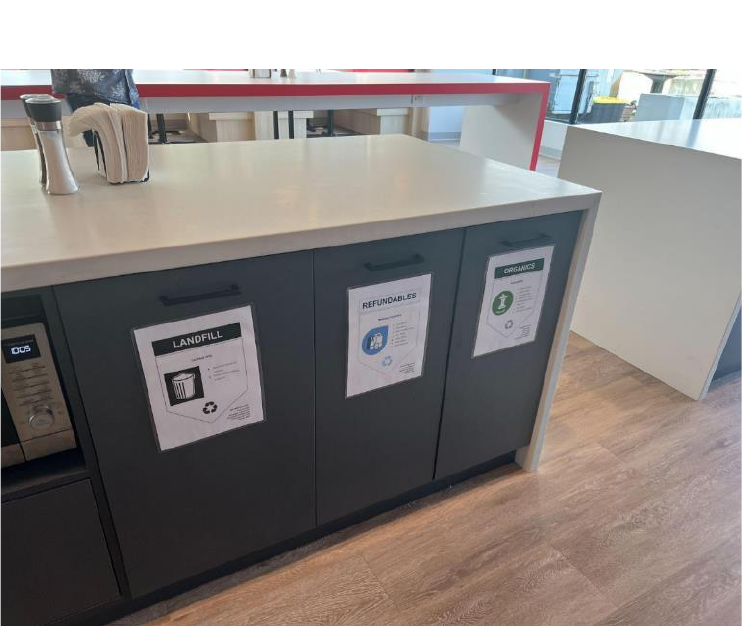
● Continue to execute a comprehensive waste management system, where all waste
stations are equipped with a bin for every waste stream: mixed recycling, refundables,
organics, and landfill, ensuring maximum waste diversion from landfill.
● Continue to ensure all bins have appropriate signage denoting proper item disposal.
Avoid using common recycling symbols on signage for organics and waste destined
for landfill, as this may lead to confusion.
● Set all printers to duplex printing to reduce paper consumption.
● To further reduce paper waste, offer a scrap paper bin for single-sided pages that can
be used for reprinting or used for note taking.
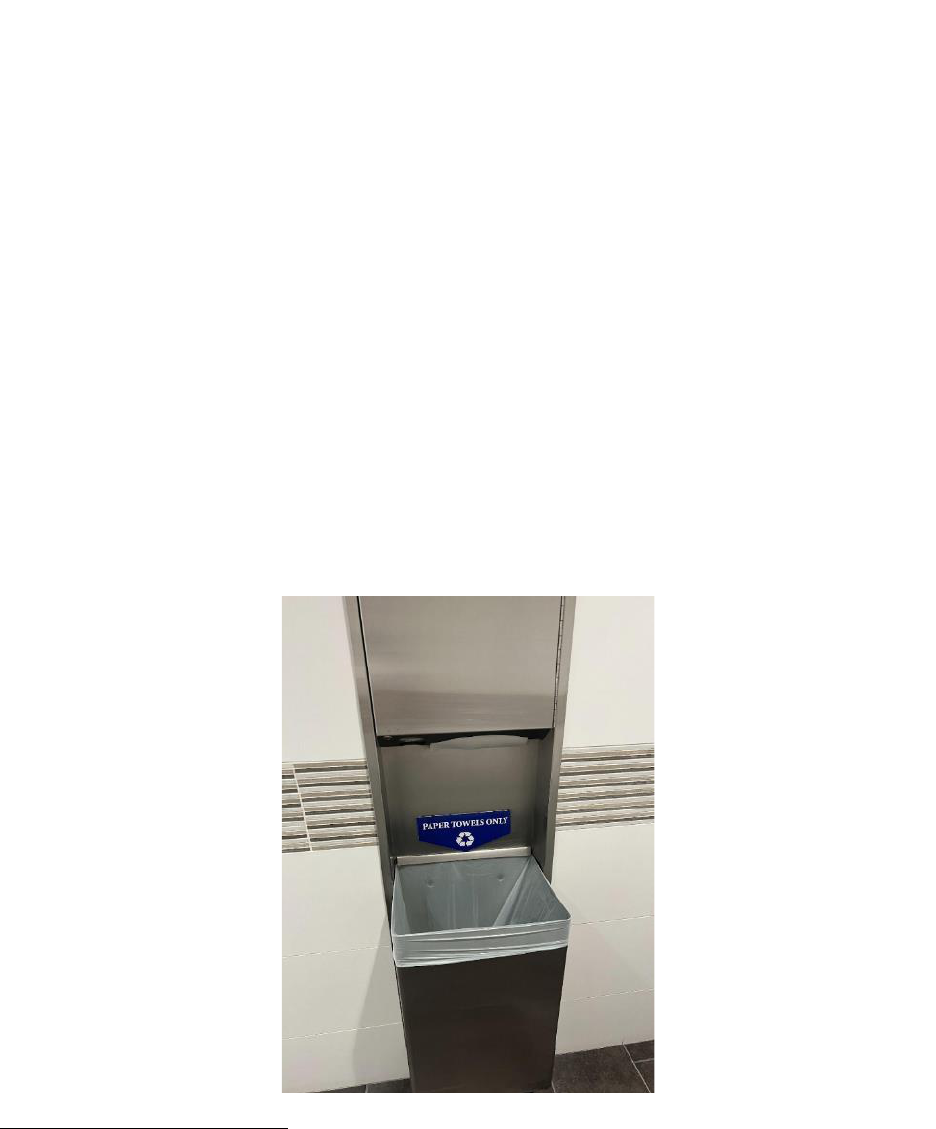
● Paper towels used in the bathrooms should be destined for organics disposal,
equipped with signage denoting as such.
● Continue to pursue circular strategies in reducing electronic waste by donating and
recycling spent electronic items.
Kitchens/Break Rooms
● Encourage the use of reusable mugs by removing disposable cups.
● Offer fair trade and ethically sourced loose leaf teas to reduce waste from individually
wrapped teas.
● When ordering catering for the offices, opt for vegetarian and vegan meals that are
made with locally sourced and in-season ingredients.
● Donate leftover food items to local charity organizations to reduce food waste and to
contribute to and strengthen the local community.
● Eradicate single-use plastics from catering offerings.

9
Material Sourcing
● When purchasing reams of paper for the office, choose reams containing 100%
recycled and/or post-consumer fiber material only and have Forest Stewardship
Council (FSC) certification to ensure the product was sourced sustainably.
● Source 100% recycled material for paper towel and toilet paper to lower the demand
for virgin paper material. Bamboo is another tree-free sustainable source for these
products.
● Purchase cleaning supplies with the EcoLogo, Green Seal, or equivalent certification.
These certifications ensure that products use safer chemicals, have environmentally
preferable packaging, and adhere to environmental standards from manufacturing
through to disposal.
Employee Travel
● Reduce air travel by prioritizing virtual meetings where possible, as air travel is
currently estimated to be a key contributor to the estimated carbon footprint of
animation. Opt for Economy flights over Business and First Class and limit layovers to
avoid multiple take-offs and landings to lessen overall impact from corporate travel.
● When choosing airlines, elect those that are low emission and participate in carbon
offset programs.
● Encourage employees to use public transit, carpools, and rideshares in electric, hybrid,
or other fuel efficient vehicles to reduce emissions from employee commutes.
● Consider the purchase of carbon offsets from reputable third parties associated with
travel providers.
Education and Crew Engagement
● Encourage staff to attend free training provided by Reel Green
TM
on Sustainable
Production.
● Encourage internal communications on sustainability. Routine memos on the benefits
of pursuing sustainable practices in respect to energy conservation and waste
reduction, alongside green messaging on email signatures, can be a method of
stimulating dialogue on individual and collective actions.
Sustainability on Screen
● Encourage opportunities to incorporate sustainability into the script or depicted on
screen through character actions or items.

10
Building Envelope
● For the existing facility and in the near term, it is recommended that the majority of
appliances be unplugged to prevent standby energy wastage.
● Shut down and unplug office lighting and other equipment, where possible,
understanding that this may not be possible for equipment sending materials to be
rendered.
● The use of the dishwasher should be limited to once a day to reduce energy
consumption.
● Consider purchasing renewable energy certificates from a 100% renewable energy
supplier to offset any facility-based fossil-fuel based consumption. These certificates
can be purchased to “cover” part or all of the electricity consumption used, as well as
the natural gas consumed.
● In the longer term, and when sourcing the next facility location, consider buildings
that are LEEDⓇ, BOMA BESTⓇ, or equivalently-certified, to help ensure the building
produces lower carbon emissions, conserves resources, and reduces operating costs
compared to alternatives.
● Sourcing a smaller office, suitable for the decreased volume of staff commuting to the
office, will also reduce cooling and heating needs.
● Consider installation of programmable thermostats and lighting automation, adjusting
the turning on and off of heating and air conditioning to a pre-set schedule. This can
generate cost savings and reduce energy consumption of a building.
● Continue to source space that gives the ability to use and prioritize natural light. LEDS
are the preferred lighting system, providing a significant reduction in energy
consumption as well as operating costs. Continue to utilize lighting occupancy timers..
● When purchasing new office equipment, including computers and printers, continue to
source those that are ENERGY STAR
TM
qualified.
● Install low-flow toilets to conserve water.
Computers and Hardware
● When sourcing new equipment, transition to more energy efficient products that will
significantly reduce overall energy consumption. There may be higher upfront costs
associated with these items but will lead to considerable savings over their lifetime,
through reduced energy consumption and lower cooling costs.
● Source electronics from companies that integrate sustainability into their supply
chains, ensuring reduced climate impact and sustainable and ethical manufacturing
and sourcing of materials in their products, including using recycled materials.

11
● Prioritize items that are designed for longevity, reuse, recyclability, and repair, and that
have reduced and/or recyclable packaging.
● Opt for locally sourced electronic items to reduce emissions associated with the
transport of goods.
Data Centre
● There is great potential for the capture and reuse of waste heat from data centres. In
the near term, consider further optimizing the use of energy in building, in particular
through the expanded use of waste heat from server rooms.
● Consider purchasing renewable energy credits to “offset” the amount of energy being
currently consumed by the data centre, as initially estimated in the AS carbon footprint.
● In the longer term and in relocating the data centre, consider facilities that use
alternative and employ more efficient options to utilize the waste thermal energy
generated, and/or that are willing to work in partnership to develop opportunities in this
area.
● Consider working with a data centre that is powered by renewable energy and/or has
an emission offset program in place (such as through the purchase of renewable offset
credits).
Storage/Archiving
● Develop data life cycle policies that filter out data that is no longer required.
● Establish a plan for length of storage. Create a policy for internal teams, clients, and
other stakeholders for active, near-term, and long-term storage.
● Perform routine audits and purges of cloud storage uses, moving inactive data to
Linear Tape-Open (LTO) for longtime storage.
Remote Work
● Renewable energy offsets can be purchased to displace the estimated electricity and
natural gas consumed by the remote workforce.
● Given the estimated impact associated with space conditioning of the remote office,
consider developing novel initiatives to support workers in reducing their home office
electric and heating consumption and utility bills. These areas could be developed as
cost-sharing opportunities and/or could be developed in partnership with other entities,
including the regional municipality, and leverage existing utility energy-efficiency
initiatives.

12
1. Introduction
Animation is a historically under-studied genre of film and television production when it comes to
the measurement and reduction of its environmental impact. To help address and further inform
this gap, the Canadian Media Producers Association, British Columbia Branch (“CMPA-BC”),
partnered with an animation studio, commissioned Earth Angel Sustainable Production Services
(“EA”) to create a sustainability case study of a Canadian animation studio. The animation
studio, remaining anonymous, will be referred to as Animation Studio (“AS”).
Initiated in Spring 2023 and running through to Fall 2023, the project objectives are to (1)
assess an animation studio's environmental impacts and carbon operational footprint; and, (2)
identify current and potential best practices to reduce environmental impact.
6
The content of the
report provides an overview of the nature and impact of AS’s operational energy use and on-site
waste streams, based on two site visits to the AS main facility, ongoing consultation with the AS
team, and supporting secondary research and analysis. Research into and the collection of data
on annual energy use is extrapolated to generate an initial estimated carbon footprint.
1.1 The environmental impact of animation
The environmental impact of animation is not always naturally self-evident, however the
transition of the industry from traditional animation techniques (pencil, paper, storyboarding) to
more computer-based production has signified a large shift in how animation productions are
made, and in particular, the use of energy associated with production. Heavy rendering times,
7
air conditioning loads for cooling equipment, and much more now go into making an animated
feature, episodic production, or theatrical release. All-digital productions that employ Computer-
Generated Imagery (CGI), can involve the use of hundreds of desktop computers and monitors,
each with their own operating power draw, and render farms with thousands of servers.
6
One additional area of relevance for AS is the environmental impact associated with a hybrid working model, where employees
have the option to work from home and/or at the office. This is a growing practice for the company, and for the sector overall. Where
possible, efforts will be made to capture the impact of the hybrid working model (i.e. such as the energy consumption associated
with working from home).
7
Rendering or image synthesis is the process of generating a photorealistic or non-photorealistic image from a 2D or 3D model by
means of a computer program.

13
According to BAFTA (2016), the average animation production produces around 5.5 tonnes of
carbon dioxide emissions per hour,
8
and approximately 84% of these emissions are associated
with the energy consumption from the production office or working from home.
9
Assuming a 90-minute animated film has a total of 130,000 “frames”
10
and that each frame
takes three hours to render,
11
the rendering practice alone can consume ~100,000 kilowatt-
hours (kWh) of electricity, which equates to an approximate greenhouse gas footprint of 110
tonnes.
12
,
13
Such impacts can multiply exponentially if the final product is an animated television
series that spans several seasons (which implies many million frames), as well as the
generation of significant waste heat.
14
In most data centers today, cooling accounts for greater
than 40 percent of electricity usage.
15
,
16
It has been determined that three percent of the world’s
electricity is used to power these data centers, amounting to one percent of global greenhouse
gas emissions.
17
Note: The work and focus of this effort is on capturing on-site operational impacts from our case study
(and focused on the principle facility location); however it is important to note that there are significant
upstream and downstream impacts associated with the manufacturing, transportation, and use of
products used in modern animation, along with the downstream impacts from streaming. Computers for
example, have significant upstream impacts, such as the mining of lithium, cobalt, and rare-earth
8
Documented by Kajawood and based on data from BAFTA, per https://www.kajawood.com/green-post-production-solutions-are-
a-hot-topic/. BAFTA’s 2019 estimates for a “regular” production are 4.4 tonnes/hour, per: https://wearealbert.org/2021/09/09/our-
2020-21-annual-review-is-out/
9
Other key emitters are from filming spaces, transport, and post-production, which emit a proportion of 6%, 6% and 3% of an
animation’s productions respectively, per interview with albert, 2023.
10
Where a frame is a single image in an animation sequence.
11
With 270W equipment.
12
Documented by Kajawood and based on data from BAFTA, Toy Story, and WIRED. Per: https://www.kajawood.com/green-post-
production-solutions-are-a-hot-topic/
13
Greenhouse gas calculation by Earth Angel. The greenhouse gas intensity of Canada's electricity grid was 110 grams of carbon-
dioxide equivalent (CO
2
e) per kilowatt-hour in 2020. Greenhouse gas intensity sourced from: https://www.cer-rec.gc.ca/en/data-
analysis/energy-markets/provincial-territorial-energy-profiles/provincial-territorial-energy-profiles-canada.html
14
The waste heat also associated could provide hot water for up to 20,000 homes for a day.
15
Per: https://thereader.mitpress.mit.edu/the-staggering-ecological-impacts-of-computation-and-the-cloud/
16
The intensity and time associated with rendering can also vary greatly. Wired magazine has reported that Toy Story 3, for
example, took an average of seven hours to render per frame, while some frames in that film took more than 30 hours to render. On
the other hand, the rendering of the most complex single frame in Toy Story 4 took more than 1,200 hours. Per:
https://www.kajawood.com/green-post-production-solutions-are-a-hot-topic/
17
Harvey, Victoria, 2021. Decarbonising The Digital Journey. Per:
https://drive.google.com/file/d/1sD_jPmg3Zz_xgRHaKeU7rJaiOljduim6/view

14
elements. The short lifespan of typical desktop computers generates massive electronic waste and
environmental contamination from heavy metals.
18
1.2 Energy audits, waste audits, and the carbon footprint
Fuel and energy consumption are typically among the largest environmental impact streams
associated with film and television productions.
19
Animation is no exception, as every stage of
the production process can have a substantial energy footprint associated. Data from energy
audits can help inform how an animation company’s operational practices affect these impact
areas.
The film and television industry has also historically shown to produce great volumes of waste
from pre-production through the shooting schedule. An average feature production can produce
up to 692,893 pounds of overall waste!
20
In this regard, animation is unlike conventional
production, in that much of the production has moved to the digital landscape. However,
including a waste audit is important in understanding an animation studio’s operational waste.
In this particular instance, we are interested in applying energy consumption data to estimate
AS’s operating carbon footprint from energy use in its Vancouver headquarters for the year
2022. This requires the added calculation of the greenhouse gas emissions - or the carbon
dioxide-equivalent - associated with AS’s energy consumption. The carbon footprint is thus the
result of combining energy audit data with energy emission factors particular to the jurisdiction
of interest.
21
18
University of Oxford (2022). The Environmental impact of IT: desktops, laptops and screens. Per:
https://www.it.ox.ac.uk/article/environment-and-it
19
Sustainable Production Alliance White Paper (2021). Carbon Emissions of Film and Television Production. Per:
https://greenproductionguide.com/wp-content/uploads/2021/04/SPA-Carbon-Emissions-Report.pdf
20
Data gathered from Earth Angel productions.
21
Energy emission factors will therefore need to account for the nature of the regional electricity grid and heating (often met largely
by natural gas, but also heating), and any fuels used in transport (typically gasoline and diesel with minor amounts of renewable
fuels). We note here that the jurisdiction in question has a cleaner electricity grid than many other regions with a high amount of
renewable generation.

15
A carbon footprint from waste production at the AS facility is not estimated as historical waste
diversion reporting is not previously recorded.
22
In capturing other areas of operation into the
cumulative carbon footprint, transportation from staff commutes to the office, couriers from
purchases of electronic equipment, and air travel are included.
Estimating the carbon footprint can help assess the cumulative impacts of operations, identify
potential areas of improvement, and also creates a baseline from which future improvements
can be measured (i.e. documenting the business-as-usual carbon baseline).
Energy audits can be performed on a facility or building level (e.g., building envelope, HVAC, lighting
performance), as well as on the operating level (e.g., energy efficiency of software, hardware, etc.).
Information collected from an energy audit can help identify and evaluate facility energy efficiency
practices, ensure that best-in-class operating strategies are maintained, and also inform potential
opportunities for next steps.
Waste audits can help provide insights into a company's waste footprint by volume and waste stream
(e.g., recycling, compost, electronic or e-waste, etc). These assessments can help identify gaps in
downstream management and disposal practices, as well as opportunities for upstream waste
reduction strategies. Waste audit information and follow-on analysis can ultimately help company’s
reduce waste, evaluate vendor procurement and supply chain processes, and inform the design of a
zero-waste program.
Both energy and waste audits can significantly differ in their scope and level of granularity depending
on the objective or the information to be collected (for example, whether an energy audit is intended to
help evaluate and plan a large-scale and capital-intensive building retrofit, vs. assessing opportunities
for changing occupancy behaviour, among many other possible objectives).
1.3 Report Structure
The report herein provides the approach to and results from research into characterizing the
environmental impacts of AS’s main studio. Section 2 outlines the methods employed to audit
AS’s energy consumption and waste production. Section 3 introduces AS’s animation process,
22
Historical waste diversion reports were not collected by AS. Additionally, all building tenants dispose of their waste using the
same facility bins and waste is collected cumulatively, preventing waste differentiation by building tenant.
16
followed by a description of facility and operational energy consumption, as well as an
assessment of current waste production and management practices. Section 4 assesses the
environmental impacts of an animation studio, attributing regional emissions factors to the
operational energy and fuel consumption to produce an approximate estimate of a carbon
footprint. Section 5 provides a guideline for best practices for zero waste operations and high
energy efficiency.

17
2. Methodology
The project research approach is categorized by the following areas of work:
1. Audits: Data collection on AS’s principal energy and waste streams.
2. Baseline carbon footprint assessment: Analysis and summary of the primary
environmental impact of animation production, based on energy use.
3. Proposed sustainability action plan: Assessment of opportunities for continued and
new sustainability activity.
The supporting approach is further described in the following sections.
2.1 Waste and energy audits
The waste and energy audits of the facilities comprise a combination of data collection
approaches, including development of an audit questionnaire (Appendix A), two on-site visits
and delivery of further audit questions, ongoing consultations taken with AS staff, and the
collection of 2022 historical data on waste and energy consumption where possible.
23
The objective of the waste audit is to identify and examine upstream/downstream waste
reduction strategies, evaluate vendor procurement processes including e-waste management,
assess current waste program design, and identify further opportunities for zero-waste
operations and education. Areas of interest with respect to the waste stream included assessing
all current waste stations placed throughout the facilities, including waste stream receptacles,
signage, and placement.
The objective of the energy audit is to characterize the key areas of energy consumption for
animation production, which in this instance largely relate to the operational energy use relating
23
The year 2022 was chosen as the main point of reference due to the altering of the work dynamics post the COVID-19 pandemic
of 2020. This period of time permanently altered the quantity of people who work from the office, adjusting the energy and waste
systems in the office. The year also marked a significant increase in hired staff, a volume which is expected to be representative of
hired staff moving forward, and is also indicative of the general shift to remote work underway in the industry.
18
to the animation development process employed by AS. As this requires primary and ongoing
use of computer hardware, software, and in particular, data servers, added attention was paid to
capturing the impacts of the digital processing and rendering stream particular to AS. Other
peripheral areas of interest included, but were not limited to, heat generation, lighting, and
heating/cooling associated with the building envelope, as well as transportation.
An on-site waste audit of the Vancouver facility was conducted on May 18, 2023, coupled with
the waste analytic questions detailed in Appendix A. A second site visit was conducted on
September 7, 2023, which focused more closely on the energy consumption aspect of
operations and in particular the data centre. Both site visits involved a walk-through of the AS
facilities, including all common spaces, work spaces, and data server rooms. Photographs and
information were gathered on-site.
Ongoing consultations and information gathering was collected through biweekly calls with AS
and included specific requests on waste sources and production, such material sourcing data,
utility data, and information on computer and data server operations. Historical data in reference
to waste production and sourcing was collected where possible (e.g. purchases of water bottles,
reams of paper, stock items for the kitchens and bathrooms, waste diversion reports, and e-
waste). Specific requests were also made for historical information on heating, cooling, energy,
and related metrics where salient and/or available.
2.2 Carbon footprint
This phase involves the application of audit information collected to estimate AS’s carbon
footprint associated with its 2022 operations.
For energy, this comprises the following two main steps:
1. Structure and analysis of energy audit data to allow for carbon footprint estimation (e.g.,
x number of servers operating for y number of hours consume z number of kilowatt-
hours of energy);
2. Sourcing and added calculation of the greenhouse gas emissions associated with AS’s
energy consumption (e.g. x number of kilowatt-hours of energy over one year of

19
operation equate to y number of metric tonnes of annual carbon dioxide emissions,
based on regional electric grid emissions).
The carbon footprint for utilities thus combines the audit data with emission factors associated
with energy consumption in the operating jurisdiction. Energy emission factors were sourced
from the Canadian Energy Regulator
24
and the Government of Canada.
25
These factors
included but were not limited to the emissions associated with electricity and natural gas
commodities.
26
Further detail on these specific assumptions and calculation approach is
documented in Section 4.0.
In quantifying the footprint derived from transportation, the albert carbon calculator
27
was used
to calculate a best estimate of emissions stemming from transportation methods by staff
commutes to the office, corporate air travel, and from shipping of electronic equipment
purchases. Staff that commuted to the office were surveyed on their mode of transport and the
number of days per week/month spent at the office, multiplied by weeks of the year. These
modes of transport included personal vehicle
28
, public transit
29
, motorcycle, bicycle, and
walking. Commutes by bicycle and by walking were excluded from the calculation. These
distances are then multiplied by integrated emissions factors to estimate a footprint. All
corporate air travel was booked through a third party company
30
which compiled all yearly travel
and produced an associated carbon footprint using a travel specific carbon calculator.
31
The
raw air travel data was also collected and input into the albert calculator to capture another
footprint estimate. In regards to couriers of electronic equipment, AS provided a list of
24
https://www.cer-rec.gc.ca/en/data-analysis/energy-markets/provincial-territorial-energy-profiles/provincial-territorial-energy-
profiles-british-columbia.html#s3
https://www.cer-rec.gc.ca/en/data-analysis/energy-markets/provincial-territorial-energy-profiles/provincial-territorial-energy-profiles-
british-columbia.html#s3
25
https://publications.gc.ca/collections/collection_2022/eccc/En84-294-2022-eng.pdf (table1). Marketable gas.
26
Energy emission factors will therefore need to account for the nature of the regional electricity grid and heating (often met largely
by natural gas, but also heating), and any fuels used in transport (typically gasoline and diesel with minor amounts of renewable
fuels). We note here that the jurisdiction in question has a cleaner electricity grid than many other regions with a high amount of
renewable generation.
27
The albert carbon calculator was developed specifically for the film and television industry to help allow productions to
understand their environmental impact.
28
A general classification of a medium car type with gasoline/petrol fuel type was applied.
29
Public transit in Vancouver is administered by TransLink. Half of the bus fleet is powered by diesel fuel, and the other half by
lower-carbon emission technologies, including electric trolley, hybrid-diesel, and compressed-natural gas buses. For the purpose of
input into the albert calculator, all commutes from public transportation were input as diesel fueled.
30
Corporate Traveller is an online based travel platform for booking, safety, reporting, policy, and expenses.
31
Thrust Carbon builds technologies that allow companies to map their sustainability progress through their business travel
emissions.

20
purchases with their associated distributor and weight of freight.
32
Shipment distances were
calculated using the distributor’s final distribution center. Where this information was not
available, a best estimate of shipment origin was utilized.
2.3 Proposed sustainability action plan
The waste and energy audits at the Vancouver facility provide an understanding of current
systems in place, allowing for a framework on which to guide best practices moving forward. An
analysis of upstream and downstream waste practices will inform the proposed action plan for
minimizing upstream waste sourcing towards zero waste efforts and education. The proposed
sustainability action plan will assess current energy consumption at the facility and propose
mechanisms for higher energy efficiency within its operational energy practices, including
minimizing its data storage footprint.
32
Associated emissions from manufacturing of products was excluded from this analysis. Shipping labels were not retained from
previous years. Subsequently, distance of shipment was designated as the distance between the distributor’s final distribution
location and the AS facility, and mode of transport designated as truck/van courier fueled by diesel fuel or distance traveled by air.

21
3. Description of Operational Processes
AS is a Canadian animation company. The company has worked on television, feature films,
and theatrical releases, on order of two up to sixteen productions a year. The company is
headquartered in British Columbia with a satellite location in Ontario. The company employs
approximately 700 people across Canada, the majority of which are based in British Columbia.
AS also collaborates with developers abroad, largely in Indonesia.
In 2020, the company transitioned to a hybrid working model in reaction and response to the
pandemic. Despite the extensive renovation of its main headquarters undertaken by AS in 2021
into 2022, the COVID-19 pandemic catalyzed a significant shift in personnel working from home.
This move toward a hybrid model is expected to continue, both for AS as well as for the broader
animation sector.
Currently, the majority of employees (95%) still work from home. Office occupancy generally
runs on standard hours from 9 am to 6 pm, Mondays through Fridays. Approximately 20 to 30
people frequent the studio daily, or only about 5% of AS’s team, as most employees now work
from home.
33
As a result, AS’s current occupant energy use is much lower than it has been traditionally, but
also far supersedes the needs of the current users within the office. The company is interested
in continuing to support a hybrid work practice and eventually find a new rental configuration
that is better suited to present circumstances.
3.1 AS animation production process
Though AS has worked on live action productions, the majority of animation work completed by
AS is 3D or CGI work. As a result, the entire animation process is completed digitally, requiring
minimal physical materials. A high level description of the animation product life cycle is
33
Currently, approximately 520 of the 550 employees in AS’s main office now work from home (the average number of employees
in 2022 was 700, 550 of which were situated in B.C.).
22
described as follows, as informed through secondary research
34
and via consultation with
company executives and key personnel.
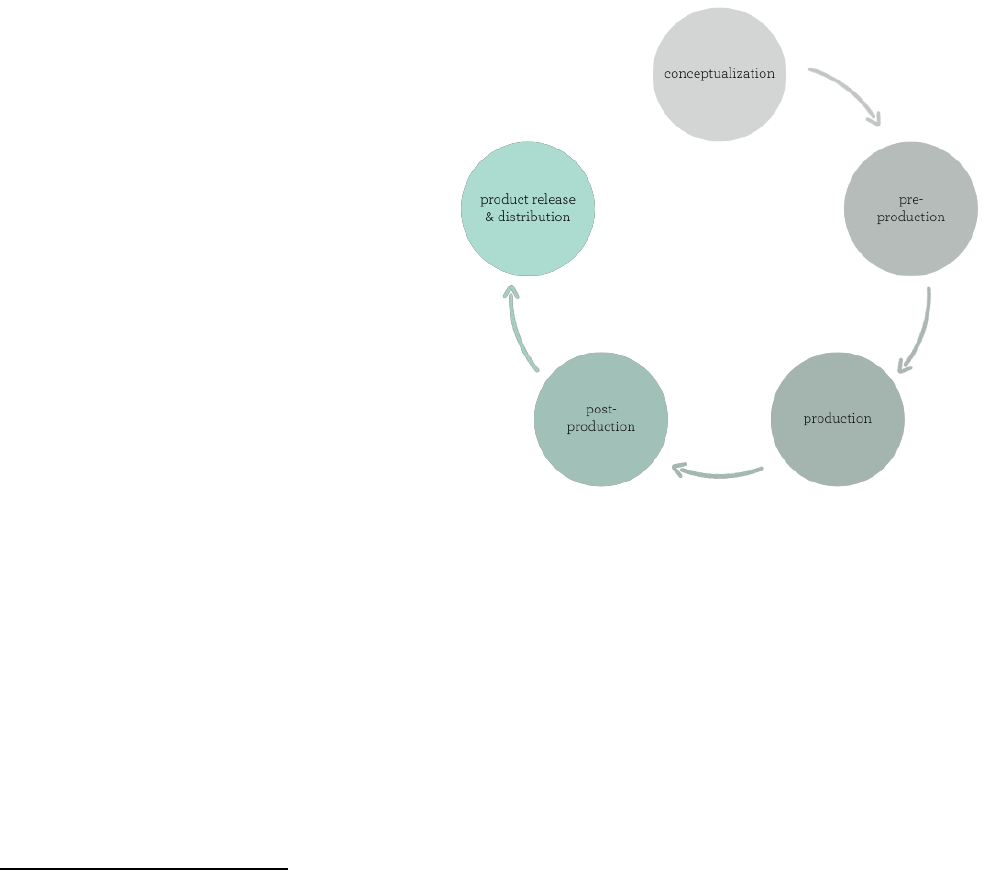
Cycle of animation product development
1. The proposed animation product first
goes through conceptualization, which
involves idea generation, the
development of the project proposal, and
related ideation.
2. This is followed by pre-production,
which includes development of the script,
picture story board, and character
design.
3. Next, the product goes to production.
Production is a critical part of AS’s
activity and involves a number of key
steps, from storyboarding, to animation,
composite, special effects, colour pass,
and other activities.
35
4. At this point the product goes to post-production, which includes composing, editing, voice
recording, and more. For AS, this work is largely performed by outside vendors/composers/sound
team/voices, but is completed within the region.
36
5. Rendering comprises the final phase, driven by the nature of the product release and
distribution. The size of the rendered image will vary significantly based on whether it is for
IMAX vs. YouTube release (for example), as well as the nature/efficiency of machines
employed.
37
The nature of the release will also vary by year - for example, five years ago, AS was
more involved in theatrical release, whereas this is largely for television today.
34
Adapted from C. QIan, Z. Liu and Y. Zhu (2018) “Exploring the Innovation System of the Animation Industry: Case Study of a
Chinese Company“ Sustainability 2018, 10 (9), 3213. Sourced from: https://www.mdpi.com/2071-1050/10/9/3213
35
Specific steps include: The script goes to storyboarding, at which point a voice recording is attached. The product is edited on an
interactive basis. When this process is complete, the two-dimensional storyline is transformed into three-dimensions (whereby the
assets are put into a three-dimensional, or 3D, space). This is the point at which the cameras are set, and the camera work takes
place. The product then goes into animation, whereby the animators are taking the character into the 3D environment. At this point,
the lighter comes in and sets lights. The lighters are responsible for colour. The product then goes to composite, whereby layers are
added together. Every shot is matched to what the director envisions. The Special Effects department then comes into play,
followed by the Crowd department, which adds depictions of crowds in background sets. Following this, shot filing occurs, which
looks to ensure all shots are technically accurate and that all the assets are in place. This also includes a “colour pass.”
36
Noting that at every stage there is editing, which is completed in Los Angeles.
37
The efficiency of machines also changes over time, which impacts the rendering time needed.

23
3.2 Building envelope and operational energy use
Animation differs from traditional film production in that the majority of production occurs within
the digital realm. The bulk of the operating energy footprint therefore occurs as a result of the
creation, manipulation, and processing of the animation product on computers, monitors, and
servers, which are further supported by the data centre(s). For AS, the majority of this digital
activity has historically occurred within its ‘bricks-and-mortar’ head office.
38
AS’s energy footprint is thus made up of two major areas: (1) the heating, lighting, and cooling
energy used for building conditioning (the building envelope), primarily for occupant comfort but
also for its hardware (i.e., cooling); and, (2) the electricity used to operate the company’s
computers, servers, monitors, and data centre. Both areas are further described in the following
sections. Transportation is also a consideration in terms of employee travel and goods
transportation - this is treated in a separate section (Section 3.4).
3.2.1 Building envelope
AS’s main facility location is adjacent to a high-occupancy transit corridor. Built in 1988, the
building is classified as an “A-Class office space”, as well as a certified BOMA BEST® silver
certified building. The building is an approximately 90,000 ft
2
multi-tenant building, which AS
leases together with eight other companies. Transportation options include bicycling, public
transit off the main transit corridor (which is currently undergoing construction for expedited
transit), and vehicles. For the latter, the building offers a parking stall ratio of one stall to 600 ft
2
.
AS is in the early years of a seven-year lease and has access to the full second and third floors
of the facility (approximately 45,000 ft
2
of space), which makes it the main anchor tenant for the
facility. Energy use in the building is not submetered, instead, a percent of use is charged to
different floors based on the square footage leased. The office experiences fluctuating, as well
as high, air conditioning load in the summer, though building windows are double-glazed. Air
conditioning is largely under the purview of the building owner. Although temperature set points
38
With the exception of off-site data servers or third-party processing services.
24
are set at 23 - 24℃, the inside air temperature is variable and is also affected by the number of
people in the facility.
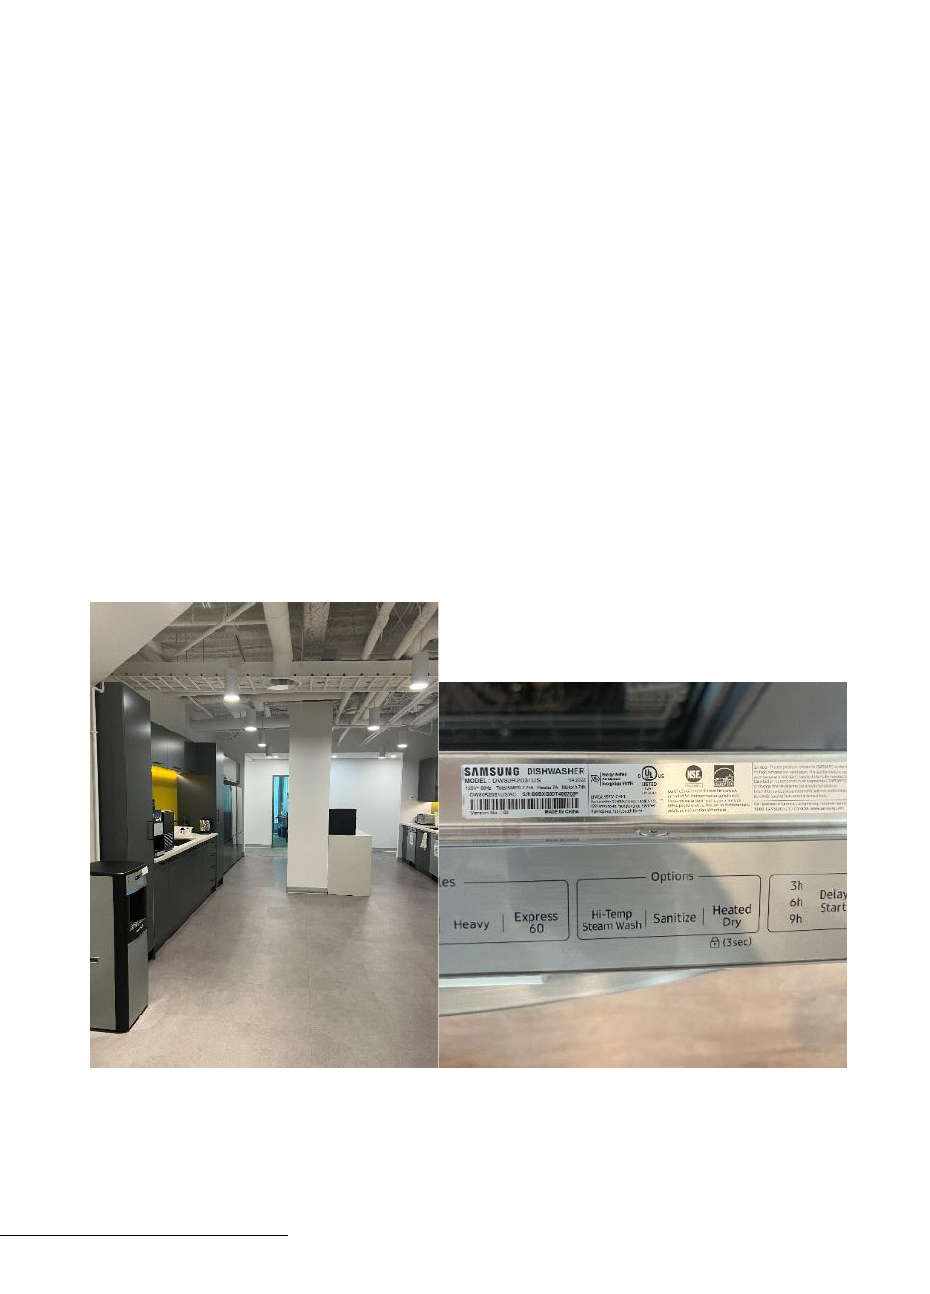
All “white good” standard office equipment within the AS space, such as refrigerators and
dishwashers, are ENERGY STAR
TM
certified. Many of these appliances were upgraded with the
large renovation that was undertaken by AS in 2021 into 2022.
Building lighting is automated and turns off at 6 pm until morning, with the exception of the data
centre. Energy efficient LED lighting provides lighting for the floors; however there is also a
significant amount of daylighting available on both floors. Depending on user function, blinds
can be raised and lowered; typically the latter is associated with reduced to no lighting draw to
allow users to most clearly work with images on the monitors. Motion sensor faucets are
installed in the bathroom facilities as a water conservation measure.
Figure 3.1: Image of AS office kitchen facilities for staff.
All equipment is new as of the renovation undertaken and ENERGY Star
TM
-certified
39
.
39
Energy STAR
TM
certification asserts the product is top performing in energy efficiency, using less energy when operating,
resulting in lower cost to run, and producing fewer emissions.
25
3.2.2 Operational energy
A particularly large energy draw associated with animation is due to the computer, server, and
related operating infrastructure required to create, evolve, and deliver the final product. At AS,
this spans computers and related hardware, the data centre, as well as remote work.
40
The
company also employs cloud storage to a minor degree, largely for administrative and general
office activity (e.g. emails). These areas are further described as follows.
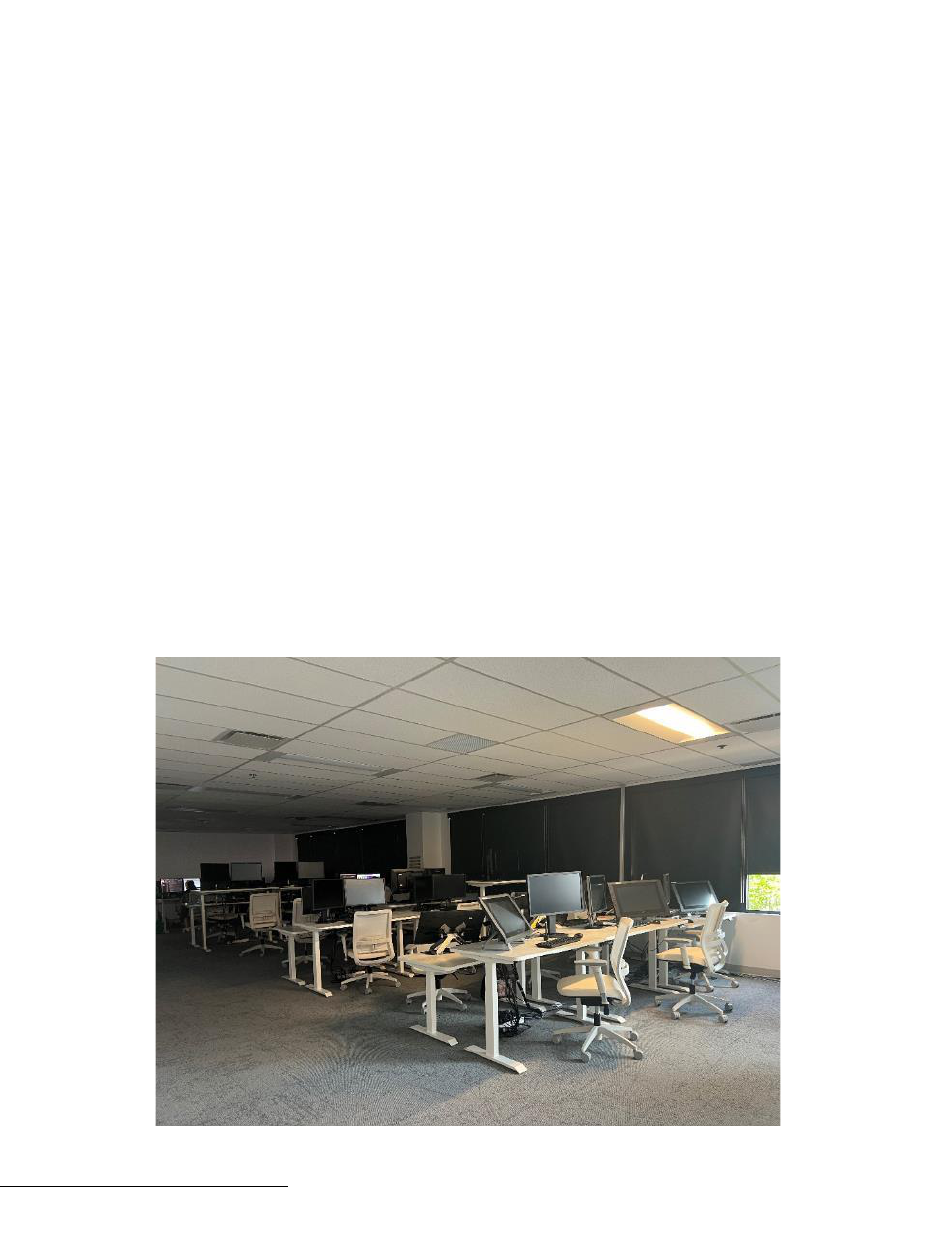
A. Computers and hardware
On average, there are approximately 900 physical machines on-site (largely laptops/desktops),
as well as servers for rendering. The computing machines broadly comprise basic personal
computers used for executive as well as administrative functions (approximately 20% of AS’s
computer assets, see Appendix B), Linux workstations (~80%) and Windows workstations
(20%). Most of AS’s artists work on Linux, but a small number use the Windows operating
system.
Figure 3.2: Image of working environment for AS employees, main office. Note the absence of personal
servers - these are racked in the data centre.
40
Three percent of the world’s electricity is used to power data centers. This amounts to one percent of global greenhouse gas
emissions.

26
The office has 50 hybrid workstations. Standard hours of use run from 9 am to 6 pm daily for the
weekdays. The machines run 24/7 to process images when not in “active” use by an employee,
but peripherals such as monitors are shut down or are put in sleep mode when inactive.
AS owns the majority of their computers, however rents additional units when expansion is
required to meet the needs of additional shows on the roster. In 2022, 75 additional computers
were rented to cover the workstations, on top of the 540 owned by the company (either as
desktops or rack-mounted workstations).
For leased computers, AS will outright purchase and typically run the unit for many more years
(+3 and up to ten years). AS’s business model going forward would be inclined in favour of
rental, so that the company can expand/contract in response to the changing needs of the
industry.
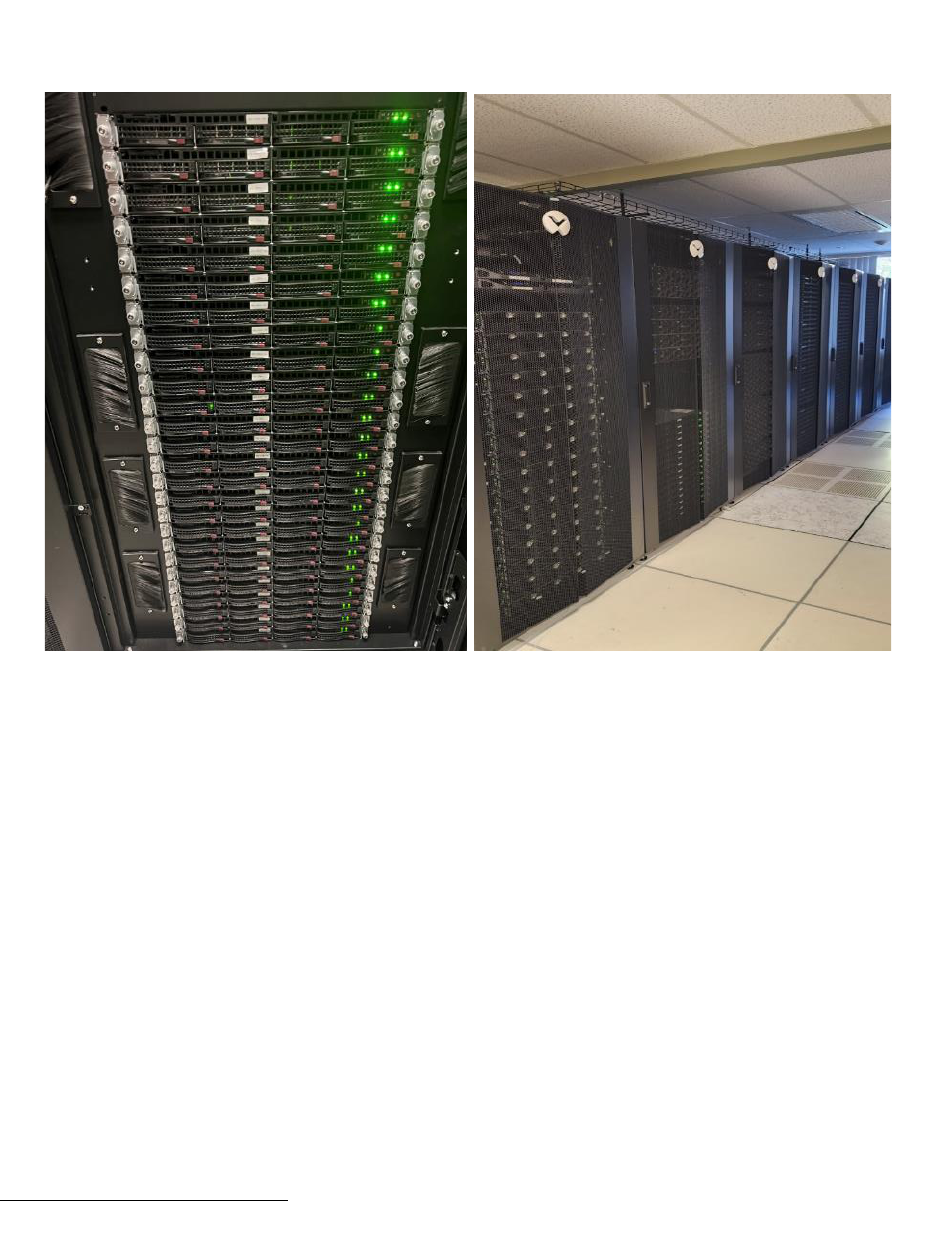
B. Data centre
AS’s principal data centre is housed at the main facility, however the company rents an
additional two racks at a downtown data centre.
41
The majority of the workstations are rack-mounted in the data centre (with the exception of the
few administrative workstations on the floor). This practice allows machines to be located in a
temperature-controlled room which allows the machine to run 24 hours, and also helps with
securing the environment. Racks also contain servers that are used explicitly to render (Figure
3.3).
41
There is a charge to acquire information from the power draws from the smaller data centre downtown - this location is not
treated within this report.
27
Figure 3.3: Images of sample rack with mounted workstations, and data centre. Each green light is a
workstation. There are 27 racks in the data server room. Racks vary in the type and amount of equipment
they host.
When equipment is not being used, it goes on the render farm and performs the rendering
function(s) that have been specified by the user as well as additional rendering. As a result, the
racked machines run for 24 hours. This can mean that, in parallel with busy periods and large
number of employees, the render farm is typically operating with minimal exceptions (i.e. a half-
day idle on December 25).
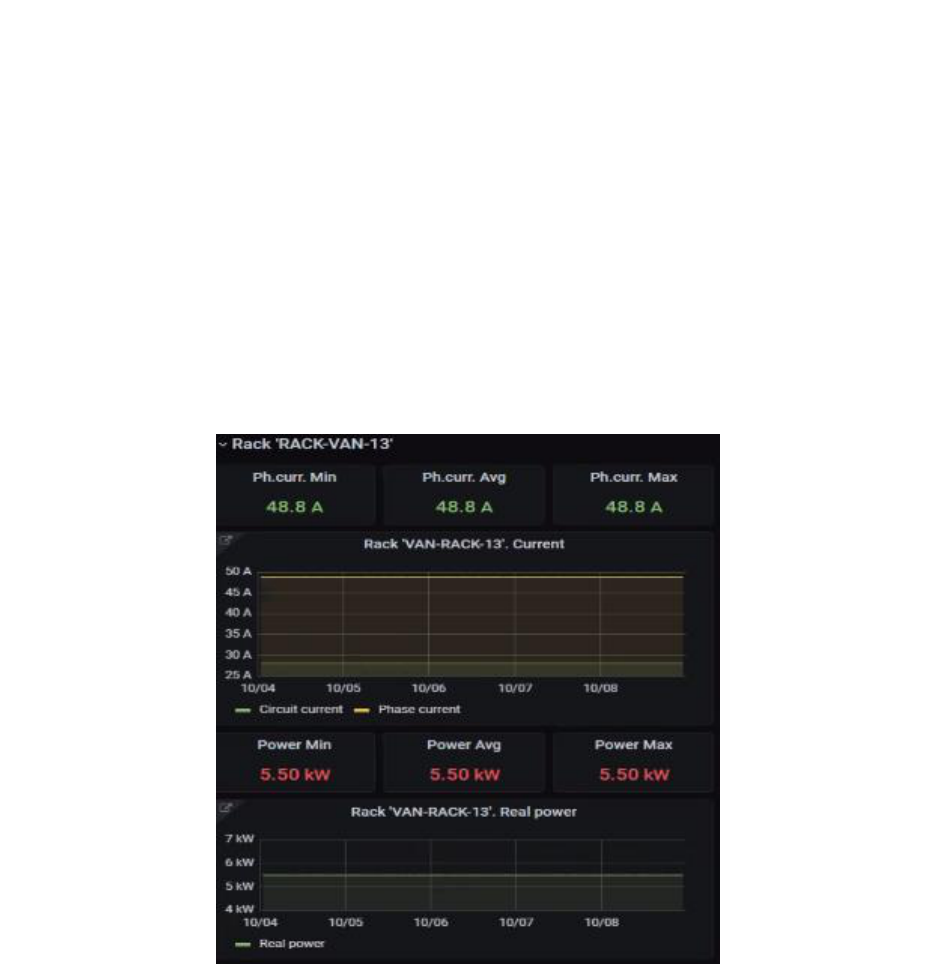
Every rack in the data centre is metered via three power bars that display power consumption
(see Figure 3.4). The graphs reflect the operating daily use of the Linux computers only,
42
as
well as the draw for rendering (thus can be categorized as either user or as rendering draw).
Sometimes the rendering process can take more energy, but this also depends on an individual
user's workflow. Generally the power bars average 5 - 7 kW for daily usage.
42
Desktops for the Windows side are not graphed, as these cannot be put into racks. This means Windows workstations do not go
onto the render farm. Windows users can log on at any point to work a machine (up to seven users per one machine).
28
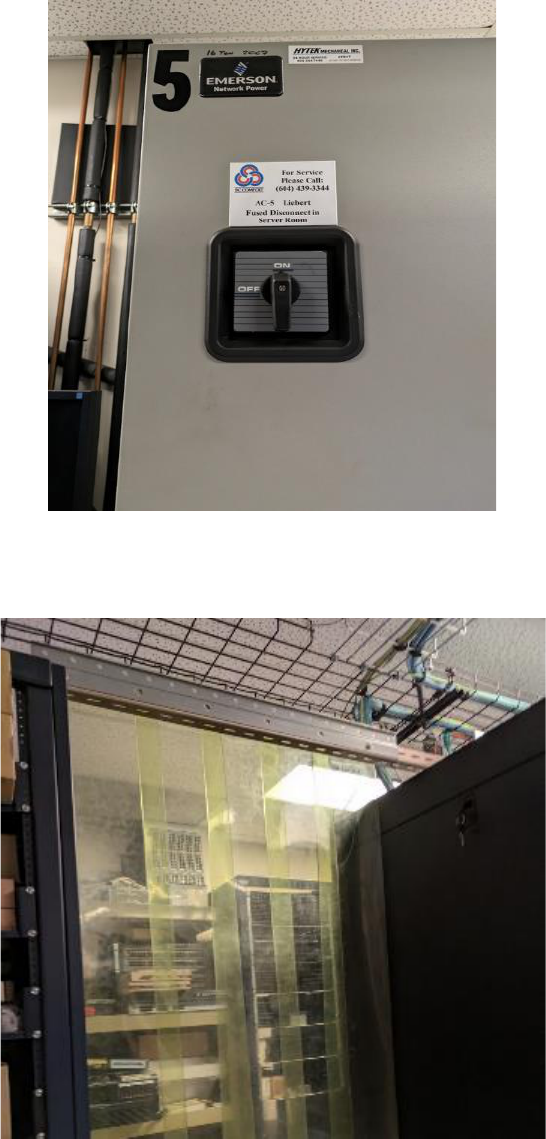
The data centre is cooled through the use of large mechanical cooling equipment which ranges
in age from 1992 to 2007 (Figure 3.5). These units, which are considerably dated (1992 - 2007
vintage), draw hot air generated from the machines and redistribute cooled air. The raised
subfloor of the data centre has been purpose-built for this function.
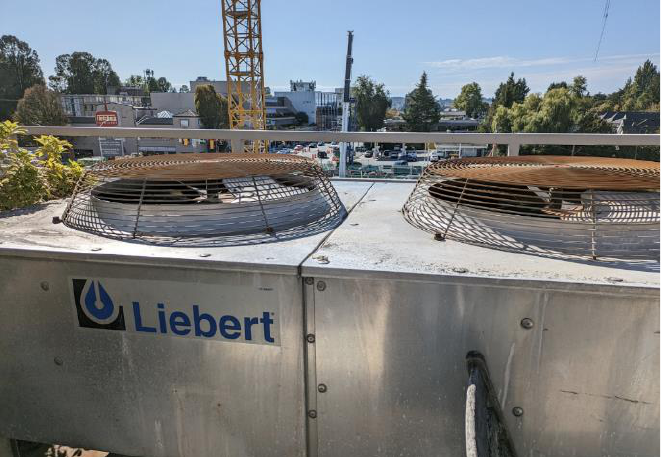
The residual waste heat from the data centre is released through a mechanical condenser unit
located on the main floor outdoor deck (Figure 3.7). The unit is in continual operation and is in a
closed-loop glycol system that is externally serviced on a regular basis.
Figure 3.4: Sample graph of energy use over time of day, select rack. Cooling towers information/data
not included. The backup racks (offsite location) uses much less resources and are not shown here.
29
Figure 3.5: Mechanical cooling equipment and subfloor venting
Figure 3.6: Plastic partition between cooling equipment and remainder of data centre.
30
Figure 3.7: External condenser unit
C. Production Storage
Production storage, also referred to as active storage, is stored in the racks in the data centre.
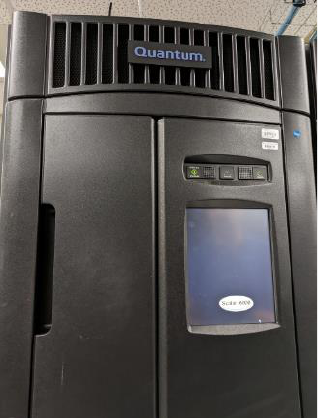
D. Archiving
Post-production, the main medium for archiving AS’s films is via tape, specifically Linear Tape
Open (LTO). Tapes are written using a scalar tape processor. AS employs a Quantum i6000
unit to write the films to tape, which are also located in the data centre. Two tapes are made for
each product; one of which is stored onsite and the other is provided to Iron Mountain for
backup off-site.
31
Figure 3.8: Scalar tape processor
E. Remote work
As indicated, approximately 95% of AS’s staff now work from home, though editorial work and
some other functions are also done within the studio. There are two main ways that artists
connect to the studio:
1. AS provides the artist with a hardware client (miniature hardware); or,
2. Remote workers use their own PC and software.
Most users connect to their studio workstations from home via zero client or software client
through Teradici PCOIP protocol. Once the users have finished their work and logout of their
session, the machine will join the farm and start rendering.
Few users connect through VPN to access files or connect to their workstations.
3.3 Waste production and management
Though the animation process has evolved from hand-sketched animation and physical builds,
avoiding large volumes of waste of paper, pens, ink, and other building materials, personnel use
of the main office naturally also results in day-to-day waste generation and associated
management (e.g. composting, recycling, disposal). The product requirements of animation also
32
have energy, waste, and disposal implications; this includes but is not limited to sourcing,
transport, and the end-of-life disposal considerations around computers, batteries, and kitchen
and break room stock items.
3.3.1 Waste management
Waste stations, consisting of separate waste receptacles for distinct waste streams, are present
in all high traffic areas and areas of high waste production (ie. kitchens and break rooms).
These waste stations consist of receptacles for organics, refundables and/or mixed recycling,
and landfill material. All receptacles are equipped with detailed signage explaining proper
disposal of waste items, including which items are not to be placed in each bin. There are
washing facilities available for rinsing of recyclable materials prior to disposal, which is important
for avoiding contamination of other recyclable materials.
Figure 3.9: Representative photo of a waste station in the kitchen spaces.
33
There is a waste receptacle from Iron Mountain available in the facility for sensitive shredding.
43
Iron Mountain collects all paper waste to be shredded and then recycles the material, effectively
diverting paper from landfill. They also provide a Green Report which summarizes the amount of
paper shredded and recycled during a specified time period. This report also provides helpful
descriptions of environmental benefits of this shredding, including trees and water saved. In
2022, the Green Report confirmed that AS shredded a total of 0.54 metric tonnes of paper.
According to this report, one hundred percent of Iron Mountain’s shredded paper is recycled and
repurposed into new paper products.
In the common workspaces, there are blue and black bins available for waste processing.
These bins are not equipped with signage denoting appropriate waste streams. Next to the
printers are blue bins with a stamped recycling symbol, assumedly reserved for the disposal of
waste paper items.
The bathrooms are equipped with waste receptacles beneath the paper towel dispensers.
These receptacles include a recycling symbol and a sign that states only paper towels should
be disposed of within the bin.
Figure 3.10: Representative paper towel receptacle bin in the bathroom.
43
Iron Mountain is a global corporation that stores, protects, and securely disposes of highly sensitive data, business information,
and other valued assets.

34
Waste collection for the building is managed by building management. Recycling Alternative is
contracted to collect cardboard, recycling (paper), mixed containers, and organics.
44
Qualifying
refundables (beverage containers) are also collected and sent for proper recycling by Recycling
Alternative. Waste Management is contracted for the remaining waste/garbage collection.
45
Building management does not request waste diversion reports from Recycling Alternative nor
Waste Management, though these are services both companies provide. As waste is collected
cumulatively from all building tenants, it was not possible to obtain historical waste diversion
reports for AS’s waste production, as they would be representative of all waste collected from
the building.
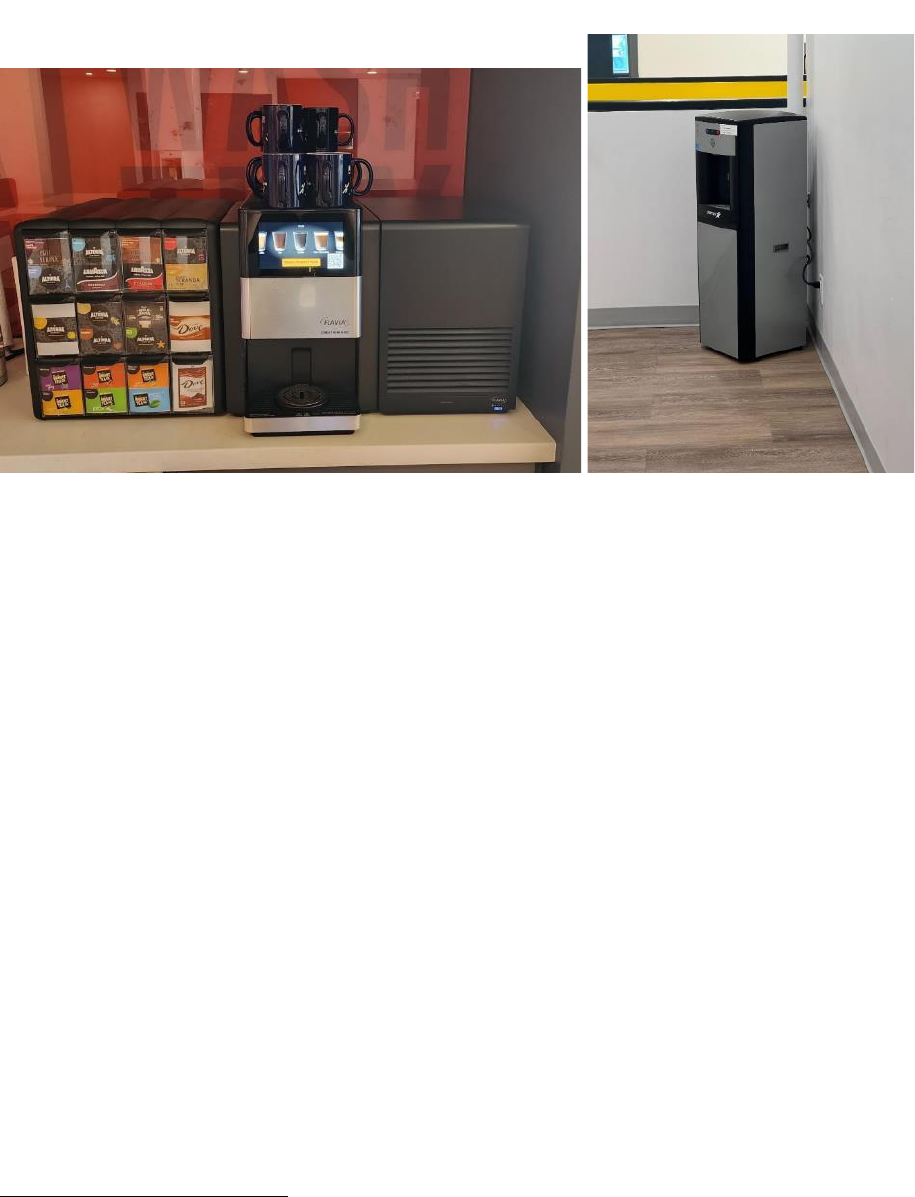
3.3.2 Kitchens and break rooms
AS stocks the kitchens and break rooms on site with hot and cold beverages. A portion of these
hot beverages come in the form of individual packages for the Flavia machine and individual
coffee pods for the Nespresso machine. The individual packages are recycled through
Terracycle
46
and the individual pods are recycled by a Nespresso service.
47
Individually
packaged teas are offered as well. There are mugs and disposable cups with lids available for
these beverages. The disposable cups are 100% compostable and the lids can be sent for
recycling. Also provided by AS are beverages in canned or bottled containers, which can be
recycled. Water dispensers are present in the building, encouraging the use of reusable bottles
and/or containers. There is reusable cutlery and dishware available for meals, encouraging a
zero-waste setup.
44
Recycling Alternative provides innovative recycling and composting solutions to Vancouver, British Columbia.
45
Waste Management provides residential and commercial waste and recycling hauling services across North America.
46
Terracycle’s mission is to eliminate waste through collaboration and innovative solutions in recycling and reuse.
47
Nespresso offers a recycling program for used capsules where aluminum capsules are recycled and coffee grinds are composted
and made into fertilizer.
35
Figure 3.11: Hot beverage offerings in the kitchens; water dispensers available in the facilities.
A water outage that occurred in the summer of 2022 resulted in the need for AS to purchase
156 500ml bottles of water for meetings. With this exception, water is sourced from water
dispensers.
3.3.3 Electronic waste
Electronic waste (e-waste) is collected and recycled by the Electronic Recycling Association
(ERA).
48
Two submissions of e-waste items were delivered to ERA for items used in 2022: one in
February of 2022 and the other in May of 2023. Though these two submissions may include a
portion of items discarded outside of the assessment year, they both encompass all the
discarded electronic items from 2022. One laptop, 15 monitors, one switch, 28 loose drilled hard
drives, 15 cell phones, and miscellaneous equipment has been donated to ERA for recycling
and/or repurposing.
49
According to a certificate issued to AS, all end-of-life equipment donated
to ERA is sorted and handled for recycling following environmental standards.
48
ERA is an ISO 9001 and ISO 14001-registered company working with charities to recycle and refurbish electronic waste.
49
ERA Certificates of Recycling are included in Appendix E..

36
3.3.4 Material sourcing
The packaging on the paper purchased for office printing does not indicate it is sustainably
sourced, nor is it Forest Stewardship Council-certified. This office paper is more than likely
sourced from virgin wood materials. Packaging on paper towels includes labeling that indicates
the product meets the United States Environmental Protection Agency (EPA) guidelines for
post-consumer fibre content. According to the EPA, this means that these paper towels contain
40 to 60% post-consumer fibre content.
50
As part of AS’s lease, cleaning products for the
maintenance of the offices are purchased by the building and/or the contracted cleaning
company. However, AS does purchase dish and dishwasher detergent cleaning products for the
kitchen facilities. No green cleaning certifications were observed on the packaging of the
cleaning products.
3.4 Other areas of impact
Though the largest areas of environmental impact for AS’s operations derive from energy
consumption, other daily operations of the studio and its staff do generate a footprint. In
quantifying other areas of impact, the analysis includes emissions stemming from transportation
to and from the studio by staff and corporate air travel, as well as from the purchases of
electronic equipment to support operations. Though not exhaustive of all other areas of impact,
the emissions analysis from employee transportation and couriers serves to further develop the
baseline operational footprint.
The advent of the Covid-19 pandemic transitioned the majority of AS staff to work remotely. As
a result, there were approximately 18 staff members who commuted to the office regularly in
2022, anywhere from one to five days per week. The total kilometers from employee commutes
by public transit and personal vehicles were tallied and input into the albert calculator to arrive at
an estimate of carbon emissions produced by commutes in 2022.
51
Employees traveled
approximately 11,371 kilometers in personal vehicles and 14,126 kilometers on public transit.
50
US EPA (2016). “Comprehensive Procurement Guidelines for Paper and Paper Products.” Per:
www.epa.gov/smm/comprehensive-procurement-guidelines-paper-and-paper-products.
51
For input into albert, personal vehicles were categorized as ‘car (medium)’ fueled by ‘gasoline/petrol’. Public transportation was
indicated as being fueled by diesel.

37
Corporate air travel was mainly associated with industry events and client projects. This
included travel to and from markets by executives and clients, as well as flights to Indonesia,
supporting pipeline projects with the partner studio. Air travel was booked through a third party
company
52
which compiled all yearly travel and produced a carbon footprint using a travel
specific carbon calculator.
53
According to this summary data, 29 trips were taken by AS staff in
2022, amounting to a total of 239,075 kilometers. The majority of these flights were long-haul
flights (over 3,700 kilometers). Of these flights, 91% were flown on Business Class, while 9%
were Economy Class. The raw air travel data was collected from AS and also input into the
albert carbon calculator to compare.
AS frequently purchases new electronic equipment to support operations. The list of purchases
for 2022 was compiled and categorized by distributor, and then all associated purchases tallied
by weight. The majority of purchases were sourced locally, while other purchases came from
Winnipeg, various states across the United States (California, New Jersey, New York, South
Carolina, Utah), Japan, and China.
52
Corporate Traveller is an online based travel platform for booking, safety, reporting, policy, and expenses.
53
Thrust Carbon builds technologies that allow companies to map their sustainability progress through their business travel
emissions.
38
4. Carbon footprint: Pulling it all together
The following section compiles impacts related to energy consumption to provide an estimated
cumulative carbon footprint of AS’s onsite facility and remote work for 2022. The footprint
encompasses the carbon outputs from the operational energy of the building (including heating
and lighting, the data centre and mechanical cooling equipment), as well as from the impact of
the remote workforce (based on equipment use and office space conditioning).
Other areas of impact reviewed include emissions from transportation, including staff commutes
to the office, air travel, and couriers of electronic equipment.
4.1 Summary table of environmental impact
The following table provides an initial estimate of AS’s emissions footprint, estimated at ~403
metric tonnes for 2022. Several areas are of note. One is the potentially significant contribution
of the data centre to the office emission footprint. Though values are approximate, our initial
analysis indicates that the data centre may account for more than half of the estimated building
operational emissions for 2022 (or 33 of 56 tonnes/year). A significant part of this draw may
relate to the mechanical cooling system, which currently comprises several large-scale cooling
units that date prior to 2007 (and in some cases to 1992).
Another more significant area of note is the natural gas draw potentially associated with remote
work space conditioning (i.e. heating of remote worker residences). Despite a relatively
conservative assumption that only 50% of AS’s remote workforce would heat their space with
natural gas, and that only 30% of this amount would be “eligible” to heat a home office area,
when we extrapolate this usage across the workforce it suggests that the emissions impact, at
~260 Mt/year, is 65% of the total footprint calculated. We note however, that this impact would
have been otherwise tempered with the emissions associated with commuting to the office,
which are not as significant as they would have been prior to the remote work model being
enacted. This said, air travel remains a significant area of impact at ~71 tonnes, or about 18% of
the total carbon footprint.

39
Also, and although we have estimated the per person impact of the various categories reviewed
(below), we suggest this estimate is of limited application when broken down by on-site vs.
remote worker. This is because many of the functions of the office (i.e. data centre use) are
driven by remote activity and vice-versa. We instead posit that considering the per user
emissions based on the full workforce (both onsite and remote), as well as the full span of
operating activity (remote, in office, etc.) provides a more useful metric for extrapolating to other
similar types of productions. This latter approach has been taken to estimate the per person
carbon footprint, estimated at 0.7 tonnes of emissions/per worker in 2022 for this case study.
Lastly, we suggest evaluating additional case studies on animation would help derive a more
robust range of estimates for the animation industry. The values expressed herein are most
reflective of the single case study reviewed, and in particular its operating jurisdiction due to the
effect of the regional electricity grid on final emissions values. These values are thus most
applicable to animation companies situated in the B.C. region.
Table 4.1 Summary of Estimated Annual Emissions, 2022
Category
Tonnes CO
2
emissions/yr
Office facility
Estimated for AS, from invoices only
35
Utility invoice billed on square footage, not usage. Does not
account for data centre draw.
Estimated for AS, from facility utility
tracking information
76
Total facility emissions (shared with eight other tenants)
approximates 174 tonnes in 2022.
AS office facility estimate
56 tonnes/yr
Average of both estimates
Office facility, on site per user draw (on-
site)
1.9 tonnes/yr
Estimated for on-site workforce and assuming that 30 individuals
are typically on-site throughout the year. We caution that this
latter estimate assigns the entirety of AS’s operational footprint
(i.e. data centre, which also processes offsite tasks) to those few
individuals working on-site.
Office facility, per user draw (all)
0.1 tonnes/yr
Accounting for on and off-site workers.
Data Centre (included within building energy estimates above)
Racks
10
Racks are assumed to account for 90% of operational draw of
machines and rendering.
Scalar Tape Processing
0.1
One quantum unit.
Mechanical Cooling
23
Does not account for efficiency rating.

40
Data centre estimate (this value is
already included as subset of facility
emissions)
33 tonnes/yr
This estimate is embedded within the building energy / emission
value in this table. It is included here as a directional estimate of
the energy draw/emissions impact from the data centre. Estimate
does not include estimates from condensers or chilling units.
Remote workers
Equipment (PCs, monitors and zero
clients)
4
Approximating PCs for all offsite staff, two monitors, and a
subset of zero clients.
Electricity (space conditioning)
6
Assuming 80% of workers live in apartments and the remainder
in single family dwellings, given the majority of the AS employee
base is under 30.
Natural gas (space conditioning)
258
Assuming 50% of offsite workers heat their homes with natural
gas (average profile for consumption in B.C. is 50% heating with
natural gas).
Remote workers
268 tonnes/yr
Accounting for off-site hardware, including PCs and two standard
monitors, but not accounting for broadband or data transfer.
Accounting for home office space conditioning (by assuming
30% of estimated electricity and natural gas typically used within
residences).
Remote workers, offsite per user draw
(remote only)
0.5 tonnes/yr
Estimated for off-site workforce. This latter estimate does not
attribute any of AS’s operational footprint (i.e. data centre, which
also processes offsite user-specified tasks, etc) to those
individuals working from home.
Remote workers, per user draw (all)
0.49 tonnes/yr
Other areas of impact
Personal vehicles
3
The albert carbon calculator was used to calculate a best
estimate of emissions stemming from transportation methods by
staff commutes to the office and from shipping of electronic
equipment purchases.
Public transit
2
Air travel - Corporate Traveller
96
Booked through a third party company which compiled all yearly
travel and produced an associated carbon footprint using a travel
specific carbon calculator.
Business class (already included as
subset of air travel)
87
Air travel - albert
46
Prepared separately by EA
Business class (already included as
subset of air travel)
39
Prepared separately by EA
Air travel, average
71
Estimate applied for total
Couriers
3
Using list of purchases with associated distributor and weight of
freight. Shipment distances were calculated using the
distributor’s final distribution center. Where this information was
not available, a best estimate of shipment origin was utilized.
Cloud storage
0.5
Used generally across the organization, for general
administrative and office functions (e.g. email). Estimated
emissions generated from third party provider.
Other areas of impact
79 tonnes/yr

41
Other areas of impact, per user draw
(all)
0.2 tonnes/yr
Estimated across full workforce (on and off site).
Total estimated emissions
403 tonnes/yr
Per user emissions (all)
0.7 tonnes/year
Note. For the building facility, data centre and for the remote workers categories, the carbon
intensity of electricity and natural gas were applied to generate the carbon footprint, using the
cost and emission factors in Appendix C. The detailed approach, values, assumptions, and
limitations to these calculations are documented in Appendix D.
For the other areas of impact, the albert calculator was applied to estimate emissions from
transportation of employees to and from the office and of goods. The Thrust Carbon calculator
was used to estimate the emissions produced from corporate air travel.
4.2 Building facility estimate
The carbon footprint associated with heating, cooling, and lighting AS’s headquarters space in
2022 is estimated to range from 35 to 76 tonnes of CO
2
-equivalent, for an average of 56
tonnes of CO
2
emitted annually.
54
Two different calculation methods were applied to arrive the estimated range:
1. For the lower end estimate, AS’s utility costs billed for 2022 for electricity and for
natural gas were extrapolated by the respective electricity and natural gas costs in B.C.
to render the estimated quantities (i.e. kWh of electricity, GJ of natural gas) used. As
utilities are billed to AS on a square footage as opposed to a usage basis, the billed
amount does not necessarily reflect the exact usage of electricity and natural gas (i.e.
the billed amount does not necessarily correspond to the amount of electricity or natural
gas consumed). As AS also operates a data centre, it is likely that the billed amount is
an underestimate of the actual amount of energy consumed.
2. For the higher end estimate, the energy used for the entire building in 2022 (~90,000
ft
2
) was acquired for electricity and natural gas. This total value was then used to
54
Assuming an occupancy of up to 30 individuals, this equates to a per person-carbon footprint of 1.9 tonnes for 2022, though we
caution that this latter estimate assigns the entirety of AS’s operational footprint (i.e. data centre, which also processes offsite tasks)
to those few individuals working on-site.
42
approximate the amount of electricity and natural gas consumed per square foot of the
full building. This per square foot consumption factor was next applied to AS’s rented
area (~45,000 ft
2
) to also derive a footprint estimate. This approach would likely
generate a more accurate total energy draw as it would also account for the operation of
the data centre, however we note the estimate would also be affected by other, non-
animation, uses in the building, such as common space conditioning, boiler rooms, and
other uses. Consequently we have elected to take a conservative estimate to total
estimated emissions resulting from building conditioning and data centre operation by
averaging the range in values.
Further detail, values, and assumptions to the calculations above are noted in Appendix D1.
4.3 Data centre and supporting large equipment estimate
As an accounting exercise specific to animation and to the AS data centre, we sought to
quantify the data centre operating footprint to provide a sense of the potential carbon impact of
this particular area. We note that this estimate is likely additive to the AS utility bill/carbon
estimates previously presented (Estimate #1), and conversely would be accounted for in the full
building carbon estimate (Estimate #2). The data centre estimate is included here to provide
further resolution on the emissions impact of AS’s data centre, but this value should not be
added to the carbon footprint total due to the reasons elucidated above.
The carbon footprint associated with the data centre in 2022 is estimated at 33 tonnes of CO
2
-
equivalent, based on the approximation of energy use associated with select major equipment.
The following calculation and general assumptions were applied:
1. We applied the total estimated power consumption from the racks, based on an
estimated average daily power draw, multiplied by the total number of racks, 24-hour
run-time, and 364 days of operation a year. These racks reflect 90% of the power draw
used by machines within the facility, remote work requests (i.e. for image rendering), as
well as ongoing rendering.
2. For the scalar tape processing unit that is used to write products to tape, we applied the
general power draw (estimated) of a tape library unit, 24-hour run-time and 364 days of
operation a year to derive approximate power consumption and associated emissions.
43
3. For the mechanical cooling units, we identified the ton-rating for each unit and
approximated the energy draw per ton of cooling capacity. The draw was multiplied by
the 24-hour run-time and 364 days of operation a year to derive approximate power
consumption and associated emissions. We note that this estimate is as yet rudimentary
and does not account for the energy efficiency rating of the equipment, however also
note these units date from 1992 to 2007 which will impact their efficiency rating.
4. Outdoor condensers and chillers are not tabulated in this estimate.
Further detail, values, and assumptions to the calculations above are noted in Appendix D2.
4.4 Remote work and supporting equipment estimate
The carbon footprint associated with remote work in 2022 is estimated at 268 tonnes of CO
2
-
equivalent. Assuming an offsite workforce of 520 individuals, this equates to a per person-
carbon footprint of 0.5 tonnes for 2022. We note that this latter estimate does not attribute any
of AS’s operational footprint (i.e. data centre, which also processes offsite tasks) to those
individuals working from home.
The following calculations were applied to derive energy consumption and emissions estimates
for remote workers.
1. AS’s office machines were used as a proxy for PCs used by remote workers and
allocated across the remote workforce. Two monitors were assigned per offsite worker,
along with a number of zero clients. The total electricity draw was estimated based on
working hours and days per year. This value was then multiplied by regional electricity
factors to derive an emission estimate associated with this activity.
2. We next considered the space conditioning impact of home offices by approximating
electricity and natural gas draw. For electricity, we assumed that 80% of employees
would be in apartment dwellings given the relatively young demographic of the remote
workforce (e.g. the majority is under 30). We next applied average monthly consumption
values per household for the region (based on regional data and household type) to
ascertain consumption values, which were then extrapolated by the associated emission
factors for electricity.

44
3. For natural gas, we assumed that 50% of the remote workforce would heat with natural
gas, as in B.C. approximately 50% of residences use natural gas for space heating.
55
The annual and daily consumption values were drawn from related literature on the
region and applied to natural gas emission factors to derive the estimated carbon
footprint associated. Both the electricity and natural gas estimates were adjusted by 0.3,
as it was assumed only 30% of the personal residence could be attributed to office use.
Further detail, values and assumptions to the calculations above are noted in Appendix D3.
4.5 Other areas of impact
Employees traveled approximately 11,371 kilometers in personal vehicles, resulting in a total of
3 tonnes of CO
2
. Employee commutes by public transportation totalled 14,126 kilometers and
resulted in an additional 2 tonnes of CO
2
.
56
29 trips were taken by AS staff in 2022, resulting in
a total of 239,075 kilometers. Of these total kilometers, 72% were flown on Business class
flights.
57
According to AS’s third party travel vendor, cumulative flight travel produced 96 tonnes
of CO
2
, 90% of which were associated with flying Business Class.
58
However, according to the
albert carbon calculator, cumulative corporate air travel produced 46 tonnes of CO
2
, 85% of
which were associated with flying Business class. This range in result is an outcome of the
varied assumptions and approaches inherent with different carbon calculations and approaches.
The carbon footprint of the couriered electronic purchases was estimated at 3 tonnes of CO
2
.
AS operations also uses Google Drive for storage, which consists largely of office processes
and functions, e.g. email. In 2022 AS used Amazon Cloud services. The carbon footprint report
from these specific storage services was estimated at 0.5 metric tonnes in 2022, as depicted in
Figure 4.1.
59
55
https://www150.statcan.gc.ca/n1/pub/11-526-s/2010001/part-partie1-eng.htm
56
Gasoline was purchased for the company van to perform routine company errands. This amount was excluded in the calculation
as it was a minimal volume.
57
Premium Economy flights were grouped together with Business flights.
58
Flying business class produces a larger carbon footprint as it decreases the number of passengers that each flight can carry.
59
The computational methodology followed is unknown as of this writing; nor is the relation to/description of the AWS renewable
energy purchase further specified, i.e. it is unclear whether the 4.5 metric tonnes shown in Figure 7 represents an offset purchase
and otherwise should be considered in the cloud carbon footprint, for a total of 5 metric tonnes in 2022.
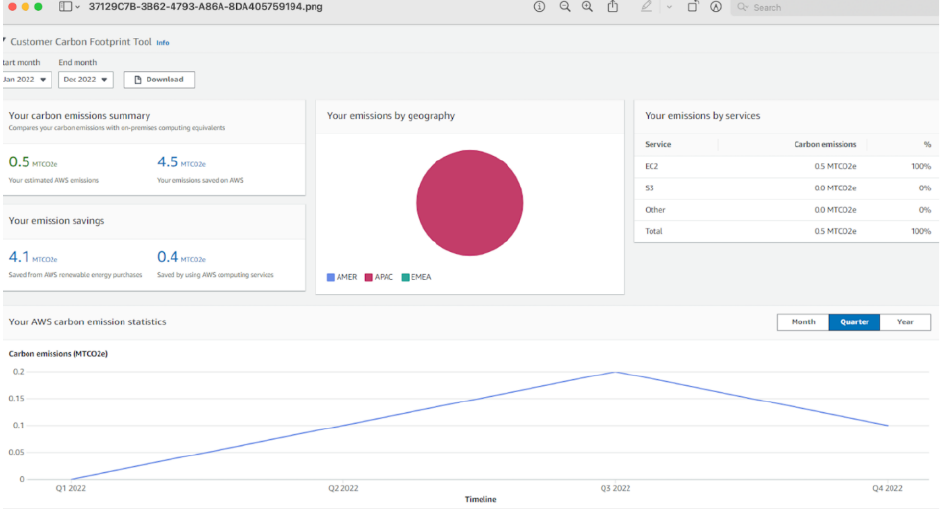
45
Figure 4.1: Cloud storage carbon footprint for 2022, AS (per Amazon Web Services (AWS))

46
5. Sustainability Best Practices for AS Studios
5.1 Proposed action plan for zero waste operations
The current waste strategy in the Vancouver facility is quite efficient in its design. However,
there are suggested best practices that can be outlined to further promote an effective waste
management system, while encouraging waste reduction and zero waste practices.
5.1.1 Waste Management
In regards to the on-site management of physical waste, it is important to ensure that a
comprehensive waste management system is in place. The facility currently has various waste
stations set up to allow for effective sorting of waste. The province of British Columbia has
established a federal program to offer refunds for beverage containers to encourage recycling of
these items.
60
There is a refundables bin available at the waste stations in the facility for
recyclable items that can be returned for refund. At every waste station, ensure that a mixed
recycling bin is available in all places where a refundables bin is present, in case there is
recycling that must be disposed of and cannot be refunded. It is also noted that signage for
landfill and organics also include the common symbol for recycling which may be confusing and
lead to incorrect disposal of waste items. As such, avoid usage of this symbol on waste bins
destined for landfill and organics.
There are waste bins labeled as “Garbage Disposal” in the hallways. We suggest all waste
stations in the facility be equipped with a bin for every waste stream (ie. mixed recycling,
refundables, organics, landfill) with appropriate signage denoting proper item disposal.
It is suggested that all printers be set to duplex printing to reduce paper consumption. As a best
practice and to reduce paper waste, offer a scrap paper bin for single-sided pages that can be
used for reprinting or used for note taking.
60
Return-It (2023). “Beverage Container Recycling 101.” Per: https://www.return-it.ca/beverage/recycling/recycling101/

47
The bathrooms are equipped with waste receptacles beneath the paper towel dispensers that
display a recycling symbol. Paper towels have fibers that are too short to recycle. As a result,
these should instead be destined for compost for proper waste disposal and to avoid
contaminating recycling waste.
5.1.2 Kitchens/Break Rooms
The takeaway cups offered in the kitchens are 100% compostable. The organics waste hauler
for the facility, Recycling Alternative, does accept compostable materials into their on-site
composters. However, in an effort to further zero waste practices, disposable cups could be
removed from the kitchens entirely to encourage the use of the reusable mugs.
There are individually wrapped teas in the breakroom. Often, the packaging for these tea bags
cannot be recycled as they are made of multiple blended materials. In an effort to implement
zero waste practices in the facilities, it is suggested that fair trade and ethically sourced loose
leaf teas be offered in place of individually wrapped teas.
When ordering catering for the offices, it is recommended that AS opt for vegetarian and vegan
meals that are made with locally sourced and in-season ingredients. In comparison to plants,
animal products lead to far greater greenhouse gas emissions.
61
Sourcing local and in-season
ingredients reduces emissions involved with the transport of products over greater distances.
Untouched leftover items can be donated to charity organizations in the area to reduce food
waste and to contribute to and strengthen the local community. Single-use plastics should be
completely eradicated from catering offerings, as the kitchens are equipped with reusable
cutlery.
5.1.3 Material Sourcing
Through the waste and sourcing audit, Earth Angel has determined approaches to reducing
unnecessary sources of waste by first examining upstream sources of reduction and then
61
Science News (2022). “How much does eating meat affect nations’ greenhouse gas emissions?” Per:
https://www.sciencenews.org/article/food-emissions-data-diet-carbon-greenhouse-gas-climate-agriculture
48
identifying mechanisms for zero waste and more sustainable sourcing of consumables and
other materials.
When purchasing reams of paper for the office, it is suggested that AS Studios elect to choose
reams containing 100% recycled and/or post-consumer fiber material only and have Forest
Stewardship Council certification to ensure the product was sourced sustainably. Pertaining to
paper towel and toilet paper sourcing, it is recommended that these products be sourced from
100% recycled material, lowering the demand for virgin paper material. Bamboo is another tree-
free sustainable source for these products.
Elect to choose cleaning supplies with the EcoLogo, Green Seal, or equivalent certification.
EcoLogo certification helps identify products that meet environmental standards throughout their
entire life cycle — from manufacturing to disposal. While the Green Seal certification ensures
that products use safer chemicals and have environmentally preferable packaging, they are also
verified non-toxic, low-VOC (Volatile Organic Chemicals), carcinogen-free, and phthalate-free.
When sourcing office furniture for the next facility location, favour eco-designed furniture with
recycled and sustainably sourced materials. Prioritize sourcing local vendors to reduce impacts
from transportation. AS can also consider renting furniture or desk sharing to reduce the volume
of office and furniture needs.
5.1.4 Other areas of impact
Employee Travel
As the work from home model has dramatically reduced the amount of employees traveling to
and from the office, emissions associated with employee commutes have greatly decreased.
For those still commuting to the office, encouraging employees to use public transit, carpools,
and rideshares in electric, hybrid, or other fuel efficient vehicles, is a best practice in reducing
emissions from employee commutes.
As evidenced from the range of emissions produced from corporate air travel in 2022, air travel
can greatly increase a corporation’s carbon footprint. Reducing air travel, by prioritizing virtual
meetings where possible, opting for Economy flights over Business and First Class, and limiting

49
layovers to avoid multiple take-offs and landings, will help to lessen overall impact from
corporate travel. When choosing airlines, elect those that are low emission and participate in
carbon offset programs. AS could also consider the purchase of carbon offsets from reputable
third parties associated with travel providers.
Education and Crew Engagement
In an effort to increase education in climate science and sustainable production, encourage all
AS staff to attend free training provided by Reel Green
TM
on Sustainable Production.
62
Pursuing internal communications on sustainability can be important to reducing a corporation’s
overall environmental impact. Routine memos on the benefits of pursuing sustainable practices
in respect to energy conservation and waste reduction, alongside green messaging on email
signatures, can be a method of stimulating dialogue on individual and collective actions.
Sustainability on Screen
Entertainment has a huge impact on culture, with the power to influence and change consumer
behaviours, knowledge, and attitudes. One study found that 75% of respondents indicated they
learned about social issues from scripted entertainment, but that only 2.8% of scripts included
any climate-related keywords.
63
In development of creative materials, inclusive of the script,
during pre-production, there may be opportunities to incorporate sustainability into the script or
depicted on screen through character actions or items.
5.2 Proposed action plan for higher energy efficiency
5.2.1 Building envelope
Energy efficiency is key to reducing energy consumption, conserving energy, and using energy
most effectively. The building is BOMA-certified, which means it already has a generally well-
62
Creative BC’s Reel Green
TM
initiative provides a collection of best practices to help accelerate sustainable production and reduce
the environmental impacts of film and television production.
63
Norman Lear Center (2022). “A Glaring Absence.” Per: https://learcenter.s3.us-west-
1.amazonaws.com/GlaringAbsence_NormanLearCenter.pdf

50
regarded and efficient operating footprint. When sourcing the next location, AS can consider
buildings that are LEEDⓇ, BOMA-BESTⓇ, or equivalently-certified, which can help confirm that
the building produces lower operational carbon emissions (and consequent lower utility costs)
and has conserved resources in the construction process. Further energy-efficient best
practices specific to the current location and potential future location include:
Temperature
Heating and cooling within the AS building is the purview of the building owner and is controlled
via thermostat. The building is largely set at 23/24C. The AS facilities are currently largely
unoccupied, resulting in the unnecessary cooling and heating of empty offices.
➢ When sourcing the next location, AS can consider installation of programmable
thermostats, adjusting the turning on and off of heating or air conditioning to a pre-set
schedule. This can generate cost savings and reduce energy consumption of a
building.
64
➢ Sourcing a smaller office, suitable for the decreased volume of staff commuting to the
office, will also reduce cooling and heating needs.
Lighting
The AS facilities employ energy efficient LED lighting for the floors and lighting is set on an
occupancy timer. Daylighting is available and used on both floors. Blinds are also used when
artists are working with high resolution image files.
➢ Other than prioritizing natural light, LEDS are preferred as they provide a significant
reduction in energy consumption as well as operating costs, as is continued use of
lighting occupancy timers.
Appliances
All “white good” standard office equipment within the AS space, such as refrigerators and
dishwashers, are ENERGY STAR
TM
certified.
64
Up to 10% on heating and cooling can be saved by turning the thermostat down for 8 hours a day from its normal setting. Per:
https://www.energy.gov/energysaver/programmable-thermostats. Ecoprod estimates that turning down the thermostat by one
degree will result in a 7% decrease in energy consumption, this increases to 10-15% in well insulated buildings. Per:
https://www.ecoprod.com/fr/les-outils-pour-agir/guide-de-l-animation-eco-responsable.

51
➢ When purchasing new office equipment, including computers and printers, continue to
source those that are ENERGY STAR
TM
qualified.
➢ When sourcing a new office location, install low-flow toilets to conserve water.
65
The renovations at the Vancouver facility were designed with the entire AS staff in mind. As the
pandemic has permanently affected the number of staff that work from the office, there is a
surplus of refrigerators, microwaves, and related kitchen equipment at the AS facilities.
➢ In the near and long term, it is recommended that the majority of these appliances be
unplugged to prevent standby energy wastage.
66
➢ It is also a good practice to shut down and unplug office lighting and other equipment,
where possible, understanding that this may not be possible for equipment sending
materials to be rendered.
➢ Additionally, it is recommended that the use of the dishwasher be limited to once a day
to reduce energy consumption.
Renewables
Though British Columbia’s electrical production is largely hydropower-based, AS can further
reduce its carbon footprint by switching to a 100% renewable energy supplier in its current
location.
➢ Service providers like Bullfrog Power and others can provide renewable energy
certificates to offset any facility-based fossil-fuel based consumption. These certificates
can be purchased to “cover” part or all of the electricity consumption used by the AS
facility, as well as the natural gas consumed.
5.2.2 Operational Energy
The operational energy of an animation studio makes up a large fraction of its carbon footprint
mainly due to the high energy consumption needed to run powerful computer systems and
complex rendering software. The storage and archiving of ample volumes of data creates
65
Low flush toilets use approximately 1.6 gallons of water per flush, whereas regular toilets can use between 3.5 to seven gallons
per flush. Per: https://greencoast.org/low-flush-toilets/.
66
According to the U.S Department of Energy, 10 percent of an average electric bill stems from items that are not being used. Per:
https://www.nrdc.org/bio/peter-lehner/pulling-plug-energy-waste-guide-efficient-consumer-electronics.
52
another fraction of the footprint. The following sections highlight strategies to increase
sustainability and minimize this digital footprint.
5.2.1 Computers and hardware
AS’s computers and related hardware are generally optimized over their lifespan as computers
are leased/owned for a number of years.
➢ AS makes a great effort to use their computer equipment for as long as possible,
handing down used equipment to other departments that do not require the same
operational speed as those required to produce.
○ As newer and more efficient technologies are entering the markets, when
sourcing new equipment, transition to more energy efficient products that will
significantly reduce overall energy consumption. There may be higher upfront
costs associated with these items but will lead to considerable savings over their
lifetime, through reduced energy consumption and lower cooling costs.
➢ When sourcing new equipment, prioritize purchasing from companies that are integrating
sustainability into their supply chains, ensuring reduced climate impact and sustainable
and ethical manufacturing and sourcing of materials in their products, including using
recycled materials. Prioritize items that are designed for longevity, reuse, recyclability,
and repair, and that have reduced and/or recyclable packaging. Though this can be
challenging, opting for locally sourced electronic items can reduce emissions associated
with the transport of goods.
➢ Continue to pursue circular strategies in reducing electronic waste by donating and
recycling spent electronic items.
➢ Operationally, continue to:
○ Turn off monitors at the end of the day, where possible.
○ Avoid the use of screensavers and allow monitors to sleep or power down.
○ Perform routine hardware maintenance and upgrades.
5.2.2 Data Centre
Current energy savings measures in place for the data centre include the electrical/mechanical
cooling system. This system uses a process of energy staging, which means the system
prioritizes mechanical energy via fans first, and the HVAC system only when required. When

53
less heat is being generated, the system runs as a fan to circulate air and uses less electricity.
The cooling load may diminish somewhat in winter months, but is largely constant as the
machines typically dissipate the same amount of heat. The air-conditioning data for the power
units is gathered separately.
➢ Waste heat, as a result of the energy consumption required to run the data servers, is
often left unused. However, there is great potential for the reuse of this waste heat. AS
can consider further optimizing its own use of energy in building, in particular through the
expanded use of waste heat from server rooms.
○ For example, Kajawood Studios in Finland estimates that the waste heat
generated from a 90-minute animated film would be sufficient to provide hot
water for up to 20,000 homes for one day.
67
○ The Finnish start-up company Kuulea operates on this principle, which also uses
the waste heat from the servers of its customers, such as Kajawood Studios, for
the heating needs of the property.
➢ Another option is to consider and measure the amount of energy being consumed by the
data centre (initial estimates are provided herein) and the purchase of renewable energy
credits to offset this consumption.
In the longer term, AS is exploring opportunities to move the data centre out of the studio and
into a purpose-built facility in another part of Vancouver. The current data centre room is large
and was built 30 years ago, which means that much energy is wasted to cool the entire room,
instead of focused cooling for individual racks. Although the company tries to run the centre as
efficiently as possible, data centre technology has advanced considerably and new ways of
cooling machines are now available that were not previously. Moving the centre into a purpose-
built location provides a more efficient and self-contained mechanism of cooling, largely
targeting the racks themselves.
➢ AS could consider specifying for data centre facilities that make use of or would consider
innovative options to utilize the waste thermal energy generated from the data facility.
Transitioning the data centre to a provider that has considered - or would be willing to
consider - optimizing the use of waste heat would be environmentally impactful. With the
67
Assuming a total of 130,000 frames, each taking three hours to render with 270W equipment, resulting in a rendering process
consuming approximately 100,000 kWh of electricity in total. Per: https://www.kajawood.com/green-post-production-solutions-are-a-
hot-topic/

54
help of various innovations, the heat produced by data centre can be used to heat
various facilities. Such avenues make data centers more climate-friendly and can offer
alternative heating solutions for buildings, especially in cold regions.
○ For example, in Sweden, a project called Stockholm Data Parks works in
cooperation with political and industrial leaders. This City-initiative provides
infrastructure for data centers that employ heat recovery in contribution towards a
more sustainable energy system in the city. The goal is to use the waste heat
produced by the city of Stockholm’s data centers to heat homes.
○ Off-site or even on-site excess thermal energy from post-production servers
could be reused in district heating or studio site heating. The ‘Spark’ concept in
Norway proposes the use of excess thermal energy from data centres to heat
local communities. This is a 2MW capacity data centre situated at the heart of a
community. The excess thermal energy produced is used in district heating
systems and household water tanks. Once the thermal energy has dissipated,
the cold water returns to the data centre to cool the servers. The designers claim
that the system provides a 40% reduction in energy use compared to a standard
data centre. A prototype is currently under construction in Lyseparken, Norway,
where it will form part of an energy positive town.
68
With the film industry
increasingly relying heavily on data centres to power and process post
production, this could be a viable innovation to consider in the longer term and in
partnership with key stakeholders such as the City of Vancouver and related
entities.
➢ AS could also consider working with a data center that is powered by renewable energy.
5.2.3 Storage & Archiving
On average, where a 3D series will have 15 terabytes (TB) of useful material at the end of
production, 107 TB will be stored by the studio.
69
This can generate vast amounts of data that
produce emissions as it is stored.
➢ Develop data life cycle policies that filter out data that is no longer required.
68
albert, BFI, & Arup. (2020). A Screen New Deal: A Route Map to Sustainable Film Production. Per: https://wearealbert.org/wp-
content/uploads/2021/03/Screen-New-Deal-Report-1.pdf
69
Ecoprod (2023). “Guide de l’Animation Éco-Responsable.” Per: https://www.ecoprod.com/fr/les-outils-pour-agir/guide-de-l-
animation-eco-responsable.

55
Production companies are often bound to store created products and data for a set period of
time. This period of time ranges by project but can be up to 10 years. This digital data is
typically stored in three mechanisms: data centers (online), hard drives, or Linear Tape Open
(LTO). Storage of digital data in data centers requires ample electricity. Three percent of the
world’s electricity is used to power these data centers, amounting to one percent of global
greenhouse gas emissions.
70
Along with limited shelf lives and a risk of losing data, hard drives
tend to be resource-heavy and their manufacturing is also carbon-intensive.
71
LTO is the
industry standard for film data storage as they are long-lasting and can hold vast amounts of
data, for a fraction of the carbon involved with data centers and hard drives.
72
AS’s use of LTO
for archiving data is a best practice and should be continued. In reducing emissions and costs
derived from storage:
➢ Establish a plan for length of storage. Create a policy for internal teams, clients, and
other stakeholders for active, near-term, and long-term storage.
➢ It is recommended that AS perform routine audits and purges of cloud storage uses,
moving inactive data to LTO for longtime storage.
73
5.2.4 Remote Work
The bulk of the estimated footprint from remote work stems from the emissions from natural gas
for space heating.
➢ For remote work, renewable energy offsets can also be purchased to displace the
estimated electricity and natural gas consumed by the remote workforce.
➢ AS may also wish to consider developing novel initiatives to support workers in
retrofitting/reducing their home office electric and heating bills - these areas could be
developed as cost-sharing opportunities and/or could be developed in partnership with
other entities.
70
Harvey, Victoria. (2021). Decarbonising The Digital Journey. Per:
https://drive.google.com/file/d/1sD_jPmg3Zz_xgRHaKeU7rJaiOljduim6/view
71
Hard drives are built with several minerals, including the scarce naturally occurring ruthenium. Per:
https://www.greenthebid.earth/complete-production-manual-1
72
Storing 10TBs for five years in a data center produces 9,000kg of CO2, whereas the same volume of data on LTOs for the same
period of time produces approximately 4.1kg of CO2. Per:
https://drive.google.com/file/d/1sD_jPmg3Zz_xgRHaKeU7rJaiOljduim6/view
73
“Best Practice for Editorial.” Per: https://www.greenthebid.earth/complete-production-manual-1

56
6. Conclusion & Next Steps
In the midst of a climate crisis, it is critical that all industries examine their processes, assess
their impacts, and action ways to lower their environmental footprint. The film and television
industry generates significant environmental impacts due to fuel consumption, energy use and
waste production. With animation, the impacts largely stem from data processing and storage,
technology infrastructure, and more recently, the impact of the remote workplace model.
The case study evaluated highlights the importance of collecting and measuring data to create
quantifiable statistics. A baseline carbon footprint was developed to better understand the
intricacies of the processes involved in creating animation productions. Altogether, the AS
studio exhibits best in class practice in the areas of building energy efficiency, lighting, and in
particular daylighting, waste management practice, and end-of-life material management. AS’s
remote working nature skewed the footprint heavily to these employees’ use of fossil-fuelled
resources in space conditioning (though this is likely offset by the minimal commuting travel
taken by employees compared to pre-pandemic years). Moving towards employing more energy
efficient data centers that optimize the use of waste thermal energy, and minimizing corporate
air travel and flying economy would help to decrease the studio’s impacts.
As this report focused on the operational carbon footprint of an animation studio, we note it
excludes the lifecycle analysis of the equipment used in animation, including its manufacture
and the associated resource and energy consumption. Along with the consumption of water and
rare metals involved, almost 80% of the greenhouse gas emissions emitted by digital equipment
is in its manufacturing, even before its initial use.
74
A lifecycle analysis of the equipment utilized
in animation production would better inform environmental pathways in the transition towards
more sustainable digital practices. Also excluded from the analysis were the downstream
impacts from distribution, merchandising, and streaming which can be significant.
75
74
Ecoprod (2023). “Guide de l’Animation Éco-Responsable.” Per: https://www.ecoprod.com/fr/les-outils-pour-agir/guide-de-l-
animation-eco-responsable.
75
Supply chain emissions are on average 11.4 times higher than those of operational emissions. Per:
https://www.cdp.net/en/research/global-reports/transparency-to-transformation
57
The quantitative and qualitative values expressed in this report are most reflective of the single
case study reviewed, and in particular its operating jurisdiction due to the effect of the regional
electricity grid on final emissions values. As such, these values are most applicable to animation
companies situated in the B.C. region and in similar size and structure as AS. Further sector-
based work in this area would benefit from extending the environmental impact evaluation to
additional studio types and locations. This would better capture a range of potential impacts
based on different studio sizes, practices, and operating jurisdictions, and in so doing, help
inform deeper understanding of the environmental impacts of this sector in Canada. Having this
more comprehensive data could provide better insight into opportunities to mitigate more
complex and wide-ranging impacts, optimizing environmental performance and minimizing
climate impacts across animation production.
58
Appendix A: Data Collection Questions
I. Waste Production Evaluation (Site Audit)
Information collected will provide data necessary to characterize AS’s typical waste footprint by volume
and waste stream (ie. recycling, compost, e-waste, etc). The assessment will aim to assess opportunities
for upstream waste reduction strategies in an effort to reduce waste, evaluate vendor procurement
processes, and help inform the design of a zero waste program.
a) Type of waste generated by department / activity (e.g. office, kitchen, edit suite, other)
i) Where the waste sample comes from (which departments)
(a) Packaging associated with lunches
(b) Who are the caterers?
(c) Is reusable dishware available?
2) Are there breakroom supplies? Snacks with individual packaging? Coffees/teas?
ii) Number of waste station setups (number of areas in which bins are available for waste
disposal)
1) How many bins are available for all the building’s waste? Are the bins separated
by waste stream?
2) Do waste stations have signage/guidance about what goes where?
3) Is there a place to rinse out recyclables before putting them in the bin?
iii) Type of diversion/compostable/recyclable alternatives available
1) Are there opportunities for vendor/sourcing alternatives to prevent waste at its
source?
2) Can you provide your current vendor list for general and office supplies and what
you order from them?
b) Are there waste haulers?
i) Types of waste/materials collected?
1) Landfill- e.g., wrappers, chip bags
2) Recycling - e.g., paper, glass, aluminum, plastic, other?
3) Organics - e.g., food scraps, compostable dishware/cutlery, paper towels
ii) How often is each type of waste hauled?
1) Landfill
2) Recycling
3) Organics
iii) Does the waste hauler provide diversion reports?
1) Can we speak to the other building manager/landlord? Do they have waste
hauler diversion reports?

59
iv) Is it possible to receive a representative quarter or one year of historical waste reports
(2022) (generation and diversion if available)?
c) What type of e-waste is generated?
i) How is e-waste managed?
ii) How much e-waste (in pounds/kilos) would you estimate you disposed of in 2022?
d) Do you know if these waste practices/policies are also being implemented in the Toronto office?
II. Energy Use Evaluation (Site Audit)
Information collected will help evaluate in-studio energy efficiency practices, help ensure that energy-
efficient operating strategies (best practices) are maintained, and help inform potential opportunities for
next steps,
a) What are the major factors affecting energy consumption rates (e.g.,. season, occupancy,
business cycles)?
b) Are there permanently installed energy meters or sub-meters that measure total building energy
consumption (electricity, natural gas, chilled water, steam, fuel oil, propane, etc)?
i) Utility-owned meters capable of aggregating total project energy use are acceptable
(possibly available from energy utility statements/building maintenance).
c) What are the current power load demands for the computer equipment and data servers in both
peak and off peak hours?
i) What are the peak and off peak hours?
ii) Are there permanently installed sub-meters that measure all electricity and fossil fuels for
equipment (lighting, computers, etc.) within the facility?
d) What type /number of servers are in use?
i) Do you have information on the power draw / heating use / cooling equipment associated
with these servers?
ii) If so, is it possible to receive a representative quarter or one year of total energy
consumption associated with the servers/a server unit (2022)?
e) There are two data servers for AS in Vancouver:
i) Are the data servers on site?
ii) What is the “average” run time?
iii) How may this differ over time/with animation activity?
iv) Is any holiday/seasonality reduction in use ‘typically’ experienced?
f) How many and what kind of computers and monitors are in the facility?
i) What are their “average” run times? (i.e. hours of use)
ii) How may this differ over time/with activity?
iii) Is there any holiday/seasonality reduction in use?

60
iv) Does AS own their own computers or do they rent?
g) Building shell/other
i) Is the studio rented?
ii) What is the vintage (age) of the studio building/construction materials used?
1) Windows - single/triple glazed?
iii) Number, type, and vintage of white goods on site (e.g. refrigerators, dishwashers, etc.)
1) Any energy efficient (eg. Energy STAR) rated equipment?
h) Facility occupancy schedule;
i) How many people are in the facility?
1) When are people in the facility? Is there a schedule for people to attend the
facility, e.g. 9 - 5.
2) How do people typically travel to work?
ii) How many remote workers?
1) What number (or proportion) of remote workers are full-time vs. part-time?
2) What is the typical computer setup for remote workers?
(a) Two ways artists connect to the studio
III. Efficiency Best Management Practices
Information collected will help support energy management and reduce environmental and economic
harms associated with excessive energy use by reducing greenhouse gas emissions and achieving
higher levels of operating energy performance.
i) What energy efficient measures are in place with regards to the data server/server room?
j) Is there sub-metering equipment in place for targeted energy use tracking?
i) This is what would be needed to determine equipment energy use, otherwise challenging
to split electricity usage between use towards lighting, servers, etc.
k) Is equipment ever turned off?
i) Is equipment on timers?
ii) Are there any changes in schedules or setpoints for different seasons, days of the week,
and times of day?
l) Evaluation of existing campus lighting - where is there LED lighting, are there occupancy sensors
etc.
i) Are there setpoints for lighting levels throughout the facility?
ii) Are there light timers/motion sensor lighting?
m) Are there opportunities for heating and cooling efficiency methods?
i) To include temperature readings of heat generation from equipment use during these
times - do maintenance staff have access to this monitoring equipment?

61
n) Are there setpoints for all HVAC equipment?
i) At what temperatures are the rooms set? Do they have air conditioning?
o) What has been done in terms of retrofits?
p) Have opportunities for on-site renewable energy strategies come up/been discussed?
i) If so, what are they?
q) Plumbing - Are there low-flow toilets installed? Motion sensor faucets?
III. Data Collection
Along with the above, Earth Angel Requests
- Floor plans of all spaces occupied by AS
- Access to historical data from 2022, as listed below:
Travel and Accommodations - Travel Coordinator/Accounting ledger
a) Commercial and Charter Air Travel
i) Number of flights and flight routes
ii) Whether it is a one way (>) or roundtrip (<>) flight
iii) If multi-city, include all airport codes
b) Accommodations - Travel Coordinator/Accounting ledger
i) Number of rooms & nights occupied by type of accommodation (hotel, apartment, or
house)
ii) Name of hotel (to determine if economy, midscale, or luxury)
iii) Costs
c) Rental Cars & Ride Shares - Rental Company
i) Total mileage/km driven & make/model of vehicle
d) Couriers- Production Office/Accounting
i) Amount and type of equipment purchased and shipped to the studio
1) Type of transport (ie. air, truck) and fuel type
2) Weight of freight
3) Distance traveled from origin
4) Which vendors are used for shipping equipment?
Sourcing
e) Paper- Production Office/Vendor
i) Number of reams by size, color & recycled content purchased in 2022
f) Water - Production office/Vendor
i) Amount (and type, volume) of individual water bottles, water jugs, & canned water
purchased in 2022

62
Fuel- Accounting ledgers
g) Fuel
i) Gallons/liters of all fuel (gasoline, diesel, propane, biodiesel, etc) purchased by vehicle
type
Utilities
h) ‘Natural Gas & Oil- Invoice
i) Therms/BTUs/ megajoules of natural gas and gallons of heating oil purchased for each
production facility
i) Electricity- Invoice
i) Total kWh of electricity purchased for each production facility
ii) Production calendar/schedule for context (i.e. understanding energy use spikes, average
power loads)
IV. Delivery of Data
Please export all ledgers as editable .CSV or Excel files and upload them to the shared Google Drive
folder. Please grant the Earth Angel Analytics Manager access to these ledgers and any corresponding
digital vendor files.

63
Appendix B: Computer types for executive and
administrative functions
HR Equipment
Dell Latitude 3410 x 3
65W - 8 Working hours 520 Watt-hour
MacBook Pro
96W or 140W - 8 Working hours 768 or 1120
Watt-hour
Exec Equipment
MacBook Pro x 2
96W or 140W - 8 Working hours 768 or 1120
Watt-hour
MacBook Air
30 W - 8 Working hours - 240 Watt-hours
Dell Latitude 3410 x 3
65W - 8 Working hours - 520 Watt-hour
Surface Pro x 3
60W - 8 Working hours - 480 Watt-hour
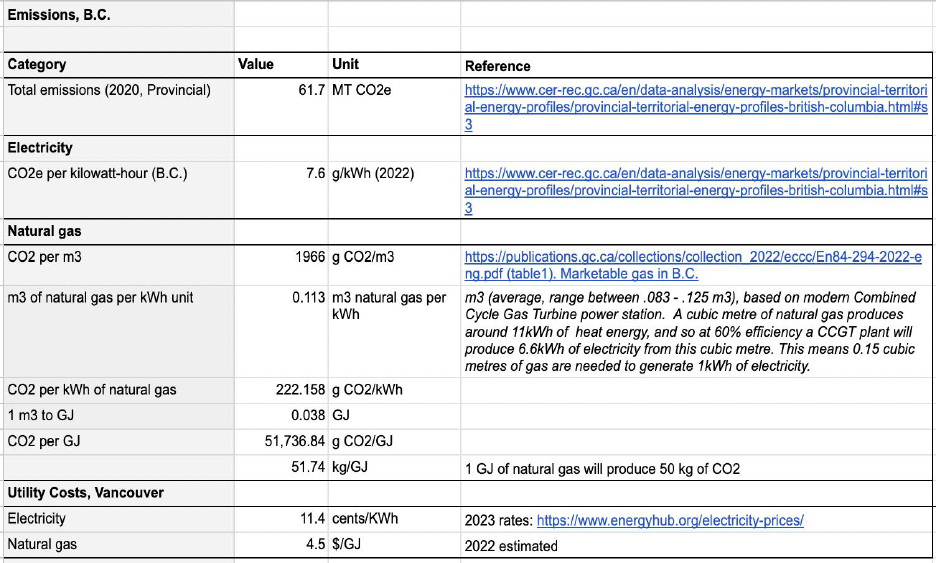
64
Appendix C: Energy and Emission Factors

65
Appendix D: Approach, values, assumptions
and limitations to the calculations
D.1 Building Facility Emissions Calculations
Estimate #1, AS Utility Invoices (does not account for data centre energy draw)
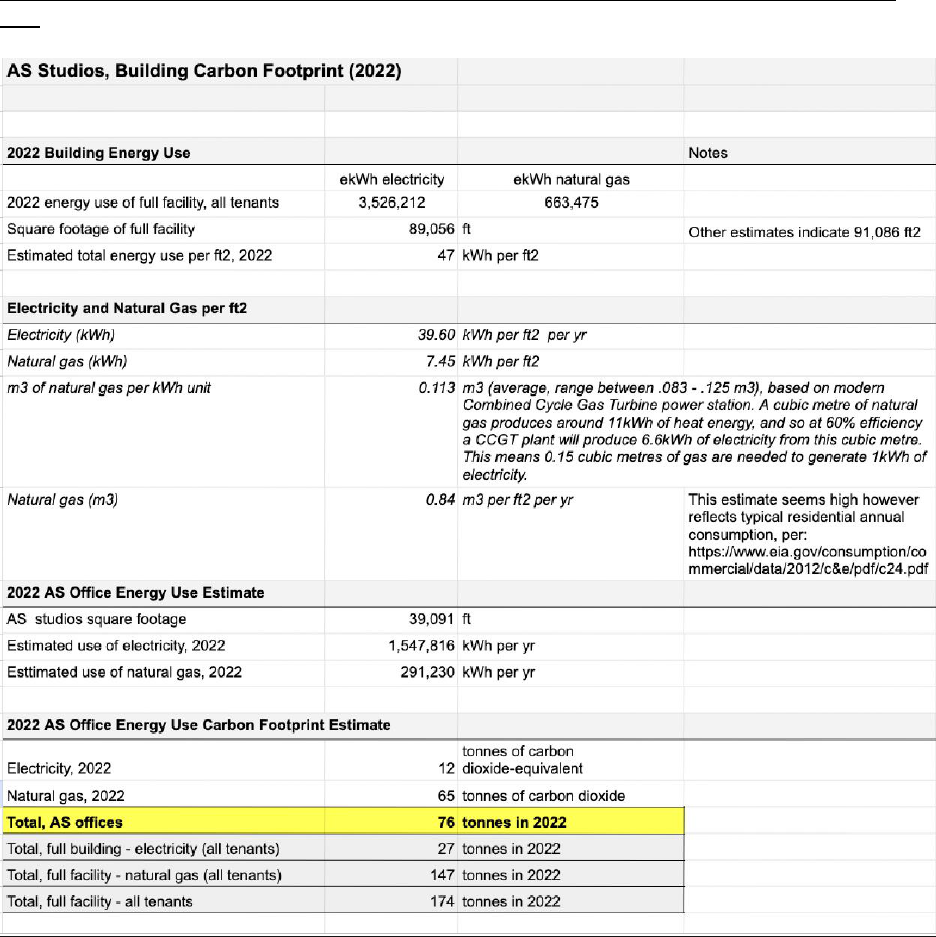
66
Estimate #2, AS Utility Estimates, derived from commodity use for full facility (extrapolated by square
foot)
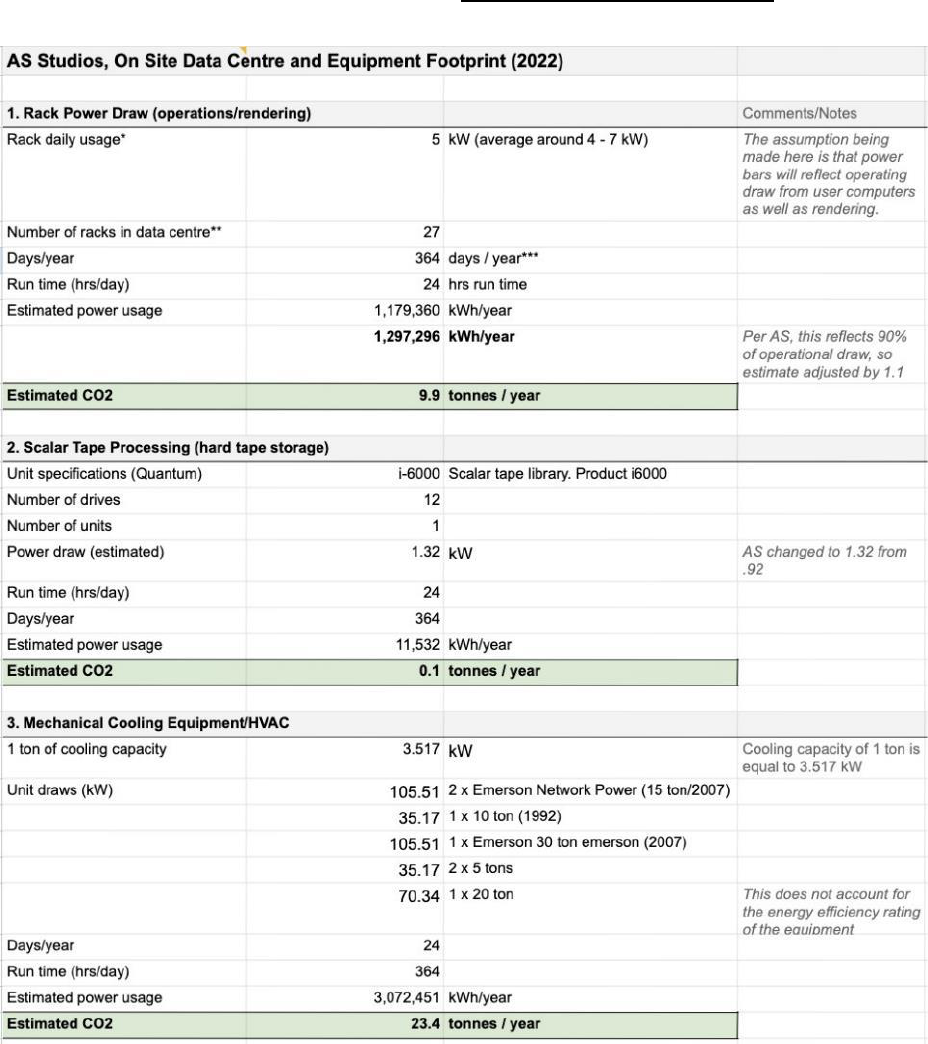
67
D.2 Computers/Data Centre Calculations (subset of D1 total emissions)
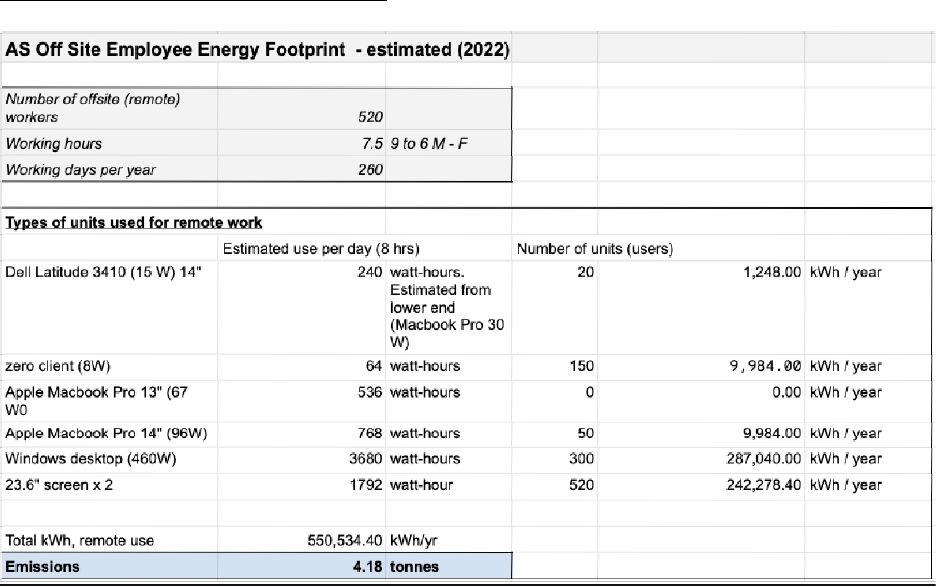
68
D.3 Remote Work Calculations
Remote Computer and Equipment Estimate
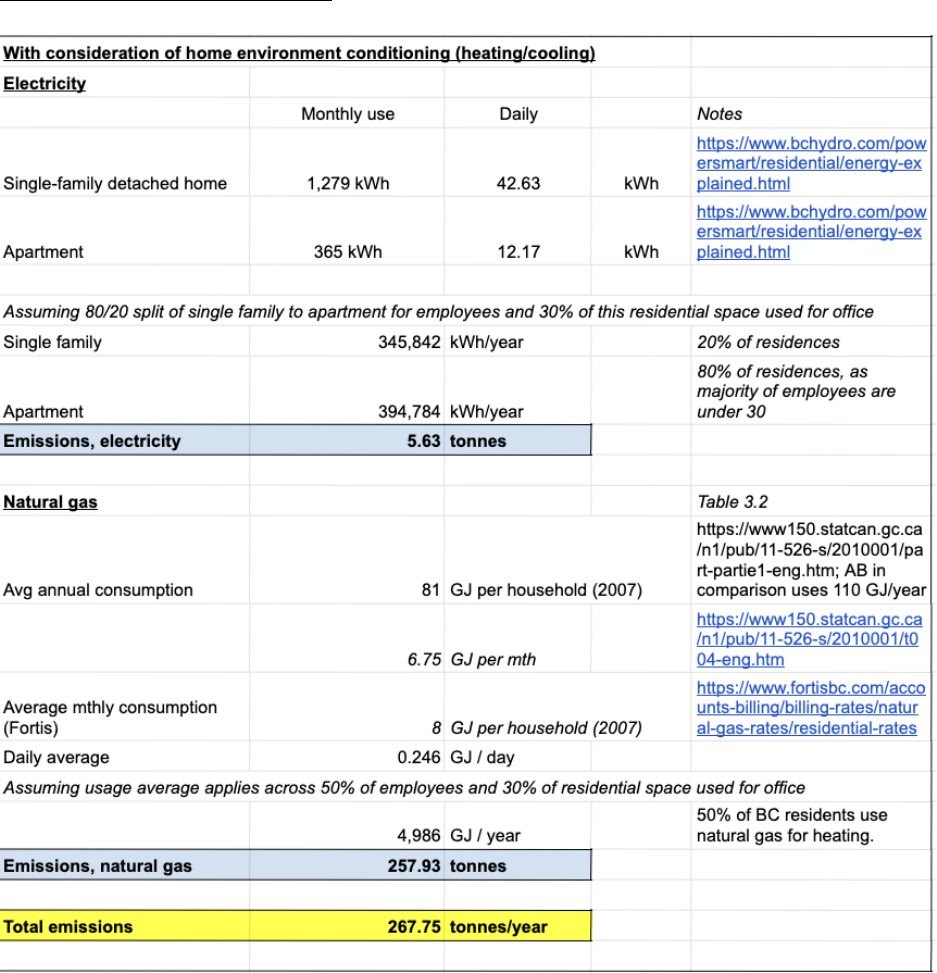
69
Remote Space Conditioning Estimate
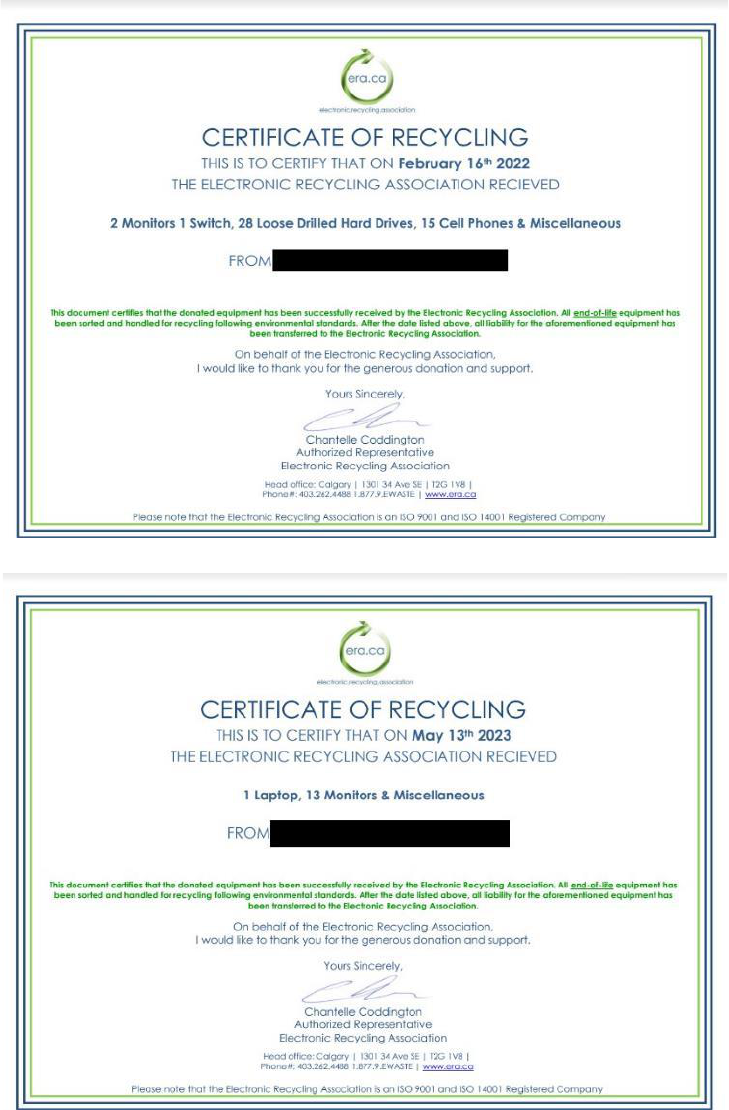
70
Appendix E: Certificates of Electronics
Recycling
