
AQA GCSE Physics Required Practicals
An independent variable is the variable that is changed or controlled in a scientific experiment to test the
effects on the dependent variable. A dependent variable is the variable being tested and measured in a
scientific experiment. The dependent variable is 'dependent' on the independent variable. Control
variables are all the other variables that could affect the dependent variable. They are kept the same
during the experiment to give a fair test of the independent variable.
Idependent
Dependent
Control
What is changed
What is measured
What is kept the same
Paper 1
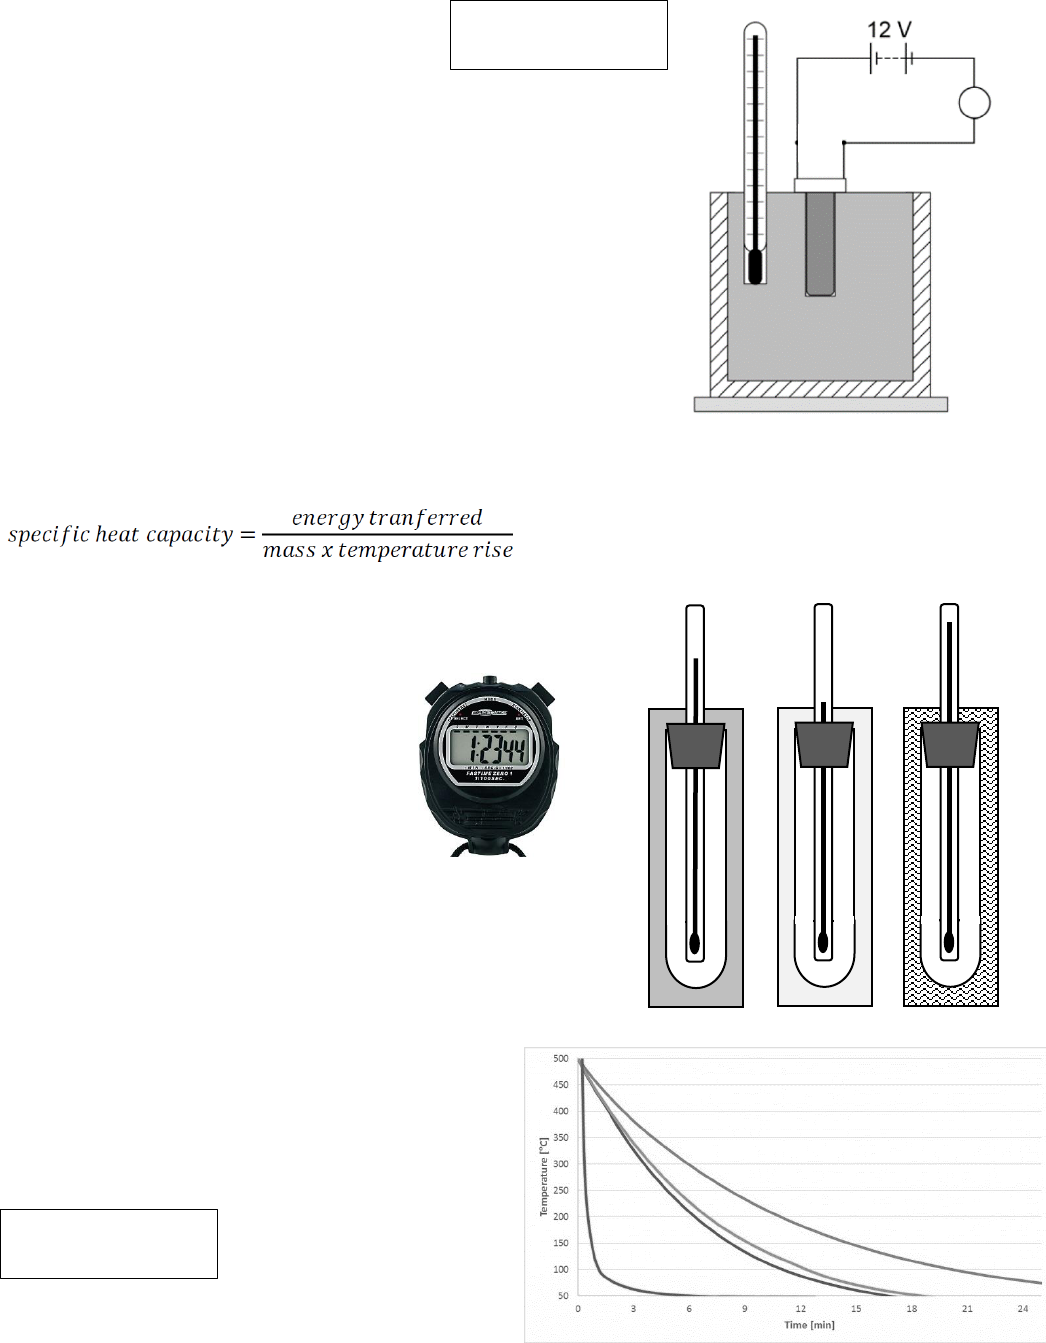
Specific Heat
Capacity
electrical energy input
temperature rise
mass of block
thickness of insulation
Thermal Insulation
type of insulation
temperature drop
volume of water
start temperature
Resistance 1
length of wire
electrical resistance
(V and I as R=V/I)
thickness of wire
material of wire
Resistance 2
series or parallel
electrical resistance
value of resistors
I-V characteristics
Bulb, Resistor, Diode
potential difference
current
component
rest of circuit
Density
object or material
mass and volume
density = m/v
gravity (stays the same
on its own)
Paper 2
Force and
Extension
force
extension
the spring
(gravity)
Acceleration 1
force
acceleration
mass
Acceleration 2
mass
acceleration
force
Waves (on a string)
frequency
wavelength
tension in string
mass of sting
Light
angle of incidence
and block material
angle of refraction
angle of reflection
colour of light
shape of block
Radiation and
Absorption
colour and texture
of surface
intensity of emitted IR
radiation
surface temperature
distance from surface
Repeatable: When a measurement is repeated there is little variation in the measured value.
Reproducible: When an experiment is done by someone else the findings are the same.
Anomaly: The result of a measurement that does not fit the pattern in the other results.
Resolution: The size of the divisions on a measuring instrument.
Range: The minimum to maximum values tested or measured.
Paper 1
Specific Heat Capacity
• metal block with two holes
• thermometer
• heater
• power supply
• insulation to wrap around the blocks
• joulemeter
• balance to determine the mass of the blocks
• heatproof mat
1. Measure the mass of the metal block with the balance
2. Zero the joule meter
3. Take the temperature of the block
4. Turn on the power supply
5. Heat by only around 10C to reduce heat losses
6. Turn off the supply and record the highest temperature reached
7. Record the electrical energy input from the joulemeter
Thermal Insulation
• boiling tubes and rack
• thermometer
• stopwatch
• kettle
• thermometers (in bungs)
• sheets of insulating material
1. Cover boiling tubes in different insulations
2. Add boiling water to tubes
3. Place thermometers in water
4. Make sure top is sealed to prevent evaporation
5. Wait for highest temperature reached
6. Record temperature as it falls at regular time
intervals
7. Repeat with different insulating materials
8. Plot graph of temperature against time
J
Safety:
Care with hot heater
Safety:
Care with hot water
Safety:
Care with hot wire
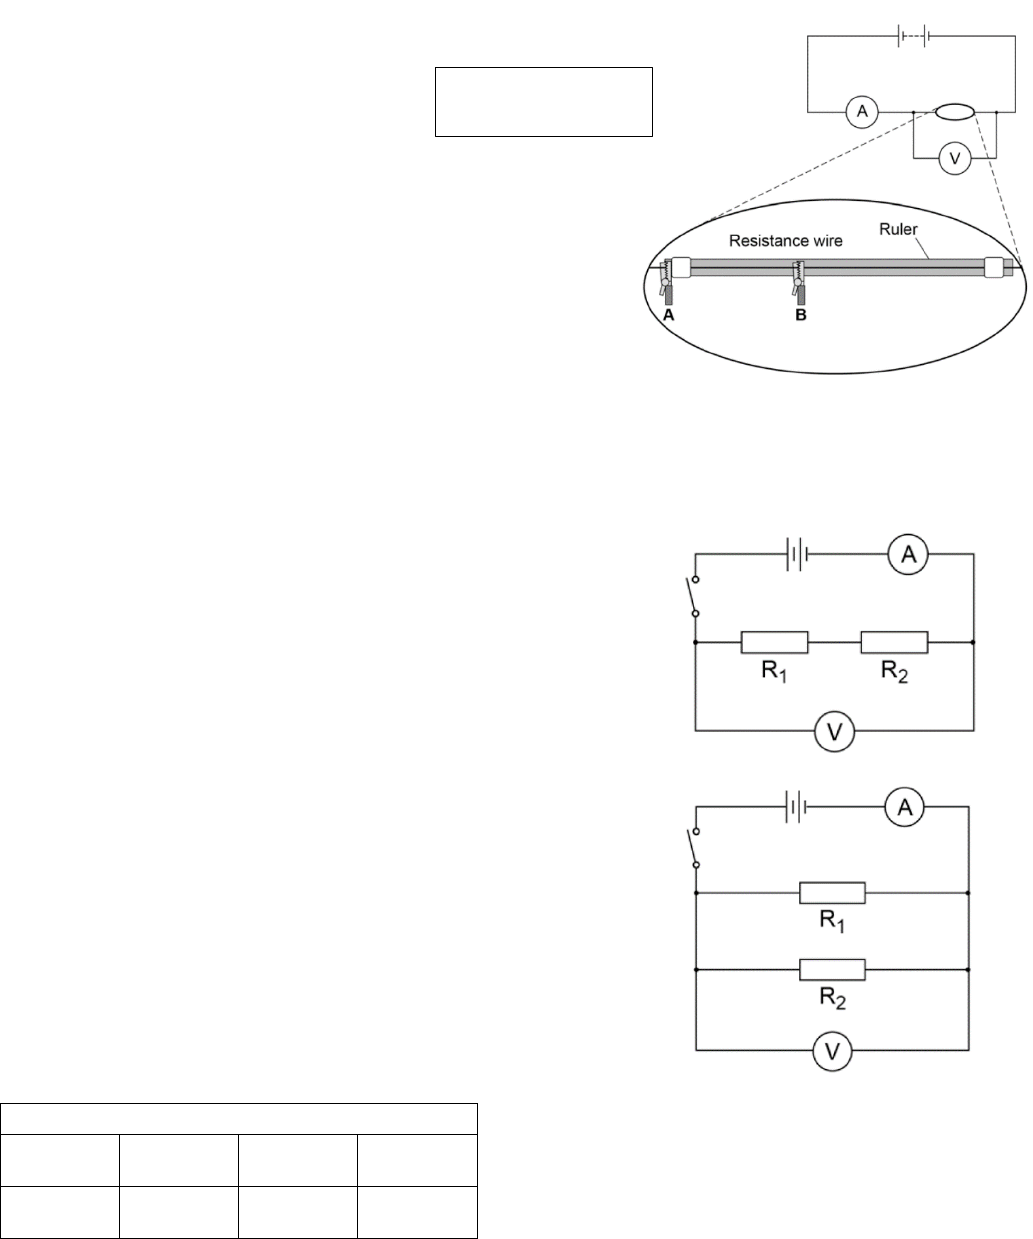
Electrical Resistance
Activity 1
• resistance wire on meter rule
• ammeter
• voltmeter
• power supply
• leads and crocodile clips
1. Connect up the circuit as in the diagram
2. The resistance wire is connected at points A and B
3. Keep A and B greater than 10cm to prevent the wire getting too hot
4. Measure the distance between A and B
5. Record the current and potential difference
6. Calculate the resistance using R=V/I
7. Increase distance between A and B and repeat
8. Plot a graph of length of wire against resistance
Activity 2
• a battery or suitable power supply
• a switch
• ammeter
• voltmeter
• crocodile clips
• two identical resistors
• connecting leads
1. Connect up the circuit as in the first diagram but with a single resistor
2. Record the current and potential difference
3. Calculate the resistance using R=V/I
4. Repeat for the second resistor
5. Connect up the first circuit with the resistors in series
6. Record the current and potential difference
7. Calculate the resistance using R=V/I
8. Connect up the second circuit with the resistors in parallel
9. Record the current and potential difference
10. Calculate the resistance using R=V/I
Sample results
Resistance in Ohms
Resistor 1
Resistor 2
Series
Parallel
10
10
20
5
Safety:
Care with hot component
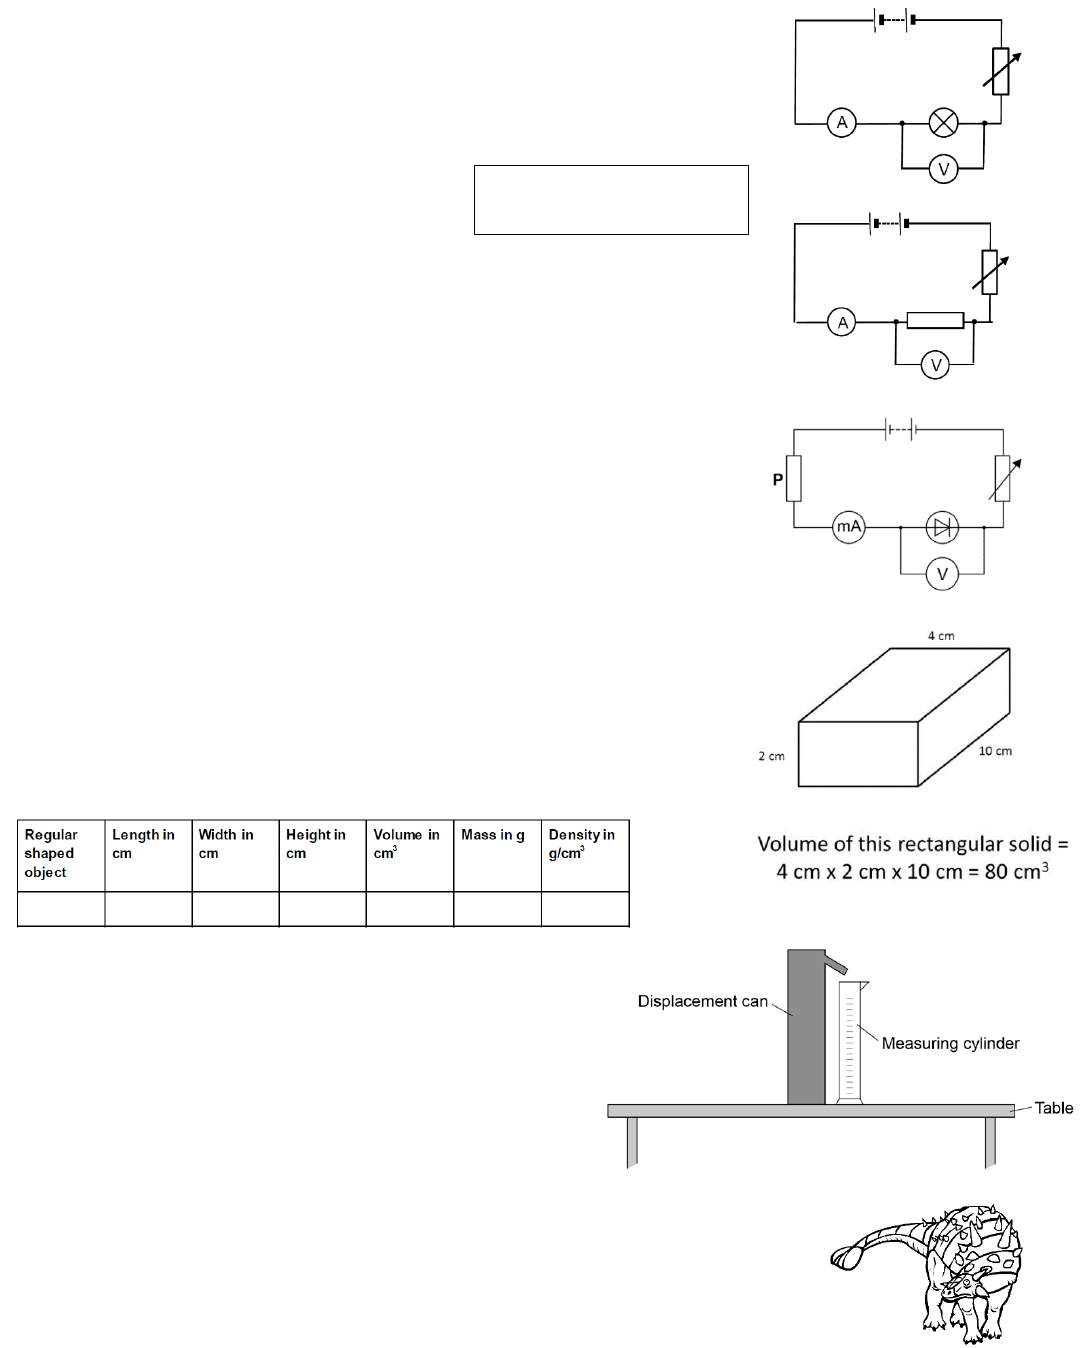
I-V Characteristics of a Filament Lamp, a Resistor and a Diode
• Power Supply or Battery Pack
• Leads
• Variable resistor (rheostat)
• Ammeter and Milliammeter (could be multimeter)
• Voltmeter (could be multimeter)
• Filament Lamp
• Resistor
• Diode and extra resistor P
1. Connect up the circuits as in the circuit diagrams
2. Use the variable resistor to alter the p.d. across the component
3. Record the p.d. and current.
4. Repeat with the component reversed for negative V and I values
5. For the diode add the restor P to prevent damage to the diode
6. For the diode use a milliammeter or the mA setting on a multimeter
7. For each component plot a graph of V against I
Density
Activity 1 A regularly shaped object
• 30 cm ruler in mm
• digital balance
• a selection of regularly shaped objects
1. Measure the length, width and height of the object using the ruler
2. Calculate the volume of the object using - volume = length x width x height
3. Measure the mass of the object using the balance
4. Calculate the density using - density = mass / volume
5. Repeat for the other regular objects
Activity 2 An irregularly shaped object
• a digital balance
• a displacement (eureka) can
• measuring cylinder
• a beaker of water and an extra empty beaker
• a selection of irregularly shaped objects
1. Fill eureka with water and allow excess water to drain
2. Place empty measuring cylinder under spout of can
3. Submerge object in can and collect displaced water
4. Record the volume of the displace water which is the volume of the object
5. Measure the mass of the object using the balance
6. Calculate the density using - density = mass / volume
7. Repeat for the other irregular objects
Activity 3 A liquid
Measure the volume of the liquid using a measuring cylinder and the mass by pouring it into a beaker on an
electronic balance that has been zeroed. The density is calculated in the same way as above.
Stack of
Safety:
Don’t drop masses on foot
Safety:
Eye protection
Paper 2
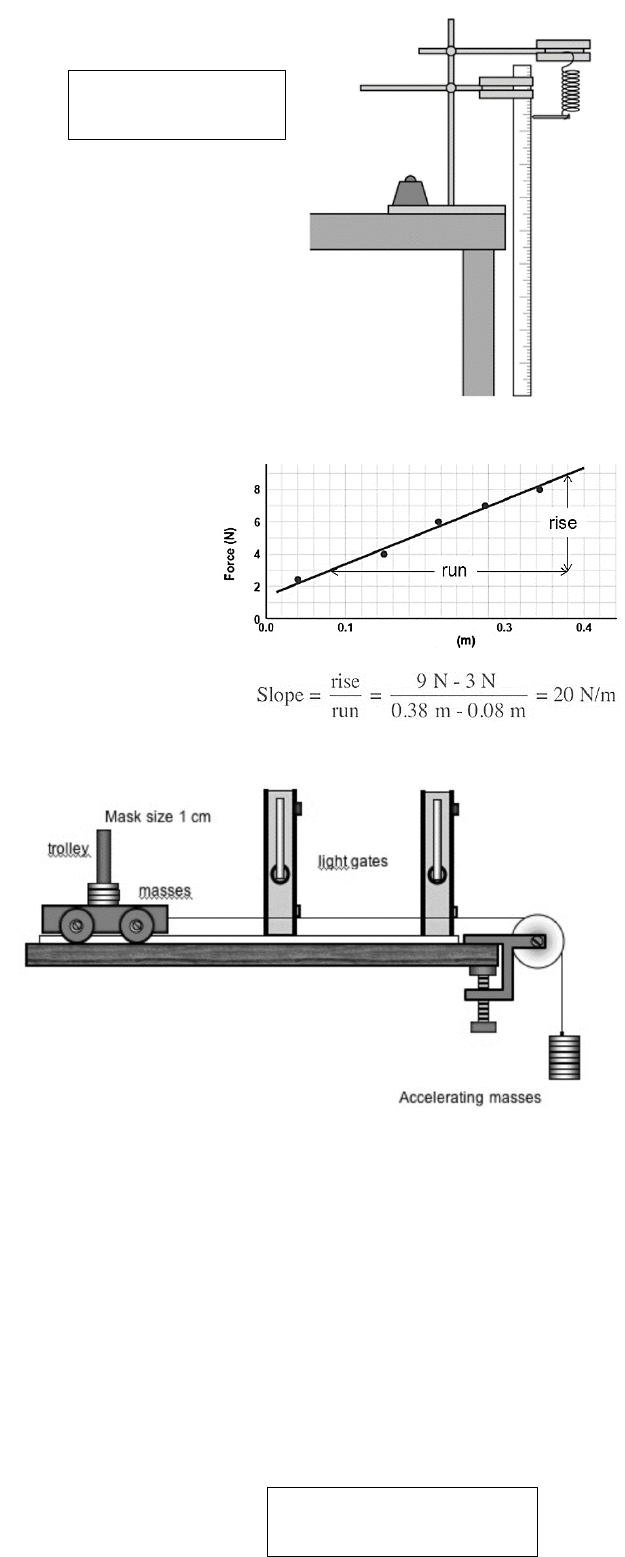
Force and Extension of a Spring
• spring
• metre ruler
• splint and tape to act as a pointer
• 10 N weights (or 0.1 kg masses and multiply by 9.8 to get weight)
• clamp stand
• clamps and bosses
• Weight or G-clamp to prevent the apparatus tipping over
• safety goggles in case the spring flies off
1. Set the apparatus up as in the diagram
2. Record the length of the unextended spring
3. Add a weight to the spring – the weight is the force on the spring
4. Record the new length of the spring
5. Add another mass and repeat
6. Subtract the original length of the spring from the lengths to
calculate the extension
7. Plot a graph of force against extension.
The gradient of the graph is the spring constant.
Acceleration
• trolley
• metre ruler
• pulley
• string
• stack of masses
• electronic balance
• light-gates and datalogger + laptop with timing software
1. Set up the equipment as in the diagram
2. Set the software to measure acceleration from gate A to B
3. Measure and enter the length of the card mask that cuts the light beams into the computer
4. Measure and enter the distance between the light gates into the computer
5. Measure the mass of the all the masses and trolley together
6. Start with one accelerating mass and the rest on the trolley
7. Let the mass accelerate the trolley and record the acceleration
8. Calculate the accelerating force by multiplying the accelerating mass by 9.8 N/kg
9. Move a mass from the trolley to the stack of masses (this keeps the total mass constant) and repeat.
10. Repeat until all the masses are on the stack
11. Plot a graph of force against acceleration.
The experiment can be repeated but this time keep the accelerating force constant by using the same number of
masses on the stack. The mass being accelerated is then changed by adding masses to the trolley. Then plot a graph
of acceleration against mass.
extension
Safety:
Don’t drop masses on foot
Safety:
Care with electricity + water
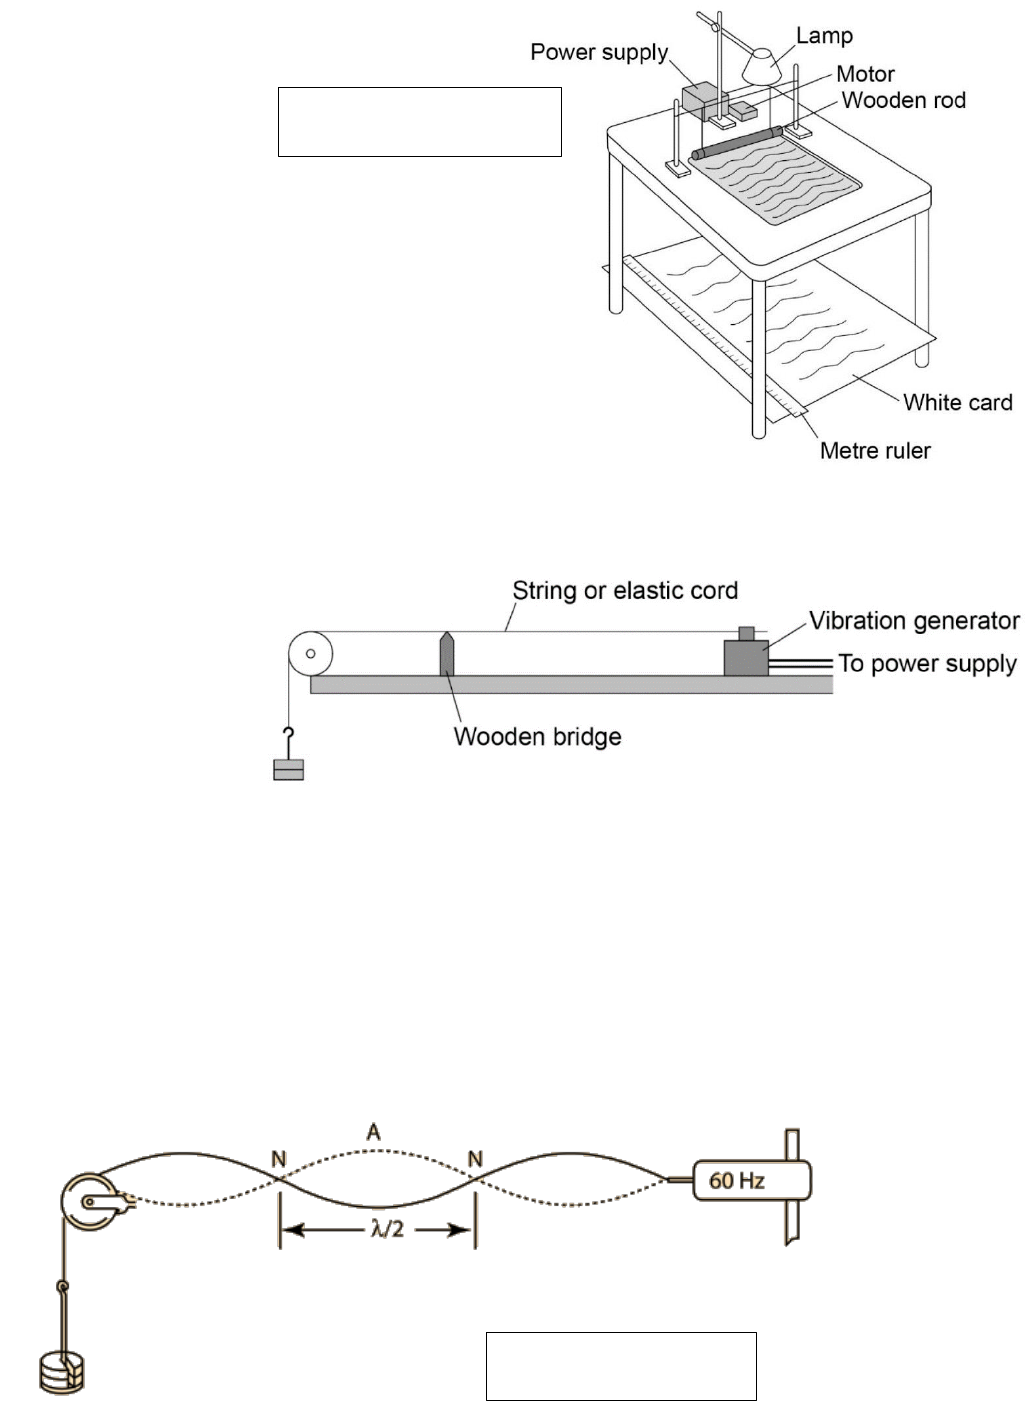
Waves
Activity 1 Observing water waves in a ripple tank
• ripple tank plus accessories
• low-voltage power supply
• lamp
• metre ruler
1. Set up the equipment as in the diagram
2. Put about 5mm depth of water in the ripple tank
3. Measure and record the depth of water using a meter rule
4. Turn on the motor
5. Measure the time for ten waves to pass
6. Divide the time by 10 to get the wave period
7. Calculate the frequency using - frequency = 1/period
8. Measure the length of 6 to 8 waves and divide to get the wavelength.
9. Calculate the wave speed using - wave speed = frequency x wavelength
10. Add more water to the tank and repeat
11. Plot a graph of wave speed against depth of water
Activity 2 Observing waves in a solid
• vibration generator
• signal generator
• string
• set of masses and hanger
• wooden bridge
• a pulley on a clamp
1. Switch on the vibration generator. The string should start to vibrate.
2. To see a clear wave pattern, adjust the frequency on the signal generator to get a standing wave pattern.
3. The waves should look like they are not moving.
4. Use a metre ruler to measure across as many half wavelengths as possible (a half wavelength is one loop).
5. Then divide the total length by the number of half waves. Multiplying this by two will give the wavelength.
6. The frequency of the wave is the frequency of the signal generator.
7. Calculate the speed of the wave using the equation - wave speed = frequency × wavelength
8. Repeat with different standing wave patterns.
Safety:
Care with hot ray box
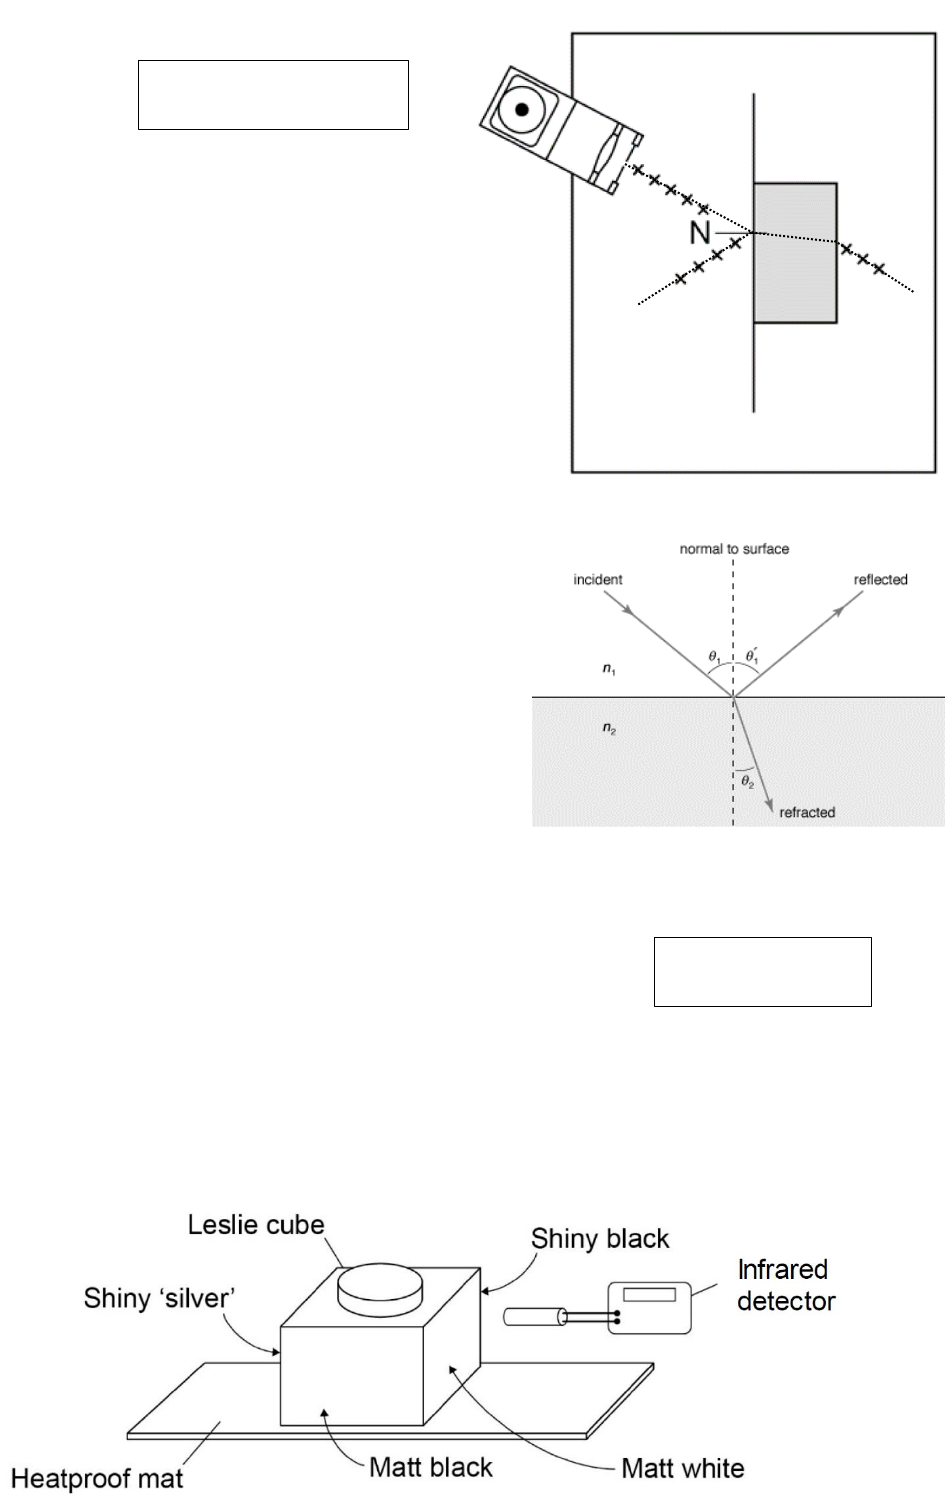
Light
• ray box
• power supply
• a slit for ray box to make a narrow ray
• glass block + Perspex block
• 30 cm ruler
• protractor
• sheets of plain A3 paper
1. Place glass block on the paper and draw around it.
2. Use protractor to draw a normal line to the block
3. Aim a ray of light at an angle to the normal where it meets the block
4. Mark the path of the rays using crosses
5. Include both the refracted and reflected rays. Then turn off ray box.
6. Remove the block and use the crosses as a guide to mark the path of the rays.
7. Use a protractor to measure and record:
a) the angle of incidence
b) the angle of reflection
c) the angle of refraction
8. Repeat with a block made from a different material keeping the
angle in incidence the same.
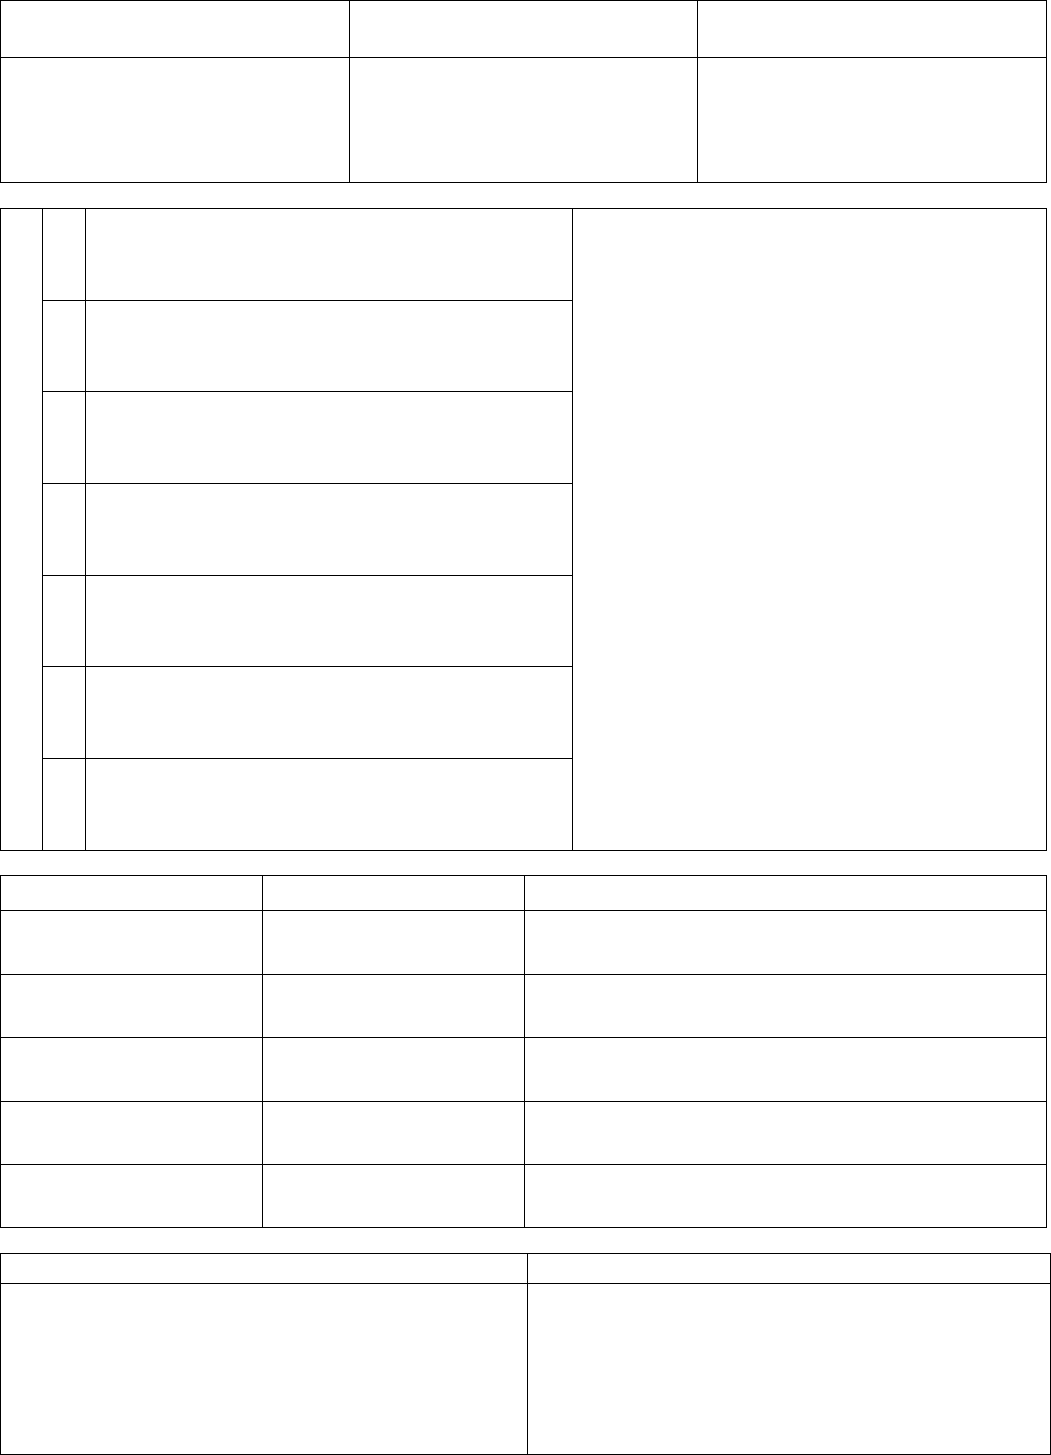
Radiation and Absorption
• Leslie cube
• kettle
• infrared detector or thermal imaging camera
• heat-proof mat
1. Put the Leslie cube onto the heat-proof mat
2. Fill the cube with very hot water and put the lid on the cube
3. Use the detector or camera to measure the amount of infrared radiated from each surface
4. Make sure that the detector is the same distance from each surface.
5. Draw a chart to show the amount of infrared radiated by each type of surface
Safety:
Care with hot water
Make your own summary notes for each practical based on this template
Independent Variable(s)
The one you vary.
Dependent Variable(s)
The one you measure.
Control Variables
Kept the same for a fair test.
Method
Step 1
Diagram of set up.
Step 2
Step 3
Step 4
Step 5
Step 6
Step 7
Measurement
Instrument Used
How Instrument is used / How to minimise errors
Equations / Calculations used to process results
Safety Precautions
