
Buyingvs.RentingaHome:AFinancial
Analysis
Andrew Fraser
Markus Linke
Russ Reilly
Justin Rosales
Daniel Rossman
Abbey Staffnik
Mohammed Tarin
Berman Tijerino
Robert Wellman
Prepared in partial fulfillment requirements in CEE 300 – Engineering Business Practices
Dr. Thomas Seager, Instructor
Arizona State University
13 August, 2012

ExecutiveSummary
Salman Khan said, “The single most important video [series] anyone can watch” is his
presentation on renting vs. buying a home. Khan explains that, for a given year, it may be better
to rent than it is to buy, assuming the houses are similar. However, Khan further explains how
the decision to buy or rent could be dominated by the appreciation and depreciation in the value
of a house. The housing market is unpredictable without making a few assumptions. The
methods used to analyze buying vs. renting were to study a few key data sources. The US
Census Bureau publishes median home asking prices for four regions of the US at
www.census.gov. The S&P/Case-Shiller Home Price Index presents data on twenty different
metro home areas, including Phoenix, AZ. Lastly, www.zillow.com publishes sales data and
market estimates for individual houses. This study compares house prices in four different areas
in metropolitan Phoenix: central Phoenix, Tempe, Scottsdale, and West Phoenix/Glendale.
Using a spreadsheet downloadable from KhanAcademy.org to reduce expected cash flow
forecasts to net present value, this analysis recommends buying rather than renting, given an
assumed forecast of little to no price appreciation expected in the Phoenix housing market.
Table of Contents
Introduction………………………….………………………………………………………….....1
Problem Statement…………………………………………………………………………….......2
Assumptions……………................................................................................................................3
Methods…………………………….………………………………………………………...…...6
Discussion and Analysis………………………………...……………………………………….14
Recommendation..……………………………………………………………………………….18
References……………………………………………………………………………………….19
Appendix………………………………………………………………………………………...20
List of figures
Figure 1.0 – Cash flow diagram for buying a home….……………………………….……...…..2
Figure 1.1 – Cash flow diagram for renting a home ………...…………………….……...…...…3
Figure 2.0 – Median asking rents and sales prices.…………………………………….……...….5
Figure 3.0 – Trend of US home prices…………….…………………………………….……......6
Figure 4.0 – Median sales price of new US homes…………………....…………………..…...…7
Figure 5.0 – Phoenix S&P/Case-Shiller Home Price Index……………………………..……......7
Figure 6.0 – Average home value. ……………………………..……............................................8
Figure 6.1 – Average area of homes in studied areas……………………………..……................9
Figure 6.2 – Average payments……………………………..…….................................................9
Figure 7.0 – Khan’s modified Excel spreadsheet………...……………………………..…….....13
Figure 8.0 – Buy vs. Rent in central Phoenix, 30 year mortgage……………………....……......15
Figure 8.1 – Buy vs. Rent in Scottsdale, 5/1 ARM…...……………………………..…..……....16
Figure 9.0 – Decision chart……..….…...……………………………..…..……...........................17
List of tables
Table 1.0 – Average mortgage rates……………………………………………………………...4
Table 2.0 – Home types and amount of homes studied..………………………………………....8
Table 3.0 – Variable list for sample calculations………………………………………………...11
Table A.CP – Central Phoenix homes….………………………………………………………..20
Table A.T – Tempe homes….………………………………..………………………………….20
Table A.S – Scottsdale homes….………………………………….…………………………….21
Table A.WP – West Phoenix/Glendale homes….………………………….……………………21
1
Introduction
The question asked for this report was “Which is cheaper—renting or buying?” Taking
into account the current market conditions of real estate in 2012 an in depth analysis was made
comparing rental properties to homes for sale in four metropolitan areas of Phoenix, Arizona.
The areas were as follows: central Phoenix, Tempe, Scottsdale and West Phoenix/Glendale.
Renters have landlords who charge a monthly fee for staying in their home. The rental
agreement is a binding contract between the renter and the landlord, so renters must make
periodic payments under the agreement to occupy the home. When renting, the landlord usually
carries the cost of maintenance and repair to the building and property, which can be substantial
when considering how much it would cost to replace an air conditioner. This is a great benefit to
the renter since it is unnecessary to set money aside for maintenance and repair. It is advisable to
carry renters insurance on the valuables in the home. Price of rent can fluctuate over time—they
can go up and down. Renters have no control over the rent or how much it can change over time.
Often times, rental agreements limit on how many changes or improvements are allowed to the
home. Usually a security deposit is required to rent a home to protect the landlord from having to
make improvements or repairs from damages the renter caused. This security deposit will be
returned to the renter upon leaving the home in acceptable shape. An advantage of renting vs.
buying is the flexibility of movement. If for whatever reason renters have to move, then renters
can simply pack up their belongings and move out without having to sell the home. Another
advantage is that renters do not have to worry about depreciation of the house.
If homeowners cannot buy the house outright, then they will most likely have a mortgage.
The mortgage is a loan secured by property that requires the borrower to make payments to
whoever holds the title of the home. This payment is most likely made up of four parts: the
interest on the outstanding loan, principal to pay down the balance of the loan, property taxes,
and homeowners insurance. Property taxes are what the responsible municipality charges based
on the assessed value of the property and dwelling. Homeowners insurance is required as part of
the loan agreement to ensure there is money to pay for replacement or repair in the case of loss.
The mortgage can be in the form of a fixed interest rate with payments spread over 15 to 40
years, depending on the signed agreement. Fixed rate loans are also known as conventional
loans. Another option is the Adjustable-Rate Mortgage (ARM), which was very popular during
the last housing boom. An ARM will start homeowners out with a lower initial interest rate than
a conventional loan but can be adjusted periodically depending if it is tied to the London
Interbank offered Rate, or LIBOR (“Definitions”). A Federal Housing Administration (FHA)
loan does not require as stringent credit qualification or as a large as a down payment when
compared to a conventional loan. As a homeowner with a fixed mortgage, the payments of
principal and interest will remain the same for the term of the loan; however the portion
2
consisting of property taxes and homeowners insurance can fluctuate with time (“What’s in a
Mortgage Payment?”).
A benefit of having a mortgage payment is that the paid interest is tax deductible
(“Renting vs. Buying a home”). This should only be small factor when deciding to buy a home.
The biggest benefit of homeownership is the possibility of the home’s appreciation, which means
the home is most likely worth more than the original purchase when homeowners decide to sell.
With the appreciation and the paying down of the principal, there should be a net gain over the
purchase price. The downfall is when the home’s value depreciates, which means the home is
worth less than what the original purchase. Homeowners are responsible for maintaining and
repairing the building and property, so important to have money in savings for unexpected
repairs.
ProblemStatement:Isitmoreeconomicaltobuyorrentahouseduring
the2012ThirdQuarter?
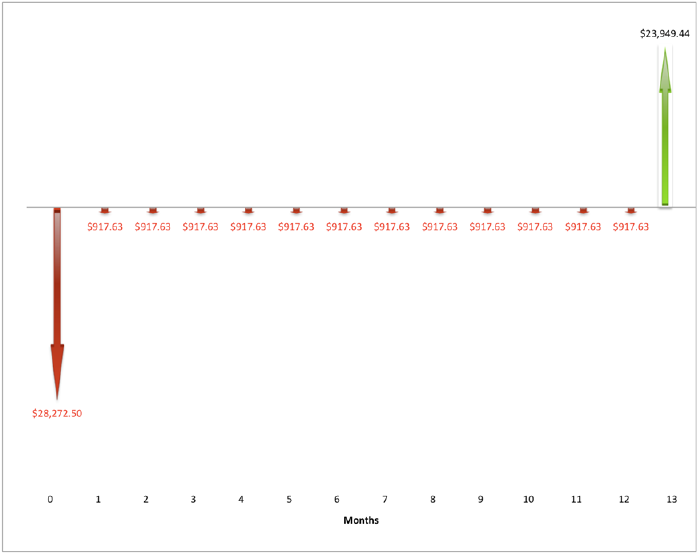
The following figures show cash flow diagrams for buying and renting a home.
Figure 1.0 – Simple cash flow diagram for buying a home.
Figure 1.0 reflects a one year ownership of a house with a purchase price of $131,500,
20% down payment, 15 year fixed mortgage rate at 3.09%, 0% appreciation, and assumes the
home is sold at the end of the year with a 6% of the sale going to the realtor.
3
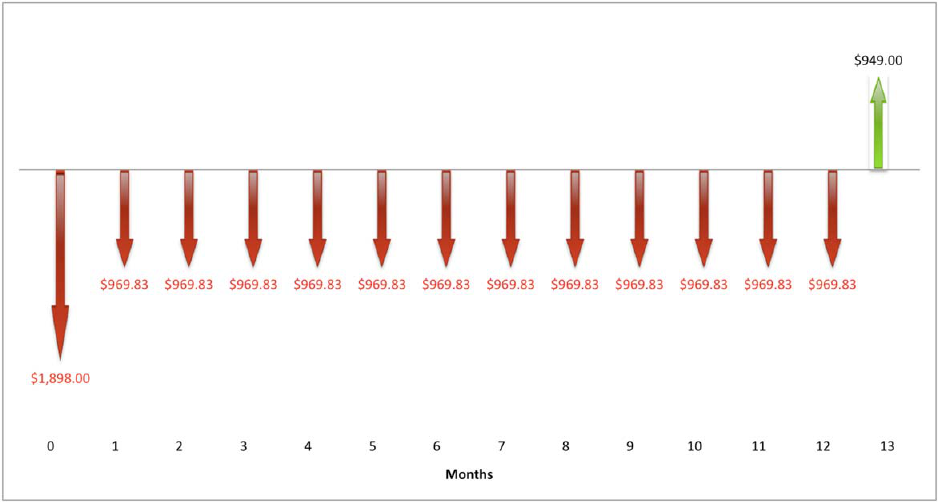
Figure 1.1 – Simple cash flow diagram for renting a home.
Figure 1.1 reflects a one year rental agreement with a monthly rent cost, which includes
renters insurance, of $949, a security deposit of $949, and assumes a full refund of the security
deposit at the end of the rental agreement.
Assumptions
In order to compare buying vs. renting a home a few assumptions must first be made
about the prospective buyer/renter. First and foremost, the client is looking for a place to live
and intends to live there for at least 5 years. This excludes any client looking at buying a house
as an investment rental property. Secondly, it is assumed that the client is in a position to buy a
home. That is to say, they have enough cash on hand for a 20% down payment and have a credit
score and debt situation that guarantees them a home loan. This client also has a steady stream of
income that would qualify them for a first mortgage. This analysis considers a client with secure
income, rather than a client that has reason to expect they may lost their job and face home
foreclosure due to an inability to make regular mortgage payments..
The report will only look at single-family detached homes. Apartments, duplexes,
condominiums, mobile homes, and loft spaces have all been excluded. The analysis will only
compare homes that are in move-in ready condition. For the sake of this report, move-in ready is
defined as a home that does not require any additional work for prospective buyer/renter. The
house does not have any structural deficiencies, does not require painting inside or out, the floors
and/or carpet are in good shape and do not need replacement, the appliances and plumbing are in
good working order, and the yard has been maintained. There are a number of homes on the

4
market that are available at a substantial discount but require additional improvements to make
the house livable. These have excluded because it is difficult to find rental equivalence and/or
estimate the cost of future renovations on these houses.
The report is specific to the greater Phoenix area, focusing on four areas: central Phoenix,
West Phoenix and Glendale, Scottsdale, and Tempe. In order to get a representation of each of
each of these areas, sale and rental properties have been analyzed using two, three and four
bedroom homes as the base categories provided they meet the move-in ready criteria listed
above.
There are additional costs associated with buying a home and those will be defined using
the following rates. Mortgage interest rate, maintenance, closing costs, property tax,
homeowners insurance, security deposits, renters insurance, appreciation, and depreciation.
While mortgage rates vary from place to place, however this report will use the average
rates posted by the Mortgage Bankers Association for August 2012, which is shown in Table 1.0.
Maintenance costs range from 1-2% of the home’s value, and this report will use an average
maintenance cost of 1.5% of the home’s value (“Budgeting for Home Maintenance and Repair
Costs”).
Table 1.0 – Average mortgage rates for August 2012
(http://www.mortgagenewsdaily.com/mortgage_rates/charts.asp?Y=2012&M=8)
30 Year Fixed 3.75%
15 Year Fixed 3.09%
5/1 ARM 2.73%
Closing costs also represent additional expenses typically paid by the purchaser. These
costs include “loan origination fees, discount points, appraisal fees, title searches, title insurance,
surveys, taxes, deed-recording fees, and credit report charges” among others (“Closing Costs”).
Based on research conducted in 2010, closing costs in Arizona average 1.5% of the
homes selling price. This number will be used for all calculations in this report and is paid at the
same time as the purchase of the home (“Closing costs averages comparison: Arizona”).
Property tax rates vary greatly depending on location. The tax rate used in this report is
based on the average rate for Maricopa County for a home’s estimated fair market value, which
is 0.55%. For this report, property taxes are paid at the end of the year (“Maricopa County
Average Property Tax”).
As of March 2012, the average Arizona homeowners insurance is $617.00 per year, or
$51.42 per month (“Arizona Homeowners Insurance Quotes”). The main components of
homeowners insurance are the dwelling, contents or personal property, and loss of use. Some
5
other components of homeowners insurance are other structures, such as garages or sheds, and
medical payments. The $51.42 per month cost is assumed throughout the analysis.
Security deposit is a refundable deposit paid buy a renter up front to cover any potential
damage to the home. These can vary depending on the house and landlord, but for this report
security deposits will be equal to one month’s rent, and the renter receives the entire security
deposit at the end of the agreement.
The average Arizona renters insurance is about $200.00 per year, or $16.67 per month
(“Arizona Renters Insurance”). Renters insurance can compensate for the replacement cost of
damaged personal property. The $16.67 per month cost is assumed throughout the analysis.
It is assumed that the prospective renters would be required to pay for all utilities on their
own. Therefore, monthly utility costs are the same for a renter or buyer, and thus have been
excluded from this report. Additionally, only 20% of homes in the United States belong to
homeowners associations and their fees vary greatly, so they have been excluded from this report
(“The Horror of Homeowners’ Associations”).
Another assumption made throughout this analysis is the homeowner sells the home after
a certain time. The time horizons assumed throughout ownership are one, three, five, ten,
fifteen, twenty, twenty-five, and thirty years. Unlike when the renter receives the entire security
deposit at the end of the agreement, the seller does not receive the entire down payment when the
home is sold because the realtor collects 6% commission (“3 ways to pay lower real-estate
commissions”).
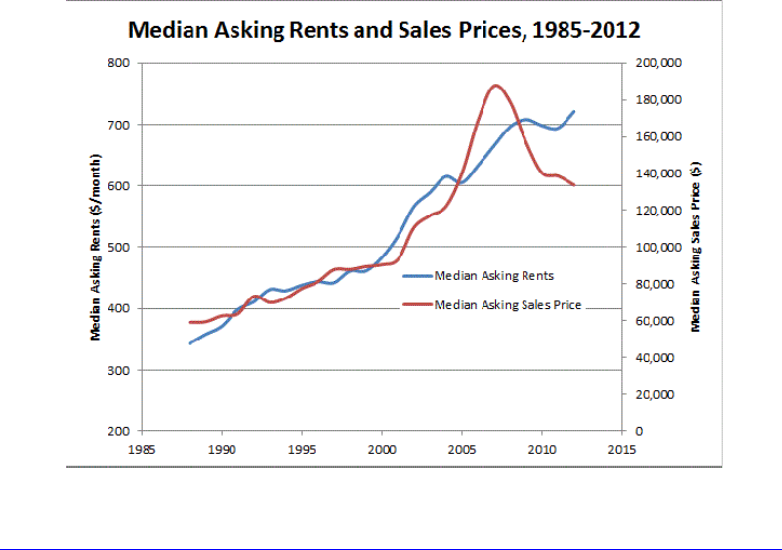
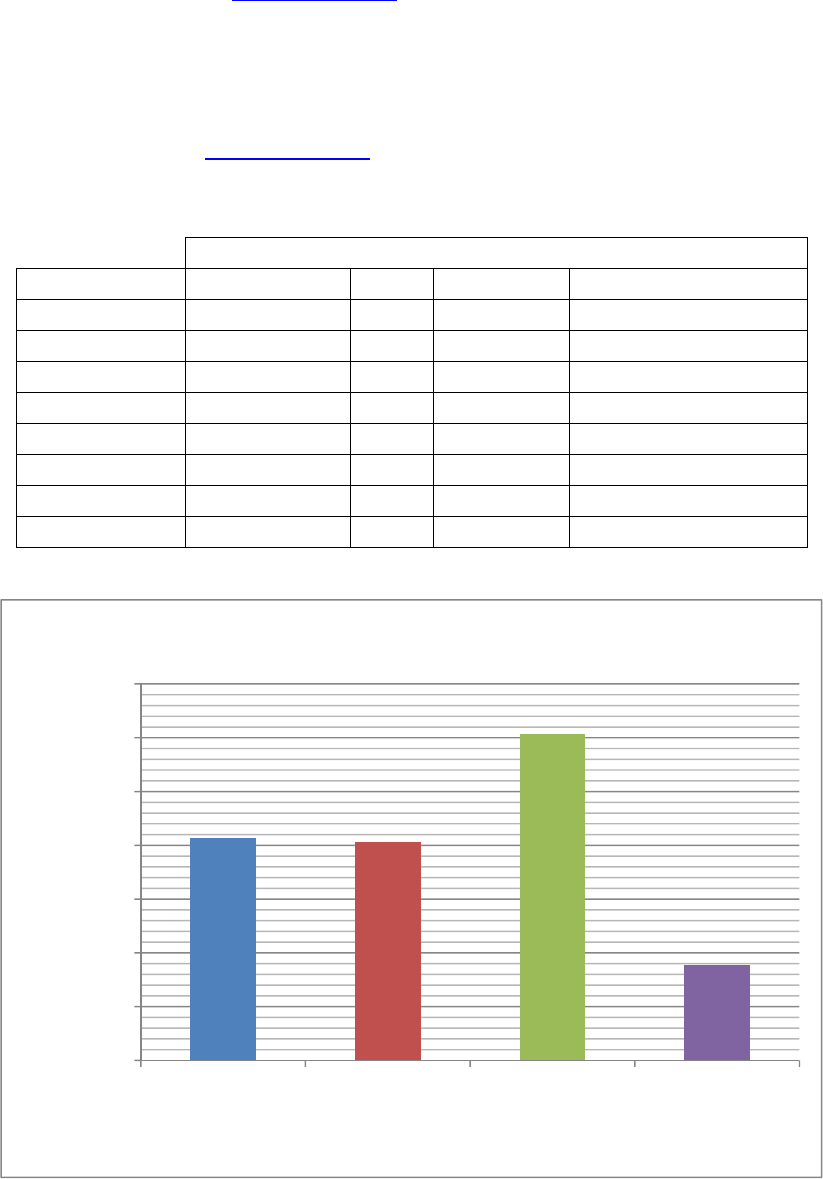
Figure 2.0 – Median asking rents and sales prices
(http://sustainableengineeringsystems.com/2012/07/24/renting-vs-buying-a-home/).
6
Figure 2.0 compares median renting price and median sales price of homes. The figure
shows a steady increase of renting price and a drop of home price in recent years. Since renting
and buying prices have been trending in opposite directions, the “Assumed rental inflation” will
be different from “Assumed annual appreciation” in the modified Khan spreadsheet. The
“Assumed rental inflation” will remain positive, while the “Assumed annual appreciation” will
fluctuate between positive and negative values, which represent appreciation and depreciation in
the housing market. Further detail of the modified Khan spreadsheet is given in the Methods
section.
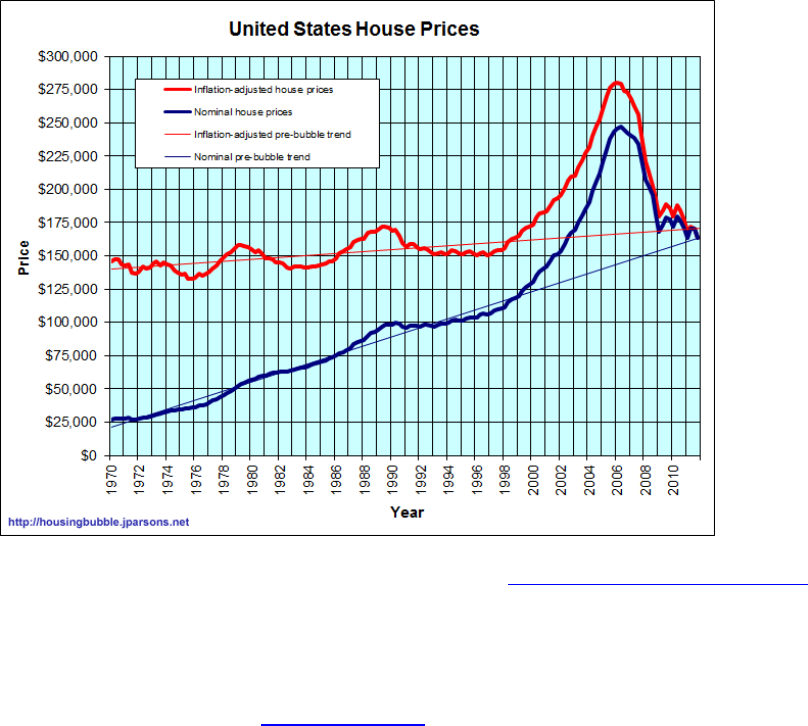
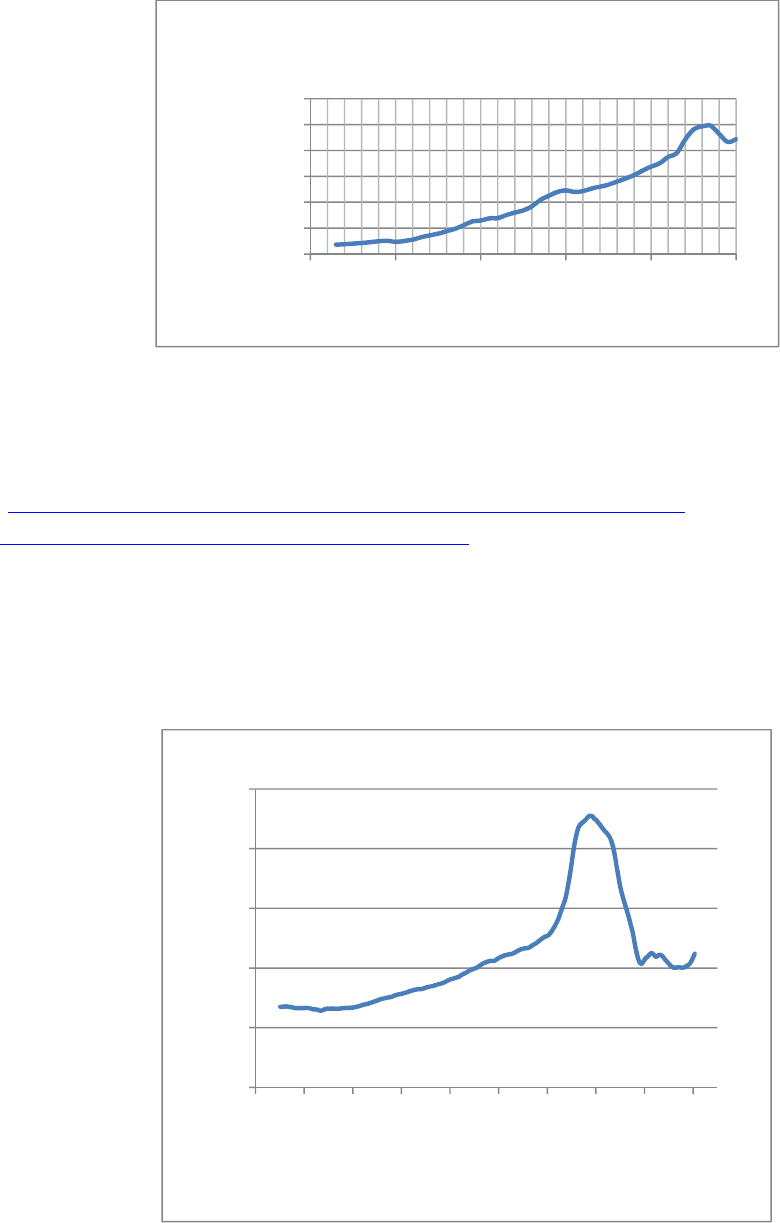
The crux of this study is the appreciation or depreciation of a home’s value. Figure 3.0
shows the trend of home prices in the United States. The positive trend lines indicate there is an
overall upward trend in home asking prices.
Figure 3.0 – Trend of United States house prices from 1970 to 2012 (http://jparsons.net/housingbubble/).
Methods
There were a few key data sources used throughout this study. The first key data source
was the United States Census Bureau (www.census.gov), which focuses on four regions—West,
Midwest, Northeast, and South. This analysis uses the US Census Bureau’s collected data on the
median price of new homes sold in the four regions. The median price was used to avoid
studying homes that were underpriced or overpriced. Figure 4.0 shows the median sale prices of
new homes from 1963 to 2010.
7
Figure 4.0 – The median sales price of new US homes in four regions (“Median and Average
Sales Prices of New Homes Sold in United States”).
Another website used was the S&P/Case-Shiller Home Price Index
(http://www.standardandpoors.com/indices/sp-case-shiller-home-price-
indices/en/us/?indexId=spusa-cashpidff--p-us----). The S&P/Case-Shiller Home Price Index
focused on twenty metro areas, which shrunk the housing market. Phoenix is one of the metro
areas, and Figure 5.0 shows the Home Price Index trend from 1989 to 2012. Higher Home Price
Indices suggest the affordability of homes. Homes are easier to purchase when the Home Price
Index is low and harder to purchase when the Home Price Index is high. From Figure 5.0,
homes are more affordable in the past few years, but were not as affordable during 2005 – 2007.
Figure 5.0 – The S&P/Case-Shiller Home Price Index from January 1989 to May 2012.
$0
$50,000
$100,000
$150,000
$200,000
$250,000
$300,000
1960 1970 1980 1990 2000 2010
Price($)
Year
MedianSalesPriceofNewUSHomesinfour
regions
0.00
50.00
100.00
150.00
200.00
250.00
8/11/1987
5/7/1990
1/31/1993
10/28/1995
7/24/1998
4/19/2001
1/14/2004
10/10/2006
7/6/2009
4/1/2012
HomePriceIndex
Date
PhoenixS&P/Case‐ShillerHomePriceIndex
8
The final website was www.zillow.com, which allows anyone to look up the value of any
home in the United States. This website focused on individual homes in four different areas—
central Phoenix, Tempe, Scottsdale, and West Phoenix/Glendale. A range of home types
determined the search criteria in Zillow and information was gathered for three of each home
type. Table 2.0 shows the range of home types studied using Zillow. Figures 6.0 – 6.2 show the
information obtained from www.zillow.com in all four areas.
Table 2.0 – The home types and amount of homes studied in Zillow
Numberofhomesstudiedinarea
HomeType CentralPhoenix Tempe Scottsdale WestPhoenix/Glendale
2bed,1bath 3 3 0 3
2bed,2bath 0 0 2 0
2bed,2.5bath 0 0 1 0
3bed,2bath 3 3 3 3
4bed,2bath 0 2 0 1
4bed,2.5bath 3 1 0 2
4bed,3bath 0 0 2 0
4bed,3.5bath 0 0 1 0
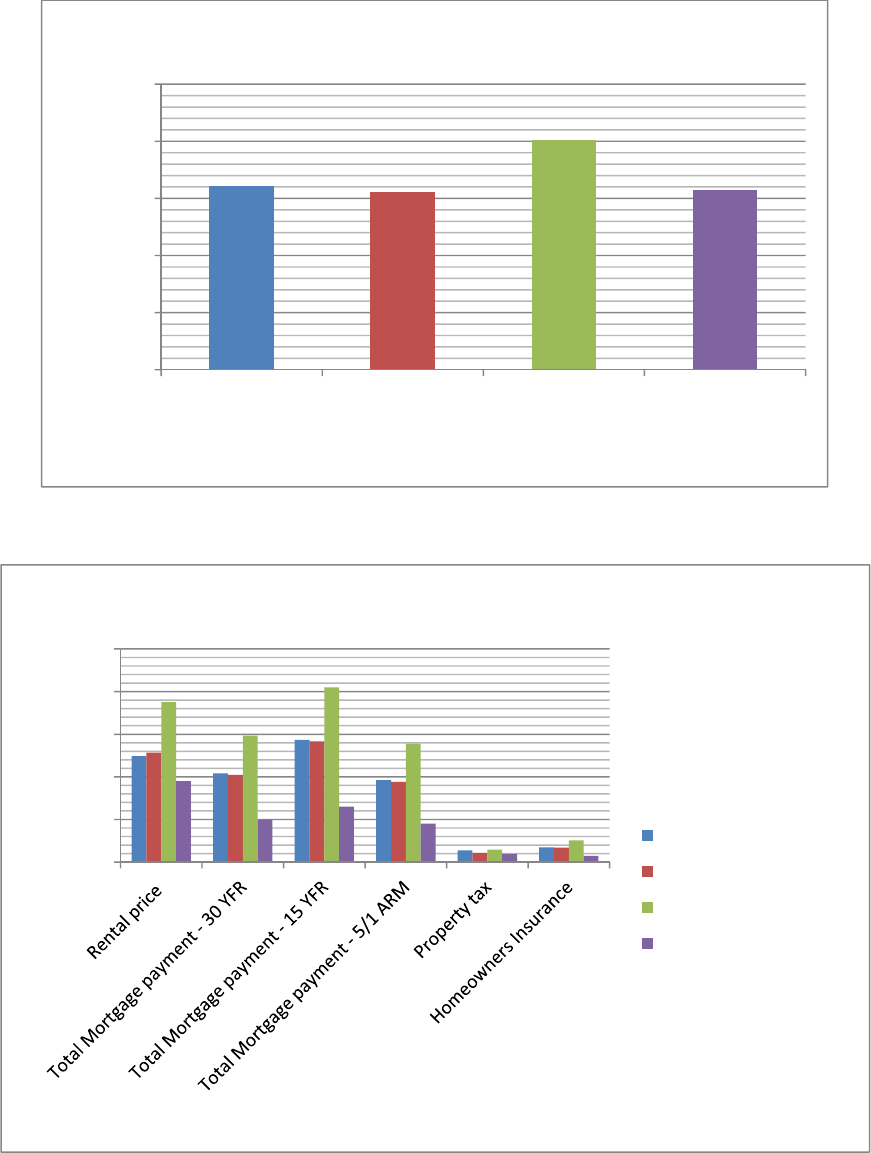
Figure 6.0 – Average home value
0
50,000
100,000
150,000
200,000
250,000
300,000
350,000
CentralPhoenix Tempe Scottsdale West
Phoenix/Glendale
Value($)
Areastudied
Averagehomevalue
9
Figure 6.1 – Average area (ft
2
) of homes
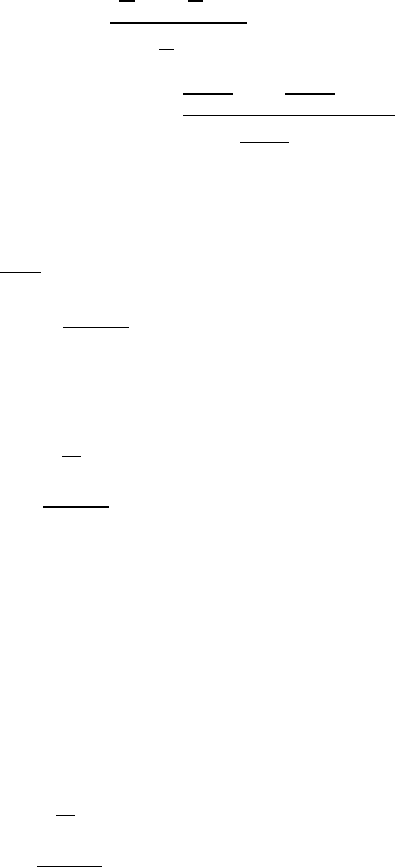
Figure 6.2– Average payments of homes
0
500
1,000
1,500
2,000
2,500
CentralPhoenix Tempe Scottsdale West
Phoenix/Glendale
Area(ft^2)
Areastudied
Averageareaofhomes
0
500
1,000
1,500
2,000
2,500
Payment($/month)
Paymenttype
Averagepaymentspermonth
CentralPhoenix
Tempe
Scottsdale
WestPhoenix/Glendale

10
Salman Khan’s video series, “Renting vs. Buying a home,” includes an extremely useful
Excel spreadsheet that was used in this analysis. Figure 7.0 shows a screenshot of the modified
version of Khan’s “buyrent” spreadsheet with the calculated averages and assumptions taken
from Table A.CP – Central Phoenix homes, which is found in the Appendix section. The
highlighted values are the important ones in the spreadsheet, and these values were manipulated
to test different scenarios. In Figure 7.0, a 30 year fixed mortgage rate of 3.75% was used per
Table 1.0. The assumed property tax rate of 0.55%, annual homeowners and renters insurance,
annual maintenance costs of 1.5% of the home’s value, marginal income tax rate, annual cash
return due to money saved by renting, and negligible homeowners association fee were also
assumed from online research. In Khan’s video, he assumes a general inflation rate of 2%,
which is what Figure 7.0 shows.
The “Assumed annual appreciation” and “Assumed rental price inflation” are theoretical
values because it is impossible to predict whether homes will appreciate or depreciate. As
mentioned in the Assumptions section, these two values will be different based on Figure 2.0.
Negative values in those cells indicate depreciation, and positive values indicate appreciation.
Figure 7.0 shows negative values to indicate buying can still be better than renting even though
the home depreciates. The time horizon and mortgage rate are important factors that determine
when buying is no longer better than renting. Khan’s “buyrent” spreadsheet is available to
download at http://www.khanacademy.org/downloads/buyrent.xls, and individuals can follow
the same process outlined in Figure 7.0.
As was previously stated, there was a wide range of assumed housing and finance
variables that were used to complete the report. Assumptions that are in the form of numerical
values (i.e. interest rates, property taxes, inflation) are used to calculate important components
that help shape an answer to the rent versus buy question. Khan’s “buyrent” spreadsheet stores
and calculates these values so that they could be easily compared and analyzed. The following
analysis shows the equations and variables that were used to calculate a several components after
120 months for the $ 131,500 home located in central Phoenix, assuming a 30 year fixed
mortgage. The rest of the sample calculations can be found in the Appendix section.

11
Table 3.0 – Variable list for sample calculations.
Variable Description Units Assumed/Calculated/Given
P purchase price $ - US dollars given
P
down
down payment $ - US dollars calculated
P
maint.
annual maintenance payment $/year - US dollars per year assumed
P
insurance1
initial monthly insurance payment $/year - US dollars per year assumed
P
insurance2
current insurance payment,
adjusted for inflation $ - US dollars calculated
P
mort
g
a
g
e1
initial monthly mortgage payment $/month - US dollars per month assumed
P
mort
g
a
g
e2
current mortgage payment,
adjusted for inflation $ - US dollars calculated
P
p
ro
p
ert
y
monthly property tax payment $/month - US dollars per month calculated
r
down
required min. down payment rate % - percent assumed
r
p
ro
p
ert
y
property tax rate % - percent assumed
r
a
pp
./de
p
.
annual appreciation/depreciation
rate % - percent assumed
r
income
marginal income tax rate % - percent assumed
r
inflation
inflation rate % - percent assumed
r
rent
rate of rental price appreciation or
depreciation % - percent assumed
r
return
rate of return on cash (renting) % - percent assumed
V
home
value of home at time t $ - US dollars calculated
i interest rate % - percent assumed
t time years assumed
m
number of compunding
subperiods months given
Debt amount of debt in current month $ - US dollars calculated
D
p
revious
amount of debt in previous month $ - US dollars calculated
D
interest
portion of mortgage paid to
interest on debt $ - US dollars calculated
S
income
savings on income tax $ - US dollars calculated
C
inflow
renter cash inflow that can be
used on home expenses $ - US dollars calculated
P
rent1
initial amount of rent payment $/month - US dollars per month assumed
P
rent2
current rent payment adjusted for
appreciation or depreciation
$ - US dollars calculated
S
rent
savings when renting $ - US dollars calculated
PV present value $ - US dollars calculated
12
Down Payment
0.2131,500
$26,300
MonthlyMortgagePayment
1
1
1
131,50026,300
.
1
.
1
.
1
$487.20
HomeValue
1
.
131,500
1
0.0298
12
∗
$97,576
Debt
1
485
82,726
1
0.0375
12
485
$82,500
EquityinHome
97,57682,500
$15,076
InterestonDebt
82,726
0.0375
12
$258.52
PaidPrincipal
485258.52
$226.48
13
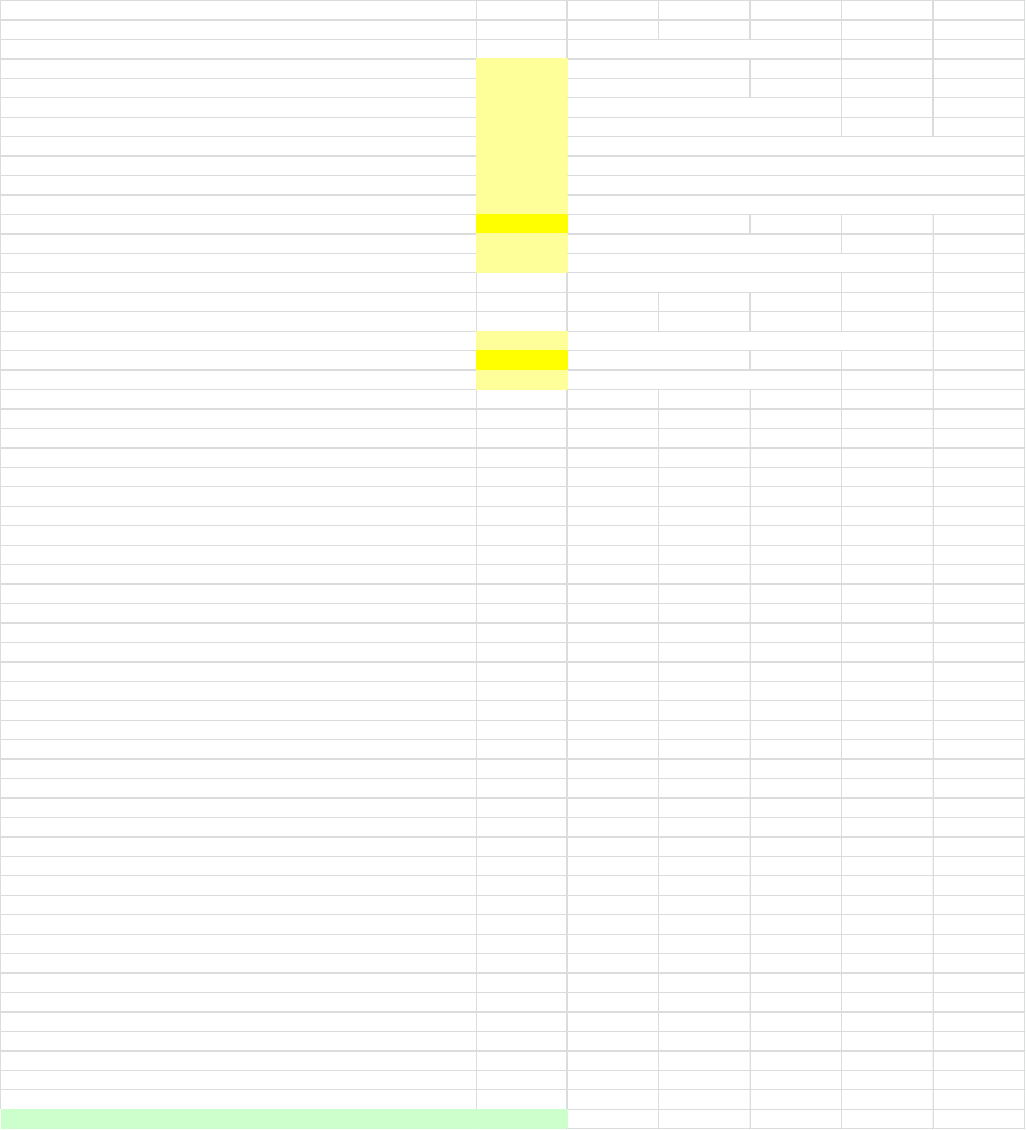
Figure 7.0 – Khan’s modified rent vs. buy Excel Spreadsheet
The lightly blue highlighted row on the bottom of Figure 7.0 indicates if buying or
renting a home is better. A positive value favors buying a home. A negative value is denoted in
Home purchase model
Data from Table 2.0 and References
Purchase price 206822.22 Home value ($)
Downpayment 41364.444 20% of Home value ($)
Interest rate 3.75% 30 Year Fixed Mortgage Rate
Principal amortization (years) 30 30 Year Fixed Mortgage Rate
Property tax rate 0.55% Assumed from "Maricopa County Average Property Tax"
Annual maintainance 3102.3333 Assumed from "Budgeting for Home Maintenance and Repair Costs"
Housing association dues (annual) 0 Assumed from "The Horrors of Homeowners' Associations"
Annual insurance 617 Assumed from "Arizona Homeowners Insurance Quotes"
Assumed annual appreciation -2.03% Theoretical value
Assumed marginal income tax rate 33% Assumed from "Federal Tax Brackets"
General inflation 2% Assumed from "Renting vs. Buying a home."
Monthly mortage payment 762.73 Assuming interest compounds monthly
Cost of renting similar home 1261.67 Rental price ($/month, including renters insurance)
Assumed rental price inflation -2.03% Theoretical value
Assumed annual (after tax) return on cash 1% Assumed from "Best Savings Accounts"
Month 012345
Buying scenario
Home Value 206,822 206,472 206,123 205,774 205,426 205,079
Debt 165,458 165,212 164,966 164,718 164,470 164,222
Equity in home 41,364 41,260 41,157 41,056 40,956 40,857
Interest on debt 517 516 516 515 514
Mortage payment 763 763 763 763 763
Paid principal 246 246 247 248 249
Insurance payment 51 52 52 52 52
Housing association dues - - - - -
Maintenance 259 259 259 260 260
Property tax 95 95 94 94 94
Income tax savings from interest deduction 202 202 201 201 201
Total cash outflow in buying scenario 966 966 967 968 968
Renting Scenario
Cashflow that could be spent on home-purchase/expesnes 966 966 967 968 968
Rent 1,262 1,259.54
1,257 1,255 1,253 1,251
Savings when renting 41,364 41,104.93 40,848 40,594 40,342 40,093
Home value after 10 years 168,795
Debt after 10 years 129,755
Home Equity after 10 years 39,040
Transaction costs of selling in year 10 10,128
Net cash if home sold in 10 years (assuming no capital gains) 28,912
Savings after 10 years if renting 28,813
Present value benefit of owning vs. renting for 10 years 82
14
parenthesis, and negative values favor renting a home. Another key assumption in Khan’s
“buyrent” spreadsheet is that the home is sold after a certain number of years. In Figure 7.0, the
home is sold after ten years of ownership.
DiscussionandAnalysis
From Figure 6.0, the home value will vary greatly depending on the area. Central
Phoenix and Tempe homes are comparable at $200,000.00, but Scottsdale homes are nearly
$100,000.00 more expensive and West Phoenix/Glendale homes are more than $100,000.00
cheaper than central Phoenix and Tempe homes. Similarly, renting central Phoenix and Tempe
homes are comparable at $1,200.00 per month, but Scottsdale homes are nearly $600.00 more
expensive per month and West Phoenix/Glendale homes are about $300.00 cheaper per month
than central Phoenix and Tempe homes.
After modifying Khan’s “buyrent” spreadsheet to fit the assumptions and averages
calculated throughout the report, buying a home in any of the four studied is better than renting a
home at a 30 year 3.75% fixed rate through fifteen years of ownership as long as there is little to
no appreciation. Even if there is some depreciation, buying a home in most of the areas is still
the cheaper option.
15
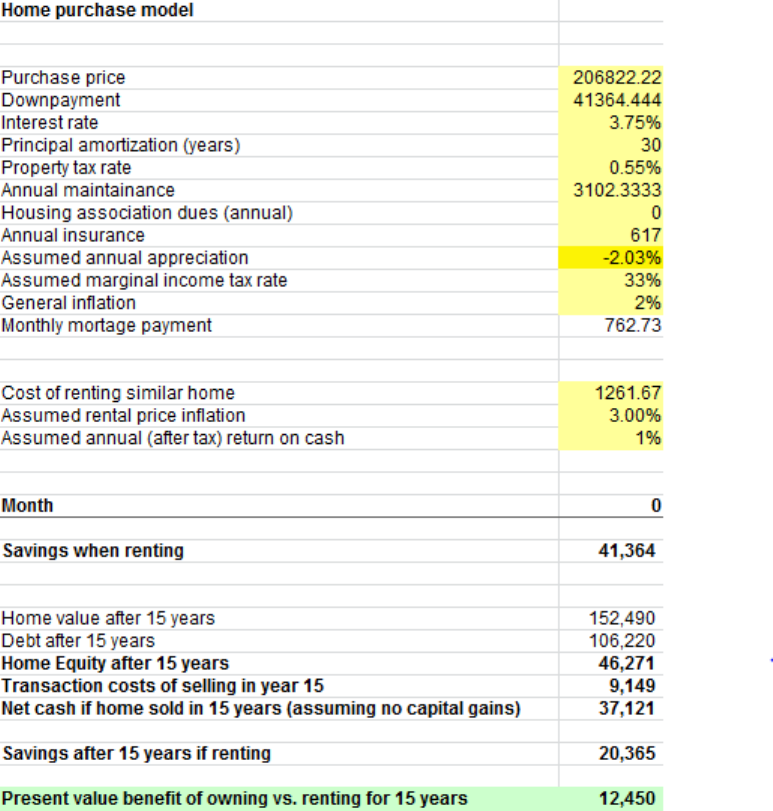
Figure 8.0 – Buy vs. rent in central Phoenix with 30 year fixed mortgage
Figure 8.0 shows the results of modifying Khan’s “buyrent” spreadsheet to show buying
a home in central Phoenix is better than renting after fifteen years of ownership, provided that
the home is sold at the end of the fifteenth year. Figure 8.0 also shows that the home
depreciations at a rate of 2.03%, but buying is still better than renting.
16
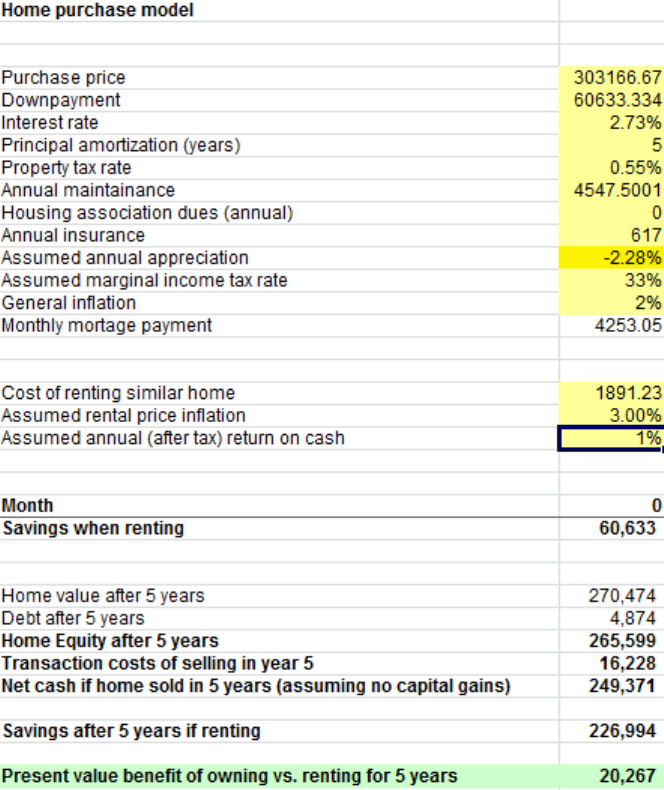
Figure 8.1 – Buy vs. rent in Scottsdale with 5/1 ARM
Figure 8.1 shows the results of modifying Khan’s “buyrent” spreadsheet to show buying
a home in Scottsdale at a 5/1 ARM is better than renting after five years of ownership, provided
that the home is sold at the end of the fifth year. The lightly blue highlighted cell indicates a net
present value of about +$20,267 when buying a home instead of renting. The home depreciates
at 2.28%, yet buying is still better.
17
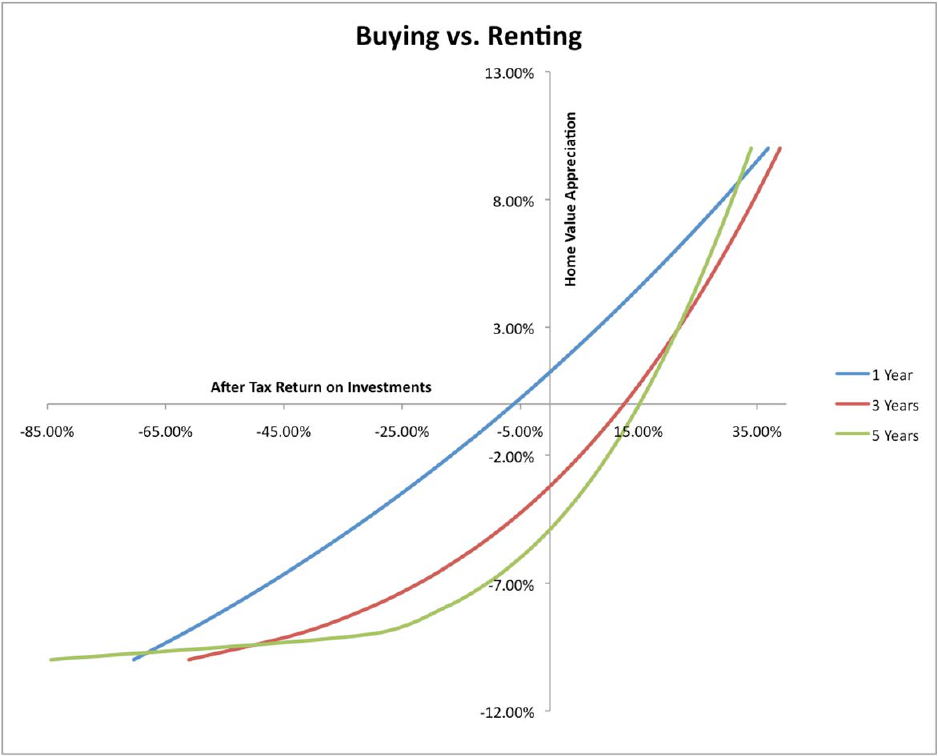
Figure 9.0 – Buy vs. rent decision chart
Figure 9.0 shows three lines representing prospective buying vs. renting years—one,
three, and five. If more prospective years, such as ten, fifteen, or thirty, were added then the
lines would continue to move right. The rates represented on the x and y axes are annual rates.
Any point above a line represents a buy scenario, and any point below represents a rent scenario.
Any point on the line is an even choice—either buy or rent and receive the same amount of
money when selling or moving out. For example, if an individual is considering buying a home
for five years, and the housing market is appreciating at 1%, then the individual should feel
confident in buying the home instead of renting because the point is above the five year line.
The large discrepancy between rental price and monthly mortgage payment accounts for the
good buying market.
18
Recommendation
Khan’s “buyrent” spreadsheet can be modified infinitely many times to fit infinite
situations, but ultimately individuals should feel confident about buying than renting a home,
provided the home is sold in after ownership and there is little to no appreciation. Figure 9.0
suggests buying is a much better option because if there is no after tax return on investments,
then owning a home that is depreciating at ~5% is more cost efficient than renting the same
home.
19
References
“3 ways to pay lower real-estate commissions.” MSN Real Estate, 2012. Web. 10 Aug. 2012.
<http://realestate.msn.com/article.aspx?cp-documentid=13108435>.
“Arizona Homeowners Insurance Quotes.” HomeInsurance.com, LLC., 2012. Web. 7 Aug. 2012.
<http://homeinsurance.com/Arizona/homeowners-insurance.php>.
“Arizona Renters Insurance.” InsureMyHouse.com, 2012. Web. 7 Aug. 2012.
<http://www.insuremyhouse.com/renters-insurance-arizona.html>.
“Best Savings Accounts.” MoneyRates.com, 2012. Web. 7 Aug. 2012. <http://www.money-
rates.com/savings.htm>.
“Budgeting for Home Maintenance and Repair Costs.” Intuit, Inc., 2012. Web. 6 Aug. 2012.
<http://www.mint.com/blog/goals/home-repair-02022011/>.
“Closing Costs.” Investopedia US, Inc., 2012. Web. 4 Aug. 2012.
<http://www.investopedia.com/terms/c/closingcosts.asp#axzz22jTBmOwo>.
“Closing costs comparison: Arizona.” Bankrate, Inc., 2012. Web. 4 Aug. 2012.
<http://www.bankrate.com/brm/news/mortgages/ccArizona.asp>.
“Definitions.” BBA Enterprises Ltd. and BBA LIBOR Ltd., 2012. Web. 7 Aug. 2012.
<http://www.bbalibor.com/bbalibor-explained/definitions>.
“Federal Tax Brackets.” Money Chimp, 2012. Web. 7 Aug. 2012.
<http://www.moneychimp.com/features/tax_brackets.htm>.
“Inflation-adjusted house prices.” JP’s Real Estate Charts, 2012. Web. 6 Aug. 2012.
<http://jparsons.net/housingbubble/>.
“Maricopa County Average Property Tax.” Tax-Rates.org, 2012. Web. 4 Aug 2012.
<http://www.tax-rates.org/arizona/maricopa_county_property_tax>.
“Renting vs. Buying a home.” Khan Academy, 2012. Web. 1 Aug. 2012.
<http://www.khanacademy.org/finance-economics/core-finance/v/renting-vs--buying-a-
home>.
“The Horror of Homeowners’ Associations.” Gawker Media, 2011. Web. 4 Aug. 2012.
<http://gawker.com/5830257/the-horror-of-homeowners-associations>.
“What’s in a Mortgage Payment?” Mortgage Bankers, Assn., 2012. Web. 7 Aug. 2012.
<http://www.homeloanlearningcenter.com/MortgageBasics/WhatsinaMortgagePayment.h
tm>.
20
Appendix
Table A.CP – Central Phoenix homes
Table A.T – Tempe homes
Hometype Area(ft
2
)Homevalue($)
Re nt al price
($/month)
Total
Mortga ge
pa yment
($/month)
30Year*
($/month)
15Ye ar*
($/month)
5/1ARM*
($/month)
Propertytax
($/month)
Homeowne rs
Insura nce
($/month)
2bed,1ba th 796 131500 949 703 466 715 415 128 110
2bed,1ba th 847 139900 954 741 496 761 442 128 117
2bed,1ba th 948 125000 874 614 443 680 395 67 104
3bed,2ba th 1440 170000 1222 887 603 925 537 142 142
3bed,2ba th 1458 142000 1167 743 504 773 449 121 118
3bed,2ba th 1815 2490 00 1169 1207 88 3 135 5 786 117 208
4bed,2.5bath 2274 385000 1983 1934 1365 2095 1216 248 321
4bed,2.5bath 2070 240000 1454 1199 85 1 1306 758 1 48 200
4bed,
2.5ba th 280 0 279000 1433 134 8 990 1519 883 126 233
Averages : 1605 206822 1245 1042 733 1125 653 136 172
TotalMortagePaym ent (30Year)=Loan+PropertyTaxes +HomeownersInsurance
Homeonwersins uarance1%ofvalue
*Bas edon20%down,excludestaxesandins
Hometype Area(ft
2
)Homevalue($)
Rentalpric e
($/month)
Total
Mortgage
pa yme nt
($/month)
30Yea r*
($/month)
15Year*
($/month)
5/1ARM*
($/month)
Propertytax
($/month)
Home owners
Ins ura nc e
($/month)
2bed,1bath 1,050 106,582 930 515 380 581 339 46 89
2bed,1bath 1,201 85,000 986 456 305 463 271 81 71
2bed,1bath 792 70,000 821 563 443 680 395 61 58
3bed,2bath 1,862 179,000 1,406 915 642 976 571 124 149
3bed,2bath 1,098 116,400 1,159 564 417 635 371 50 97
3bed,2bath 1,650 225,000 1,254 2,432 804 1,227 714 1,440 188
4bed,2bath 2,118 245,000 1,477 1,231 878 1,336 781 148 204
4bed,2bath 1,536 148,000 1,154 1,422 531 808 472 768 123
4bed,
2.5bath 2,659 649,900 2,373 3,141 2,322 3,544 2,061 278 542
Average s: 1,552 202,765 1,284 1,024 747 1,139 664 108 169
TotalMortagePayment(30Year)=Loan+PropertyTaxes +HomeownersInsurance
Home onwersins uarance1%ofvalue
*Bas edon20%down,excludestaxesand
21
Table A.S – Scottsdale homes
Table A.WP – West Phoenix/Glendale homes
Hometype Area (ft
2
)Homevalue($)
Rentalpric e
($/month)
Total
Mortgage
pa yment
($/month)
30Yea r*
($/month)
15Year*
($/month)
5/1ARM*
($/month)
Propertyta x
($/month)
Home owne rs
Insura nc e
($/month)
2bed,2bath 1,026 80,800 993 427 289 440 225 71 67
2bed,2ba th 1,335 154,900 1,351 794 554 844 849 111 129
2bed,2.5ba th 1,178 219,900 1,324 1,067 78 6 1,199 694 98 183
3bed,2bath 1,898 235,000 1,386 1 ,129 840 1,281 742 93 196
3bed,2bath 2,331 410,000 2,320 1 ,916 1,466 2,235 1,294 108 342
3bed,2bath 2,094 289,000 1,863 1 ,417 1,033 1,575 912 143 241
4bed,3bath 3,106 524,000 2,863 2 ,550 1,873 2,857 1,650 240 437
4bed,3.5ba th 2,242 364,900 1,991 1,774 1,304 1 ,989 1,149 166 304
4bed,
3bath 2,928 450,000 2,780 5 ,353 1,608 2 ,435 1,417 3,370 375
Averages : 2,015 303,167 1,875 1,482 1,084 1,651 992 146 253
Total MortagePaym ent(30Year)=Loan+PropertyTaxes+HomeownersInsurance
Homeonwersins uarance1%ofvalue
*Basedon20%down,excl udestaxesandins
Hometype Area(ft
2
)Homevalue($)
Rental price
($/month)
Total
Mortgage
pa yment
($/month)
30Yea r*
($/month)
15Year*
($/month)
5/1ARM*
($/month)
Prope rtytax
($/month)
Homeown ers
Ins uranc e
($/month)
2bed,1ba th 1,188 80,000 831 440 286 436 255 87 67
2bed,1ba th 520 40,000 759 246 143 218 127 70 33
2bed,1ba th 1,019 84,000 778 498 301 458 268 127 70
3bed,2ba th 1,710 124,900 988 658 447 680 399 107 104
3bed,2ba th 1,925 97,000 1,094 1,568 347 528 310 1,140 81
3bed,2ba th 1,882 144,900 1,071 754 518 789 462 115 121
4bed,2.5bath 2,099 70,000 1,026 391 250 381 223 83 58
4bed,2ba th 1,892 89,900 995 487 321 490 287 91 75
4bed,
2.5ba th 1,913 64,900 997 458 323 354 207 81 54
Average s: 1,572 88,400 949 495 326 482 282 95 74
TotalMortagePaym ent(30Year)=Loan+PropertyTaxes +HomeownersInsurance
Homeonwersins uarance1%ofvalue
*Basedon20%down,exc ludestaxesandins

22
InsurancePayment
1
617
12
1
0.02
12
$62.79
MaintenancePayment
1
1972.5
12
1
0.02
12
$200.73
PropertyTaxPayment
97,576
0.0055
12
$44.72
IncomeTaxSavings
0.28
44.72258.52
$84.91
TotalCashOutflow(Buying)
48562.79 200.7344.7284.91
708.33
23
RenterCashInflow
$708.33
Rent
1
965
1
0.0298
12
$716.06
SavingsWhenRenting
1
9,199
1
0.01
12
708.33716.06
$9,198
NetCashifHomeisSoldin10Years
15,0766,797
8,279
PresentValue
9,1988,279
$919
