
The Rodney L. White Center for Financial Research
The Long-term Returns on the Original
S&P 500 Firms
Jeremy J. Siegel
Jeremy D. Schwartz
29-04
1
The Long-term Returns on the Original
S&P 500 Firms
by
Jeremy J. Siegel and Jeremy D. Schwartz
Jeremy J. Siegel is the Russell E. Palmer Professor of Finance at the
Wharton School of the University of Pennsylvania Jeremy D.
Schwartz is a 2003 graduate of the Wharton School and Assistant
Director of Research at Index Development Partners, Inc.
Draft December 5, 2004
Do note quote without permission.
2
Abstract
The S&P 500 Index, first compiled in March, 1957, is the most widely-used benchmark for
measuring the performance of large capitalization, US-based stocks. The index of 500 stocks is
continually updated, adding approximately 20 new firms each year that meet Standard and Poor’s
criteria for market value, earnings, and liquidity while deleting an equal number that fall below these
standards or are eliminated by mergers or other corporate changes.
We calculated the return of all 500 of the original S&P 500 firms and the new firms that have been
subsequently added to the index. Contrary to earlier studies, we found that the buy-and-hold returns
of the 500 original firms have outperformed the returns on the continually updated S&P 500 index
and have done so with lower risk. The new firms added to the S&P 500 Index since 1957 have
underperformed the original firms in nine of the ten industrial GICS sectors.
We also found that less than one-third of a sector’s return from 1957 through 2003 can be attributed
to the expansion and contraction of the sector’s market value relative to the S&P 500 Index. Sector
differences in dividend yields, capitalizations, and the number of firms admitted to the sector
accounted for more two-third of the changes in market share.
The underperformance of the continually updated S&P 500 Index is due to the overvaluation of
newly admitted firms, which have been caused by the cyclical fluctuations in investor sentiment and
price pressures exerted by indexers. Relative to the updated S&P 500 index, the portfolios of
original firms became heavily weighted with price-to-earnings stocks, particularly large oil
producers that have outperformed growth stocks since 1957.

3
The Long-term Returns on the Original S&P 500 Firms
by
Jeremy J. Siegel and Jeremy D. Schwartz
Introduction
The S&P 500 Index is the most widely-used benchmark for measuring the performance of large
capitalization, US-based stocks. Covering almost all of the 500 largest companies ranked by market
value, the S&P 500 Index comprised about 83% of the market capitalization of all regularly traded
stocks on the New York, American, and Nasdaq stock exchanges.
1
The index of 500 stocks, first compiled in March, 1957 is continually updated by adding new firms
that meet Standard and Poor’s criteria for market value, earnings, and liquidity while deleting an
equal number that fall below these standards or are eliminated by mergers or other corporate
changes.
2
S&P states that the purpose of updating is to maintain a representative index that includes
500 “leading companies in leading industries of the economy.”
3
It is well documented that over time
the S&P 500 index has outperformed the vast majority of active money mangers and mutual funds.
4
Since the S&P 500 was formulated, more than 900 new firms have been added and a like number
deleted from the index.
Joseph Schumpeter called the process by which new firms enter the market, challenge, and
eventually destroy the older firms, “creative destruction.”
5
Indeed, many of the giant firms in the
original index, such as US and Bethlehem Steel, Union Carbide, and Eastman Kodak have declined
while new firms, such as Intel, Microsoft, and Wal-Mart have taken their place. In fact, the market
value of the S&P 500 firms that have survived from the original 1957 list is only 31% of the 2003
year end S&P 500’s market value.
Many financial advisors counsel clients to continually upgrade their portfolio, claiming that new
firms offer investors higher returns than the older, dying companies. These recommendations were
supported by the research of Richard Foster and Sarah Kaplan from McKinsey & Co who reported
that the new companies added to the S&P 500 Index have generated higher returns than the original
1
Market value based on the Wilshire 5000 Total Market Index valued at the end of October 2004.
2
A list of the selection criteria can be found on S&P’s website, www2.standardandpoors.com/spf/pdf/index/
500factsheet.pdf.
3
This quotation is found on S&P’s website, see above.
4
See “The Case for Indexing,” The Vanguard Group, September 2003, Siegel, Stocks for the Long Run, 3
rd
edition,
2002, McGraw Hill, Chapter 20, and Malkiel, B., A Random Walk Down Wall Street, 2003 edition.
5
Joseph Schumpeter, Capitalism, Freedom, and Democracy, Harper and Bros, New York, NY, 1942

4
firms. They stated “without these new firms, the performance of the [S&P 500] index would have
been considerably less.”
6
Our research calculated the return of all 500 of the original S&P 500 firms and the new firms that
have been subsequently added to the index. Contrary to Foster and Kaplan’s results, we found that
the buy-and-hold returns of the 500 firms that were chosen for the original index in March 1957
have outperformed the returns on the continually updated S&P 500 index used by investment
professionals to benchmark their performance and have done so with lower risk. Underperformance
of the new firms added to the index were found in virtually all industries: in nine of the ten industrial
GICS sectors, the returns of the new firms added to the index fell short of the performance of the
original firms.
We also found that industry sectors that have gained market share over time have not always
translated into higher stockholder returns, while returns in shrinking sectors often beat the averages.
Specifically, less than one-third of a sector’s return can be attributed to the expansion and
contraction of the sector’s relative market value, while the remainder is due to differences in
dividends and the addition of new firms. These findings argue that updating the S&P 500 Index to
include new firms, while it may increase diversification, is not essential to achieve good returns.
History and Transformation of the S&P 500 Index
Standard & Poor’s Corporation first developed industry-wide stock price indices in 1923 and three
years later formulated the Composite Index containing 90 stocks.
7
The Composite Index was
expanded to 500 stocks on March 1, 1957 and renamed the S&P 500 Index. At that time, the firms in
the S&P 500 Index had a market value of $173 billion, comprising about 85 percent of the value of
all NYSE-listed stocks.
The Index originally contained exactly 425 industrials, 25 railroad, and 50 utility firms. In 1976, 40
financial stocks were added, and the industrial, transportation and utility groups were reduced to
400, 20, and 40, respectively.
8
In 1988 Standard and Poor’s eliminated fixed sectors with the goal of
achieving a diversified and representative portfolio of all stocks trading in US markets. In July 2002
all foreign-based companies, which comprised 1.3% of the market capitalization of the index at that
time, were eliminated and replaced by US-based firms.
9
6
Creative Destruction: Why Companies That Are Built to Last Underperform the Market – and How to Successfully
Transform Them, by Richard Foster and Sarah Kaplan, Random House, New York, 2001. p. 28.
7
See Standard and Poor’s Security Price Index Record, 2002 Edition, pg. I
8
The only financial stocks in the index in 1957 were consumer finance companies, such as Household International,
Beneficial Corp, and CIT Financial. Banks were not added to the Index until 1976. One of the reasons given for the
early exclusion of bank stocks was that most banks were trading on the over-the-counter exchange (which became
Nasdaq in 1971) and timely price data were not available.
9
In 2002, S&P eliminated Royal Dutch Petroleum, Unilever NV, and the Canadian firms Inco Ltd., Alcan Inc., Nortel
Networks, Barrick Gold and Placer Dome.
5
Updating the Index
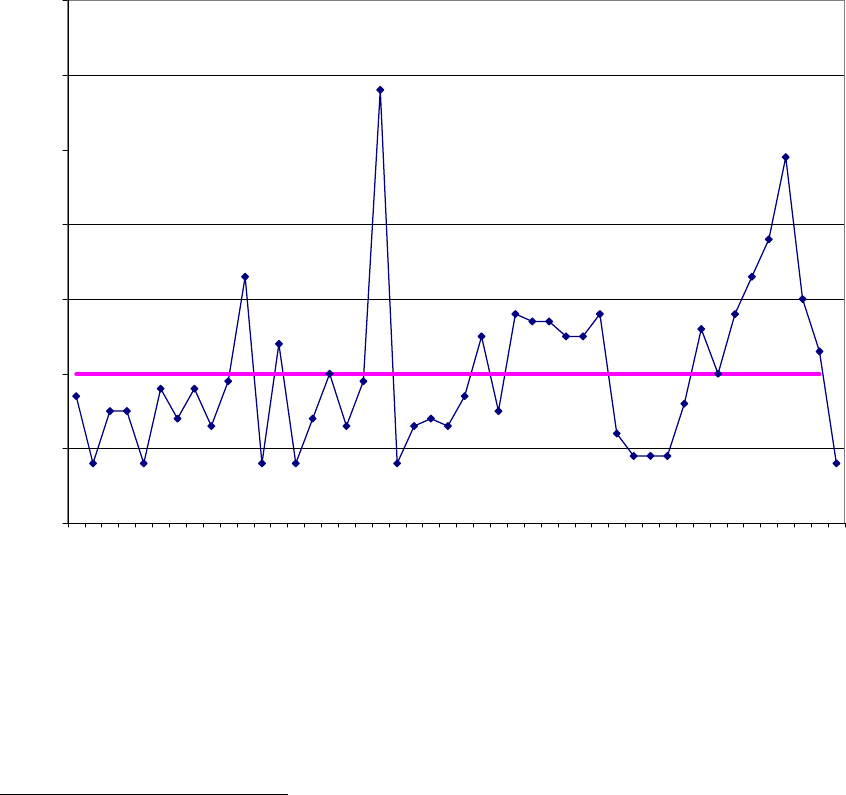
The total number of new firms added to the S&P 500 Index from its inception in 1957 through 2003
is 917, an average of 20 per year.
10
The number added each year is shown in Figure 1. The highest
number of new firms added to the index occurred in 1976, when the S&P added 60 firms, 40 of
which, as noted above, were financial. These new companies comprised 10.4% of the market value
of the index at the time.
11
Avg = 20
Total = 917
0
10
20
30
40
50
60
70
1958
1959
1960
1961
1962
1963
1964
1965
1966
1967
1968
1969
1970
1971
1972
1973
1974
1975
1976
1977
1978
1979
1980
1981
1982
1983
1984
1985
1986
1987
1988
1989
1990
1991
1992
1993
1994
1995
1996
1997
1998
1999
2000
2001
2002
2003
Number of Companies
Figure 1: Number of Firms added to the S&P 500 Index
10
This number may be lower than found on the S&P website since we did not consider a merger of two S&P companies
an addition to the index.
11
The addition and deletion of firms are not the only changes that have been made to the index. In order to match the
performance of the S&P 500 Index requires that indexers buy and sell shares when existing firms issue or repurchase
shares or change their capitalization in some other way. From 1993 through 2002, these capitalization changes have
averaged 1.56% of the market value of the index, a figure that rose to 2.49% during the technology boom in 2000.
Transactions related to capitalization changes have comprised about 30% of all the transactions that the S&P 500
indexers must undertake, the other 70% are related to the deletion and addition of firms to the index.

6
In recent years, annual additions have averaged slightly more than more than 5% of the market value
of the index. The percentage was higher during the late 1990s due to addition of new, high-
capitalization technology firms. In 2003, the number of new firms added to the index fell to a record-
tying low of 8, a level last reached in 1977.
Holding Period Returns to the Original Portfolio of S&P 500 Stocks
To calculate the performance of the original S&P 500 firms, we formed three portfolios. Over time
the three portfolios evolve differently depending on the assumptions we make about what investors
do with their shares received from a spin-off or when an original firm is merged into another firm or
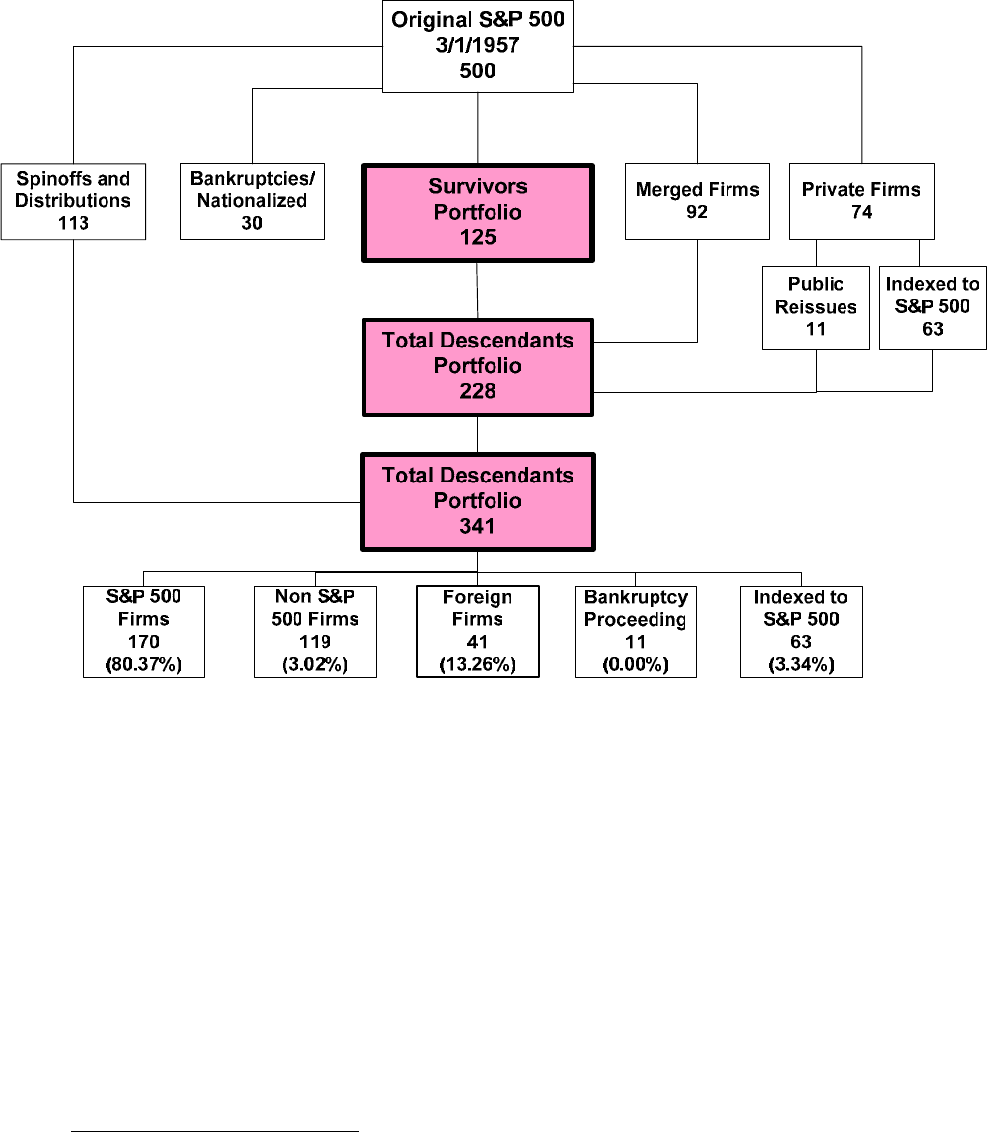
went private. Figure 2 displays the evolution of these portfolios through time.
The first portfolio we analyze is called the Survivors’ Portfolio (SP). The survivor portfolio
consists only of shares of the original S&P 500 firms. Shares of other firms received through
mergers are immediately sold and the proceeds invested in the remaining survivor firms in
proportion to their market value. For example, when Mobil Oil was merged into Exxon in 1999,
shareholders of Mobil are assumed to sell the shares they received from Exxon-Mobil and invest the
proceeds in the remaining survivor firms. The surviving firm is identified as the company whose
identifier in the CRSP (Center for Research in Security Prices) “PERMNO” remains unchanged. All
spinoffs are immediately sold and the proceeds reinvested in the parent firm. Funds received from
privatizations are sold and the proceeds re-invested in the original surviving firms in proportion to
their market value.
It is important to note that the evolution of the survivors’ portfolio does not assume advance
knowledge of which firms survived Firms are deleted over time when they are privatized or merged
into other firms. As a result, there is no presumption that the returns on these firms would
outperform the benchmark index and there is no “survivorship bias.”
At year end 2003, the Survivors’ Portfolio consisted of 125 original firms that have remained intact
(except possibly for a name change) from 1957 to the present. Ninety-four of the surviving firms are
still in the S&P 500 index, 26 are publicly traded companies not in the index, and five are in
bankruptcy proceedings.
The second portfolio is called the Direct Descendants’ Portfolio (DDP), which consists of the shares
of firms in the survivors’ portfolio plus the shares issued by firms acquiring an original S&P 500
firm. In the case of the Mobil-Exxon merger discussed above, we assume that shareholders of Mobil
Oil hold the shares of Exxon that were issued in the merger.
If an original firm was taken private, we assume that the cash distributed from the privatization was
invested in an indexed portfolio whose returns matched the standard S&P 500 Index.
12
If a firm that
was taken private is subsequently reissued to the public again, we assume the portfolio repurchases
shares in the reissued company with the funds that had been invested in the index at the time the firm
12
In some cases, bonds or preferred shares were distributed in a privatization and we assumed that these funds were sold
and invested to match the index.
7
went private. Seventy-four original S&P 500 firms were privatized.
13
As before, spinoffs are
immediately sold and the proceeds reinvested in the parent.
Figure 2: Composition of Original S&P 500 firms on December 31, 2003.
The third portfolio is called the Total Descendants’ Portfolio (TDP) and includes all firms in the
DDP plus all the spinoffs and other stock distributions issued by the firms in the Direct Descendants’
Portfolio. The only difference between the TDP and the DDP is that the TDP holds all the spinoffs
rather than sell them and reinvest in the proceeds in the parent firm.
The TDP is identical to the portfolio of a totally passive investor who holds all the spinoffs and
shares issued from mergers and never sells any stock. For example, when American Telegraph and
Telephone distributed its baby bells in 1983 following the government-mandated breakup of the
13
For example, when RJR Nabisco was taken private by KKR in 1989, investors in the TDP are assumed to invest the
money received for their shares in an S&P 500 index fund. Two years later when KKR reissued Nabisco Holdings,
shares were repurchased with the accumulation in the index fund.

8
monopoly, all the shares of the regional bell companies were held by investors in the TDP. Table 1
shows how the returns are calculated for each of the portfolios.
Portfolio Return Assumptions
Firms
Survivor Merged Distributions Privatized
Survivor
Held
Sold and Proceeeds
Reinvested in Remaining
Survivor Firms
Reinvested in
Parent
Sold and Proceeeds
Reinvested in Remaining
Survivor Firms
Direct Descendants
Held Held
Reinvested in
Parent
Matched to S&P
500*
Total Descendants
Held Held Held
Matched to S&P
500*
* If privatized firm subsequently re-issued, stock purchased with funds that were matched to S&P 500.
Portfolio
Table 1: Portfolio Return Assumptions
It should be noted that the return data compiled in the CRSP data bases assume that spinoffs are
immediately sold and the proceeds reinvested in the parent firm, as we have done for the direct
descendants’ portfolio.
14
But many investors do hold the spun-off firms and doing so is often both
tax and transaction-cost efficient. It is for this reason that we have also computed the returns of the
Total Descendants’ Portfolio
Figure 2 shows that through mergers, bankruptcies, nationalizations and privatizations, the original
500 firms have been reduced to 339 on December 31, 2003. Of these, 168 are still in the S&P 500
Index and these firms comprise 80.4% of the market value of the final accumulation of the TDP.
One hundred nineteen firms, comprising just under 3% of the final accumulations of the TDP are
US-based firms not currently in the S&P 500 Index; 41 firms, comprising 13.3% of the final
accumulation are foreign and headquartered outside the US, and 11 firms are in bankruptcy
proceedings. The firms privatized and not reissued constitute approximately 3% of the market value
of the portfolio.
The returns on Spin-offs versus the Parent
Although there was not a significant difference in the overall returns of the DDP and TDP portfolios,
Table 2 shows that for individual companies there were some significant differences between the
return of the parent firms and the returns of the spinoffs.
By far the most important spinoffs from the original S&P 500 firms belonged to American
Telephone and Telegraph, the largest and most widely held stock when the index was founded.
Investors who held all of AT&T’s spinoffs received a return of 10.50% per year, only 35 bps behind
the performance of the S&P 500 Index since 1957, while the return on parent company was only
7.85%, far below the market average.
14
See description of “Return” calculation in Data Description Guide for the CRSP US Stock Database and the CRSP US
Indices Database, Version CA276.200303.2, pg 184.

9
Spinoffs whose Return Exceed Parent
Company
Annual
Return w/
Spinoffs
Ann. Ret w/
Spinoffs
Reinvested
Gain in
Annual
Return
Spinoffs
1 AT&T 10.50% 7.85% 2.64% Baby Bells
2 Sears, Roebuck 11.32% 10.01% 1.31% Morgan Stanley, Allstate
3 Olin Corp. 10.88% 8.58% 2.30% Squibb Beechnut
4 Ford 11.64% 11.25% 0.39% Associates First Capital
5 American Brands 14.55% 14.42% 0.13% Gallaher Group
Spinoffs whose Return Fell Short of Parent
Company
Annual
Return w/
Spinoffs
Ann. Ret w/
Spinoffs
Reinvested
Loss in
Annual
Return
Spinoffs
1 Atchison, Topeka, Santa Fe 11.36% 13.42% -2.05% Catellus, Santa Fe Energy, Santa Fe Gold
2 Union Carbide 9.98% 10.51% -0.53% Praxair
3 Southern Co. 11.03% 12.17% -1.14% Mirant Corp
4 General Motors 8.28% 8.45% -0.17% Raytheon, Delphi
5 Du Pont 8.30% 8.40% -0.11% General Motors
Table 2: Effect of spinoffs on returns on specific companies
But spinoffs do not always outperform the parent. Praxair, a natural gas producer, underperformed
its parent Union Carbide and Mirant Corp., a provider of energy products and services and spun-off
by Southern Co. in 2001, declared bankruptcy in 2003.. Similarly, investors who held the rail stocks
were generally hurt by the relatively poor returns of the spinoffs of oil, gas, and other real properties.
Calculation of the Returns on the original S&P 500 portfolios
The returns from each of these three portfolios are analyzed from two initial allocations of the
original S&P 500 firms: value-weighted and equally-weighted. There is no rebalancing in any
portfolio after this initial allocation is made.
Table 3 shows the returns, standard deviation, and Sharpe ratios of all the portfolios and compares
them to the standard S&P 500 Index. All six of the portfolios of the original S&P 500 stocks
outperformed the S&P 500 benchmark and all had higher Sharpe ratios.
From March 1, 1957 through December 31, 2003, the S&P 500 Index registered a 10.85%
annualized compound return. The compound return on the value-weighted and equally-weighted
TDP was 11.40% and 12.14% per year respectively, beating the updated Index by 55 and 129 basis
points annually over the past 47 years.

10
Portfolio
Initial Weighting
Geometric
Return
Arithmetic
Return
Standard
Deviation
Sharpe
Ratio
Value
11.31% 12.38% 15.72% 0.4343
Equal
12.28% 13.75% 18.45% 0.4446
Value
11.35% 12.45% 15.93% 0.4331
Equal
12.18% 13.67% 18.55% 0.4375
Value
11.40% 12.53% 16.09% 0.4337
Equal
12.14% 13.63% 18.53% 0.4357
S&P 500 Value
10.85% 12.14% 17.02% 0.3871
Survivors Portfolio
Total Descendants
Direct Descendants
Table 3: Performance of Portfolios of Original S&P 500 Firms
The superior performance of the TDP is noteworthy since, as noted above, it is the most transaction-
cost and tax-efficient strategy of accumulating wealth from the original S&P 500 stocks. The TDP
involves fewer transactions than required of a standard S&P 500 index fund since no shares are ever
sold in the open market, and the only shares purchased arise from dividends or reissues of privatized
companies. Furthermore the TDP is the most tax-efficient strategy since, with very few exceptions,
no capital gains are realized as no shares are ever sold.
15
These results mean that these 500 firms chosen by Standard and Poor’s in 1957 have, on average,
outperformed the nearly one thousand new firms that had been added to the index over the
subsequent half century.
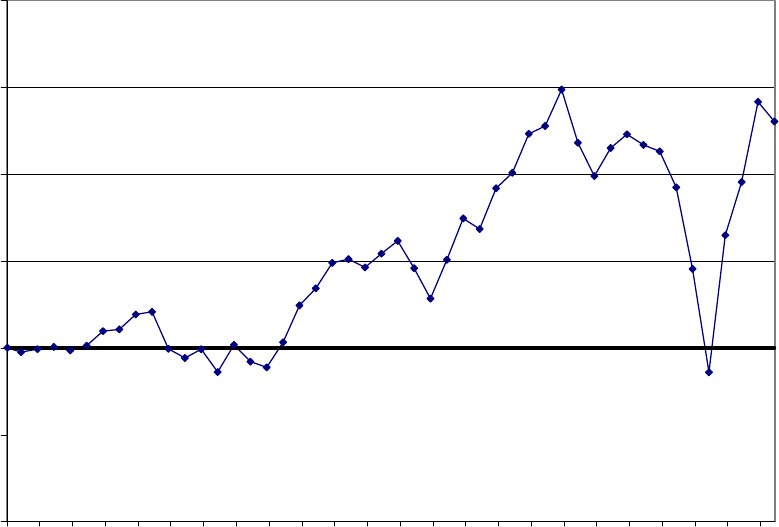
Figure 3 shows a yearly relative comparison of the cumulative return on the value-weighted TDP to
the S&P 500 Index from 1957 through 2003. The two returns are nearly coincident in the early
years because the two portfolios were nearly identical. In the late 1980s the cumulative return on the
TDP rose to a high of 30% above the S&P 500 Index. During the 1990s the relative performance of
the TDP declines, and at the end of 1999 the cumulative return on the TDP temporarily falls behind
the S&P 500 Index. This decline is due to the technology bubble which vastly inflated the returns to
the new technology entrants in the updated S&P 500 index while the TDP had a very small
technology weighting. When technology shares fell, the TDP again outperformed the standard,
updated S&P 500 Index.
15
There are a few cases where a stock distribution is not considered a non-taxable event by the IRS.
11
0.80
0.90
1.00
1.10
1.20
1.30
1.40
1957
1959
1961
1963
1965
1967
1969
1971
1973
1975
1977
1979
1981
1983
1985
1987
1989
1991
1993
1995
1997
1999
2001
2003
Cumulative Return of TDP / S&P 500
Figure 3: Cumulative performance of value-weighted Total Dependents Portfolio relative to
S&P 500
Difference Between Changes in Market Value and Investor Return
The market value of the updated S&P 500 Index firms has risen at a 9.13% annual rate since the
index was founded, increasing from $172 billion in 1957 to $10.3 trillion by December 31, 2003. In
contrast, the market value of the Survivors’ Portfolio has grown at only a 6.44% annual rate,
reaching $3.2 trillion by the end of 2003. Yet the return on the survivor’s portfolio was greater than
the return on the S&P 500 index.
Investor return is a per share concept while market value records prices times aggregate number of
shares. Return to investors include reinvested dividends that are absent from market value data.
Furthermore, market value data are impacted by changes in the capitalization of individual firms, the
issuance of new shares, spinoffs, or by new, higher-valued firms replacing lower-valued, deleted
firms in the index. It was the confusion between market value and investor returns that led Foster
and Kaplan to their erroneous conclusions.

12
Long-term Returns of the Original S&P 500 firms.
Table 4 shows the annualized returns from March 1, 1957 through December 31, 2003 of the twenty
largest market-value firms on March 1, 1957, Table 5 displays the twenty best-performing survivor
firms, and Table 6 records the twenty best-performing firms from the Total Descendants’ Portfolio.
16
Rank
Return
Rank
Market
Cap
1957
Original Name → 2003 Name (→ = Merger ► = Name Change )
Total
Accumulation
of $1
(including
s
p
inoffs
)
Annual
Return
112
Royal Dutch Petroleum
398.84 13.64%
214
Shell Oil → Royal Dutch Petroleum (1985)
323.96 13.14%
313
Socony Mobil Oil ► Mobil (1966) → Exxon-Mobil (1999)
322.41 13.13%
416
Standard Oil of Indiana ► Amoco (1985) → BP Amoco (1998)
285.31 12.83%
52
Standard Oil of New Jersey ► Exxon (1972) ► Exxon-Mobil (1999)
254.00 12.55%
65
General Electric
220.04 12.21%
76
Gulf Oil ► Gulf Corp. → Chevron (1984) ► Chevron-Texaco (2001)
214.12 12.14%
811
International Business Machines
196.50 11.94%
910
Standard Oil of California ► Chevron (1984) ► Chevron-Texaco (2001)
172.29 11.62%
10 15
Sears Roebuck
151.51 11.32%
11 8
Texas Co ► Texaco (1959) → Chevron-Texaco (2001)
128.63 10.93%
12 20
Phillips Petroleum ► ConocoPhillips (2002)
119.61 10.76%
13 1
American Telephone & Telegraph ► AT&T (1994)
107.16 10.50%
14 7
Union Carbide & Carbon ► Union Carbide (1957) → Dow Chemical (2001)
86.20 9.98%
15 4
Du Pont E I De Nemours & Co
41.82 8.30%
16 3
General Motors
41.47 8.28%
17 17
Aluminun Company of America ► Alcoa (1999)
37.74 8.06%
18 19
Eastman Kodak
35.33 7.91%
19 9
U S Steel ► USX Corp (1986) ► USX Marathon (1991) ► Marathon Oil
(2000)
8.25 4.61%
20 18
Bethlehem Steel
0.00 -13.54%
Table 4: Returns of the Largest 20 Companies from the Original S&P 500
Of the twenty largest firms in 1957, nine were oil firms and the five best performers – Royal Dutch
Petroleum, Shell Oil, Socony Mobil, Standard Oil of Indiana (now BP Amoco), and Standard Oil of
New Jersey (now Exxon-Mobil) were also oil companies. Each of these firms outperformed the
S&P 500 Index by between 2% and 3% per year over the 46 year period.
Of the four remaining oil companies, Gulf Oil, now part of Chevron Texaco, Standard Oil of
California, which changed its name to Chevron, and Texaco also outperformed the S&P 500 Index,
while Phillips Petroleum (now Conoco-Phillips) just fell short of the index’s performance.
The material and manufacturing stocks, such as Union Carbide (now part of Dow Chemical),
DuPont, General Motors, and Alcoa lagged the market significantly. US Steel would have given
16
Data on the returns of each firm of the original S&P 500 is available from the authors.

13
investors an even lower return had it not purchased and then sold Marathon Oil. Bethlehem Steel,
once the second largest steel manufacturer in the world behind US Steel, went bankrupt in 2001 and
is the only one of the twenty largest stocks to lose money for investors.
Despite the losers, an equal investment placed in each of the 20 largest S&P 500 firms when the
index was founded would have generated a 11.40% return for investors, 55 basis point greater than
the S&P 500. Interestingly, this return is exactly equal to the return received in the value-weighted
total descendants portfolio.
17
Table 5 lists the twenty top performing stocks for the survivors of the 500 original S&P 500 firms.
Many of these firms, such as Merck, Abbott Labs, Pfizer, Coca-Cola, Colgate-Palmolive, PepsiCo,
Wrigley, Heinz, outperformed the market by large margins over the past half century.
The single best performing firm of the original S&P 500 Index is Philip Morris, recently renamed
the Altria Group. Philip Morris yielded an annual return of 19.75% and beat the S&P 500 Index by
almost 9% per year since the index’s inception. $1,000 placed in an S&P 500 Index fund on
February 28, 1957 would have grown, with reinvested dividends, to almost $125,000 by December
31, 2003. But $1,000 put in Phillip Morris would have grown to almost $4.6 million.
It is of note that 18 of the twenty best-performing firms are from the pharmaceutical and consumer
staples industries. All these firms have strong consumer brand names and are marketed on an
international basis.
Table 6 lists the 20 top performing firms from the Total Descendants’ Portfolio. These include the
original S&P 500 firms that were merged into other firms as well as those survivor firms. Many of
the top-performing firms rode on the coattails of other successful firms: Through mergers the
shareholders of Thatcher Glass, General Foods, California Packing, National Dairy Products, and
Standard Brands all became shareholders of Philip Morris and shared in its success.
17
The superior performance of the original portfolios analyzed in the previous section is not solely due to the better
performance of the oil sector. Excluding the oil firms, the value-weighted TDP still beat the S&P 500 Index by 23 basis
points a year, and the return on the equally-weighted total portfolio actually rises if we exclude the oil sector.

14
Rank
Return
Rank
Market
Cap
1957
Original Name → 2003 Name (→ = Merger ► = Name Change )
Total Accum-
ulation
Annual
Return
1 215 Philip Morris ► Altria (2003) 4,626.40 19.75%
2 197 Abbot Labs 1,281.33 16.51%
3 299 Bristol Myers ► Bristol Myers Squibb (1989) 1,209.44 16.36%
4 487 Sweets Co. ► Tootsie Roll Industries (1966) 1,090.96 16.11%
5 143 Pfizer Inc. 1,054.82 16.03%
6 83 Coca-Cola 1,051.65 16.02%
7 117 Merck 1,032.64 15.97%
8 216 Pepsico 866.07 15.54%
9 239 Colgate-Palmolive 761.16 15.22%
10 275 Crane Co. 736.80 15.14%
11 277 Heinz 635.99 14.78%
12 188 Wrigley 603.88 14.65%
13 72 American Tobacco ► American Brands (1969) ► Fortune Brands (1997) 580.03 14.55%
14 180 Kroger Co. 546.79 14.41%
15 255 Schering Corp → Schering Plough (1971) 537.05 14.36%
16 31 Procter & Gamble 513.75 14.26%
17 227 Hershey Foods 507.00 14.22%
18 76 American Home Products ► Wyeth (2002) 461.19 13.99%
19 198 General Mills 420.49 13.77%
20 12 Royal Dutch Petroleum 398.84 13.64%
Table 5: Returns of the 20 top “Survivors”

15
Rank
Return
Rank
Market
Cap
1957
Original Name → 2003 Name (→ = Merger ► = Name Change )
Total
Accumulation
Annual
Return
1 215 Philip Morris ► Altria (2003) 4,626.40 19.75%
2473
Thatcher Glass → Rexall Drug (1966) ► Dart Industries (1969) → Dart &
Kraft (1980) ► Kraft (1986) → Philip Morris (1988)
2,742.27 18.42%
3 447 National Can → Triangle Industries (1985) → Pechiney SA (1989) 2,628.72 18.31%
4485
Dr. Pepper → Private (1984) → Dr. Pepper Seven Up (1993) → Cadbury
Schweppes
(
1995
)
2,392.22 18.07%
5 458 Lane Bryant → Limited Stores (1982) ► Limited Inc. (1982) 1,997.87 17.62%
6 65 General Foods → Philip Morris (1985) 1,467.10 16.85%
7 197 Abbot Labs 1,281.33 16.51%
8 234 Warner-Lambert → Pfizer (2000) 1,225.25 16.40%
9 259 Celanese Corp. → Hoechast AG (1987) → Aventis (1999) 1,220.16 16.39%
10 299 Bristol Myers ► Bristol Myers Squibb (1989) 1,209.44 16.36%
11 433 Columbia Pictures → Coca-Cola (1982) 1,154.27 16.25%
12 487 Sweets Co. ► Tootsie Roll Industries (1966) 1,090.96 16.11%
13 274 American Chicle → Warner-Lambert (1962) → Pfizer (2000) 1,069.50 16.06%
14 143 Pfizer Inc. 1,054.82 16.03%
15 83 Coca-Cola 1,051.65 16.02%
16 267
California Packing Corp → Del Monte (1978) → Reynolds RJ Industries
(1979) → Private (1989) → RJR Nabisco Holdings (1991) → Philip Morris
(2000)
1,050.10 16.01%
17 117 Merck 1,032.64 15.97%
18 348 Lorillard → Loew's Theatres (1968) ► Loew's Corp (1971) 1,026.20 15.96%
19 66
National Dairy Products → Dart & Kraft (1980) ► Kraft (1986) → Philip
Morris (1988)
1,011.39 15.92%
20 218
Standard Brands → Nabisco Brands (1981) → Reynolds RJ Industries
(1985) ►RJR Nabisco (1986) → Private (1989) → RJR Nabisco Holdings
(1991) → Philip Morris (2000)
1,002.98 15.90%
Table 6. Returns on 20 top-performing Stocks from Total Descendants’ Portfolio
GICS Sector Returns
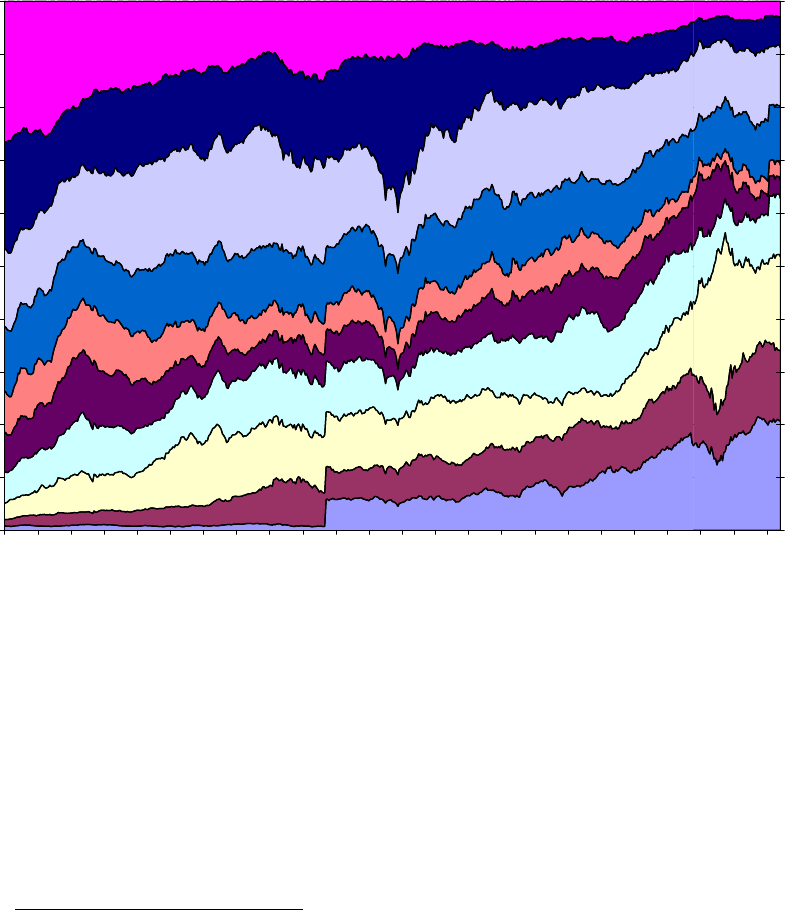
Figure 4 shows the share of the market value of the major sectors of the original S&P 500 Index in
1957 and the sector weights today.
18
The upward jump in the financial sector’s share in 1976 occurred
when Standard and Poor’s added 40 financial firms to the index.
Through the addition of new firms and the transformation of old firms, there has been a profound
change in the industry over the past half century. The three smallest sectors in 1957 (Financials,
18
While Standard & Poor’s developed the current GICS (Global Industry Classification Standard) definitions in 2001,
we were able to map firms into the sectors by using SIC (Standard Industry Classification) codes as well as S&P’s
Security Price Index Record which contains the complete company history of S&P industry groups.
16
Health Care, and Information Technology) became the three largest sectors by the end of 2003.
Financials grew from less than one percent of the market value of the S&P 500 Index to over 20%,
Health Care grew from 1.2% to 13.3%, and information technology grew from 3.1% to 17.7%.
On the other hand, the two largest sectors in 1957, materials and energy, have shrunk dramatically.
The Materials sector includes firms engaged in commodity-related manufacturing, such as
chemicals, steels, paper, etc. These firms comprised over one-quarter of the market’s value in 1957
but have become the second smallest sector in the index today. The energy sector has also shrunk
dramatically – from 20% of the market to only 6% today.
Financials
Health Care
Information Tech
Consumer Staples
Telecom Svc
Utilities
Industrials
Consumer Discretionary
Energy
Materials
0%
10%
20%
30%
40%
50%
60%
70%
80%
90%
100%
1957
1959
1961
1963
1965
1967
1969
1971
1973
1975
1977
1979
1981
1983
1985
1987
1989
1991
1993
1995
1997
1999
2001
2003
0%
10%
20%
30%
40%
50%
60%
70%
80%
90%
100%
Figure 4 Market Sector Share, 1957-2003
Table 7 lists the sector returns of the original and continually updated S&P 500 Index. The sector
returns based on the original firms in the index outpaced the sector returns based on the updated
S&P 500 Index in every sector except consumer discretionary.
19
This means that the outperformance
of the original firms in the S&P 500 Index was not concentrated in one sector, but present in all the
sectors of the economy.
19
As noted in footnote 7 above, the current GIC classification was begun in 1999. Prior to that date we matched firms to
the current classifications.

17
Original S&P
500
Total Descendants
Portfolio
Sector
Market Cap
1957
Market Cap
2003
Annual
Return
Market
Cap Final
Annual
Return
Difference
Consumer Discretionar
y
14.58% 6.86% 9.80% 11.30% 11.09% -1.29%
Consumer Staples 5.75% 20.19% 14.43% 10.98% 13.36% 1.07%
Energ
y
21.57% 31.82% 12.32% 5.80% 11.32% 1.01%
Financials 0.77% 1.12% 12.44% 20.64% 10.58% 1.86%
Health Care 1.17% 6.07% 15.01% 13.31% 14.19% 0.82%
Industrials 12.03% 10.33% 11.17% 10.90% 10.22% 0.95%
Information Tech 3.03% 3.10% 11.42% 17.74% 11.39% 0.03%
Materials 26.10% 10.33% 9.41% 3.04% 8.18% 1.23%
Telecom Svc 7.45% 5.94% 10.47% 3.45% 9.63% 0.84%
Utilities 7.56% 4.25% 9.97% 2.84% 9.52% 0.45%
Actual S&P 500
Table 7: Sector Returns on Total Descendants Portfolio and S&P 500 Index
The original firms in the consumer discretionary sector underperformed the updated sector for two
reasons. First, General Motors, which comprised over 43% of the sector’s market value in 1957,
realized a poor return of only 8.28%, far below the 11.09% return to the entire sector.
20
Secondly,
Wal-Mart, one of the best performing stocks in market history, was classified in the consumer
discretionary sector until 2003, when S&P switched it to the consumer staples sector. The
underperformance of General Motors and the superior performance of Wal-Mart are the reasons the
original firms in the consumer discretionary sector could not outperform the new firms added.
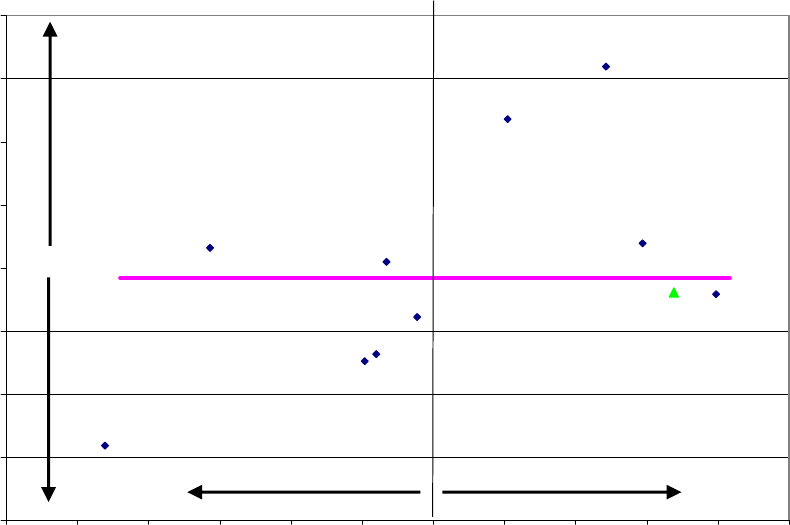
Sector Shifts and Sector Returns
Changes in the relative market value of a sector correlate only weakly with returns in that sector.
Investors often ignore stocks in declining market sectors, such as energy, and the low prices for their
stocks results in superior investor returns. On the other hand, expanding sectors frequently become
overvalued, attracting new firms that result in overexpansion, excess capacity, and a sharp
subsequent decline in share prices.
20
Without GM, the original sector’s return would be 79 basis points higher, whereas the updated sector would have only
been 43 basis points higher.
18
Consumer
Discr
Consumer Staples
Energy
Financials
Health Care
Industrials
Technology
Materials
Telecom
Utilities
S&P 500
Technology
Ex-IBM
7%
8%
9%
10%
11%
12%
13%
14%
15%
-30% -25% -20% -15% -10% -5% 0% 5% 10% 15% 20% 25%
Return
Shifts in GICS Sector Weighting
Expanding SectorContracting Sector
Inferior Returns Superior Returns
Figure 5: Relation between Change in Market Value and Return in each Sector
Figure 5 plots the return of each sector against the change in the weighting of the sector from 1957
through 2003. Energy and Consumer Discretionary had above-average returns despite contracting
sectors, while Financials had below average returns and Information Technology had slightly above
average returns, but without IBM, which dominated the index in the 1950s and 1960s, technology
would have also had below average returns. Eq. (1) below is a regression of the sectors’ returns, y
t
,
on the charge in the market share of the GIC sector, x
t
.
(1) y
t
= 0.1095 + .0753x
t
+ ε
t
; R
2
= 0.3187.
(t = 1.934)
Where, y
t
, is the sector’s return and x
t
is
the change of its share of market value. An R
2
of 0.31
indicates that less than one-third of the excess returns is associated with the change in the sector
weight. The other two-thirds of the return is due to the addition of new firms or changes in the
capitalization of existing firms.
Reasons for Underperformance of New Stocks
Our finding that the new firms added to the index since 1957 on average have actually reduced the
return to investors should not reflect poorly on Standard and Poor’s Index Committee or the firms

19
selected by this committee. In fact, S&P wisely resisted adding a number of technology and internet
firms in the late 1999s into the index although they attained huge market values.
21
Cyclical Overvaluation of New Firms
Despite S&P’s restrained, there is pressure to add firms of high market value when there is a
vacancy in the index. Therefore, when investor demand for a particular sector is high, such as for the
oil service stocks in the 1978-80 energy bubble or the technology and telecommunications stocks in
the 1998-2000 bubble, these stocks become candidates for admission to the index. Their high price
relative to fundamentals leads to a downward bias to future returns.
22
For example, the underperformance of the updated energy sector is due primarily to the oil and gas
extractors, many of which were added during the energy boom of the early 1980s. In fact, 12 of the
13 energy stocks that were added during the 1980s, such Texas Oil and Gas, McDermott
International, Pennzoil, Rowan, Baker Hughes, Helmerich & Payne, underperformed the index.
The telecommunications sectors also experienced a boom that resulted in the addition of overpriced
stocks that dragged down the performance of the sector. This sector added virtually no new firms
from 1957 through the early 1990s. But in the late 1990s, new firms, such as WorldCom, Global
Crossing, and Qwest entered the index and subsequently underperformed the average by a large
margin. In June of 1999 WorldCom constituted over 16% of sector’s market value, but subsequently
lost 97.9% of its value by the time it was deleted from the index in May 2002. Qwest lost over 65%
of its value since it was admitted, while Global Crossing lost over 98% of its value before it was
deleted in October 2001.
The technology sector, despite a few very successful firms, has been hurt by firms that have been
added when the public’s demand for technology stocks is high. Thirty six of the 125 technology
firms that have been added to this sector since its founding occurred in 1999 and 2000, and two-
thirds of these have underperformed the sector’s return since their admittance. Firms admitted in
1999 underperformed the sector by 4% per year and those admitted in 2000 subsequently
underperformed the sector by 12% annually. Despite the huge success of firms such as Intel,
Microsoft, Cisco, and Dell, the drag from the addition of overpriced technology firms significantly
hurt the performance of this important sector.
Price Pressure from Indexing
Another reason for superior performance of the original firms relates to the overvaluation of new
firms caused by price pressure exerted on new stocks by indexers that must buy shares of the firms
added to this popular benchmark. Standard and Poor’s Corporation published a study in September
2000 that noted that from the announcement date to the effective date of admission in the S&P 500
21
During the internet boom, S&P only admitted AOL, in January 1999 and Yahoo in December, 1999.
22
Ritter, Jay, ’Hot Issue’ Market of 1980, Journal of Business, 1984 (vol. 57, no. 2), pp 215-240 documents a similar
phenomena in the poor performance of initial public offerings during hot issue markets.

20
stock index, that over the previous decade shares rose by an average of 8.49%.
23
A more recent
study indicates that these price jumps have been reduced in recent years, but this may be due to
speculators who purchase firms that are candidates for admission, in turn pushing their price upward
before the announcement.
24
Value Bias of Original Portfolios
One of the reasons for the superior performance of the original portfolios is that the Total
Descendants’ Portfolio had a higher weights in sectors that outperformed over time and tended to
have lower price-to earnings ratios. Table 8 shows the sector weights of the Total Descendants’
portfolio on December 31, 2003 and compares this to the weights in the S&P 500 Index. Investors
in the TDP are significantly overweight in the energy sector and moderately overweight in the
consumer staples sector. Both of these sectors outperformed the S&P 500 Index. On the other hand,
investors in the TDP are underweight in the health care, financials and information technology
sectors.
Energy 34.82% 5.80% 29.02%
Consumer Staples 19.27% 10.98% 8.29%
Industrials 12.01% 10.90% 1.11%
Health Care 6.67% 13.31% -6.65%
Materials 6.78% 3.04% 3.74%
Consumer Discretionary 6.54% 11.30% -4.76%
Telecom Services 4.72% 3.45% 1.27%
Utilities 4.04% 2.84% 1.20%
Financials 2.67% 20.64% -17.98%
Information Technology 2.50% 17.74% -15.24%
Sector
Total
Descendants
S&P 500 Difference
Table 8: Composition of Total Descendants and S&P 500 portfolios on December 31, 2003.
Because the original portfolios became underweight in technology firms and overweight in energy
firms, they took on a significant “value” bias over time. On December 31, 2003, the average price to
earnings ratio, based on the last 12 months of reported earnings, was 15 on the TDP compared to 22
for the S&P 500 Index. Since the performance of “value” stocks has exceeded those of “growth”
23
Roger Bos, “Event Study: Quantifying the Effect of Being Added to an S&P Index,” Standard and Poor’s, September
2000.
24
See Srikant Das, “Index Effect Redux,” Standard and Poor’s, September 8, 2004

21
stocks from 1957 through 2003,
25
this explains some of the out performance of the original
portfolios.
Summary
Many in the financial community believe that the active updating of firms in the S&P 500 Index is
essential to obtain the high returns that this index has recorded over the past half century. This study
shows that this is not the case. We find that a portfolio of the original 500 stocks chosen by
Standard and Poor’s to formulate their index in 1957 have outperformed the standard, updated S&P
500 Index over the subsequent 46 year-period and with lower risk. Furthermore, the original firms in
nine of the ten GICS industry sectors have outperformed the new firms added to these sectors.
This study also shows that there is a weak relation between returns to a sector and the relative
change in aggregate market value of the sector. Some sectors that have outperformed the S&P 500
index have shrunk dramatically, such as energy, while others that have expanded greatly, such as
financials and information technology, have mediocre or below average returns. Less than one third
of a sector’s excess return over the S&P 500 Index is associated with the expansion or contraction of
a sector.
There are several reasons for the underperformance of the new firms added to the S&P 500 Index.
Temporary overvaluation of a firm’s stock, due to fluctuations in investor sentiment unrelated to
firm fundamentals, may push a firm’s valuation high enough to qualify for admittance to the index.
This overvaluation will result in a downward bias in future returns. Another source of overvaluation
is the price pressures exerted by indexers who must buy the stock when a new firm is admitted to the
index. Finally, the original portfolios had higher weights in value stocks with low prices relative to
fundamentals, such as energy and they were underweight in technology stocks.
25
Among the recent studies documenting superior performance of low P-E stocks are, Ibbotson Associates, Stocks,
Bonds, Bills, Inflation 2004 Yearbook and James O’Shaughnessy, What Works on Wall Street, Revised Edition,
McGraw-Hill, 1998. Important historical studies of the outperformance of low P-E stocks are ; S. F. Nicholson, “Price-
Earnings Ratios,” Financial Analysts Journal, July/August 1960, pp. 43–50; 2) S. Basu, “Investment Performance of
Common Stocks in Relation to their Price-Earnings Ratio: A Test of the Efficient Market Hypothesis,” Journal of
Finance, 32 (June 1977), pp. 663–82..
22
Bibliography
S. Basu, “Investment Performance of Common Stocks in Relation to their Price-Earnings
Ratio: A Test of the Efficient Market Hypothesis,” Journal of Finance, 32 (June 1977), pp.
663–82..
Bos, Roger. Event Study: Quantifying the Effect of Being Added to an S&P Index, Standard
and Poor’s, September 2000.
Srikant Das, “Index Effect Redux,” Standard and Poor’s, September 2004
Foster, Richard and Sarah Kaplan, Creative Destruction: Why Companies That Are Built to
Last Underperform the Market – and How to Successfully Transform Them. Random House,
New York, 2001.
Ibbotson Associates, Stocks, Bonds, Bills, Inflation 2004 Yearbook
Malkiel, Burton. A Random Walk Down Wall Street, W.W. Norton & Company, 2003
S. F. Nicholson, “Price-Earnings Ratios,” Financial Analysts Journal, July/August 1960, pp.
43–50; 2)
O’Shaughnessy, James, What Works on Wall Street, Revised Edition, McGraw-Hill, 1998
Ritter, Jay, ’Hot Issue’ Market of 1980, Journal of Business, 1984 (vol. 57, no. 2), pp 215-
240
Joseph Schumpeter, Capitalism, Freedom, and Democracy, Harper and Bros, New York,
1942.
Siegel, Jeremy. Stocks for the Long Run, 3
rd
edition, McGraw Hill, New York, 2002.
Standard and Poor’s Security Price Index Record, 2002 Edition
The Vanguard Group, The Case for Indexing, October 2003.

The Rodney L. White Center for Financial Research
The Wharton School
University of Pennsylvania
3254 Steinberg Hall-Dietrich Hall
3620 Locust Walk
Philadelphia, PA 19104-6367
(215) 898-7616
(215) 573-8084 Fax
http://finance.wharton.upenn.edu/~rlwctr
The Rodney L. White Center for Financial Research is one of the oldest financial research centers in the
country. It was founded in 1969 through a grant from Oppenheimer & Company in honor of its late
partner, Rodney L. White. The Center receives support from its endowment and from annual
contributions from its Members.
The Center sponsors a wide range of financial research. It publishes a working paper series and a reprint
series. It holds an annual seminar, which for the last several years has focused on household financial
decision making.
The Members of the Center gain the opportunity to participate in innovative research to break new ground
in the field of finance. Through their membership, they also gain access to the Wharton School’s faculty
and enjoy other special benefits.
Members of the Center
2004 – 2005
Directing Members
Geewax, Terker & Company
Goldman, Sachs & Co.
Hirtle, Callaghan & Co.
Morgan Stanley
Merrill Lynch
The Nasdaq Educational Foundation
The New York Stock Exchange, Inc.
Members
Aronson + Johnson + Ortiz, LP
Twin Capital
Founding Members
Ford Motor Company Fund
Merrill Lynch, Pierce, Fenner & Smith, Inc.
Oppenheimer & Company
Philadelphia National Bank
Salomon Brothers
Weiss, Peck and Greer
