
The Effects of Weather on Massachusetts Municipal
Expenditures: Implications of Climate Change for
Local Governments in New England
New England Public Policy Center
RESEARCH REPORT 22-2
By Bo Zhao
December 2022

New England Public
Policy Center
www.bostonfed.org/neppc
Sta
Hope Bodenschatz
Mary A. Burke
Nicholas Chiumenti
Eli Inkelas
Osborne Jackson
Matthew Sexton
Riley Sullivan
Tanner Thering
Jerey Thompson
Pinghui Wu
Bo Zhao
Table of Contents
Executive Summary ............................................................................................... 3
I. Introduction ......................................................................................................... 4
II. Weather Patterns ............................................................................................... 5
III. The Impact of Weather on Municipal Expenditures ..................................... 9
IV. Implications of Climate Change for Municipal Governments .................. 10
V. Policy Discussion ............................................................................................. 14
VI. Conclusion ...................................................................................................... 16
References ........................................................................................................... 17
Appendix .............................................................................................................. 18
The views expressed in this
report are those of the author
and do not necessarily repre-
sent positions of the Federal
Reserve Bank of Boston or the
Federal Reserve System.

FEDERAL RESERVE BANK OF BOSTON 3
NEW ENGLAND PUBLIC POLICY CENTER RESEARCH REPORT 22-2
EXECUTIVE SUMMARY
In New England, municipal governments provide a variety of public services that are vital
to residents and businesses, such as public works, police and re services, and general govern-
ment administration. However, the region and its local governments face an increasing threat
from climate change. As recorded by the National Oceanic and Atmospheric Administration, New
England states have become hotter and wetter and have experienced an increased number of
extreme precipitation events since 1900. Rising temperatures and more frequent extreme pre-
cipitation events are projected for the region through the end of this century. These changes in
weather conditions could damage public infrastructure, disrupt the delivery of public services,
and increase the costs of snow removal, road maintenance, the heating and cooling of public
buildings, and other local services.
Using Massachusetts data from 1990 through 2019, this report examines how weather
aects municipal expenditures. It nds that temperature and precipitation have a signicant
impact on local spending. Based on the estimated historical relationship between temperature
and local spending, the report nds that municipal expenditures will increase considerably in the
coming decades as a result of projected rising temperatures. These cost increases could create
signicant scal stress on municipalities and force them to raise taxes and fees.
Among the ndings highlighted in this report is that during the 1990–2019 period, a 1 degree
Fahrenheit increase in average temperature, on average, resulted in a 3.2 percent increase in per
capita municipal general-fund expenditures in Massachusetts. During the same period, a 1 per-
centage point increase in the percentage of days in each year with at least 1 inch of snowfall, on
average, led to an increase in per capita municipal expenditures of about 0.4 percent. This report
estimates that if global emissions continue to grow at their current rates, resulting in signicantly
higher temperatures in Massachusetts, per capita annual municipal expenditures will increase 30
percent for the 2090–2099 decade relative to average per capita annual municipal expenditures
for the 1990–2019 period. Given the substantial similarities in scal structures and weather pat-
terns throughout New England, these ndings are likely to apply to other states in the region.
This report recommends that municipalities account for climate change in their long-term
municipal nancial planning, since early policy actions are often more cost eective than later
ones. Investing in improvements to the climate resilience of public infrastructure is important, and
it is particularly urgent for New England, given how dated the region’s infrastructure systems are.

4 FEDERAL RESERVE BANK OF BOSTON
NEW ENGLAND PUBLIC POLICY CENTER RESEARCH REPORT 22-2
I. Introduction
The New England region has already begun to experience long-term changes in its weather con-
ditions. It has become hotter and wetter and has seen more frequent extreme precipitation events
over the past century (Kunkel et al. 2022). The average temperature in each New England state
has risen 3 to 4 degrees Fahrenheit since 1900, and annual precipitation has generally increased
since 1895. A record number of extreme precipitation events occurred during the 2005–2014
period. Climate scientists at the National Oceanic and Atmospheric
Administration (NOAA) project that temperatures and the frequency
and intensity of heat waves and extreme precipitation events in New
England will continue to increase in the coming decades.
Previous research suggests that changes in weather conditions
have a signicant impact on economic and social activities, especially
for low-income areas. Hsiang et al. (2017) show that an increase in the
average temperature leads to a reduction in GDP and employment. The
negative eect of a higher average temperature on economic growth is
stronger for low-income countries and may decrease their political sta-
bility (Dell, Jones, and Olken 2012). Extreme high temperatures are also found to increase mortality;
therefore, climate change is expected to raise the mortality rate (Deschenes and Greenstone 2011).
The largest mortality increases will likely occur in places where temperatures are already high and
poverty is prevalent (Carleton et al. 2022). In addition, Ranson (2014) nds that higher temperatures
result in more criminal activities.
Using Massachusetts data, this report examines the impact of weather on local government
spending, a subject that has not been studied previously. Municipal governments are important
economic agents because they provide a wide range of public services, such as snow removal, road
maintenance, police and re services, and general government administration. These services are
critical for maintaining residents’ quality of life and businesses’ smooth operation. It is important to
understand how weather aects spending on these local services. Informed by such an understand-
ing, this report makes a projection of the future impact of climate change on local budgets. It then
discusses municipal policy actions for mitigating and adapting to climate change.
This report shows that weather has a signicant impact on municipal expenditures in
Massachusetts. A 1 degree Fahrenheit increase in average temperature, on average, results in a 3.2
percent increase in per capita municipal expenditures from the general fund. A 1 percentage point
increase in the percentage of days in each scal year with at least 1 inch of snowfall, on average,
raises municipal expenditures by 0.4 percent. Public works and general government are shown to
be the two most aected government functions, likely because they are directly involved in snow
removal, road maintenance, and the heating and cooling of public buildings. Furthermore, municipal
expenditures will likely increase considerably by the end of this century as a result of rising tem-
peratures. If global emissions continue growing at their current rates, average per capita municipal
expenditures for the 2090–2099 period are projected to be 30 percent, or $924, higher than average
per capita municipal expenditures for the 1990–2019 period. It will be dicult for municipalities to
absorb these added costs without signicantly increasing taxes and fees. This report recommends
that municipalities account for climate change in their long-term nancial planning and invest in
improvements to public infrastructure so that it becomes more adaptative to climate change.
The ndings of this report are applicable throughout New England, as all the region’s states have
similar scal structures and weather patterns. Each has either no or an extremely limited county gov-
ernment, and as a result, municipal governments provide almost all local public services. In addition,
Municipal expenditures
will increase considerably
in the coming decades as
a result of projected rising
temperatures.

FEDERAL RESERVE BANK OF BOSTON 5
NEW ENGLAND PUBLIC POLICY CENTER RESEARCH REPORT 22-2
school districts in New England depend scally on municipal governments, which also distinguishes
the region from the rest of the United States. School districts in New England have no legal author-
ity to raise taxes; instead, their revenues rely on municipal appropriations and state grants. The
New England states have experienced similar increases in temperature and precipitation since the
beginning of the 20
th
century (Kunkel et al. 2022), and they are all projected to see higher temper-
atures and more extreme precipitation events in future decades. Furthermore, their recent policy
responses to climate change have been similar. For example, they have accelerated weatherizing
public buildings and improving their energy eciency. I provide a more comprehensive discussion of
regional eorts later in the report.
II. Weather Patterns
Massachusetts municipalities have experienced changes in weather patterns over the last 30
years. Overall, their average temperatures and annual precipitations have trended upward since
scal year (FY) 1990. Days with extremely hot temperatures or extreme precipitation have become
more common. Though municipalities’ long-term weather patterns share a similar trend, they are
considerably dierent across regions of the state.
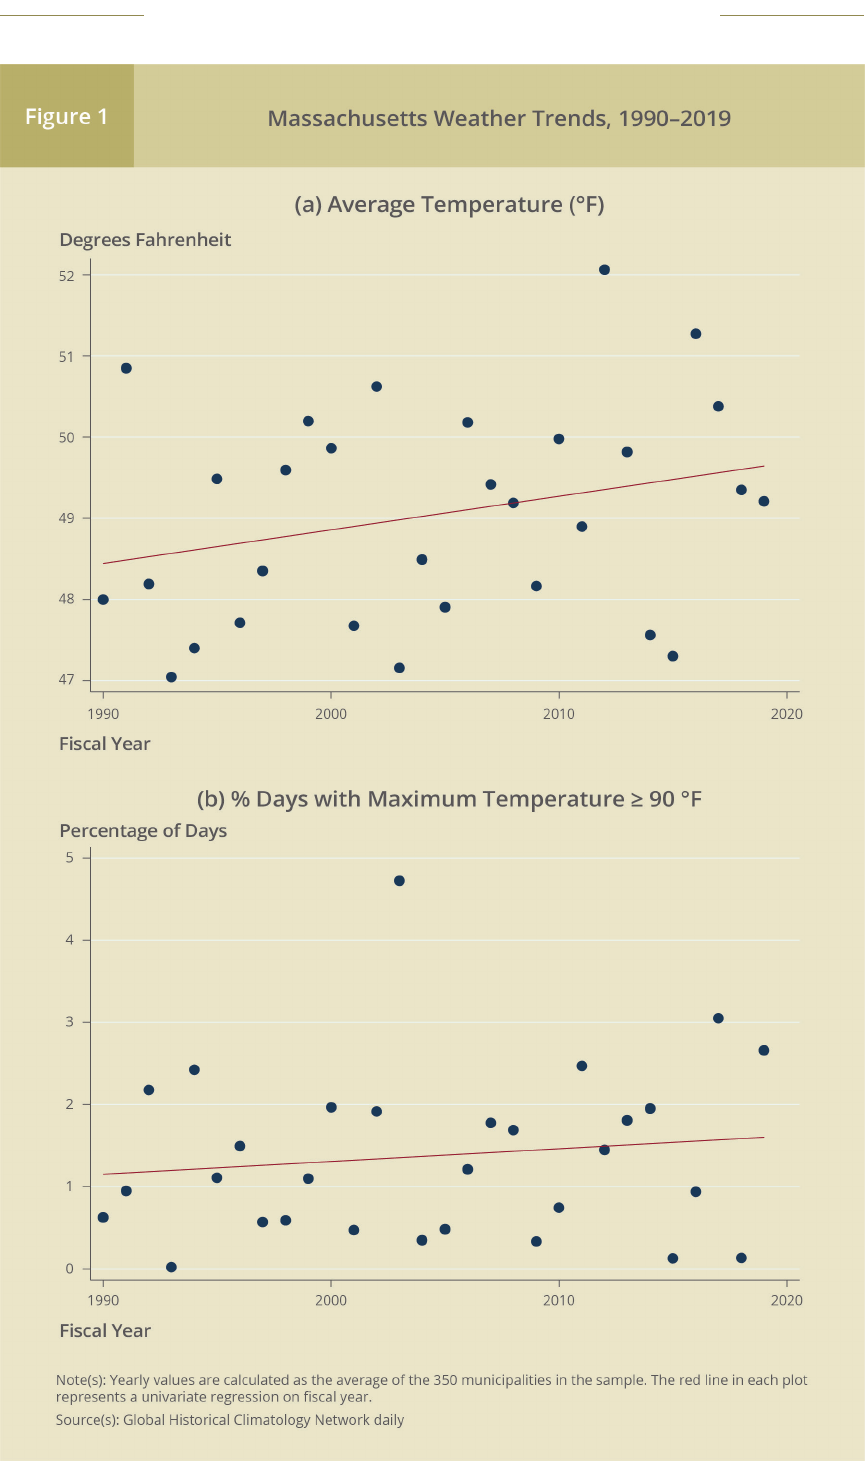
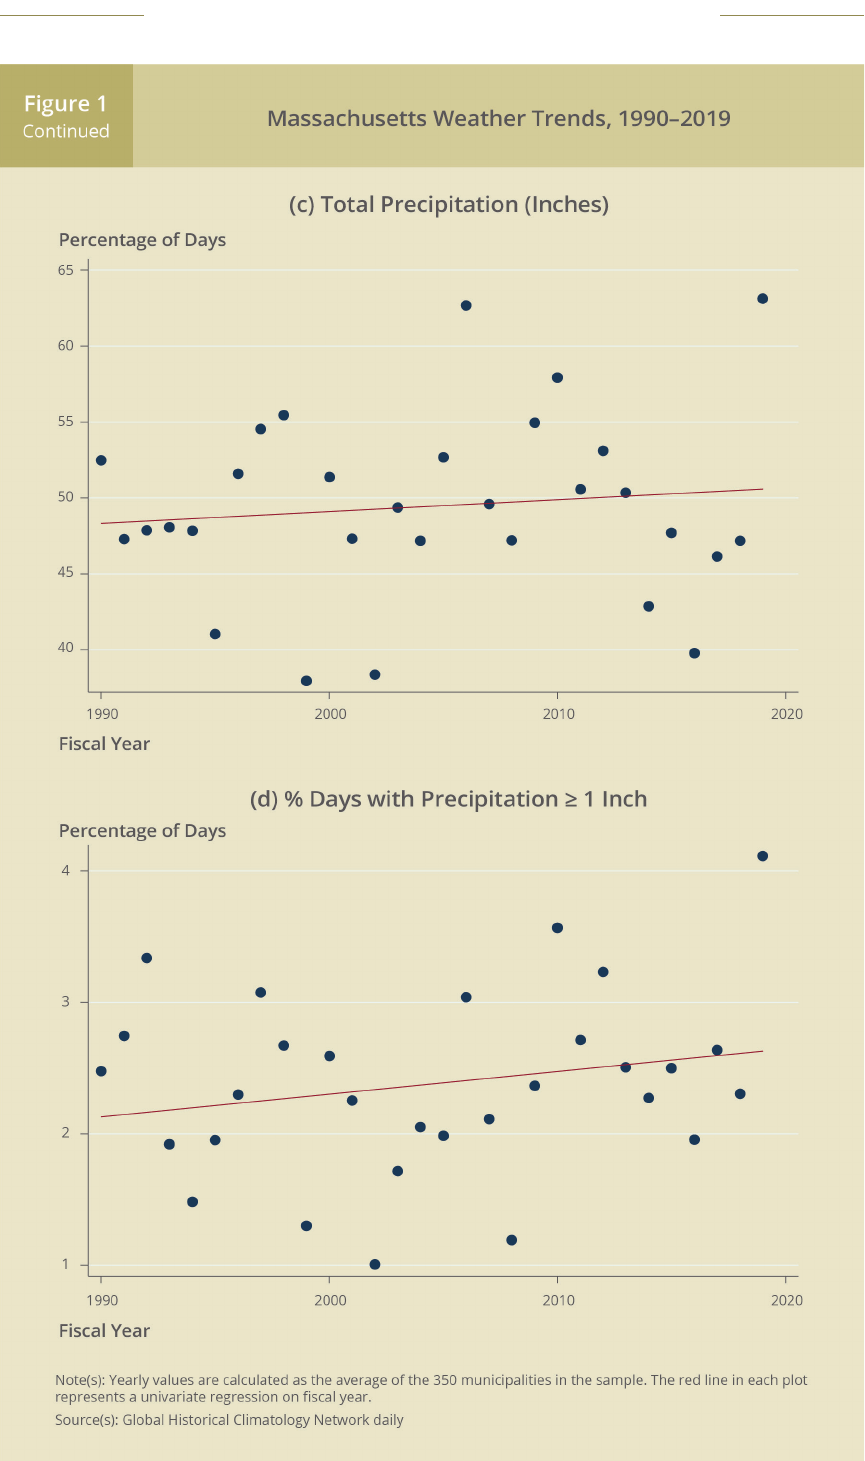
Massachusetts has become hotter and wetter and experienced more frequent extreme weather
events over time. From FY1990 through FY2019, the annual average temperature increased 0.04
degree Fahrenheit per year, on average, across the state’s municipalities (Figure 1a).
1
Over the
same 30-year span, the share of days in each scal year that reached or exceeded 90 degrees
Fahrenheit rose 0.015 percentage point per year, on average (Figure 1b).
Meanwhile, annual precipitation increased 0.08 inch per year, and the
share of days with at least 1 inch of precipitation rose 0.017 percent-
age point per year, on average, across Massachusetts municipalities
(Figures 1c and 1d).
These observations are consistent with a recent assessment of
Massachusetts’s climate from the NOAA (Kunkel et al. 2022). It nds
that the state’s average temperature has risen nearly 3.5 degrees
Fahrenheit since 1900 and that the average annual precipitation
for the 1970–2020 period was greater than that for the 1895–1969
period by about 4.7 inches.
Long-term weather patterns show considerable regional dierences in the state. Municipalities
in eastern Massachusetts experienced higher average temperatures from FY1990 through FY2019
compared with cities and towns in the western portion of the state (Figure 2a). Municipalities in the
southern part of the state tended to have more annual precipitation over that 30-year period com-
pared with cities and towns in the north (Figure 2b).
1 See the Appendix for details on how the weather data for each municipality were constructed.
Massachusetts has
become hotter and
wetter and experienced
more frequent extreme
weather events over time.
6 FEDERAL RESERVE BANK OF BOSTON
NEW ENGLAND PUBLIC POLICY CENTER RESEARCH REPORT 22-2
FEDERAL RESERVE BANK OF BOSTON 7
NEW ENGLAND PUBLIC POLICY CENTER RESEARCH REPORT 22-2

8 FEDERAL RESERVE BANK OF BOSTON
NEW ENGLAND PUBLIC POLICY CENTER RESEARCH REPORT 22-2

FEDERAL RESERVE BANK OF BOSTON 9
NEW ENGLAND PUBLIC POLICY CENTER RESEARCH REPORT 22-2
III. The Impact of Weather on Municipal Expenditures
I use a statistical method to systematically analyze the relationship between weather and
government spending among Massachusetts municipalities over the last three decades. The
analysis shows that temperature and precipitation have a signicant impact on municipal expen-
ditures, with this impact varying by government function and by community type.
I use regression analysis to examine the eects of weather on municipal general-fund expen-
ditures during the FY1990–FY2019 period.
2
This approach controls for per capita property tax
base, per capita state grants, and other confounding factors that may be corrected with weather
variables.
3
This enables me to interpret the regression results as causal eects of weather on
local government spending.
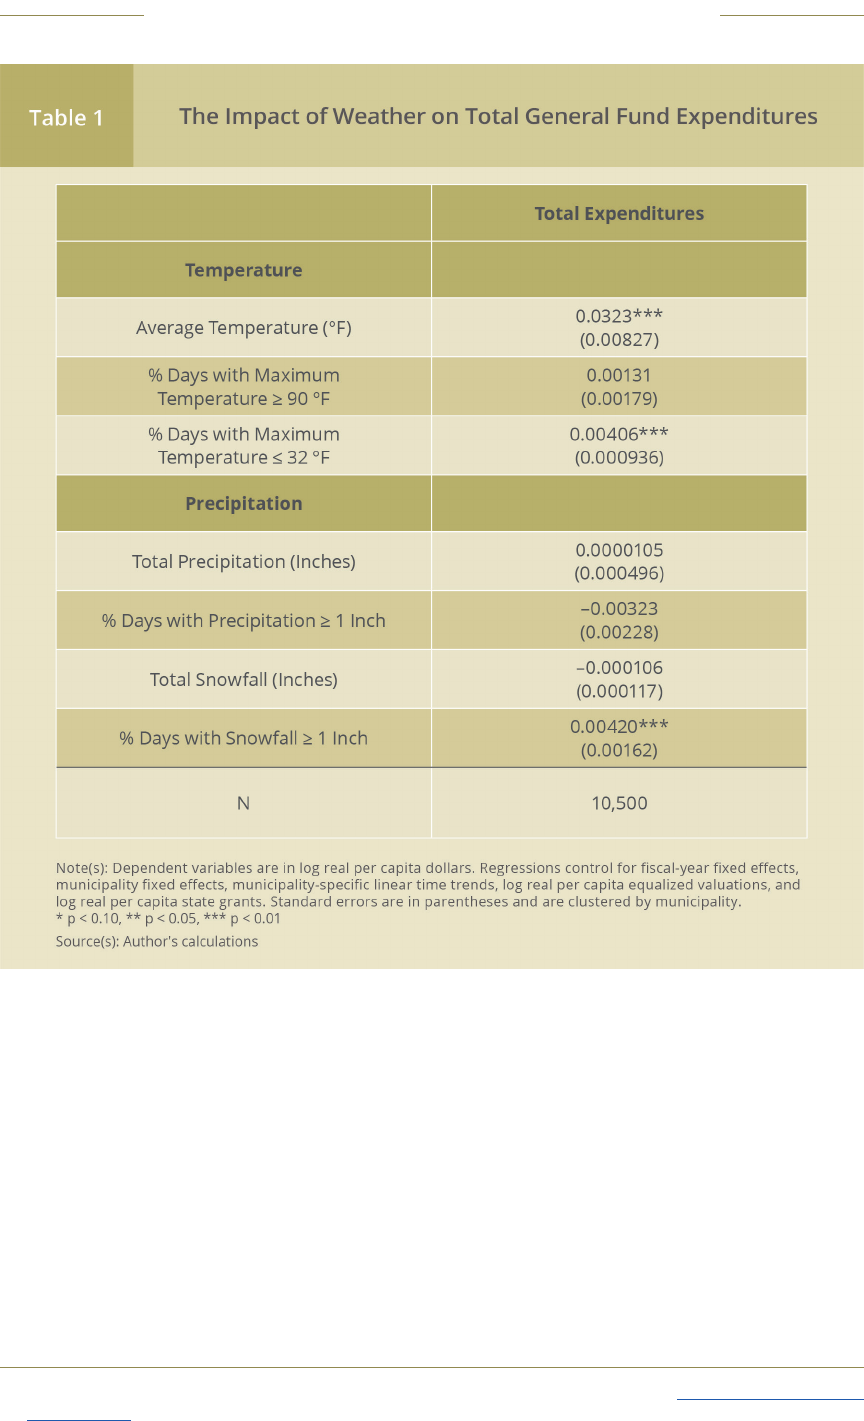
The regressions show that weather has a statistically signicant and economically meaning-
ful impact on municipal expenditures (Table 1). A 1 degree Fahrenheit increase in annual average
temperature, on average, results in a 3.2 percent increase in ination-adjusted per capita total gen-
eral-fund expenditures. The average Massachusetts municipality spent $3,108 per capita per year
(in 2019 dollars) in total general-fund expenditures over the FY1990–FY2019 period. For this level of
yearly spending, a 3.2 percent increase represents an additional $100 of per capita expenditures.
Total expenditures also appear to be aected by the frequency of extremely cold days and heavy
snowfalls. A 1 percentage point increase in the percentage of days with a maximum temperature of
32 degrees Fahrenheit or colder or in the percentage of days with at least 1 inch of snowfall, on aver-
age, leads to an increase in per capita total expenditures of about 0.4 percent. This amounts to an
increase of about $12 per capita in 2019 dollars for the average Massachusetts municipality.
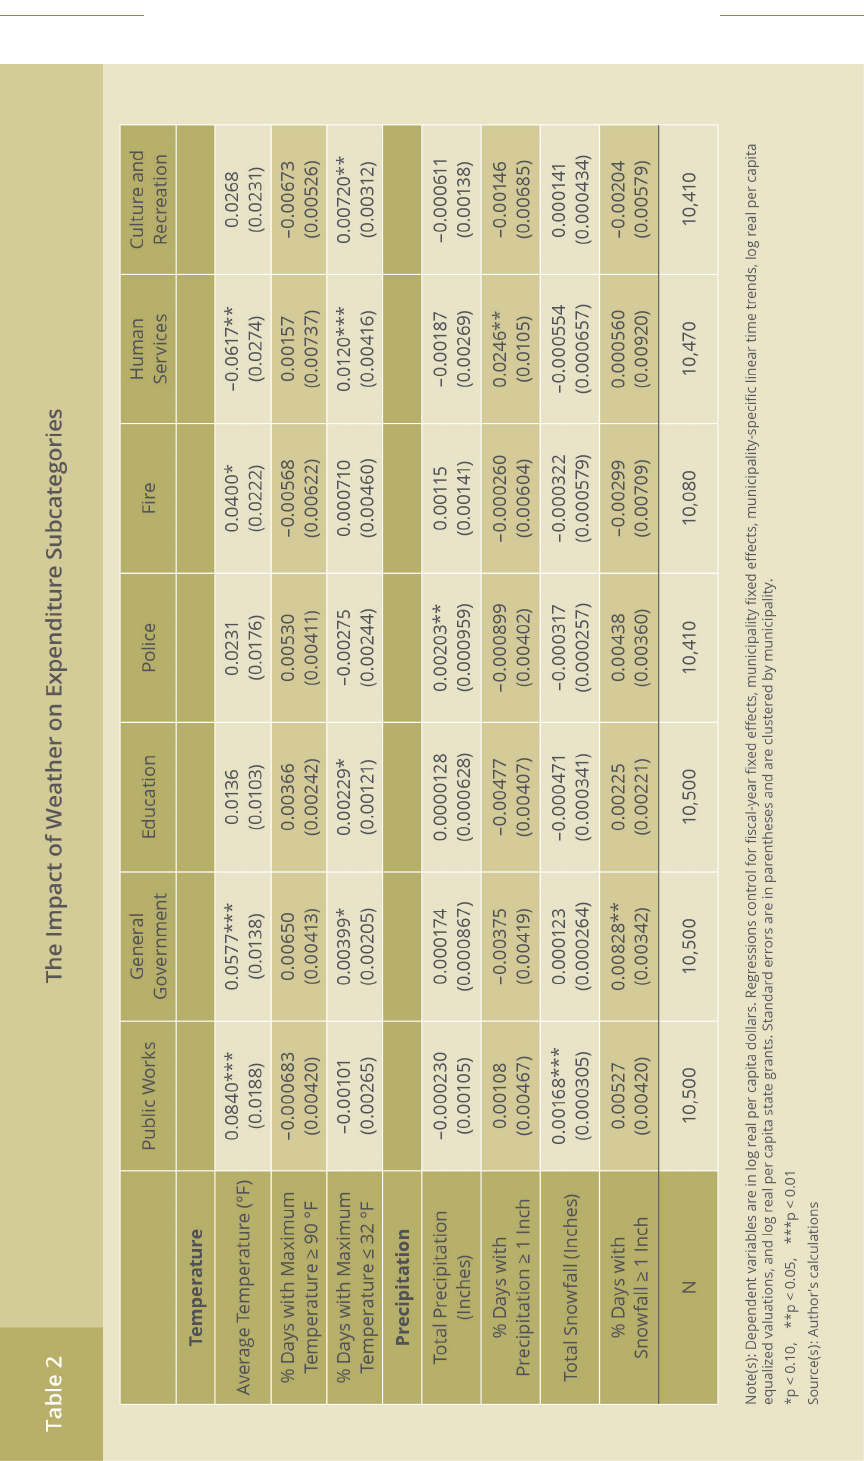
Among the government functions supported by the general fund, public works, general gov-
ernment, and human services are more aected by weather than others (Table 2). For example,
spending on public works increases with annual average temperature and total snowfall. The latter
result conforms to the common understanding that more snowfall generates higher costs for snow
removal and road maintenance.
In addition, weather aects dierent types of communities to diering extents. Massachusetts
coastal communities are highly vulnerable to damage from nor’easters, tropical storms, and hur-
ricanes (Kunkel et al. 2022). Indeed, Zhao (2022) suggests that an increase in the percentage of days
with at least 1 inch of precipitation results in larger municipal expenditures for coastal municipali-
ties than for inland municipalities. Climate experts warn that densely populated urban areas are
more vulnerable to the eects of heat waves, storms, and ooding (Kunkel et al. 2022). However,
the results in Zhao (2022) paint a mixed picture of the eects of weather on the spending of densely
populated urban areas relative to the spending of sparsely populated rural areas. On the one hand,
an increase in the percentage of days with at least 1 inch of precipitation results in more govern-
ment spending in high-density areas than in low-density areas. On the other hand, government
spending in high-density areas appears to be less aected by increases in average temperature,
annual precipitation, and the frequency of extremely cold days. This is likely because these high-
density communities enjoy greater economies of scale, and their economic structures depend less
on weather compared with the economic structures of low-density rural areas where agriculture
still plays an important role.
2 The general fund accounts for most nancial activities that are governed by normal municipal appropriations and that
support daily government operations. It is outside the scope of this paper to study other government funds, such as
enterprise funds and capital projects funds.
3 I include municipality xed eects to control for unobserved municipal characteristics that were constant over time. I also
include scal-year xed eects to control for shocks shared by all Massachusetts municipalities in each scal year, such as
business cycles and state policy changes. In addition, I include a time trend that is specic to each municipality to account
for the possibility that municipalities’ spendings were on dierent time paths.
10 FEDERAL RESERVE BANK OF BOSTON
NEW ENGLAND PUBLIC POLICY CENTER RESEARCH REPORT 22-2
IV. Implications of Climate Change for Municipal Governments
With climate change, average temperatures are expected to rise in the coming decades.
Based on the historical relationship between temperatures and local spending, rising tempera-
tures will likely increase Massachusetts’s average per capita municipal expenditures by as much
as 30 percent by the end of the century relative to average expenditures for the 1990–2019
period. These cost increases could create signicant scal stress for local governments.
The Climate Explorer, created by the NOAA Climate Program Oce, provides annual projec-
tions for county-level temperatures, precipitation, and other climate conditions out to the year
2100.
4
The projections were made under two scenarios of global emissions of heat-trapping gases.
Under the “high-emissions” scenario, global emissions will continue growing at current rates.
5
This
is sometimes known as the “business-as-usual” path. Under the “low-emissions” scenario, global
4 The Climate Explorer website, Frequently Asked Questions, accessed September 21, 2022, https://crt-climate-explorer.
nemac.org/faq/.
5 This scenario is also known as the Representative Concentration Pathway 8.5 (RCP 8.5), in which the atmosphere’s radiative
forcing level in 2100 is at least 8.5 watts per square meter greater than pre-industrial-era values.
FEDERAL RESERVE BANK OF BOSTON 11
NEW ENGLAND PUBLIC POLICY CENTER RESEARCH REPORT 22-2
12 FEDERAL RESERVE BANK OF BOSTON
NEW ENGLAND PUBLIC POLICY CENTER RESEARCH REPORT 22-2
emissions will peak around 2040 and afterward remain relatively stable.
6
This would require a sub-
stantial reduction in emissions through the end of the 21st century.
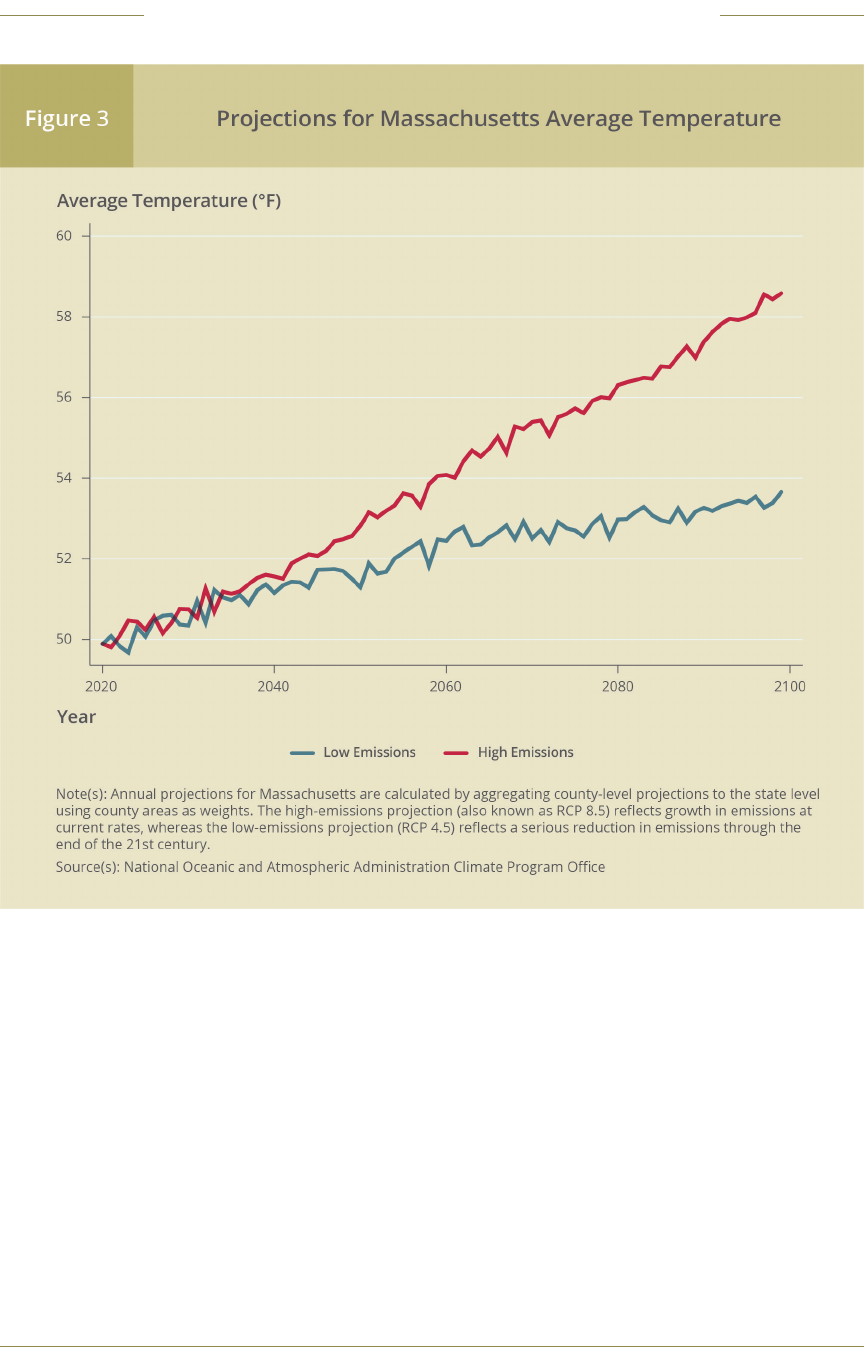
I focus on projections for the average temperature, since the regressions suggest that it has the
most signicant impact on local spending.
7
Figure 3 indicates that the annual average temperature
in Massachusetts is projected to rise in future decades under either scenario.
8
It will likely rise from
about 50 degrees Fahrenheit in 2020 to nearly 54 degrees Fahrenheit under the low-emissions sce-
nario and almost 59 degrees Fahrenheit under the high-emissions scenario by the end of this century.
A couple of caveats should be noted when using the regression model to project the s-
cal impact of climate change. First, the regression coecients in Tables 1 and 2 are identied
based on year-over-year changes in weather conditions. These short-term weather changes
may aect government costs dierently compared with the long-term changes associated with
climate change. If that is true, the regression results will not be entirely applicable to project-
ing the impact of climate change. Second, because the regression model was estimated based
6 This scenario is also known as the Representative Concentration Pathway 4.5 (RCP 4.5), in which the atmosphere’s radiative
forcing level in 2100 is 4.5 watts per square meter greater than pre-industrial-era values.
7 The projections for the annual average temperature are derived by taking an average of the projected annual average
maximum and minimum daily temperatures.
8 I use county area as the weight to calculate the weighted mean as the average temperature for the state.
FEDERAL RESERVE BANK OF BOSTON 13
NEW ENGLAND PUBLIC POLICY CENTER RESEARCH REPORT 22-2
on historical data, using it to make projections assumes implicitly that the relationship between
weather and local spending in the future will be the same as it was in the past. However, that may
not be the case. In fact, Zhao (2022) nds some evidence that Massachusetts municipal govern-
ments have adapted and become less sensitive to temperature over the past 30 years. Thus, the
scal projections based on the regression results should be treated as directional guidance rather
than as precise forecasts.
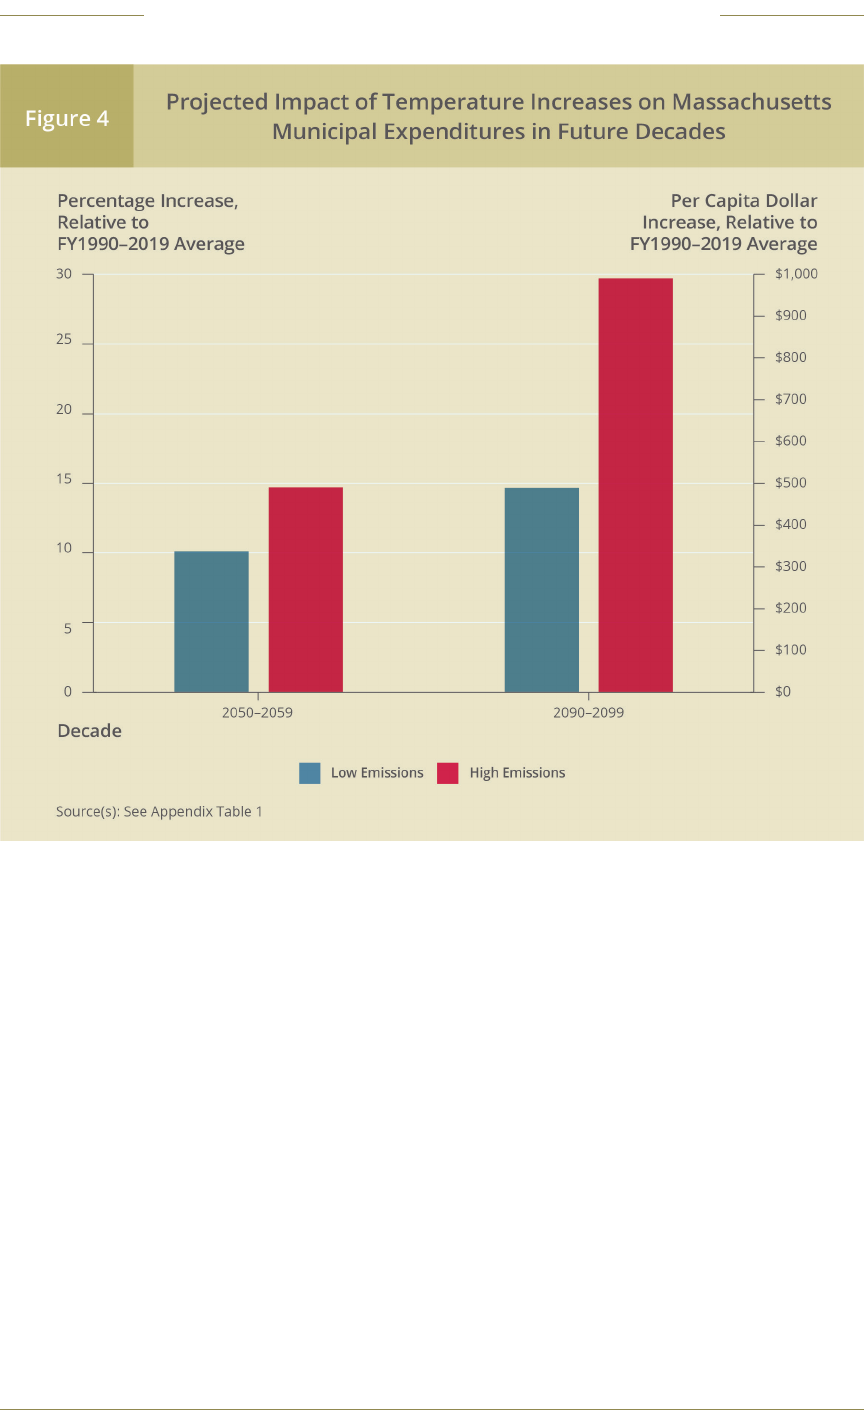
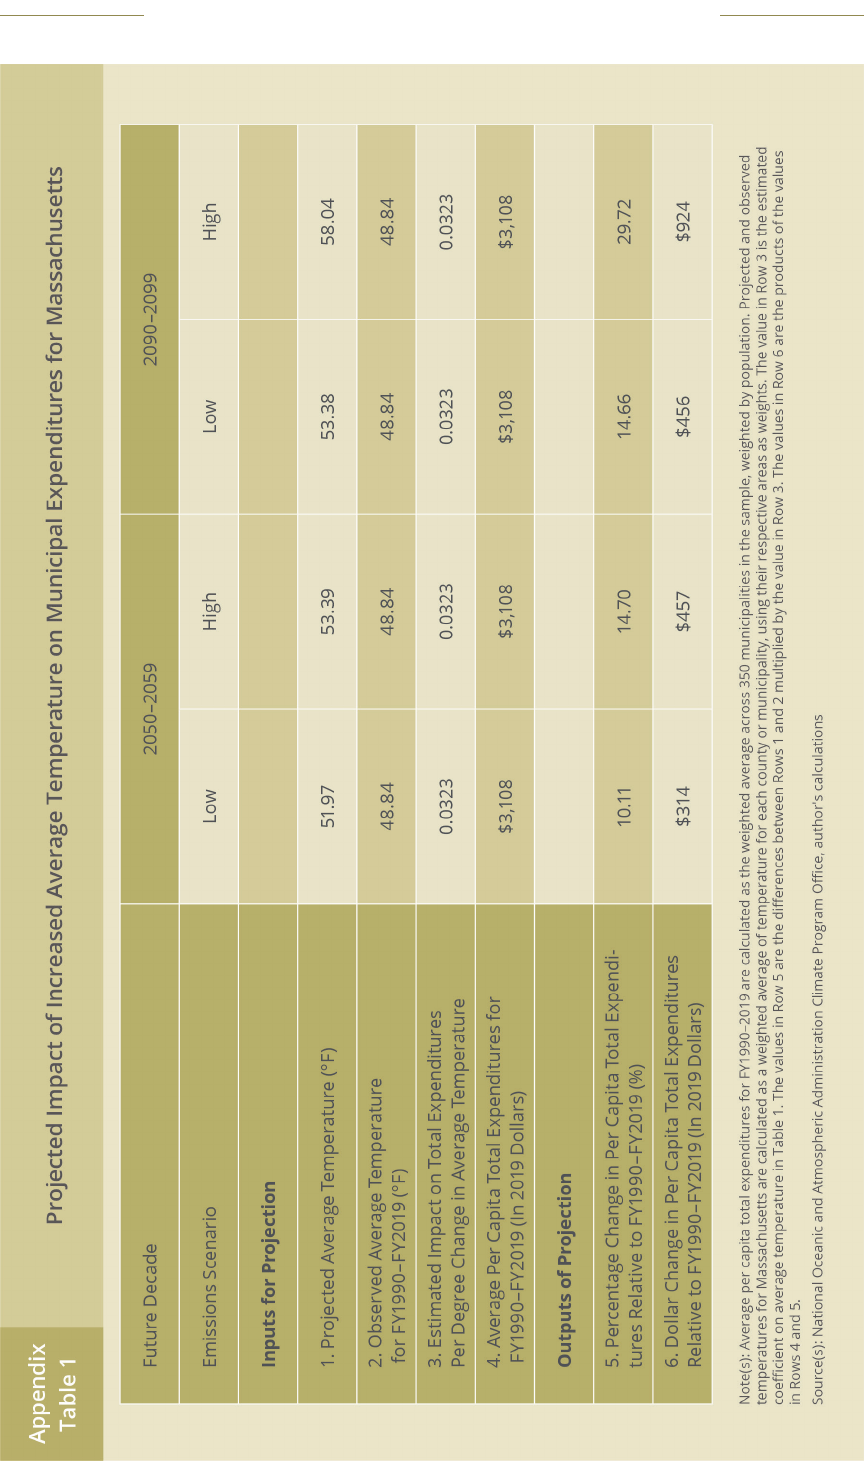
Figure 4 illustrates the impact of projected temperature increases on Massachusetts munici-
pal expenditures for future decades.
9
The gure depicts two future decades: a mid-century decade
(2050 through 2059) and the last decade of the century (2090 through 2099). The Climate Explorer
creators recommend using decadal averages as a more reliable alternative to annual projections,
since annual projections could have large margins of error. With the projected rise in temperatures,
municipal expenditures are estimated to increase 10 to 15 percent for the 2050–2059 period and 15
to 30 percent for the 2090–2099 period relative to the 1990–2019 period. In terms of dollar changes
from average per capita annual expenditures for the 1990–2019 period, projected temperature
increases are estimated to raise municipal expenditures by $314 to $457 per capita (in 2019 dollars)
for the 2050–2059 period and by $456 to $924 per capita (in 2019 dollars) for the 2090–2099 period.
These large increases could have a signicant impact on the scal health of local governments and
may be dicult or impossible to accommodate without signicant increases in taxes and fees.
9 Appendix Table 1 shows how the impact of projected temperature increases on Massachusetts municipal expenditures
is calculated.

14 FEDERAL RESERVE BANK OF BOSTON
NEW ENGLAND PUBLIC POLICY CENTER RESEARCH REPORT 22-2
V. Policy Discussion
A robust policy response is necessary to address the impact of climate change on municipali-
ties. Some research suggests that early actions are important and often more ecient than later
ones in alleviating future impact (Catalano, Forni, and Pezzolla 2020). It is more cost eective to
reduce emissions and adapt proactively, but such policy may not have received sucient emphasis
in current municipal budgets. Thus, municipalities should take into account climate change in their
long-term nancial planning. It is important to make eorts to “climate-proof” public infrastructure,
such as roads, public buildings, and water and sewer systems.
In recent years, New England states and many municipalities in the region have actively pur-
sued ways to address the challenges presented by climate change. For example, they have
endeavored to reduce emissions of heat-trapping gases. Transportation is one of the largest
sources of emissions in the region (Massachusetts Executive Oce of Energy and Environmental
Aairs 2022). To reduce emissions from transportation, states and
municipalities have expanded and upgraded or plan to expand and
upgrade bicycle and pedestrian infrastructure and public transit. The
Massachusetts Department of Transportation committed $240 million
in 2018 to fund additional sidewalks and bike lanes (Massachusetts
Executive Oce of Energy and Environmental Aairs, Massachusetts
Executive Oce of Public Safety and Security, and Massachusetts
Emergency Management Agency 2018). Vermont runs a program called
VTrans that awards money to bicycle and pedestrian infrastructure
programs.
10
Connecticut aims to deploy a eet of municipal vehicles
that is 100 percent electric by 2030 and operate a bus eet that is
entirely electric by 2035.
11
On the local level, Worcester, Massachusetts, recently partnered with a
nonprot and a state agency to run a pilot program providing 100 free e-bikes to residents,
12
and
Burlington, Vermont, oers a $200 rebate to any resident purchasing an e-bike.
13
Many states oer
subsidies for the purchase of electric vehicles. These policies are designed to encourage alternative
transit modes that use cleaner energy and less energy than gas-fueled cars.
Heating and cooling buildings is another major source of emissions in the region (Massachusetts
Executive Oce of Energy and Environmental Aairs 2022). States and many municipalities have
accelerated weatherizing public buildings and improving their energy eciency. For example, in
June 2022, Maine launched a $15 million initiative to fund improvements to heating and cooling sys-
tems in public schools, municipal buildings, and nonprot residential facilities.
14
Through its Lead by
Example program, Connecticut has provided more than $117 million to fund energy improvements
to state agency buildings since 2012, including retrotting heating and cooling systems, installing
LED lighting, and improving insulation.
15
10 State of Vermont Agency of Transportation website, Bicycle and Pedestrian Program, accessed September 21, 2022, https://
vtrans.vermont.gov/highway/local-projects/bike-ped/.
11 The Oce of Governor Ted Lamont press release, “Governor Lamont Signs Executive Order Directing Connecticut State Agencies
To Implement Actions That Reduce Carbon Emissions and Adapt to Climate Crisis,” December 16, 2021, https://portal.ct.gov/
Office-of-the-Governor/News/Press-Releases/2021/12-2021/Governor-Lamont-Signs-Executive-Order-Directing-Connecticut-
State-Agencies-To-Implement-Actions.
12 MassBike website, Worcester E-Bike Program, accessed September 21, 2022, https://www.massbike.org/ebikeworcester.
13 Burlington Electric Department website, E-Bikes, accessed September 21, 2022, https://www.burlingtonelectric.com/ebike.
14 State of Maine Oce of Governor Janet T. Mills press release, “Governor Mills and Eciency Maine Announce $15 Million
Maine Jobs and Recovery Plan Initiative to Cut Energy Costs in Schools and Public Buildings,” June 17, 2022, https://www.
maine.gov/governor/mills/news/governor-mills-eciency-maine-announce-15-million-maine-jobs-recovery-plan-initiative-cut.
15 Connecticut Department of Energy and Environmental Protection website, Lead by Example: Improving Energy Management
at State Facilities, accessed September 21, 2022, https://portal.ct.gov/DEEP/Energy/Lead-By-Example/Lead-By-Example.
New England states and
many municipalities
have actively pursued
ways to address the
challenges presented
by climate change.

FEDERAL RESERVE BANK OF BOSTON 15
NEW ENGLAND PUBLIC POLICY CENTER RESEARCH REPORT 22-2
Another popular strategy for emission reduction is to increase the use of cleaner and renew-
able energy to replace fossil fuels. For example, Maine
16
and Rhode Island
17
have committed to
purchasing 80 percent and 100 percent, respectively, of their electricity demand from providers of
renewable energy by 2030. West Warwick, Rhode Island, recently became the rst municipality in
the state to source 100 percent of its electricity from local providers of solar and wind power.
18
Municipalities across the region have also been actively adapting to climate change. In addi-
tion to improving the heating and cooling systems of public buildings, many have updated their
zoning codes to move housing away from areas with an increasing ood risk. Meanwhile, states
have played an important role in providing technical and nancial support and helping municipali-
ties better prepare for climate change. For example, the state of Rhode Island requires members
of local planning commissions to complete training modules through a program called Prep-RI,
which educates them about the risks of development in areas prone to ooding.
19
Massachusetts
runs a Municipal Vulnerability Preparedness (MVP) grant program to help cities and towns evalu-
ate their risk level and prepare for climate change. At least 335 municipalities, accounting for 99
percent of the state’s population, have received such grants.
20
Furthermore, the MVP grant program
in Massachusetts, the Climate Resilience Fund in Rhode Island, and the Infrastructure Adaptation
Fund in Maine have funded many local projects to protect against climate change. For example,
Falmouth, Massachusetts,
21
and Warren, Rhode Island,
22
received grants from their respective
states to remove dams and restore the ood plains around rivers in their jurisdictions. In 2022,
Maine granted a total of $20 million to 13 municipalities to make improvements to stormwater and
wastewater facilities.
23
These projects will increase natural water-storage capacity and help prepare
for extreme precipitation and rising sea levels. In addition, many municipalities have received state
grants to plant more trees to provide shade and help reduce the number of “heat islands” in densely
populated areas.
24
16 State of Maine Oce of Governor Janet T. Mills press release, “Governor Mills and Eciency Maine Announce $15 Million
Maine Jobs and Recovery Plan Initiative to Cut Energy Costs in Schools and Public Buildings,” June 17, 2022, https://www.
maine.gov/governor/mills/news/governor-mills-eciency-maine-announce-15-million-maine-jobs-recovery-plan-initiative-cut.
17 State of Rhode Island Governor Gina M. Raimondo Executive Order 20-01, Advancing a 100% Renewable Energy Future for
Rhode Island by 2030, January 17, 2020, https://governor.ri.gov/sites/g/les/xkgbur236/les/2021-06/Executive-Order-20-01.pdf.
18 State of Rhode Island Climate Change website, Cities and Towns, Success Stories, accessed September 21, 2022, https://
climatechange.ri.gov/cities-and-towns.
19 State of Rhode Island Climate Change website, Toolkits and Guidance, New Mandatory Education for Planning Boards/
Commissions, accessed September 21, 2022, https://climatechange.ri.gov/cities-and-towns/toolkits-and-guidance.
20 Massachusetts Executive Oce of Energy and Environmental Aairs press release, “Baker-Polito Administration Awards
Municipal Vulnerability Preparedness Planning Grants to Seven Municipalities,” February 15, 2022, https://www.mass.gov/
news/baker-polito-administration-awards-municipal-vulnerability-preparedness-planning-grants-to-seven-municipalities.
21 Massachusetts Executive Oce of Energy and Environmental Aairs, Municipal Vulnerability Preparedness,
Coonamessett River Restoration: Phase 2 Construction, accessed September 21, 2022, https://www.mass.gov/doc/
falmouth-fy19-featured-project-case-study/download.
22 State of Rhode Island Department of Environmental Management press release, “DEM Awards $4,360,600 to Help RI
Communities Confront the Eects of Climate Change,” July 29, 2020, https://www.ri.gov/press/view/38968.
23 State of Maine Oce of Governor Janet T. Mills press release, “Mills Administration Awards Nearly $20 Million from Maine
Jobs & Recovery Plan to 13 Maine Communities to Protect Infrastructure from the Eects of Climate Change,” July 19, 2022,
https://www.maine.gov/governor/mills/news/mills-administration-awards-nearly-20-million-maine-jobs-recovery-plan-13-
maine-communities.
24 Massachusetts Executive Oce of Energy and Environmental Aairs website, Municipal Vulnerability Preparedness
Program Action Grant Projects, accessed September 21, 2022, https://www.mass.gov/info-details/municipal-vulnerability-
preparedness-program-action-grant-projects.

16 FEDERAL RESERVE BANK OF BOSTON
NEW ENGLAND PUBLIC POLICY CENTER RESEARCH REPORT 22-2
VI. Conclusion
This report examines the role of weather in the provision of local public services. It uses
Massachusetts data from a 30-year period to quantify the impact of temperature and pre-
cipitation on municipal expenditures. It nds that a 1 degree Fahrenheit increase in average
temperature, on average, results in a 3.2 percent increase in per capita local expenditures.
This nding can help policymakers better understand what climate change in the region
will mean for local budgets in the future. If global emissions continue to grow at their current
rates, the average temperature in Massachusetts is expected to rise from under 49 degrees
Fahrenheit for the 1990–2019 period to over 53 degrees Fahrenheit for the 2050–2059 decade
and 58 degrees Fahrenheit for the 2090–2099 decade. Assuming that the relationship between
average temperature and municipal expenditures in the future is the same as it was from 1990
through 2019, per capita local spending is projected to increase 15 percent for the 2050–2059
decade and 30 percent for the 2090–2099 decade relative to the level of the past three decades.
These spending increases will create signicant scal stress for municipalities. Given the substan-
tial similarities in scal structures and weather patterns throughout New England, these ndings
are likely to apply to other states in the region.
Examples of local projects that received Climate Action Grants
through the Massachusetts Municipal Vulnerability Preparedness
(MVP) program in recent years
1
• Boston received $280,000 to conduct a Heat Resilience Planning Study. The nal
report, released in July 2022, includes an assessment of urban “heat islands” in the
city and outlines mitigation and resilience strategies for expected higher tempera-
tures (City of Boston 2022).
• Easthampton received more than $2 million to design and fund “green infrastruc-
ture” improvements to a street in the city. The improvements include rebuilding
an eroded stream bank, rebuilding sidewalks, and adding tree and plant cover to
provide shade and increase the soil’s water-storage capacity.
• Mattapoisett received $960,000 to purchase 120 acres of coastal wetlands for con-
servation and to provide natural protection against sea-level rise and coastal storms.
• Newburyport received $1 million to fund reconstruction of a stone revetment wall
that will help protect the city’s wastewater treatment plant from storm surges
in the Merrimack River. The project brought the wall up to Federal Emergency
Management Agency (FEMA) standards and included the construction of a recre-
ational multi-use path along the river.
• Uxbridge received $257,000 to develop a mosquito-control plan in anticipation of
an increased insect population due to warming winter temperatures. The town
used the funding to conduct assessments, design upgrades to water-storage sys-
tems, and host a regional conference on mosquito control.
a Massachusetts Executive Oce of Energy and Environmental Aairs website, Municipal Vulnerability
Preparedness Program Action Grant Projects, accessed September 21, 2022, https://www.mass.gov/info-details/
municipal-vulnerability-preparedness-program-action-grant-projects.
a

FEDERAL RESERVE BANK OF BOSTON 17
NEW ENGLAND PUBLIC POLICY CENTER RESEARCH REPORT 22-2
It is important for policymakers to take actions now to address and be prepared for the
projected climate change. They should account for climate change in their long-term municipal
nancial planning. It is prudent and sound to invest in improving the climate resilience of public
infrastructure, which will benet municipalities for many years to come.
References
Carleton, Tamma, Amir Jina, Michael Delgado, Michael Greenstone, Trevor Houser, Solomon Hsiang, Andrew
Hultgren, Robert E. Kopp, Kelly E. McCusker, Ishan Nath, James Rising, Ashwin Rode, Hee Kwon Seo, Arvid
Viaene, Jiacan Yuan, and Alice Tianbo Zhang. 2022. “Valuing the Global Mortality Consequences of Climate
Change Accounting for Adaptation Costs and Benets.” The Quarterly Journal of Economics 137: 2037–2105.
Catalano, Michele, Lorenzo Forni, and Emilia Pezzolla. 2020. “Climate-change Adaptation: The Role of Fiscal Policy.”
Resource and Energy Economics 59: 101111.
City of Boston. 2022. Heat Resilience Solutions for Boston.
Dell, Melissa, Benjamin F. Jones, and Benjamin A. Olken. 2012. “Temperature Shocks and Economic Growth:
Evidence from the Last Half Century.” American Economic Journal: Macroeconomics 4(3): 66–95.
Dell, Melissa, Benjamin F. Jones, and Benjamin A. Olken. 2014. “What Do We Learn from the Weather? The New
Climate-economy Literature.” Journal of Economic Literature 52(3): 740–798.
Deschênes, Olivier, and Michael Greenstone. 2011. “Climate Change, Mortality, and Adaptation: Evidence from
Annual Fluctuations in Weather in the US.” American Economic Journal: Applied Economics 3(4): 152–185.
Hsiang, Solomon, Robert Kopp, Amir Jina, James Rising, Michael Delgado, Shashank Mohan, D.J. Rasmussen, Robert
Muir-Wood, Paul Wilson, Michael Oppenheimer, Kate Larsen, and Trevor Houser. 2017. “Estimating Economic
Damage from Climate Change in the United States.” Science 356(6345): 1362–1369.
Kunkel, Kenneth, Rebekah Frankson, Jennifer Runkle, Sarah Champion, Laura Stevens, David R. Easterling, Brooke
Stewart, Andrea McCarrick, and Ciara Lemery. 2022. State Climate Summaries for the United States 2022. NOAA
Technical Report NESDIS 150. Silver Spring, MD: NOAA/NESDIS.
Massachusetts Executive Oce of Energy and Environmental Aairs. 2022. Massachusetts Clean Energy and Climate
Plan for 2025 and 2030.
Massachusetts Executive Oce of Energy and Environmental Aairs, Massachusetts Executive Oce of Public
Safety and Security, and Massachusetts Emergency Management Agency. 2018. Massachusetts State Hazard
Mitigation and Climate Adaptation Plan.
Ranson, Matthew. 2014. “Crime, Weather, and Climate Change.” Journal of Environmental Economics and Management
67(3): 274–302.
Zhao, Bo. 2022. “The Impact of Weather on Local Government Spending.” Federal Reserve Bank of Boston Working Papers
No. 22-22.

18 FEDERAL RESERVE BANK OF BOSTON
NEW ENGLAND PUBLIC POLICY CENTER RESEARCH REPORT 22-2
Appendix: Constructing Municipality-level Weather Data
Since municipality-level weather data are not publicly available, I construct them using data
from the Global Historical Climatology Network daily (GHCNd). This network includes numerous
weather stations from all over the United States and the rest of the world. It applies a common
set of quality-control procedures to each station’s climate records to ensure the quality and com-
parability of the data. Therefore, the GHCNd data are generally considered high quality and have
been widely used in weather-related research (Dell, Jones, and Olken 2014).
For this project, I use data reported by weather stations in and near Massachusetts. From
1990 through 2019, more than 1,100 weather stations located within 50 miles of the centroid of
at least one Massachusetts municipality were reporting data in the Global Historical Climatology
Network.
25
To align the weather data with the local spending data, I aggregate daily weather
records at the station level to annual weather statistics at the municipality level in two steps. First,
I calculate the weighted average of each daily weather variable among weather stations within 50
miles of a municipality’s centroid. I assign a higher weight to a weather station closer to the cen-
troid.
26
Second, I aggregate the daily weather data to the scal-year level for each municipality.
27
25 I tried reducing the cuto to 40 miles, but doing so leaves no relevant weather stations for a few municipalities for part of
the sample period.
26 I use the inverse of the distance between the centroid of a municipality and each weather station that is within 50 miles of
that centroid as the weight.
27 In Massachusetts, Fiscal Year (FY) t starts on July 1 in calendar year t–1 and ends on June 30 in calendar year t.
FEDERAL RESERVE BANK OF BOSTON 19
NEW ENGLAND PUBLIC POLICY CENTER RESEARCH REPORT 22-2

20 FEDERAL RESERVE BANK OF BOSTON
NEW ENGLAND PUBLIC POLICY CENTER RESEARCH REPORT 22-2
About the Author
Bo Zhao is a senior economist at the New England Public Policy Center in
the Federal Reserve Bank of Boston Research Department. He specializes
in public nance and urban and regional economics. Zhao earned his PhD
in economics and his MS in applied statistics from Syracuse University. He
has published extensively in academic journals such as Journal of Urban
Economics, Journal of Policy Analysis and Management, National Tax Journal,
and Regional Science and Urban Economics. He has served on the edito-
rial board of Public Budgeting & Finance since 2019. He joined the Boston
Fed in 2005 and received the President’s Award in 2013. He served on the
Municipal Aid Subcommittee of the Massachusetts Municipal Finance Task
Force from 2006 to 2007.
Acknowledgments
The author thanks Je Thompson for helpful comments, Eli Inkelas for high-quality research
assistance, and Lawrence Bean for excellent edits.

FEDERAL RESERVE BANK OF BOSTON 21
NEW ENGLAND PUBLIC POLICY CENTER RESEARCH REPORT 22-2
New England Public Policy Center
Federal Reserve Bank of Boston
600 Atlantic Avenue
Boston, MA 02210
The New England Public Policy Center was established by the Federal Reserve Bank of Boston in
2005. The Boston Fed has provided support to the public policy community of New England for
many years; the NEPPC institutionalizes and expands on this tradition. The Center’s mission is to
promote better public policy in New England by conducting and disseminating objective, high-qual-
ity research and analysis of strategically identied regional economic and policy issues. When ap-
propriate, the Center works with regional and Bank partners to advance identied policy options.
You can learn more about the Center by contacting us or visiting our website:
New England Public Policy Center
Federal Reserve Bank of Boston
E-mail: [email protected]
Web: http://www.bostonfed.org/neppc
