
Federal Reserve Bank of Boston
The Color of Wealth in Boston
A Joint Publication with Duke University and The New School

The information, analyses, and conclusions set forth are those of the individual
authors and do not necessarily indicate concurrence by the Board of Governors of
the Federal Reserve System, the Federal Reserve Banks, or members of their stas.
Federal Reserve Bank of Boston
The Color of Wealth in Boston
A Joint Publication with Duke University and The New School
Authors
Ana Patricia Muñoz
Marlene Kim
Mariko Chang
Regine O. Jackson
Darrick Hamilton
William A. Darity Jr.
Acknowledgments
is project is made possible by the generous support of the Ford Foundation’s Building
Economic Security Over a Lifetime (BESOL) initiative and the Federal Reserve Bank
of Boston. William A. Darity Jr. (Research Network on Racial and Ethnic Inequality at
the Duke Consortium on Social Equity, Duke University) and Darrick Hamilton (Mila-
no School of International Aairs, Management, and Urban Policy at e New School)
serve as primary investigators; Kilolo Kijakazi served as the Ford Foundation’s program
ocer. e National Asset Scorecard for Communities of Color–Boston project manager
is Ana Patricia Muñoz (Federal Reserve Bank of Boston).
e authors are grateful to Prabal Chakrabarti, Erin Graves, Je Fuhrer, and Anna Steiger
(Federal Reserve Bank of Boston); Ray Boshara (Federal Reserve Bank of St. Louis); and
Tatjana Meschede (Brandeis University and visiting scholar at the Federal Reserve Bank
of Boston) for reviewing this report and providing valuable insights and feedback. Rebecca
Leung provided excellent research assistance. Marcin Hitczenko (Federal Reserve Bank of
Boston) and Kobi Abayomi (Columbia University) provided helpful methodological sug-
gestions. Tom M. Guterbock (University of Virginia) directed the survey collection process.
e views expressed in this report are solely those of the authors and do not necessarily
represent those of the Ford Foundation, the Federal Reserve Bank of Boston, or the Federal
Reserve System.
Additional talent that went into this publication:
Copyeditor:
Beth Magura
Illustrator:
Ken Dubrowski
Visit www.bostonfed.org/commdev

Summary of Findings
Introduction
Demographic Changes in the Boston MSA
Methodology
Assets, Debt, and Net Worth Estimates
The Implications of Racial Disparities
About the Authors
References
Endnotes
Appendix
..........................................................................................................1
..........................................................................................................................3
.................................................................4
........................................................................................................................8
........................................................................10
..........................................................................22
.............................................................................................................24
...........................................................................................................................25
..............................................................................................................................28
..............................................................................................................................30
The Color of Wealth in Boston
Table of Contents
1
The Color of Wealth in Boston
Abstract
e widening wealth gap in the United States is a worrisome sign that millions of families
nationwide do not have enough in assets to oer better opportunities for future genera-
tions. Wealth allows families to make investments in homes, in education, and in business
creation. On the basis of data collected using the National Asset Scorecard for Commu-
nities of Color (NASCC) survey, we report that, when analyzed by race, wealth accumula-
tion is vastly unequal. By means of the NASCC survey, researchers have collected, for the
rst time, detailed data on assets and debts among subpopulations, according to race, eth-
nicity, and country of origin—granular detail ordinarily unavailable in public datasets. In
this analysis we focus on estimates for U.S. born blacks, Caribbean blacks, Cape Verdeans,
Puerto Ricans, and Dominicans in the Boston Metropolitan Statistical Area (MSA). Our
analysis shows that with respect to types and size of assets and debt held, the data collected
on white households and nonwhite households exhibit large dierences. e result is that
the net worth of whites as compared with nonwhites is staggeringly divergent.
Summary of findings
• While it has been common to lump the experiences of all blacks and all Hispanics
together, in fact, subcategories of blacks and Hispanics—for example, Puerto Ricans
and Dominicans, or U.S. blacks and Caribbean black immigrants—exhibit import-
ant dierences. e level of detail needed to dierentiate among these groups has
not been available until the implementation of the NASCC survey.
• ere exist key dierences in liquid assets, which may be thought of as representing
buers to income and expenditure shocks. e typical white household in Boston is
more likely than nonwhite households to own every type of liquid asset. For exam-
ple, close to half of Puerto Ricans and a quarter of U.S. blacks are unbanked (that is,
they do not have bank accounts) compared with only 7 percent of whites. For every
dollar, the typical white household has in liquid assets (excluding cash), U.S. blacks
have 2 cents, Caribbean blacks 14 cents, and Puerto Ricans and Dominicans less
than 1 cent.
• Whites and nonwhites also exhibit key dierences in less-liquid assets that are
primarily associated with homeownership, basic transportation, and retirement
or health savings. While most white households (56 percent) own retirement
accounts, only one-fth of U.S and Caribbean blacks have them. Only 8 per-
cent of Dominicans and 16 percent of Puerto Ricans have such accounts. Most
whites—79 percent—own a home, whereas only one-third of U.S. blacks, less
than one-fth of Dominicans and Puerto Ricans, and only half of Caribbean
blacks are homeowners.
• Although members of communities of color are less likely to own homes, among
homeowners they are more likely to have mortgage debt. Nonwhite households are
more likely than whites to have student loans and medical debt.
• us nonwhites are likely to experience far more short-term nancial disruptions
due to their lack of liquid buer assets. ey are also more likely to experience much
poorer longer-term housing and retirement outcomes as a consequence of their lack
of homeownership, housing equity, and retirement savings. e result is that the net
worth of whites as compared with nonwhites is staggeringly divergent.
2
The Color of Wealth in Boston
• Nonwhite households have only a fraction of the net worth attributed to white
households. While white households have a median wealth of $247,500, Domini-
cans and U.S. blacks have a median wealth of close to zero. Of all nonwhite groups
for which estimates could be made, Caribbean black households have the highest
median wealth with $12,000, which is only 5 percent of the wealth attributed to
white households in the Boston MSA.
• In the coming decades, a signicant rise in the share of nonwhite populations is
projected nationwide. Population growth in the Boston MSA is already driven by
the nonwhite population increase. us, the nancial well-being of communities
of color is central to ensuring the inclusive long-term growth and prosperity of the
Boston MSA. Unless net worth outcomes in communities of color improve, the
aggregate magnitude of the wealth disparity will increase. is is a rst-order public
policy problem requiring immediate attention.
3
The Color of Wealth in Boston
Introduction
e widening wealth gap in the United States is a worrisome sign that millions of families
nationwide do not have enough in assets to oer better opportunities for future generations.
Wealth (or net worth) provides a more complete picture of the disparity than the narrower
measure of income. While income is a ow that provides a snapshot of a family’s resources
at a given point in time, wealth reects the stock that a family accumulates over the long
term. Whereas income helps families cover their current needs, wealth allows them to make
investments in homes, in education, and in business creation. It provides safety during times
of family crisis or economic insecurity, such as during a stretch of unemployment or when
a family member faces a serious illness. Without being able to draw upon assets such as
savings accounts, a head of household must pay for his or her family’s nancial needs from
current or future income (that is, by borrowing)—which, for many in the United States, is
often insucient to cover large and critically important unexpected expenses.
Yet wealth accumulation is vastly unequal in the United States, with a small population
owning most of the wealth (Saez 2014). Such wealth disparities are problematic in this
country. Nationally and regionally, economic growth would be greater if wealth were dis-
persed more evenly, some economists argue (Rugaber 2013). Even Federal Reserve Chair
Janet Yellen has stated that “the extent of and continuing increase in inequality in the
United States greatly concerns” her. She has asked whether this trend of widening wealth
inequality “is compatible with values rooted in our nation’s history, among them the high
value Americans have traditionally placed on equality of opportunity” (Yellen 2014). In ad-
dition, wealth is transmitted intergenerationally—with the few who own wealth bequeath-
ing inheritances and house down payments to their progeny, which serves to perpetuate
inequality in wealth and impede social mobility for those who are not similarly advantaged.
As this report will show, accrual of wealth is vastly unequal when race is taken into account.
In part, racial dierences in net worth are derived from racially based dierences in income
because nonwhites generally earn less (Gittleman and Wol 2007). But racial dierences in
income and racial dierences in wealth are only weakly correlated. Rather, the racially based
gulf in wealth accumulation widens as income increrases (Tippett et al. 2014, see Figure 1)
and because wealth dierences reect an accumulated lifetime of income disparities, com-
pounded by asset returns (or lack thereof), the racial wealth gap is much greater than the
income dierences. Over the past 30 years, this gap has widened (McKernan et al. 2013).
Furthermore, nonwhites seem to have fewer opportunities than whites to build wealth by
means of income gains (Shapiro et al. 2013). In addition, intergenerational transmission
of wealth and the opportunities this provides are unequal when race is taken into account.
Black families who attain higher levels of income typically have greater transfer demands
from their less well-o kin networks in comparison to their white peers, further reducing
the resources earmarked for savings (Chiteji and Hamilton 2002; Hein and Pattillo 2000).
Furthermore, intergenerational transmissions of wealth and the opportunities these provide
are also unequal by race (Blau and Graham 1990; Menchik and Jianakoplos 1997; Gittle-
man and Wol 2007). Consequently, nonwhites have more limited opportunities—lacking
parents who can provide college educations, down payments, or inheritances. Wealth dis-
parity on the basis of race will persist in part because of lower rates of intergenerational
transmission of assets.
4
The Color of Wealth in Boston
Acknowledging the existence of diering levels of net worth transmission and striving to
implement policies that help to level the playing eld are of greater importance than ever,
given the rapid growth of communities of color across the nation. is report examines
racial wealth inequality in the Boston MSA and discusses its implications. Using the
NASCC survey, we have examined subpopulations by race, ethnicity and country of origin.
e NASCC survey has addressed two shortcomings of the public datasets (see Appendix
for more information) that have data on assets and debts, that is, a lack of information (1)
for small geographic areas and (2) for race, ethnicity and/or ancestral origin. Because rele-
vant geographic distinctions exist within asset markets and variations exist in racial compo-
sition across geographies, the NASCC survey was designed to collect data at the level of the
metropolitan statistical area. In addition, because nonwhite groups are not monolithic, the
NASCC survey gathered more detailed data, such as country of origin for certain groups.
1
is report provides a brief overview of the demographic changes in the Boston MSA,
revealing the growing presence of nonwhite groups. e second section summarizes the
NASCC methodology, and the third part analyzes asset and debt ownership and estimates
the wealth position of various communities of color in the Boston metro area. e last sec-
tion discusses the implication of racial disparities.
Demographic Changes in the Boston MSA
e Boston MSA, which is home to 4.6 million residents and accounts for almost one-
third of New England’s population,
2
has experienced noteworthy demographic changes
over the past decade or so. e non-Hispanic white population declined 3 percent from
2000 to 2012.
3
During the same period, the number of Asian and Hispanic residents in
the Boston MSA increased 58 percent and the number of non-Hispanic blacks increased
33 percent.
4
According to recent estimates, Hispanics accounted for 10 percent of the
total population, up four percentage points since 2000. e proportion of non-Hispanic
black residents in the Boston MSA increased from 6 to 7 percent.
5
e nationality and ethnic breakdown within these broadly dened racial and ethnic
groups is a distinctive feature of the Boston MSA. According to the 2012 U.S. Census, of
the 368,133 black residents in the metropolitan area, 34 percent (126,200) were foreign
born and 10.5 percent (38,686) were of Hispanic origin.
e origin of most Hispanics in the Northeast is also distinct from what is found in the rest
of the United States. In the country as a whole, Mexicans represented more than two-thirds
of the Hispanic population, whereas they accounted for less than 7 percent in the Boston
metro area. e two largest Hispanic groups in the Boston MSA were Puerto Ricans and
Dominicans, who represented 29 percent and 23 percent of the Hispanic population, re-
spectively.
6
e number of Dominicans grew 121 percent to 100,850 from 2000 to 2012,
the largest percentage increase of any group in the Boston metro area (Figure 1).
Two other groups living in the Boston metropolitan area, whose numbers are on the rise,
were Haitians and Cape Verdeans. Close to 9 percent of Haitians living in the United
States—about 75,600—resided in the Boston MSA. e concentration of Cape Verdeans
was even greater, with about 45 percent of the 87,000 Cape Verdeans living in the United
States residing in the Boston metro area.
5
The Color of Wealth in Boston
ese groups were not distributed evenly in the cities and towns of the Boston MSA. Al-
though overall the Boston metro area was 74 percent white, the city of Boston and most
gateway cities (or “working cities”)
7
in the Boston metropolitan area have high concentra-
tions of nonwhite populations. On average, only 53 percent of the population in working
cities located in the metro area was white, whereas in the city of Boston whites constituted
approximately 46 percent of the residents. e highest concentration of black residents was
found in the city of Boston; and in Brockton, more than one-third of the population was
black. e majority of the population in Chelsea (62 percent) and Lawrence (74 percent)
was Hispanic. In addition, close to 30 percent of the population in Lynn and Revere and
20 percent in Everett were Hispanic. In Lowell and Malden, Asians accounted for about
20 percent of residents (Figure 2).
Source: U.S. Census Bureau, American Community Survey 2012, 1 year estimates
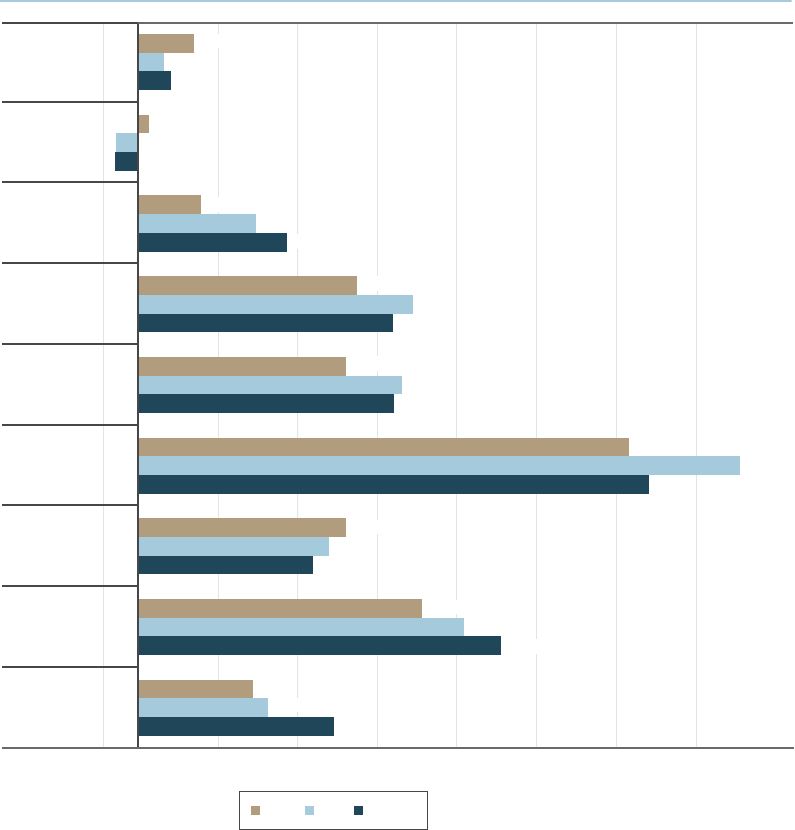
Figure 1.
Population change, 2000-2012, U.S., New England and Boston MSA
15%-5% 35% 55% 75% 95% 115% 135%
5%
6%
1%
-3%
-3%
26%
64%
58%
59%
58%
117%
149%
121%
43%
37%
76%
21%
41%
Total
White
Black
Asian
Hispanic
Dominican
Puerto
Rican
Haitian
Cape
Verdean
23%
84%
65%
46%
50%
52%
13%
12%
33%
U.S. NE Boston
6
The Color of Wealth in Boston
What’s behind the numbers?
A closer look at the population in the Boston metropolitan area revealed the distinctive
characteristics of its communities of color and their histories, which have implications for
better understanding inequality in the accrual of wealth. Our analysis conrmed that the
nonwhite population is far from homogenous.
Since the end of World War II, the region and the MSA have attracted growing numbers
of Latin American, Caribbean, Asian, and African immigrants. As of 2012, close to 17
percent of the population of the Boston MSA was foreign-born and less than 20 percent of
these immigrants came from Europe.
8
Migrants from Haiti, China, Vietnam, the Domin-
ican Republic, Cape Verde, Jamaica, Brazil, El Salvador, and Colombia have contributed
signicantly to the increase in Boston’s foreign-born population.
Compared with Asians and Latin Americans, black immigrants from the Caribbean and
Africa were still a relatively small group, accounting for less than 10 percent of 40 million
immigrants nationwide and for 15 percent of nearly 775,000 foreign-born residents in the
Boston area. But roughly one-third of blacks in the Boston MSA were immigrants, compared
with nearly 9 percent nationwide.
Violet Johnson’s book e Other Black Bostonians: West Indians in Boston, 1900–1950 focuses
on the West Indian community that began to take shape in Boston on the eve of World War
I ( Johnson 2006). is mostly black and working class migration of both men and women
(unlike the privileged mulatto men who preceded them in late 19th century) grew into a
visible presence until the Immigration and Nationality Act of 1952 (also known as the Mc-
Carran-Walter Act) denied Afro-Caribbeans the right to take advantage of the quotas set
for Great Britain. Johnson credits the United Fruit Company, headquartered in Boston, for
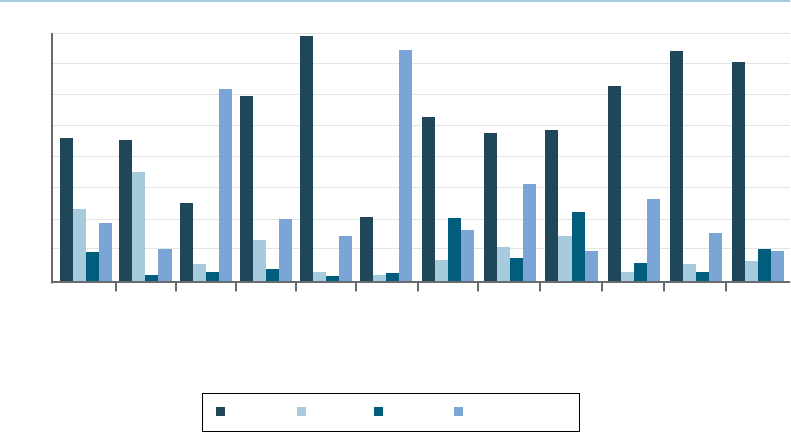
Somerville
Salem
Revere
Malden
Lynn
Lowell
Lawrence
Haverill
Everett
Chelsea
Brockton
Boston
80
70
60
50
40
30
20
10
0
Figure 2.
Percentage of total population by race and ethnicity, 2012, for Boston
and working cities
White Black Asian Hispanic/Latino
Source: U.S. Census Bureau, American Community Survey 2012, 1 year estimates
Percentage of population
7
The Color of Wealth in Boston
setting in motion the estimated 5,000 émigrés from the English-speaking Caribbean colo-
nies—mainly Barbados, Jamaica, and Montserrat—that eventually settled in Greater Boston.
Today 50 percent of Boston’s Caribbean population is made up of Haitian immigrants and
their descendants. e earliest wave of Haitian immigrants began to arrive in Massachusetts
as early as 1950 ( Jackson 2011). e registered population, statewide, increased twofold in
1970. By the late 1970s, pockets of Haitians could be identied in various sections of the city,
and in the early 1980s these communities began to crystallize. ere are sizeable clusters of
Haitians residing throughout the southern precincts of the City of Boston, in the suburbs
of Milton, Randolph, and Brockton, as well as in other cities in the larger metropolitan area,
such as Cambridge and Somerville. Jackson argues that the two- and three-decker homes
widely available in Dorchester for $24,000 to $26,000 in the 1970s, helped to stabilize the
Haitian community, creating a new class of homeowners and landlords that gave Haitian
renters a low-cost alternative to public housing (Jackson 2011; see also Jackson 2007).
9
African immigrants and refugees also contributed to the diversity of the black community.
Cape Verdeans are the African immigrants of longest duration in the city and the greatest in
number. e rst voluntary African emigrants to the United States, they began arriving in the
area in the 1900s to work in the whaling industry. As Gibau notes, “ere are Cape Verdeans
who came to the U.S. twenty years ago and others who have just arrived a few months ago.
Likewise, there are Cape Verdeans who were born in Boston fty years ago and others just
two years ago” (Gibau 2008, p. 263).
Unlike New Bedford, MA, or Providence, RI, there are more Cape Verdean immigrants liv-
ing in the Boston area than second- and third-generation Cape Verdean Americans. eir
numbers increased as a result of post-1965 and especially post-independence (1975) relo-
cations to the area (Ibid.). Since the 1950s, the American-born Cape Verdeans of Boston
migrated from the smaller South Shore communities of Massachusetts, such as Taunton and
New Bedford, and also from Cape Cod (Gibau 2008).
Likewise, Hispanics are not a monolithic group. Puerto Ricans arrived in the region in great
numbers after World War II. According to Hernandez (2006), as the original Hispanics,
Puerto Ricans were instrumental in laying the groundwork for the metropolitan area’s His-
panic community. As U.S. citizens, Puerto Ricans were spared problems with visas, had ac-
cess to social services, and could vote. It was not till the 1980s that diversity in the Hispanic
population of Boston became visible for the rst time (Uriarte et al. 2003) as Dominican
immigrants began to arrive. e Dominican population grew more slowly (Hernandez 2006).
Central Americans from El Salvador are the more recent arrivals.
A brief history of Boston’s heterogeneous population suggests the likelihood of a wide array
of economic positions and prospects among these diverse racial and ethnic groups in metro-
politan Boston.
8
The Color of Wealth in Boston
Methodology
A research initiative known as the National Asset Scorecard for Communities of Color
(NASCC) has embarked on the design and implementation of a pilot survey in targeted
metropolitan areas to collect data about the asset and debt positions of racial and ethnic
groups at a detailed ancestral origin level. In the past, other eorts have studied the
net worth position of broadly dened ethnic groups, such as Latinos or Asians taken
collectively. In contrast, the NASCC survey collects asset and debt information on key
subgroups within the broader categories—from such subgroups as Mexicans, Puerto
Ricans, and Cubans or Asian Indians, Chinese, Filipinos, Koreans, Vietnamese, and
Japanese. e NASCC data collection also includes information about native Americans,
disaggregated by tribal aliation, and about black Americans, disaggregated by ancestral
origin, that is, whether from the Caribbean or recently from the African continent. To
date, little had been known about the asset positions of these subgroups.
e survey was conducted in the Boston MSA and in four other metropolitan areas (Los
Angeles, CA; Miami, FL; Tulsa, OK; and Washington, DC). ese areas were chosen using
a systematic approach to ascertain the geographic and demographic national representa-
tiveness of the ethnic groups dened at the ancestral origin level. Criteria for choosing
metropolitan areas to be included in the sampling were primarily ethnic plurality and other
variables such as geographical representation, area size, and access to certain ethnic groups
that might be hard to identify in an urban context.
e survey instrument was designed primarily to gather information about a respondent’s
specic assets, liabilities, nancial resources, and personal savings and investment activity
at the household level. Net worth is estimated by subtracting debts from assets. Assets
included nancial assets (savings and checking accounts, money market funds, govern-
ment bonds, stocks, retirement accounts, business equity, life insurance) and tangible assets
(houses, vehicles, and other real estate). Debts included credit card debt, student loans,
installment loans, medical debt, mortgages, and vehicle debt.
Additional areas of inquiry included remittance behavior, that is, sending assets or other
resources abroad, and support for relatives in the United States. In addition, the survey
collects information on home ownership, foreclosure experiences, and the equity status of
homes. e survey also solicits additional information relevant to thenancial experiences
of lower wealth nonwhite individuals, such as the use of payday lenders. Core demographic
characteristics, such as age, sex, educational attainment, household composition, nativity,
income, and family background, are included in the survey.
10
e asset and debt module of the questionnaire replicates questions used in the Panel Study
of Income Dynamics (PSID), the longest running national longitudinal household survey
that collects data on employment, income, wealth, expenditures, health, marriage, educa-
tion, and numerous other topics. For the non asset and debt-based questions, the
NASCC survey replicated many questions found on the Multi-City Study of Urban In-
equality (MCSUI) survey, which in the early 1990s was a cross-sectional four-city survey
aimed at gathering socioeconomic data across ethnic and racial groups.
Various sampling techniques were used to locate and identify an ethnically plural sample
consisting of the specically dened ethnic groups. e techniques included the fol-
lowing: directory-listed landline samples targeted to census tracts where specic ethnic
9
The Color of Wealth in Boston
groups were known to reside; cell phone random digit dialing samples drawn from rate
centers that covered the targeted ethnic group ZIP codes; samples drawn from targeted
ZIP codes on the basis of billing address; and the use of surname-based lists targeting
specic national origin groups.
Race and ethnic identity for this study was based on self-identication of the family re-
spondent best qualied to discuss family nancial matters. e statistics in the sam-
ple used weights based on family characteristics in the U.S. Census Bureau’s American
Community Survey to generate results representative of specic ethnic group character-
istics in the respondent’s metropolitan area of residence. Overall, the results computed
from the unweighted NASCC sample are not dissimilar from those using the weight-
ed NASCC sample, suggesting that the specic ethnic group observations in the metro-
politan areas covered by the study were fairly representative of their populations at large.
e study was primarily designed to compare specic ethnic and racial groups within the
same metropolitan area. An advantage of this approach is the implicit control with regard
to asset and debt pricing and products, chiey housing prices, associated with particular
geographic areas.
e Boston sample targeted ve nonwhite groups: multigenerational African Americans
(referred here as U.S. blacks), Caribbean blacks (including Haitians), Cape Verdeans (both
black and white), Puerto Ricans, and Dominicans.
11
e sample also collected information
on whites. In the Boston MSA, 403 surveys were completed.
12
Table 1.
Boston Metropolitan Statistical Area sample characteristics
White
U.S. Black
Caribbean Black
Cape Verdean
Puerto Rican
54.0 55
Number of
observations
Bachelor’s
degree
or higher
Married
Median
age
Median
family
income
Dominican
Other Hispanic
NEC
a
Asian
55.2
78
24.8 55
43.4
71
40.8 49
57.2
36
58.0 43
72.7
14
34.4 51
38.0
43
32.1 40
10.5
51
18.4 44
16.7
38
32.1 37
33.3
21
32.1 50
44.2
51
90,000
41,200
50,000
96,000
65,000
37,000
25,000
46,000
55,000
Source: NASCC survey, authors’ calculations
a
The “not elsewhere classified” (NEC) category includes mainly respondents that chose more than one race (30 respondents).
10
The Color of Wealth in Boston
As shown in Table 1, in general, white households in the sample were older, much more
educated,
13
more likely to be married,
14
and have higher income
15
than nonwhite groups in
the study.
Assets, Debt, and Net Worth Estimates
Survey respondents were asked if they owned various assets and debts and, if so, to
estimate their value. In the following analysis, we used the weighted sample and reported
the percentage of households that owned dierent types of assets and debts. We
evaluated whether the data for whites and nonwhites dier in a statistically signicant
way. Note that what we report here as statistically signicance results are considered to
be conservative.
16
Small sample sizes limit the statistical power to detect meaningful
dierences even when there is good reason to suspect that group-based dierences in
assets levels and debts exist.
In addition, even when respondents owned assets, many did not report estimated values.
e result is that asset values were often not statistically signicant when examined sep-
arately, but they were statistically signicant when combined. Finally, we use the median
rather than the mean (or average) to measure asset values because medians more accurately
represent the typical holdings of families within each racial or ethnic group.
17
Unfortunate-
ly, the sample size for Asians is too small to make any inferences.
Financial Assets:
e Boston NASCC survey results show that white households were more likely to hold
assets than every other racial and ethnic group; this held true for every type of asset. e
dierences were all statistically signicant with a few exceptions (Table 2).
In general, among communities of color, Cape Verdeans, Caribbean blacks, and racial
groups not otherwise classied were the most likely to own an asset, whereas Puerto Ricans
and Dominicans were generally the most asset poor.
Liquid assets:
Liquid assets include checking accounts, savings accounts, money market funds, certi-
cates of deposit, and government bonds. Table 2 shows that nearly all whites in the Boston
area—96 percent—owned liquid assets. In comparison, the proportion of the other racial
groups was considerably lower. Eighty-three percent of blacks born in the United States
held a liquid asset, whereas the share for Caribbean blacks and Cape Verdeans was 85 per-
cent and 74 percent, respectively. e groups least likely to own a liquid asset were Puerto
Ricans, Dominicans, and other Hispanics; among those three groups, 57 percent, 63 per-
cent, and 67 percent owned any type of liquid asset, respectively.
18
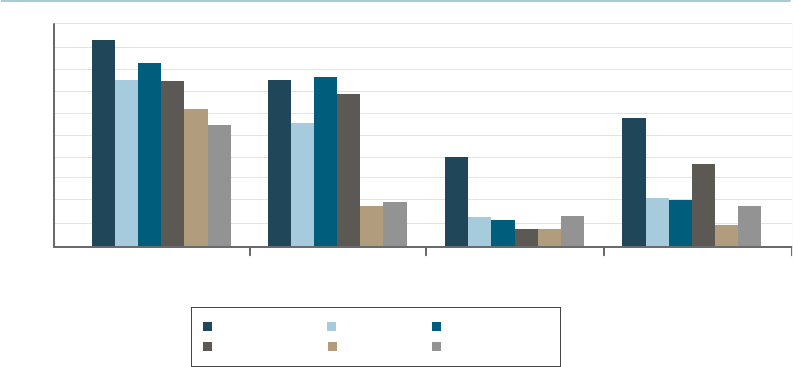
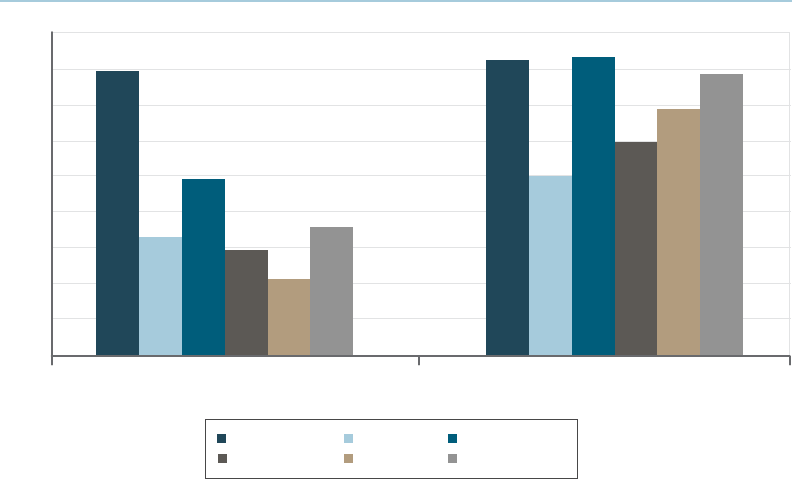
Checking and savings accounts:
Being banked, or having a checking or savings account, is critical for everyday nancial
ecacy. Yet surprisingly, most Puerto Ricans, Dominicans, and other Hispanics did not
hold either type of account. Rather than using a bank for nancial transactions, many in
these populations may use alternative nancial institutions, which charge transaction fees
for cashier’s checks or money orders or for wiring money.
11
The Color of Wealth in Boston
Within these populations, only 39 percent of Puerto Ricans, 37 percent of Dominicans,
and 48 percent of other Hispanics had savings accounts. Although they were more likely to
own checking accounts, these numbers remained surprisingly low: 53 percent of Puerto Ri-
cans, 62 percent of Dominicans, and 54 percent of other Hispanics held such accounts. In
contrast, almost all whites were likely to hold checking or savings accounts (93 percent).
19
e remaining racial and ethnic groups were also signicantly less likely than whites to be
banked. Close to 75 percent of U.S. blacks and Cape Verdeans and 84 percent of Caribbean
blacks held either a checking or savings account.
20
It is possible that those who are unbanked may have more cash on hand. Research has
suggested that populations that are unbanked fail to meet the minimum amounts of cash
needed for free checking or savings accounts. Paying the higher transaction fees of alter-
native nancial services—and these are notably more expensive—may actually be more
prudent than paying even higher fees or penalties due to overdrafts at traditional banks and
savings institutions (Servon 2014).
However prudent it may seem to remain unbanked and thus pay high transaction fees,
these circumstances make it dicult to accumulate savings and begin to earn interest on
owned funds. In addition, such low rates of being banked indicate that many in these pop-
ulations are living paycheck to paycheck—unable to save enough money in their accounts
to meet the minimum banking requirements.
Table 2.
Comparison of percentage of white and nonwhite households owning
any type of liquid asset, a checking account, or a savings account
White
U.S. Black
Caribbean
Black
Cape Verdean
Puerto Rican
91.8 0.0
Percent
Percentage
point
dierence
from whites
Percent
Percentage
point
dierence
from whites
Percent
Percentage
point
dierence
from whites
Dominican
Other Hispanic
NEC
a
Liquid Assets
Checking Account Savings Account
0.0
95.7
73.8 –18.0***–13.1***
82.6
80.0 –11.8*–1.2
94.5
54.0 –37.8***–28.2**
67.5
61.5 –30.3***–32.4***
63.3
52.9 –38.9***
–38.5***
57.2
72.8 –19.0–22.0**
73.7
82.2 –9.6*–10.9**
84.8
73.7 0.0
55.1 –18.6**
65.5 –8.2
47.6 –26.2***
37.1 –36.6***
39.0 –34.7***
65.9 –7.8
74.8 1.1
Source: NASCC survey, authors’ calculations
Note: The dierence in the percentage of nonwhites as compared with the percentage of white households is statistically
significant at the ***99%, **95%, *90% level. The percentage of Puerto Rican households holding liquid assets as compared
with Dominican households does not dier in a statistically significant manner. Percentage of U.S. black households holding
liquid assets as compared with Caribbean black households is statistically significant for savings accounts at the 95% level.
a
The “not elsewhere classified” (NEC) category includes mainly respondents that chose more than one race.
12
The Color of Wealth in Boston
Other financial assets:
What is striking about ownership of other nancial assets is the general absence of owner-
ship by all nonwhite groups analyzed in this report. is indicates that most families lacked
resources for long-term investment and economic security.
Stocks, mutual funds, and investments trusts:
As Table 3 illustrates, even among white households, only 40 percent owned other types
of assets such as stocks, mutual funds, or other investments or trusts. Ownership of these
assets among other racial groups was markedly lower than among whites. Only 10 percent
of U.S. blacks, 8 percent of Caribbean blacks, and 6 percent of Cape Verdeans possessed
any of these other types of nancial assets. e percentage of Dominican, Puerto Rican,
and other Hispanic households possessing these types of nancial assets was much lower in
comparison to whites: 6 percent, 9 percent, and 19 percent, respectively.
Retirement funds:
Few families owned Individual Retirement Accounts (IRAs) or private annuities, which
is consistent with our interpretation of the data collected thus far. We speculate that most
families are spending a majority of their earnings and have little to save toward long-term
goals despite the fact that compound interest and the income tax savings or tax deferments
associated with IRAs is a key step toward building future nancial security in retirement.
is is consistent with other studies reporting that most Americans are not able to save
suciently to support themselves during retirement (Ghilarducci 2012, Sommer 2013).
White
U.S. Black
Caribbean
Black
Cape Verdean
Puerto Rican
56.2 0.0
Percentage
point
from white
households
Percentage
point
from white
households
Dominican
Other Hispanic
NEC
a
Stocks IRA or Private Annuity
0.0
39.5
21.2 –34.9***–29.9***
9.6
33.8 –22.4**–9.2
30.3
28.1 –28.1***–20.1**
19.4
7.5 –48.7***–33.5***
6.0
16.2 –40***–30.1***
9.4
38.6 –17.6–33.9**
5.6
21.1 –35.1*–31.2***
8.3
Table 3.
Percentage of white and nonwhite households owning stocks,
an Individual Retirement Account (IRA) or private annuity
Source: NASCC survey, authors’ calculations
Note: The dierence in the percentage of nonwhites as compared with the percentage of white households is statistically
significant at the ***99%, **95%, *90% level.
a
The “not elsewhere classified” (NEC) category includes mainly respondents that chose more than one race.
Percentage of
households
owning these
Percentage of
households
owning these
13
The Color of Wealth in Boston
Except for Cape Verdeans, the white-nonwhite disparity is greater for ownership of private
retirement assets than ownership of stocks and other nancial investment assets discussed
above. While most white households (56 percent) own either an IRA or a private annuity,
most racial and ethnic groups do not hold such retirement funds (see Table 3). Only one-
fth of U.S. and Caribbean blacks have retirement accounts. Only 8 percent of Dominicans
and 16 percent of Puerto Ricans hold such accounts.
21
ese results suggest that, if not for
the federally structured Social Security program, many households, particularly black and
Hispanic ones, would have virtually no nancial assets of their own at retirement.
22
Unsecured debt:
Unsecured debt refers to debt not backed by an underlying asset and includes credit card
debt, student loans, and medical debt.
Credit card debt:
Credit card debt is usually debt associated with consumption goods that have no invest-
ment value. Hence, credit card debt is generally considered to be less “healthy” than other
forms of debt, which, for example, may be associated with a good that could appreciate
over time. Most households in the sample had credit card debt; Cape Verdeans were least
likely to have credit card debt (27 percent). In contrast, approximately half of whites, U.S.
blacks, Caribbean blacks, and Dominican households have such debt. e dierences in the
percentage of white and nonwhite households having credit card debt did not dier in a
statistically signicant way. However, nonwhites often have credit cards with less favorable
terms, such as higher interest rates (Weller 2007), further inhibiting their ability to pay
down their credit card debt (see Table 4).
Student loans:
Since 2008, student loan debt nationwide has increased 84 percent to $1.1 trillion (Federal
Reserve Bank of New York 2014). Given the relatively lower levels of household income
among nonwhites, student loan debt may be more relevant for nonwhite college students
100
80
60
40
20
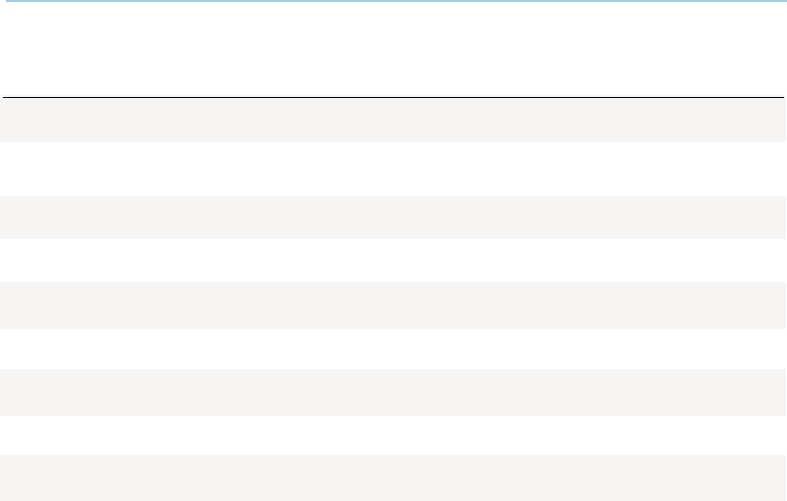
0
White U.S. Black Caribbean Black
Cape Verdean Dominican Puerto Rican
Checking Account Savings Account Stocks IRA or Private
Figure 3.
Percentage of households having financial assets by type of asset
Source: NASCC survey, authors’ calculations
Percentage of households
90
70
50
30
10
14
The Color of Wealth in Boston
than their white peers. For example, black and Hispanic students graduate from college
with substantially higher debt than their white peers (Baum and Steele 2010). As shown
in Table 4, nonwhite households were more likely to have student loan debt than white
households with Caribbean blacks and other Hispanics almost twice as likely to have stu-
dent loan debt. Although obtaining a college degree provides greater lifetime earnings
potential than having only a high school diploma, clear disadvantages are associated with a
debt-burdened degree.
Medical debt:
While only 2 percent of Cape Verdeans reported having medical debt, most respondents
from communities of color reported similar or higher percentages of medical debt as com-
pared with whites (11 percent). However, Dominicans and other Hispanics are about twice
as likely as whites to have medical debt: 20 percent and 24 percent, respectively.
23
One
reason medical debt may be higher generally for Hispanic groups is that Hispanics are least
likely to have health insurance (Brown and Patten 2014) and, within the Hispanic popula-
tion, Puerto Ricans are more likely to have health insurance than other Hispanics (Motel
and Patten 2012). is is consistent with our ndings that Puerto Ricans were less likely to
have medical debt than Dominicans and other Hispanics. Likewise, blacks were less likely
to have health insurance than whites (Brown and Patten 2014) and were more likely to re-
port having medical debt (although the percentage dierence among households reporting
medical debt was statistically insignicant).
24
White
U.S. Black
Caribbean
Black
Cape Verdean
Puerto Rican
18.9 0.0
Percentage
of
households
having a
credit card
Percentage
point
dierence
from white
households
Percentage
of
households
having a
student loan
Percentage
point
dierence
from white
households
Percentage
of
households
having
medical debt
Percentage
point
dierence
from white
households
Dominican
Other Hispanic
NEC
a
Credit Card Student Loan Medical Debt
0.0
46.5
28.0 9.15.8
52.3
28.9 10.013.6
60.1
34.4 15.5*–6.9
39.6
21.1 2.28.3
54.8
19.4 0.5–5.7
40.8
25.5 6.6–19.8
26.8
33.7 14.8*6.1
52.7
10.9 0.0
17.1 6.2
13.9 3.0
24.1 13.3*
19.8 8.9
10.6 –0.2
2.0 –8.9*
17.1 6.2
Table 4.
Percentage of households having various types of debt
Source: NASCC survey, authors’ calculations
Note: The dierence in the percentage of nonwhites as compared with the percentage of white households is statistically
significant at the ***99%, **95%, *90% level.
a
The “not elsewhere classified” (NEC) category includes mainly respondents that chose more than one race.
15
The Color of Wealth in Boston
Tangible assets and secured debt:
Tangible assets include houses, vehicles, and other property households may own.
Homeownership:
Homeownership serves as the primary asset in which most Americans build and store their
wealth. e federal tax code also incentivizes homeownership by providing tax savings as-
sociated with mortgage interest deductions. Furthermore, there are other positive attributes
that owning a home, particularly in a certain neighborhood, may oer, such as access to a
good public school district and other neighborhood amenities such as convenient shops
and access to parks. Finally, the purchase of a home and regular on-time payments of a
mortgage lead to higher Fair Isaac Corporation (FICO) credit scores than for families who
regularly make on-time payments for rent.
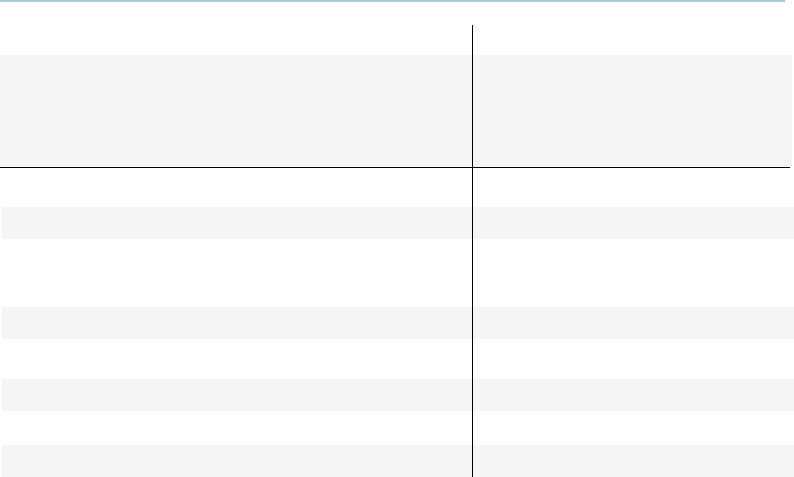
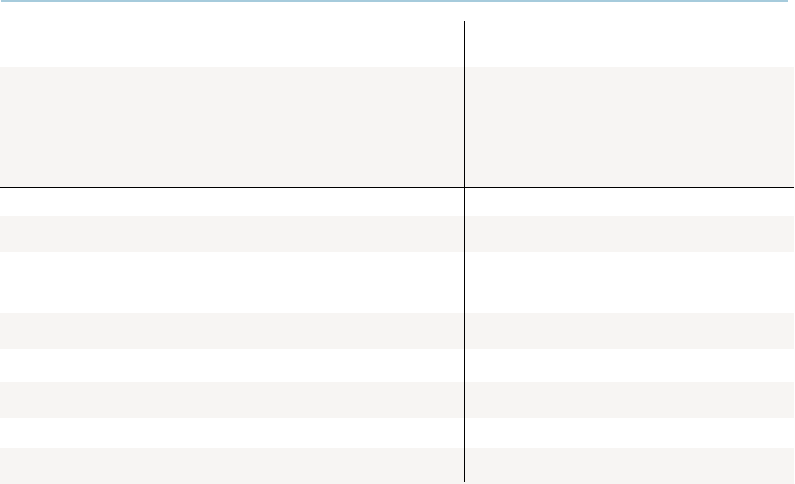
Yet the percentage of households owning a home diers radically by race and ethnicity in
Boston. Most whites—79 percent—are homeowners, whereas most nonwhites are not. Ca-
ribbean blacks were most likely to own a home (49 percent) in Boston among the analyzed
nonwhite groups. Only one-third of U.S. blacks and other Hispanics owned their homes
25
(see Table 5).
Twenty-nine percent of Cape Verdeans owned their home, as did 21 percent of Puerto Ri-
cans. Dominicans had the lowest rate of home ownership—only 17 percent owned or were
in the process of purchasing a home.
White
U.S. Black
Caribbean
Black
Cape Verdean
Puerto Rican
83.6 0.0
Percentage
of
households
owning a
home
Percentage
point
dierence
from white
households
Percentage
of
households
owning a
vehicle
Percentage
point
dierence
from white
households
Dominican
Other Hispanic
NEC
a
House Vehicle
0.0
79.1
50.7 –32.8***–45.3***
33.8
83.5 –0.1–36.3***
42.8
77.2 –6.3–45.1**
34.0
69.0 –14.5*–61.9***
17.3
61.1 –22.4**–57.9***
21.2
85.4 1.9–49.7**
29.4
84.1 0.5–30.4**
48.7
Table 5.
Percentage of households that have tangible assets by type of asset
Source: NASCC survey, authors’ calculations
Note: The dierence in the percentage of nonwhites as compared with the percentage of white households is statistically
significant at the ***99%, **95%, *90% level.
Note: The percentage of Puerto Rican households holding tangible assets as compared with Dominican households did not
dier in a statistically significant way. The percentage of U.S. black households owning homes and vehicles diered
significantly when compared with Caribbean black households as follows: for homes, at a 90% level, and for vehicles, at a
99% level.
a
The “not elsewhere classified” (NEC) category includes mainly respondents that chose more than one race.
16
The Color of Wealth in Boston
Mortgages:
Across all households, whites were most likely to have mortgage debt with 47 percent of
white households reporting mortgage debt (Table 6). In contrast, only 15 percent of Do-
minicans, 18 percent of Puerto Ricans and 29 percent of U.S. blacks
26
had mortgage debt.
In regard to the percentage of households having mortgage debt, whites, Cape Verdeans,
and Caribbean blacks did not dier in a statistically signicant way.
When the sample is restricted to homeowners, white households are least likely to have
mortgage debt than the other racial and ethnic groups. To put it dierently, whites are
more likely to own their own homes outright. Although 60 percent of white homeowners
have mortgage debt, the proportion of homeowners with mortgage debt is much higher
for other groups. Close to 90 percent of U.S. blacks,
27
Caribbean blacks, and Domini-
can homeowners have a mortgage. While mortgage debt for Puerto Ricans and other
Hispanics also is higher than for white homeowners, the percentage dierence was not
statistically signicant.
Of all types of debt, mortgage debt is potentially the most benecial for long-term asset
building if the total amount is not excessive, if it is not accompanied by high interest rates,
and if home prices do not drop dramatically. Very few people can aord to become home-
owners without acquiring mortgage debt, and, if conditions are favorable, homeownership is
often a primary mechanism for building assets, especially for the middle class. However, our
analysis of the survey data suggests that racial and ethnic minorities are not beneting to the
same extent as white households from the potential wealth-enhancing eects of homeown-
ership. Why? Because racial and ethnic minorities are less likely to own homes and because,
when they do own homes, they are much more likely than whites to have mortgage debt.
40
30
20
10
0
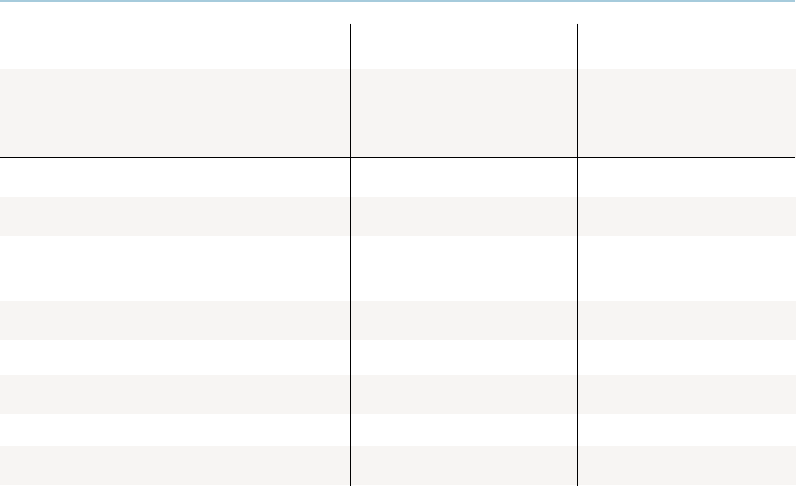
White U.S. Black Caribbean Black
Cape Verdean Dominican Puerto Rican
House Vehicle
80
70
60
50
90
Percentage of households
Figure 4.
Percentage of households that have tangible assets by type of asset
Source: NASCC survey, authors’ calculations

17
The Color of Wealth in Boston
Vehicles:
Like homeownership, owning a vehicle has far-reaching implications. ose who own ve-
hicles have access to job opportunities beyond the zones of public transportation, and they
can work late or take unusual shifts because of having their own transportation. For this
reason, patterns of vehicle ownership analyzed on the basis of race were noteworthy. U.S.
blacks had the lowest rates—only 50 percent owned a vehicle (Table 5). Puerto Ricans and
Dominicans also had relatively low rates of ownership (61 percent and 69 percent, respec-
tively). In contrast, close to 85 percent of whites, Cape Verdeans, and Caribbean blacks
owned a vehicle.
Vehicle debt:
Compared with the percentage of white households having vehicle debt, U.S. blacks and
Puerto Ricans were less likely to be so encumbered; the dierence in the percent of other
racial groups with vehicle debt as compared with whites was not statistically dierent.
Whereas 30 percent of whites had vehicle debt, 21 percent of U.S. blacks and 16 percent
of Puerto Ricans had vehicle debt. However, as shown in Table 6, U.S. blacks and Puerto
Ricans were much less likely to own vehicles than whites. Interestingly, among households
owning vehicles, no statistically signicant dierences in vehicle debt were noted.
Among all
households
Among all
households
Among
homeowners
Among households
that own vehicles
Vehicle Debt Mortgage
Percentage
point
dierence
from white
households
–14.2*
–1.5
–9.1
9.5
–8.9***
0.0
–7.6
–6.2
Among all
households,
percentage
with vehicle
debt
16.1
25.8
21.2
39.9
21.4
30.3
22.7
24.1
Percentage
point
dierence
from white
households
–29.5***
–32.21***
–18.7
–2.8
–18.3**
0.0
–10.0
–20.5**
Among all
households,
percentage
with
mortgage
debt
17.7
15.1
28.6
44.4
28.9
47.2
37.3
26.7
Percentage
point
dierence
from white
households
–9.9
5.4
–1.6
11.1
5.9
0.0
–9.1
–2.2
Among
households
that own
vehicles,
percentage
with vehicle
debt
26.4
41.7
34.7
47.4
42.2
36.3
27.2
34.1
0.0
Percentage
point
dierence
from white
households
23.9
27.8**
37.3***
31.6***
25.8**
27.4**
18.7
Among
home-
owners,
percentage
with
mortgage
debt
83.6
87.5
97.0
91.3
85.5
59.7
87.1
78.4
White
U.S. Black
Caribbean
Black
Cape Verdean
Puerto Rican
Dominican
Other Hispanic
NEC
a
Source: NASCC survey, authors’ calculations
Note: The dierence in the percentage of nonwhites as compared with the percentage of white households was
statistically significant at the ***99%, **95%, *90% level.
Note: The dierence between the percentage of U.S. blacks having mortgages (among all households) as compared with
Caribbean blacks was statistically significant at ***99 percent. The dierence between the percentage of U.S. blacks having
mortgages (among all homeowners) as compared with Cape Verdeans was statistically significant at the 90% significance level.
The dierence between the percentage of U.S. blacks having vehicle debt (among all households) as compared with
Caribbean blacks was statistically significant at the 99% significance level.
a
The “not elsewhere classified” (NEC) category includes mainly respondents that chose more than one race.
Table 6.
Comparison of the percentage of white and nonwhite households having vehicle
debt or mortgage
18
The Color of Wealth in Boston
Asset, debt and net worth values:
Asset Values:
Whites own far more in assets than every other racial group, and comparisons of asset
data for racial groups exhibited statistically signicant dierences. We analyzed not only
the prevalence of these assets but also their estimated value. We looked at liquid and total
assets separately. Liquid assets, which can quickly be converted into cash, include money
in savings and checking accounts, stocks, money market, and government bonds.
28
e
median value of liquid assets for Puerto Ricans and Dominicans was only $150 and $20,
respectively. Some of these families may hold cash in hand, but most of them have no for-
mal savings. e median value of liquid assets among U.S. blacks and other Hispanics was
close to $700, whereas the median level of liquid assets in white households was $25,000.
A typical Caribbean black household has $3,500 in liquid assets. In case of an emergency,
half of members of the nonwhite groups in this analysis would be unable to weather an
unexpected expenditure shock of even $700 with their own savings.
29
We totaled the value of all assets held by each racial group, including the value of all liquid
assets, nancial assets, retirement, home and vehicle equity, and the values of all other assets
(these include life insurance policies and valuables such as jewelry). White households had
by far the highest values; the median total value of assets was $256,500. e median asset
values for communities of color were far below this threshold, at best, barely approaching
20 percent of the median asset value of white households (Table 7).
White
U.S. Black
Caribbean
Black
Cape Verdean
b
Puerto Rican
256,500 100.0
Median amount
(U.S.dollars)
Nonwhite
household
percentage of
white household
liquid assets
Dominican
Other Hispanic
NEC
a
Liquid Assets Total Assets
100.0
25,000
700 0.3**2.7**
670
18,000 7.0***16.0***
4,000
15,000 5.8***2.8**
700
1,724 0.7***0.6**
150
3,020 1.2***0.1**
20
— —0.6**
150
12,000 4.7***14.0*
3,500
Table 7.
Comparison of the value of assets held by white and nonwhite households
Median amount
(U.S.dollars)
Nonwhite
household
percentage of
white household
liquid assets
Source: NASCC survey, authors’ calculations
Note: The dierence in the percentage of nonwhites as compared with the percentage of white households was
statistically significant at the ***99%, **95%, *90% level.
a
The “not elsewhere classified” (NEC) category includes mainly respondents that chose more than one race.
b
Values for Cape Verdeans were not calculated because sample sizes were too small.
19
The Color of Wealth in Boston
Blacks had the lowest median asset value, $700, which is less than 0.3 percent of the median
asset value of whites. e median asset value of Puerto Ricans and Dominicans was only 1
percent of the median asset value of whites. Caribbean blacks were slightly better o, at 5
percent of the median asset value of whites. e median asset value of other Hispanics was
6 percent that of whites. All told, our analysis of these data substantiates the existence of a
staggering racial wealth gap in the Boston MSA.
30
Debt values:
Among the various racial and ethnic groups, the percentage of nonwhite group members
carrying various forms of debt diered; the groups are heterogeneous in regard to debt. Our
data analysis also revealed that the amount of debt owned by whites as compared with other
racial and ethnic groups diered only slightly (Table 8). A noteworthy exception was that
Dominicans, other Hispanics, U.S. blacks, and Caribbean blacks had signicantly lower
median mortgage debt than white households. e lower median mortgage debt is likely
a result of whites being able to purchase homes valued at higher prices (and thus having
higher mortgages).
31
In this study, the lack of statistical signicance stemming from our analysis of white and
nonwhite median debt burden should not be misconstrued as indicating equity in the bur-
den of debt for white and nonwhite households.
32
Minority households often pay more for
their debt as a result of carrying higher fees and interest rates, for example; they have higher
debt-to-income ratios; and they are more likely to be denied credit (Weller 2007).
White
U.S. Black
Caribbean Black
Cape Verdean
Puerto Rican
Median amount
(U.S. dollars)
Dominican
Other Hispanic
NEC
a
2,000
3,000
4,000
5,000
2,200
300
2,200
6,000
Table 8.
Comparison of total median nonhousing debt for white and nonwhite households
Source: NASCC survey, authors’ calculations
a
The “not elsewhere classified” (NEC) category includes mainly respondents that chose more than one race.
20
The Color of Wealth in Boston
Net worth:
Net worth (or wealth), the sum of the value of total assets minus the value of debts, provides
a snapshot of household nancial well-being. Striking racial dierences are evident when
looking at total household wealth. Nonwhite households have only a fraction of the wealth
of white households. Whereas white households have a median wealth
33
of $247,500, Do-
minicans and U.S. blacks have a median wealth of close to zero (see Table 9). Of all non-
white groups for which estimates could be made, Caribbean black households had the
highest median wealth with $12,000, which represents only 5 percent as much wealth as
white households.
34
Racial and ethnic dierences in net worth demonstrate the extreme nancial vulnerabil-
ity faced by nonwhite households. Possessing less than 5 percent of the wealth of white
households, nonwhites are less likely to have the nancial resources to draw upon in times
of nancial stress. In addition, they have fewer resources to invest in their own future and
those of their children.
Racial dierences in asset ownership, particularly homeownership, contribute to vast racial
disparities in net worth. Homes—the most valuable asset owned by middle-class house-
holds—comprise the bulk of middle-class wealth. However, unequal opportunities (past
and present) to build other assets and to reduce debt are contributors to the vast racial
wealth gap substantiated in this analysis.
Table 9.
Comparison of white and nonwhite household median net worth
White
U.S. Black
Caribbean
Black
Cape Verdean
b
Puerto Rican
Amount
(U.S. dollars)
Nonwhite household
percentage of white
household median
net worth
Dominican
Other Hispanic
NEC
a
Median net worth
100.0
247,500
0.0***
8
4.8***
12,000
1.1***
2,700
0.0***
0
1.2***
3,020
—
—
4.8***
12,000
Source: NASCC survey, authors’ calculations
Note: Dierence in findings of nonwhite household median or mean net worth values were statistically significant at the
***99 percent level.
a
The “not elsewhere classified” (NEC) category includes mainly respondents that chose more than one race.
b
Net worth values for Cape Verdeans were not calculated because sample sizes were too small.
21
The Color of Wealth in Boston
Some of the dierences observed may be driven by dierences in age or educational attain-
ment. In general, nonwhites in the survey were younger and had much lower educational
attainment rates. Unfortunately, it was not possible to provide data broken down by age
for all the groups analyzed in Boston, because the sample size was too small. So we have
focused on how whites, blacks, and Hispanics dier. Even among highly educated house-
holds, black and Hispanics were less likely than whites to be banked and to own a house.
Almost all whites with a bachelor’s degree or higher had either a savings or a checking ac-
count, whereas a quarter of Hispanics and 11 percent of blacks
35
did not have either (Table
10). Homeownership rates diered widely. Among Hispanics and blacks having bachelor’s
degrees, less than half owned a home, whereas 82 percent of comparably educated whites
were homeowners.
36
A majority of households with high educational attainment owned a
vehicle. In this regard, whites, blacks, and Hispanics did not dier in a statistically mean-
ingful way.
Age may greatly inuence a family’s assets and debts. One expects lower or negative savings
during the early years when individuals do not have enough income to save and incur debt
to buy assets or nance their education. Generally, the middle-aged working population
tends to save and prepare for retirement. In this analysis, we focused on two age brack-
ets: 31- to 50-year-olds and 51- to 65-year-olds. Interestingly, for the 31- to 50-year-old
bracket, whites and blacks had a similar percentage of banked households, at close to 90
percent. Among Hispanics in the same age category, only 60 percent had either a savings
or checking account. However, disparity in homeownership rates were considerable when
comparing groups in the same age bracket. Close to 80 percent of white households were
homeowners, compared to 45 percent of blacks and 25 percent of Hispanics. Vehicle own-
ership did not dier signicantly in the 31- to 50-year-old category. Taking into account
heads of households 51 to 65 years old, a much higher percentage of white households were
banked and owned a home and a vehicle than black households and Hispanic households.
Percentage of
banked households
Homeownership
rate
Vehicle ownership
rate
Net worth
(U.S. dollars)
74.7***
White Black Hispanic
Bachelor’s Degree
or Higher
Age: 31 to 50 Years
88.7**
98.1
49.3***47.9***
82.4
12,000*
313,500
90.679.0
84.1
Age: 51 to 65 Years
58.5
White Black Hispanic
91.7
87.5
25.7***44.7***
78.9
69.976.0
87.1
52.3***
White Black Hispanic
69.1***
95.5
32.8***45.3***
82.3
4,000***
311,000
61.8**57.9***
87.9
_b _b _b _b _b
Source: NASCC survey, authors’ calculations
Note: The dierence in the figures of nonwhites as compared with the figures of white households was statistically
significant at the ***99%, **95%, *90% level.
b
Values not calculated because sample size is too small.
Table 10.
Comparison of the percentage of banked households, homeownership, and vehicle
ownership rates, and net worth values for white and nonwhite households by
college education and age group
22
The Color of Wealth in Boston
e net worth dierences of whites and blacks were remarkable even when level of educa-
tion or age were considered. Median wealth among black households that have a bachelor’s
degree or higher ($12,000) was 4 percent of the median for white households ($313,500).
Similarly, if we look at households in the 51- to 65-year-old bracket, the typical white
household holds $311,000 in wealth, compared with only $4,000 for the typical black
household (Table 10).
The Implications of Racial Disparities
Assets are important for nancial security and have long-term implications for
communities and families. In our analysis, the data revealed disparities in both nancial
and tangible assets that are striking. e extremely low homeownership rates among
communities of color in Boston are worrisome. Most nonwhite groups do not have
enough liquid savings to serve as buers to income and expenditure shocks. Lack of
retirement and nancial savings not only implies possible hardship in the long term, it
also makes short-term disruption much more likely. Any problem—a car breaking down,
losing a job, medical needs—is likely to become a crisis. e stress experienced when
someone is unable to meet family needs, x the car, buy school supplies, or take care of
medical ailments can be long-term and debilitating (Fiscella 2004, Massey 2004).
With respect to debt, several key ndings emerged from our analysis. Although members
of communities of color are less likely to own homes, among homeowners they are more
likely to have mortgage debt. Also, data on student loans and medical debt for whites and
racial/ethnic minorities suggest that whites are often less likely to have these forms of debt.
Because households from communities of color often have higher-cost debt, have higher
debt-to-income ratios, and are more likely to be denied credit, their ability to build assets
is crippled and contributes to lower asset ownership and lower asset values when compared
with white households.
It is beyond the scope of this report to identify the major drivers of the enormous wealth
gap that exists in the Boston MSA. However, a review of the economic literature (Hamil-
ton and Chiteji 2013) demonstrates that inheritances, bequests, and intrafamily transfers
account for more of the racial wealth gap than any other demographic and socioeconomic
indicators, including education, income, and household structure (see, for example, Blau
and Graham 1990, Menchik and Jianakoplos 1997, Conley 1999, Chietji and Hamilton
2002, Charles and Hurst 2003, Gittleman and Wol 2007).
So what explains the racial dierences in resource transfers across generations?
Blacks experienced deprivation of property, especially the land of former slaves between the
period 1880 to 1910 (Darity 2008). More recently, general housing and lending discrim-
ination through restrictive covenants, redlining and other lending practices has inhibited
blacks from accumulating wealth (Lui et al. 2005, Katznelson 2005, Oliver and Shapiro
2006, Munnell et al. 1996, Hamilton and Darity 2010).
Moreover, people of color were excluded from post-Depression and World War II (1939–
1945) public policy, which was largely responsible for the asset development of an Amer-
ican middle class (for example, racially discriminatory local implementation of Federal
Housing Administration loans and G.I. Bill benets; see Lui et al. 2005, Katznelson 2005,
and Oliver and Shapiro 2006). us, explanations that attribute the lack of assets among
minority groups to a relative deciency in current savings behaviors are at the very least an
oversimplication the problem.
37
23
The Color of Wealth in Boston
e cumulative consequences of a lack of net worth exacerbate the enormous racial divide
in wealth in Boston. e staggering disparities identied in this analysis should urge us to
nd policies that can help narrow the wealth divide by: providing opportunities for asset
development; ensuring fair access to housing, credit, and nancial services; ensuring equal
opportunity to good-paying jobs regardless of race or ethnicity; strengthening retirement
incomes; promoting access to education without overburdening individuals with debt; and
providing access to healthcare while helping minimize medical debt.
38
All policies aimed at
bridging the wealth gap should also consider the wide diversity among nonwhite popula-
tions and be targeted or adapted accordingly. Policy solutions are complex and need to use
a multifaceted approach that includes input from practitioners who are familiar with the
unique needs and challenges dierent communities of color face.
Finally, this analysis highlights the importance of collecting data on assets and debts at the
local level, including disaggregated information for nonwhite groups. is is the rst time
this kind of data has been collected, and it is an important step to help shape policymakers’,
practitioners’, and foundations’ responses to the enormous challenges communities of color
experience across the country. More needs to be done to ensure that the diverse voices of
nonwhite groups are included in public debates and to understand the reasons behind the
enormous dierences uncovered in this analysis. Having a qualitative research component
is also going to be important for a deeper understanding.

24
The Color of Wealth in Boston
About the Authors
Ana Patricia Muñoz is the community development research director in the Regional and
Community Outreach department at the Federal Reserve Bank of Boston. She conducts
applied research on issues that impact low- and-moderate-income (LMI) families and is
interested in issues related to wealth inequality, asset building, equal access to credit, and
immigration. Muñoz holds a master’s degree in economics from the Université de Mon-
tréal, a master of public aairs from Brown University, and a B.S in economics from the
Universidad Católica del Ecuador.
Marlene Kim is a professor of economics at the University of Massachusetts, Boston. She
edited Race and Economic Opportunity in the Twenty-First Century (Routledge 2007)
and is the recipient of the rst Rhonda Williams Prize for her work on race and gender
discrimination. She is the associate editor of Feminist Economics and serves on the edito-
rial boards of Industrial Relations. She holds a Ph.D. in economics from the University of
California, Berkeley.
Mariko Chang is a former associate professor of sociology at Harvard and the author of
Shortchanged: Why Women Have Less Wealth and What Can Be Done about It. She is
also the primary author of the Insight Center report “Lifting As We Climb: Women of
Color, Wealth and America’s Future.” In addition to her work on the wealth gap, she works
as a consultant and external program evaluator to help universities diversify their faculty.
Further information can be found at www.mariko-chang.com.
Regine O. Jackson is an associate professor of sociology at Agnes Scott College. She has a
B.A. from Brown University in Providence and a Ph.D. from the University of Michigan,
Ann Arbor. She specializes in Haitian migration and diaspora studies, contemporary Ca-
ribbean and African communities in the United States, and place/urban studies. She is the
author of Boston Haitians: Navigating Race, Place and Belonging in a Majority-Minority
City (manuscript) and editor of Geographies of the Haitian Diaspora (Routledge, 2011).
Darrick Hamilton is an associate professor of economics and urban policy at the New
School, an aliate scholar at the Center for American Progress, and co-associate director
of the Diversity Initiative for Tenure in Economics Program. He serves on the board of
overseers for the General Social Survey and is the president-elect of the National Econom-
ic Association. Hamilton is a stratication economist, whose work focuses on the causes,
consequences, and remedies of intergroup inequality.
William A. (“Sandy”) Darity Jr. is the Samuel DuBois Cook Professor of Public Policy,
African and African American Studies, and Economics and the director of the Duke Con-
sortium on Social Equity at Duke University. He was the founding director of the Research
Network on Racial and Ethnic Inequality at Duke. Darity’s research focuses on inequality
by race, class, and ethnicity, stratication economics, schooling, and the racial achievement
gap. He received the Samuel Z. Westereld Award in 2012 from the National Economic
Association, the organization’s highest honor.

25
The Color of Wealth in Boston
References
Aja, Alan, Daniel Bustillo, William Darity, Jr., and Darrick Hamilton. 2014. “From a Tan-
gle of Pathology to a Race Fair America. Dissent Magazine.” pp. 38-42. Retrieved from
http://www.dissentmagazine.org/article/from-a-tangle-of-pathology-to-a-race-fair-america
Baum, Sandy, and Patricia Steele. 2010. “Who Borrows Most? Bachelor’s Degree Recipi-
ents with High Levels of Student Debt.” College Board, Trends in Higher Education Series,
2010. Retrieved from
https://trends.collegeboard.org/sites/default/les/trends-2010-who-borrows-most-brief.pdf
Blau, Francine D., and John W. Graham. 1990. “Black-White Dierences in Wealth and
Asset Composition.” Quarterly Journal of Economics, 105(2), 321-39.
Brown, Anna, and Eileen Patten. April 2014. “Statistical Portrait of Hispanics in the Unit-
ed States, 2012.” Pew Research Center’s Hispanic Trends Project, 2014.
Charles, Kerwin, and Erik Hurst. 2003. “e Correlation of Wealth across Generations.”
Journal of Political Economy, 111(6), 1155-1182.
Chiteji, Ngina, and Darrick Hamilton. 2002. “Family Connections and the Black-White
Wealth Gap Among Middle Class Families.” Review of Black Political Economy, 30(1), 9-27.
Conley, Dalton. 1999. Being Black, Living in the Red: Race, Wealth, and Social Policy in Amer-
ica. Berkeley, CA: University of California Press.
Darity, William Jr. 2008. “Forty Acres and a Mule in the 21st Century,” Social Science Quar-
terly 89(3), 656-64.
Federal Reserve Bank of New York. August 2014. Quarterly Report on Household Debt and
Credit. Retrieved from
http://www.newyorkfed.org/householdcredit/2014-q2/data/pdf/HHDC_2014Q2.pdf
Fiscella, Kevin, and David R. Williams. 2004. “Health Disparities Based on Socioeconomic
Inequities: Implications for Urban Health Care.” Academic Medicine, 79(12), 1139-1147.
Ghilarducci, Teresa. 2012, July 21. “Our Ridiculous Approach to Retirement.” New York
Times, p. SR5.
Gibau, Gina Sanchez. 2008. “Cape Verdean Diasporic Identity Formation.” In Luís Batal-
ha and Jørgen Carling (Eds.), Transnational archipelago: Perspectives on Cape Verdean mi-
gration and diaspora (pp. 262-263). Amsterdam University Press.
Gittleman, Maury, and Edward N. Wol. 2007. “Racial and Ethnic Dierences in Wealth.”
In Marlene Kim (Ed.). Race and Economic Opportunity in the Twenty-First Century, Chapter
2. London: Routledge.
Hamilton, Darrick, and Ngina Chiteji. 2013. “Wealth.” In Patrick L. Mason (ed.), Interna-
tional Encyclopedia of Race and Racism (2nd ed). Macmillan Reference, USA.

26
The Color of Wealth in Boston
Hamilton, Darrick, and William Darity, Jr. 2010. “Can ‘Baby Bonds’ Eliminate the Ra-
cial Wealth Gap in Putative Post-Racial America?” Review of Black Political Economy,
37(3,4):207-216.
Hein, Colleen M., and Mary Pattillo. 2000. “Kin Eects on Black-White Account and
Home Ownership.” Sociological Inquiry 72(2), 220-239.
Hernandez, Deborah Pacini. 2006.” Quiet Crisis: A Community History of Latinos in
Cambridge, Massachusetts. In Andres Torres (Ed.).” Latinos in New England, pp. 149-170.
Philadelphia, PA: Temple University Press.
Jackson, Regine O. 2007. “After the Exodus: e New Catholics in Boston’s Old Ethnic
Neighborhoods.” Religion and American Culture, 17(2), 191-212.
Jackson, Regine O. 2011. “e Uses of Diaspora among Haitians in Boston.” In R. Jackson
(Ed.).”Geographies of the Haitian Diaspora, pp. 136-162. New York: Routledge.
Johnson, Violet. 2006. e Other Black Bostonians: West Indians in Boston, 1900-1950.
Bloomington, IN: Indiana University Press.
Krim, Arthur J. 1977 Dec. 30. Three Deckers of Dorchester: An Architectural Historical Survey.
Boston Redevelopment Authority. Retrieved from
http://www.sidewalkmemories.org/archives/e%20ree-Deckers%20of%20Dorchester.pdf
Katznelson, Ira. 2005. When Armative Action Was White: An Untold History of Racial In-
equality in Twentieth-Century America. New York: W.W. Norton & Co.
Lui, Meizhu, Barbara Robles, Betsy Leondar-Wright, Rose Brewer, and Rebecca Adamson.
2005. e Color of Wealth: e Story Behind the U.S. Racial Wealth Divide. New York, NY:
e New Press
Massey, Douglas S. 2004. “Segregation and Stratication: A Biosocial Perspective.” Du Bois
Review, 1(1), 7-25.
Menchik, Paul L., and Nancy Ammon Jianakoplos. 1997. “Black-White Wealth Inequality:
Is Inheritance the Reason?” Economic Inquiry, 35(2), 428-442.
Motel, Seth, and Eileen Patten. 2012. “Hispanics of Puerto Rican Origin in the Unit-
ed States, 2010 (statistical prole).” Pew Research Center, Pew Research Hispanic Trends
Project. Retrieved from
http://www.pewhispanic.org/2012/06/27/hispanics-of-puerto-rican-origin-in-the-united-
states-2010/
Motel, Seth, and Eileen Patten. 2014. “Statistical Portrait of Hispanics in the United
States.” Pew Research Center, Pew Research Hispanic Trends Project . Retrieved from
http://www.pewhispanic.org/2014/04/29/statistical-portrait-of-hispanics-in-the-united-
states-2012/#persons-without-health-insurance-by-age-race-and-ethnicity-2012
McKernan, Signe-Mary and Michael Sherraden (Eds). 2008. (Eds.) Asset building and
low-income families. Washington, DC: Urban Institute Press.

27
The Color of Wealth in Boston
McKernan, Signe-Mary, Caroline Ratclie, Eugene Steuerle, and Sisi Zhang. 2013. “Less
an Equal: Racial Disparities in Wealth Accumulation.” Washington, DC:Urban Insti-
tute. Retrieved from
http://www.urban.org/UploadedPDF/412802-Less-an-Equal-
Racial-Disparities-in-Wealth-Accumulation.pdf
Munnell, Alicia H., Georey M. B. Tootell, Lynn E. Browne, and James McEneaney. 1996.
“Mortgage Lending in Boston: Interpreting the HMDA Data.” American Economic Review
86(1), 25-53.
Oliver, Melvin, and omas Shapiro. 2006. Black Wealth/White Wealth: A New Perspective on
Racial Inequality (2nd Ed). New York: Routledge.
Rugaber, Christopher S. 2013 Dec. 17. “Income Inequality Is Hurting the Economy, 3
Dozen Economists Say.” Hungton Post. Retrieved from
http://www.hungtonpost.com/2013/12/17/income-inequality-economy_n_4460725.html
Saez, Emmanuel, and Gabriel Zucman. 2014. “Wealth Inequality in the United States
since 1913: Evidence from Capitalized Income Tax Data.” NBER Working Paper No. 20625.
Cambridge, MA: National Bureau of Economic Research. Retrieved from
http://eml.berkeley.edu/~saez/saez-zucmanNBER14wealth.pdf
Shapiro omas, Tatjana Meschede, and Sam Osoro. 2013. “e Roots of the Widen-
ing Racial Wealth Gap: Explaining the Black-White Economic Divide.” Waltham, MA:
Brandeis University, Institute on Assets and Social Policy. Retrieved from
http://iasp.brandeis.edu/pdfs/Author/shapiro-thomas-m/racialwealthgapbrief.pdf
Servon, Lisa. 2014, Oct. 29. “Are Banks too Expensive to Use?” New York Times, p. A 29.
Sommer, Je. 2013, June 8. “For Retirees, a Million-Dollar Illusion.” New York Times, p.
BU1.
Tippett, Rebecca, Avis Jones-DeWeever, Maya Rockeymoore, Darrick Hamilton, William
Darity Jr. 2014. “Beyond Broke: Why Closing the Racial Wealth Gap Is a Priority for National
Economic Security.” Durham, NC: Duke Center for Global Policy Solutions. Retrieved from
http://globalpolicysolutions.org/wp-content/uploads/2014/04/Beyond_Broke_FINAL.pdf
Uriarte, Miren, Phillip Granberry, Megan Halloran, Susan Kelly, and Rob Kramer. 2003.
“Salvadorans, Guatemalans, Hondurans, and Colombians: A Scan of Needs of Recent Lat-
in American Immigrants to the Boston Area.” Boston, MA: University of Massachusetts,
Gastón Institute. Retrieved from
http://scholarworks.umb.edu/gaston_pubs/134
Weller, Christian E. 2007. “Access Denied: Low-Income and Minority Families Face More
Credit Constraints and Higher Borrowing Costs.” Washington, DC: Center for American
Progress. Retrieved from
http://cdn.americanprogress.org/wp-content/uploads/issues/2007/08/pdf/credit_access.pdf
Yellen, Janet L. 2014, Oct. 17. “Perspectives on Inequality and Opportunity from the Sur-
vey of Consumer Finances.” Remarks at the Conference on Economic Opportunity and
Inequality, Federal Reserve Bank of Boston, Boston, MA). Retrieved from
http://www.federalreserve.gov/newsevents/speech/yellen20141017a.htm
28
The Color of Wealth in Boston
Endnotes
1
As defined by the U.S. Census Bureau, race categories reflect a social definition of race recognized in the United States.
Categories of race are based on respondents’ self-identification and include the following: White, Black or African
American, American Indian and Alaska Native, Asian, and Native Hawaiian and Other Pacific Islander. The concept of
race is separate from the concept of Hispanic origin or ethnicity. In addition to race and ethnicity, the NASCC survey
asked about ancestry and country of origin.
2
The Boston MSA includes the following counties: Essex, Middlesex, Norfolk, Plymouth, and Suffolk in Massachusetts;
and Rockingham and Strafford New Hampshire.
3
All population figures come from the 2012 American Community Survey 1-year estimates. The share of the non-His-
panic white population declined from 81 percent in 2000 to 74 percent in 2012.
4
As of 2012, there were 3,435,332 white residents; 329,500 black residents; 318,181 Asians and Pacific Islanders; and
444,517 Hispanics in the Boston MSA. These categories do not include mixed-race individuals with the exception of
Hispanics/Latinos who may be of any race. Most Hispanics self-identify as “other race” in the U.S. Census.
5
U.S. Census projections at the national level estimate that by 2030 non-Hispanic whites will account for 55 percent of
the nation’s population. Hispanics and non-Hispanic blacks will represent 22% and 13%, respectively. Unfortunately,
population projections at the state level by race and ethnicity are not available.
6
In the United States in 2012, Puerto Ricans and Dominicans accounted for 9.4 percent and 3.1 percent of the Hispanic
population, respectively.
7
Gateway cities in Massachusetts are economically struggling mid-size urban centers. In this report, we use the Federal
Reserve Bank of Boston’s definition of “working cities,” that is, cities in Massachusetts with a population above 35,000
(excluding Boston) that have below median family income and above median poverty rates.
8
U.S. Census Bureau, 2012 American Community Survey, 1-year estimates.
9
The “three-decker” is a unique housing type characteristic of New England cities in the early 20th century. Generally
defined, it is a freestanding, three-story wood frame structure on a narrow lot. Triple-deckers (as they are also called)
are designed as multifamily housing with one family living on each floor, including the owner who typically pays the
mortgage by renting the other two units. They are the dominant housing stock in Dorchester where nearly 5,000 such
structures exist (see Krim 1977).
10
The Center for Survey Research (CSR) at the University of Virginia was the subcontractor that administered the survey.
Tom M. Guterbock, director for the CSR, directed the survey administration. The surveys were translated into Spanish
and Portuguese for the Boston study sample. To complete the survey took an average of 39 minutes.
11
The sample also includes a smaller sample of Asians (14) that we don’t analyze in this report because the sample is not
large enough and because we are not able to differentiate among different subgroups within the Asian category.
12
For the NASCC project in general, about 70,000 personalized advanced letters were sent, 87,000 telephone numbers
dialed 448,000 times, and 12,113 interviewer hours were spent across three shops to conduct 2,746 completed surveys.
13
Among NASCC households, a higher percentage of heads of household have completed college as compared with
households represented in the U.S. Census Bureau’s American Community Survey (ACS) data. For example, for black
households the percentage was 21 percent (ACS data) as compared with 42 percent (NASCC data). Among Hispanics,
NASCC data on educational attainment is similar to the ACS data.
14
In general, the median age of the head of household and the percentage of married households was higher in the NA-
SCC dataset than in the ACS dataset.
15
The median family income for blacks and whites was 10% lower among NASCC households than among ACS house-
holds.
16
We report significance at the 90%, 95% and 99% levels. However, given our small sample sizes it may be difficult to
detect significance at those levels even if differences exist. This is particularly true when estimating asset, debt, and net
worth values. The p-values will be conservative, increasing the likelihood of not detecting significance when, in fact,
there may be significance. Thus, differences in medians can be treated as meaningful in some cases even when statistical
significance is not found at traditional levels.
17
Because of some very high values, using the mean, skews upward estimates of what a typical family owns when measur-
ing wealth. This is especially relevant when comparing groups with small sample sizes, where arithmetic means will be
even more sensitive to outlier values.
18
Cash is not included in these calculations.
19
Tippett et al. (2014) found that 80 percent of whites, 55 percent of blacks, and 60% of Hispanics held checking ac-
counts.
20
It is worth noting that the percentage of Caribbean black households owning savings accounts and the percentage of
Cape Verdean households owning savings accounts did not differ in a statistically significant way.
29
The Color of Wealth in Boston
21
In addition to asking about IRAs or private annuities, the survey asked whether the respondent had a benefit plan at the
workplace that would provide money or other benefits after retirement. Less than 1 percent of respondents who did not
have an IRA or private annuity reported that they had a retirement plan provided by their employer.
22
Tippett et al. (2014) report that in the United States, as a whole, 58 percent of whites had retirement accounts compared
with 32 percent of blacks and 28 percent of Hispanics.
23
Only the percentage of white households having medical debt as compared with other Hispanic households differed in a
statistically significant way.
24
Some of these differences may be attributed in part to other observable characteristics like age or education. Unfortu-
nately, because of small sample sizes, we cannot break down these tables by age and education.
25
The percentage of U.S. blacks owning a home as compared to the percentage of Caribbean blacks differed in a statisti-
cally significant manner.
26
The percentage of U.S. black households and Caribbean black/Haitian households differed in a statistically significant
way, revealing that meaningful ethnic distinctions may exist even within a single racial category.
27
The percentage of U.S. black homeowners and Cape Verdean homeowners differed in a statistically significant way,
another example of how ethnic groups may differ.
28
Excluding IRA and private annuities. Liquid asset values are calculated adding stock values to the total values of check-
ing, saving, money market, Government bonds values.
29
Total asset values for Cape Verdeans and Asians were not calculated because sample sizes were too small. For those
groups for which the data are reported, the estimation excluded “missing values,” that is, cases where the respondents
indicated that they had an asset or debt but had not assigned a value.
30
A recent analysis based on U.S. Census Bureau’s Survey of Income and Program Participation data shows that nation-
wide, as of 2011, African Americans and Hispanics had median liquid assets of only $200 and $340, respectively, as
compared with $23,000 held by whites. For details, see Tippett et al. (2014).
31
Most median debt values were zero because the proportion of households that have debts is less than 50 percent in most
cases.
32
Among households that reported having debt, debt-to-income ratios (excluding mortgages) range from 13 percent
among whites to 30 percent among U.S. blacks.
33
When examining differences in mean wealth, nonwhite groups seemingly fared better with respect to the share of white-
owned wealth. But because wealth is so unequally distributed, a few high-wealth households pulled the average up,
rendering the mean less representative of the typical household. For this reason, the median is preferred as a summary
measure of the wealth holdings of the typical household.
34
Net worth values for Cape Verdean were not calculated because sample sizes were too small. For those groups for which
the data are reported, the estimation excluded “missing values,” that is, cases where the respondents indicated that they
had an asset or debt but had not assigned a value.
35
The percentage of blacks with a bachelor’s degree or higher as compared with similarly educated whites differed sta-
tistically at the 95% level. The percentage of Hispanics with a bachelor’s degree or higher as compared with similarly
educated whites differed statistically at the 99% level.
36
These differences were statistically significant at the 99% level.
37
Economists ranging from Milton Friedman (1957), to Marjorie Galenson (1972), to Marcus Alexis (1971), have found
that, after accounting for household income, blacks have a slightly higher savings rate than whites. More recently,
Maury Gittleman and Edward Wolff (2004) using the Panel Study on Income Dynamics (PSID) have found that, after
controlling for household income, if anything blacks had a mild savings advantage compared to whites (Hamilton and
Chietji 2013).
38
Two of the authors of this report have previously proposed universal gradationally endowed based familial wealth posi-
tion at birth child trust accounts, “baby bonds.” The accounts would be used as seed money to purchase an asset like a
home or a new business that might appreciate over a lifetime (Hamilton and Darity 2009, and Aja et. al. 2014).

30
The Color of Wealth in Boston
Appendix
Measuring wealth
As in any company, families have to balance what they own with what they owe. Wealth,
also called net worth, captures what families have at their disposal to use in case of emer-
gencies or to invest for future gains. Wealth is measured by taking into account the dier-
ence between assets (nancial assets that include liquid assets such as savings and check-
ing accounts, government bonds, and stocks and other nancial assets such as retirement
accounts and nonnancial assets including homes and vehicles) and liabilities (mortgages,
auto loans, credit card debt, and family loans).
ree main surveys collect periodic information on wealth: the Survey of Consumer Fi-
nances (SCF), the Panel Study of Income Dynamics (PSID) and the Survey of Income
Program Participation (SIPP). Wealth and wealth gap estimates vary depending on the
source used.
e SCF provides detailed information on assets and liabilities and provides insights into
changes in family income and net worth. e survey is conducted every three years; it
includes detailed information on family balance sheets, on the use of nancial services,
on pensions, on labor force participation, and on demographic characteristics. e SCF is
sponsored by the Federal Reserve Board. More information available at http://www.feder-
alreserve.gov/econresdata/scf/scndex.htm
e PSID is a longitudinal survey conducted every other year, which allows for intergen-
erational studies. is nationally representative panel include oversamples lower-income
families and provides a detailed inventory of real and nancial assets and liabilities. PSID
is directed by faculty at the University of Michigan.
e SIPP is administered by the U.S. Census Bureau. A major use of the SIPP has been to
evaluate the use of and eligibility for government programs and to analyze the impact of
options for modifying them. e entire sample was interviewed at four-month intervals. Its
large sample size allows for detailed subgroup analysis.
e SCF is dierent from the PSID in that it oversamples higher income households, and
it provides a more detailed picture of assets and debts including information on the current
value of pension plans. Also, the PSID and SIPP provide longitudinal data on assets and
liabilities, but they don’t have the same level of detail as the SCF (McKernan and Sherra-
den 2009).
A major shortcoming of all these surveys has been the lack of detailed information by race
and ethnicity. At the most, using these surveys, comparative analyses can be done for whites
and nonwhites and, in some cases, for whites, Hispanics, and blacks.
+ Assets – Debts
Financial assets
Liquid assets (assets that can be quickly converted
into cash): Checking or savings accounts, money
market funds, certificates of deposit, government
savings bonds, stocks
Other financial assets: Individual retirement accounts,
private annuities value, business equitive net value
Tangible assets
Home, vehicles, other real estate
Credit card debt
Medical Debt
Student loans
Installment loans
Loans from family and friends
Secured debt
Mortgage, Vehicle debt
Wealth (net worth) =
Assets-Debts