No.13‐2
The2010SurveyofConsumerPaymentChoice
KevinFoster,ScottSchuh,andHanbingZhang
Abstract:
In 2010, the number of consumer payments increased nearly 9 percent from 2009 as economic
activitybegan to rebound from the financial crisis and recession. Cash payments by consumers,
whichhadincreasedsharplyin2009,didnotfallbackbutrathergrewanother3percentin2010.
However,theshareofcashpayments,thedollaramountofcashwithdrawals,andcashholdings
by consumers decreased moderately in 2010. Credit card payments by consumers increased 15
percent, reversing more than halfthe 2009 decline, and the steady trend decline in paper chec k
paymentsbyconsumerscontinued.Debitcardsandcashcontinuedtoaccountforthetwolargest
sharesofconsumerpayments(31.1and28.6percent,respectively),andconsumeradoptionofall
types of prepaid cards (38.2 percent) increased notably in 2010. Mobile banking and mobile
payments by consumers continued to show moderate increases through the end of 2010,
consistent with early stages of technology adoption. The 2010 SCPC contains new results that
mayhelpresearchersandpolicymakersidentifypotentialindirecteffects ofRegulationII(Durbin
Amendment)onconsumersandmayhelptoinformtheFederalReserve’s newstrategicplanfor
thepaymentsystem.
JELClassifications:D12,D14,E42
K
evin Foster and Scott Schuh are members of the Consumer Payments Research Center in the research
departmentoftheFederalReserveBankofBoston.KevinFosterisasurveymethodologist.ScottSchuhis
the director of the Center and a senior economist andpolicyadvisor.Hanbing Zhang isa law studentat
YaleUniversityandaformerresearchassociatewiththeConsumerPaymentsResearchCenter.Theiremail
respectively.
This report, which may be revised, isavailable on the web site of the Federal Reserve Bank of Boston at
http://www.bostonfed.org/economic/rdr/index.htm.
Completeanddetailedacknowledgmentsappearonthefirstpageofthis report.Theprimaryauthorsare
responsibleforanyerrorsthatmayremain.
Theviewsexpressed inthispaperarethoseoftheauthorsandtheFederal ReserveBankof Boston.They
donotnecessarilyrepresenttheviewsoftheotherFederalRe
serveBanksortheBoardofGovernorsofthe
FederalReserveSystem.
Thisversion:November2013
1
Acknowledgments
The Survey of Consumer Payment Choice (SCPC) is produced by the Consumer Payments
Research Center (CPRC) in the research department at the Federal Reserve Bank of Boston.
Enthusiastic and generous support from the Bank’s senior management for many years is
acknowledged and greatly appreciated. Geoff Tootell and Robert Triest provided excellent
oversight ofthe CPRC and its data program. For more detailed acknowledgments and a brief
historyoftheSCPC,seeFoster,Meier,Schuh,andZabek(2009,2011).
Thefollowingindividualscontributeddirectlytotheproductionanddisseminationofthe2010
Survey of ConsumerPayment Choice. From the Boston Fed: Patricia
Allouise, Sean Connolly,
Marianne Crowe, Kevin Foster, Claire Greene, Marcin Hitczenko, Vikram Jambulapati, Nina
Johnson,TomLavelle,SuzanneLorant,WilliamMurdock,LaurenNyren,SarojiniRao,Heather
Roberts,ScottSchuh,OzShy,JoannaStavins,JoelWerkema,MichaelA.Zabek,JeffZhang,and
Chuanqi Zhu. From the RAND Corp.: Marco Angrisani, Sandy Chien,
Tim Colvin, Tania
Gutsche, Arie Kapteyn, Erik Meijer, Julie Newell, Matthias Schonlau, and Albert Weerman.
(SomeoftheRANDstaffnowworksfortheUniversityofSouthernCalifornia.)
The CPRC acknowledges and thanks the CPRC Board of Advisors who served during the
productionanddisseminationof the 2010 SCPC; see
SectionXII for a listofthe Advisors. Ray
GraberandTom Burke ofGraberAssociates provided publicrelationsand marketingservices
for the CPRC and SCPC during the production of the 2010 SCPC. Louise Roseman, Board of
Governors of the Federal Reserve System, provided very helpfulcomments onthe 2010
SCPC
questionnaire. Janet Estep, Jane Larimer, Colleen Morrison, and Scott Lang of NACHA (The
Electronic Payments Association) provided data and technical advice on consumer electronic
payments.

2
ContactList
Pleasecontactthefollowingindividualsforfurtherinformationabout theSurveyofConsumer
PaymentChoiceinthedesignatedareasofinterest.
FederalReserveBankofBoston
MediaandPublicRelations
ThomasLavelle,VicePresidentandPublicInformationOfficer
(617)973‐3647
ConsumerPaymentsResearchCenter(CPRC)
ClaireGreene,PaymentsAnalyst(publicinformationliaison)
(617)973‐3246
KevinFoster,SurveyMethodologist
(617)973‐3955
ScottSchuh,DirectorandEconomist
(617)973‐3941
RAND‐USCAmericanLifePanel
UniversityofSouthernCalifornia,CenterforSocialandEconomicResearch(CESR)
TaniaGutsche,ManagingDirector
(310)448‐0371
[email protected](alternate)
ArieKapteyn,Director
(310)448‐5383
[email protected](alternate)
RANDCorporation,LaborandPopulationDivision
JoyMoini,SeniorResearchDirector
(310)393‐0411x6045
3
TableofContents
I.Introduction.......................................................................................................................................4
II.ConceptsandContent......................................................................................................................8
III.ConsumerUseofPaymentInstruments......................................................................................15
IV.ConsumerAdoptionofPaymentInstruments............................................................................23
V.BankandOtherPaymentAccounts.............................................................................................33
VI.SelectedTopics................................................................................................................................35
VII.NewQuestionsin2010..................................................................................................................41
VIII.SurveyMethodologyand
Data.....................................................................................................51
IX.Conclusions......................................................................................................................................59
X.Definitionsandconcepts................................................................................................................60
XI.SCPCBoardofAdvisors.................................................................................................................68
XII.References........................................................................................................................................70
XIII.2010SCPCTables............................................................................................................................73

4
I. Introduction
The2010SurveyofConsumerPaymentChoice(SCPC)isthethirdinaseriesofannual
studies(2008–2010)conductedbytheFederalReserveBankofBostontogainacomprehensive
understanding of the cash and noncash payment behavior of U.S. consumers.
1
This report
contains 43 tables with detailed estimates of therates of adoption, shares of consumers using,
and number of payments made by consumers for nine common payment instruments—cash,
checks,moneyorders,traveler’schecks,debit cards,creditcards,prepaidcards,onlinebanking
bill payments (OBBP), and bank account number payments
(BANP)—plus payments made
directlyfromconsumers’incomesource.Thereportalsocontainsestimatesofconsumeractivity
related to banking, cash management, and other payment practices; consumer assessments of
paymentcharacteristics;andarichsetofconsumerandhouseholddemographiccharacteristics.
In2010,thenumberofconsumerpaymentsrebounded astheeconomy
begantoemerge
from the financial crisis and recession. The large increase in consumers’ use of cash in 2009,
documentedinFoster,Meier,Sch u h,andZabek(2011),generallywasnotreversedin2010.The
number of cash payments increased moderately, while the share of cash payments and most
measures of
cash holdings and withdrawals declined moderately. Consumers also increased
their use of credit card s and bank account numbers (BANP) to make payments in 2010, with
both methods recovering roughly half of their 2009 declines. Changes in other noncash
consumerpaymentswererelativelymodest,evenforprepaidcards,whichexperiencedalarge
increase in the rate of adoption by consumers. Debit cards remained one of the two most
popularconsumerpaymentmethods(31.1percentofallpayments;cashwas28.6percent),and
1
FordetailedreportsonearlierversionsoftheSCPC,seeFoster,Meier,Schuh,andZabek(2009,2011).

5
adoptionanduseofdebitcardsincreased.Consumerpaymentsbycheckcontinuedtheirlong‐
run trend decline. Mobile banking and mobile payments by consumers continued to increase
moderatelythrough2010,consistentwithearlystagesoftechnologydiffusionandconfirmedby
other,morerecentdata.
The 2010 SCPC provides results that may
help to inform the assessment of the 2010
Dodd‐Frank Act (DFA), which included new legislation pertaining to debit card interchange
fees and routing. The so‐called Durbin Amendment to DFA became Regulation II, which the
Federal Reserve approved in July 2011 and implemented in October 2011.
2
In response to this
development, the CPRC added new question s to the 2010 SCPC about consumer attitudes
towarddebitcardauthorizationmethodsandsecuritytohelpgaugethepotentialpolicyimpact
onconsumerbehavior.RegIIprimarilyaffectedfinancialinstitutions,paymentcardnetworks,
and merchants; most consumers likely were unaware
of the changes. However, consumers’
debit card behavior may have been affected indirectly by Reg II because of differences in
consumerattitudestowardauthorizationmethodsandsecurity.If so,thenewquestionsabout
these issues in 2010 (and subsequent surveys) may help researchers to identify any indirect
impact.
The SCPC of
2010 (and other survey years) may provide useful data for at least two
other recent proposed policies. One is the Federal Reserve’s new strategic focus for financial
servicesduringthenextdecade,whichwasannouncedinOctober2012bythepresidentofthe
FederalReserve BankofCleveland(Pianalto2012).
AnimportantelementoftheFed’splanisto
begin taking into account the preferences of end users, such as consumers, when making
decisions about the payment system. A second policy is the Advanced Notice of Proposed
Rulemaking on prepaid cards issued by the Consumer Financial Protection Bureau (CFPB) in
2
Seehttp://www.federalreserve.gov/paymentsystems/regii‐about.htm.

6
May 2012, which “seeks input on how to ensure that consumers’ funds on prepaid cards are
safeandthatcardtermsandfeesaretransparent.”
3
Todetermineconsumerpreferencestoward
prepaidcardsandotherpaymentinstruments,itisnecessarytohavedataonactual consumer
paymentchoicesaswellastheirattitudestowardpaymentinstrumentsandpractices,whichare
in the SCPC. Aparticular advantageof the SCPC data is the fact that it contains
estimates for
the same consumer over multiple years. This type of longitudinal panel of consumers’ data,
which now extends to three years (2008–2010), offers unique information for researchers and
policymakers.
As in prior years, the 2010 SCPC was developed by the Consumer Payments Research
Center (CPRC) of the Boston Fed and
implemented by the RAND Corporation as an online
survey, using RAND’s American Life Panel.
4
The 2010 SCPC had 2,102 respondents whose
responses were weighted to represent all U.S. consumers ages 18 years and older. Of these
respondents, 1,913 of them (91 percent) were also respondents to the 2009 SCPC, and 788 of
respondents completed all three surveys since 2008. Both groups form valuable longitudinal
panels for research on consumer payment choice. The survey was implemented in the fall of
2010,primarilyinOctober.AlsoinOctober2010,theCPRCteamedwithrepresentativesofthe
FederalReserveBanksofRichmondandSanFranciscotoimplementapilotstudyversionofa
consumerpaymentdiarytosupplement
theSCPC.
5
Theresultsofthe2010SCPCreflectfurthermodificationsinthequestionnaireandother
aspectsofsurveymethodology,introducedtoimprovetheoverallqualityandmeasurementof
3
See http://www.consumerfinance.gov/pressreleases/consumer‐financial‐protection‐bureau‐considers‐rules‐on‐
prepaid‐cards/.
4
In 2013, the American Life Panel became a joint venture between the RAND Corporation (Labor and Population
Division)andtheUniversityofSouthernCalifornia(DornsifeCenterforEconomicandSocialResearch).
5
The results of the pilot diary in 2010 and 2011 are not published because of their developmental stage and small
samplesizes.AnofficialversionoftheDiaryofConsumerPaymentChoice wasimplementedinOctober2012and
theresultsarebeingpreparedforpublication.
7
consumer payment choices. To this end, the following revisions were made to the survey
questionnaire:
Questions were modified and added to improve measurement of mobile banking
andmobilepayments;
Newquestionswereaddedaboutthesecurityandinitiationofdebitcardpayments;
Twoquestions about consumer assessmentsof
characteristics ofpayments that had
beendroppedin2009(recordkeepingandsetupcost)wererestored;
An improv ed methodology was introduced for detecting and reducing online
reportingerrors.
Releaseofthe2010SCPCresults,alongwithreviseddatafor2008–2009,wasdelayedby
complications associated with evaluating and cleaning
the responses across time. Previously,
thedata evaluationandcleaning process wasconducted on a year‐by‐year basis using largely
subjective judgments. With the addition of a third year of data in 2010, however, it became
possibletoenhancethedataanalysistoincludethetime‐seriespropertiesofthe
responsesand
develop more consistent, objective, rule‐based, multi‐year procedures for evaluating and
cleaning the survey‐response data. This task required extensive new research and innovation
andwasfurthercomplicatedbychangestothesurveyquestionnaire.Thoughthesechangesare
valuable improvements to the measurement of consumer payment activity,
the changes also
makeitmorechallengingtodrawcross‐yearcomparisons becauseofthedifficultiesinherentin
separating effects of changes in the survey from the effects of changes in economic behavior.
The investment in improving the analysis and cleaning the SCPC data in 2010 is expected to
reducethe
timeittakestoprocessandpublishSCPCresultsfor2011andbeyond.
All SCPC data are available free of charge to the public once the official results have
been published, along with complete technical documentation. As with previously published
results, the SCPC estimates for 2008–2010 reported here may be revised in the future due to
additional process improvement and insights from new data in 2011 and beyond. The 2008–
2010 estimates are not yet adjusted for seasonal variation, inflation, or item nonresponse
8
(missing values). The CPRC is conducting ongoing research to develop procedures for these
kindsofadjustmentsforpotentialinclusioninfuturedatareleases.
The remainder of this paper comprises three parts: 1) a written summary of the key
SCPCresults;2)asetofofficialtablescontainingmostoftheSCPC
results;and3)asetoftables
containingtheofficialdefinitionsofimportantsurveyconcepts.Mored e tailsareavailableina
separatetechnicalappendixbyAngrisani,Foster,andHitczenko(2013).
II. ConceptsandContent
The main objective of the SCPC program is to measure U.S. consumer payments
behavior.Broadlyspeaking,theSCPCasksconsumerswhatpaymentaccountsandinstruments
theyhaveandhow theyusetheseaccountsandinstruments. ThetwomaingoalsoftheSCPC
programare:1)toprovideaggregatedataontrends
inU.S.consumerpaymentchoices;and2)
toprovideaconsumer‐leveldatabasetosupportresearchonconsumerpaymentchoices.
KeyMeasurementConcepts
ThereportingunitoftheSCPCisanindividualconsumerintheU.S.,age18orolder.The
primaryreasonisthatitiscostliertoobtain
estimatesforallconsumersinahouseholdanditis
unlikelythataheadofhouseholdcanaccuratelytrackpaymentsofallmembers,especiallyfor
cash. Consequently, the SCPC does not provide comprehensive estimates of the payment
choicesofhouseholdunits.However,informationabouteachreportingconsumer’shouseholdis
collected in
the survey and can be used to tabulate consumer payment behavior by type of

9
household, and for research on the relationship between consumer payment choice and
householdcharacteristics.
6
ThecoremeasurementconceptoftheSCPCisapaymentinstrument,whichissomething
thatconsumersuseto initiateandauthorizepaymenttoanotherparty(seeDefinitionsTable2
for more detail). Payments are settled with some form of money, which economists most
commonlydefineasM1:
Currency,
or“cash”(coins,billsandnotes),
Funds in a bank demand deposit account (checking) or other checkable deposit
account,
Traveler’schecks.
Two forms of money, cash and traveler’s checks, are both money and payment instruments,
whileotherinstrumentsarenot.
7
Onerecent,complicatingexceptiontothisclassificationisthat
some traveler’s checks are now being issued as prepaid cards (see below). Four technologies
serveaspaymentinstrumentsthatcanaccessfundsincheckingandotherdepositaccounts:
Paperchecks,
Debitcards(alsocalledcheckcards),
Online banking
bill payments (OBBP), which consumers initiate from their bank’s
onlinebankingwebsite,
6
Thedecisionnottocollectpaymentinformationatthehouseholdlevelshouldnotaffectthestatisticalpropertiesof
theaggregateestimatesofconsumerpaymentbehavior,inexpectation.However,theSCPCsamplingweightsdonot
accountforhouseholdcharacteristics,andtheCPRCiscontinuingtostudythestatisticalandeconomicrelationships
betweenindividualconsumerpaymentsandhouseholdpaymentsinmulti‐consumerhouseholds.TheSCPCcontains
amodestnumberofrespondentswhoaremembersofthesamehousehold.
7
Formoredetailsaboutthedifferencebetween(“basic”)moneyandpaymentinstruments(“derivativemedia”),see
Tobin(2008).

10
Bank account number payments (BANP), which occur when consumers give their
bankroutingandaccountnumbers toathirdpartyotherthanthebanktoauthorize
payment.
Twootherpaymentinstrumentshaveuniqueproperties:
Credit cards authorize payments to be settled later and hence are based on debt
rather
thanmoney;
Prepaid cards (also called gift cards, stored‐value cards, or prepaid debit cards –
including some types of traveler’s checks) authorize payment from balances that
consumerspre‐fundwithsomekindofpaymentinstrument.
8
The SCPC also tracks payments made by consumers directly from their income source (for
example,fromtheirpaycheck).Althoughpaymentsmadedirectlyfromincomesourcesreplace
conventional payments, they are not counted as a payment instrument at this time. See
Definition Tables 1 and 2 for more details about banking
concepts and payment instruments.
Paymentinstrumentsalsohavevarioustypesofcharacteristics:acceptance,convenience,costof
use, cost of setup, recordkeeping, and security. For each payment instrument, the SCPC asks
consumerstorateeachofthesecharacteristicsasitappliestothatinstrumentona1to5scale
(with
5beingthehighestorbestrating).Presumably,consumersbasetheirratingsontheirown
objectiveknowledgeabouttheactualpaymentcharacteristicstheyface.However,theseratings
may contain measurement error due to incomplete information, memory loss, estimation, or
8
Depending on the type of prepaid card, including traveler’s checks, the consumer’s pre‐funded balances may or
maynotbeheldinabankaccountandcouldbepaidusingmanydifferentinstruments,includingcash,creditcard,
or BANP. In any case, the variety of sources of funds backing the
prepaid card, as well as the legal and financial
protectionsassociatedwiththem,maynotbeknownorunderstoodwellbyconsumers.Also,prepaidcardsfunded
byoneconsumermaybeaccessedandusedbyanotherconsumer.

11
even subjective perception. See Definition Table 7 for more information about payment
instrumentcharacteristics.
TheSCPCprimarilymeasurestwotypesofconsumerpaymentchoice.First,itmeasures
the adoption (or ownership) of payment accounts, payment instruments, and other payment
practicesbyaskingwhetherornotconsumershavetheitemand,
formanyitems,whetherthey
everhadit(iftheydidnothaveitatthetimeofthesurvey).Theproportionofconsumerswho
do not have an item now but did have it in the past reflects a minimum estimate of the
percentage of consumers who have discarded the
item. For some payment instrument, such as
cash and money orders, adoption and discarding occur naturally as part of their use so
ownershipoftheseinstrumentsisdefinedbytheiruseduring thepast12months.Second,the
SCPC also measures consumers’ use of payment instruments and other payment practices
in
twoways: theshare of consumers whouse them in a monthor year and thenumberof times
consumersusethem.Inprinciple,itwouldbeusefulfortheSCPCtomeasurethedollarvalueof
consumer payments in addition to the number of payments. However, the SCPC does
not
attempt to measure the dollar value of payments because the dollar values are larger, more
complicated numbers that are presumably more difficult for consumers to report.
9
See
DefinitionTables3and4formoredetailsaboutadoptionanduse.
TheSCPCalsomeasuresconsumerpaymentsbytypeoftransaction.Consumerpayment
transactions are broadly classified as bills or nonbills. A bill means a recurring payment—
typically monthly, but potentially any one of a variety of frequencies—that
is usually made
after a good or service is purchased (for example, loan repayments, utility payments,
subscription fees, membership dues, etc.).Nonbills are all other payments, which are broken
down further into two categories: retail goods and services and person‐to‐person (P2P)
9
Thedollarvaluesareincludedinthenew2012DiaryofConsumerPaymentChoice(forthcoming).

12
payments. Both nonbill payment categories can be further divided into two locations: online
andotherelectronicpayments(suchasthosemadeonmobilephones),andbymail,in‐person,
orbyphone.SeeDefinitionsTable5formoredetailsabouttransactions.
The SCPC employs a flexible reporting strategy to enhance recall
and maximize the
accuracyofitsestimatesofthenumber(use)ofpayments.First,respondentsareaskedtoreport
the number of payments for a typical period rather than a specific calendar period. Typical
periods are like an implicit average that ideally is consistent with consumers’ sense of their
regular
or trend behavior; typical periods also have the advantage of eliminating unusual
events that might affect high‐frequency payments and obscure longer‐run trends.
10
Second,
respondents are allowed to choose the frequency (week, month, or year) that best suits their
recollection of payments for eachcombination of payment instrumentandtype of transaction.
Third,respondentsareaskedtoreporttheirnumberofpaymentsatrelativelydetailedlevels—
foreachcombinationof10uniquelydefinedmeans
ofpayment(ninepaymentinstrumentsand
directdeductionfromincome)andsevenuniquelydefinedtransactiontypes:threetypesofbills
andfourtypesofnonbillpaymentsforgoodsandservices,includingpaymentstootherpeople
who are not merchants. Not all combinations of payment instrument andtransaction type are
possible
because not all instruments are accepted for all transactions. Thus, respondents may
report up to 41 categories of payments, depending on how many instruments they have
adopted.
SupplyandDemandPerspectives
Theconsumer‐orientedconcepts anddefinitions in theSCPC differ in somewaysfrom
the terminology and perspectives of the
supply side of the payment system, especially in the
10
Foracomparisonoftheeffectivenessofusingthetypicalperiodrelativetoaspecificcalendarperiodinasurveyof
consumerpaymentchoicewithrecall,seeAngrisani,Kapteyn,andSchuh(2012).

13
areaofelectronicpayments.
11
Thisdemand‐sideapproachtomeasuringpaymentactivityhelps
to fill a knowledge gap by complementing work on the supply‐side perspective of payment
services (banks, the Federal Reserve System, nonbank payment service providers, an d
consultants, and merchants who accept payment from consumers), which focuses on the
networksandprocesses
bywhich payments are settled.
12
In contrast, the SCPC measures how
consumersinitiateandauthorizepaymentsratherthanhowpaymentsclearandsettle.
The Federal Reserve’s new strategic focus for financial services (Pianalto 2012)
emphasizes the importance of developing an array of payment instruments that satisfy
consumer preferences. To accomplish this objective, it is first
important to obtain a better
understanding of the relationship between the supply and demand for payment instruments.
Then, to properly take into account consumer (end‐user) preferences, policymakers need to
understandtheinteractionbetweenthesupplyanddemandforpayments.Thesupply‐sidecost
ofprovidingpaymentservices is one important
aspect of understanding the optimal payment
system. However, there are distinct costs and especially benefits to consumers that affect the
optimalityofthemoneyandpaymentsystem.
TheSCPC,alongwithotherrelateddataprojectsfromtheConsumerPaymentsResearch
Center, can provide useful input for research and understanding of
consumer preferences.
Ultimately,however,itwouldbebesttohavedetaileddataonboththesupplyanddemandfor
11
TheBANPinstrumentisaprimeexampleofhowtheconsumerperspectiveonpaymentsdiffersfromthesupply‐
side perspective. BANP is an electronic payment in which a consumer gives his or her bank account and bank
routing numbers to a third party who then uses the numbers to obtain permission to debit the consumer’s bank
account for payment. Thus, it is like an electronic check. Consumer payments made by OBBP also work like an
electronic check, except that the consumer’s bank does not disclose the bank account number (or other personal
information)toathirdparty.Viewedfromthesupply
sideofpayments,bothOBBPandBANPconsumerpayments
settleontheAutomaticClearingHouse(ACH)networkandarebothclassifiedasan“ACHpayment”instrumentin
theFederalReservePaymentStudies(seeFederalReserveSystem2010).
12
Forexample,seethelatestFederalReservePaymentStudy(FederalReserveSystem2010).

14
money and payments, and how these interact for each consumer‐merchant payment
transaction, to be able to design an optimal money and payment sys t em with appropriate
governmentpolicies.
OfficialTablesandData
The official 2010 survey results appear in SCPC Tables 1–33 ofthis paper(a total of 43
tables).Thetablesareorganizedbroadlyintofoursections:
1. Adoption – Consumer adoption of bank accounts, nonbank payment accounts, and
paymentinstrumentsandpractices.[Tables1–12]
2. Use – Consumer use of their
adopted payment instruments to pay bills, purchase
goodsandservices,andmakeotherpayments.[Tables13–26]
3. Assessments – Consumer assessments of key characteristics of payment instruments
andpaymentpractices.[Tables28–29K]
4. Demographics and other – Information about consumer demographic characteristics
andfinancialstatus.[Tables30–33]
A complete set
of analogous tables containing estimates of the standard errors fo r the SCPC
results is available online.
13
The official definitions of survey concepts are found in Definition
Tables1–7.
TheSCPCtablescontainmost,butnotall,oftheresultsfromthe2010survey.The2010
SCPCpublic‐usemicrodatasetcontainstheconsumer‐levelSCPCresponsestoallofthesurvey
questions,includingthoseusedto
createtheofficialtables,andalsomanymoreresponsesthat
arenottabulatedor presented here.Acompletelistofvariablesinthe2010SCPC datasetcan
13
Toobtainthestandarderrortables,seehttp://www.bostonfed.org/economic/cprc/SCPC/index.htm

15
be obtained from the data codebook and questionnaire.
14
All SCPC data users are strongly
encouraged to read Section VIII, Survey Methodology and Data, and the technical appendix
(Angrisani, Foster, and Hitczenko 2013) for more details and instructions on how to use the
data.
III. ConsumerUseofPaymentInstruments
TotalPayments
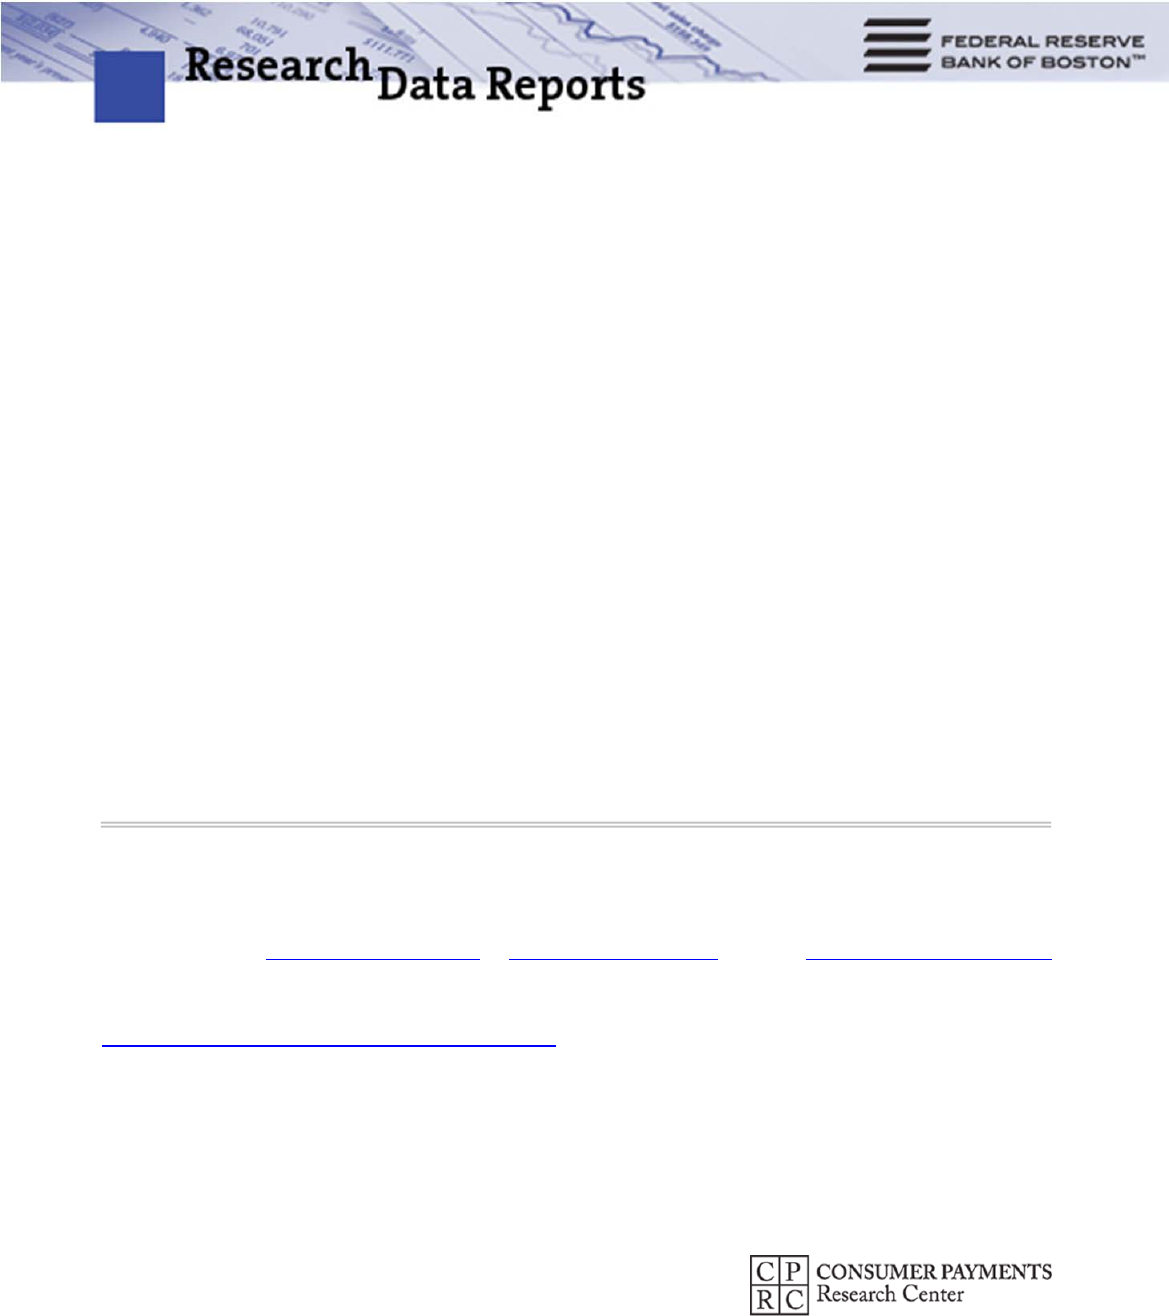
Total consumer payments per month rebounded in 2010, as shown in Figure 1. The average
numberofpaymentsmadebyconsumers(percapita)increased8.8percentin2010(Q4toQ4)to
73.0 in a typical month.
15
Consumer payments in the fourth quarter of 2010 were 2.5
16
percent
above their level in the same period of 2008, which was near the mid‐point of the previous
recessionasdefinedbytheNationalBureauofEconomicResearch(NBER)anddenotedbythe
shadedregionofFigure1.
14
Toobtainthe2010SCPCdataset,codebook,andquestionnaire,see
http://www.bostonfed.org/economic/cprc/SCPC/index.htm
15
The 2010 increase in total consumer payments per month is statistically significant at the 99 percent significance
level.
16
Allnumbersreportedinthetextarecopiedfromnumbersintheofficialtablesor,inthecaseoftransformations
suchasgrowthrates,calculatedusingthenumbersintheofficialtables,whichareroundedtointegersorasmall
numberofdecimals.SimilarcalculationsusingvariablesfromtheofficialSCPCdataset,whichhavemoreprecision,
mayproduceslightlydifferentestimatesinsomecasesduetothelackofrounding.
16
Figure1:Numberofconsumerpaymentspercapitapermonth
Source:2010SurveyofConsumerPaymentChoice,Table20.
Althoughthenumberofconsumerpaymentsin2008–2010appearstohavemovedprocyclically
during this unusually tumultuous time, with only three annual time series observations it is
simplytoosoontodeterminethe cyclical characterofthenumberof consumerpayments;that
willhavetowaituntiladditionalyearsof
databecomeavailable.Readersshouldalsobeaware
that the number of co nsumer payments is not the same as the National Income Account
measure of real consumption (per capita); Section VIII explains the relationship between the
twomeasures.

17
PaymentsbyInstrumentandTransactionType
In 2010, the SCPC tracked the number of payments made by consumers using 10 means of
payment(ninepaymentinstrumentsplusautomaticdeductionsfromincomesources )forseven
transactiontypes,asshowninTable1.Thetableshowstheaveragenumberofpaymentsmade
by consumers in a typical month for
each combination of instrument and transaction.
17
Blank
table entries indicate combinations for which the means of payment is assumed not to be
acceptedforthetransaction.Forexample,consumerscannotusecashtopayonline.
The largest number of consumer payments used cash (9.4 per month) and debit cards (9.2) to
pay for goods, followed by
payments for services using cash (7.1) and debit cards (6.0).
Consumersalsomade5.4creditcardpaymentsforgoodsand3.8forservices.Another2.7cash
payments were made by consumers to other consumers (or person‐to‐person, P2P) for
unspecified reasons. No other means of payment accounts for as many
as 2.0 payments for
nonbills.
Thelargestnumbersofbillpaymentsaremadebymail,phone,orinpersonusingcheck(3.3)or
cash (2.5). Among payment instruments, however, debit cards are used to make the most bill
payments:2.1automatic,2.0online,and2.3bymail,phone,orin
person,foratotalof6.3
18
bill
payments. Consumers make several automatic and online bill paym ents each month using
OBBPandBANPaswell.
19
17
TheaverageU.S.householdhadabouttwoconsumers(age18orolder)in2010,sodoublingthenumbersinTable1
yieldsanapproximateestimateofpaymentsperhousehold(excludingpaymentsbychildren).
18
Numbersdonotsumexactlyduetorounding.
19
The number of payments in each category may not necessarily reflect consumers’ preferred choices if there are
constraintsontheiradoptionanduseofpaymentinstruments,ifmerchantsvaryintheiracceptanceofpayments,or
if other factors influence consumer decisions. However, if these actual choices do reflect consumers’ preferred
paymentchoices,thenconsumerpreferencescanbeestimatedfromamodelofconsumerpaymentchoiceasshown
inKoulayev,Rysman,Schuh,andStavins(2012).

18
BillPayments NonbillPayments
Automatic Online
Mail,
phone,
in
person Online Goods
Services
&other
Person
to
person
Cash 2.5 9.4 7.1 2.7
Check 3.3 0.6 1.6 1.6 0.9
Moneyorder 0.3 0.1 0.1 0.1 0.1
Traveler’scheck*
Debitcard 2.1 2.0 2.3 1.3 9.2 6.0 0.5
Creditcard 1.2 0.9 1.2 0.8 5.4 3.8 0.2
Prepaidcard 0.1 0.1 0.2 0.1
OBBP 1.2 1.9 0.2
BANP 1.2 1.3 1.0 0.2
Incomededuction 0.6
Table1:Averagenumberofpaymentsmadeintypicalmonth,bytransactiontype
*Traveler’s checksare reportedin aseparate section,outsidethe paymentinstrument/transactiontype section,and
haveanaveragenumberof0.0paymentsafterrounding.
Source:2010SurveyofConsumerPaymentChoice,Tables23–25.
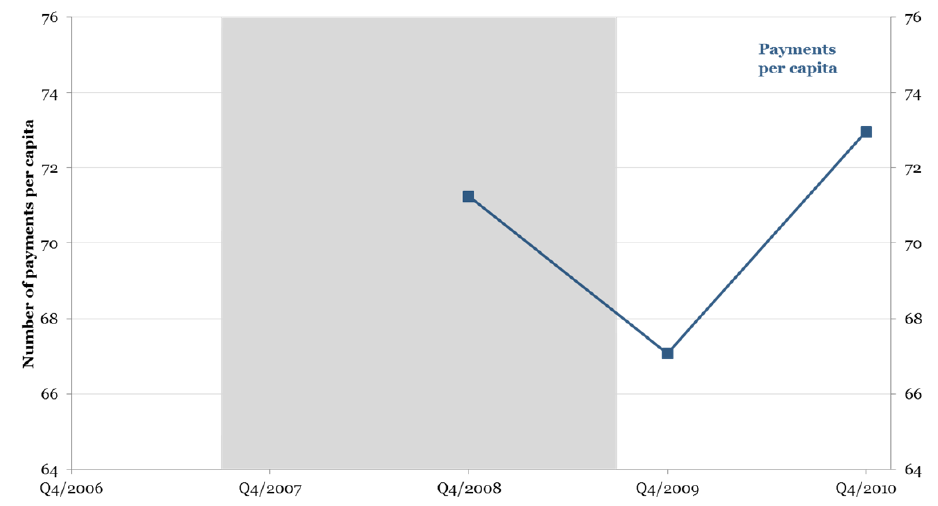
PaymentsbyTransaction
Oftheaverage73paymentsinatypicalmonthin2010,consumersmadeanaverageof21.2bill
payments(or29.2percentoftotalpayments)and51.4nonbillpayments(70.8percent),asshown
inFigure2.
20
Amongbills,themostcommonmethodofpaymentbyconsumerswasbymailor
in person (9.2 per month). Bill payments set up by consumers to be made automatically each
20
ThenumberofbillpaymentintheSCPCtendstobehigherthanotherindustryestimates.Potentialexplanations
are:1)theSCPCasksrespondentstoreportbillpaymentatamoredetailedleveloftypeandpaymentinstrument,
whichmayenhancerespondentrecall;2)theSCPCleavesthedefinitionofbills
opentorespondents’interpretation,
whichmayleadtoamoreinclusiveestimate;and3)theSCPCrespondentsareconsumersratherthanheadsof
households,whichmayleadtosomedouble‐countingofhouseholdbills.TheCPRCcontinuestostudythisissue.
19
month(6.1)andbillpaymentsmadeonlineattheconsumer’sdiscretionthroughoutthemonth
(5.9)wereaboutthesame.
Figure2:Numberofconsumerpaymentspermonthbytransaction
Source:2010SurveyofConsumerPaymentChoice,Table21.
Mostnonbillconsumerpaymentsweremadeinperson.Inatypicalmonth,consumersmadean
averageof25.1paymentsforretailgoodsand18.1paymentsforserviceswhileshoppingoffline,
plus another 4.5 payments directly to another person (person‐to‐person, or P2P). Consumers
madeanaverageof3.7nonbillonline
paymentspermonth.
20
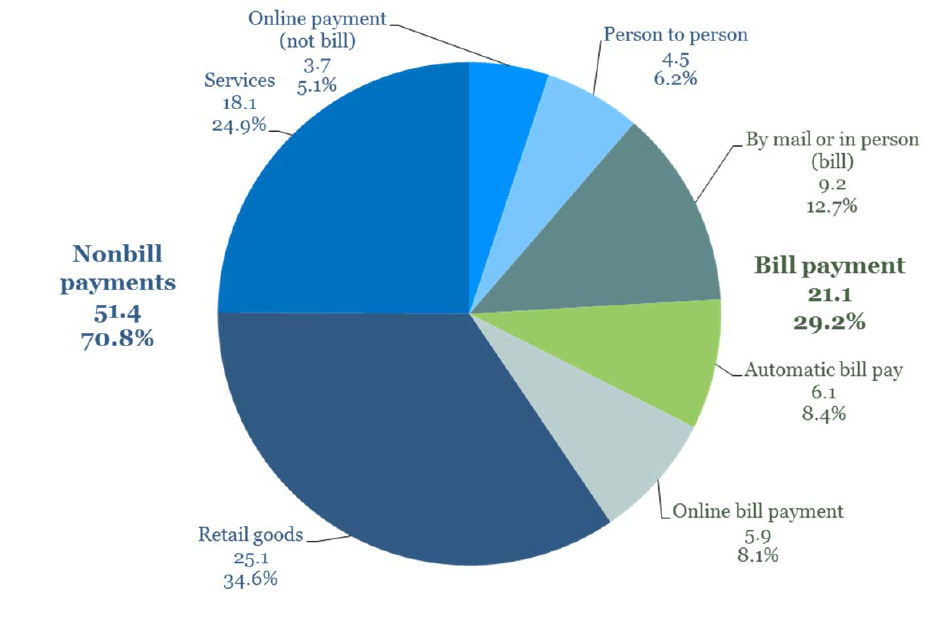
The average number of consumer payments by transaction type shifted primarily among
nonbill payments in 2010, as shown by the dark bars in Figure 3.
21
The share of consumer
payments for services made by mail, in‐person, or by phone increased 5.6 percentage points,
whiletheshareofpaymentsforretailgoodsmadeby mail,in‐person,orbyphonedecreased6.3
percentagepoints. The shareof consumer paymentsmadeonline for retail goods and
services
combineddeclined2.1percentagepoints,aboutthesamedeclineinthiscategoryasin2009(2.4
percentagepoints).Otherchangesinpaymentshareswerenotstatisticallysignificant.
Figure3:Changesinconsumerpaymentsbytransactiontype
Source:2010SurveyofConsumerPaymentChoice,Table21.
21
Thestatisticalhypothesisofnochangeinthemixoftransactionpaymentsbyconsumersin2010canberejectedat
the95percentsignificancelevel.
21
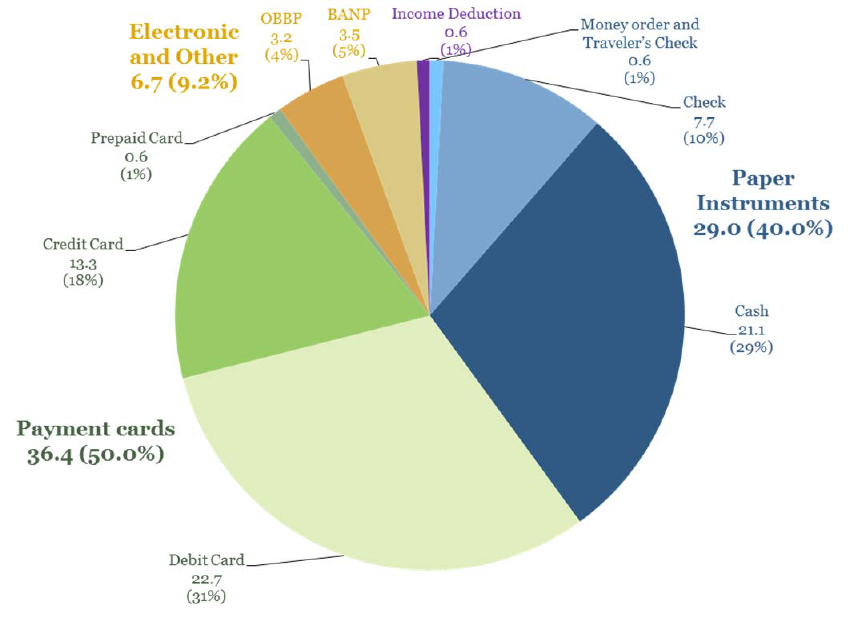
PaymentsbyInstrumentType
In2010,consumersmadeanaverageof36.4paymentsusingpaymentcards(or50.0percentof
totalpayments),29.0paymentsusingpaperinstruments(40.0percent),and6.7paymentsusing
electronic and other instruments (9.2 percent) in a typical month, as shownin Figure 4. Debit
cardsandcashcontinuedtobe
mostpopularamongconsumers.Consumersmadeanaverage
of22.7debitcardand21.1cashpaymentsinatypicalmonth,accountingfor about three‐fifths
of all consumer payments in a typical month (59.7 percent). The next most popular payments
instruments were credit cards (13.3 payments) and checks (7.7 payments).
All other payment
instrumentswereusedforanaverageof8.5paymentspermonth.
Figure4:Numberofconsumerpaymentsinatypicalmonth,bypaymentinstrument
Source:2010SurveyofConsumerPaymentChoice,Table20.
Note:Percentagesdonotsumto100duetorounding.
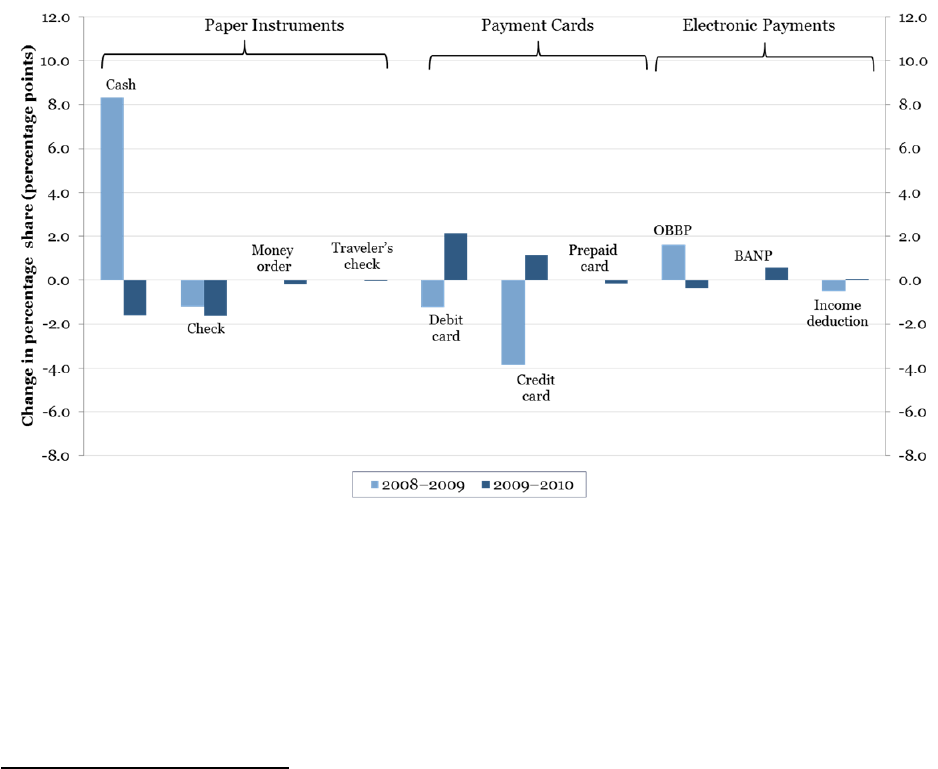
22
In 2010, consumers’ use of payment instruments shifted moderately from paper to cards, as
shownbythedarkbluebarsinFigure5.
22
Thesharesofconsumerpaymentsmadeusingdebit
cardsandcreditcardsincreased2.1and1.2percentagepoints,respectively.The2010increasein
thesharesofdebitandcreditcardpaymentspartiallyoffsetlargerdeclinesinthesharesofthese
same instruments as occurred in 2009 (the light blue bars)—most
notably the 3.9 percentage
pointdropincreditcarduse.
Figure5:Changeinconsumerpaymentsbyinstrumenttype
Source:2010SurveyofConsumerPaymentChoice,Table20.
Note:Missingbarsindicatedataforindicatedyearsarenotcomparable.
Incontrast,thesharesofconsumerpaymentsmadeusingeithercashorcheckin2010declined
1.6 and 1.7 percentage points, respectively. The 2010 decline in cash share was modest
22
Thestatisticalhypothesisofnochangeinthemixofpaymentinstrumentusebyconsumersin2010canberejected
atthe95percentsignificancelevel.

23
compared with the 8.4 percentage point increase in cash share in 2009, so the share of cash
paymentsbyconsumersremainedhigherthaninthemiddleoftherecession.The2010decrease
inchecksharewasconsistentwithalonger‐termtrenddeclineinconsumercheckuse.
23
Simulation results indicate that the shares of consumer use of all other payment instruments
had very low probabilities of having changed statistically significantly since 2009. Thus, the
shareofOBBPpayments,whichrose1.6percentagepoints in2009,waslikelytohaveremained
higher in 2010 than in 2009. Although
the share of BANP is estimated to have been lower in
2009than2008,thatchangemaynotbeanaccurateestimateofactualconsumerBANPbecause
ofalterationstothe2009surveyquestionnaire.Furthermore,asshowninSectionIV,therewere
much larger changes in the rate of adoption of
BANP.Section IV also provides additional
discussion about consumer electronic payments that provide context and perspective for the
SCPCresults.
IV. ConsumerAdoptionofPaymentInstruments
This section reports 2010 estimates of consumer adoption of payment instruments measured
three ways: 1) adoption rates of individual payment instruments; 2) number of payment
instruments adopted by consumers; and (3) portfolios of payment instruments adopted by
consumers.
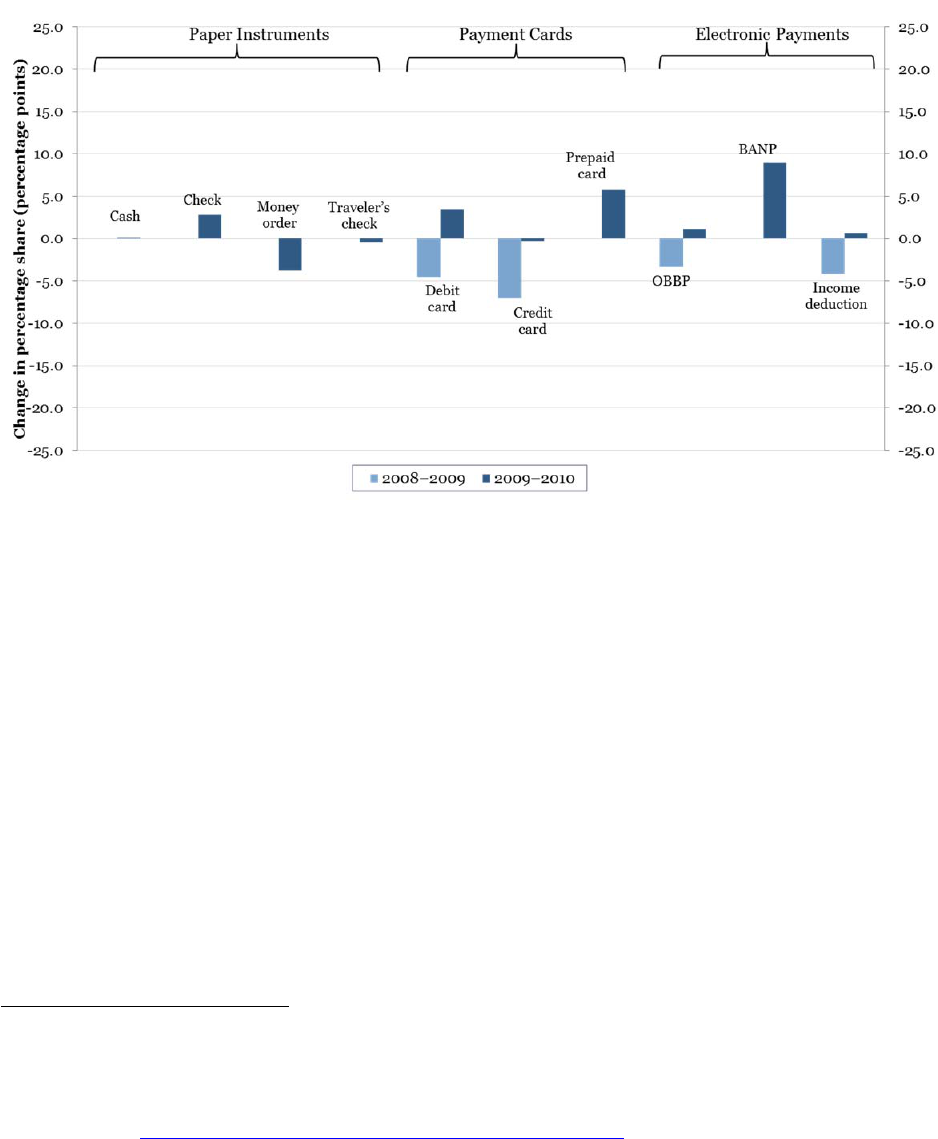
IndividualInstruments
In2010,consumeradoptionofdebitcards,prepaidcards,andBANP
increased,asshownin
23
Intermsof growth rates, rather than changesinshares,the number of checkswrittenbyconsumers declined 8.5
percentperyearfrom2006to 2009, accordingto the Federal ReservePaymentStudies (see Federal ReserveSystem
2011),anddeclined 6.1percentfrom 2009 to2010, accordingtothe SCPC.
Through2009,theFRPS did notprovide
estimatesofconsumeruseofotherpaymentinstrumentssoitisnotpossibletocalculateshares,andtheirchanges,to
comparewiththeSCPC.

24
Figure6.
24
The biggest of these changesoccurred intheshareof consumershavingBANP,up
8.9 percentage points. The 2009 share of consumers having BANP is estimated to have been
muchlowerthanin2008,butthisdeclinemaynotrepresentactualconsumeradoptionofBANP
becauseofimprovementstothe
2009questionnaire.Amuchsmaller2010increaseinadoption
ofOBBPwasnotstatisticallysignificant.
More consumers held payment cards in 2010 than in 2009. The shares of consumers adopting
prepaidanddebitcardsincreased5.7and3.4percentagepoints,respectively,overtheprevious
year. Although smaller than the previous year,
the 2010 increase in prepaid card adoption
indicatedgrowingdisseminationofthesecardsamongconsumers.Incontrast,the2010increase
in adoption of debit cards reversed most of its decline in 2009. Credit card adoption was
essentiallyunchangeddespitetheincreaseinusedescribedearlier.
Moderately higher adoption of checks
and lower adoption of money orders in 2010 partially
offset opposite movements in 2009 in the shares of consumers adopting each of these paper
instruments.
24
The statistical hypothesis of no change in the adoption of payment instruments by consumers in 2010 can be
rejectedatthe95percentsignificancelevel.
25
Figure6:Changesinconsumeradoptionofpaymentinstruments
Source:2010SurveyofConsumerPaymentChoice,Table4.
Note:Missingbarsindicatedataforindicatedyearsarenotcomparable.
Figure7putstherecentchangesinconsumerholdingofpaymentinstrumentsintoperspective
byplottingadoptionratesovertime .
25
Asof2010,about two‐th irdsor moreofconsumers had
adopted the five most popular payment instruments: cash (100 percent), blank checks (87.0
percent),debitcards(78.4percent),creditcards(70.3percent),andBANP(64.8percent).About
halfofconsumershadadoptedOBBP(48.7percent),andwellmore than
one‐thirdhadadopted
prepaidcards(38.2percent).Morethanoneinfiveconsumershadadoptedmoneyorders(23.6
percent),andfewhadadoptedtraveler’schecks(6.2percent).
25
Figure 7 combines SCPC data on consumer adoption of payment instruments with similar data for households
fromtheSurveyof Consumer Finances (SCF), where available and comparable, toprovideaperspectiveon longer
termtrends.Seehttp://www.federalreserve.gov/econresdata/scf/scfindex.htmformoredetails.Exceptforcreditcard
spending,theSCFdoesnotcontaindataontheuseofpaymentinstrumentscomparabletodatafromtheSCPC.
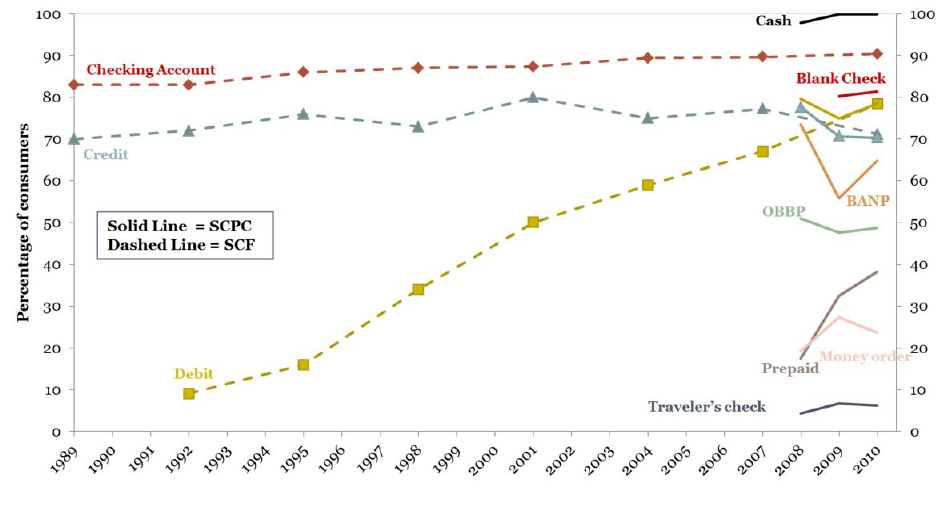
26
Figure7:Consumeradoptionofpaymentinstruments
Source:2010SurveyofConsumerPaymentChoice,Table4;1983–2007SurveyofConsumerFinances.
Most shares of consumer adoption of payment instruments generally appear to be stabilizing
duringrecentyears.Thesharesofconsumersholdingcash,checks,andcreditcardshave been
relativelyhighandsteadyformanyyears.Afteralongtrendincrease,theshareof consumers
with debit cards appears to be
leveling off near 75–80 percent. The share of consumers with
OBBPhasfluctuatedlittleinthefewyearsforwhichdataareavailable.
In contrast, consumer adoption of prepaid cards shows evidence of a trend increase in recent
years as the share of consumersholding prepaid cards more than doubled from
2008to 2010.
The increase from 2008 to 2009 may have been partly due to improvements to the2009 SCPC
questionnaire. However, other data sources also show an increase in prepaid card adoption
duringthepastdecade(forexample,Pew2012).Furthermore,thetimeseriespatternofprepaid
cardadoption
isbroadlysimilartotheearly stagesofdebitcardadoption,bothmeasuresbeing
roughlyconsistentwiththeflatS‐curvepatternthattypifiesdiffusionofnewtechnologies.

27
Trendsinconsumerelectronicpaymentsaremoredifficulttodiscernbecausedata availability
is limited (three years) and, in the case of BANP, the year‐to‐year fluctuations are large.It is
possiblethat the sharpdecline in BANPin 2009 was partly due toimprovementsin the SCPC
questionnaire.Adoption
ofOBBP,whichdidnotchangedefinitionandhassimilaritiestoBANP
asanelectronicpayment,wasrelativelystableduringthesametime.ThelargeswingsinBANP
adoptionare difficulttoreconcilewiththerelativelymodestchangesinpaymentuseofBANP
described in the previous section. Furthermore, actual
transactions data from NACHA (The
ElectronicPaymentsAssociation)showalongerruntrendincreaseintotalconsumerelectronic
payments.
26
However, the OBBP and BANP definitions in the SCPC pertain only to certain
subcategoriesoftheNACHAconsumerelectronicpaymentsdata,anditisdifficulttomatchthe
twodatasourcesexactly,asdiscussedinSectionVIII.Inanycase,itnotpossibletodetermine
BANPtrendsdefinitivelyatthis
time.
PortfoliosofInstruments
In2010,thenumberofpaymentinstrumentsheldbyconsumerswasessentiallyunchanged,as
shownin
Figure 8. On average, consumers held 5.2 instruments out of the nine common instruments
trackedbytheSCPC,upslightlyfrom2009(5.0)butnotmuchdifferentfromtheirholdings
in
2008(5.1).Fromasmallergroupoffourpaymentinstruments,includingonlyasubsetofBANP
(automatic ACH bill payments), consumers held 3.0 of them on average. This number is
approximately twice as many as in 1989, reflecting a trend increase in consumer holdings of
26
We thank NACHA CEO Janet Estep for bringing this issue to our attention. From 2008 to 2011, the NACHA
estimateoftotalconsumerelectronicpaymentsclosesttotheSCPCmeasuregrew5.4percentperyear inpercapita
terms.

28
paymentinstruments.However,averageholdingsinboththefour‐instrumentsetandthenine‐
instrumentsetappeartohavebeengrowingmoreslowlyinrecentyears.
Figure8:Averagenumberofpaymentinstrumentsadoptedbyconsumers
Source:2008–2010SurveyofConsumerPaymentChoice,authors’calculation;1983–2007SurveyofConsumer
Finances.
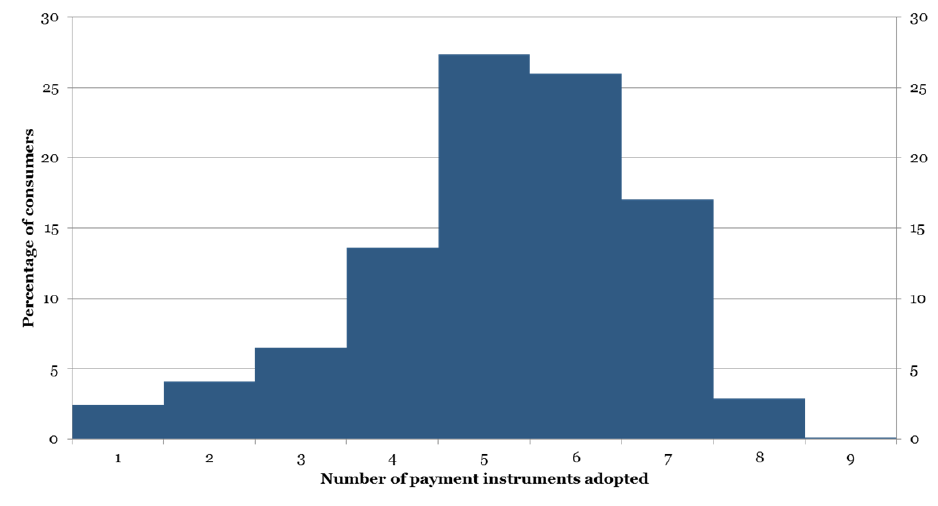
Another way to view consumer adoption of payment instruments is to look at individual
portfoliosof instruments held by consumers,as shown in Figure9. In 2 010, the mostcommon
number of instruments held by individual consumers was five (held by 27.4 percent of
consumers).Butalmostasmanyconsumers
(26.0percent)hadsixinstruments,andanother30.6
percentof consumershad fourorseveninstruments. Only about one ineight consumers (13.1
percent)heldfewerthanfourormorethansevenpaymentinstruments.
29
Figure9:Numberofpaymentinstrumentsadoptedbyindividualconsumers
Source:2010SurveyofConsumerPaymentChoice,authors’calculations.
An even deeper look at individual portfolios of payment instrument reveals considerable
variety, as Table 2 shows. The most common portfolio of six instruments (two from each
categoryofpaper,cards,andelectronic:cashandcheck,debitandcreditcards,andOBBPand
BANP) was held by only 11.8 percent
of all consumers and the top five portfolios account for
only about one out of three consumers. These results demonstrate there is not one clear
representative consumer with reg ard to pay ment instrument holdings and highlight the
challenge of explaining the wide array of consumer payment choices. In fact, consumers held
135
uniqueportfolios(differentcombinationsofinstruments)in2010.

30
Number
of PI
Cash Check Traveler’s
Check
Money
Order
Credit
Card
Debit
Card
Prepaid
Card
OBBP BANP Percentage
of
Consumers
6 X X X X X X 11.9
7 X X X X X X X 9.1
5 X X X X X 7.2
5 X X X X X 3.9
5 X X X X X 3.8
Table2:Top5paymentinstrumentportfoliosadoptedbyindividualconsumers
Source:2010SurveyofConsumerPaymentChoice,authors’calculations.
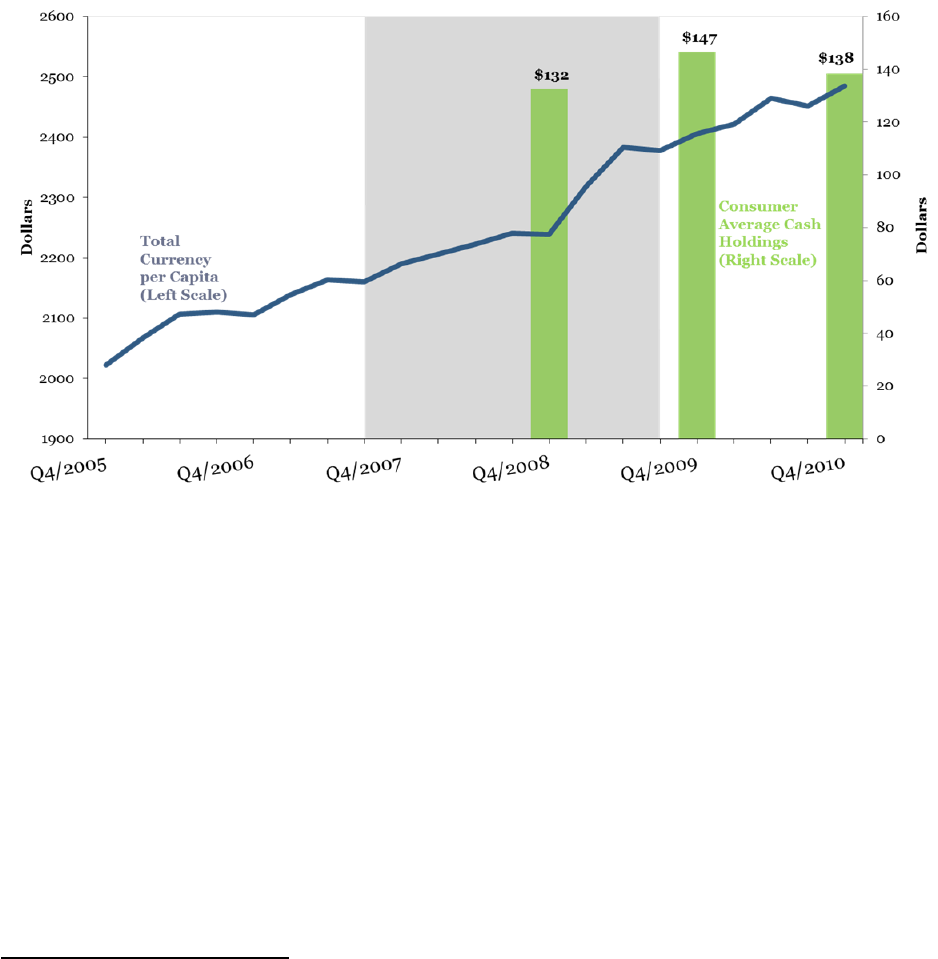
CashManagement
Total per‐capita domestic U.S. currency in circulation grew 3.3 percent in 2010 (Q4/Q4), after
growing7.5percentin2009,asshowninFigure10.Thisestimatereflectstotalcashholdingsby
all domestic U.S. agents (households, firms, nonprofit, and government) as well as balances
heldinbankvaults.
27
Forconsumersonly,theaverageamountofcurrencyheld declinedto$138
in the fourth quarter of 2010 from $147 four quarters prior; these amounts exclude unusual ly
large‐value cash holdings.
28
The 2010 decline in consumer cash holdings is relatively modest
and only marginally statistically significant. Note that dollar figures in this section are not
adjusted for inflation during the three‐year period from 2008 to 2010. During this time, the
annualpercentagechange(Q4/Q4)intheconsumerpriceindexwas
about1‐1/2percent.
27
TheestimateofdomesticcurrencyincirculationfollowsthemethodologydevelopedbytheBoardofGovernorsof
theFederalReserveSystemusingFlowofFundsdata(FederalReserveBoard2013c).ItexcludesU.S.currencyheld
inforeigncountries.
28
Average cash holding by consumers in Figure 10 excludes large‐value holdings of currency (that is, holdings
greaterthanthe95
th
percentile,whichisapproximately$1,200).ThisexclusionismotivatedbythefactthattheSCPC
obtains only a very small number of observations of very large cash holdings each year; hence fluctuations in the
compositionoflarge‐value cash holdings exertstatisticallyexcessive influenceonestimates of the average value of
totalcashholdings.SeeSection5.2,“CashValues,”inthetechnicalappendixformoreinformation.
31
Figure10:U.S.domesticcurrencyincirculation
Source:2010SurveyofConsumerPaymentChoice,Table9;HaverAnalytics.
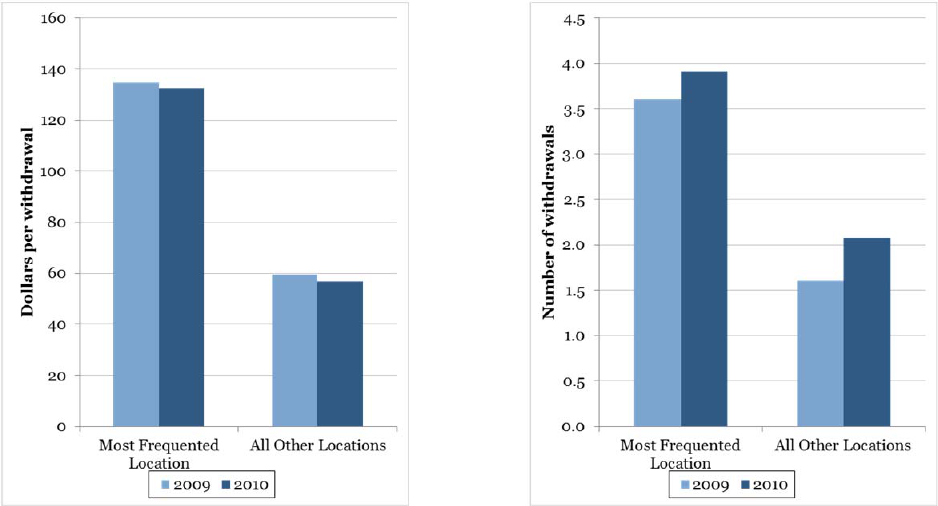
Given that consumer cash payments (Figure 4) and cash holdings (Figure 10) did not change
muchin2010,itisnotsurprisingthatcashwithdrawalswerelittlechangedaswell.Consumers
withdrew$502permonthonaveragein2010,upfrom$488permonthin2009,notastatistically
significant
change.Figure11showscashwithdrawalsbytheamountofwithdrawalmademost
oftenandthetypicalnumberofwithdrawalspermonth.
29
Theamountperwithdrawalandthe
numberof withdrawals aremeasuredat two sources:1)thelocation wheretheconsumergets
cashmostoften,and2)allotherlocationscombined.In2010,thetypicalamountofwithdrawal
29
Thenumberofwithdrawalsinatypicalperiodfollows themethodologyforthenumberofpayments.Theamount
of withdrawal made most often by a consumer may not be the same as the average amount of withdrawal by the
consumer.Statistically,“mostoften”correspondstothemodeofadistribution
ratherthanthemean.TheSCPCasks
for the most common amount to enhance consumer recall. If the mode and mean are not equal, this survey
methodologychoiceproducesbiasintheSCPCestimateoftotalwithdrawalamountinamonth.Thedirectionofbias
dependsonwhetherthemeanis
largerorsmallerthanthemode.
32
at the most frequented location was $133 and the amount at all other locations was $57.
Although both amounts were down slightly from 2009, neither decrease was statistically
significant. Also in 2010, the number of withdrawals per month was 3.9 at the most frequent
location and 2.1 at all other locations.
Both estimates of the number of withdrawals increased
significantlyfromtheir2009levels(whichwere3.6and1.6permonth,respectively).
Figure11:Amountofcashperwithdrawalandnumberofcashwithdrawalspermonth
Source:2010SurveyofConsumerPaymentChoice,Table9.
Note:Theleftpanelshowstheamountofcashperwithdrawalatthemostfrequentlocationcomparedtoallothers.
Therightpanelshowsthenumberofcashwithdrawalspermonthperconsumer.
33
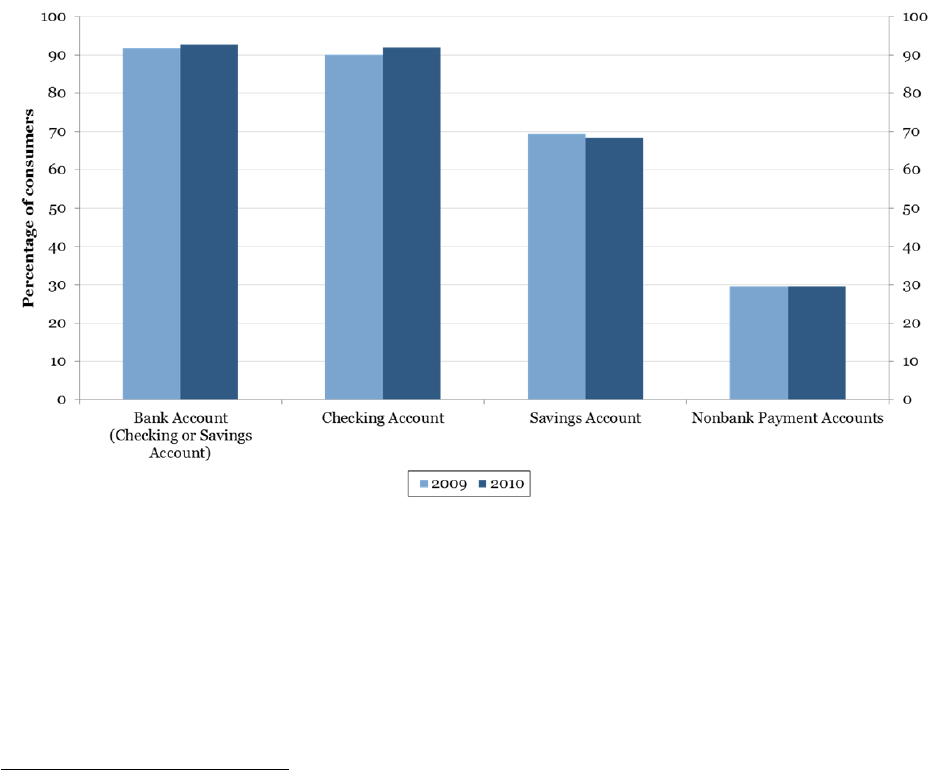
V. BankandOtherPaymentAccounts
Consumerownershipofbankandotherpaymentaccountswasessentiallyunchangedin
2010,as shown inFigure12.
30
In 2010,thepercentage of consumers with a checking orsaving
account at a bank was 92.7 percent, up just 0.9 percentage point from 2009. Consumer
ownership of checking accounts was 91.9, an increase of 1.8 percentage points, and consumer
ownershipofsavingaccountswas72.7percent,down1.6percentage
points.
Figure12:Consumerownershipofbankandotherpaymentaccounts
Source:2010SurveyofConsumerPaymentChoice,Table1.
Some consumers own nonbank deposit accounts to make payments, including those
held with PayPal, Google Wallet, Facebook, or other companies that are not depository
institutions.In2010,the shareofconsumers whoownednonbankpaymentaccountswas29.7,
essentially unchanged from 2009 (29.6). Due toresource limitations, theSCPC does not
collect
30
Noneofthechangesdiscussedinthissectionwerestatisticallysignificantatthe95percentsignificancelevel.

34
any other information about the nature or use of nonbank payment accounts other than
consumer adoption of the accounts, so it does not provide an estimate of the number of
paymentsbyinstrumentandaccount.
31
TheSCPCdoesnotcollectdataonthedollarvalueofdepositsheldinbankaccountsor
nonbankpaymentaccounts.Originally,thefocusoftheSCPCwasonmeasuringconsumeruse
of payment instruments, and checking account balances are not payment instruments per se.
However,checkingaccountbalancesaremoney
(anasset),likecash,andthedollaramountina
consumer’s checking account probably is correlated with a consumer’s cash management.
Therefore, it might be useful to collect data on checking account dollar amounts in future
versionsoftheSCPC.
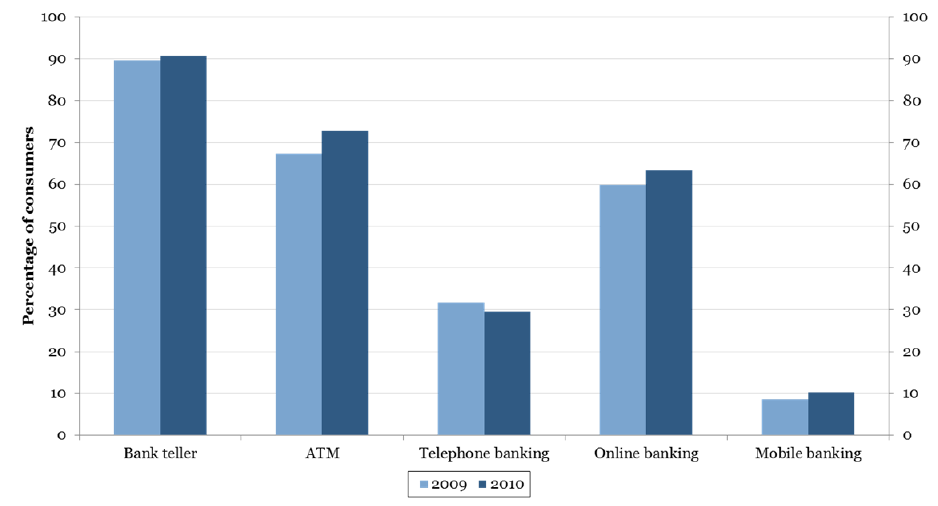
Moreconsumersaccessedtheirbankaccountsin2010thanin2009,
asshown in Figure
13. The share of consumers accessing their bank account through one of five methods (other
than a payment instrument) increased to 90.7 percent in 2010, up 1.0 percentage point from
2009.
32
Given that 92.7 percent of consumers have a bank account, the percentage of bank
accountadopterswhoaccessedtheiraccountduringthepastyearis97.8percent (90.7 percent
dividedby92.7percent).Comparedwith2009,moreconsumersaccessedtheirbankaccountsin
2010through ATMs (up 5.5 percentage points)
andonline banking (up 3.5 percentagepoints).
Changes in other methods of accessing bank and payment accounts were not statistically
significant,includingthe1.6percentagepointincreaseinmobilebanking.
31
Because the SCPC counts the number of payments initiated by consumers, it focuses on payment instruments
ratherthanon theaccounts,networks,platforms,orrelatedtechnologies throughwhichthesepaymentsoccur.For
example,thenumberofcreditcardpaymentsmadebyconsumersinatypicalmonth(13.3in2010)may
includesome
creditcardpaymentsmadeviaPayPal.Asimilarissuearisesformobilepaymentsdescribedinthenextsection.
32
Thestatisticalhypothesis of no changeinthe access of bank andpayment accountsbyconsumers in2010canbe
rejectedatthe95percentsignificancelevel.
35
Figure13:Consumeraccessofbankaccounts
Source:2010SurveyofConsumerPaymentChoice,Table13.
VI. SelectedTopics
This section briefly describes selected 2010 SCPC results pertaining to payment
instruments and practices that are changing rapidly, gaining notoriety, or in early stages of
diffusionandadoption.
PrepaidCards
Althoughprepaidcardshaveexistedfordecades,consumerprepaidactivityappearsto
have expanded notably in 2008‐2010. As indicated earlier
in Figure 7, the share of consumers
holdingprepaidcardsisestimatedintheSCPCtohavereached38.2percentbytheendof2010.

36
Other sources also indicate an increase in prepaid card activity (Hewitt 2013).
33
In addition,
governments are using prepaid cards to distribute benefits, and employers are using prepaid
cardsforpayroll.
34
A deeper look at the SCPC data reveals a more nuanced view of developments in
consumerprepaidcard activitythrough2010.Table3 shows evidence suggesting that prepaid
card activity likely grew primarily on the extensive margin of use rather than the intensive
margin. Although a larger share of consumers
held prepaid cards in 2010 than in 2009, the
numberofprepaidcardsheldperadopterdeclinedto1.7in2010from2.4in2009,andtheshare
of prepaid card adopters using a prepaid card during the year fell more than 10 percentage
points to 32.1 percent in 2010.
35
Among prepaid card holders, the number of prepaid card
payments per consumer was 1.6 in 2010 but the change from 2009 was not significant. Taken
together, these results suggest that newer prepaid card holders tend to be less intensive users
thanconsumerswhoalreadyhadprepaidcards.
33
The Federal Reserve Payment Study reports that total payments made using prepaid cards (by all consumers,
businesses, and governments) increased 21.5 percent per year from 2006 to 2009 (Federal Reserve System 2011).
MercatorAdvisoryGroupestimatesthatthenumberofprepaidcardsincreasedfrom15millionin2007to52million
in2011,a24percentannualrateofgrowth(Hewitt2013).
34
Formoredetailsaboutprepaidcards,seeRhine,Jacob,Osaki,andTescher(2007)andWilshusen,Hunt,vanOpstel,
andSchneider(2012).
35
The hypothesis of no change in the number of prepaid cards per adopter can be rejected at the 99 percent
significancelevel.Thehypothesisofnochangeintheshareofprepaidcardadoptersusingaprepaidcardduringthe
yearcanberejectedatthe90percentsignificancelevel.

37
2009 2010
Number of prepaid cards per adopter 2.4 1.7
Number of prepaid card payments in a typical month per
adopter
2.1 1.6
Percentage of adopters using prepaid card in a given year 42.7 32.1
Percentage of prepaid card adopters who reloaded in the past
12 months
46.5 44.1
Number of reloads per month, reloaders only 1.7 2.0
Amount per prepaid reloading, reloaders only $146 $79
Table3:Consumerprepaidcardactivity
Source:2010SurveyofConsumerPaymentChoice,Tables7,9,14,20.
Forsomeprepaidcards,consumerscan“reload”thecards,meaningtheycanaddvalue
to the card using cash or another source of money or credit. The dollar amount loaded on
prepaid cards fell almost by half to $79 per reloading in 2010, and the share of consumers
reloadingtheir
cardsfellto44.1percent.
36
Thenumberofprepaidcardreloadingsperadopter
was 2.0 per month in 2010, but the change from 2009 was not significant. These reloading
resultsalsosuggestlessintensiveuseofprepaidcardsbyconsumersin2010.
MobileBankingandMobilePayments
Mobilebankingandmobilepaymentsarenewertechnologiesthathavebeenreceivinga
lotofattentionrecently.Although thesetechnologiesareincreasinglyfamiliartoconsumers,it
isimportant to define themcarefullyfor measurement in surveysanddata analysis.Thus, the
SCPCdefinitionsmaydifferfromthoseusedintheindustry,
media,orelsewhere.
36
Thehypothesisofnochangeinthesetwomeasurescanberejectedatthe90percentlevelofsignificance.Rhineet
al. (2007) found a higher reload average ($180) in data on general purposeprepaid cardfromcard processors. The
discrepancywiththeSCPCmaybeattributabletothefact
thattheSCPCincludesallprepaidcardsifgeneralpurpose
cardshavehigheraverageloads,orifconsumersonlyreporttheirownprepaidcardloadingifotherparties(suchas
governments,employers,etc.)tendtoloadhighervaluesthanconsumersdo.

38
IntheSCPC,mobilebankingisdefinedasthepracticeofaccessingabankaccountusinga
mobilephone.Asof2010,mobilebankingaccesscouldoccurinatleastoneofthreewaysona
mobile phone: 1) accessing a bank web site using a web browser; 2) using a
mobile banking
application (“app”) downloaded onto the phone; and 3) sending or receiving a text message.
Oncethebankaccountisaccessedviamobilephone,theconsumercancheckbalances,transfer
money,makepayments,andconductotherbankingbusiness.
IntheSCPC,a mobilepaymentisdefinedasthepractice
ofpayingforgoodsandservices
usinga mobile phone.Unlike mobilebanking,which usually istiedtoa specific bank, mobile
paymentscanoccurinavarietyofwaysusingdifferentpaymentinstrumentsandthereforethe
concept is more difficult to define. As of 2010, the SCPC measured only two
types of mobile
payments.
37
One is a contactless mobile payment, which make use of an NFC (near field
communication) device or QR (quick response) code that can communicate with a reader at a
pointofsale(POS).
38
Thisdefinitionisconsistentwithterminologyusedinthemobilepayments
industry.
However, the SCPC focuses on measuring all consumerpayments, andconsumers can
makemanyothertypesofpayments using amobile phone. Therefore, the SCPCalsoincludes
text/SMS mobile payment, such as messages sent to buy something or
to make a charitable
donation. For many of these types of payments, consumers authorize their cellular carrier to
make a payment to a third party, which the consumer repays later upon receipt of the cell
37
In2011and2012theSCPCincludedadditionaltypesofmobilepayments.
38
SeeCrowe,Rysman,andStavins (2010) for an analysis ofmobilepayments that focuses on contactlesspayments
usingNFCtechnology.MobilepaymentsbybarcodeorQRcodecanbemadeusingLevelUp,forexample,andare
addressedspecificallyinthe2011SCPCandbeyond.

39
phonebill.Inthiscase,theconsumerisauthorizingacreditpaymentinafashionsimilartothe
wayheorshewoulduseachargecardthatrequiresfullpaymentbytheendofthemonth.
39
In general, mobile payments are not different from all other payments tracked in the
SCPC; all of these payments are based on consumer initiation and authorization using a
payment instrument. Essentially all payments made by consumers on a mobile phone use a
standard payment instrument (except the text/SMS mobile payments,
of course). Thus,
consumer payments made using a mobile phone work quite similarly to the way consumer
payments made on a laptop computeror a ta blet device work; these are all “mobile” and use
eitherwirelessorcellulartechnologytotransmitpayments.Forexample,aconsumercoulduse
a credit card
to make a mobile payment by 1) using a contactless device in the phone at the
checkout counter; 2) entering the credit card number using a mobile browser at a store’s web
site;or3)enteringacreditcard number into a merchant’s app. Consequently,theSCPCtreats
mobile phones
as another device through which consumers make payments with instruments
as opposed to viewing mobile payments as being different from other consumer payments
(again,withtheexceptionoftext/SMSpayments).
Finally, beca usethe SCPC focuses on counting thenumber ofconsumer payments, the
definitions of mobile banking and mobile payments inherently
overlap. For example,
consumerswhoaccesstheironlinebankingwebsiteusing awebbrowserorapp (amethodof
mobile banking) and then pay a bill with OBBP (a type of mobile payment) have performed
39
For this reason, it might be reasonable to define mobile payments made by text/SMS sent to a cellularcarrier or
another nonbank as an official payment instrument that is analogous to, but different from, a credit/charge card
issuedbyabank.ThisclassificationisunderconsiderationbytheCPRC,but
thetechnologyandpracticeofmobile
payments are diverse, complex, and changing rapidly. For example, some large brick‐and‐mortar merchants have
mobile apps thatdonotuseNFC, bar codes,or QR codes but also do not usenonbanksor carrier billing. One gas
station chain uses text messages to
pay at the pump and ACH for settlement of payment, and a QSR chain uses a
prepaid‐based mobile app based on a six‐digit number that cashiers use to deduct money from the consumer’s
prepaidmobileapp.
40
bothmobileactivitiessimultaneouslyfromtheperspectiveoftheSCPC.Thisconcerndoesnot
ariseinthe2010SCPCbutdoesinlateryears.
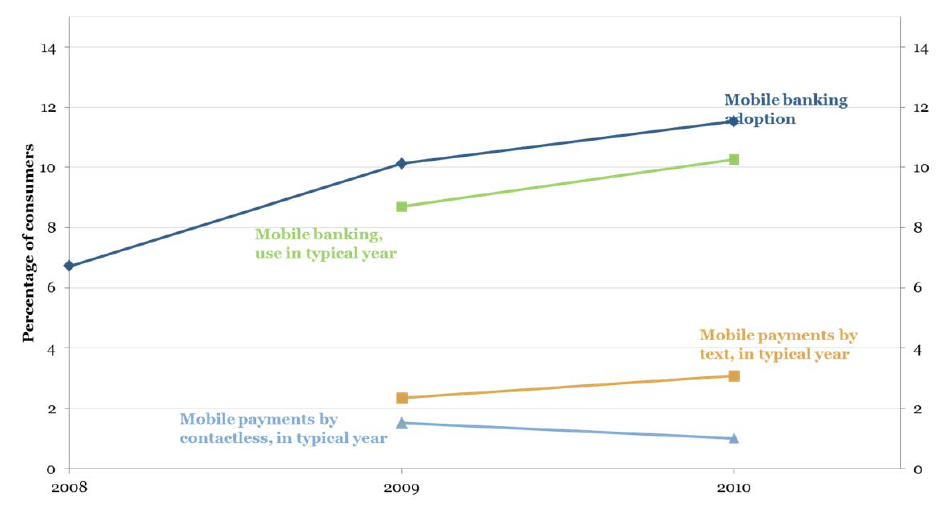
As of the fourth quarter of 2010, mobile banking and mobile payments were still
relativelyuncommonamongconsumers,asFigure14shows.In2010,92.2 percentof
consumers
hadamobilephonebutonly11.5percentof consumers had adoptedmobile banking and10.3
percent of consumers had used mobile banking in the pre vious 12 months. That is, about 90
percent(10.3percentdividedby11.5percent)ofmobilebankingadoptersusedtheservice.The
percentageof
consumerswhomadeatext/SMSmobilepaymentwas3.1percentin2010,butthe
percentageofconsumerswhomadeacontactless mobilepaymentin2010was1.0percent.The
smallchangesinbothoftheseestimatesfrom2009are notstatisticallysignificant.
Figure14:Mobilebankingandpayments
Source:2010SurveyofConsumerPaymentChoice,Tables1and13.
TherelativelylownumbersinFigure14areconsistentwiththeearlystagesofdiffusion
ofnewtechnologyandhaveincreasedsubstantiallyinsubsequentyears.Accordingtoamobile
payment survey in November 2012, the Federal Reserve Board (2013b) estimates that 48.9

41
percentofconsumershadadoptedmobilebankingbydownloadinganappand27.7percentof
consumers had used mobile banking. Both numbers represent large increases over the 2010
SCPCestimates,suggestingthatthesetechnologiesmayhaveenteredtherapidgrowthstageof
adoptionandusesince2010.
40
Diversity and rapid change in technology make it challenging to measure mobile
banking and mobile payments accurately and consistently in surveys over time. Because the
optionsforbothactivitiesarebecomingmorecomplexastechnologicalinnovationsexpand,the
SCPCmustaddmoredetailandcomplexitytocontinueobtainingunbiasedestimates.
Aspecial
measurement problem for surveys like the SCPC is that new technologies are unfamiliar to
consumersandchangerapidly,soitisdifficulttoaskquestionsthatwillbeunderstoodbyall
surveyrespondents.Also,intheearlystagesoftechnologicaldiffusion thesupplyoftechnology
tendstoleaddemand
for(adoptionof)technology.Becausesometechnologiesstarttodevelop
andthenfizzleoutduetoweakdemandorotherchallenges,itisriskytoinvestlimitedsurvey
resources in questions about them. By early 2013, the Federal Reserve Board’s estimates of
mobile banking and mobile payments suggest that these
technologies may have long‐run
stayingpower,sothedecisiontoincludethemintheSCPCstartingin2008seemstohavebeen
warranted.
VII. NewQuestionsin2010
Section 1075 of the Dodd‐Frank Wall Street Reform and Consumer Protection Act of
2010,“ReasonableFeesandRulesforPaymentCardTransactions,”containsamendmentstothe
40
The“ConsumersandMobileFinancialServices”(CMFS)surveywasconductedbytheDivisionofConsumerand
CommunityAffairs(DCCA) oftheBoardof Governorsof the FederalReserveinDecember2011/January2012 and
again in November 2012. The CMFS survey uses some of the same questions about mobile banking and mobile
paymentsasthe2011and2012SCPC,aswellasmanymore‐detailedquestionsonthesetechnologies.

42
ElectronicFundsActthataffectedpaymentmarketsinimportantways.
41
Thissectionofthelaw
eventually became Regulation II, written by the Board of Governors of the Federal Reserve,
approved in July 2011, and implemented on October 1, 2011. Most of the debate over Reg II
focusedontwochanges:1)cappingthedebitcardinterchangefeechargedbybanks
atalevel
belowtheprevailingmarketrateatthattime;and2)requiringdebitcardissuerstoofferatleast
twonetworksforthemerchanttoroutedebitcardpayments.
42
AstheDodd‐FrankActwasunfolding,newquestionswereaddedtothe2010 SCPCthat
may eventually help researchers and policy makers better understand the potential impact of
thenewregulationonconsumers.Thisendeavorisnoteasybecausemanydetailsofpayment
card systems are not well known
or understood by most consumers. For example, only 59
percentofconsumerswereevenawarethatpaymentcards involvedfeeschargedtomerchants
when a consumer paid with a card, and few would have known the ma gnitude of the fee on
theirparticularcardwhenevenmerchantswhoreceivedthecard
generallydidnotfullyknow
atthemomentofpayment.
43
Furthermore,theconceptofroutinga debitcardpaymentalonga
complex pa yment card network that involves merchants, processors, and banks is even more
arcaneandunfamiliartoconsumers.
Nevertheless, Reg II has the potential to affect consumers who choose debit card
payments,at leastindirectly, evenif they are
unawareof the connection. The mostlikely way
consumers could be affected indirectly is by the method they use to authorize debit card
payments—thatis,byusing a personalidentificationnumber(PIN) or a methodthatdoes not
requireaPIN.BecauseinterchangefeespriortoRegIIwerelowerfor
PINdebitcardpayments,
41
Originally,thissectionwascalledthe“DurbinAmendment”becauseitwasintroducedbySenatorRichardDurbin
(D‐Illinois) shortly before the Dodd‐Frank Act was approved. The entire law can be found online at
http://www.gpo.gov/fdsys/pkg/PLAW‐111publ203/html/PLAW‐111publ203.htm.
42
For information and evidence on the Reg II debit interchange fees, see Federal Reserve Board (2011, 2012b, and
2013a).Forresearchabouttheimpactoftheregulation,seeShy(2012,2013),Wang(2013),andHayashi(2013).
43
Formoreinformationaboutthisissue,seeSchuh,Shy,Stavins,andTriest(2011).

43
thepolicymayhavedifferentimplicationsforeachofthedebitcardauthorizationprocedures.
Thus,researchersmaybenefit fromknowinghowconsumersviewauthorizationmethodsand
locationsofdebitcardpayments.
A finer dis t inction, even more subtle to consumers, pertains to the security risks
associatedwithPINversusno‐PINauthorization.
RegIIallowsa1‐cent‐per‐transactionincrease
in debit interchange fees if the card‐issuing bank adheres to strong security standards. PIN
authorizations generally are considered more secure fo r the debit card payment system as a
whole.
44
Most of this information and perspective comes from the payment industry. Less is
known about the issue of payment security from the perspective of consumers and their
experiencewithloss,theft,andfraudassociatedwithpaymentinstruments.Therefore,the2010
SCPC includes new questions aboutconsumer experienceswith payment security
for selected
instruments.
The remainder of this section reports results of new questions about consumer
experiences with debit and other payment methods that may be related to policy‐induced
changes in thedebit card market. Before proceeding, however, it is important to reiterate that
the results do not provide a direct
assessment of the policy implications. The choice of consumer
authorizationofdebit cardpaymentsisnotalwaysleftentirelytothediscretionof consumers,
because merchants make decisions that affect the choice, such as whether to provide PIN
terminals (or not) at the point of sale. Furthermore, the Dodd‐Frank
Act and two subsequent
legal settlements have made it possible for merchants to steer consumers toward low‐cost
paymentmethodsusingdiscountingand,forthemoment,surcharging.
45
Itdoesnotappearthat
44
AccordingtoSullivan(2010),“Fraudratesondifferentpaymentcardsareunequal.UseofaPINcodetoidentifya
cardholderismoresecurethanusingasignature.CountriesthatrelymoreheavilyonPINcodesforcardpayments
willhavelesspaymentfraud.InAustralia,forexample,approximately90
percentofdebittransactionsin2006used
PINcodes,comparedtoonlyabout40percentintheUnitedStates.”
45
In2011,theDepartmentofJusticereachedasettlementwithVisaandMasterCardoverdiscountinganddisclosure
ofmerchantdiscount fees(http://www.justice.gov/atr/cases/f273100/273170.htm).In2012, merchants (plaintiffs)and

44
thesepracticeshavebecomewidespreadyet,butmeasuringthisactivityisdifficult(seeShyand
Stavins 2013). Any effort to identify the effects of debit‐card related policies on consumers
wouldrequirefurtherresearch.
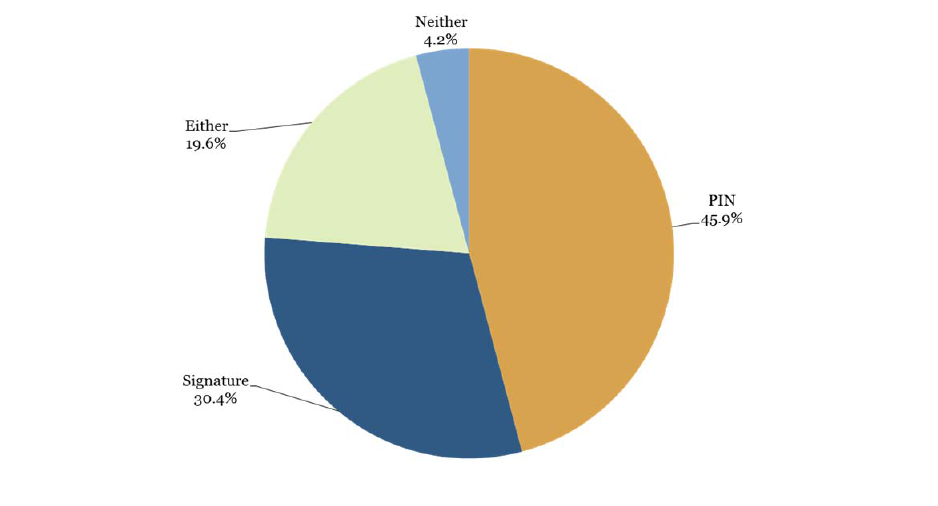
DebitCardAuthorization
Asofthefourthquarterof2010,consumerspreferredPINdebitcardpayments.Figure
15showsconsumers’firstchoicefromamongfourmethodstoauthorizedebitcard payments:
1) entering a personal identification number (PIN); 2) signing the card ‐holder’s name
(signature); 3) indifference between PIN and signature (either); and 4) neither entering a PIN
nor signing.
46
Almost half of consumers (46 percent) preferred PIN debit authorization and
nearlyone‐third(30percent)preferredsignaturedebitauthorization.Oneinfiveconsumers(20
percent)wasindifferentbetweenenteringaPINandprovidingasignature.
Visa, MasterCard, and banks (defendants) reached a tentative settlement over interchange fees (see In re Payment
Card Interchange Fee and Merchant Discount Antitrust Litigation, No. 05‐MD‐1720, E.D. N.Y. for all documents),
whichhasnotreceivedfinalapprovaloftheU.S.DistrictCourtyetbutwouldallowsurchargingofcardpaymentsin
themeantime.Foradetailedanalysisoftheformersettlement,seeSchuh,Shy,Stavins,andTriest(2011).
46
Signatureauthorizationissometimescalled“credit”butisactuallystilladebitcardpaymentthatusesacreditcard
network such as Visa or MasterCard.The fourth category, neither PIN nor signature, includes at least two other
methods:1)usingthedebitcardnumberandCVCcode,usuallyonlineor
inothersituationswheretheconsumeris
notphysically present(card‐not‐present,orCNP);2)neithersignaturenorcard numberand CVCcodeisavailable,
usuallywhenthetransactionisforasufficientlysmalldollarvalue.
45
Figure15:Consumerpreferencesforauthorizingadebitcardpayment
Source:2010SurveyofConsumerPaymentChoice,Table29K
Note:Numbersmaynotsumexactlyduetoroundingormissingvalues.
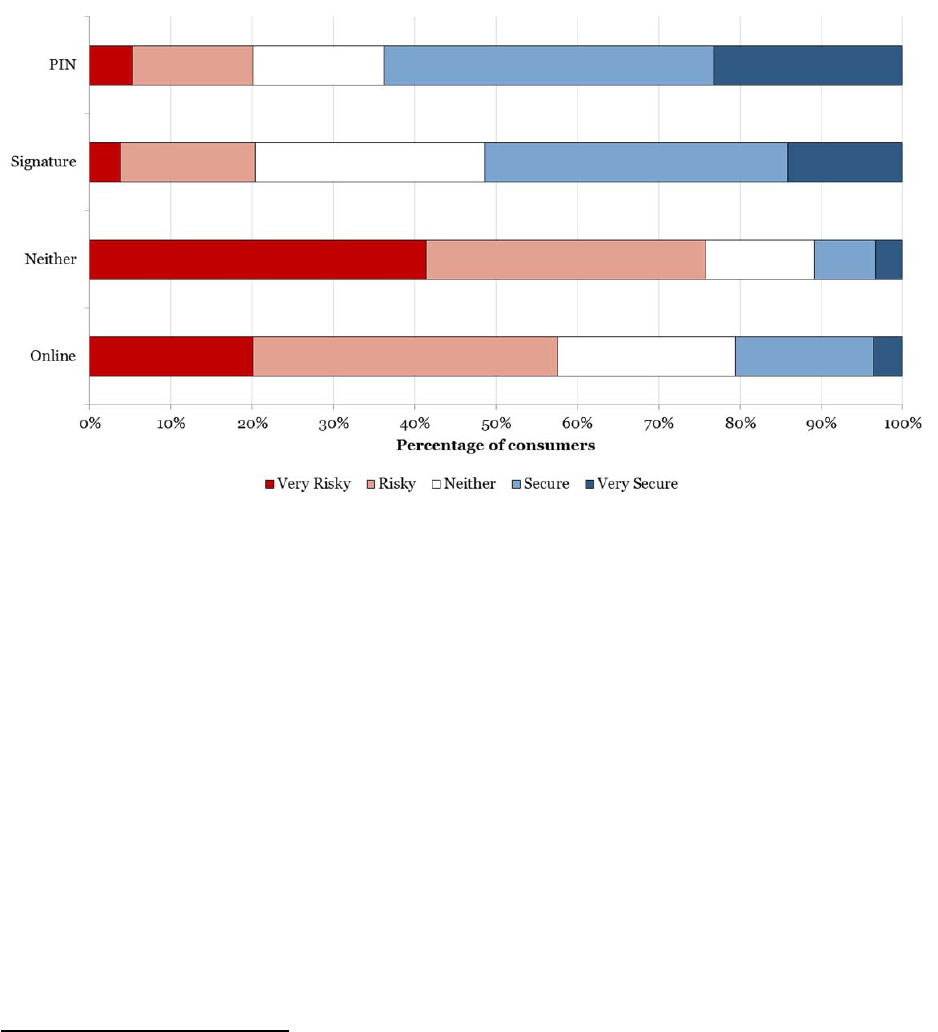
Themajorityofconsumerstrustthesecurityof PINdebit, asshown in thebluebarsof
Figure 16. Security is rated on a 1‐to‐5 scale from “very risky” (1) to “very secure” (5).
Consumers find either of the two primary authorization methods—PIN or signature—to be
relatively secure,
with 63.8 percent of consumers viewing PIN debit as secure or very secure
(blue bars) and 51.4 percent viewing signature debit as secure or very secure. From the
perspective of risk, about the same percentage of consumers (20 percent) view PIN and
signature debit as risky or very risky (red bars).
So, the main difference between these two
formsofauthorizingdebitcardsissimplythatmoreconsumersviewsignatureasneitherrisky
norsafe,whilemoreviewPINassafeorverysafe.Largemajoritiesofconsumersthinkthatthe
lack of authorization (neither PIN nor signature) and online authorization
are considerably
riskierthaneitherPINorsignaturedebit.
46
Figure16:Consumerassessmentsofdebitauthorizationmethod
Source:2010SurveyofConsumerPaymentChoice,Table29J.
PaymentSecuritybyLocation
Since 2008, the SCPC has included questions about consumers’ assessments of the
characteristicsofpaymentinstruments(see 2010SCPC Tables 29A through 29H). One of these
characteristics is the “security” of the payment instrument in terms of the potential loss of
moneyor personal informationwhen
the instrumentis lostor stolen.
47
Akey objective of the
new Federal Reserve strategic plan for payments is to improve the security of the payments
47
The questionnaire asks: “Suppose a payment method has been stolen, misused, or accessed without the owner’s
permission. Please rate the security of each method against permanent financial loss or unwanted disclosure of
personalinformation.”

47
system.Research shows that most consumer assessments ofcharacteristics are correlated with
consumeradoptionanduseofpaymentinstruments.
48
AdisadvantageoftheSCPCcharacteristicquestionsisthattheydonotallowconsumers
tovarytheirassessmentsofthesecurityofapaymentinstrumentoverthedifferentlocationsat
which they pay. Forexample, a consumermay have different views ofthe security ofa credit
cardswipedthrough
aterminalatastorecheckoutcountercomparedtoenteringthecreditcard
numberonlineatacompany’swebpage.Thus,thecharacteristicratingsmayimplicitlyreflecta
consumer’s payment patterns, meaningwhere he orshe most often uses a particularpayment
instrument. To fully address this shortcoming, it would be
necessary to ask the characteristic
questions for each payment instrument and payment location simultaneously. With so many
characteristics, instruments, and locations, it is not feasible to ask so many questions and still
keep the survey to a reasonable length tominimize respondent burden. To partly address the
shortcoming of the
security characteristics question, the 2010 SCPC included a new question
aboutconsumers’assessmentofsecurity,inwhichsubjectsareaskedtoratesecuritybylocation
ofpaymentona1‐to‐5scalefrom“veryrisky”to“verysecure.”
In 2010, consumers viewed payments made in person as the most secure
by far, as
shown in Figure 17. Nearly 90 percent of consumers thought payments made in person were
eithersecureorverysecure.Nootherlocationwasratedsosecurely.Thelocationwiththenext
bestsecurityratingwasonline,alocationthatalmosthalfofconsumersviewassecure
orvery
secure.Consumersaremostconcernedaboutthesecurityofmobilepayments,whichmorethan
halfofconsumersrateasriskyorveryrisky.
49
Consumersratethesecurityofpaymentsbymail
andtelephone(whichmeansauthorizationbyvoice/conversationonanytypeofphone)better
thanmobilepaymentsbutnotbetterthanonlineandfar from as goodasin‐person payments.
48
Forexamples,seeSchuhandStavins(2010,2013)andKoulayev,Rysman,Schuh,andStavins(2012).
49
SeeAccenture(2013)formorerecentcorroboratingevidenceonconsumerconcernsaboutmobilesecurity.
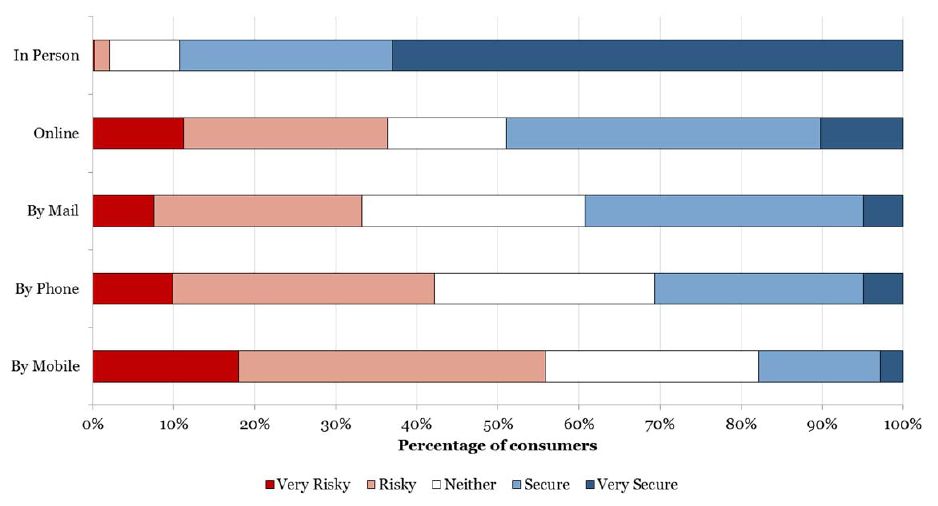
48
To evaluate consumers’ view of the connection between the security of a payment instrument
andapaymentlocation,researchers would havetousetheindividualsurveyresponsesfound
inthepubliclyavailable2010SCPCdatasetasthebasisforfurtherinvestigation.
Figure17:Consumerassessmentsofsecuritybypayment
location
Source:2010SurveyofConsumerPaymentChoice,Table29I.
Notes:Byphonereferstopaymentsmadebyconversationoveraphone.Bymobilereferstoapaymentmadeusing
theonlineortextcapabilitiesofacellphone.
Loss,Theft,andFraud
Although consumer assessments of security are valuable, information about actual
consumer experiences with loss, theft, or fraud is perhaps even more useful. Financial
institutionsandotherpaymentindustryparticipantshaveinformationonthesesecurity‐related
mattersfortheoverallpaymentsmarket.However,lessinformationofthis
sortisavailablefor
consumers only, and especially by consumer demographic category (for example, by age or

49
income). So, in 2010, the SCPC included new questions to elicit basic facts about consumers’
experiences with loss, fraud, and theft of four common payment instruments: cash, checks,
debitcards,andcreditcards.
50
Loss or theft of the four most common payment instruments touched more than one in eight
consumers(13.2percent)whohadtheseinstrumentsin2010.TheleftpanelofFigure18shows
that among the four common instruments, adopting consumers were least likely to have had
security problems with checks
(1.6 percent of check adopters) and most likely to have had
security problems with cash (7.3 percent of adopters). Debit and credit card adopters had
similarsecurityproblems(6.1and5.2percent,respectively).
51
50
Respondents were asked to report loss and theft together, rather than separately, because it may be difficult to
separatethetwoincidentsaccuratelyandconsistentlyacrossincidentsandsurveyrespondents.
51
The difference in percentage of credit card adopters and debit card adopters who were victims of loss, theft or
fraud,isnotstatisticallysignificantatthe95percentsignificancelevel.
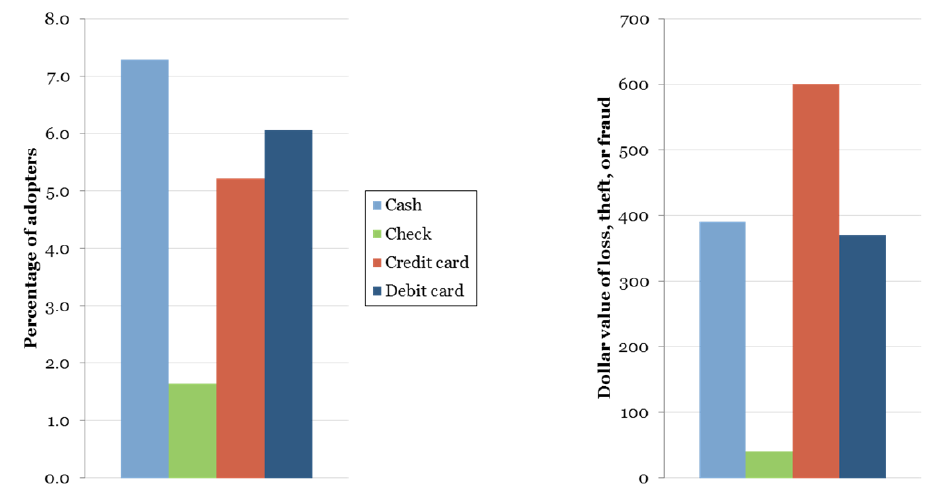
50
Figure18:Consumerexperiencewithloss,theft,andfraudulentuseofpaymentinstruments
Source:2010SurveyofConsumerPaymentChoice,Table27.
Note:Theleftpanelshowstheshareofconsumerswhohadadoptedthepaymentinstrumentandlostitorhadit
stoleninthepast12months.Therightpanelshowstheaveragevalueofcashlostorstolenamongconsumerswith
cashlostorstolen,andtheaveragevalueoffraudulentchargesamongconsumerswithalostorstolencheckor
paymentcard,inthepast12months.
In 2010,among consumers whose payment instruments were lost or stolen in the previous 12
months, the amount of money associated with those security problems was greatest for credit
cards. As shown in Figure 18, the average amount of fraudulent charges experienced by
consumerswithlostorstolencreditcards
inthepreceding12monthswas$600.Bycomparison,
the average value of fraudulent charges was only $40 for checks and $370 for debit cards.
Depending on the business relationship between consumers and their banks that issued the
checkingaccountsorpaymentcards,consumersmaynothavebornethefullamount
(orany)of
thefinanciallossassociatedwiththesefraudulentcharges.Ontheotherhand,consumers who
experienced lost or stolen cash in the preceding 12 months had an average of $391 involved.
Giventhenatureofcash,itislikelythatconsumerslostmost(orall)ofthiscash
value.

51
VIII. SurveyMethodologyandData
Mostofthesurveymethodologyforthe2010SCPCisthesameorverysimilartothatfor
the2009SCPCasdocumentedinFoster,Meijer,Schuh,andZabek(2011).Likeitspredecessors,
the 2010 SCPC was developed by the Consumer Payments Research Center (CPRC) of the
Federal Reserve Bank of
Boston and implemented by the RAND Corporation using the
American Life Panel (ALP) over multiple months near the end of the calendar year. Table 4
summarizes the key features of the 2008–2010 SCPC. In 2010, the size and composition of the
samplewasaboutthesameasin2009but
thetimingofthesurveywasmoresimilartothatof
the 2008 survey. The 2010 survey was administered online to members of the ALP who were
selected to maximize the number of longitudinal panelists. Median survey completion time
continued to be slightly more than 30 minutes. ALP members who participated
in the SCPC
tendedtoratethesurveyfavorablyagain.
2008 2009 2010
Primary months
(% of completed responses)
Sept–Oct
(100%)
Nov–Jan*
(98%)
Sept–Nov
(97%)
Number of respondents 1,010 2,173 2,102
2008–2010 panelists 788 788 788
2009–2010 panelists – 1,913 1,913
2008–2009 panelists 876 876 –
Median completion time in minutes 36.5 30.1 33.2
Favorability rating
(1 to 5 scale; 1 = “Very interesting”)
2.1 1.9 1.9
Table4:SummaryoftheSurveyofConsumerPaymentChoice,2008–2010
Source:Authors’tabulations.
Notes:Asterisk(*)indicatesJanuary2010.
Overall,implementationofthe2010SCPCwassuccessfulintermsofparticipationandresponse
rates, as in prior years. For more information and analysis of the survey methodology and
issuesdiscussedintherestofthissection,seethetechnicalappendixbyAngrisani,Foster,and
Hitczenko(2013).
52
QuestionnaireChanges
The CPRC is working continually to improve the definitions and measurement of the
conceptsappearingintheSCPC. Althoughtheseinnovationsandimprovementsmakeitmore
difficulttocomparesurveyresults acrossyears,thequalitygainsarevaluableand anecessary
partoftheearlystagesofasurvey
aboutanewandchangingfieldofstudysuchasconsumer
payment choice. Also, the number and magnitude of changes in the survey methodology is
decliningovertime.
In 2010, the SCPC questionnaire had fewer changes from the previous year’s survey
than the questionnaire in 2009. Important revisions were made
to the details and definitions
relatedtomobilephones.Morequestionswereaddedtomeasuretheadoptionofsmartphones
andotherphonefeatures,suchastextmessageplansandwebbrowsingcapability.Themobile
bankingandmobilepaymentssectionwasalsoexpandedtocapturerecent developmentsinthe
industry.
Twopaymentinstrumentcharacteristics—(1)acquisitionandsetupcostand(2)record
keeping—were dropped in 2009 to save time but were reinstated in the 2010 questionnaire
becausetheyareimportantforresearch.Respondentsalsowereaskedtoassessnewaspectsof
payments, including the security of payment locations, and the security and
preferences
pertaining to PIN and signature debit card payments, as discussed in Section VII. Finally,
details were added to the prepaid card section to better assess consumers’ adoption and
managementofthecards.
DataIssues
The SCPC results in the official tables of this report reflect several features about data
transformationsthatreadersanddatausersshouldkeepinmind:
Seasonaladjustment–Noseasonaladjustmenthasbeenmadetothedatayet.AsTable4
shows,thecalendartime period ofimplementation of the 2008, 2009,and 2010 surveys
differs from survey to survey. If there are important
monthly seasonal differences in
consumer payment behavior, this different survey timing may affect the comparability
53
of the SCPC results across years, especially with respect to growth rates or changes.
Consequently,thereportedchangesandgrowthratesfortheaggregateSCPCdatamay
berevisedafterseasonaladjustment.TheCPRCiscontinuingtostudythisissue.
Inflation adjustment – All dollar value responses are measured in
current values; no
adjustmentforinflationhasbeenmadeyet.SCPCdatainreal(inflation‐adjustedterms)
may be provided in the future. Readers and data user may adjust the nominal do llar
values in the SCPC by using a suitable aggregate price index like the consumer price
index.
Data
evaluation and cleaning procedures – Major revisions and improvements have been
made to the procedures used to evaluate the consistency and reliability of survey
responses. Previously, these procedures were conducted independently on a year‐by‐
yearbasis.Beginningin2010,theseprocedurestookaccountofsurveyresponsedatafor
allrespondents
andallyears(2008–2010),yieldingatotalofmorethan5,000respondent‐
year observations, and employed enhanced statistical methodology to evaluate and
clean the data. As a result, data for all years reported in dollar values or units (for
example, number of payments) have been revised, including those for 2008–2009.
Response rates have remained relatively high throughout the period studied in the
SCPC program. However, missing values due to item nonresponse have not yet been
imputedinthepublic‐usedataset.
DataRevision
Readersofthetableswillnoticeasuperscripted“r”nexttothecolumnsforthe2008and
2009estimates,indicatingthatthedataintheaffectedcolumnsmayhavebeenrevisedsincethe
lasttimethe2008or2009SCPCresultstableswerepublished.Themainreasonforthechanges
is that a new weighting scheme was applied retroactively to the earlier SCPC results. In
addition, a
new outlier cleaning procedure was applied retroactively to the payment use and
cash holdings numbers from 2008 and 2009. For more information on the change in the
weightingprotocol,seeAngrisani,Foster,andHitczenko(2013).

54
ElectronicPaymentsBenchmarking
SCPCmeasurementofconsumerelectronicpaymentscanpotentiallybecomparedwith
comprehensive,reliabledatafromexternalsourcesforvalidationandbenchmarking.
52
NACHA
(TheElectronicPaymentsAssociation)trackstheuniverseofelectronicpaymentsbycollecting
datafromthetwoelectronicclearinghouses—FedACH,runbytheFederalReserveSystem,and
theElectronicPaymentsNetwork(EPN),runbyTheClearingHouse (TCH).
53
In principle, NACHA can identify all consumer‐related electronic payments separately
fromelectronicpayments bybusinessandgovernment.AccordingtoNACHArules,banksand
other financial institutions involved in electronic payments must follow very specific
accounting and classification procedures when handling electronic payments. Electronic
payments are assigned to specific categories
called standard entry class (SEC) codes, which
define various types of payments. This SEC coding separates consumer‐related electronic
paymentsfromothersandassignsthemtodetailedcategoriesofconsumerelectronicpayments,
whichcanthenbecomparedwiththeSCPCestimatesofconsumerelectronicpayments.
54
For2009–2010,theSCPCnumberofconsumerelectronicpayments(OBBP+BANP)per
month is close to the corresponding estimate from NACHA, as shown in Figure 19, despite
some definitional differences in the two measures. In 2008, however, the SCPC estimate of
consumerelectronicpaymentsisaboutonethirdhigher
thantheNACHAestimate.Thislarger
52
WethankNACHACEOJanetEstepforbringingtoourattentionthepotentialofbenchmarkingtheSCPCdatato
theNACHAdata.WealsothankJaneLarimer,ColleenMorrison,andScottLangofNACHAfortheirtimeandeffort
tohelpusreconcilethetwodatasources.ClaireGreeneof
theCPRCcontributedprominentlytotheideasandresults
inthissubsection.
53
For more information on FedACH, see http://frbservices.org/fedach/, and for more details on EPN, see
http://www.epaynetwork.com/home.php.
54
For more information about NACHA’s operating rules see https://www.nacha.org/achrules.The NACHA SEC
codes CIE, PPD debit, TEL, and WEB are the closest to the SCPC concepts of OBBP and BANP. However, the
NACHA and SCPC concepts are not exactly the same. It is possible to improve the matching of the SCPC and
NACHA data on consumer electronic payments, but doing so would require
NACHA to receive information from
thetwoACH operatorsatamoredetailedlevelofreportingthaniscurrentlyprovided.TheCPRCisworkingwith
NACHAtorefinetheanalysisandmatchingofthedatasourcesandwillreleaseadditionaldetailsinthefuture.
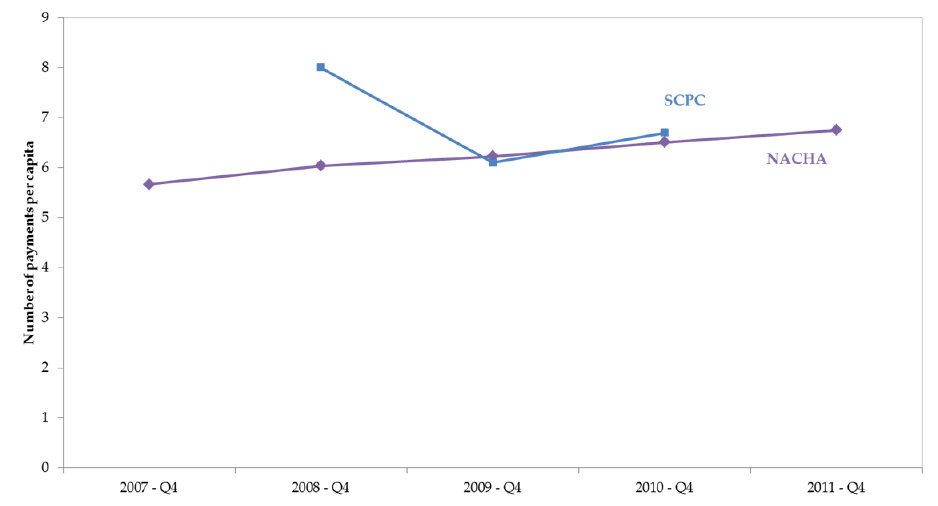
55
discrepancyisnotyetwellexplained,butthereareatleasttwopotentialexplanations.First,the
2008 SCPC questionnaire had a different definition of BANP than ithad in 2009–2010, so it is
possible that the change in the questionnaire improved the accuracy of the SCPC estimate.
Second, there are also
unresolved differences in the matching of the SCPC and NACHA data
that,onceresolved, may reduce thediscrepancybetweenthe two estimates.In themeantime,
the change in SCPC consumer electronic pa yments from 2008 to 2009 should be viewed
circumspectlyandshouldnotberegardedascomparabletothechange
from2009to2010.
Figure19:ComparisonofSCPCandNACHAestimatesofconsumerelectronicpaymentsper
capitapermonth
Source:SurveyofConsumerPaymentChoice,NACHA.
RelationshipbetweenNumberofPaymentsandConsumption
As noted in the discussion of Figure 1, the number of payments by consumers in the
SCPC and real consu m ption in the National Income Accounts are different measures of
consumer spending. There are at least two potentially substantive differences between these
56
twomeasures:1)thetypesofspendingincluded(consumptionversusnonconsumption)and2)
theunitsofmeasurementofconsumptionspending.
First, people make payments for many types of goods and services that are called
consumption, but also for other things that are not included in the economic definition of
consumption.One
importantexampleisthatconsumptionincludestheimputedrentalvalueof
home ownership, which is not a consumer payment, but home‐owning consumers make
mortgagepayments(whichdonotnecessarilyequalimputedrentalservices).Moregenerally,
consumers make payments for debt service, person‐to‐person payments, undocumented
services(suchas
babysitting),andotherthingsthatarenotincludedintheeconomicdefinition
ofconsumption.
Theotherpotentialdifferenceisthatconsumptionismeasuredintermsofthevalueof
spending whilepayments are measured in terms of the number of times a consumer pays for
something. Table 5 illustrates a hypothetical
example of how the units of measurement for
consumption and payments differ for an individual consumer. Real (inflation‐adjusted)
consumption represents the quantity of goods and services purchased for personal
consumption. In contrast, the number of payments represents the number of times that
consumersmakepaymentswhentheybuygoods
andservices,whichcanoccurasasingleitem
or for a group of items such as a shopping basket. As Table 5 indicates, suppose that real
consumption increases over time, as it usually does, in this case by 2 percent from one year
($100) to the next ($102). Then, the
number of payments could stay the same (scenario 2), or
increase (scenario 3) or decrease (scenario 1), even though real consumption increased by 2
percent in each scenario. In scenario 2, the number of payments is not correlated with
consumption, while in scenario 3 the number of payments is positively
correlated with
consumption(andviceversaforscenario1).

57
Values of
Payments
Number of
payments
Total
consumption
Year 1
$50, $50 2 $100
Year 2
Scenario 1: Consumption increases, number of
payments decreases
$102 1 $102
Scenario 2: Consumption increases, number of
payments stays the same
$51, $51 2 $102
Scenario 3: Consumption increases, number of
payments increases
$34, $34,
$34
3 $102
Table5:Hypotheticalexamplesdepictingtherelationshipbetweennumberofpaymentsand
consumption
Source:Authors’calculations.
Note:Dollarvaluesareassumedtohavebeenadjustedforinflation.
A second way the number of payments differs from real consumption is that some
consumer payments are made for items that are not classifiedas consumption in the National
Income Accounts. For example, consumption includes an estimate of the rental equivalent of
homeownership,althoughconsumerswhoownhomesmay
makemortgagepaymentsthatdo
not necessarily equal the imputed rent calculation in consumption. Consumers also make
paymentstootherconsumersforundocumentedservices(suchasbabysitting)orinrepayment
ofprivatedebts,neitherofwhichisincludedinconsumption.Theseandotherexamplesreflect
differencesintheconceptsofpayments
andconsumption.
To summarize, real consumption and the number of consumer payments may be
correlated over time but the concepts differ in important ways. Thus, payments and
consumption should not be expectedtomove inexactlythesamewayovertime,especially at
the level of individual consumers. In the
aggregate, common factors among consumers may
producebusinesscyclecorrelation betweenpaymentsandconsumption.However,thereisstill
very little theoretical research about this relationship or empirical evidence on the actual
correlation.Therefore,itisnotpossibletodrawfirmconclusionsaboutthecyclicalrelationship
between aggregate consumption and the number
of payments until more data and research
becomeavailable.

58
Public‐UseDataandDocumentation
Along with this report, the CPRC is releasing a public‐use microdata set that can be
downloadedbythepublicfreeofcharge.
55
Thedatasetcontainsallofthe2010surveyresponses
at the individual‐respondent level, with all data cleaning and adjustments done by the CPRC,
providedinmultiple formats (SAS,Stata,and CSV). The SCPC data web site also contains the
2010surveyquestionnaire,acodebookfordatausers,andstandard
errorscorrespondingtothe
estimates in Tables 1‐33.
56
The data codebook includes tabulationsof the results for all survey
questionsandvariables.
TheCPRCstronglyrecommendsthatusersoftheSCPCdatareadtheDataUserManual
and Technical Appendix(Angrisani, Foster, and Hitczenko2013) for detailed instructions.
57
In
particular, users should refrain from converting SCPC estimates for the average consumer to
aggregate estimates for all U.S. consumers by multiplying SCPC data and the adult
population.
58
More research and development of the SCPC sampling weights, currently
ongoing, are still needed to ensure that the aggregate estimates are properly benchmarked to
othersourcesof aggregate payments data. For more details,seeAppendixD in Foster,Meijer,
Schuh,andZabek(2011).
Somedatausersmaywishtocombine
thethreeavailablesurveydatasets(2008–2010)to
createa longitudinalpanel for research.The CPRC recommends that data users whodoso be
acutely aware that changes in survey questions over time can make some variables
55
Thedataareavailablefromhttp://www.bostonfed.org/economic/cprc/SCPC/index.htm
56
Additional information can be obtained from the Consumer Payments Research Center of the Boston Fed at the
SCPCwebsiteorbycontactingtheindividualslistedinthecontactpageatthebeginningofthisreport.
57
http://www.bostonfed.org/economic/cprc/SCPC/index.htm
58
Thisrecommendationappliestotheaveragenumberofpaymentspermonth,theaveragevalueofcashholdings,
theaveragenumberofcreditordebitcards,andothersimilartypesofestimates.
59
incomparablebetweenyears(theseareindicatedbytheitalicizednumbersintheofficialtables).
The CPRC plans to release an official longitudinal dataset will document and adjust for these
differences in the future. The longitudinal dataset will also include longitudinal sample
weights; ongoing research is being conducted to find the best
methodology to construct these
longitudinalweights.
InadditiontothedatasetontheBostonFedwebsite,wealsoincludealinktotheRAND
data website, where the user can download the raw, unedited data. These data can be easily
mergedwith the BostonFed’s dataset. Forinformation onhow
tomerge the twodatasets,see
theTechnicalAppendix(Angrisani,Foster,andHitczenko2013).
IX. Conclusions
The 2010 SCPC provides an updated snapshot of U.S. consumer payment choices that
reflects widespread diversity and the influence of new payment innovations but also a
persistentrelianceoncash.Whencombinedwithsimilardatafromtwoearlieryears,theSCPC
begins to suggest trends in consumer payments. However, it is
important to refrain from
drawing conclusions about consumer payment trends at this juncture given the short time
period.Furthermore,theyearsof2008–2010weretumultuousbecauseofthefinancialcrisisand
theunusually severe recession. Evenin normal economic times, however, trendsestimatedon
threeyearsofdataarestill
tooshortandsometimesestimatedtooimpreciselytoenableoneto
draw strong conclusions. Therefore, consumers’ increased use of cash through 2010 and the
rebound in consumers’ use of credit cards and bank account numbers for payment should
continuetobeinterpretedcircumspectlyuntilmoreyearsofdataareavailable.
Consumer
useofmobilebankingandmobilepaymentsappearstohavebeenexpanding
through2010inlinewithtypicalpatternsoftechnologydiffusionthathavecontinuedthrough
at least 2012. Consumer use of prepaid cards has expanded through 2010 in some regards
(extensivemargin)but not all (intensivemargin),sothe
futureofprepaid cards isless clear at
this juncture. Consumers have different preferences for authorization of debit card payment,

60
but without additional research it is not known whether Regulation II may have had any
meaningfuloridentifiableimpactonconsumerpaymentchoices.Consumersassessthequality
of payment security in diverse ways across not only payment instruments but also payment
locations.
The overall picture of consumer payments that emerges from
the 2008 to 2010 SCPC
mayprovideusefulinformationandbackgroundforassessingpotentialpolicychanges,suchas
Regulation II, the CFPB’s proposed rulemaking on prepaid cards, and the Federal Reserve’s
new strategic plan for the U.S. payment system. However, firm conclusions about policy
implicationscannotbedrawnfromthe
officialtablesalone.Mostlikely,muchmoreresearchis
needed using individual consumer responses to be able to draw such policy impli cationsand
certainlytodevelopmoreeffectivepolicies.
X. Definitionsandconcepts
Thissectioncontainsacompletesetoftableswiththeexactdefinitionsofconceptsusedinthe
Survey of Consumer Payment Choice (SCPC) questionnaire and in the construction of the
officialtablesofstatistics.Formoreinformation,consultthe2010SCPCquestionnaireavailable
online.
DefinitionsTable1–BankingConcepts
Concept Definition
Assets Any item of monetary value, such as bank accounts, real estate, stocks,
bonds, annuities, retirement accounts, motor vehicles, jewelry, rare or
collectable goods, and personal or household goods.
Automated Teller
Machine (ATM)
A machine that allows customers to access their bank accounts with an
ATM card, debit card, or credit card to withdraw cash, make deposits,
view account balances, transfer money, and other related banking
transactions.

61
Concept Definition
ATM card An ATM card is a card that allows you to deposit or withdraw cash from
an automated teller machine, but cannot be used for purchases or
payments.
Bank An institution that accepts deposits and offers checking accounts or
savings accounts, including regular or Internet-based commercial banks,
credit unions, and savings and loans.
Checking account A demand deposit account at a bank from which a customer can make an
essentially unlimited number of withdrawals or payments by check,
among other methods.
Mobile banking A method of accessing your bank account using a mobile device. This
can be done either by accessing your bank’s web page through the web
browser on your mobile device, via text messaging or SMS, or by using a
downloadable application on your mobile device.
Money market
account
An account that is similar to a regular savings account, but it usually pays
higher interest, has higher minimum balance requirements, and only
allows three to six withdrawals per month. Also, many money market
accounts will allow a small number of checks each month.
Nonbank online
payment account
A payment service provided by a company that is not a bank. These
services allow a consumer to send and receive money online. Examples
of nonbank online payment services include PayPal, Google Checkout
and Amazon Payments.
Online banking A transaction conducted on the website of a bank, such as viewing
account balances, making transfers between accounts, or paying bills
electronically (see Bank Account Number Payment for additional
definitions).
Savings account A time deposit account at bank from which a customer can make a
limited number of withdrawals or payments each month by a variety of
methods except by check.
Telephone banking A method of accessing your account by calling a phone number that your
bank has provided. You interact with the system using either voice
commands, your phone’s numeric keypad, or speaking with a live
customer service representative.

62
DefinitionsTable2–PaymentInstruments
Concept Definition
Bank account
number payment
(BANP)
A payment made by providing your bank account number to a third
party, such as your employer or a utility company. You can give your
number on websites, paper forms, etc. You do not have to visit your
bank’s website to make these payments.
Cash Coins and paper bills.
Check A piece of paper directing a financial institution to pay a specific amount
of money to a person or business.
Credit card A card that allows the cardholder to make a purchase that will be paid
back to the credit card company later.
Debit card Also called a check card. A type of card that allows the cardholder to
make purchases or payments in addition to allowing access to the
cardholder’s bank accounts through an ATM.
Money order A type of payment that can be purchased from a bank or other institution
and allows the individual named on the order to receive a specified
amount of cash on demand.
Online banking bill
payment (OBBP)
A bill payment made directly from your bank’s online banking website.
This payment does not require you or your bank to disclose your bank
account number to a third party.
Prepaid card A card that has money stored or loaded onto the card. Also known as
stored value cards or gift cards.
Traveler’s check A piece of paper that is similar to a check but works like cash and is
protected against loss or theft. Traveler’s checks are purchased in
advance and issued for a specific amount of money.

63
DefinitionsTable3–Adoption
Concept Consumer Behavior that Defines Adoption
ATM card* Has a bank account and has an ATM card.
Bank account Has at least one checking account, savings account or money market
account.
Cash Has used cash to make a payment at least once in the past 12 months,
holds cash (on person or on property), gets cash on a regular basis, or
uses cash in a typical year.
Cell phone Has a cell phone
Check Has used check to make a payment at least once in the past 12 months,
currently have blank checks, or uses check in a typical year.
Checking account Has at least one checking account.
Credit card* Has a credit card.
Current adoption The percentage of consumers who own a bank account or have a
payment instrument, and have not discarded it as of the time of the
survey.
Debit card* Has a bank account and has a debit card.
Discarding rate The difference between historical and current adoption or ownership
rates. It measures the minimum percentage of consumers who owned a
bank account or had a payment instrument, but discarded it and thus do
not own or have it now.
Bank account number
payment (BANP)
Makes an electronic bank account number payment in a typical year.
Historical adoption The percentage of consumers who have ever owned a bank account or
had a payment instrument at any time (currently or in the past).
Mobile banking Has a bank account, has a cell phone and has set up mobile banking.
Money market
account
Has at least one money market account
Money order Has used a money order in the past 12 months or uses money order in a
typical year.
Nonbank online
payment account
Has at least one nonbank online payment account
Online banking bill
payment* (OBBP)
Has a bank account, has set up online banking, and has set up access to
the online bill payment function.
Online banking* Has a bank account and has set up online banking.
Ownership Equivalent to adoption, but for bank accounts.
Prepaid card* Has a prepaid card of any type.

64
Concept Consumer Behavior that Defines Adoption
Savings account Has at least one savings account
Smart phone Has a smart phone.
Telephone banking* Has a bank account and has set up telephone banking.
Traveler’s check Has used a traveler’s check in the past 12 months.
* In a small number of cases where respondents did not answer the direct adoption question for this concept,
additional information from other questions was used to infer adoption in a manner consistent with the primary
definition.
DefinitionsTable4–PaymentUse
Concept Consumer Behavior that Defines Use
Frequency of use See “Use.”
Incidence of use The percentage of consumers who have used a particular payment
instrument at least once during a typical period of time.
Incidence of use, annual The percentage of consumers who have used a particular payment
instrument at least once in a typical year.
Incidence of use, monthly The percentage of consumers who have used a particular payment
instrument at least once in a typical month.
Use The number of times consumers use a particular instrument for
payment during a typical month (“use” for a typical week or year
was converted to a typical month for comparability).
Typical period A recent week, month, or year in which the consumer does not
experience any unusual payments or other related events.
Consumers choose the reporting frequency they prefer most. The
most recent period is implied and assumed but not stated explicitly
in the survey questions.
DefinitionsTable5–TransactionTypes
Concept Definition
Automatic bill payment A bill payment set up to occur on a regularly scheduled basis,
typically monthly. Once set up, they do not require any
additional effort on the consumer’s part. They can be
processed via bank account deductions, debit card transactions,
or credit card charges or paid directly from your income.

65
Concept Definition
Bill payment A payment made to a company or person at some date after the
time when the company or person provided goods or services
to a consumer. Examples include a payment to utility company
for energy services provided during a month payment or a
payment to service a loan such as a mortgage payment. Most
bill payments occur at regular frequencies such as a week,
month or year.
By mail, in person, or by phone
bill payment
A bill payment made by mail, in person, or over the phone.
Online bill payment (OBP) A bill payment made using the Internet, either via the website
of a bank, company, or other institution that sent the bill, or via
a payment intermediary such as PayPal. Consumers make an
OBP at their discretion and as needed, not automatically. An
OBP can be made via bank account number payment (BANP),
online banking bill payment (OBBP), or debit or credit card.
Online payment (OP) A payment (other than payment of a bill) made for an online
transaction or transfer of funds. The purchase or transfer
initiated either via the website of a seller of goods and services
or other institution, or via a payment intermediary, such as
PayPal. Consumers make an OP at their discretion and as
needed. Included in this definition are payments made via
check or money order (sent by mail) as well as payments made
via debit or credit card or via bank account number payment
(BANP), so long as the payment is made in connection with
transaction initiated online.
Person-to-person payment Transfers or transactions made between two private
individuals. Examples include payments for babysitting or
allowances, paying a person for something that is not business
related, and account to account payments from your bank
account to another person’s bank account.
Retail payment A payment made in person to buy basic goods from retail
outlets while shopping, including: food and grocery stores,
restaurants; superstores, warehouses, and club stores; drug or
convenience stores; gas stations; department stores;
electronics, hardware and appliance stores; home goods and
furniture stores.

66
Concept Definition
Services and other payments A payment made in person by a consumer for services such as:
transportation and tolls; medical, dental, health and fitness;
education and child care; personal care (for example, hair);
recreation, entertainment, and travel; maintenance and repairs;
other professional services (business, legal, etc.); charitable
donations.
DefinitionsTable6–PaymentInstrumentCharacteristics
Concept Definition
Acceptance for payment Please rate how likely each payment method is to be
ACCEPTED for payment by stores, companies, online
merchants, and other people or organizations.
Convenience Please rate the CONVENIENCE of each payment method.
Examples: speed, record keeping, control over payment timing,
ease of use, effort to carry, get or set up, ability to keep or
store.
Cost Please rate the COST of using each payment method.
Examples: fees, penalties, postage, interest paid or lost,
subscriptions, or materials raise the cost; cash discounts and
rewards (like frequent flyer miles) reduce the cost.
Getting & setting up Rate the task of GETTING & SETTING UP each payment
method before you can use it.
Examples: getting cash at the ATM, length of time to get or set
up, paper work, learning to use or install it, or travel.
Payment records Rate the quality of PAYMENT RECORDS offered by each
method of payment. Consider both paper and electronic
records.
Examples: proof of purchase, account balances, spending
history, usefulness in correcting errors or dispute resolution,
and ease of storage.
Security Suppose a payment method has been stolen, misused, or
accessed without the owner’s permission. Rate the
SECURITY of each method against permanent financial loss
or unwanted disclosure of personal information.

67
DefinitionsTable7–OtherTermsandConcepts
Concept Definition
Contactless payment
technology
Allows the consumer to make a payment by tapping or waving a
card or other instrument near a special electronic reading device
without swiping, signing or entering a personal identification
number.
Electronic toll payment A contactless payment technology allowing motor vehicle drivers to
drive through a toll without stopping and have the toll automatically
billed to them, rather than stopping to pay. Examples are EZ-Pass, I-
Pass, Smart Lane, or Smart Tag. The payment can be made from a
bank account, by credit card, and sometimes other methods.
Identity theft or fraud All types of crime in which someone uses (or attempts to use)
someone else's personal information or data without the owner's
permission to purchase goods or services, make payments, steal
money, set up accounts, or commit fraud. Examples of information
used include name and address, Social Security number, credit card
or debit card number, and other related financial information.
Key fob A contactless payment technology that attaches to your key chain.
Key fobs are branded by gas stations and credit card companies such
as American Express, Visa, and MasterCard. An example is the
Mobil Speedpass.
Overdraft protection A service that your bank provides when you make a transaction that
exceeds your account balance. It covers the difference between the
transaction amount and your account balance, and therefore you will
avoid a fee from the retailer or merchant for having insufficient
funds. Overdraft protection can be activated by linking a savings
account or credit card to your checking account, or through
overdraft insurance for instance.
Overdraft Withdraw more money from a bank account than is currently in the
account (also termed "insufficient funds"). Overdraft may occur, for
example, when paying with a check, debit card, or electronic
deduction.

68
Concept Definition
Paid directly from
income
A payment made for a consumer by an employer or other income
provider directly from the consumer’s wages and salaries or other
income payments (such as interest and dividends, social security
payments, retirement plan distributions, alimony, child support,
welfare, trust fund distributions, and other money received).
Reward Any type of benefit given to payment cardholders when they use
their cards to make purchases and other payments. A reward is
usually proportional to the dollar value of the purchase or payment.
Examples include: cash back (a percentage of the dollar value),
frequent flyer miles (airlines), frequent stay points (lodging), college
tuition funding, and shopping network points.
Texting Respondent has cell phone that is able to send or receive text
messages.
Text/SMS with no
texting plan
Respondent can send and receive text messages, but does not have a
monthly text message plan.
Text/SMS with texting
plan
Respondent has a monthly text message plan.
Web browsing Respondent has cell phone which has web browsing capabilities.
Smart phone Respondent has a smart phone. Examples are given as iPhone,
Android, or BlackBerry.
XI. SCPCBoardofAdvisors
BarbaraBennett(joined2009)
FederalReserveSystem
DebbieBianucci(2013)
BankAdministrationInstitute
MarlaBlow(2013)
ConsumerFinancialProtection
Bureau
AndrewCaplin(2009)
NewYorkUniversity
BobChakravorti(2012)
TheClearingHouse
RichardCurtin(2009)
UniversityofMichigan
JanetEstep(2013)
NACHA
DavidEvans(2011)
MarketPlatformDynamics
GeoffreyGerdes(2009)
FederalReserveBoard
FumikoHayashi(2009)
FRBKansasCity
69
DaveHumphrey(2009)
FloridaStateUniversity
RobertHunt(2013)
FRBPhiladelphia
KimP.Huynh(2013)
BankofCanada
RogerJohnston(2010)
Fiserv
DanLittman(2009)
FRBCleveland
MayLiu(2011)
FederalReserveBoard
LeonMajors(2009)
ESP/PhoenixConsulting
BillMcCracken(2009)
SynergisticsResearch
AaronMcPherson(2009)
FinancialInsights
SteveMott(2010)
BetterBuyDesign
JayRyan(2013)
BureauofLaborStatistics
JohnSabelhaus(2012)
FederalReserveBoard
PeterShortall(2013)
MasterCardAdvisors
MarthaStarr(2009)
AmericanUniversity
ChrisVanSteenberg(2013)
CitzensBank
TomWelander(2009)
McKinsey
JaneYao(2009)
AmericanBankersAssociation
JayZagorsky(2010)
OhioStateUniversity
FormerAdvisors
CarlosArango(2009–2010)
BankofCanada
PaulBauer(2009)
FederalReserveBankofCleveland
PeterBurns(2009–2012)
FRBPhiladelphia(retired)
JeffCarter(2009)
CenterforFutureBanking,MIT
MediaLab
ChadHarper(2009)
FRBSanFrancisco
PeterIreland(2009)
BostonCollege
BethKlee(2009)
FederalReserveBOG
RichOliver(2009‐2011)
FRBAtlanta
WilliamRoberds(2008–2012)
FRBAtlanta
GeoffreyThomas(2011–2012)
CitizensBank
AdrienneWells(2009–2010)
FRBAtlanta

70
XII. References
Accenture (2013).“Driving Value and Adoption of Mobile Payments—Consumers Want
More.”
http://www.accenture.com/SiteCollectionDocuments/PDF/FinancialServices/Accenture‐
Consumer‐Mobile‐Payments‐Survey.pdf
Angrisani,Marco,ArieKapteyn,andScottSchuh(2013).“MeasuringHouseholdSpendingand
PaymentHabits:TheRoleof‘Typical’and‘Specific’TimeFramesinSurveyQuestions.”
Improving the Measurement of Consumption Expenditures, NBER‐CRIW Conference
Volume,TimCrossleyeditor,forthcoming.
Angrisani, Marco, Kevin Foster, andMarcin Hitczenko(2013). “The 2010 Survey of
Consumer
Payment Choice: Technical Appen dix.”Federal Reserve Bank of Boston Research Data
Report,forthcoming.
Crowe, Marianne, Marc Rysman, and Joanna Stavins (2010). “Mobile Payments in the United
States at Retail Point of Sale: Current Market and Future Prospects.”Public Policy
DiscussionPaper10‐2,FederalReserveBankofBoston.
Federal
ReserveBoard(2011).PressRelease,June29,
http://www.federalreserve.gov/newsevents/press/bcreg/20110629a.htm
Federal Reserve Board (2012a).Consumers and Mobile Financial Services 2012, March,
http://www.federalreserve.gov/econresdata/mobile‐devices/files/mobile‐device‐report‐201203.pdf
FederalReserveBoard(2012b).PressRelease,July27,
http://www.federalreserve.gov/newsevents/press/bcreg/20120727a.htm
FederalReserveBoard(2013a).AverageDebitCardInterchangeFeebyPaymentCardNetwork,
May23,
http://www.federalreserve.gov/paymentsystems/regii‐average‐interchange‐fee.htm
Federal Reserve Board (2013b).Consumers and Mobile Financial Services 2013, March,
http://www.federalreserve.gov/econresdata/consumers‐and‐mobile‐financial‐services‐report‐
201303.pdf
FederalReserveBoard(2013c).FederalReserveStatisticalRelease,Z.1FinancialAccountsofthe
United States: Flow of Funds, Balance Sheets, and Integrated Macroeconomic Accounts, Table
L.204,June6,
http://www.federalreserve.gov/releases/z1/current/z1.pdf
FederalReserveSystem(2011).The2010FederalReservePaymentsStudy:NoncashPaymentTrends
intheUnitedStates:2006–2009.
http://www.frbservices.org/files/communications/pdf/press/2010_payments_study.pdf

71
Foster, Kevin, Erik Meijer, Scott Schuh, and Michael A. Zabek (2009). “The 2008 Survey of
Consumer Payment Choice.” Federal Reserve Bank of Boston Public Policy Discussion
Paper09‐10.
Foster, Kevin, Erik Meijer, Scott Schuh, and Michael A. Zabek (2011). “The 2009 Survey of
Consumer Payment Choice.” Federal Reserve Bank of
Boston Public Policy Discussion
Paper11‐1.
Hewitt , Patricia. “Understanding Consumers’ Evolving Use of Prepaid Cards.” at NACHA
Payments2013,SanDiego,CA,April22,2013
Hayashi,Fumiko(2013).“TheNewDebitCardRegulations:EffectsonMerchants,Consumers,
andPaymentsSystemEfficiency”FederalReserveBankofKansas,Economic
ReviewQ1
2013.
Koulayev,Sergei,MarcRysman,ScottSchuh,andJoannaStavins(2012).“ExplainingAdoption
andUse of PaymentInstruments by U.S. Consumers,” FederalReserve Bank of Boston
WorkingPaper12–14.
PewCharitableTrusts,LoadedwithUncertainty:ArePrepaidCardsaSmart AlternativetoChecking
Accounts?
http://www.pewstates.org/uploadedFiles/PCS_Assets/2012/Prepaid_Checking_report.pdf
Pianalto, Sandra (2012). “Collaborating to Improve the U.S. Payments System,” October 22,
2012,
http://www.clevelandfed.org/For_the_Public/News_and_Media/Speeches/2012/Pianalto
_20121022.cfm
Rhine,SherrieL.W.,KatyJacob,YazminOsaki,andJenniferTescher(2007).“CardholderUseof
GeneralSpendingPrepaidCards:ACloserLookattheMarket.”TheCenterforFinancial
ServicesInnovation,February.
Schuh, Scott, Oz Shy, Joanna Stavins, and Robert Triest (2011). “An Economic Analysis of the
2010 Proposed Settlement between the Department
of Justice and Credit Card
Networks.”JournalofCompetitionLaw&Economics,8(1):107–144.
Schuh, Scott and Joanna Stavins (2010). “Why Are (Some) Consumers (Still) Writing Paper
Checks?”JournalofBankingandFinance,34(8),1745–1758,August.
Schuh, Scott and Joanna Stavins (2013). “How Consumers Pay: Adoption and Use of
Payments.”
AccountingandFinanceResearch,2(2),1–21,May.
Shy ,Oz (2012).ʺWho gains and who loses from the 2011 debit card interchange fee reform? ʺ
PublicPolicyDiscussionPaper12‐6,FederalReserveBankofBoston.
Shy, Oz (2013).ʺMeasuring Some Effects of the 2011 Debit Card Interchange Fee Reform,ʺ
ContemporaryEconomic
Policy,forthcoming.
Shy,OzandJoannaStavins(2013).“MerchantSteeringofConsumerPaymentChoice:Lessons
LearnedfromConsumerSurveys.”ResearchDataReport13‐1,FederalReserveBankof
Boston.
72
Sullivan, Richard (2010).“The Changing Nature of U.S. Card Payment Fraud: Issues For
Industry and Public Policy,” Workshop on the Economics of Information Security
HarvardUniversity.
Tobin, James (2008). “Money.” In Steven N. Durlauf and Lawrence E. Bloom, eds., The New
PalgraveDictionaryofEconomics,2
nd
edition.
Wang, Zhu (2013). “Demand Externalities and Price Cap Regulation: Learning from a Two‐
SidedMarket,”WorkingPaperNo.13‐06,FederalReserveBankofRichmond.
Wilshusen, Stephanie M., Robert M. Hunt, James van Opstal, and Rachel Schneider (2012).
“Consumers’Use ofPrepaidCards:ATransactions‐BasedAnalysis.”Discussion Paper
12‐
02,PaymentCardsCenter,FederalReserveBankofPhiladelphia,August.
73
XIII. 2010SCPCTables
Table 1 Current Ownership of Accounts and Account Access Technologies
Table 2 Historical Ownership and Discarding of Bank Accounts and Account Access Technologies
Table 3 Primary Bank Account Holdings, by Type of Account and Financial Institution
Table 4 Current Adoption of Payment Instruments
Table 5 Historical Adoption and Discarding of Payment Instruments
Table 6 Current Adoption of Payment Instruments, by Instrument Features
Table 7 Number of Adopted Bank Accounts and Payment Cards
Table 8 Mean Number of Payment Instruments Adopted
Table 9 Cash Holdings, Withdrawals, and Prepaid Card Reloadings
Table 10 Cash Holdings, by Adoption of Bank Accounts and Payment Instruments
Table 11 Monthly Cash Withdrawals, by Most Frequent Location
Table 12 Monthly Cash Withdrawals, by Adoption of Bank Accounts and Payment Instruments
Table 13 Share of Consumers Accessing Bank Account and Other Payment Practices
Table 14 Share of Consumers or Adopters Using Payment Instruments
Table 15 Share of Consumers Making a Transaction, by Type of Transaction
Table 16 Share of Consumers Using Payment Instrument, by Type of Transaction
Table 17 Share of Consumers Using Payment Instrument, by Type of Bill Payment
Table 18 Share of Consumers Using Payment Instrument, by Type of Retail Goods
Table 19 Share of Consumers Using Payment Instrument, by Type of Nonretail, In-Person Transactions
Table 20 Number of Consumer Payments in a Typical Month, by Type of Payment Instrument
Table 21 Number of Consumer Payments in a Typical Month, by Type of Payment Transaction
Table 22 Use of Payment Instruments in a Typical Month, by Type of Transaction
Table 23 Use of Payment Instruments in a Typical Month, by Type of Bill Payment
Table 24 Use of Payment Instruments in a Typical Month, by Type of Retail Goods
Table 25 Use of Payment Instruments in a Typical Month, by Type of Nonretail, In-Person Transactions
Table 26 Payment Instruments Used in a Typical Period, by Type of Instrument and Transaction
Table 27 Loss, Theft, or Fraudulent Use of Payment Instrument
Table 28 Importance Rankings of Characteristics of Payment Instruments
Table 29A Assessments of Payment Instruments: Acceptance for Payments
Table 29B Assessments of Payment Instruments: Acquisition and Setup
Table 29C Assessments of Payment Instruments: Control over Payment Timing
Table 29D Assessments of Payment Instruments: Convenience
Table 29E Assessments of Payment Instruments: Cost
Table 29F Assessments of Payment Instruments: Payment Records
Table 29G Assessments of Payment Instruments: Payment Speed
Table 29H Assessments of Payment Instruments: Security
Table 29I Assessments of Payment Locations: Security
Table 29J Assessment of Debit Authorization Mode
Table 29K Preferred Way of Authorizing Debit Card Payments
Table 30 Demographics: Gender, Age, Race, and Education
Table 31 Income and Labor Force Status
Table 32 Consumers' Financial Responsibility in the Household
Table 33 Selected Assets and Liabilities

2010 Survey of Consumer Payment Choice
2008ʳ 2009ʳ 2010
Bank account
s
93.5 91.8 92.7
Checking............................................................................................................................... 90.3 90.1 91.9
Savings.................................................................................................................................. 77.4 74.3 72.7
Traditional or passbook..................................................................................................... na 69.4 68.3
Money market.................................................................................................................... na 28.5 23.6
With check privileges..................................................................................................... na 16.0 14.6
Bank account feature
s
Primary checking account with earned interest..................................................................... 48.8 46.9 52.3
Overdraft protection.............................................................................................................. 52.3 72.1 75.0
Bank account access technolo
g
ie
s
B
l
an
k
paper c
h
ec
k
s............................................................................................................... na 84.2 87.0
ATM or
d
e
bi
t car
d
................................................................................................................ 84.4 82.1 83.4
ATM car
d
.......................................................................................................................... 25.6 35.4 42.2
De
bi
t car
d
.......................................................................................................................... 79.6 75.0 78.4
Te
l
ep
h
one
b
an
ki
ng................................................................................................................ 42.7 41.1 37.7
On
li
ne
b
an
ki
ng...................................................................................................................... 69.4 64.0 68.0
Mo
bil
e p
h
one........................................................................................................................ na 89.0 92.2
Smart phone (iPhone, Android, BlackBerry, etc.)............................................................ na na 26.7
Mo
bil
e
b
an
ki
ng..................................................................................................................... 6.7 10.1 11.5
Nonbank
p
a
y
ment account
s
On
li
ne payment serv
i
ce prov
id
er.......................................................................................... na 29.6 29.7
Table 1
NOTES: Superscript "r" denotes that numbers in the column may have been revised since the last time they were published. Numbers in italics are not
comparable across years due to changes in the survey questionnaire or methodology. Numbers may not sum exactly due to rounding or missing values. The
notation "na" indicates that the estimate is not available.
Current Ownership of Accounts and Account Access Technologies
Percentage of consumers
Survey of Consumer Payment Choice Version of November 2013
T-1
©2008–2013 Federal Reserve Bank of Boston

2010 Survey of Consumer Payment Choice
Ever owned
2008ʳ 2009ʳ 2010
Bank account
s
97.5 98.7 98.4
Checking.............................................................................................................................. 95.9 98.1 97.9
Savings................................................................................................................................. 95.4 95.6 95.3
Traditional or passbook..................................................................................................... na 95.0 94.9
Money market................................................................................................................... na 40.7 37.7
Money market with check privileges............................................................................. na na na
Bank account feature
s
Primary checking account bears interest.............................................................................. na na na
Overdraft protection............................................................................................................. na na na
Bank account access technolo
g
ie
s
Blank paper checks............................................................................................................... na na na
ATM or debit card................................................................................................................ 91.6 92.3 92.3
ATM card.......................................................................................................................... 59.4 69.0 69.9
Debit card.......................................................................................................................... 85.4 84.7 86.4
Telephone banking............................................................................................................... 49.9 50.1 na
Online banking..................................................................................................................... 71.8 71.9 75.9
Mobile banking.................................................................................................................... na 11.3 13.7
Nonbank
p
a
y
ment account
s
Online payment service provider.......................................................................................... na na na
Discarded*
2008ʳ 2009ʳ 2010
Bank account
s
4.0 6.9 5.6
Checking.............................................................................................................................. 5.5 8.0 6.0
Savings................................................................................................................................. 18.1 21.4 22.6
Traditional or passbook..................................................................................................... na 25.6 26.5
Money market................................................................................................................... na 12.0 14.1
Money market with check privileges............................................................................. na na na
Bank account feature
s
Primary checking account bears interest.............................................................................. na na na
Overdraft protection............................................................................................................. na na na
Bank account access technolo
g
ie
s
Blank paper checks............................................................................................................... na na na
ATM or debit card................................................................................................................ 7.1 10.3 8.8
ATM card.......................................................................................................................... 33.7 29.8 27.7
Debit card.......................................................................................................................... 5.8 9.6 7.9
Telephone banking............................................................................................................... 7.3 8.8 na
Online banking..................................................................................................................... 2.3 7.8 7.8
Mobile banking.................................................................................................................... na 0.7 1.4
Nonbank
p
a
y
ment account
s
Online payment service provider.......................................................................................... na na na
Table 2
* "Discarded" refers to the difference between historical and current ownership rates.
NOTES: Superscript "r" denotes that numbers in the column may have been revised since the last time they were published. Numbers in italics are not
comparable across years due to changes in the survey questionnaire or methodology. Numbers may not sum exactly due to rounding or missing values. The
notation "na" indicates that the estimate is not available.
Historical Ownership and Discarding of Accounts and Account Access Technologies
Percentage of consumers
Survey of Consumer Payment Choice Version of November 2013
T-2
©2008–2013 Federal Reserve Bank of Boston

2010 Survey of Consumer Payment Choice
Percentage of consumers
2008ʳ 2009ʳ 2010
Primar
y
checkin
g
accoun
t
Commercial bank................................................................................................................... 68.0 62.0 63.1
Savings and loan.................................................................................................................... 1.4 6.9 6.9
Credit union........................................................................................................................... 18.6 18.5 18.1
Brokerage............................................................................................................................... na 0.2 0.4
Internet bank.......................................................................................................................... 0.6 0.9 0.6
Other...................................................................................................................................... 0.8 0.8 2.0
Primar
y
savin
g
s accoun
t
Commercial bank................................................................................................................... 44.9 33.9 35.0
Savings and loan.................................................................................................................... 1.3 5.3 5.3
Cre
di
t un
i
on........................................................................................................................... 25.2 24.5 22.1
Bro
k
erage............................................................................................................................... na 1.5 1.0
Internet
b
an
k
.......................................................................................................................... 2.1 2.4 1.6
Ot
h
er...................................................................................................................................... 1.2 0.5 1.3
Percentage of account adopters*
2008ʳ 2009ʳ 2010
Primar
y
checkin
g
accoun
t
Commerc
i
a
l
b
an
k
................................................................................................................... 76.2 69.4 69.3
Sav
i
ngs an
d
l
oan.................................................................................................................... 1.5 7.8 7.6
Cre
di
t un
i
on........................................................................................................................... 20.8 20.7 19.9
Bro
k
erage............................................................................................................................... na 0.2 0.4
Internet
b
an
k
.......................................................................................................................... 0.6 1.0 0.7
Ot
h
er...................................................................................................................................... 0.9 0.9 2.2
Primar
y
savin
g
s accoun
t
Commerc
i
a
l
b
an
k
................................................................................................................... 60.1 49.7 52.7
Sav
i
ngs an
d
l
oan.................................................................................................................... 1.8 7.8 8.0
Cre
di
t un
i
on........................................................................................................................... 33.7 36.0 33.2
Bro
k
erage............................................................................................................................... na 2.2 1.5
Internet
b
an
k
.......................................................................................................................... 2.8 3.5 2.5
Ot
h
er...................................................................................................................................... 1.6 0.7 2.0
* Adopters are respondents who have identified themselves as owning and/or using that type of account. For example, 69.3% of checking account
adopters identified "commercial bank" as the location of their primary checking account in 2010.
Table 3
Primary Bank Account Holdings, by Type of Account and Financial Institution
NOTES: Superscript "r" denotes that numbers in the column may have been revised since the last time they were published. Numbers in italics are not
comparable across years due to changes in the survey questionnaire or methodology. Numbers may not sum exactly due to rounding or missing values.
The notation "na" indicates that the estimate is not available.
Survey of Consumer Payment Choice Version of November 2013
T-3
©2008–2013 Federal Reserve Bank of Boston

2010 Survey of Consumer Payment Choice
2008ʳ 2009ʳ 2010
Pa
p
er instrument
s
98.0 100.0 100.0
Cash†.................................................................................................................................... 97.9 99.9 100.0
Check.................................................................................................................................... 90.3 84.2 87.0
Money order‡ ....................................................................................................................... 19.2 27.3 23.6
Traveler's check‡ .................................................................................................................. 4.3 6.7 6.2
Pa
y
ment card
s
93.0 93.3 94.1
Debit..................................................................................................................................... 79.6 75.0 78.4
Credit.................................................................................................................................... 77.7 70.6 70.3
Prepaid.................................................................................................................................. 17.5 32.5 38.2
Electronic
p
a
y
ment
s
80.2 71.4 75.7
Online banking bill payment................................................................................................. 50.9 47.6 48.7
Bank account number payment‡........................................................................................... 73.4 55.8 64.8
Other means of
p
a
y
men
t
Direct deduction from income‡............................................................................................. 20.9 16.8 17.5
† Adoption means the consumer used the instrument in the given year, held it on person, held it on property, or had obtained it at least once in the given
year
* Adoption means the consumer had the instrument, unless otherwise noted.
Table 4
Current Adoption of Payment Instruments*
Percentage of consumers
‡ Adoption means the consumer used the instrument or method in a given year.
NOTES: Superscript "r" denotes that numbers in the column may have been revised since the last time they were published. Numbers in italics are not
comparable across years due to changes in the survey questionnaire or methodology. Numbers may not sum exactly due to rounding or missing values.
Survey of Consumer Payment Choice Version of November 2013
T-4
©2008–2013 Federal Reserve Bank of Boston

2010 Survey of Consumer Payment Choice
Ever adopted 2008ʳ 2009ʳ 2010
Pa
p
er instrument
s
Cash†.................................................................................................................................. na na na
Check.................................................................................................................................. na na na
Money order‡...................................................................................................................... na 81.8 81.1
Traveler's check‡................................................................................................................. na 55.5 54.5
Pa
y
ment card
s
Debit................................................................................................................................... 85.4 84.7 86.4
Credit.................................................................................................................................. 91.8 87.7 87.4
Prepaid................................................................................................................................ 46.0 63.8 65.3
Electronic
p
a
y
ment
s
On
li
ne
b
an
ki
ng
bill
payment................................................................................................. 56.6 57.6 57.1
Bank account number payment‡........................................................................................... na na na
Other means of
p
a
y
men
t
Direct deduction from income‡............................................................................................. na na na
Discarded**
2008ʳ 2009ʳ 2010
Pa
p
er instrument
s
Cash†.................................................................................................................................. na na na
C
h
ec
k
.................................................................................................................................. na na na
Money order‡...................................................................................................................... na 54.5 57.5
Traveler's check‡................................................................................................................. na 48.9 48.3
Pa
y
ment card
s
De
bi
t................................................................................................................................... 5.8 9.6 7.9
Cre
di
t.................................................................................................................................. 13.8 17.0 17.1
Prepa
id
................................................................................................................................ 28.5 28.8 27.0
Electronic
p
a
y
ment
s
On
li
ne
b
an
ki
ng
bill
payment................................................................................................. 4.9 7.6 5.3
Bank account number payment‡........................................................................................... na na na
Other means of
p
a
y
men
t
Direct deduction from income‡............................................................................................. na na na
† Adoption means the consumer used the instrument in the given year, held it on person, held it on property, or had obtained it at least once in the given
year
Table 5
Historical Adoption and Discarding of Payment Instruments*
Percentage of consumers
* Adoption means the consumer had the instrument, unless otherwise noted.
‡ Adoption means the consumer used the instrument in a given year.
** "Discarded" refers to the difference between historical and current adoption rates.
NOTES: Superscript "r" denotes that numbers in the column may have been revised since the last time they were published. Numbers in italics are not
comparable across years due to changes in the survey questionnaire or methodology. Numbers may not sum exactly due to rounding or missing values. The
notation "na" indicates that the estimate is not available.
Survey of Consumer Payment Choice Version of November 2013
T-5
©2008–2013 Federal Reserve Bank of Boston

2010 Survey of Consumer Payment Choice
2008ʳ 2009ʳ 2010
Debit card
s
79.6 75.0 78.4
Rewards................................................................................................................................ 22.8 21.5 25.6
Credit cards† 77.7 70.6 70.3
Rewards................................................................................................................................ 61.8 52.8 53.8
Nonrewards........................................................................................................................... 52.9 41.8 42.5
General purpose.................................................................................................................... na 65.7 65.3
Rewards............................................................................................................................. na 45.7 47.3
Nonrewards........................................................................................................................ na 32.8 31.1
Charge................................................................................................................................... na 15.8 16.1
Rewards............................................................................................................................. na 8.6 8.7
Nonrewards........................................................................................................................ na 6.3 6.0
Branded................................................................................................................................. na 39.5 44.2
Rewards............................................................................................................................. na 21.2 23.6
Nonrewards........................................................................................................................ na 20.0 23.9
Pre
p
aid cards‡ 17.5 32.5 38.2
General purpose.................................................................................................................... na 19.4 25.9
Merchant specific.................................................................................................................. na 15.4 19.0
Payroll**............................................................................................................................... na 2.0 2.3
Government issued................................................................................................................ na na 5.5
Electronic benefits transfer (EBT)**................................................................................. na 7.8 na
Reloadable............................................................................................................................ na 15.2 14.1
Bought for own use............................................................................................................... 6.4 na na
Received from others............................................................................................................ 13.8 na na
Both bought and received..................................................................................................... 2.8nana
Contactless 44.4 23.2 28.2
Debit card.............................................................................................................................. 19.2 10.4 12.4
Credit card............................................................................................................................. 24.7 9.5 9.2
Prepaid card.......................................................................................................................... 4.7 2.0 3.1
Electronic toll payment......................................................................................................... 9.9 8.3 11.9
Key fob................................................................................................................................. 1.7 1.9 1.6
Mobile phone††.................................................................................................................... na 1.5 1.0
Table 6
Current Adoption of Payment Instruments, by Instrument Features*
Percentage of consumers
* Adoption means the consumer had the instrument, unless otherwise noted.
†General purpose credit cards have a network logo such as Visa, MasterCard, Discover, or American Express; Branded cards also have a merchant's logo on
the card. Charge cards require full payment of the balance at the end of each billing period.
‡ General purpose prepaid cards have a credit card network or PIN network logo and can be used at any merchant or retailer that accepts cards from that
network. Specific purpose prepaid cards, such as gift cards or public transportation cards, are limited in use to one or several merchants, retailers, or service
providers.
**
Payro
ll
car
d
s an
d
EBT car
d
s may a
l
so
b
e genera
l
purpose car
d
s.
†† Adoption means the consumer used the instrument in a given year.
NOTES: Superscript "r" denotes that numbers in the column may have been revised since the last time they were published. Numbers in italics are not
comparable across years due to changes in the survey questionnaire or methodology. Numbers may not sum exactly due to rounding or missing values. The
notation "na" indicates that the estimate is not available.
Survey of Consumer Payment Choice Version of November 2013
T-6
©2008–2013 Federal Reserve Bank of Boston

2010 Survey of Consumer Payment Choice
2008ʳ 2009ʳ 2010
Bank account
s
2.8 3.2 2.9
Checking............................................................................................................................... 1.5 1.5 1.5
Savings.................................................................................................................................. na 2.1 1.9
Traditional or passbook..................................................................................................... 1.7 1.6 1.5
Money market.................................................................................................................... na 1.6 1.3
Money market with check privileges.............................................................................. na na na
Nonbank
p
a
y
ment account
s
Online payment service provider.......................................................................................... na 2.1 2.2
ATM and debit card
s
ATM...................................................................................................................................... 1.3 1.3 1.4
De
bi
t..................................................................................................................................... 1.5 1.3 1.4
Credit Cards‡ 3.5 3.7 3.9
Rewar
d
s................................................................................................................................ 2.3 2.0 2.1
Nonrewar
d
s........................................................................................................................... 2.5 1.8 1.8
Genera
l
purpose ................................................................................................................... na 2.1 2.1
Rewar
d
s............................................................................................................................. na 1.3 1.4
Nonrewar
d
s........................................................................................................................ na 1.2 1.1
C
h
arge .................................................................................................................................. na 0.4 0.4
Rewar
d
s............................................................................................................................. na 0.2 0.2
Nonrewar
d
s........................................................................................................................ na 0.2 0.2
Bran
d
e
d
................................................................................................................................ na 1.3 1.5
Rewar
d
s............................................................................................................................. na 0.7 0.7
Nonrewar
d
s........................................................................................................................ na 0.8 1.0
Pre
p
aid cards** 2.4 2.4 1.7
Genera
l
purpose.................................................................................................................... na 1.0 0.7
Merc
h
ant spec
ifi
c ................................................................................................................ na 1.1 0.9
Payroll††............................................................................................................................... na 0.1 0.0
Government
i
ssue
d
................................................................................................................ na na 0.1
Electronic benefits tansfer (EBT)†† ................................................................................. na 0.3 na
Boug
h
t
f
or own use............................................................................................................... 0.6 na na
Rece
i
ve
d
f
rom ot
h
ers............................................................................................................ 1.7 na na
Table 7
Number of Adopted Bank Accounts and Payment Cards*
Mean number per adopter†
*Adopters are respondents who have identified themselves as owning and/or using that type of account.
† Bold-face numbers are per adopter of the instrument. The denominator for each of the subcategories is the number of adopters of the bold-faced
instrument.
‡General purpose credit cards have a network logo such as Visa, MasterCard, Discover, or American Express; Branded cards also have a merchant's logo on
the card. Charge cards require full payment of the balance at the end of each billing period.
** General purpose prepaid cards have a credit card network or PIN network logo and can be used at any merchant or retailer that accepts cards from that
network. Specific purpose prepaid cards, such as gift cards or public transportation cards, are limited in use to one or several merchants, retailers, or service
providers.
†† Payroll cards and EBT cards may also be general purpose cards.
NOTES: Superscript "r" denotes that numbers in the column may have been revised since the last time they were published. Numbers in italics are not
comparable across years due to changes in the survey questionnaire or methodology. Numbers may not sum exactly due to rounding or missing values. The
notation "na" indicates that the estimate is not available.
Survey of Consumer Payment Choice Version of November 2013
T-7
©2008–2013 Federal Reserve Bank of Boston

2010 Survey of Consumer Payment Choice
All consumers 2008ʳ 2009ʳ 2010
Available number of
p
a
y
ment instruments† 9 9 9
Tota
l
5.1 5.0 5.2
Paper instruments.................................................................................................................. 2.1 2.2 2.2
Card instruments................................................................................................................... 1.7 1.8 1.9
Electronic instruments........................................................................................................... 1.2 1.0 1.1
Adopter status 2008ʳ 2009ʳ 2010
Bank account nonado
p
ter
s
1.3 2.2 1.9
Bank account ado
p
ter
s
5.4 5.3 5.5
Checking and savings account adopters................................................................................ 5.5 5.4 5.5
Checking account adopters, no savings................................................................................. 5.0 5.0 5.3
Savings account adopters, no checking................................................................................. 3.2 3.3 3.0
Pa
p
er instrument ado
p
ter
s
5.2 5.0 5.2
Cash adopters‡ .................................................................................................................... 5.2 5.0 5.2
Check adopters...................................................................................................................... 5.4 5.3 5.5
Money order adopters**........................................................................................................ 5.4 5.1 5.5
Traveler's check adopters**.................................................................................................. 6.7 6.5 6.5
Pa
y
ment card ado
p
ter
s
5.4 5.3 5.4
Debit adopters....................................................................................................................... 5.6 5.6 5.7
Credit adopters...................................................................................................................... 5.6 5.5 5.7
Prepaid adopters.................................................................................................................... 6.0 5.8 6.0
Electronic
p
a
y
ment ado
p
ter
s
5.7 5.7 5.8
Online banking bill payment adopters.................................................................................. 6.0 6.0 6.1
Bank account number payment adopters**........................................................................... 5.7 5.9 5.9
‡ Adoption means the consumer used the instrument in the given year, held it on person, held it on property, or had obtained it at least once in the given year.
Table 8
Mean Number of Payment Instruments Adopted*
*Adoption means the consumer had the instrument or account, unless otherwise noted.
† The nine available payment instruments are cash, check, money order, traveler's check, debit card, credit card, prepaid card, online banking bill payment,
and bank account number payment (in 2008, bank account number payment was called "electronic bank account deduction").
**Adoption means the consumer used the instrument or method in a given year
NOTES: Superscript "r" denotes that numbers in the column may have been revised since the last time they were published. Numbers in italics are not
comparable across years due to changes in the survey questionnaire or methodology. Numbers may not sum exactly due to rounding or missing values.
Survey of Consumer Payment Choice Version of November 2013
T-8
©2008–2013 Federal Reserve Bank of Boston

2010 Survey of Consumer Payment Choice
2008ʳ 2009ʳ 2010 2008ʳ 2009ʳ 2010
Cash holdin
gs
424 275 340 72 75 70
On person..................................................................................................... 111 69 66 28 30 30
On property................................................................................................... 325 213 286 15 19 15
Excluding large-value holdings*.................................................................. 132 147 138 60 70 60
On person.................................................................................................. 48 51 47 24 29 26
On property............................................................................................... 91 89 76 10 15 9
Cash withdrawals
p
er month †‡ na 488 502 na 217 239
Amount per withdrawal................................................................................ na 131 124 na 60 60
W
i
t
hd
rawa
l
s
(
num
b
er per mont
h)
................................................................. na 5.2 6.0 na 4 4
Most fre
q
uent location
p
er month † 573 383 397 186 196 186
Amount per w
i
t
hd
rawa
l
............................................................................. 128 135 133 51 58 58
W
i
t
hd
rawa
l
s
(
num
b
er per mont
h)
.............................................................. 5.2 3.6 3.9 2.8 2.0 2.0
All other locations
p
er month † na 108 108 na 0.0 0.0
Amount per w
i
t
hd
rawa
l
............................................................................. na 59 57 na 0 9
W
i
t
hd
rawa
l
s
(
num
b
er per mont
h)
.............................................................. na 1.6 2.1 na 0.1 0.3
Pre
p
aid card reloadin
g
s
p
er month † na 198 136 na 45.7 89.3
Amount per re
l
oa
di
ng, re
l
oa
d
ers on
l
y.......................................................... na 146 79 na 47 49
Re
l
oa
d
s, re
l
oa
d
ers on
l
y
(
num
b
er per mont
h)
................................................ 3.5 1.7 2.0 1.2 0.8 0.9
Re
l
oa
d
e
d
i
n t
h
e past 12 mont
h
s
(
percentage o
f
consumers
)
......................... 5.8 7.2 6.2 na na na
Re
l
oa
d
e
d
i
n t
h
e past 12 mont
h
s
(
percentage o
f
a
d
opters
**)
......................... na 46.5 44.1 na na na
Table 9
Cash Holdings, Withdrawals, and Prepaid Card Reloadings
Dollars per consumer, except as noted
‡ In 2009 and 2010, this number is the withdrawal-weighted average of typical amounts per withdrawal from the primary and all other locations.
** Consumers who have adopted a reloadable prepaid card.
NOTES: Superscript "r" denotes that numbers in the column may have been revised since the last time they were published. Numbers in italics are not
comparable across years due to changes in the survey questionnaire or methodology. Numbers may not sum exactly due to rounding or missing values. The
notation "na" indicates that the estimate is not available. Dollar values are not adjuted for inflation.
Mean Median
* Estimates are for the subsample of respondents with cash holdings of less than or equal to the 95th percentile (Approximately $1,100 for total, $280 for
on person, and $1,000 on property in 2008; $960 for total, $250 for on person, and $800 on property in 2009; and $1,200 for total, $260 for on person,
and $1,000 on property in 2010.)
† Amount per month is obtained from the amount per withdrawal times the number of withdrawals, calculated for each consumer. For further information
please see Section 5.2, "Cash Values" in the technical appendix.
Survey of Consumer Payment Choice Version of November 2013
T-9
©2008–2013 Federal Reserve Bank of Boston

2010 Survey of Consumer Payment Choice
2008ʳ 2009ʳ 2010 2008ʳ 2009ʳ 2010
Bank account 435 277 334 75 75 75
On person........................................................................................... 108 66 66 29 30 30
On property........................................................................................ 337 218 279 17 19 19
ATM or debit card 435 261 267 60 70 70
On person........................................................................................... 103 62 60 25 29 29
On property........................................................................................ 342 206 215 14 19 15
Credit card 278 302 393 85 100 100
On person........................................................................................... 90 72 72 30 39 39
On property........................................................................................ 194 237 335 19 20 20
Prepaid card 219 303 297 80 75 75
On person........................................................................................... 64 66 59 29 30 30
On property........................................................................................ 162 245 245 39 23 19
Money order** 260 212 354 60 70 45
On person........................................................................................... 136 77 65 25 28 20
On property........................................................................................ 129 140 308 18 17 5
2008ʳ 2009ʳ 2010 2008ʳ 2009ʳ 2010
Bank account 271 261 422 11 70 19
On person........................................................................................... 149 101 71 11 36 18
On property........................................................................................ 137 160 382 0 15 0
ATM or debit card 367 340 713 112 124 70
On person........................................................................................... 152 99 96 51 49 38
On property........................................................................................ 229 245 656 27 33 19
Credit card 926 211 214 26 49 32
On person........................................................................................... 181 61 53 15 20 19
On property........................................................................................ 781 154 168 0 6 0
Prepaid card 467 262 367 67 75 70
On person........................................................................................... 121 70 71 25 30 29
On property........................................................................................ 359 198 312 9 18 13
Money order** 463 299 338 74 80 76
On person........................................................................................... 105 66 66 28 34 30
On property........................................................................................ 371 240 282 14 19 19
Table 10
Cash Holdings, by Adoption of Bank Accounts and Payment Instruments*†‡
Dollars per consume
r
*On person is defined as cash held in the respondent's wallet, purse, and/or pocket.
†On property is defined as cash held elsewhere by the respondent (in the respondents home, car, office, etc.) instead of on person.
Adopters
Nonadopters
MedianMean
Mean Median
‡ Adoption means the consumer had the instrument or account, unless otherwise noted.
**Adoption means the consumer used the instrument in a given year.
NOTES: Superscript "r" denotes that numbers in the column may have been revised since the last time they were published. Numbers in italics are not
comparable across years due to changes in the survey questionnaire or methodology. Numbers may not sum exactly due to rounding or missing values.
Dollar values are not adjuted for inflation.
Survey of Consumer Payment Choice Version of November 2013
T-10
©2008–2013 Federal Reserve Bank of Boston

2010 Survey of Consumer Payment Choice
2008ʳ 2009ʳ 2010 2008ʳ 2009ʳ 2010
ATM† na 339 291 na 182 172
Amount per withdrawal...................................................................... na 97 93 na 53 52
Withdrawals (number per month)...................................................... na 3.9 4.0 na 3.0 2.7
Bank† na 411 507 na 211 259
Amount per withdrawal...................................................................... na 196 202 na 96 96
Withdrawals (number per month)...................................................... na 2.4 2.9 na 1.6 1.7
Check† na 948 980 na 952 820
Amount per withdrawal...................................................................... na 365 244 na 262 263
Withdrawals (number per month)...................................................... na 2.9 4.6 na 1.8 3.3
Retail† na 144 146 na 78 83
Amount per withdrawal...................................................................... na 44 32 na 20 19
Withdrawals (number per month)...................................................... na 4.0 4.6 na 2.0 2.9
Em
p
lo
y
er† na 1137 1406 na 791 1493
Amount per withdrawal...................................................................... na 275 403 na 131 389
Withdrawals (number per month)...................................................... na 7.7 4.0 na 4.2 4.1
Famil
y
or friend† na 164 216 na 86 46
Amount per withdrawal...................................................................... na 63 65 na 23 19
Withdrawals (number per month)...................................................... na 2.7 3.8 na 2.0 1.0
Other† na 532 721 na 96 516
Amount per withdrawal...................................................................... na 335 205 na 93 90
Withdrawals (number per month)...................................................... na 2.1 8.3 na 0.7 3.1
Most frequent location 2008ʳ 2009ʳ 2010
2008ʳ 2009ʳ
2010
ATM...................................................................................................... 52.9 49.6 50.5 na na na
Bank teller............................................................................................. 24.6 24.6 23.5 na na na
Check cashing store............................................................................... 1.3 2.5 0.7 na na na
Retail or grocery store........................................................................... 8.5 9.9 10.3 na na na
Employer............................................................................................... 5.2 4.5 4.6 na na na
Family or friend..................................................................................... 2.5 6.2 6.9 na na na
Other...................................................................................................... 0.3 2.7 3.4 na na na
† Monthly amount is obtained from the amount per withdrawal times the number of withdrawals, calculated for each consumer. For further information
please see Section 5.2, "Cash Values" in the technical appendix.
Table 11
Monthly Cash Withdrawals, by Most Frequent Location*
Dollars per consumer per location, except as noted
* The amount for each location is the dollar amount of withdrawals at the specified location, only by consumers who named that location as their most
frequent location.
NOTES: Superscript "r" denotes that numbers in the column may have been revised since the last time they were published. Numbers in italics are not
comparable across years due to changes in the survey questionnaire or methodology. Numbers may not sum exactly due to rounding or missing values. The
notation "na" indicates that the estimate is not available. Dollar values are not adjuted for inflation.
Mean Median
Survey of Consumer Payment Choice Version of November 2013
T-11
©2008–2013 Federal Reserve Bank of Boston

2010 Survey of Consumer Payment Choice
2008ʳ 2009ʳ 2010 2008ʳ 2009ʳ 2010
Bank accoun
t
549 462 490 188 217 239
Amount per withdrawal...................................................................... 120 122 118 51 60 60
Withdrawals (number per month)....................................................... 5.2 5.1 5.9 2.9 3.8 3.9
ATM or debit car
d
535 464 474 184 216 230
Amount per withdrawal...................................................................... 102 116 112 47 58 56
Withdrawals (number per month)....................................................... 5.3 5.4 6.0 3.5 3.9 3.9
Credit car
d
411 424 461 191 208 226
Amount per withdrawal...................................................................... 115 122 119 54 60 60
Withdrawals (number per month)....................................................... 5.1 4.9 5.2 2.7 3.0 3.1
Pre
p
aid car
d
344 460 514 191 214 290
Amount per withdrawal...................................................................... 113 124 123 53 60 60
Withdrawals (number per month)....................................................... 4.0 5.0 6.4 2.6 3.9 3.9
Mone
y
order‡ 666 642 624 217 333 344
Amount per withdrawal...................................................................... 154 174 138 48 78 59
Withdrawals (number per month)....................................................... 6.9 5.8 7.4 3.6 3.8 4.3
2008ʳ 2009ʳ 2010 2008ʳ 2009ʳ 2010
Bank accoun
t
906 778 654 0 678 177
Amount per withdrawal...................................................................... 243 245 207 24 84 44
Withdrawals (number per month)....................................................... 4.1 5.5 6.3 0.0 3.2 2.7
ATM or debit car
d
778 598 647 195 249 272
Amount per withdrawal...................................................................... 271 203 187 88 100 100
Withdrawals (number per month)....................................................... 4.5 4.3 5.5 1.8 2.3 2.7
Credit car
d
1135 641 600 167 261 257
Amount per withdrawal...................................................................... 174 152 136 35 60 50
Withdrawals (number per month)....................................................... 5.4 5.8 7.7 3.2 4.0 4.3
Pre
p
aid car
d
621 501 492 185 217 200
Amount per withdrawal...................................................................... 131 134 124 50 60 59
Withdrawals (number per month)....................................................... 5.4 5.3 5.7 2.9 3.3 3.3
Mone
y
order‡ 554 430 444 184 198 200
Amount per withdrawal...................................................................... 121 115 118 51 60 60
Withdrawals (number per month)....................................................... 4.8 4.9 5.5 2.6 3.0 3.0
Table 12
Monthly Cash Withdrawals, by Adoption of Bank Accounts and Payment Instruments*†
Dollars per month, except as noted
† Adoption means the consumer had the instrument or account, unless otherwise noted.
‡Adoption means the consumer used the instrument in a given year.
Adopters
Nonadopters
Mean Median
Mean Median
*Monthly amount is obtained from the amount per withdrawal times the number of withdrawals, calculated for each consumer. For further information
please see Section 5.2, "Cash Values" in the technical appendix.
NOTES: Superscript "r" denotes that numbers in the column may have been revised since the last time they were published. Numbers in italics are not
comparable across years due to changes in the survey questionnaire or methodology. Numbers may not sum exactly due to rounding or missing values.
Dollar values are not adjuted for inflation.
Survey of Consumer Payment Choice Version of November 2013
T-12
©2008–2013 Federal Reserve Bank of Boston

2010 Survey of Consumer Payment Choice
2008ʳ 2009ʳ 2010 2008ʳ 2009ʳ 2010
Bank account acces
s
na na na na 89.7 90.7
Bank branch visit*.......................................................................... na na na na 75.2 75.7
ATM............................................................................................... na na na na 67.2 72.7
Telephone banking......................................................................... na na na na 31.8 29.4
Online banking............................................................................... na na na na 59.9 63.4
Mobile banking.............................................................................. na na na na 8.7 10.3
Other
p
a
y
ment
p
ractice
s
Cash withdrawals............................................................................ 91.1 90.1 92.5 95.8 97.7 99.0
Online payment service provider.................................................... na na na na 20.0 19.5
Online payment service provider, adopters only......................... na na na na 67.6 65.9
Prepaid card reloading†.................................................................. 4.3 4.5 3.9 5.8 7.2 6.2
Prepaid card reloading, reloaders only†...................................... 73.3 63.7 63.8 98.0 92.5 99.1
Mobile payments............................................................................ na na na na 3.4 4.0
Text/SMS.................................................................................... na na na na na na
Contactless.................................................................................. na na na na 1.5 1.0
Other........................................................................................... na na na na na na
2008ʳ 2009ʳ 2010 2008ʳ 2009ʳ 2010
Bank account acces
s
na na na na 97.7 97.8
Bank branch visit*.......................................................................... na na na na 81.8 81.7
ATM............................................................................................... na na na na 81.4 79.0
Telephone banking......................................................................... na na na na 77.5 78.1
Online banking............................................................................... na na na na 93.6 93.2
Mobile banking.............................................................................. na na na na 85.8 89.1
O
t
h
er
p
a
y
ment
p
ract
i
ce
s
Cash withdrawals............................................................................ 93.1 90.2 92.5 97.9 97.8 99.0
O
n
li
ne payment serv
i
ce prov
id
er.................................................... na na na na
67
.
6
65
.
9
Prepaid card reloading, reloaders only†...................................... 73.3 63.7 63.8 98.0 92.5 99.1
M
o
bil
e payments............................................................................ na na na na na na
T
ext
/SMS
.................................................................................... na na na na
2
.
3
3
.
1
C
ontact
l
ess.................................................................................. na na na na
1
.
5
1
.
0
O
t
h
er........................................................................................... na na na na na na
Table 13
Share of Consumers Accessing Bank Account and Other Payment Practices
* Bank branch visit is defined as visiting a bank and interacting with a teller or other bank employee. It does not include visiting an ATM located at a bank
branch.
† A reloader has adopted a reloadable prepaid card and, in the past 12 months, has added money to it.
Monthly Annual
Percentage of consumers
Percentage of adopters
NOTES: Superscript "r" denotes that numbers in the column may have been revised since the last time they were published. Numbers in italics are not
comparable across years due to changes in the survey questionnaire or methodology. Numbers may not sum exactly due to rounding or missing values. The
notation "na" indicates that the estimate is not available.
Monthly Annual
Survey of Consumer Payment Choice Version of November 2013
T-13
©2008–2013 Federal Reserve Bank of Boston

2010 Survey of Consumer Payment Choice
2008ʳ 2009ʳ 2010 2008ʳ 2009ʳ 2010
Pa
p
er instrument
s
95.1 94.7 95.6 96.0 96.2 96.6
Cash........................................................................................ 85.7 88.6 90.2 88.0 92.1 93.1
Check...................................................................................... 81.6 69.2 71.7 86.8 75.0 78.2
Money order........................................................................... 8.7 10.9 10.8 19.2 15.6 14.9
Traveler's check...................................................................... 0.7 0.1 0.0 4.3 5.9 4.9
Pa
y
ment card
s
89.1 87.1 87.8 90.3 88.2 88.7
Debit....................................................................................... 64.9 63.0 65.2 67.2 65.3 67.7
Credit...................................................................................... 69.0 54.7 56.9 72.8 59.7 61.7
Prepaid................................................................................... 6.1 9.1 8.7 8.8 13.5 11.9
Electronic
p
a
y
ment
s
73.5 62.3 69.1 75.9 66.8 72.4
Online banking bill payment.................................................. 31.9 33.5 36.7 34.0 35.6 38.6
Bank account number payment.............................................. 70.8 49.0 58.3 73.4 55.8 64.8
Other means of
p
a
y
men
t
Direct deduction from income................................................ 20.3 15.9 16.4 20.9 16.8 17.5
2008ʳ 2009ʳ 2010 2008ʳ 2009ʳ 2010
Pa
p
er instrument
s
97.5 95.3 96.0 98.0 96.7 96.6
Cash**.................................................................................... 88.2 88.7 90.3 90.5 92.2 93.2
Check...................................................................................... 85.1 82.7 82.5 89.7 89.7 90.0
Money order*††..................................................................... 44.8 40.3 46.8 100.0 57.9 64.5
Traveler's check*††................................................................ 15.2 1.2 0.8 100.0 88.1 78.2
Pa
y
ment card
s
95.9 93.3 93.3 97.2 94.5 94.3
Debit....................................................................................... 82.2 84.3 83.3 85.0 87.3 86.5
Credit...................................................................................... 89.6 77.9 81.1 94.2 85.0 87.9
Prepaid................................................................................... 36.8 28.7 23.4 52.7 42.7 32.1
Electronic
p
a
y
ment
s
92.4 88.2 91.8 95.5 94.6 96.3
Online banking bill payment.................................................. 65.3 71.4 76.1 69.5 75.7 80.1
Bank account number payment*††......................................... 96.4 87.8 90.1 100.0 100.0 100.0
Other means of
p
a
y
men
t
Direct deduction from income*††.......................................... 96.8 94.8 94.0 100.0 100.0 100.0
Table 14
Share of Consumers or Adopters Using Payment Instruments
* Estimates are 100 percent whenever adoption is defined solely as annual incidence of use.
Percentage of consumers
Percentage of adopters†‡
Monthly Annual
Monthly Annual
† Each payment instrument uses adopters of that particular payment instrument as the denominator. For example, in 2010, 90.3 percent of cash adopters
used cash in a typical month.
**Adoption means the consumer used the instrument in the given year, held it on person, held it on property, or had obtained it at least once in the given
year.
†† Adoption means the consumer used the instrument or method in a given year.
NOTES: Superscript "r" denotes that numbers in the column may have been revised since the last time they were published. Numbers in italics are not
comparable across years due to changes in the survey questionnaire or methodology. Numbers may not sum exactly due to rounding or missing values.
‡Adoption means the consumer had the instrument, unless otherwise noted.
Survey of Consumer Payment Choice Version of November 2013
T-14
©2008–2013 Federal Reserve Bank of Boston

2010 Survey of Consumer Payment Choice
2008ʳ 2009ʳ 2010 2008ʳ 2009ʳ 2010
An
y
Transactio
n
96.6 99.1 99.3 96.6 100.0 99.9
Online or electronic 86.9 85.9 85.9 88.4 88.6 89.1
By mail, in person, or by phone 96.3 97.6 98.0 96.5 97.6 98.0
Bill
p
a
y
ments 95.5 95.7 96.0 95.6 96.9 97.5
Automatic..................................................................................... 58.1 52.6 55.5 58.5 53.3 56.7
Direct deduction from income.................................................. 20.3 15.9 16.4 20.9 16.8 17.5
Other automatic........................................................................ 58.1 51.0 54.0 58.5 51.7 55.3
Online........................................................................................... 65.2 61.3 63.0 69.6 66.1 67.7
By mail, in person, or by phone................................................... 81.7 79.8 83.1 88.0 86.9 89.1
Nonbill
p
a
y
ment
s
96.2 97.2 97.1 96.5 97.8 97.3
Retail goods and services na 96.9 95.9 na 97.5 96.1
Online or electronic...................................................................... 60.4 58.8 52.3 79.3 73.2 68.9
By mail, in person, or by phone................................................... na 96.2 96.2 na 96.8 96.4
Retail goods.............................................................................. 95.6 95.7 93.6 95.8 96.5 94.2
Services..................................................................................... 86.2 81.8 90.4 89.1 89.2 93.0
Person to person na 44.6 56.9 na 55.2 70.9
Online or electronic...................................................................... na 13.8 15.3 na 19.4 21.7
By mail, in person, or by phone................................................... na 40.2 51.4 na 51.3 66.7
Monthly Annual
Table 15
Share of Consumers Making a Transaction, by Type of Transaction
* Adjusted for changes from 2008 to 2009 in the survey definition of transaction categories to make the two years directly comparable.
NOTES: Superscript "r" denotes that numbers in the column may have been revised since the last time they were published. Numbers in italics are not
comparable across years due to changes in the survey questionnaire or methodology. Numbers may not sum exactly due to rounding or missing values. The
notation "na" indicates that the estimate is not available.
Survey of Consumer Payment Choice Version of November 2013
T-15
©2008–2013 Federal Reserve Bank of Boston

2010 Survey of Consumer Payment Choice
2008ʳ 2009ʳ 2010 2008ʳ 2009ʳ 2010 2008ʳ 2009ʳ 2010
Pa
p
er instrument
s
76.7 76.0 79.0 31.5 29.2 15.3 90.5 90.2 91.8
Cash............................................................ 21.5 30.1 34.3 na na na 86.2 87.6 89.5
Check or money order................................. 71.9 63.7 67.8 31.5 29.2 15.3 58.4 51.8 50.9
Check....................................................... na 57.7 63.1 na 25.7 14.1 na 49.2 49.0
Money order............................................ 7.7 9.5 9.9 na 5.5 3.4 4.9 4.8 5.8
Traveler's check.......................................... na na na na na na na na na
Pa
y
ment card
s
72.2 60.9 66.1 46.3 42.0 40.4 88.3 83.0 82.9
De
bi
t........................................................... 57.9 41.4 43.7 27.2 25.3 24.1 61.4 59.7 60.2
Cre
di
t.......................................................... 56.7 32.8 37.3 31.6 24.5 22.7 64.8 48.9 51.6
Prepa
id
........................................................ 2.1 2.9 3.7 2.6 2.9 4.3 5.8 7.7 6.4
Electronic
p
a
y
ment
s
70.5 60.2 66.2 33.0 19.0 22.8 na na na
On
li
ne
b
an
ki
ng
bill
payment....................... 31.9 33.4 36.7 na na na na na na
Ban
k
account num
b
er payment................... 65.1 44.6 51.9 33.0 19.0 22.8 na na na
Other means of
p
a
y
men
t
D
i
rect
d
e
d
uct
i
on
f
rom
i
ncome.................... 20.3 15.9 16.4 na na na na na na
2008ʳ 2009ʳ 2010 2008ʳ 2009ʳ 2010 2008ʳ 2009ʳ 2010
Pa
p
er instrument
s
84.4 85.4 87.3 39.0 37.3 22.8 92.8 93.0 93.6
Cas
h
............................................................ 25.0 37.0 41.7 na na na 88.7 91.5 92.4
C
h
ec
k
or money or
d
er................................. 80.5 74.2 76.6 39.0 37.3 22.8 68.1 63.4 62.2
C
h
ec
k
....................................................... na 67.5 72.1 na 33.2 20.9 na 60.5 60.6
Money or
d
er............................................ 14.4 13.1 13.1 na 8.8 5.2 19.2 8.3 7.8
Trave
l
er's c
h
ec
k
.......................................... na na na na na na na na na
Pa
y
ment card
s
75.2 65.3 71.2 65.0 58.2 57.9 89.4 84.6 84.5
De
bi
t........................................................... 60.7 44.0 47.4 36.0 34.8 34.2 63.8 62.1 63.3
Cre
di
t.......................................................... 62.3 37.8 42.9 48.3 38.3 37.9 70.4 54.8 57.2
Prepa
id
........................................................ 2.6 5.2 4.8 3.4 6.4 5.3 8.4 11.9 10.2
Electronic
p
a
y
ment
s
73.3 63.2 69.7 41.5 27.6 31.4 na na na
On
li
ne
b
an
ki
ng
bill
payment....................... 34.0 35.1 38.2 na na na na na na
Ban
k
account num
b
er payment................... 67.6 49.1 58.1 41.5 27.6 31.4 na na na
Other means of
p
a
y
men
t
D
i
rect
d
e
d
uct
i
on
f
rom
i
ncome.................... 20.9 16.8 17.5 na na na na na na
Table 16
Share of Consumers Using Payment Instrument, by Type of Transaction
Monthly
Annual
Nonbill Payments
Bill Payments
Bill Payments
Online
Retail, services, and person
to person*
Nonbill Payments
Online
Retail, services, and person
to person*
* Adjusted for changes from 2008 to 2009 in the survey definition of transaction categories to make the two years directly comparable.
NOTES: Superscript "r" denotes that numbers in the column may have been revised since the last time they were published. Numbers in italics are not
comparable across years due to changes in the survey questionnaire or methodology. Numbers may not sum exactly due to rounding or missing values. The
notation "na" indicates that the estimate is not available.
Survey of Consumer Payment Choice Version of November 2013
T-16
©2008–2013 Federal Reserve Bank of Boston

2010 Survey of Consumer Payment Choice
2008ʳ 2009ʳ 2010 2008ʳ 2009ʳ 2010 2008ʳ 2009ʳ 2010
An
y
instrumen
t
58.1 52.6 55.5 65.2 61.3 63.0 81.7 79.8 83.1
Excl. online banking bill payment*............. 58.1 49.4 52.8 na na na na na na
Pa
p
er instrument
s
na na na na na na 76.5 74.4 77.7
Cash............................................................. na na na na na na 21.5 30.1 34.3
Check or money order................................. na na na na na na 71.9 63.7 67.8
Check....................................................... na na na na na na na 57.7 63.1
Money order............................................. na na na na na na 7.7 9.5 9.9
Traveler's check........................................... na na na na na na na na na
Pa
y
ment card
s
39.4 32.1 37.4 42.6 40.2 41.5 37.3 37.2 42.0
Debit............................................................ 21.6 18.5 23.1 28.3 28.9 27.8 24.7 25.4 28.4
Credit........................................................... 29.7 21.2 22.0 24.4 19.2 21.1 21.2 18.4 22.2
Prepaid......................................................... na na na na na na 2.1 2.9 3.7
Electronic
p
a
y
ment
s
53.5 41.8 45.8 54.7 48.1 51.5 na na na
Online banking bill payment....................... na 20.6 21.6 31.9 29.4 30.4 na na na
Bank account number payment.................... 53.5 30.8 37.5 42.8 31.2 35.6 na na na
Other means of
p
a
y
men
t
Direct deduction from income..................... 20.3 15.9 16.4 na na na na na na
2008ʳ 2009ʳ 2010 2008ʳ 2009ʳ 2010 2008ʳ 2009ʳ 2010
An
y
instrumen
t
58.5 53.3 56.7 69.6 66.1 67.7 88.0 86.9 89.1
Excl. online banking bill payment*............. 58.5 50.3 54.4 na na na na na na
Pa
p
er instrument
s
na na na na na na 84.0 83.7 85.9
Cash............................................................. na na na na na na 25.0 37.0 41.7
Check or money order................................. na na na na na na 80.5 74.2 76.6
Check....................................................... na na na na na na na 67.5 72.1
Money order............................................. na na na na na na 14.4 13.1 13.1
Traveler's check........................................... na na na na na na na na na
Payment cards 41.8 33.6 39.3 47.6 46.2 47.9 42.3 44.0 48.5
Debit............................................................ 23.1 19.3 24.3 32.0 32.5 31.4 26.9 29.7 32.9
Credit........................................................... 32.7 23.2 25.7 29.3 24.0 26.4 26.7 23.6 27.0
Prepaid......................................................... na na na na na na 2.6 5.2 4.8
Electronic
p
a
y
ment
s
54.5 43.4 48.4 59.5 51.7 55.8 na na na
Online banking bill payment....................... na 21.9 22.4 34.0 31.1 32.1 na na na
Bank account number payment.................... 54.5 34.1 41.6 46.5 35.8 42.5 na na na
Other means of
p
a
y
men
t
Direct deduction from income..................... 20.9 16.8 17.5 na na na na na na
Monthly
Annual
Automatic Online
Table 17
Share of Consumers Using Payment Instrument, by Type of Bill Payment
By Mail or In Person
* Online banking bill pay is excluded to show direct comparison between 2008 and 2009 estimates for automatic bill payments. OBBP was not included as
a payment choice for automatic bill payments in the 2008 SCPC.
NOTES: Superscript "r" denotes that numbers in the column may have been revised since the last time they were published. Numbers in italics are not
comparable across years due to changes in the survey questionnaire or methodology. Numbers may not sum exactly due to rounding or missing values. The
notation "na" indicates that the estimate is not available.
Automatic Online By Mail or In Person
Survey of Consumer Payment Choice Version of November 2013
T-17
©2008–2013 Federal Reserve Bank of Boston

2010 Survey of Consumer Payment Choice
2008ʳ 2009ʳ 2010 2008ʳ 2009ʳ 2010 2008ʳ 2009ʳ 2010
An
y
instrumen
t
95.6 95.7 93.6 93.5 na na 79.1 na na
Pa
p
er instrument
s
87.9 82.1 81.4 79.8 na na 55.9 na na
Cash............................................................ 85.0 81.7 80.1 76.5 na na 51.3 na na
Check or money order................................ 44.7 31.2 31.4 30.2 na na 21.1 na na
Check...................................................... na 30.2 31.0 na na na na na na
Money order............................................ na 3.3 3.6 na na na na na na
Traveler's check.......................................... na na na na na na na na na
Pa
y
ment card
s
87.0 80.2 79.1 82.9 na na 68.9 na na
Debit........................................................... 60.6 57.4 58.0 58.8 na na 45.0 na na
Credit.......................................................... 64.0 45.5 47.4 55.0 na na 46.2 na na
Prepaid....................................................... 5.4 6.5 5.7 5.1 na na 2.8 na na
Electronic
p
a
y
ment
s
na na na na na na na na na
Online banking bill payment...................... na na na na na na na na na
Bank account number payment.................. na na na na na na na na na
2008ʳ 2009ʳ 2010 2008ʳ 2009ʳ 2010 2008ʳ 2009ʳ 2010
An
y
instrumen
t
95.8 96.5 94.2 94.5 na na 91.9 na na
Pa
p
er instrument
s
89.6 86.0 84.0 87.4 na na 73.1 na na
Cash............................................................ 86.7 86.0 83.1 84.1 na na 67.8 na na
Check or money order................................ 51.9 40.3 38.9 42.6 na na 39.6 na na
Check...................................................... na 38.8 na na na na na na na
Money order............................................ na 5.6 5.0 na na na na na na
Traveler's check.......................................... na na na na na na na na na
Pa
y
ment card
s
88.5 82.5 81.2 85.6 na na 83.7 na na
Debit........................................................... 63.2 60.5 61.1 62.0 na na 56.7 na na
Credit.......................................................... 69.4 51.4 53.3 64.0 na na 63.8 na na
Prepaid....................................................... 8.2 11.0 9.0 7.6 na na 4.8 na na
Electronic
p
a
y
ment
s
na na na na na na na na na
Online banking bill payment...................... na na na na na na na na na
Bank account number payment.................. na na na na na na na na na
Table 18
Share of Consumers Using Payment Instrument, by Type of Retail Goods*
Annual
Total Essential Goods†
NOTES: Superscript "r" denotes that numbers in the column may have been revised since the last time they were published. Numbers in italics are not
comparable across years due to changes in the survey questionnaire or methodology. Numbers may not sum exactly due to rounding or missing values. The
notation "na" indicates that the estimate is not available.
* Adjusted for changes from 2008 to 2009 in the survey definition of transaction categories to make the two years directly comparable.
† For definitions of essential and nonessential goods, see Appendix A.5 in Foster, Meijer, Schuh, and Zabek 2009.
Nonessential Goods†
Percentage of consumers
Monthly
Total Essential Goods† Nonessential Goods†
Survey of Consumer Payment Choice Version of November 2013
T-18
©2008–2013 Federal Reserve Bank of Boston

2010 Survey of Consumer Payment Choice
2008ʳ 2009ʳ 2010 2008ʳ 2009ʳ 2010 2008ʳ 2009ʳ 2010
An
y
instrumen
t
86.2 85.7 93.0 na 81.8 90.4 na 44.6 56.9
Pa
p
er instrument
s
75.0 75.7 84.6 na 67.5 78.4 na 40.0 51.3
Cash...................................................... 61.9 65.4 78.4 na 56.2 73.4 na 35.1 43.9
Check or money order........................... 47.9 43.3 43.5 na 37.3 34.0 na 16.0 21.7
Check................................................. na 41.7 41.9 na 37.3 33.9 na 14.9 20.2
Money order...................................... na 3.4 4.9 na 2.2 3.0 na 1.9 3.4
Traveler's check.................................... na na na na na na na na na
Pa
y
ment card
s
65.0 63.5 75.4 na 63.1 74.8 na 8.6 8.0
Debit..................................................... 42.1 42.5 51.0 na 42.4 50.9 na 6.4 6.0
Credit.................................................... 41.6 34.6 43.9 na 34.4 43.6 na 4.2 4.0
Prepaid.................................................. 1.9 4.0 4.3 na 4.0 4.3 na na na
Electronic
p
a
y
ment
s
na 8.2 10.4 na na na na 8.2 10.4
Online banking bill payment................. na 4.5 6.0 na na na na 4.5 6.0
Bank account number payment............. na 5.7 5.9 na na na na 5.7 5.9
2008ʳ 2009ʳ 2010 2008ʳ 2009ʳ 2010 2008ʳ 2009ʳ 2010
An
y
instrumen
t
89.1 90.6 95.1 na 89.2 93.0 na 55.2 70.9
Pa
p
er instrument
s
80.9 83.8 89.6 na 78.3 83.6 na 51.0 66.5
Cash...................................................... 66.6 76.5 85.5 na 68.6 79.3 na 46.1 60.0
Check or money order........................... 58.0 57.7 56.5 na 51.3 43.2 na 27.8 37.5
Check................................................. na 55.6 55.2 na 50.8 43.9 na 26.6 36.6
Money order...................................... na 6.4 6.8 na 4.7 4.1 na 3.6 4.6
Traveler's check.................................... na na na na na na na na na
Pa
y
ment card
s
73.5 73.1 80.4 na 72.9 79.9 na 12.4 12.5
Debit..................................................... 48.3 50.4 55.8 na 50.4 55.4 na 8.7 8.8
Credit.................................................... 55.9 45.7 51.5 na 45.5 51.2 na 6.8 6.7
Prepaid.................................................. 3.8 6.7 6.9 na 6.7 6.9 na na na
Electronic
p
a
y
ment
s
na 12.3 15.2 na na na na 12.3 15.2
Online banking bill payment................. na 6.3 7.9 na na na na 6.3 7.9
Bank account number payment............. na 9.1 9.8 na na na na 9.1 9.8
Table 19
Share of Consumers Using Payment Instrument, by Type of Nonretail, In-Person Transactions*
* Adjusted for changes from 2008 to 2009 in the survey definition of transaction categories to make the two years directly comparable.
NOTES: Superscript "r" denotes that numbers in the column may have been revised since the last time they were published. Numbers in italics are not
comparable across years due to changes in the survey questionnaire or methodology. Numbers may not sum exactly due to rounding or missing values.
The notation "na" indicates that the estimate is not available.
Annual
Monthly
Person to PersonServices and OtherTotal
Total Services and Other Person to Person
Survey of Consumer Payment Choice Version of November 2013
T-19
©2008–2013 Federal Reserve Bank of Boston

2010 Survey of Consumer Payment Choice
2008ʳ 2009ʳ 2010 08-09ʳ 09-10
Total
p
a
y
ment
s
71.2 67.1 73.0 -5.8 8.8
Pa
p
er instrument
s
25.7 28.9 29.0 12.4 .4
Cash........................................................................................................ 16.1 20.4 21.1 27.3 3.0
Check or money order............................................................................ 10.1 8.8 8.3 -12.1 -6.2
Check.................................................................................................. 9.7 8.2 7.7 -15.1 -5.5
Money order........................................................................................ 0.4 0.7 0.6 – -10.6
Traveler's check...................................................................................... 0.0 0.0 0.0 – -9.6
Pa
y
ment card
s
36.9 31.3 36.4 -15.1 16.2
Debit....................................................................................................... 21.8 19.5 22.7 -10.6 16.3
Credit...................................................................................................... 15.0 11.5 13.3 -23.5 15.3
Prepaid.................................................................................................... 0.6 0.7 0.6 – - 0.1
Prepaid, per adopter*.............................................................................. 3.4 2.1 1.6 -38.0 -23.0
Electronic
p
a
y
ment
s
8.0 6.1 6.7 -24.0 10.5
Online banking bill payment.................................................................. 3.8 3.3 3.2 -14.4 - .2
Bank account number payment............................................................... 4.3 2.9 3.5 – 22.4
Bank account number payment, per adopter*...................................... 7.8 5.1 5.4 – 5.5
Other means of
p
a
y
men
t
Direct deduction from income................................................................ 1.0 0.5 0.6 -44.6 16.9
2008ʳ 2009ʳ 2010 08-09ʳ 09-10
Total
p
a
y
ment
s
100 100 100 – –
Pa
p
er instrument
s
35.8 43.4 40.0 7.6 -3.4
Cash........................................................................................................ 21.8 30.2 28.6 8.3 -1.6
Check or money order............................................................................ 13.9 13.2 11.4 -0.7 -1.8
Check.................................................................................................. 13.4 12.2 10.5 -1.2 -1.6
Money order........................................................................................ 0.6 1.1 0.9 – -0.2
Traveler's check...................................................................................... 0.0 0.0 0.0 – 0.0
Pa
y
ment card
s
51.8 46.9 50.0 -5.0 3.2
Debit....................................................................................................... 30.1 28.9 31.1 -1.2 2.1
Credit...................................................................................................... 20.9 17.0 18.2 -3.9 1.2
Prepaid.................................................................................................... 0.8 1.0 0.8 – -0.2
Electronic
p
a
y
ment
s
11.2 9.0 9.2 -2.2 0.2
Online banking bill payment†................................................................ 3.2 4.8 4.4 1.6 -0.4
Bank account number payment†............................................................. 8.0 4.2 4.8 – 0.6
Other means of
p
a
y
men
t
D
i
rect
d
e
d
uct
i
on
f
rom
i
ncome................................................................ 1.2 0.7 0.8 -0.5 0.1
Table 20
Number of Consumer Payments in a Typical Month, by Type of Payment Instrument
* Per adopter estimate is included due to changes in the survey design that affected the rates of adoption of payment instruments (see Table 4), making
the per consumer estimates not comparable across years. Estimates are calculated using only adopters of a payment instrument, not all consumers.
NOTES: Superscript "r" denotes that numbers in the column may have been revised since the last time they were published. Numbers in italics are not
comparable across years due to changes in the survey questionnaire or methodology. Numbers may not sum exactly due to rounding or missing values.
Number per consumer
Percentage share
Mean Growth Rate (%)
Share (%) Change
Survey of Consumer Payment Choice Version of November 2013
T-20
©2008–2013 Federal Reserve Bank of Boston

2010 Survey of Consumer Payment Choice
2008ʳ 2009ʳ 2010 08-09ʳ 09-10
Tota
l
71.2 67.1 73.0 -5.8 8.8
Online or electronic 20.3 15.7 16.6 -22.5 5.8
By mail, in person , or by phone 50.9 51.1 55.9 0.2 9.5
Bill
p
a
y
ments 20.3 18.2 21.2 -10.4 16.1
Automatic...................................................................................... 6.6 4.8 6.1 -26.9 25.9
Direct deduction from income.................................................... 1.0 0.5 0.6 -44.6 16.9
Other automatic.......................................................................... 5.7 4.3 5.5 -23.9 27.0
Online............................................................................................ 6.8 5.3 5.9 -22.5 11.5
By mail, in person, or by phone..................................................... 7.1 8.2 9.2 15.2 13.3
Nonbill
p
a
y
ment
s
50.9 48.5 51.4 – 5.8
Retail and services na 45.0 46.8 – 4.1
Online or electronic...................................................................... 6.9 4.8 3.7 -29.6 -23.3
By mail, in person, or by phone.................................................... na 40.2 43.1 – 7.3
Retail goods.............................................................................. 30.6 27.3 25.1 -10.7 -8.2
Services..................................................................................... 13.5 12.9 18.1 – 40.2
Person to person na 3.5 4.5 – 27.8
Online or electronic...................................................................... na 0.9 1.0 – 19.9
By mail, in person, or by phone.................................................... na 2.7 3.5 – 30.0
2008ʳ 2009ʳ 2010 08-09ʳ 09-10
Tota
l
100 100 100 ––
Online or electronic 28.3 23.5 22.9 -4.8 -0.6
By mail or in person 71.7 76.4 77.1 4.8 0.6
Bill
p
a
y
ments 28.6 27.3 29.2 -1.3 1.9
Automatic...................................................................................... 9.1 7.2 8.4 -1.9 1.2
Direct deduction from income.................................................... 1.2 0.7 0.8 -0.5 0.1
Other automatic.......................................................................... 7.9 7.2 8.4 -0.7 1.2
Online............................................................................................ 9.6 7.9 8.1 -1.7 0.2
By ma
il
,
i
n person, or
b
y p
h
one..................................................... 9.9 12.2 12.7 2.3 0.5
Nonbill Pa
y
ment
s
71.4 72.7 70.8 – -1.9
Retail and services na 67.4 64.6 – -2.8
On
li
ne or e
l
ectron
i
c...................................................................... 9.6 7.2 5.1 -2.4 -2.1
By mail, in person, or by phone.................................................... na 60.2 59.5 – -0.7
Reta
il
goo
d
s.............................................................................. 42.9 40.9 34.6 -2.0 -6.3
Services..................................................................................... 18.9 19.3 24.9 – 5.6
Person to person na 5.3 6.2 – 0.9
Online or electronic...................................................................... na 1.2 1.4 – 0.1
By mail, in person, or by phone.................................................... na 4.1 4.9 – 0.8
Table 21
Number of Consumer Payments in a Typical Month, by Type of Payment Transaction
Mean
Growth Rate (%)
Number per consumer
NOTES: Superscript "r" denotes that numbers in the column may have been revised since the last time they were published. Numbers in italics are not
comparable across years due to changes in the survey questionnaire or methodology. Numbers may not sum exactly due to rounding or missing values. The
notation "na" indicates that the estimate is not available.
Percentage share
Share (%) Change
Survey of Consumer Payment Choice Version of November 2013
T-21
©2008–2013 Federal Reserve Bank of Boston

2010 Survey of Consumer Payment Choice
2008ʳ 2009ʳ 2010 2008ʳ 2009ʳ 2010 2008ʳ 2009ʳ 2010
Pa
p
er instrument
s
5.0 5.6 5.9 1.7 1.4 0.7 19.5 22.0 22.6
Cash...................................................... 1.2 2.3 2.5 na na na 15.2 18.4 18.8
Check or money order........................... 4.0 3.4 3.5 1.7 1.4 0.7 4.7 4.0 4.2
Check................................................. 3.8 3.1 3.3 na 1.3 0.6 na 3.9 4.0
Money order...................................... 0.2 0.3 0.3 na 0.2 0.1 0.2 0.2 0.3
Traveler's check.................................... na na na na na na na na na
Pa
y
ment card
s
7.9 7.2 9.5 4.1 2.8 2.2 25.0 21.4 24.9
Debit..................................................... 4.9 4.7 6.3 2.3 1.7 1.3 15.1 13.4 15.5
Credit.................................................... 3.2 2.6 3.2 1.8 1.1 0.8 10.3 8.0 9.4
Prepaid.................................................. 0.1 0.1 0.1 0.1 0.1 0.1 0.4 0.5 0.4
Electronic
p
a
y
ment
s
6.7 5.1 5.4 1.3 0.6 1.0 na 0.4 0.4
Online banking bill payment................. 2.4 3.1 3.0 na na na na 0.2 0.2
Bank account number payment............. 4.5 2.1 2.4 1.3 0.6 1.0 na 0.2 0.2
Other methods of
p
a
y
men
t
Direct deduction from income.............. 1.0 0.5 0.6 na na na na na na
2008ʳ 2009ʳ 2010 2008ʳ 2009ʳ 2010 2008ʳ 2009ʳ 2010
Pa
p
er instrument
s
6.9 8.3 8.0 2.2 2.1 0.9 26.6 33.0 31.1
Cash...................................................... 1.5 3.2 3.2 na na na 20.3 27.0 25.4
Check or money order........................... 5.4 5.1 4.8 2.2 2.1 0.9 6.3 6.0 5.7
Check................................................. 5.1 4.6 4.4 na 1.9 0.7 na 5.7 5.4
Money order...................................... 0.3 0.5 0.4 na 0.2 0.1 0.3 0.3 0.3
Traveler's check.................................... na na na na na na na na na
Pa
y
ment card
s
11.0 10.7 13.0 5.7 4.2 3.0 35.1 31.9 34.1
Debit..................................................... 6.6 6.8 8.5 3.1 2.5 1.7 20.5 19.6 20.9
Credit.................................................... 4.4 3.7 4.3 2.5 1.6 1.1 14.0 11.6 12.7
Prepaid.................................................. 0.1 0.2 0.1 0.1 0.1 0.2 0.6 0.7 0.5
Electronic
p
a
y
ment
s
9.5 7.6 7.4 1.7 0.9 1.3 na 0.6 0.5
Online banking bill payment................. 3.2 4.5 4.1 na na na na 0.3 0.3
Bank account number payment............. 6.3 3.1 3.3 1.7 0.9 1.3 na 0.3 0.2
Other methods of
p
a
y
men
t
Direct deduction from income.............. 1.2 0.7 0.8 na na na na na na
Table 22
Use of Payment Instruments in a Typical Month, by Type of Transaction
NOTES: Superscript "r" denotes that numbers in the column may have been revised since the last time they were published. Numbers in italics are not
comparable across years due to changes in the survey questionnaire or methodology. Numbers may not sum exactly due to rounding or missing values.
The notation "na" indicates that the estimate is not available.
Number per consumer
Bill Payments
Nonbill payments
Online
Retail, Service and Person
to Person
Percentage share
Bill Payments
Nonbill Payments
Online
Retail, Service and Person
to Person
Survey of Consumer Payment Choice Version of November 2013
T-22
©2008–2013 Federal Reserve Bank of Boston

2010 Survey of Consumer Payment Choice
2008ʳ 2009ʳ 2010 2008ʳ 2009ʳ 2010 2008ʳ 2009ʳ 2010
Pa
p
er instrument
s
na na na na na na 5.0 5.5 5.8
Cash................................................................................. na na na na na na 1.2 2.3 2.5
Check or money order..................................................... na na na na na na 4.0 3.4 3.5
Check........................................................................... na na na na na na na 3.1 3.3
Money order................................................................. na na na na na na 0.2 0.3 0.3
Traveler's check............................................................... na na na na na na na na na
Pa
y
ment card
s
3.2 2.3 3.3 2.8 2.4 2.9 2.2 2.7 3.5
Debit................................................................................ 2.0 1.3 2.1 1.8 1.8 2.0 1.3 1.7 2.3
Credit............................................................................... 1.3 1.0 1.2 1.1 0.7 0.9 1.0 1.0 1.2
Prepaid............................................................................ na na na na na na 0.1 0.1 0.1
Electronic
p
a
y
ment
s
2.6 2.2 2.3 4.2 3.0 3.1 na na na
Online banking bill payment*......................................... 1.4 1.2 1.2 2.4 1.9 1.9 na na na
Bank account number payment....................................... 1.2 1.0 1.2 2.0 1.1 1.3 na na na
Other means of
p
a
y
men
t
Direct deduction from income......................................... 1.0 0.5 0.6 na na na na na na
2008ʳ 2009ʳ 2010 2008ʳ 2009ʳ 2010 2008ʳ 2009ʳ 2010
Pa
p
er instrument
s
na na na na na na 6.9 8.3 8.0
Cash................................................................................. na na na na na na 1.5 3.2 3.2
Check or money order..................................................... na na na na na na 5.4 5.1 4.8
Check........................................................................... na na na na na na na 4.6 4.4
Money order................................................................. na na na na na na 0.3 0.5 0.4
Traveler's check............................................................... na na na na na na na na na
Pa
y
ment card
s
4.3 3.3 4.4 3.7 3.5 3.8 3.0 4.0 4.7
Debit................................................................................ 2.5 1.9 2.8 2.3 2.6 2.7 1.7 2.4 3.0
Credit............................................................................... 1.7 1.4 1.6 1.4 0.9 1.1 1.3 1.4 1.6
Prepaid............................................................................ na na na na na na 0.1 0.2 0.1
Electronic
p
a
y
ment
s
3.6 3.2 3.1 5.9 4.4 4.3 na na na
Online banking bill payment*......................................... 1.9 1.7 1.6 3.2 2.8 2.5 na na na
Bank account number payment....................................... 1.7 1.5 1.6 6.4 1.6 1.7 na na na
Other means of
p
a
y
men
t
Direct deduction from income......................................... 1.2 0.7 0.8 na na na na na na
Table 23
Use of Payment Instruments in a Typical Month, by Type of Bill Payment
*The 2008 automatic bill payment number for online banking bill payment is derived from the ratio of total electronic automatic bill payments to total
number of online banking bill payments in the 2009 SCPC.
NOTES: Superscript "r" denotes that numbers in the column may have been revised since the last time they were published. Numbers in italics are not
comparable across years due to changes in the survey questionnaire or methodology. Numbers may not sum exactly due to rounding or missing values.
The notation "na" indicates that the estimate is not available.
By Mail, in Person, or
by Phone
By Mail, in Person, or
by Phone
Mean number per consumer
Percentage share
Automatic Online
Automatic Online
Survey of Consumer Payment Choice Version of November 2013
T-23
©2008–2013 Federal Reserve Bank of Boston

2010 Survey of Consumer Payment Choice
2008ʳ 2009ʳ 2010 2008ʳ 2009ʳ 2010 2008ʳ 2009ʳ 2010
Pa
p
er instrument
s
12.3 12.6 10.7 8.4 na na 4.1 na na
Cash................................................................................. 10.8 11.3 9.4 7.5 na na 3.4 na na
Check or money order..................................................... 1.7 1.9 1.7 1.1 na na 0.7 na na
Check........................................................................... na 1.8 1.6 na na na na na na
Money order................................................................. na 0.1 0.1 na na na na na na
Traveler's check............................................................... na na na na na na na na na
Pa
y
ment card
s
18.6 14.8 14.5 12.3 na na 6.3 na na
Debit................................................................................ 11.6 9.2 9.2 7.8 na na 3.9 na na
Credit............................................................................... 7.3 5.6 5.4 4.7 na na 2.6 na na
Prepaid............................................................................ 0.3 0.3 0.2 0.2 na na 0.1 na na
Electronic
p
a
y
ment
s
na na na na na na na na na
Online banking bill payment........................................... na na na na na na na na na
Bank account number payment....................................... na na na na na na na na na
2008ʳ 2009ʳ 2010 2008ʳ 2009ʳ 2010 2008ʳ 2009ʳ 2010
Pa
p
er instrument
s
16.8 18.9 14.6 11.3 na na 5.5 na na
Cash................................................................................. 14.5 16.2 12.4 9.9 na na 4.6 na na
Check or money order..................................................... 2.3 2.7 2.2 1.4 na na 0.9 na na
Check........................................................................... na 2.6 2.1 na na na na na na
Money order................................................................. na 0.1 0.1 na na na na na na
Traveler's check............................................................... na na na na na na na na na
Pa
y
ment card
s
26.1 22.0 19.9 17.2 na na 8.8 na na
Debit................................................................................ 15.7 13.4 12.3 10.5 na na 5.2 na na
Credit............................................................................... 9.9 8.1 7.3 6.4 na na 3.5 na na
Prepaid............................................................................ 0.5 0.4 0.3 0.3 na na 0.1 na na
Electronic
p
a
y
ment
s
na na na na na na na na na
Online banking bill payment........................................... na na na na na na na na na
Bank account number payment....................................... na na na na na na na na na
Table 24
Use of Payment Instruments in a Typical Month, by Type of Retail Goods
Mean number per consumer
Percentage share
Total* Essential Goods†
NOTES: Superscript "r" denotes that numbers in the column may have been revised since the last time they were published. Numbers in italics are not
comparable across years due to changes in the survey questionnaire or methodology. Numbers may not sum exactly due to rounding or missing values. The
notation "na" indicates that the estimate is not available.
* Adjusted for changes from 2008 to 2009 in the survey definition of transaction categories to make the two years directly comparable.
† For definitions of essential and nonessential goods, see Appendix A.5 in Foster, Meijer, Schuh, and Zabek 2009.
Total*
Nonessential Goods†
Essential Goods† Nonessential Goods†
Survey of Consumer Payment Choice Version of November 2013
T-24
©2008–2013 Federal Reserve Bank of Boston

2010 Survey of Consumer Payment Choice
2008ʳ 2009ʳ 2010 2008ʳ 2009ʳ 2010 2008ʳ 2009ʳ 2010
Pa
p
er instrument
s
7.3 9.4 12.0 na 6.7 8.5 na 2.7 3.5
Cash................................................................................. 4.4 7.5 9.7 na 5.4 7.1 na 2.2 2.7
Check or money order...................................................... 3.0 2.2 2.5 na 1.6 1.6 na 0.6 0.9
Check............................................................................ na 2.1 2.5 na 1.6 1.6 na 0.5 0.9
Money order................................................................. na 0.1 0.2 na 0.1 0.1 na 0.1 0.1
Traveler's check................................................................ na na na na na na na na na
Pa
y
ment card
s
6.5 6.7 10.4 na 6.3 9.7 na 0.5 0.7
Debit................................................................................ 3.6 4.3 6.4 na 4.0 6.0 na 0.4 0.5
Credit............................................................................... 3.0 2.4 4.0 na 2.3 3.8 na 0.1 0.2
Prepaid............................................................................. 0.1 0.2 0.1 na 0.2 0.1 na na na
Electronic
p
a
y
ment
s
na 0.4 0.4 na na na na 0.4 0.4
Online banking bill payment............................................ na 0.2 0.2 na na na na 0.2 0.2
Bank account number payment........................................ na 0.2 0.2 na na na na 0.2 0.2
2008ʳ 2009ʳ 2010 2008 2009ʳ 2010 2008 2009ʳ 2010
Pa
p
er instrument
s
9.8 14.1 16.4 na 10.0 11.6 na 4.1 4.9
Cash................................................................................. 5.8 10.8 13.0 na 7.6 9.4 na 3.2 3.6
Check or money order...................................................... 4.0 3.3 3.5 na 2.4 2.2 na 0.9 1.3
Check............................................................................ na 3.1 3.3 na 2.3 2.1 na 0.8 1.1
Money order................................................................. na 0.2 0.2 na 0.1 0.1 na 0.1 0.1
Traveler's check................................................................ na na na na na na na na na
Pa
y
ment card
s
9.1 9.9 14.2 na 9.3 13.3 na 0.7 0.9
Debit................................................................................ 4.8 6.2 8.6 na 5.7 8.0 na 0.5 0.6
Credit............................................................................... 4.1 3.5 5.4 na 3.3 5.1 na 0.2 0.3
Prepaid............................................................................. 0.1 0.2 0.2 na 0.2 0.2 na na na
Electronic
p
a
y
ment
s
na 0.6 0.5 na na na na 0.6 0.5
Online banking bill payment............................................ na 0.3 0.3 na na na na 0.3 0.3
Bank account number payment........................................ na 0.3 0.2 na na na na 0.3 0.2
Table 25
Use of Payment Instruments in a Typical Month, by Type of Nonretail, In-Person Transactions
Mean number per consumer
Percentage share
Total* Services and Other
Total* Services and Other
* Adjusted for changes from 2008 to 2009 in the survey definition of transaction categories to make the two years directly comparable.
NOTES: Superscript "r" denotes that numbers in the column may have been revised since the last time they were published. Numbers in italics are not
comparable across years due to changes in the survey questionnaire or methodology. Numbers may not sum exactly due to rounding or missing values. The
notation "na" indicates that the estimate is not available.
Person to Person
Person to Person
Survey of Consumer Payment Choice Version of November 2013
T-25
©2008–2013 Federal Reserve Bank of Boston

2010 Survey of Consumer Payment Choice
Typical month
2008ʳ 2009ʳ 2010
All
p
a
y
ments (9 instruments available)
*
4.1 3.7 3.9
Paper instruments.................................................................................................................. 1.8 1.7 1.7
Payment cards........................................................................................................................ 1.4 1.3 1.3
Electronic payments.............................................................................................................. 1.0 0.8 0.9
Bill
p
a
y
ments (8 instruments available)† 3.0 2.6 2.9
Paper instruments.................................................................................................................. 1.0 0.9 1.0
Payment cards........................................................................................................................ 1.1 0.8 0.8
Electronic payments.............................................................................................................. 0.9 0.8 0.9
Online
p
a
y
ments (6 instruments available)‡ 1.2 1.0 0.9
Paper instruments.................................................................................................................. 0.3 0.3 0.2
Payment cards........................................................................................................................ 0.6 0.5 0.5
Electronic payments.............................................................................................................. 0.3 0.2 0.2
In-
p
erson
p
a
y
ments (8 instruments available)*
*
2.8 2.6 2.7
Paper instruments.................................................................................................................. 1.5 1.4 1.4
Payment cards........................................................................................................................ 1.3 1.1 1.2
Electronic payments.............................................................................................................. na 0.1 0.1
Typical year
2008ʳ 2009ʳ 2010
All
p
a
y
ments (9 instruments available)
*
4.5 4.1 4.3
Paper instruments.................................................................................................................. 2.0 1.9 1.9
Payment cards........................................................................................................................ 1.5 1.4 1.4
Electronic payments.............................................................................................................. 1.1 0.9 1.0
Bill
p
a
y
ments (8 instruments available)† 3.3 2.9 3.3
Paper instruments.................................................................................................................. 1.2 1.1 1.2
Payment cards........................................................................................................................ 1.2 0.8 0.9
Electronic payments.............................................................................................................. 1.0 0.8 1.0
Online
p
a
y
ments (6 instruments available)‡ 1.6 1.4 1.3
Paper instruments.................................................................................................................. 0.4 0.4 0.3
Payment cards........................................................................................................................ 0.9 0.8 0.8
Electronic payments.............................................................................................................. 0.4 0.3 0.3
In-
p
erson
p
a
y
ments (8 instruments available)*
*
3.1 3.0 3.0
Paper instruments.................................................................................................................. 1.7 1.6 1.6
Payment cards........................................................................................................................ 1.4 1.3 1.3
Electronic payments.............................................................................................................. na 0.2 0.2
‡ Cash, traveler's check, and OBBP are not accepted as payment instruments for online payments.
** OBBP is not accepted as a payment instrument for in-person payments
Table 26
Payment Instruments Used in a Typical Period, by Type of Instrument and Transaction
Mean number per consume
r
* The 9 available payment instruments include cash, check, traveler's check, money order, debit card, credit card, prepaid card, OBBP, and BANP.
NOTES: Superscript "r" denotes that numbers in the column may have been revised since the last time they were published. Numbers in italics are not
comparable across years due to changes in the survey questionnaire or methodology. Numbers may not sum exactly due to rounding or missing values. The
notation "na" indicates that the estimate is not available.
† Traveler's check is not accepted as a payment instrument for bill payments.
Survey of Consumer Payment Choice Version of November 2013
T-26
©2008–2013 Federal Reserve Bank of Boston

2010 Survey of Consumer Payment Choice
Percentage of consumers 2008ʳ 2009ʳ 2010
Lost or stolen in
p
ast 12 months na na 13.2
Cash............................................................................................................................................ na na 7.3
Checks......................................................................................................................................... na na 1.5
Credit card................................................................................................................................... na na 3.6
Debit card.................................................................................................................................... na na 4.7
Percentage of adopters 2008ʳ 2009ʳ 2010
Lost or stolen in
p
ast 12 months na na 13.3
Cash............................................................................................................................................ na na 7.3
Checks......................................................................................................................................... na na 1.6
Credit card................................................................................................................................... na na 5.2
Debit card.................................................................................................................................... na na 6.1
Mean dollar value* (adopters) 2008ʳ 2009ʳ 2010
Amount lost or stolen in
p
ast 12 month
s
Cash............................................................................................................................................ na na 391
Amount of fraudulent char
g
es in
p
ast 12 months†
Checks......................................................................................................................................... na na 40
Credit card................................................................................................................................... na na 600
Debit card.................................................................................................................................... na na 370
NOTES: Superscript "r" denotes that numbers in the column may have been revised since the last time they were published. Numbers in italics are not
comparable across years due to changes in the survey questionnaire or methodology. Numbers may not sum exactly due to rounding or missing values. The
notation "na" indicates that the estimate is not available. Dollar values are not adjuted for inflation.
* Amount reported is the total amount of loss or fraud over the past 12 months among consumers who experienced loss, theft, or fraud.
Table 27
Loss, Theft, or Fraudulent Use of Payment Instrument
† The amount of fraudulent charges may not be the actual amount of the loss borne by consumers. Actual consumer loss depends on the policies of
depository institutions and card network agreements.
Survey of Consumer Payment Choice Version of November 2013
T-27
©2008–2013 Federal Reserve Bank of Boston

2010 Survey of Consumer Payment Choice
2008
r
Most
Important
2nd Most 3rd Most 4th Most 5th Most
Least
Important
Characteristics
Acceptance for payment........................................................
9.9 na na na na 5.6
Acquisition and setup............................................................
0.4 na na na na 41.4
Control over payment timing.................................................
10.5 na na na na 19.8
Cost.......................................................................................
10.1 na na na na 5.1
Ease of use.............................................................................
27.5 na na na na 4.8
Payment records....................................................................
5.7 na na na na 4.3
Payment speed.......................................................................
3.9 na na na na 17.9
Security.................................................................................
31.9 na na na na 1.0
2009
r
Most
Important
2nd Most 3rd Most 4th Most 5th Most
Least
Important
Characteristic
s
Acceptance for payment........................................................
22.8 24.0 25.1
na na
27.6
Convenience..........................................................................
27.8 25.7 25.2
na na
20.6
Cost.......................................................................................
26.2 27.1 21.8
na na
24.4
Security.................................................................................
55.1 24.7 13.8
na na
5.7
2010
Most
Important
2nd Most 3rd Most 4th Most 5th Most
Least
Important
Characteristic
s
Acceptance for payment........................................................
21.5 19.2 19.9 15.9 12.7 10.0
Acquisition and setup............................................................
9.2 9.7 10.3 15.0 19.7 35.4
Convenience..........................................................................
27.1 21.0 18.6 16.3 10.9 5.3
Cost.......................................................................................
23.7 22.5 14.9 16.9 12.3 8.9
Payment records....................................................................
15.0 16.4 17.9 19.8 16.8 13.3
Security.................................................................................
47.3 23.2 13.3 8.9 5.1 1.4
Table 28
Importance Rankings of Characteristics of Payment Instruments
Percentage of consumers
NOTES: Superscript "r" denotes that numbers in the section may have been revised since the last time they were published. Numbers in italics are not
comparable across years due to changes in the survey questionnaire or methodology. Numbers may not sum exactly due to rounding or missing values. The
notation "na" indicates that the estimate is not available. Each survey asked about a different set of characteristics, as indicated in this table.
Survey of Consumer Payment Choice Version of November 2013
T-28
©2008–2013 Federal Reserve Bank of Boston

2010 Survey of Consumer Payment Choice
Rarely Accepted
Occasionally
Accepted
Often
Accepted
Usually Accepted
Almost Always
Accepted
Cash
2008
r
…………………………….
1.9 3.1 8.3 11.0 75.7
2009
r
…………………………….
2.9 1.8 8.2 11.4 75.8
2010…………………………….. 2.4 1.6 7.4 13.1 75.4
Check
2008
r
…………………………….
1.7 12.7 31.6 37.1 16.9
2009
r
…………………………….
5.0 15.3 27.4 33.8 18.5
2010…………………………….. 2.9 14.3 32.3 33.9 16.6
Debit card
2008
r
…………………………….
1.7 2.5 12.9 38.2 44.7
2009
r
…………………………….
2.9 0.9 12.7 31.7 51.8
2010…………………………….. 1.2 1.4 10.2 36.2 50.9
Credit card
2008
r
…………………………….
1.7 0.1 7.9 32.5 57.7
2009
r
…………………………….
3.0 0.9 7.4 29.6 59.2
2010…………………………….. 1.5 1.4 6.3 32.2 58.5
Prepaid card
2008
r
…………………………….
3.9 9.7 23.5 30.5 32.4
2009
r
…………………………….
4.9 6.7 24.0 31.8 32.6
2010…………………………….. 3.8 8.5 25.4 31.2 31.1
Bank account number payment*
2008
r
…………………………….
13.5 19.5 25.9 21.4 19.7
2009
r
…………………………….
30.2 22.0 22.2 13.7 11.9
2010…………………………….. 28.8
22.8
24.9 14.2 9.2
Online banking bill payment*
2008
r
…………………………….
13.5 19.5 25.9 21.4 19.7
2009
r
…………………………….
10.3 9.4 26.6 26.1 27.6
2010…………………………….. 9.5 10.2 26.6 27.3 26.3
Table 29A
Assessments of Payment Instruments: Acceptance for Paymen
t
Percentage of consumers
* In 2008 respondents were asked to assess "electronic deduction." In the 2009 and 2010 SCPC, we disaggregated the rating of electronic deduction into
"bank account number payment" and "online banking bill payment".
NOTES: Superscript "r" denotes that numbers in the row may have been revised since the last time they were published. Numbers in italics are not
comparable across years due to changes in the survey questionnaire or methodology. Numbers may not sum exactly due to rounding or missing values.
Survey of Consumer Payment Choice Version of November 2013
T-29
©2008–2013 Federal Reserve Bank of Boston

2010 Survey of Consumer Payment Choice
Ver
y
Hard to Get
or Set Up
Hard to Get or
Set up
Neither Hard nor
Easy
Eas
y
to Get or Set
Up
Very Easy to Get
or Set Up
Cash
2008
r
…………………………….
2.4 5.3 13.5 18.0 60.7
2009……………………………. na na na na na
2010…………………………….. 2.0 5.5 13.3 20.6 58.7
Check
2008
r
…………………………….
2.8 9.0 21.5 47.6 19.2
2009……………………………. na na na na na
2010…………………………….. 2.1 7.8 25.4 38.3 26.3
Debit card
2008
r
…………………………….
1.6 4.6 22.6 46.9 24.3
2009……………………………. na na na na na
2010…………………………….. 1.8 4.1 19.7 41.3 33.1
Credit card
2008
r
…………………………….
4.5 8.1 22.1 43.0 22.3
2009……………………………. na na na na na
2010…………………………….. 5.0 10.4 20.3 36.8 27.5
Pre
p
aid car
d
2008
r
…………………………….
5.0 13.8 33.3 31.5 16.4
2009……………………………. na na na na na
2010…………………………….. 5.4 13.7 35.7 26.3 18.8
Bank account number
p
a
y
ment
*
2008
r
…………………………….
4.8 17.8 27.7 36.2 13.6
2009……………………………. na na na na na
2010…………………………….. 4.9 14.8 31.8 28.6 20.0
Online bankin
g
bill
p
a
y
ment
*
2008
r
…………………………….
4.8 17.8 27.7 36.2 13.6
2009……………………………. na na na na na
2010…………………………….. 6.0 13.5 29.6 28.2 22.6
Table 29B
Assessments of Payment Instruments: Acquisition and Setup
Percentage of consumers
* In 2008 respondents were asked to assess "electronic deduction." In the 2009 and 2010 SCPC, we disaggregated the rating of electronic deduction into
"bank account number payment" and "online banking bill payment".
NOTES: Superscript "r" denotes that numbers in the row may have been revised since the last time they were published. Numbers in italics are not
comparable across years due to changes in the survey questionnaire or methodology. Numbers may not sum exactly due to rounding or missing values. The
notation "na" indicates that the estimate is not available.
Survey of Consumer Payment Choice Version of November 2013
T-30
©2008–2013 Federal Reserve Bank of Boston

2010 Survey of Consumer Payment Choice
Very Low
Control
Low Control
Neither Low nor
High Control
High Control
Very High
Control
Cash
2008
r
…………………………….
10.0 9.7 13.7 16.4 50.2
2009……………………………. na na na na na
2010…………………………….. na na na na na
Check
2008
r
…………………………….
6.0 24.8 26.4 30.1 12.7
2009……………………………. na na na na na
2010…………………………….. na na na na na
Debit card
2008
r
…………………………….
7.5 12.3 20.5 36.3 23.4
2009……………………………. na na na na na
2010…………………………….. na na na na na
Credit car
d
2008
r
…………………………….
5.8 14.2 22.0 38.5 19.6
2009……………………………. na na na na na
2010…………………………….. na na na na na
Pre
p
aid car
d
2008
r
…………………………….
10.4 13.0 32.2 25.9 18.5
2009……………………………. na na na na na
2010…………………………….. na na na na na
Electronic deduction
*
2008
r
…………………………….
8.6 11.9 21.9 29.2 28.4
2009……………………………. na na na na na
2010…………………………….. na na na na na
Table 29C
Assessments of Payment Instruments: Control Over Payment Timin
g
Percentage of consumers
* In 2008 respondents were asked to assess "electronic deduction." In the 2009 and 2010 SCPC, we disaggregated the rating of electronic deduction into
"bank account number payment" and "online banking bill payment."
NOTES: Superscript "r" denotes that numbers in the row may have been revised since the last time they were published. Numbers in italics are not
comparable across years due to changes in the survey questionnaire or methodology. Numbers may not sum exactly due to rounding or missing values. The
notation "na" indicates that the estimate is not available.
Survey of Consumer Payment Choice Version of November 2013
T-31
©2008–2013 Federal Reserve Bank of Boston

2010 Survey of Consumer Payment Choice
Very
Inconvenient
Inconvenient
Neither
Inconvenient nor
Convenient
Convenient Very Convenient
Cash
2008
r
…………………………….
1.5 7.8 16.8 24.9 49.0
2009
r
…………………………….
3.0 5.8 14.3 20.8 56.1
2010…………………………….. 5.5 9.9 14.7 25.8 44.0
Check
2008
r
…………………………….
2.4 20.3 28.1 35.4 13.9
2009
r
…………………………….
4.9 15.3 28.0 30.8 20.9
2010…………………………….. 10.3 23.7 21.8 28.7 15.5
Debit card
2008
r
…………………………….
2.0 2.5 15.1 31.8 48.5
2009
r
…………………………….
2.3 2.3 12.8 29.3 53.3
2010…………………………….. 3.1 2.4 10.3 30.2 54.0
Credit car
d
2008
r
…………………………….
1.5 2.7 10.8 33.1 51.9
2009
r
…………………………….
2.6 1.9 10.2 29.7 55.6
2010.................................................. 3.7 2.8 9.6 30.3 53.6
Pre
p
aid car
d
2008
r
…………………………….
4.5 8.5 33.1 25.6 28.2
2009
r
…………………………….
5.0 9.9 31.1 24.6 29.5
2010…………………………….. 9.1 14.9 28.2 24.3 23.5
Bank account number
p
a
y
men
t
2008
r
…………………………….
5.9 10.3 28.0 27.9 27.9
2009
r
…………………………….
12.6 20.8 30.9 19.8 16.0
2010…………………………….. 15.5 21.2 30.0 19.4 13.9
Online bankin
g
bill
p
a
y
men
t
2008
r
…………………………….
5.9 10.3 28.0 27.9 27.9
2009
r
…………………………….
6.6 7.6 25.7 27.3 32.9
2010…………………………….. 6.2 6.7 18.5 27.0 41.6
* In 2008, the survey referred to this concept as "Ease of use". The numbers are not directly comparable due to differences in the definitions of "Ease of
use" and "Convenience."
NOTES: Superscript "r" denotes that numbers in the row may have been revised since the last time they were published. Numbers in italics are not
comparable across years due to changes in the survey questionnaire or methodology. Numbers may not sum exactly due to rounding or missing values.
Table 29D
Assessments of Payment Instruments: Convenience*
Percentage of consumers
Survey of Consumer Payment Choice Version of November 2013
T-32
©2008–2013 Federal Reserve Bank of Boston

2010 Survey of Consumer Payment Choice
Very High Cost High Cost
Neither High nor
Low Cost
Low Cost Very Low Cost
Cash
2008
r
…………………………….
1.5 4.9
17.9
8.3 67.5
2009
r
…………………………….
1.4 2.7
14.8
9.2 71.9
2010…………………………….. 0.7 2.0 16.3 9.5 71.5
Check
2008
r
…………………………….
1.7 13.1 21.7 41.4 22.1
2009
r
…………………………….
2.3 7.7 21.8 37.6 30.5
2010…………………………….. 1.7 6.7 21.5 42.3 27.8
Debit card
2008
r
…………………………….
2.3 10.5 24.4 31.2 31.7
2009
r
…………………………….
2.7 8.1 23.5 30.0 35.7
2010…………………………….. 1.6 7.0 22.3 34.5 34.6
Credit car
d
2008
r
…………………………….
21.0 32.7 16.1 17.7 12.6
2009
r
…………………………….
23.5 31.3 16.0 14.1 15.1
2010…………………………….. 18.2 28.1 19.5 17.8 16.4
Pre
p
aid car
d
2008
r
…………………………….
4.7 16.3 44.5 17.4 17.1
2009
r
…………………………….
5.0 13.9 36.5 23.2 21.4
2010…………………………….. 4.4 14.1 37.6 22.1 21.8
Bank account number
p
a
y
ment
*
2008
r
…………………………….
3.2 9.8 31.2 23.2 32.6
2009
r
…………………………….
4.6 6.0 35.0 24.5 29.8
2010…………………………….. 3.1 5.0 38.7 23.2 30.0
Online bankin
g
bill
p
a
y
ment
*
2008
r
…………………………….
3.2 9.8 31.2 23.2 32.6
2009
r
…………………………….
3.2 6.9 27.3 25.1 37.5
2010…………………………….. 2.7 4.2 28.5 25.1 39.4
NOTES: Superscript "r" denotes that numbers in the row may have been revised since the last time they were published. Numbers in italics are not
comparable across years due to changes in the survey questionnaire or methodology. Numbers may not sum exactly due to rounding or missing values.
* In 2008 respondents were asked to assess "electronic deduction." In the 2009 and 2010 SCPC, we disaggregated the rating of electronic deduction into
"bank account number payment" and "online banking bill payment."
Table 29E
Assessments of Payment Instruments: Cos
t
Percentage of consumers
Survey of Consumer Payment Choice Version of November 2013
T-33
©2008–2013 Federal Reserve Bank of Boston

2010 Survey of Consumer Payment Choice
Very Poor
Records
Poor Records
Neither Good
nor Poor
Good Records
Very Good
Records
Cash
2008
r
…………………………….
31.1 22.6 23.7 12.0 10.6
2009.……………………………. na na na na na
2010…………………………….. 36.8 21.6 20.8 10.7 10.2
Check
2008
r
…………………………….
1.0 5.2 11.6 46.2 36.0
2009.……………………………. na na na na na
2010…………………………….. 0.6 3.1 11.0 46.2 39.0
Debit card
2008
r
…………………………….
2.9 5.5 18.5 40.2 32.9
2009.……………………………. na na na na na
2010…………………………….. 1.7 4.0 13.1 41.7 39.5
Credit car
d
2008
r
…………………………….
0.9 4.3 10.1 40.2 44.4
2009.……………………………. na na na na na
2010…………………………….. 1.3 2.7 8.5 38.1 49.3
Pre
p
aid car
d
2008
r
…………………………….
11.9 20.5 40.5 13.8 13.3
2009.……………………………. na na na na na
2010…………………………….. 19.6 18.7 34.7 16.8 10.2
Bank account number
p
a
y
ment
*
2008
r
…………………………….
2.8 6.9 21.6 33.0 35.8
2009.……………………………. na na na na na
2010…………………………….. 3.2 5.2 21.1 36.9 33.5
Online bankin
g
bill
p
a
y
ment
*
2008
r
…………………………….
2.8 6.9 21.6 33.0 35.8
2009.……………………………. na na na na na
2010…………………………….. 2.2 2.8 14.2 35.9 44.9
* In 2008 respondents were asked to assess "electronic deduction." In the 2009 and 2010 SCPC, we disaggregated the rating of electronic deduction into
"bank account number payment" and "online banking bill payment."
NOTES: Superscript "r" denotes that numbers in the row may have been revised since the last time they were published. Numbers in italics are not
comparable across years due to changes in the survey questionnaire or methodology. Numbers may not sum exactly due to rounding or missing values. The
notation "na" indicates that the estimate is not available.
Table 29F
Assessments of Payment Instruments: Payment Record
s
Percentage of consumers
Survey of Consumer Payment Choice Version of November 2013
T-34
©2008–2013 Federal Reserve Bank of Boston

2010 Survey of Consumer Payment Choice
Very Slow Slow
Neither Slow
nor Fast
Fast Very Fast
Cash
2008
r
…………………………….
1.1 4.9 16.1 22.0 55.9
2009…………………………….. na na na na na
2010…………………………….. na na na na na
Check
2008
r
…………………………….
8.7 30.2 33.0 21.8 6.4
2009…………………………….. na na na na na
2010…………………………….. na na na na na
Debit card
2008
r
…………………………….
2.0 6.0 17.2 40.7 34.1
2009…………………………….. na na na na na
2010…………………………….. na na na na na
Credit car
d
2008
r
…………………………….
2.1 6.8 15.8 42.0 33.3
2009…………………………….. na na na na na
2010…………………………….. na na na na na
Pre
p
aid car
d
2008
r
…………………………….
4.6 6.7 30.3 33.2 25.2
2009…………………………….. na na na na na
2010…………………………….. na na na na na
Electronic deductio
n
2008
r
…………………………….
3.4 9.5 26.8 27.0 33.3
2009…………………………….. na na na na na
2010…………………………….. na na na na na
Table 29G
Assessments of Payment Instruments: Payment Spee
d
Percentage of consumers
NOTES: Superscript "r" denotes that numbers in the row may have been revised since the last time they were published. Numbers in italics are not
comparable across years due to changes in the survey questionnaire or methodology. Numbers may not sum exactly due to rounding or missing values. The
notation "na" indicates that the estimate is not available.
Survey of Consumer Payment Choice Version of November 2013
T-35
©2008–2013 Federal Reserve Bank of Boston

2010 Survey of Consumer Payment Choice
Very Risky Risky
Neither Risky
nor Secure
Secure Very Secure
Cash
2008
r
…………………………….
42.4 15.2 13.2 8.5 20.7
2009
r
…………………………….
32.8 12.1 13.4 10.2 31.5
2010…………………………….. 37.3 16.8 11.9 9.1 24.8
Check
2008
r
…………………………….
12.2 35.1 18.9 25.5 8.2
2009
r
…………………………….
12.3 31.7 18.5 30.1 7.4
2010…………………………….. 7.6 34.4 22.3 26.4 9.2
Debit card
2008
r
…………………………….
13.0 30.9 19.3 28.5 8.3
2009
r
…………………………….
15.4 27.5 19.8 26.7 10.5
2010…………………………….. 9.2 28.6 18.0 32.2 12.1
Credit car
d
2008
r
…………………………….
14.8 29.2 15.0 29.5 11.5
2009
r
…………………………….
17.9 27.4 16.3 27.2 11.2
2010…………………………….. 11.8 26.1 15.3 33.1 13.7
Pre
p
aid car
d
2008
r
…………………………….
25.3 23.7 26.0 16.1 9.0
2009
r
…………………………….
21.6 19.5 25.3 20.2 13.5
2010…………………………….. 21.1 23.2 25.4 18.8 11.5
Bank account number
p
a
y
ment
*
2008
r
…………………………….
10.5 20.3 22.7 26.2 20.3
2009
r
…………………………….
32.3 28.9 17.0 15.0 6.7
2010…………………………….. 23.8 31.0 17.4 18.5 9.2
Online bankin
g
bill
p
a
y
ment
*
2008
r
…………………………….
10.5 20.3 22.7 26.2 20.3
2009
r
…………………………….
16.9 22.6 19.7 26.2 14.6
2010…………………………….. 12.1 20.9 20.1 30.9 16.0
* In 2008 respondents were asked to assess "electronic deduction." In the 2009 and 2010 SCPC, we disaggregated the rating of electronic deduction into
"bank account number payment" and "online banking bill payment."
NOTES: Superscript "r" denotes that numbers in the row may have been revised since the last time they were published. Numbers in italics are not
comparable across years due to changes in the survey questionnaire or methodology. Numbers may not sum exactly due to rounding or missing values.
Table 29H
Assessments of Payment Instruments: Securit
y
Percentage of consumers
Survey of Consumer Payment Choice Version of November 2013
T-36
©2008–2013 Federal Reserve Bank of Boston

2010 Survey of Consumer Payment Choice
Very Risky Risky
Neither Risk
y
nor
Secure
Secure Very Secure
In person
2008…………………………….. na na na na na
2009…………………………….. na na na na na
2010…………………………….. 0.2 2.0 8.5 26.3 63.0
Online
2008…………………………….. na na na na na
2009…………………………….. na na na na na
2010…………………………….. 11.2 25.2 14.6 38.8 10.2
By mail
2008…………………………….. na na na na na
2009…………………………….. na na na na na
2010…………………………….. 7.6 25.7 27.5 34.4 4.9
B
y
p
hone
2008…………………………….. na na na na na
2009…………………………….. na na na na na
2010…………………………….. 9.9 32.3 27.2 25.7 4.9
Mobile
2008…………………………….. na na na na na
2009…………………………….. na na na na na
2010…………………………….. 18.0 37.9 26.3 15.0 2.8
Table 29I
Assessments of Payment Locations: Security
Percentage of consumers
NOTES: Numbers may not sum exactly due to rounding or missing values. The notation "na" indicates that the estimate is not available.
Survey of Consumer Payment Choice Version of November 2013
T-37
©2008–2013 Federal Reserve Bank of Boston

2010 Survey of Consumer Payment Choice
Very Risky Risky
Neither Risk
y
nor
Secure
Secure Very Secure
2008.……………………………. na na na na na
2009.……………………………. na na na na na
2010…………………………….. 5.3 14.9 16.1 40.6 23.2
2008.……………………………. na na na na na
2009.……………………………. na na na na na
2010…………………………….. 3.8 16.6 28.2 37.3 14.1
2008.……………………………. na na na na na
2009.……………………………. na na na na na
2010…………………………….. 41.4 34.3 13.5 7.4 3.4
2008.……………………………. na na na na na
2009.……………………………. na na na na na
2010…………………………….. 20.1 37.5 21.8 17.0 3.6
T
a
bl
e
29K
P
re
f
erre
d
W
ay o
f
A
u
th
or
i
z
i
ng
D
e
bit
C
ar
d
P
aymen
t
s
P
ercen
t
age o
f
consumers
2008 2009 2010
na na 45.9
na na 30.4
na na 19.6
na na 4.2
Table 29J
Assessment of Debit Authorization Mode
Percentage of consumers
NOTES: Numbers may not sum exactly due to rounding or missing values. The notation "na" indicates that the estimate is not available.
NOTES: Numbers may not sum exactly due to rounding or missing values. The notation "na" indicates that the estimate is not available.
Neither one/ I prefer not to enter a PIN or give my signature..............................
Security
PIN debit card
Signature debit card
No PIN and no signature debit card
Usin
g
a debit card onlin
e
Signature..............................................................................................................
Either one is fine/I'm indifferent..........................................................................
PIN......................................................................................................................
Survey of Consumer Payment Choice Version of November 2013
T-38
©2008–2013 Federal Reserve Bank of Boston

2010 Survey of Consumer Payment Choice
2008ʳ 2009ʳ 2010
Gende
r
Male................................................................................................................................... 48.3 48.3 48.4
Female............................................................................................................................... 51.7 51.7 51.6
A
g
e
18–24................................................................................................................................. 9.8 9.2 8.0
25–34................................................................................................................................. 19.7 21.7 22.9
35–44................................................................................................................................. 18.9 17.2 16.7
45–54................................................................................................................................. 20.0 19.4 19.2
55–64................................................................................................................................. 14.9 15.6 16.0
65 and older....................................................................................................................... 16.8 16.8 17.2
Race
W
hi
te................................................................................................................................. 74.2 72.9 73.2
B
l
ac
k
.................................................................................................................................. 16.9 15.6 15.6
As
i
an.................................................................................................................................. 3.8 2.8 2.7
Ot
h
er.................................................................................................................................. 5.1 8.8 8.4
Ethnicit
y
H
i
span
i
c or Lat
i
no............................................................................................................. 9.8 12.8 12.8
Educatio
n
No
hi
g
h
sc
h
oo
l
di
p
l
oma..................................................................................................... 7.6 6.9 5.1
H
i
g
h
sc
h
oo
l
........................................................................................................................ 37.5 38.0 38.9
Some co
ll
ege...................................................................................................................... 28.0 28.0 28.3
Co
ll
ege............................................................................................................................... 14.0 15.2 15.2
P
ost-gra
d
uate stu
d
y............................................................................................................
12
.
9
12
.
0
12
.
5
NOTES: Superscript "r" denotes that numbers in the column may have been revised since the last time they were published. Numbers may not sum
exactly due to rounding or missing values.
Table 30
Demographics: Gender, Age, Race, and Education*
Percentage of consumers
* Estimates are weighted. The table of unweighted sample demographics is available upon request.
Survey of Consumer Payment Choice Version of November 2013
T-39
©2008–2013 Federal Reserve Bank of Boston

2010 Survey of Consumer Payment Choice
2008ʳ 2009ʳ 2010
Household incom
e
Less than $25,000................................................................................................................. 21.0 24.9 24.4
$25,000–$49,999.................................................................................................................. 27.6 27.3 27.4
$50,000–$74,999.................................................................................................................. 17.7 21.1 21.1
$75,000–$99,999.................................................................................................................. 16.3 11.9 12.1
$100,000–$124,999.............................................................................................................. 7.8 5.7 7.4
$125,000 or more................................................................................................................. 9.4 9.1 7.6
$125,000–$199,999........................................................................................................... 6.4 6.2 4.9
$200,000 or more.............................................................................................................. 2.9 2.9 2.7
Res
p
ondent incom
e
Highest in household............................................................................................................ 54.9 48.6 49.5
About equal to highest.......................................................................................................... 11.4 12.9 13.9
2n
d
hi
g
h
est........................................................................................................................... 26.0 25.9 25.4
3r
d
hi
g
h
est or
l
ower.............................................................................................................. 7.7 12.7 11.3
Labor force statu
s
Wor
ki
ng now........................................................................................................................ 69.3 76.3 62.5
Unemp
l
oye
d
an
d
l
oo
ki
ng
f
or wor
k
....................................................................................... 2.1 1.4 9.4
Temporar
il
y
l
a
id
o
ff
, on s
i
c
k
or ot
h
er
l
eave.......................................................................... 0.1 0.3 1.2
D
i
sa
bl
e
d
................................................................................................................................ 3.5 3.2 6.9
Ret
i
re
d
.................................................................................................................................. 18.5 14.7 18.7
Homema
k
er........................................................................................................................... 4.5 2.7 9.5
Ot
h
er..................................................................................................................................... 2.2 1.4 2.9
NOTES: Superscript "r" denotes that numbers in the column may have been revised since the last time they were published. Numbers may not sum exactly
due to rounding or missing values.
Table 31
Income and Labor Force Status*
Percentage of consumers
* Estimates are weighted. The table of unweighted sample demographics is available upon request.
Survey of Consumer Payment Choice Version of November 2013
T-40
©2008–2013 Federal Reserve Bank of Boston

2010 Survey of Consumer Payment Choice
2008ʳ 2009ʳ 2010
Budgeting
All.......................................................................................................................................... 44.9 43.0 44.3
Most...................................................................................................................................... 12.9 13.1 12.6
Shared equally....................................................................................................................... 21.0 23.5 22.5
Some...................................................................................................................................... 14.6 9.7 10.6
None...................................................................................................................................... 6.6 10.6 10.0
Bill payment
All.......................................................................................................................................... 49.9 47.7 48.2
Most...................................................................................................................................... 9.4 10.6 10.6
Shared equally....................................................................................................................... 15.7 14.1 16.3
Some...................................................................................................................................... 14.8 13.6 13.4
None...................................................................................................................................... 10.3 14.0 11.5
Shopping
A
ll
.......................................................................................................................................... 39.3 37.5 37.4
Most...................................................................................................................................... 12.7 14.0 16.1
S
h
are
d
equa
ll
y....................................................................................................................... 26.2 23.8 22.6
Some...................................................................................................................................... 16.3 18.4 17.4
None...................................................................................................................................... 5.5 6.3 6.5
Asset management
A
ll
.......................................................................................................................................... 40.5 36.6 37.5
Most...................................................................................................................................... 11.5 10.1 10.7
S
h
are
d
equa
ll
y....................................................................................................................... 23.4 22.3 23.4
Some...................................................................................................................................... 10.0 9.7 8.8
None...................................................................................................................................... 14.5 21.3 19.6
Table 32
Consumers' Financial Responsibility in the Household
Percentage of consumers
NOTES: Superscript "r" denotes that numbers in the column may have been revised since the last time they were published. Numbers may not sum exactly
due to rounding or missing values.
Survey of Consumer Payment Choice Version of November 2013
T-41
©2008–2013 Federal Reserve Bank of Boston

2010 Survey of Consumer Payment Choice
2008ʳ 2009ʳ 2010
Credit card deb
t
Carried unpaid balance at any time during the past 12 months ............................................ 58.1 39.9 38.7
Mean credit card balance unpaid, previous month (dollars)
Per credit card adopter...................................................................................................... 3,702 4,384 4,149
Per adopter with unpaid balance....................................................................................... 6,392 7,797 7,537
Median credit card balance unpaid, previous month (dollars)
Per credit card adopter...................................................................................................... 94 183 149
Per adopter with unpaid balance....................................................................................... 2,434 3,960 3,230
Change in unpaid balance since a year ago
Much lower........................................................................................................................ 18.2 12.0 13.4
Lower................................................................................................................................. 26.8 26.3 28.8
A
b
out t
h
e same.................................................................................................................. 27.4 30.0 31.7
H
i
g
h
er................................................................................................................................ 17.0 19.8 17.2
Muc
h
hi
g
h
er....................................................................................................................... 10.7 11.9 8.9
Home ownershi
p
Home owners
hi
p rate ........................................................................................................... 72.2 67.3 65.3
Table 33
Selected Assets and Liabilities
Percentage of consumers, except as noted
NOTES: Superscript "r" denotes that numbers in the column may have been revised since the last time they were published. Numbers may not sum exactly
due to rounding or missing values.
Survey of Consumer Payment Choice Version of November 2013
T-42
©2008–2013 Federal Reserve Bank of Boston
