Bureau of Justice Statistics · Statistical Tables
U.S. Department of Justice
Oce of Justice Programs
Bureau of Justice Statistics
November 2023, NCJ 305534
Capital Punishment, 2021 –
Statistical Tables
A
t yearend 2021, a total of 27 states and
the Federal Bureau of Prisons (BOP)
held 2,382 prisoners under sentence of
death, which was 79 (3%) fewer than at yearend
2020 (table 1, gure 1). California (29%),
Florida (14%), and Texas (8%) held more than
half of the prisoners under sentence of death in
the United States on December 31, 2021. e
BOP held 42 prisoners under sentence of death
at yearend.
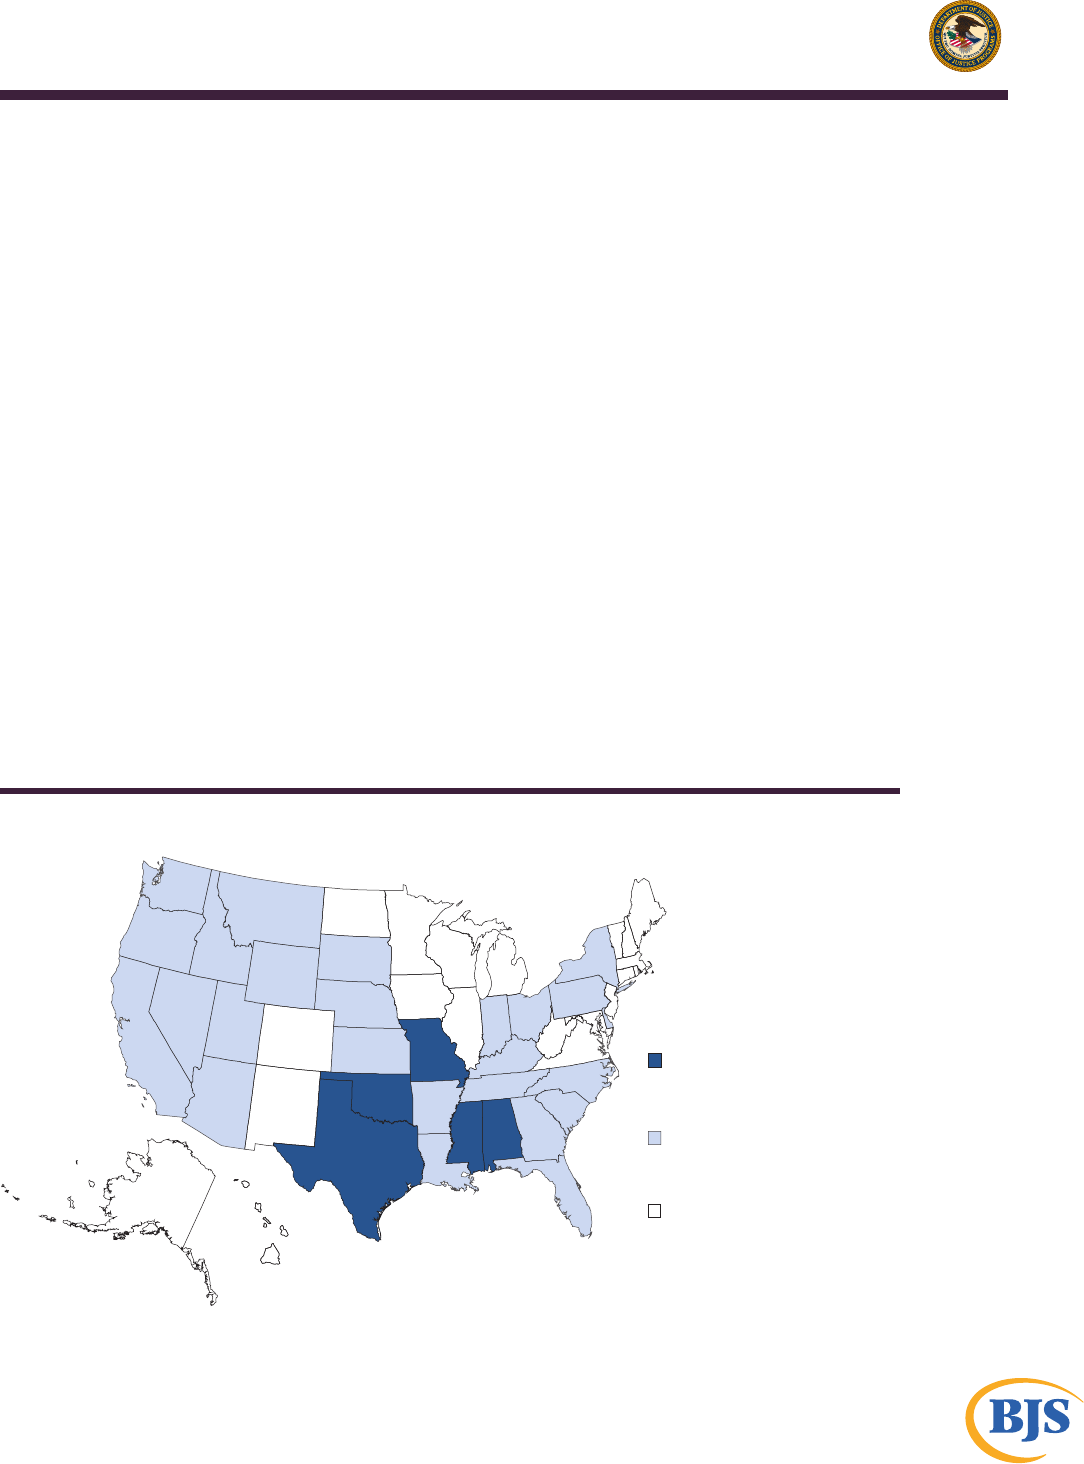
At yearend 2021, 30 states and the federal
government had death penalty statutes (map1).
In July 2021, Virginia abolished the state’s
capital murder oense (see Status of the death
penalty in2021), leaving a total of 20 states and
Tracy L. Snell, BJS Statistician
the District of Columbia with no death penalty
statute in force on December 31, 2021.
MAP 1
States with and without death penalty statutes, yearend 2021
Had the death penalty as of
December 31, 2021 but did not carry
out an execution in 2021
Had no death penalty as of
December 31, 2021
Had the death penalty as of
December 31, 2021 and carried out
an execution in 2021*
Note: See table 2 for details on states that authorized the death penalty.
*Not shown: Federal Bureau of Prisons, which carried out three executions in 2021. See table 1 for executions by jurisdiction.
Source: Bureau of Justice Statistics, National Prisoner Statistics program (NPS-8), 2021.
Five states (Texas, Oklahoma, Missouri,
Alabama, and Mississippi) and the BOP executed
a total of 11 prisoners in 2021. Among the
prisoners executed, 10 were male and 1 was
female (not shown in tables). Texas and the BOP
each executed three prisoners, which accounted
for more than half of the executions carried out
in 2021.
is report presents statistics on prisoners
who were under sentence of death in 2021, a
summary of state and federal death penalty laws
in 2021, and historical trends in executions.

Capital Punishment, 2021 – Statistical Tables | November 2023 2
TABLE 1
Status of the death penalty, December 31, 2021
Executions in 2021 Number of prisoners under sentence of death Jurisdictions with no death penalty (21)
Federal Bureau of Prisons 3 California 690 Alaska
Texas 3 Florida 324 Colorado
Oklahoma 2 Texas 198 Connecticut
Missouri 1 Alabama 169 District of Columbia
Alabama 1 North Carolina 136 Hawaii
Mississippi 1 Ohio 132 Illinois
Arizona 114 Iowa
Pennsylvania 111 Maine
Louisiana 62 Maryland
Nevada 61 Massachusetts
Tennessee 47 Michigan
Oklahoma 44 Minnesota
Federal Bureau of Prisons 42 New Hampshire
Georgia 38 New Jersey
Mississippi 36 New Mexico
South Carolina 34 North Dakota
Arkansas 28 Rhode Island
Kentucky 26 Vermont
Oregon 23 Virginia
Missouri 19 West Virginia
Nebraska 12 Wisconsin
Kansas 9
Idaho 8
Indiana 8
Utah 7
Montana 2
New Hampshire
a
1
South Dakota 1
Total 11 Total
b
2,382
Note: While the Washington Supreme Court has declared the state’s death penalty statute unconstitutional as applied (State v. Gregory, 192 Wash.
2d 1, 427 P.3d 621 (2018)), no legislative action has been taken to revise or repeal the statute. The state continues to report that the death penalty is
authorized. See table 2 for information on statutes.
a
New Hampshire repealed the death penalty eective May 30, 2019. As of December 31, 2021, one male prisoner remained under a previously
imposed sentence of death.
b
New York, Delaware, Washington, and Wyoming held no inmates under sentence of death on December 31, 2021.
Source: Bureau of Justice Statistics, National Prisoner Statistics program (NPS-8), 2021.

Capital Punishment, 2021 – Statistical Tables | November 2023 3
Terms and definitions
Aggravating factors—Specic elements of a crime
dened by statute. When present, these factors may
allow a jury to impose a death sentence for a person
convicted of a capital oense. Sometimes these are also
called aggravating circumstances.
Capital conviction—A formal declaration that a
defendant is guilty of a capital oense, made by the
verdict of a jury, the decision of a judge, or a guilty plea
by the defendant in a court of law.
Capital oense—A criminal oense punishable by
death. Oenses that are eligible for a death sentence are
dened by statute in each jurisdiction that authorizes
capital punishment. The most common is rst-degree
murder accompanied by at least one aggravating factor.
Capital punishment—The process of sentencing
convicted oenders to death for the most serious crimes
and carrying out that sentence. The specic oenses and
circumstances that determine whether a crime is eligible
for a death sentence are dened by statute and are
prescribed by the U.S. Congress or a state legislature.
Capital statute—State or federal laws dictating
specic crimes that are eligible for a death sentence
and specic procedures to be followed in carrying out
such sentences.
Civil authority—The state or federal entity responsible
for implementing and enforcing capital punishment
laws, excluding military authorities.
Commutation—Reduction of a death sentence by
the president (federal) or by a governor or a board of
advisors empaneled to review sentences (state). Criteria
for granting a commutation vary by state. The new
sentence can be to life or a term of years.
Death row—A slang term that originally referred to
the area of a prison in which prisoners under sentence
of death were housed. Usage of the term “death row”
continues despite the fact that many states do not
maintain a separate unit or facility for prisoners under
sentence of death.
Received under sentence of death—The admission of
a person to prison after being sentenced to death by
acourt.
Removal from under sentence of death—The removal
of a prisoner from the count of prisoners under
sentence because the sentence is no longer in eect.
A prisoner can be relieved of a death sentence by
several methods: execution, death by causes other
than execution, commutation, an overturned capital
conviction or sentence, or a change in the statute
dening capital punishment.
Sentence of death—A sentence imposed by a court for
a capital oense that authorizes the state to execute a
convicted oender.

Capital Punishment, 2021 – Statistical Tables | November 2023 4
List of tables
TABLE 1. Status of the death penalty, December31, 2021
TABLE 2. Capital oenses, by state, 2021
TABLE 3. Federal capital oenses, 2021
TABLE 4. Authorized method of execution, by state, 2021
TABLE 5. Prisoners under sentence of death, by region, jurisdiction, and race, 2020 and 2021
TABLE 6. Demographic characteristics of prisoners under sentence of death, 2021
TABLE 7. Female prisoners under sentence of death, by region, jurisdiction, and race, 2020 and2021
TABLE 8. Hispanic prisoners under sentence of death, by region and jurisdiction, 2020 and2021
TABLE 9. Criminal history of prisoners under sentence of death, by race or ethnicity, 2021
TABLE 10. Prisoners under sentence of death on December 31, 2021, by year of sentencing and
jurisdiction
TABLE 11. Prisoners removed from under sentence of death, by region, jurisdiction, and method of
removal, 2021
TABLE 12. Average elapsed time between sentencing and execution, 1977–2021
TABLE 13. Number of executions, by jurisdiction, 1930–2021 and 1977–2021
List of gures
MAP 1. States with and without death penalty statutes, yearend 2021
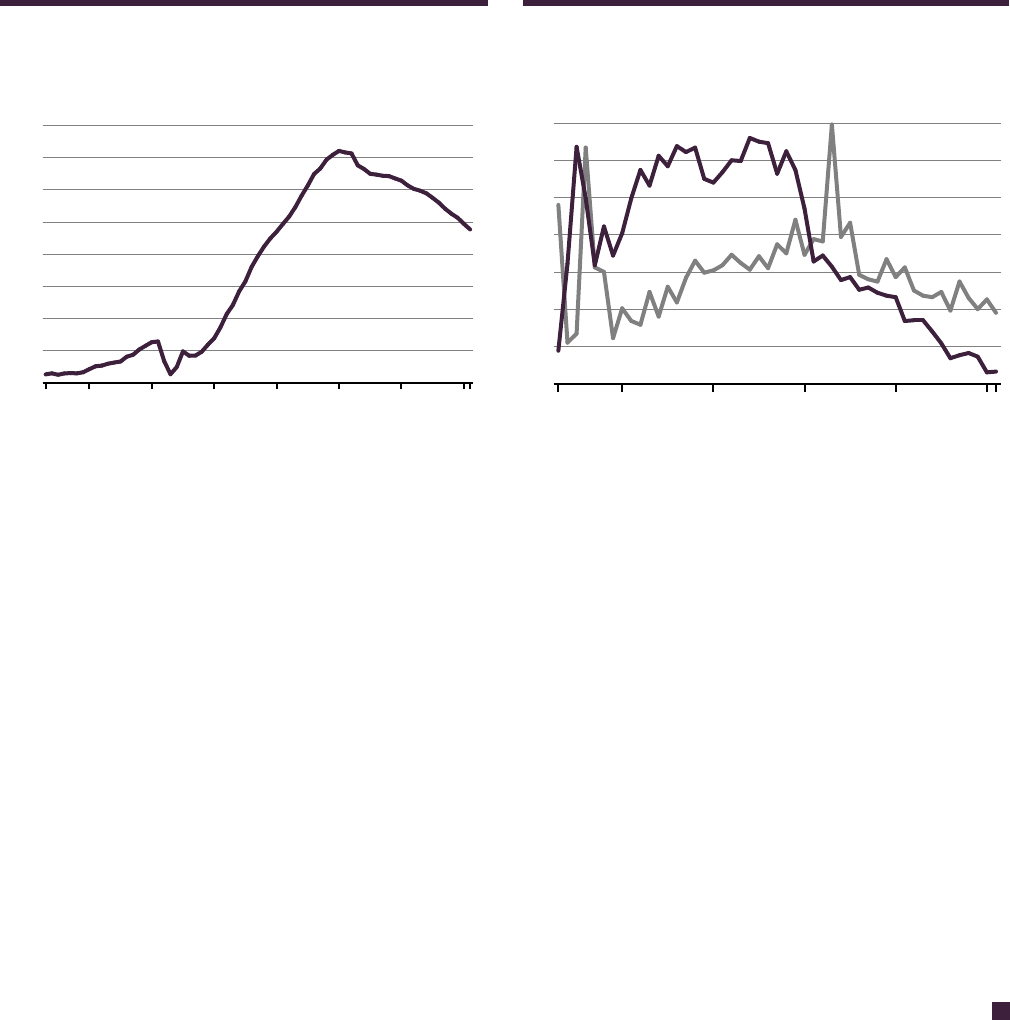
FIGURE 1. Number of prisoners under sentence of death, 1953–2021
FIGURE 2. Admissions to and removals from under sentence of death, 1973–2021
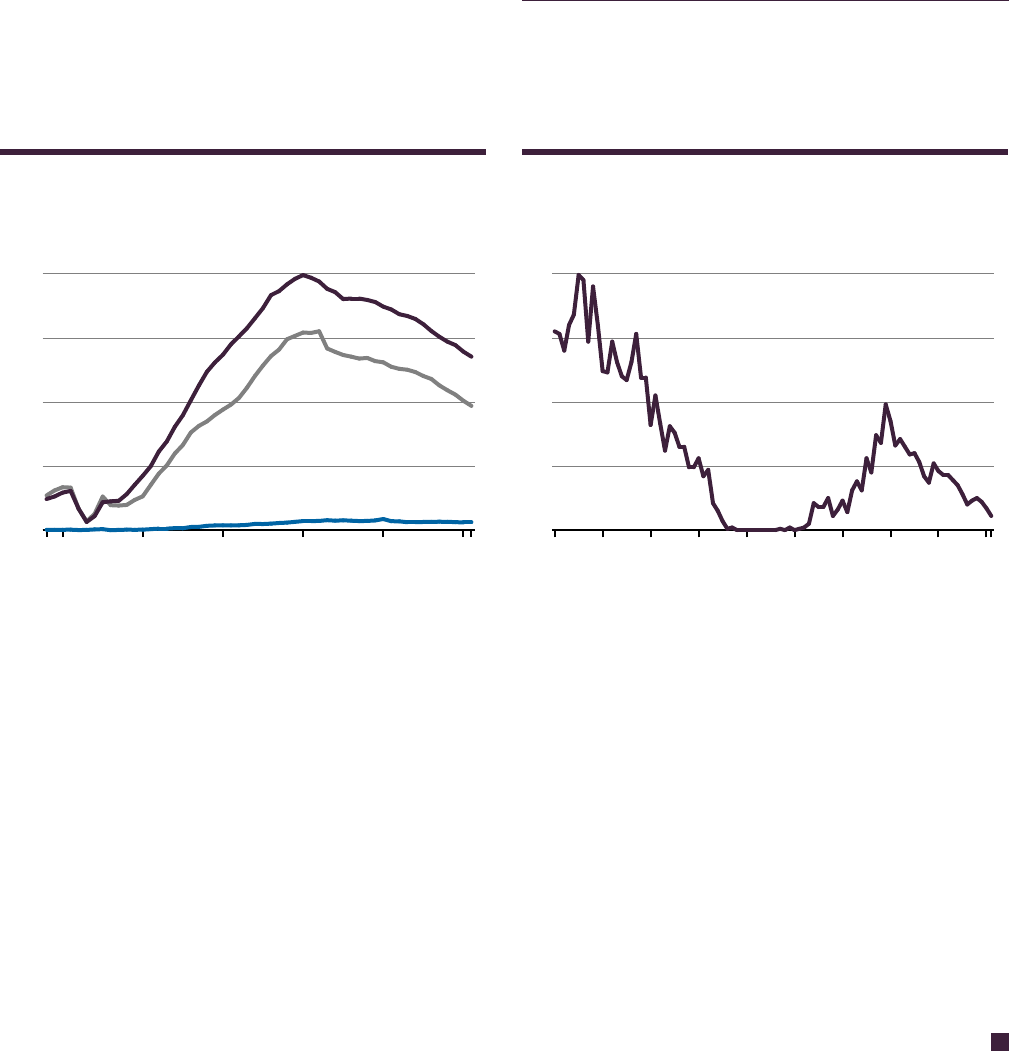
FIGURE 3. Number of prisoners under sentence of death, by race, 1968–2021
FIGURE 4. Number of prisoners executed in the United States, 1930–2021
FIGURE 5. Advance count of executions, January 1, 2022–December 31, 2022
List of appendix tables
APPENDIX TABLE 1. Number of prisoners executed, by race or ethnicity, 1977–2021
APPENDIX TABLE 2. Number of executions, by method and jurisdiction, 1977–2021
APPENDIX TABLE 3. Counts for gure 1: Number of prisoners under sentence of death, 1953–2021
APPENDIX TABLE 4. Counts for gure 2: Admissions to and removals from under sentence of death,
1973–2021
APPENDIX TABLE 5. Counts for gure 3: Number of prisoners under sentence of death, by race,
1968–2021
APPENDIX TABLE 6. Counts for gure 4: Number of prisoners executed in the United States, 1930–2021
Capital Punishment, 2021 – Statistical Tables | November 2023 5
Key findings
During 2021, the number of prisoners under sentence
of death declined for the 21st consecutive year
(gure1). (See Status of the death penalty in 2021.)
A total of 16 prisoners were received under sentence
of death in 2021, one more than was reported in 2020
(gure 2).
Twenty states and the Federal Bureau of Prisons (BOP)
removed a total of 84 prisoners from under sentence of
death by means other than execution in 2021 (table 5).
Among jurisdictions with prisoners under sentence of
death at yearend 2021, 19 states and the BOP reported
a decrease in the number of prisoners held under
sentence of death, 8 states reported no change, and no
states reported an increase in the number of prisoners
held under sentence of death. Four states held no
prisoners under sentence of death during 2021.
The largest declines in the number of prisoners under
sentence of death in 2021 occurred in California (down
14 prisoners) and Florida (down 11).
Almost all (98%) prisoners under sentence of death
were male (table 6).
Among prisoners under sentence of death at yearend
2021 with a known ethnicity, about 16% were Hispanic.
FIGURE 1
Number of prisoners under sentence of death,
1953–2021
Number
0
500
1
,000
1
,500
2
,000
2
,500
3
,000
3
,500
4
,000
2020-21 2010200019901980197019601953
Note: Data on the number of prisoners under sentence of death at
yearend have been collected since 1953. See appendix table 3
for counts.
Source: Bureau of Justice Statistics, National Prisoner Statistics program
(NPS-8), 1953–2021.
FIGURE 2
Admissions to and removals from under sentence of
death, 1973–2021
Number
0
50
100
150
200
250
300
350
2020-2120102000199019801973
Removals
Admissions
Note: Removals can be due to any cause, including execution, other
death, or appeal. See appendix table 4 for counts.
Source: Bureau of Justice Statistics, National Prisoner Statistics program
(NPS-8), 1973–2021.
Continued on next page
Capital Punishment, 2021 – Statistical Tables | November 2023 6
Key findings (continued)
At yearend 2021, 1,353 (57%) prisoners under
sentence of death were white and 969 (41%) were
black (gure 3).
At yearend 2021, 14 states held 50 female prisoners
under sentence of death, one fewer than was reported
in 2020 (table 7).
Eighteen states and the BOP held 336 Hispanic
prisoners under sentence of death at yearend 2021
(table 8).
Among prisoners under sentence of death on
December 31, 2021 with a known criminal history, two-
thirds (68%) had a prior felony conviction (table 9).
Prisoners under sentence of death on December31,
2021 had been on death row for an average of
20.2years (table 10).
Fifteen states and the BOP reported 45 prisoners whose
convictions or sentences were vacated or overturned
during 2021 (table 11).
Prisoners executed during 2021 had been on death row
for an average of 19.4 years (table 12).
Between 1977 and yearend 2021, 34 states and
the federal government executed 1,540 prisoners
(table13).
1
Between 1930, when the federal government began
collecting annual execution statistics, and yearend
2021, a total of 5,393 persons were executed under civil
authority (table13, gure 4).
2
1
Following the U.S. Supreme Court’s 1976 approval of revised
statutes in some states (Gregg v. Georgia and its companion cases),
executions of inmates resumed in 1977.
2
Military authorities carried out an additional 160 executions
between 1930 and 1961, which are not included in this report.
FIGURE 3
Number of prisoners under sentence of death, by race,
1968–2021
Number
0
500
1
,000
1
,500
2
,000
2021201020001990198019701968
All other races
a,b
Black
a
White
a
Note: Data on Hispanic origin was not collected prior to 1977.
Seeappendix table 5 for counts.
a
Includes prisoners of Hispanic origin.
b
Includes American Indian or Alaska Native prisoners; Asian, Native
Hawaiian, or Other Pacic Islander prisoners; and prisoners for whom
only ethnicity was identied.
Source: Bureau of Justice Statistics, National Prisoner Statistics program
(NPS-8), 1968–2021.
FIGURE 4
Number of prisoners executed in the United States,
1930–2021
Executions
0
50
100
150
200
2021
201020001990198019701960195019401930
Note: Excludes 160 executions carried out by military authorities from
1930 to 1961. See appendix table 6 for counts.
Source: Bureau of Justice Statistics, National Prisoner Statistics program
(NPS-8), 1930–2021.

Capital Punishment, 2021 – Statistical Tables | November 2023 7
Status of the death penalty in 2021
As of December 31, 2021, a total of 30 states and the
federal government authorized the death penalty
(tables 2 and 3). While the Washington Supreme
Court declared the state death penalty statute
unconstitutional, as applied, on October 11, 2018 (State
v. Gregory, 192 Wash. 2d 1, 427 P.3d 621 (2018)), the
Washington state legislature has neither revised nor
repealed the statute.
In 2019, New Hampshire repealed the death penalty
(HB 455), eective May 30, 2019. The repeal did not
aect previously imposed death sentences, and as of
December 31, 2021, New Hampshire held one male
prisoner under sentence of death.
In 2021, the Virginia legislature repealed the death
penalty, replacing the crime of capital murder with
aggravated murder (2021 Va. Acts chs. 344, 345, Spec.
Sess. I). The amended law provided that all prisoners
under previously imposed death sentences (2) would
have their sentences changed to life imprisonment
without the possibility of parole, eective July 1, 2021.
Oregon recently revised the denition of aggravated
murder (Or. Laws 2019, ch. 365), which substantially
reduced the scope of oenses eligible for the death
penalty. (See Status of the death penalty in 2019 in Capital
Punishment, 2019 – Statistical Tables (NCJ 300381, BJS,
June 2021).) On October 7, 2021, the Oregon Supreme
Court ruled that the change in the law may be applied
retroactively (State v. Bartol, 368 Or 598 (2021)). As a
result, prisoners sentenced to death prior to September
2019 may be entitled to have their death sentences
vacated since those sentences are now in violation of
Article 1, Section 16 of the Oregon Constitution.
During 2021, Ohio amended its code of criminal
procedure to prohibit imposition of the death penalty
for aggravated murder when the oender had a
serious mental illness at the time of the oense (O.R.C.
§ 2929.025). An oender who has been diagnosed
with schizophrenia, schizoaective disorder, bipolar
disorder, and/or delusional disorder and proves that the
condition(s) impaired the oender’s capacity at the time
of the oense will be sentenced to life imprisonment
without parole if convicted. The amendments became
eective April 12, 2021.
South Carolina amended its death penalty statute to
authorize a ring squad as a method of execution (S.C.
Code § 24-3-530), eective May 14, 2021.
Tennessee established a mechanism to allow
defendants who were sentenced to death prior to the
statute’s enactment date and whose conviction is nal
on direct review to petition the trial court to determine
if the defendant is intellectually disabled (Tenn. Code
Ann. § 39-13-203). The change became eective
May18,2021.
Authorized methods of execution in 2021
Methods of execution are dened by statute and
vary by jurisdiction. In 2021, all 30 states with a death
penalty statute authorized lethal injection as a method
of execution (table 4). Fourteen states also authorized
an alternative method of execution: electrocution
(8states), ring squad (4), lethal gas (3), nitrogen
hypoxia (3), and hanging (2).
In states that authorized multiple methods of
execution, the condemned prisoner usually selected
the method. Five states (Arizona, Arkansas, Kentucky,
Tennessee, and Utah) stipulated which method must
be used depending on the date of either the oense or
sentencing. Six states authorized alternative methods
if lethal injection was ruled to be unconstitutional:
Arkansas authorized electrocution; Delaware authorized
hanging; Mississippi and Oklahoma authorized
electrocution, ring squad, or nitrogen hypoxia; Utah
authorized ring squad; and Wyoming authorized
lethal gas.
Federal prisoners are executed by lethal injection,
pursuant to 28 C.F.R. Part 26. For oenses prosecuted
under the federal Violent Crime Control and Law
Enforcement Act of 1994, the law of the state in which
the conviction took place determines the method used
(18 U.S.C. § 3596).
Continued on next page

Capital Punishment, 2021 – Statistical Tables | November 2023 8
Status of the death penalty in 2021 (continued)
Note: New Hampshire repealed its death penalty eective May 30, 2019. One man remains under a previously imposed sentence of death.
a
The Delaware Supreme Court held that a portion of Delaware’s death penalty sentencing statute (11 Del. C. § 4209) was unconstitutional (Rauf
v. State, 145 A.3d 430 (Del. 2016)). No legislative action has been taken to amend the statute. As a result, capital cases are no longer pursued in
Delaware.
b
The New York Court of Appeals held that a portion of New York’s death penalty sentencing statute (C.P.L. 400.27) was unconstitutional (People
v. Taylor, 9 N.Y.3d 129 (2007)). No legislative action has been taken to amend the statute. As a result, capital cases are no longer pursued in New
York.
c
The Washington Supreme Court has declared the state’s death penalty statute unconstitutional as applied (State v. Gregory, 192 Wash. 2d 1, 427
P.3d 621 (2018)). No legislative action has been taken to revise or repeal the statute.
Source: Bureau of Justice Statistics, National Prisoner Statistics program (NPS-8), 2021.
TABLE 2
Capital offenses, by state, 2021
State Oense
Alabama Intentional murder (Ala. Stat. Ann. § 13A-5-40(a)(1)-(21)) with 14 aggravating factors (Ala. Stat. Ann. § 13A-5-49).
Arizona First-degree murder, including premeditated murder and felony murder, accompanied by at least 1 of 10 aggravating
factors (A.R.S. § 13-703(F)).
Arkansas Capital murder (Ark. Code Ann. § 5-10-101) with a nding of at least 1 of 10 aggravating circumstances; and treason
(Ark. Code Ann. § 5-51-201).
California First-degree murder with special circumstances; military sabotage; trainwreck causing death; treason; perjury
resulting in the execution of an innocent person; and fatal assault by a prisoner serving a life sentence.
Delaware
a
First-degree murder (11 Del. C. § 636) with at least 1 statutory aggravating circumstance (11 Del. C. § 4209).
Florida First-degree murder, dened as premeditated murder, felony murder, and death resulting from capital drug-
tracking felonies (Fla Stat. § 782.04(1)(a)) accompanied by aggravating factors (Fla Stat. § 921.141(6)).
Georgia Murder with aggravating circumstances; rape, armed robbery, or kidnapping with bodily injury or ransom when the
victim dies; aircraft hijacking; and treason (O.C.G.A. § 17-10-30).
Idaho First-degree murder with aggravating factors; rst-degree kidnapping; and perjury resulting in the execution of an
innocent person.
Indiana Murder with 1 or more of 18 aggravating circumstances (I.C. 35-50-2-9).
Kansas Intentional and premeditated killing of a person in 1 or more of 7 dierent circumstances (K.S.A. 21-5401).
Kentucky Intentional murder with the presence of at least 1 statutory aggravating circumstance; and capital kidnapping (K.R.S.
532.025).
Louisiana First-degree murder (La. R.S. 14:30) with aggravating circumstances (La. C.Cr.P 905.4); and treason (La. R.S. 14:113).
Mississippi Capital murder with aggravating circumstances (Miss. Code Ann. § 97-3-19(2)); and aircraft piracy (Miss. Code Ann. §
97-25-55(1)).
Missouri First-degree murder with at least 1 statutory aggravating circumstance (565.020 R.S.M.O. 2000).
Montana Deliberate homicide, including felony murder, with 1 of 9 aggravating circumstances (Mont. Code Ann. § 46-18-303);
aggravated kidnapping resulting in death of victim or rescuer; attempted deliberate homicide, aggravated assault,
or kidnapping while in detention; and capital sexual intercourse without consent (Mont. Code Ann. § 45-5-503).
Nebraska First-degree murder with a nding of 1 or more statutory aggravating circumstances.
Nevada First-degree murder with at least 1 of 15 aggravating circumstances (N.R.S. 200.030, 200.033, 200.035).
New York
b
First-degree murder with 1 of 13 aggravating factors (NY Penal Law § 125.27).
North Carolina First-degree murder (N.C. Gen. Stat. § 14-17) with the nding of at least 1 of 11 statutory aggravating circumstances
(N.C. Gen. Stat. § 15A-2000(e)).
Ohio Aggravated murder with at least 1 of 10 aggravating circumstances (O.R.C. 2903.01, 2929.02, 2929.04).
Oklahoma First-degree murder (21 O.S. § 701.7) in conjunction with a nding of at least 1 of 8 statutorily dened aggravating
circumstances (21 O.S. § 701.12) .
Oregon Aggravated murder (Or. Rev. Stat. 163.095).
Pennsylvania First-degree murder (18 Pa.C.S.A § 2502(a)) with 18 aggravating circumstances (42 Pa.C.S.A § 9711).
South Carolina Murder with at least 1 of 12 aggravating circumstances (S.C. Code § 16-3-20(C)(a)).
South Dakota First-degree murder (S.D.C.L. 22-16-4) with 1 of 10 aggravating circumstances (S.D.C.L. 23A-27A-1).
Tennessee First-degree murder (Tenn. Code Ann. § 39-13-202) with 1 of 18 aggravating circumstances (Tenn. Code Ann. § 39-13-
204).
Texas Capital murder, dened as criminal homicide with 1 of 9 statutory aggravators (Tex. Penal Code § 19.03).
Utah Aggravated murder (Utah Code Ann. § 76-5-202).
Washington
c
Aggravated rst-degree murder.
Wyoming First-degree murder, including premeditated murder and murder during the commission of sexual assault, sexual
abuse of a minor, arson, robbery, burglary, escape, resisting arrest, kidnapping, or abuse of a minor younger than
age 16 (W.S.A. § 6-2-101(a)).
Continued on next page

Capital Punishment, 2021 – Statistical Tables | November 2023 9
Status of the death penalty in 2021 (continued)
TABLE 3
Federal capital offenses, 2021
Federal statute Oense
8 U.S.C. § 1342 Murder related to the smuggling of aliens.
18 U.S.C. §§ 32–34 Destruction of aircraft, motor vehicles, or related facilities resulting in death.
18 U.S.C. § 36 Murder committed during a drug-related drive-by shooting.
18 U.S.C. § 37 Murder committed at an airport serving international civil aviation.
18 U.S.C. § 115(b)(3) [by cross-reference to
18 U.S.C. § 1111]
Retaliatory murder of a member of the immediate family of law enforcement ocials.
18 U.S.C. §§ 241, 242, 245, 247 Civil rights oenses resulting in death.
18 U.S.C. § 351 [by cross-reference to 18 U.S.C. § 1111] Murder of a member of Congress, an important executive ocial, or a U.S. Supreme
Courtjustice.
18 U.S.C. § 794 Espionage.
18 U.S.C. §§ 844(d), (f), (i) Death resulting from oenses involving transportation of explosives, destruction of
government property, or destruction of property related to foreign or interstate
commerce.
18 U.S.C. § 924(i) Murder committed by the use of a rearm during a crime of violence or a drug-
trackingcrime.
18 U.S.C. § 930 Murder committed in a federal government facility.
18 U.S.C. § 1091 Genocide.
18 U.S.C. § 1111 First-degree murder.
18 U.S.C. § 1114 Murder of a federal judge or law enforcement ocial.
18 U.S.C. § 1116 Murder of a foreign ocial.
18 U.S.C. § 1118 Murder by a federal prisoner.
18 U.S.C. § 1119 Murder of a U.S. national in a foreign country.
18 U.S.C. § 1120 Murder by an escaped federal prisoner already sentenced to life imprisonment.
18 U.S.C. § 1121 Murder of a state or local law enforcement ocial or other person aiding in a federal
investigation; or murder of a state correctional ocer.
18 U.S.C. § 1201 Murder during a kidnapping.
18 U.S.C. § 1203 Murder during a hostage taking.
18 U.S.C. § 1503 Murder of a court ocer or juror.
18 U.S.C. § 1512 Murder with the intent of preventing testimony by a witness, a victim, or an informant.
18 U.S.C. § 1513 Retaliatory murder of a witness, a victim, or an informant.
18 U.S.C. § 1716 Mailing of injurious articles with intent to kill or resulting in death.
18 U.S.C. § 1751 [by cross-reference to
18 U.S.C. §1111]
Assassination or kidnapping resulting in the death of the U.S. president or U.S. vice
president.
18 U.S.C. § 1958 Murder for hire.
18 U.S.C. § 1959 Murder involved in a racketeering oense.
18 U.S.C. § 1992 Willful wrecking of a train resulting in death.
18 U.S.C. § 2113 Murder or kidnapping related to bank robbery.
18 U.S.C. § 2119 Murder related to a carjacking.
18 U.S.C. § 2245 Murder related to rape or child molestation.
18 U.S.C. § 2251 Murder related to sexual exploitation of children.
18 U.S.C. § 2280 Murder committed during an oense against maritime navigation.
18 U.S.C. § 2281 Murder committed during an oense against a maritime xed platform.
18 U.S.C. § 2332 Terrorist murder of a U.S. national in another country.
18 U.S.C. § 2332a Murder by the use of a weapon of mass destruction.
18 U.S.C. § 2340 Murder involving torture.
18 U.S.C. § 2381 Treason.
21 U.S.C. § 848(e) Murder related to a continuing criminal enterprise or related murder of a federal, state, or
local law enforcement ocer.
49 U.S.C. §§ 1472–1473 Death resulting from aircraft hijacking.
Source: Bureau of Justice Statistics, National Prisoner Statistics program (NPS-8), 2021.
Continued on next page

Status of the death penalty in 2021 (continued)
TABLE 4
Authorized method of execution, by state, 2021
Jurisdiction Lethal injection
a
Electrocution Lethal gas Hanging
a
Firing squad
Nitrogen
hypoxia
Total 30 8 3 2 4 3
Alabama
Arizona
b
Arkansas
c
California
d
Delaware
e
Florida
f
Georgia
Idaho
Indiana
Kansas
Kentucky
g
Louisiana
Mississippi
h
Missouri
Montana
Nebraska
Nevada
New York
North Carolina
Ohio
Oklahoma
h
Oregon
Pennsylvania
South Carolina
South Dakota
i
Tennessee
j
Texas
Utah
k
Washington
Wyoming
l
Note: The method of execution of federal prisoners is lethal injection, pursuant to 28 C.F.R. Part 26. For oenses prosecuted under the Violent
Crime Control and Law Enforcement Act of 1994, the execution method is that of the state in which the conviction took place (18 U.S.C. § 3596).
a
Counts exclude New Hampshire, which repealed the death penalty eective May 30, 2019. The one male prisoner remaining under sentence of
death is subject to execution by lethal injection or by hanging if lethal injection cannot be given.
b
Authorizes lethal injection for prisoners sentenced after November 23, 1992. Prisoners sentenced before that date may select lethal injection
or
gas.
c
Authorizes lethal injection for prisoners whose oense occurred on or after July 4, 1983 (Act 774 of 1983). Prisoners whose oense occurred
before that date may select lethal injection or electrocution. Electrocution is the authorized method if lethal injection is invalidated by an
unappealable court order (Ark. Code Ann. § 5-4-617).
d
Both lethal injection and lethal gas are authorized by statute (Cal. Pen. Code 3604). However, use of lethal gas was invalided by a federal court
(Fierro v. Terhune, 147 F.3d 1158, 1160 (9th Cir. 1998)).
e
Authorizes hanging if lethal injection is held to be unconstitutional by a court of competent jurisdiction.
f
Authorizes “any constitutional method of execution” if electrocution or lethal injection is held to be unconstitutional (Fla. Stat. § 105(3)).
g
Authorizes lethal injection for prisoners sentenced on or after March 31, 1998. Prisoners sentenced before that date may select lethal injection
orelectrocution.
h
Authorizes nitrogen hypoxia if lethal injection is held to be unconstitutional, electrocution if both lethal injection and nitrogen hypoxia are held
to be unconstitutional, and ring squad if all other methods are held to be unconstitutional.
i
Any person convicted of a capital oense or sentenced to death prior to July 1, 2017 may choose to be executed by lethal injection or in the
manner provided by South Dakota law at the time of the person’s conviction or sentence.
j
Authorizes lethal injection for prisoners whose capital oense occurred after December 31, 1998. Prisoners whose oense occurred before that
date may select electrocution by written waiver. Electrocution is the authorized method if a court or the commissioner of corrections determines
that lethal injection cannot be given. If both methods are ruled unconstitutional, state law allows for the use of any method that is constitutional.
k
Authorizes ring squad if lethal injection is held unconstitutional. Prisoners who selected execution by ring squad prior to May 3, 2004 may
still be entitled to execution by that method.
l
Authorizes lethal gas if lethal injection is held to be unconstitutional.
Source: Bureau of Justice Statistics, National Prisoner Statistics program (NPS-8), 2021.
Capital Punishment, 2021 – Statistical Tables | November 2023 11
Advance count of executions in 2022
The Bureau of Justice Statistics gathers information
following each execution to provide the most recent
data on capital punishment in advance of the annual
data collection. The data include the date, jurisdiction,
and method of execution and the race and ethnicity
(Hispanic origin) of each person executed.
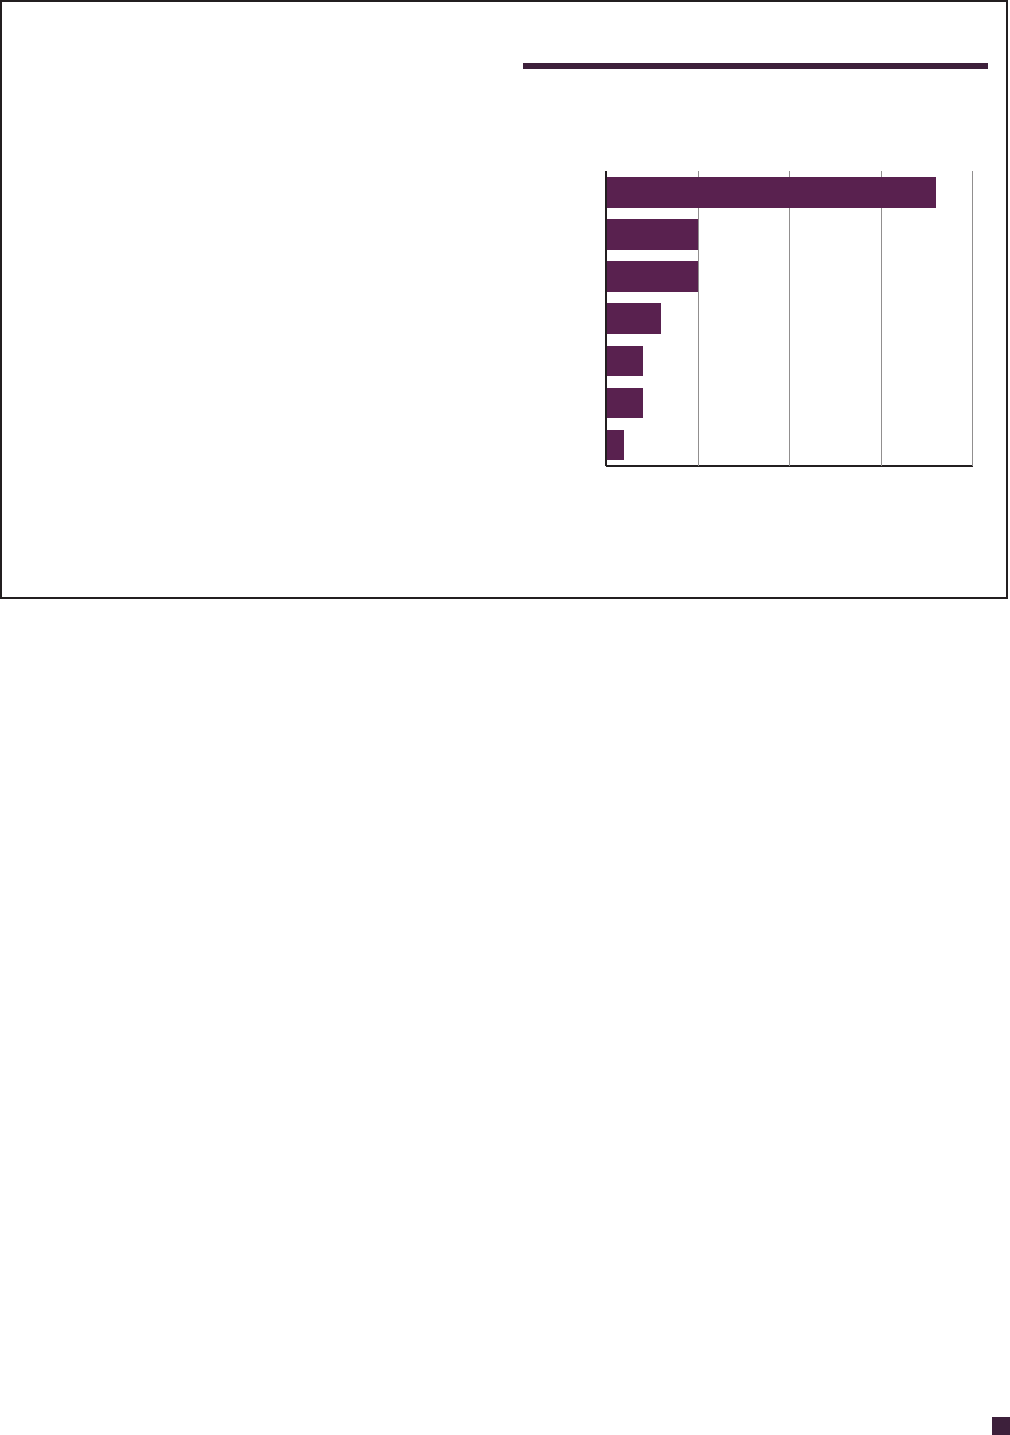
From January 1, 2022 to December 31, 2022, six states
executed 18 prisoners (gure 5), which was 7 more
than the number executed in 2021. Oklahoma and
Texas (5 each) executed the largest number of prisoners
during this period.
All of the executions in 2022 were by lethal injection.
Eleven of the prisoners executed were white, ve were
black, one was American Indian, and one was Asian. No
females were executed during this period.
Complete data for 2022 will appear in Capital
Punishment, 2022. This annual report will consist of data
collected from state and federal correctional agencies.
The report will cover all prisoners under sentence of
death on December 31, 2022, as well as those removed
from under sentence of death during the year.
FIGURE 5
Advance count of executions, January 1, 2022–
December 31, 2022
Source: Bureau of Justice Statistics, National Prisoner Statistics
program (NPS-8), 2021.
Jurisdiction
0 5 10 15 20
Mississippi
Alabama
Missouri
Arizona
Texas
Oklahoma
Total
Number of executions
(12)
(2)
(2)
(3)
(5)
(18)
(5)
(1)

Capital Punishment, 2021 – Statistical Tables | November 2023 12
TABLE 5
Prisoners under sentence of death, by region, jurisdiction, and race, 2020 and 2021
Region and
jurisdiction
Prisoners under sentence
of death, 12/31/20
Received under sentence
of death, 2021
Removed from death
row (excluding
executions), 2021
a
Executed, 2021
Prisoners under sentence
of death, 12/31/21
Total
b
White
c
Black
c
Total
b
White
c
Black
c
Total
b
White
c
Black
c
Total
b
White
c
Black
c
Total
b
White
c
Black
c
U.S. total 2,461 1,392 1,009 16 10 6 84 44 40 11 5 6 2,382 1,353 969
Federal
d
51 30 21 0 0 0 6 4 2 3 1 2 42 25 17
State 2,410 1,362 988 16 10 6 78 40 38 8 4 4 2,340 1,328 952
Northeast 118 58 58 0 0 0 6 2 4 0 0 0 112 56 54
New Hampshire 1 0 1 0 0 0 0 0 0 0 0 0 1 0 1
New York 0 0 0 0 0 0 0 0 0 0 0 0 0 0 0
Pennsylvania 117 58 57 0 0 0 6 2 4 0 0 0 111 56 53
Midwest 187 97 89 1 1 0 6 4 2 1 0 1 181 94 86
Indiana 8 6 2 0 0 0 0 0 0 0 0 0 8 6 2
Kansas 10 7 3 0 0 0 1 1 0 0 0 0 9 6 3
Missouri 20 13 7 0 0 0 0 0 0 1 0 1 19 13 6
Nebraska 12 9 3 1 1 0 1 0 1 0 0 0 12 10 2
Ohio 136 61 74 0 0 0 4 3 1 0 0 0 132 58 73
South Dakota 1 1 0 0 0 0 0 0 0 0 0 0 1 1 0
South 1,179 625 539 13 8 5 43 22 21 7 4 3 1,142 607 520
Alabama 170 87 83 4 3 1 4 0 4 1 0 1 169 90 79
Arkansas 29 14 15 0 0 0 1 0 1 0 0 0 28 14 14
Delaware 0 0 0 0 0 0 0 0 0 0 0 0 0 0 0
Florida 335 212 123 1 1 0 12 9 3 0 0 0 324 204 120
Georgia 40 20 20 0 0 0 2 1 1 0 0 0 38 19 19
Kentucky 26 23 3 0 0 0 0 0 0 0 0 0 26 23 3
Louisiana 66 22 44 0 0 0 4 2 2 0 0 0 62 20 42
Mississippi 39 16 22 0 0 0 2 1 1 1 1 0 36 14 21
North Carolina 137 58 73 0 0 0 1 1 0 0 0 0 136 57 73
Oklahoma 45 23 19 4 2 2 3 1 2 2 1 1 44 23 18
South Carolina 36 17 19 0 0 0 2 0 2 0 0 0 34 17 17
Tennessee 50 23 26 1 1 0 4 2 2 0 0 0 47 22 24
Texas 204 110 90 3 1 2 6 5 1 3 2 1 198 104 90
Virginia 2 0 2 0 0 0 2 0 2 0 0 0 0 0 0
West 926 582 302 2 1 1 23 12 11 0 0 0 905 571 292
Arizona 116 89 20 0 0 0 2 2 0 0 0 0 114 87 20
California 704 417 256 2 1 1 16 7 9 0 0 0 690 411 248
Idaho 8 8 0 0 0 0 0 0 0 0 0 0 8 8 0
Montana 2 2 0 0 0 0 0 0 0 0 0 0 2 2 0
Nevada 65 40 23 0 0 0 4 2 2 0 0 0 61 38 21
Oregon 24 21 2 0 0 0 1 1 0 0 0 0 23 20 2
Utah 7 5 1 0 0 0 0 0 0 0 0 0 7 5 1
Washington 0 0 0 0 0 0 0 0 0 0 0 0 0 0 0
Wyoming 0 0 0 0 0 0 0 0 0 0 0 0 0 0 0
Note: Some counts for yearend 2020 are revised from those reported in Capital Punishment, 2020 – Statistical Tables (NCJ 302729, BJS, December 2021). The
revised counts include 3 prisoners who were either reported late to the National Prisoner Statistics program or were not in the custody of state correctional
authorities on December 31, 2020 (1 each in Florida, California, and Idaho). The revised counts exclude 11 prisoners who were relieved of a death sentence
before December 31, 2020 (3 in Florida; 2 each in Texas and Nevada; and 1 each in Pennsylvania, Ohio, Mississippi, and Idaho).
a
Includes 32 deaths from natural causes (8 in California; 4 in Florida; 3 each in the Federal Bureau of Prisons and Nevada; 2 each in Ohio, Oklahoma, Tennessee,
and Texas; and 1 each in Kansas, Nebraska, Georgia, Louisiana, Mississippi, and South Carolina), 2 deaths by suicide (1 each in Mississippi and California), 1 death
resulting from a murder committed by another prisoner (Arizona), and 1 death from an unspecied cause (Texas).
b
Includes American Indian or Alaska Native prisoners; and Asian, Native Hawaiian, or Other Pacic Islander prisoners.
c
Includes prisoners of Hispanic origin.
d
Excludes prisoners held under the jurisdiction of the U.S. Armed Forces with a military death sentence for murder.
Source: Bureau of Justice Statistics, National Prisoner Statistics program (NPS-8), 2021.

Capital Punishment, 2021 – Statistical Tables | November 2023 13
TABLE 6
Demographic characteristics for prisoners under sentence of death, 2021
Total, 12/31/21 Admissions Removals
Demographic characteristic Percent Number Percent Number Percent Number
Total 100% 2,382 100% 16 100% 95
Sex
Male 97.9% 2,332 100% 16 98.9% 94
Female 2.1 50 0 0 1.1 1
Race
White
a
56.8% 1,353 62.5% 10 51.6% 49
Black
a
40.7 969 37.5 6 48.4 46
American Indian/Alaska Native
a
0.8 18 0 0 0 0
Asian/Native Hawaiian/Other
Pacic Islander
a,b
1.8 42 0 0 0 0
Ethnicity
Hispanic 15.5% 336 6.7% 1 10.9% 10
Non-Hispanic 84.5 1,828 93.3 14 89.1 82
Unknown 218 1 3
Age
18-19 0% 0 0% 0 0% 0
20-24 0 0 0 0 0 0
25-29 0.8 20 6.3 1 0 0
30-34 3.7 89 12.5 2 2.1 2
35-39 7.0 166 37.5 6 6.3 6
40-44 12.2 291 6.3 1 12.6 12
45-49 16.0 380 25.0 4 10.5 10
50-54 17.6 420 0 0 13.7 13
55-59 16.2 385 6.3 1 14.7 14
60-64 12.6 300 6.3 1 15.8 15
65 or older 13.9 331 0 0 24.2 23
Average age
Mean 53 yrs. 41 yrs. 56 yrs.
Median 52 38 57
Education
8th grade or less 11.7% 218 11.1% 1 11.0% 8
9th-11th grade 35.0 652 11.1 1 30.1 22
High-school graduate/GED 44.1 823 55.6 5 53.4 39
Any college 9.2 172 22.2 2 5.5 4
Unknown 517 7 22
Median education level 12th grade : 12th grade
Marital status
Married 21.1% 426 37.5% 3 23.2% 19
Divorced/separated 19.9 403 12.5 1 22.0 18
Widowed 3.5 70 12.5 1 4.9 4
Never married 55.6 1,124 37.5 3 50.0 41
Unknown 359 8 13
Note: Percentages are based on prisoners for whom data were reported. Details may not sum to totals due to rounding.
: Not calculated.
a
Includes prisoners of Hispanic origin.
b
Includes 36 Asian prisoners and 6 Native Hawaiian or Other Pacic Islander prisoners at yearend 2021.
Source: Bureau of Justice Statistics, National Prisoner Statistics program (NPS-8),
2021.

Capital Punishment, 2021 – Statistical Tables | November 2023 14
TABLE 7
Female prisoners under sentence of death, by region, jurisdiction, and race, 2020 and 2021
Region and
jurisdiction
Female prisoners under
sentence of death,
12/31/20
Received under
sentence of death, 2021
Removed from death
row (excluding
executions), 2021 Executed, 2021
Female prisoners under
sentence of death,
12/31/21
Total
a
White
b
Black
b
Total
a
White
b
Black
b
Total
a
White
b
Black
b
Total
a
White
b
Black
b
Total
a
White
b
Black
b
U.S. total 51 38 11 0 0 0 0 0 0 1 1 0 50 37 11
Federal 1 1 0 0 0 0 0 0 0 1 1 0 0 0 0
State 50 37 11 0 0 0 0 0 0 0 0 0 50 37 11
Midwest 1 1 0 0 0 0 0 0 0 0 0 0 1 1 0
Ohio 1 1 0 0 0 0 0 0 0 0 0 0 1 1 0
South 22 14 8 0 0 0 0 0 0 0 0 0 22 14 8
Alabama 5 4 1 0 0 0 0 0 0 0 0 0 5 4 1
Florida 3 1 2 0 0 0 0 0 0 0 0 0 3 1 2
Georgia 1 0 1 0 0 0 0 0 0 0 0 0 1 0 1
Kentucky 1 1 0 0 0 0 0 0 0 0 0 0 1 1 0
Louisiana 1 0 1 0 0 0 0 0 0 0 0 0 1 0 1
Mississippi 1 1 0 0 0 0 0 0 0 0 0 0 1 1 0
North Carolina 2 1 1 0 0 0 0 0 0 0 0 0 2 1 1
Oklahoma 1 1 0 0 0 0 0 0 0 0 0 0 1 1 0
Tennessee 1 1 0 0 0 0 0 0 0 0 0 0 1 1 0
Texas 6 4 2 0 0 0 0 0 0 0 0 0 6 4 2
West 27 22 3 0 0 0 0 0 0 0 0 0 27 22 3
Arizona 3 3 0 0 0 0 0 0 0 0 0 0 3 3 0
California 23 18 3 0 0 0 0 0 0 0 0 0 23 18 3
Idaho 1 1 0 0 0 0 0 0 0 0 0 0 1 1 0
a
Includes American Indian or Alaska Native prisoners; and Asian, Native Hawaiian, or Other Pacic Islander prisoners.
b
Includes prisoners of Hispanic origin.
Source: Bureau of Justice Statistics, National Prisoner Statistics program (NPS-8), 2021.

Capital Punishment, 2021 – Statistical Tables | November 2023 15
TABLE 8
Hispanic prisoners under sentence of death, by region and jurisdiction, 2020 and 2021
Region and jurisdiction
Hispanic prisoners
under sentence of
death, 12/31/20*
Received under
sentence of
death, 2021
Removed from death
row (excluding
executions), 2021 Executed, 2021
Hispanic prisoners
under sentence of
death, 12/31/21
U.S. total 345 1 10 0 336
Federal 7 0 1 0 6
State 338 1 9 0 330
Northeast 14 0 1 0 13
Pennsylvania 14 0 1 0 13
Midwest 10 0 0 0 10
Nebraska 6 0 0 0 6
Ohio 4 0 0 0 4
South 89 1 2 0 88
Alabama 1 0 0 0 1
Florida 23 0 0 0 23
Georgia 2 0 0 0 2
Louisiana 2 0 0 0 2
Mississippi 1 0 0 0 1
North Carolina 3 0 0 0 3
Oklahoma 1 1 0 0 2
South Carolina 1 0 0 0 1
Tennessee 1 0 1 0 0
Texas 54 0 1 0 53
West 225 0 6 0 219
Arizona 23 0 1 0 22
California 190 0 4 0 186
Idaho 1 0 0 0 1
Nevada 6 0 1 0 5
Oregon 3 0 0 0 3
Utah 2 0 0 0 2
Note: Counts of Hispanic prisoners are based on prisoners for whom data were reported.
*Counts of Hispanic prisoners under sentence of death at yearend 2020 have been revised from those reported in Capital Punishment, 2020 – Statistical
Tables (NCJ 302729, BJS, December 2021). The revised counts include one prisoner in Florida and one prisoner in California who were not included in
the counts for December 31, 2020.
Source: Bureau of Justice Statistics, National Prisoner Statistics program (NPS-8), 2021.

Capital Punishment, 2021 – Statistical Tables | November 2023 16
TABLE 9
Criminal history of prisoners under sentence of death, by race or ethnicity, 2021
All prisoners White
a
Black
a
Hispanic
American Indian/
Alaska Native
a
Asian/Native
Hawaiian/Other
Pacic Islander
a
U.S. total 100% 100% 100% 100% 100% 100%
Prior felony convictions
b
Yes 67.8% 63.8% 73.2% 65.7% 68.8% 56.8%
No 32.2 36.2 26.8 34.3 31.3 43.2
Prior homicide
convictions
c
Yes 10.4% 10.8% 10.5% 9.7% 6.3% 5.4%
No 89.6 89.2 89.5 90.3 93.8 94.6
Legal status at time of
capital oense
d
Charges pending 7.6% 9.1% 6.9% 5.6% 6.3% 5.6%
On probation 11.7 9.9 12.0 15.2 18.8 13.9
On parole 16.0 13.7 17.9 17.5 25.0 13.9
On escape 1.1 1.8 0.7 0.7 0 0
Incarcerated 4.6 5.8 3.7 3.6 12.5 0
Other status 0.1 0 0.1 0.3 0 0
None 58.8 59.7 58.6 57.1 37.5 66.7
Number of prisoners 2,382 1,027 961 336 18 40
Note: Percentages are based on prisoners for whom data were reported. Details may not sum to totals due to rounding.
a
Excludes prisoners of Hispanic origin (e.g., “white” refers to non-Hispanic white prisoners and “black” refers to non-Hispanic black prisoners).
b
Excludes 189 prisoners because data were not reported.
c
Excludes 221 prisoners because data were not reported.
d
Excludes 290 prisoners because data were not reported.
Source: Bureau of Justice Statistics, National Prisoner Statistics program (NPS-8), 2021.

Capital Punishment, 2021 – Statistical Tables | November 2023 17
TABLE 10
Prisoners under sentence of death on December 31, 2021, by year of sentencing and jurisdiction
Jurisdiction
Year of sentence for prisoners under sentence of death, 12/31/21
Under sentence
of death,
12/31/21
Average years
under sentence of
death, 12/31/21
1976–
1980
1981–
1985
1986–
1990
1991–
1995
1996–
2000
2001–
2005
2006–
2010
2011–
2015
2016–
2020 2021
U.S. total 18 99 196 387 499 340 399 283 145 16 2,382 20.2
Florida 8 16 35 65 56 28 44 45 26 1 324 21.2
California 5 46 82 122 153 73 105 72 30 2 690 22.0
Texas 2 1 6 20 40 41 32 33 20 3 198 17.1
Nevada 1 8 5 10 15 5 8 5 4 0 61 22.8
Kentucky 1 3 4 4 7 2 4 1 0 0 26 25.9
Arkansas 1 0 0 6 5 5 4 5 2 0 28 18.7
Ohio 0 6 14 21 25 22 16 14 14 0 132 20.2
Arizona 0 3 8 19 10 16 34 16 8 0 114 18.0
Tennessee 0 3 6 8 13 5 6 4 1 1 47 22.6
Pennsylvania 0 2 14 16 22 15 17 21 4 0 111 20.0
Louisiana 0 2 3 9 25 10 6 6 1 0 62 21.3
Missouri 0 2 1 0 0 4 7 4 1 0 19 16.6
Alabama 0 1 8 21 36 30 35 24 10 4 169 17.7
Mississippi 0 1 3 6 5 7 7 4 3 0 36 19.2
Utah 0 1 2 1 2 0 0 1 0 0 7 :
North Carolina 0 1 1 44 47 23 12 4 4 0 136 22.4
South Carolina 0 1 1 1 6 11 11 1 2 0 34 17.9
Oklahoma 0 1 0 1 5 10 12 6 5 4 44 13.4
Montana 0 1 0 1 0 0 0 0 0 0 2 :
Georgia 0 0 2 4 12 7 8 4 1 0 38 19.5
Idaho 0 0 1 2 1 2 1 0 1 0 8 :
Oregon 0 0 0 4 8 3 6 2 0 0 23 20.2
Federal 0 0 0 1 3 13 15 6 4 0 42 14.2
Indiana 0 0 0 1 2 1 1 3 0 0 8 :
Nebraska 0 0 0 0 1 4 3 0 3 1 12 12.0
Kansas 0 0 0 0 0 3 4 1 1 0 9 :
South Dakota 0 0 0 0 0 0 0 1 0 0 1 :
New Hampshire 0 0 0 0 0 0 1 0 0 0 1 :
Note: For prisoners sentenced to death more than once, numbers are based on the year of the most recent death sentence.
:Not calculated. A reliable average could not be calculated from fewer than 10 cases.
Source: Bureau of Justice Statistics, National Prisoner Statistics program (NPS-8), 2021.

Capital Punishment, 2021 – Statistical Tables | November 2023 18
TABLE 11
Prisoners removed from under sentence of death, by region, jurisdiction, and method of removal, 2021
Region and
jurisdiction Total Execution Other death
a
Sentence
commuted
Appeals court or higher
court overturned—
Capital conviction Death sentence Other
b
U.S. total 95 11 36 1 6 39 2
Federal 9 3 3 0 1 2 0
State 86 8 33 1 5 37 2
Northeast 6 0 0 0 1 5 0
Pennsylvania 6 0 0 0 1 5 0
Midwest 7 1 4 0 0 2 0
Kansas 1 0 1 0 0 0 0
Missouri 1 1 0 0 0 0 0
Nebraska 1 0 1 0 0 0 0
Ohio 4 0 2 0 0 2 0
South 50 7 16 1 2 22 2
Alabama 5 1 0 0 0 4 0
Arkansas 1 0 0 0 0 1 0
Florida 12 0 4 0 0 8 0
Georgia 2 0 1 0 1 0 0
Louisiana 4 0 1 0 0 3 0
Mississippi 3 1 2 0 0 0 0
North Carolina 1 0 0 0 0 1 0
Oklahoma 5 2 2 1 0 0 0
South Carolina 2 0 1 0 0 1 0
Tennessee 4 0 2 0 0 2 0
Texas 9 3 3 0 1 2 0
Virginia 2 0 0 0 0 0 2
West 23 0 13 0 2 8 0
Arizona 2 0 1 0 0 1 0
California 16 0 9 0 2 5 0
Nevada 4 0 3 0 0 1 0
Oregon 1 0 0 0 0 1 0
a
In 2021, other deaths were due to natural causes, suicide, homicide, and unspecied causes.
b
In 2021, two prisoners in Virginia were removed from under sentence of death as a result of the state’s repeal of capital punishment.
Source: Bureau of Justice Statistics, National Prisoner Statistics program (NPS-8), 2021.

Capital Punishment, 2021 – Statistical Tables | November 2023 19
TABLE 12
Average elapsed time between sentencing and execution,
1977–2021
Year
a
Executions
Average elapsed time
from sentence to execution
b
Total 1,540 147 mos.
1977 1 :
1979 2 :
1981 1 :
1982 2 :
1983 5 :
1984 21 74
1985 18 71
1986 18 87
1987 25 86
1988 11 80
1989 16 95
1990 23 95
1991 14 116
1992 31 114
1993 38 113
1994 31 122
1995 56 134
1996 45 125
1997 74 133
1998 68 130
1999 98 143
2000 85 137
2001 66 142
2002 71 127
2003 65 131
2004 59 132
2005 60 147
2006 53 145
2007 42 153
2008 37 139
2009 52 169
2010 46 178
2011 43 198
2012 43 190
2013 39 186
2014 35 218
2015 28 195
2016 20 204
2017 23 243
2018 25 238
2019 22 264
2020 17 227
2021 11 233
Note: In 1972, the U.S. Supreme Court invalidated capital punishment statutes
in several states (Furman v. Georgia, 408 U.S. 238 (1972)), eecting a moratorium
on executions. Executions resumed in 1977 when the court found that revisions
to statutes in several states had eectively addressed the issues previously held
unconstitutional (Gregg v. Georgia, 428 U.S. 153 (1976) and its companion cases).
:Not calculated. A reliable average cannot be calculated from fewer than 10 cases.
a
No executions were carried out in 1978 or 1980.
b
Average time was calculated from the most recent sentencing date.
Source: Bureau of Justice Statistics, National Prisoner Statistics program
(NPS-8), 2021.

Capital Punishment, 2021 – Statistical Tables | November 2023 20
TABLE 13
Number of executions, by jurisdiction, 1930–2021 and
1977–2021
Jurisdiction Since 1930 Since 1977
U.S. total 5,393 1,540
Texas 870 573
Georgia 441 76
New York 329 0
North Carolina 306 43
California 305 13
Florida 269 99
Ohio 228 56
Virginia 205 113
South Carolina 205 43
Alabama 203 68
Mississippi 177 22
Oklahoma 176 114
Louisiana 161 28
Pennsylvania 155 3
Missouri 153 91
Arkansas 149 31
Kentucky 106 3
Tennessee 105 13
Illinois 102 12
Arizona 75 37
New Jersey 74 0
Maryland 73 5
Indiana 61 20
Washington 52 5
Colorado 48 1
Federal system 42 16
Nevada 41 12
District of Columbia 40 0
West Virginia 40 0
Delaware 28 16
Massachusetts 27 0
Connecticut 22 1
Oregon 21 2
Utah 20 7
Iowa 18 0
Kansas 15 0
Montana 9 3
New Mexico 9 1
Nebraska 8 4
Wyoming 8 1
South Dakota 6 5
Idaho 6 3
Vermont 4 0
New Hampshire 1 0
Note: Excludes 160 executions carried out by military authorities
between 1930 and 1961. The federal government has collected data on
executions under civil authority annually since 1930.
Source: Bureau of Justice Statistics, National Prisoner Statistics program
(NPS-8), 1930–2021.

Capital Punishment, 2021 – Statistical Tables | November 2023 21
Methodology
e Bureau of Justice Statistics (BJS) collects
information about capital punishment each year
through the National Prisoner Statistics program
(NPS-8). BJS collects this data series in two parts:
Data on prisoners under sentence of death are
obtained from the department of corrections in each
jurisdiction that authorizes capital punishment.
e status of death penalty statutes is obtained from
the Oce of the Attorney General in each of the 50
states, the Oce of the U.S. Attorney in the District
of Columbia, and the Federal Bureau of Prisons for
the federal government.
Data collection forms are available on the BJS
website at https://bjs.ojp.gov/data-collection/capital-
punishment-nps-8#surveys-0.
e NPS-8 covers all prisoners under sentence of
death at any time during the year who were held in a
state or federal nonmilitary correctional facility. is
includes capital oenders transferred from prison to
a mental institution and those who may have escaped
from custody. It excludes prisoners sentenced to
death under the Uniform Code of Military Justice and
those whose death sentences have been overturned
by a court or an executive action, regardless of their
current incarceration status. Statistics in this report
may dier from data collected by other organizations
for various reasons:
e NPS-8 adds prisoners to the population under
sentence of death at the time they are admitted to a
state or federal correctional facility, not at the time
they are sentenced.
If prisoners entered prison under a death sentence or
were reported as being relieved of a death sentence
in one year but the admission or removal occurred
in a previous year, counts are adjusted to reect the
actual date of sentence or removal.
NPS-8 counts are for the last day of the calendar year
and will dier from counts for more recent periods.

Capital Punishment, 2021 – Statistical Tables | November 2023 22
APPENDIX TABLE 1
Number of prisoners executed, by race or ethnicity, 1977–2021
Year
a
All executions White
b
Black
b
Hispanic
American Indian/
Alaska Native
b
Asian/ Native
Hawaiian/Other
Pacic Islander
b
Total 1,540 865 526 134 9 6
1977 1 1 0 0 0 0
1979 2 2 0 0 0 0
1981 1 1 0 0 0 0
1982 2 1 1 0 0 0
1983 5 4 1 0 0 0
1984 21 13 8 0 0 0
1985 18 9 7 2 0 0
1986 18 9 7 2 0 0
1987 25 11 11 3 0 0
1988 11 6 5 0 0 0
1989 16 6 8 2 0 0
1990 23 16 7 0 0 0
1991 14 6 7 1 0 0
1992 31 17 11 2 1 0
1993 38 19 14 4 1 0
1994 31 19 11 1 0 0
1995 56 31 22 2 0 1
1996 45 29 14 2 0 0
1997 74 41 26 5 1 1
1998 68 40 18 8 1 1
1999 98 53 33 9 1 2
2000 85 43 35 6 1 0
2001 66 45 17 3 1 0
2002 71 47 18 6 0 0
2003 65 41 20 3 1 0
2004 59 36 19 3 0 1
2005 60 38 19 3 0 0
2006 53 25 20 8 0 0
2007 42 22 14 6 0 0
2008 37 17 17 3 0 0
2009 52 24 21 7 0 0
2010 46 28 13 5 0 0
2011 43 22 16 5 0 0
2012 43 25 11 7 0 0
2013 39 23 13 3 0 0
2014 35 12 18 5 0 0
2015 28 11 10 7 0 0
2016 20 16 2 2 0 0
2017 23 13 8 2 0 0
2018 25 14 6 5 0 0
2019 22 14 7 1 0 0
2020 17 10 5 1 1 0
2021 11 5 6 0 0 0
Note: In 1972, the U.S. Supreme Court invalidated capital punishment statutes in several states (Furman v. Georgia, 408 U.S. 238 (1972)), eecting a
moratorium on executions. Executions resumed in 1977 when the court found that revisions to statutes in several states had eectively addressed the
issues previously held unconstitutional (Gregg v. Georgia, 428 U.S. 153 (1976) and its companion cases).
a
No executions were carried out in 1978 or 1980.
b
Excludes prisoners of Hispanic origin (e.g. "white" refers to non-Hispanic white prisoners and "black" refers to non-Hispanic black prisoners).
Source: Bureau of Justice Statistics, National Prisoner Statistics program (NPS-8), 2021.

Capital Punishment, 2021 – Statistical Tables | November 2023 23
APPENDIX TABLE 2
Number of executions, by method and jurisdiction, 1977–2021
Jurisdiction All methods Lethal injection Electrocution Lethal gas Hanging Firing squad
U.S. total 1,540 1,360 163 11 3 3
Federal 16 16 0 0 0 0
Alabama 68 44 24 0 0 0
Arizona 37 35 0 2 0 0
Arkansas 31 30 1 0 0 0
California 13 11 0 2 0 0
Colorado 1 1 0 0 0 0
Connecticut 1 1 0 0 0 0
Delaware 16 15 0 0 1 0
Florida 99 55 44 0 0 0
Georgia 76 53 23 0 0 0
Idaho 3 3 0 0 0 0
Illinois 12 12 0 0 0 0
Indiana 20 17 3 0 0 0
Kentucky 3 2 1 0 0 0
Louisiana 28 8 20 0 0 0
Maryland 5 5 0 0 0 0
Mississippi 22 18 0 4 0 0
Missouri 91 91 0 0 0 0
Montana 3 3 0 0 0 0
Nebraska 4 1 3 0 0 0
Nevada 12 11 0 1 0 0
New Mexico 1 1 0 0 0 0
North Carolina 43 41 0 2 0 0
Ohio 56 56 0 0 0 0
Oklahoma 114 114 0 0 0 0
Oregon 2 2 0 0 0 0
Pennsylvania 3 3 0 0 0 0
South Carolina 43 36 7 0 0 0
South Dakota 5 5 0 0 0 0
Tennessee 13 7 6 0 0 0
Texas 573 573 0 0 0 0
Utah 7 4 0 0 0 3
Virginia 113 82 31 0 0 0
Washington 5 3 0 0 2 0
Wyoming 1 1 0 0 0 0
Note: In 1972, the U.S. Supreme Court invalidated capital punishment statutes in several states (Furman v. Georgia, 408 U.S. 238 (1972)), eecting a
moratorium on executions. Executions resumed in 1977 when the court found that revisions to statutes in several states had eectively addressed the
issues previously held unconstitutional (Gregg v. Georgia, 428 U.S. 153 (1976) and its companion cases).
Source: Bureau of Justice Statistics, National Prisoner Statistics program (NPS-8), 2021.

Capital Punishment, 2021 – Statistical Tables | November 2023 24
APPEN TABLE 3DIX
Counts for figure 1: Number of prisoners under sentence of death, 1953–2021
Year
Number of prisoners
under sentence of death
1953 131
1954 147
1955 125
1956 146
1957 151
1958 147
1959 164
1960 212
1961 257
1962 267
1963 297
1964 315
1965 331
1966 406
1967 435
1968 517
1969 575
1970 631
1971 642
1972 334
1973 134
1974 244
1975 488
Year
Number of prisoners
under sentence of death
1976 420
1977 423
1978 482
1979 593
1980 692
1981 860
1982 1,066
1983 1,209
1984 1,420
1985 1,575
1986 1,800
1987 1,967
1988 2,117
1989 2,243
1990 2,346
1991 2,465
1992 2,580
1993 2,727
1994 2,905
1995 3,064
1996 3,242
1997 3,328
1998 3,465
Year
Number of prisoners
under sentence of death
1999 3,540
2000 3,601
2001 3,577
2002 3,562
2003 3,377
2004 3,320
2005 3,245
2006 3,233
2007 3,215
2008 3,210
2009 3,173
2010 3,139
2011 3,065
2012 3,011
2013 2,983
2014 2,942
2015 2,872
2016 2,797
2017 2,703
2018 2,626
2019 2,563
2020 2,461
2021 2,382
Note: Data on the number of prisoners under sentence of death at yearend have been collected since 1953.
Source: Bureau of Justice Statistics, National Prisoner Statistics program (NPS-8), 1953–2021.

Capital Punishment, 2021 – Statistical Tables | November 2023 25
APPEN TABLE 4DIX
Counts for figure 2: Admissions to and removals from under sentence of death, 1973–2021
Year Admissions Removals
1973 44 240
1974 161 55
1975 318 67
1976 249 317
1977 159 156
1978 211 150
1979 172 61
1980 202 101
1981 249 84
1982 287 79
1983 266 123
1984 306 90
1985 292 130
1986 319 109
1987 311 142
1988 317 165
1989 274 149
Year Admissions Removals
1990 270 152
1991 284 159
1992 300 173
1993 300 163
1994 330 153
1995 326 171
1996 323 155
1997 282 187
1998 312 175
1999 287 221
2000 235 173
2001 164 194
2002 172 191
2003 157 348
2004 140 197
2005 143 216
2006 126 146
Year Admissions Removals
2007 129 140
2008 122 137
2009 118 167
2010 116 143
2011 84 156
2012 85 125
2013 85 118
2014 70 116
2015 54 123
2016 34 98
2017 38 137
2018 41 115
2019 36 100
2020 15 113
2021 16 95
Note: Removals can be due to any cause, including execution, other death, or appeal.
Source: Bureau of Justice Statistics, National Prisoner Statistics program (NPS-8), 1973–2021.
APPEN TABLE 5DIX
Counts for figure 3: Number of prisoners under sentence of death, by race, 1968–2021
Year White
a
Black
a
All other races
a,b
1968 243 271 3
1969 263 310 2
1970 293 335 3
1971 306 332 4
1972 167 166 1
1973 64 68 2
1974 110 128 6
1975 218 262 8
1976 225 195 0
1977 229 192 2
1978 281 197 4
1979 354 236 3
1980 424 264 4
1981 499 353 8
1982 613 441 12
1983 692 505 12
1984 806 598 16
1985 896 664 15
1986 1,013 762 25
1987 1,128 813 26
1988 1,235 848 34
1989 1,308 898 37
1990 1,368 940 38
1991 1,449 979 37
1992 1,511 1,031 38
1993 1,575 1,111 41
1994 1,653 1,203 49
Year White
a
Black
a
All other races
a,b
1995 1,732 1,284 48
1996 1,833 1,358 51
1997 1,864 1,408 56
1998 1,917 1,489 59
1999 1,960 1,515 65
2000 1,989 1,541 71
2001 1,968 1,538 71
2002 1,939 1,551 72
2003 1,882 1,417 78
2004 1,856 1,390 74
2005 1,802 1,366 77
2006 1,806 1,353 74
2007 1,806 1,338 71
2008 1,795 1,343 72
2009 1,779 1,318 76
2010 1,743 1,309 87
2011 1,721 1,274 70
2012 1,684 1,258 69
2013 1,670 1,251 62
2014 1,647 1,233 62
2015 1,606 1,202 64
2016 1,553 1,179 65
2017 1,508 1,129 66
2018 1,470 1,091 65
2019 1,443 1,057 63
2020 1,392 1,009 60
2021 1,353 969 60
Note: Data on Hispanic origin was not collected prior to 1977.
a
Includes prisoners of Hispanic origin.
b
Includes American Indian or Alaska Native prisoners; Asian, Native Hawaiian, or Other Pacic Islander prisoners; and prisoners for whom only
ethnicity was identied.
Source: Bureau of Justice Statistics, National Prisoner Statistics program (NPS-8), 1968–2021.

Capital Punishment, 2021 – Statistical Tables | November 2023 26
APPEN TABLE 6DIX
Counts for figure 4: Number of prisoners executed in the United States, 1930–2021
Year Executions
1930 155
1931 153
1932 140
1933 160
1934 168
1935 199
1936 195
1937 147
1938 190
1939 160
1940 124
1941 123
1942 147
1943 131
1944 120
1945 117
1946 131
1947 153
1948 119
1949 119
1950 82
1951 105
1952 83
1953 62
1954 81
1955 76
1956 65
1957 65
1958 49
1959 49
1960 56
Year Executions
1961 42
1962 47
1963 21
1964 15
1965 7
1966 1
1967 2
1968 0
1969 0
1970 0
1971 0
1972 0
1973 0
1974 0
1975 0
1976 0
1977 1
1978 0
1979 2
1980 0
1981 1
1982 2
1983 5
1984 21
1985 18
1986 18
1987 25
1988 11
1989 16
1990 23
1991 14
Year Executions
1992 31
1993 38
1994 31
1995 56
1996 45
1997 74
1998 68
1999 98
2000 85
2001 66
2002 71
2003 65
2004 59
2005 60
2006 53
2007 42
2008 37
2009 52
2010 46
2011 43
2012 43
2013 39
2014 35
2015 28
2016 20
2017 23
2018 25
2019 22
2020 17
2021 11
Note: Excludes 160 executions carried out by military authorities from 1930 to 1961.
Source: Bureau of Justice Statistics, National Prisoner Statistics program (NPS-8), 1930–2021.

e Bureau of Justice Statistics of the U.S. Department of Justice is the
principal federal agency responsible for measuring crime, criminal
victimization, criminal oenders, victims of crime, correlates of crime,
and the operation of criminal and civil justice systems at the federal,
state, tribal, and local levels. BJS collects, analyzes, and disseminates
reliable statistics on crime and justice systems in the United States,
supports improvements to state and local criminal justice information
systems, and participates with national and international organizations
to develop and recommend national standards for justice statistics.
Kevin M. Scott, PhD, is the acting director.
is report was written by Tracy L. Snell. Todd D. Minton, Stephanie
Mueller, and Laura M. Maruschak veried the report.
David Fialko and Brigit Baron edited the report. Jerey Link
produced the report.
November 2023, NCJ 305534
Oce of Justice Programs
Building Solutions • Supporting Communities • Advancing Justice
www.ojp.gov
NCJ 305534
