U.S. Department of Justice
Oce of Justice Programs
Bureau of Justice Statistics
Bureau of Justice Statistics · Statistical Tables
September 2020, NCJ 254786
Capital Punishment, 2018 –
Statistical Tables
Tracy L. Snell, BJS Statistician
A
t year-end 2018, a total of 30 states and
the Federal Bureau of Prisons (BOP) held
2,628 prisoners under sentence of death,
which was 75 (3%) fewer than at year-end 2017.
In 2018, the number of prisoners under sentence
of death declined for the 18th consecutive year.
irteen states and the BOP received a total
of 38 prisoners in 2018 who were under death
sentences. California (28%), Florida (13%),
and Texas (8%) held about half of the prisoners
under death sentences in the United States at
year-end 2018. Eight states executed a total of
25 prisoners in 2018, with Texas accounting for
more than half (13) of the executions.
is report presents statistics on persons who
were under sentence of death or were executed
in 2018, and on state and federal death-penalty
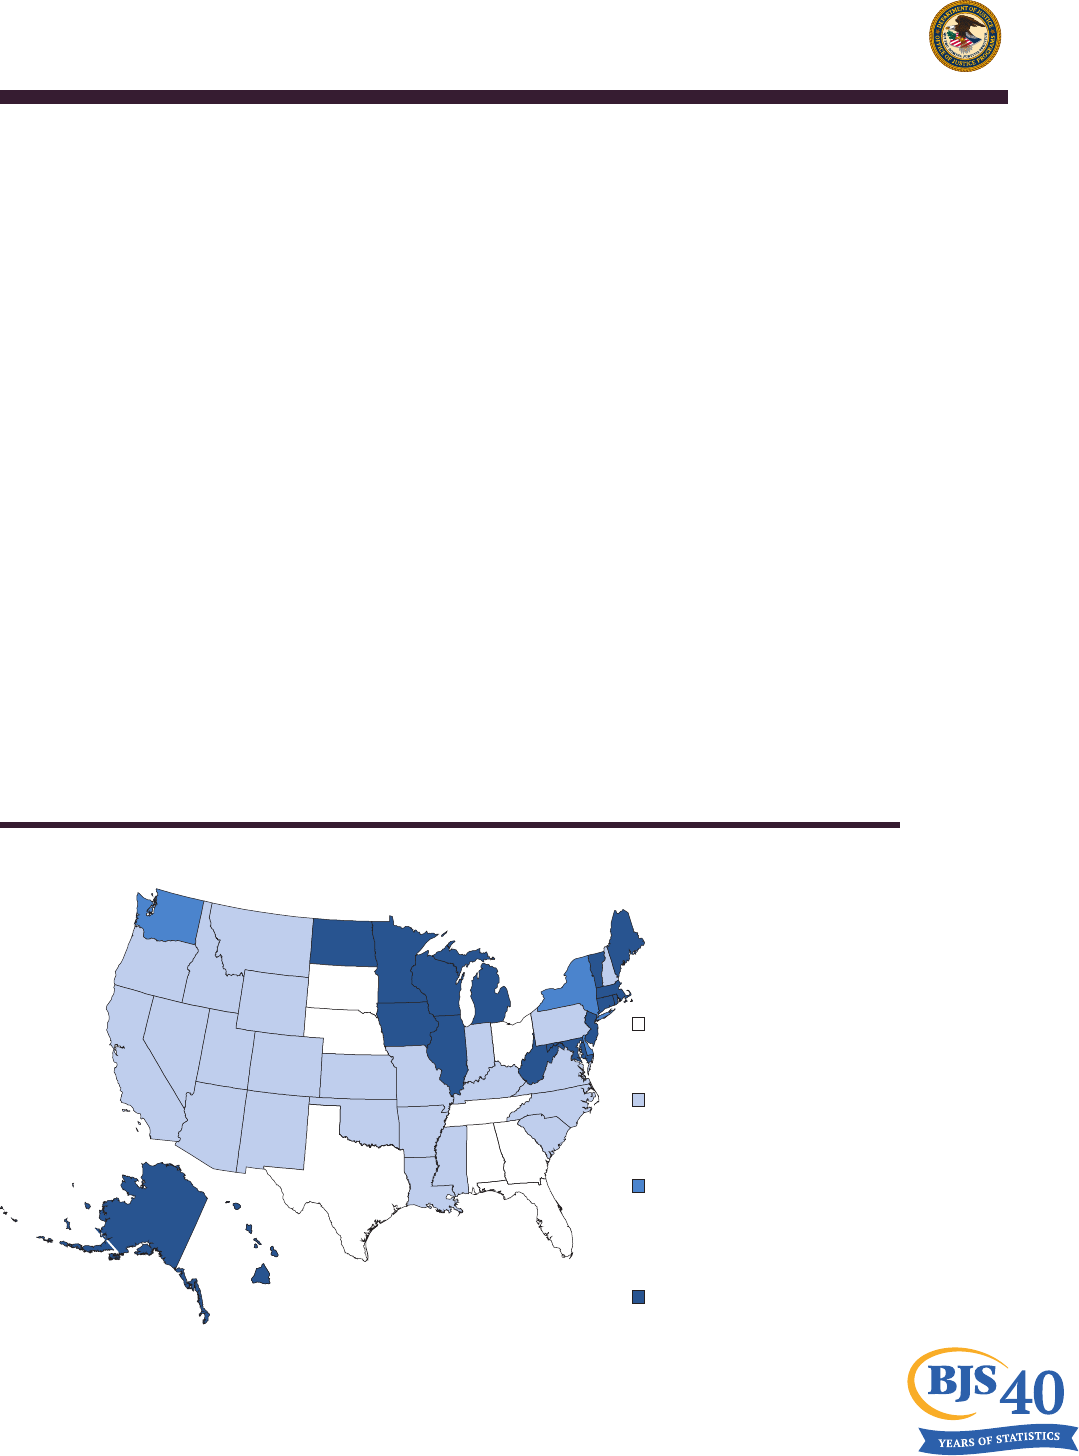
laws. At year-end 2018, a total of 34 states and
the federal government authorized the death
penalty (map 1). Each jurisdiction determines
the oenses for which the death penalty can be
imposed. Once a person has been convicted of a
capital oense, a separate sentencing hearing is
held. During the sentencing hearing, a jury will
consider aggravating and mitigating factors as
dened by state or federal law. Before a person
can be sentenced to death, a jury must nd
that at least one aggravating factor is present
and that mitigating factors do not outweigh the
aggravating factor(s).
MAP 1
States with and without death-penalty statutes, year-end 2018
Had a statute authorizing the death
penalty as of December 31, 2018
and carried out an execution in 2018
Had a statute authorizing the death
penalty as of December 31, 2018
but did not carry out an execution
in 2018
Had a statute authorizing the death
penalty as of December 31, 2018 that
had been invalidated by the state’s
highest court but had not been repealed
by the legislature
Had no statute authorizing the death
penalty as of December 31, 2018
Note: See table 2 for details on states that authorized the death penalty.
Source: Bureau of Justice Statistics, National Prisoner Statistics program (NPS-8), 2018.
Capital Punishment, 2018 – Statistical Tables | September 2020 2
Highlights
Nineteen states had a decrease in the number of
prisoners held under sentence of death from year-end
2017 to year-end 2018, while 2 states and the BOP had
an increase.
Eighteen states and the BOP removed a total of 88
prisoners from being under sentence of death in 2018
by means other than execution.
In 2018, the Washington Supreme Court ruled that
the state’s death-penalty law was unconstitutional,
and eight prisoners under sentence of death were
re-sentenced to life without parole.
During 2018, Delaware removed its remaining
death-row prisoner from a previously imposed
death sentence.
The largest declines in the number of prisoners under
death sentences in 2018 were in Pennsylvania and Texas
(down 11 prisoners each), followed by Washington
(down 8) and then Alabama, Florida, California, and
Nevada (down 6 each).
From year-end 2017 to year-end 2018, the number of
prisoners held under sentence of death in Arkansas
increased by two, while the BOP and Missouri each
increased their number by one.
At year-end 2018, 56% of prisoners under death
sentences were white and 42% were black.
Among prisoners under a death sentence at year-end
2018 with a known ethnicity, 15% were Hispanic.
Ninety-eight percent of prisoners under sentence of
death were male.
In three of the four (Census) regions in the country
(the West, Midwest, and South), more white prisoners
than black prisoners were under sentence of death at
year-end 2018.
The average elapsed time from sentencing to execution
almost tripled from 1988 (6.7 years) to 2018 (19.8 years).
FIGURE 1
Number of prisoners under sentence of death,
1953-2018
Number
4,000
3,500
3,000
2,500
2,000
1,500
1,000
500
0
1953 1960 1970 1980 1990 2000 2010 2018
Note: Data on the number of prisoners under sentence of death at
year-end have been collected since 1953. See appendix table 2 for
counts.
Source: Bureau of Justice Statistics, National Prisoner Statistics program
(NPS-8), 1953-2018.
FIGURE 2
Admissions to and removals from a sentence of death,
1973-2018
Number
350
300
250
200
150
100
50
0
1973 1980 1990 2000 2010 2018
Admissions
Removals
Note: Removals can be due to any cause, including execution, other
death, or appeal. See appendix table 3 for counts.
Source: Bureau of Justice Statistics, National Prisoner Statistics program
(NPS-8), 1973-2018.

Capital Punishment, 2018 – Statistical Tables | September 2020 3
FIGURE 3
Number of prisoners executed under civil authority in
the United States, 1930-2018
Executions
200
150
100
50
0
1930 1940 1950 1960 1970 1980 1990 2000 2010 2018
Note: Excludes 160 executions carried out by military authorities from
1930 to 1961. See appendix table 4 for counts.
Source: Bureau of Justice Statistics, National Prisoner Statistics program
(NPS-8), 1930-2018.
FIGURE 4
Number of prisoners under sentence of death, by race,
1968-2018
Number
2,000
1,500
1,000
500
0
White
a
Black
a
Other races
b
1968 1970 1980 1990 2000 2010 2018
Note: Data on Hispanic origin was not collected prior to 1977. See
appendix table 5 for counts.
a
Includes persons of Hispanic origin.
b
Includes Asians, Native Hawaiians, Other Pacic Islanders, American
Indians, Alaska Natives, and persons for whom only ethnicity
was identied.
Source: Bureau of Justice Statistics, National Prisoner Statistics program
(NPS-8), 1968-2018.
Terms and denitions
Aggravating factors—Specic elements of a crime
dened by statute. When present, these factors may
allow a jury to impose a death sentence for a person
convicted of a capital oense. These can also be called
aggravating circumstances.
Capital conviction—A formal declaration that a
defendant is guilty of a capital oense, made by the
verdict of a jury, the decision of a judge, or a guilty plea
by the defendant in a court of law.
Capital oense—A criminal oense that may be
punishable by death. Oenses that are eligible for
a death sentence are dened by statute in each
jurisdiction that authorizes capital punishment. The
most common is rst-degree murder accompanied by at
least one aggravating factor.
Capital punishment—The process of sentencing
convicted oenders to death for the most serious crimes
and carrying out that sentence. The specic oenses
and circumstances that determine if a crime is eligible
for a death sentence are dened by statute and are
prescribed by Congress or a state legislature.
Capital statute—A state or federal law dictating
specic crimes that are eligible for a death sentence and
specic procedures to be followed in carrying out such
a sentence.
Civil authorities—For the purposes of this report, the
state or federal entities responsible for implementation
and enforcement of capital-punishment laws, excluding
military authorities.
Commutation—Reduction of a death sentence by
the president (federal) or by a governor or a board of
advisors empaneled to review sentences (state). Criteria
for granting a commutation vary by state. The new
sentence can be for life or to a term of years.
Death row—A slang term referring to the area of a
prison in which prisoners under sentence of death
are housed. Usage of the term “death row” continues
despite the fact that many states do not maintain a
separate unit or facility for prisoners under sentence
of death.
Received under sentence of death—The admission of
a person to prison after they are sentenced to death by
a court.
Removal from being under sentence of death—The
removal of a prisoner who was previously sentenced
to death from the count of persons under sentence of
death. A prisoner can be relieved of a death sentence
by several methods: execution, death by causes other
than execution, commutation, or an overturned capital
conviction or sentence.
Sentence of death—A sentence imposed by a court for
a capital oense that authorizes the state to execute a
convicted oender.
Year-end—As of December 31 of the calendar year.

Capital Punishment, 2018 – Statistical Tables | September 2020 4
List of tables
TABLE 1. Status of the death penalty, December 31, 2018
TABLE 2. Capital oenses, by state, 2018
TABLE 3. Federal capital oenses, 2018
TABLE 4. Authorized methods of execution, by state, 2018
TABLE 5. Movement of prisoners under sentence of death, by region, jurisdiction, and race,
2017 and 2018
TABLE 6. Demographic characteristics of prisoners under sentence of death, 2018
TABLE 7. Female prisoners under sentence of death, by region, jurisdiction, and race, 2017 and 2018
TABLE 8. Hispanic prisoners under sentence of death, by region and jurisdiction, 2017 and 2018
TABLE 9. Criminal history of prisoners under sentence of death, by race or ethnicity, 2018
TABLE 10. Prisoners removed from being under sentence of death, by region, jurisdiction, and
method of removal, 2018
TABLE 11. Average elapsed time between sentencing and execution, 1977-2018
TABLE 12. Number of prisoners executed, by race or ethnicity, 1977-2018
TABLE 13. Number of executions, by method and jurisdiction, 1977-2018
TABLE 14. Cumulative number of executions at year-end 2018, by jurisdiction, since 1930 and
since 1977
List of figures
MAP 1. States with and without death-penalty statutes, year-end 2018
FIGURE 1. Number of prisoners under sentence of death, 1953-2018
FIGURE 2. Admissions to and removals from a sentence of death, 1973-2018
FIGURE 3. Number of prisoners executed under civil authority in the United States, 1930-2018
FIGURE 4. Number of prisoners under sentence of death, by race, 1968-2018
FIGURE 5. Advance count of executions, January 1, 2019-December 31, 2019
List of appendix tables
APPENDIX TABLE 1. Demographic characteristics for prisoners under sentence of death, 2018
APPENDIX TABLE 2. Number of prisoners under sentence of death, 1953-2018
APPENDIX TABLE 3. Admissions to and removals from a sentence of death, 1973-2018
APPENDIX TABLE 4. Number of prisoners executed under civil authority in the United States,
1930-2018
APPENDIX TABLE 5. Number of prisoners under sentence of death, by race, 1968-2018

Capital Punishment, 2018 – Statistical Tables | September 2020 5
Status of the death penalty in 2018
At year-end 2018, a total of 34 states and the federal
government authorized the death penalty for certain
oenses (tables 1, 2, and 3). Although New Mexico
repealed its death penalty in 2009 (2009 N.M. Laws,
ch. 11 § 5), the repeal was not retroactive, and
oenders charged with a capital oense committed
prior to the repeal date may be eligible for a death
sentence. As of December 31, 2018, New Mexico held
two men under death sentences.
e Washington State Supreme Court declared the
state’s death-penalty statute unconstitutional on
October 11, 2018. e court found in State v. Gregory
(192 Wash. 2d 1, 427 P.3d 621 (2018)) that the death
penalty was administered in an “arbitrary and racially
biased manner” and, therefore, violated the state
constitution. e ruling resulted in the removal of
eight prisoners from being under sentence of death
in Washington. e state’s legislature has not acted to
repeal the statute.
During 2018, the Alabama state legislature revised
statutory provisions for the death penalty. ey added
murder committed in the presence of a child younger
than age 14 when the murder victim was a parent to
that child (Ala. Stat. Ann. § 13A-5-40(a)(20)) to the list
of oenses eligible for a death sentence. e state also
added as aggravating factors the murder committed
either against a victim younger than age 14 or in the
presence of a child younger than age 14 when the
murder victim was a parent to that child (Ala. Stat.
Ann. § 13A-5-49 (11) and (12)). ese changes became
eective August 1, 2018.
South Dakota amended its code of criminal procedure
to prohibit persons with severe mental illness from
being sentenced to death (SDCL §§ 23A-27A-26.1 to
23A-27A-26.7). Persons deemed prior to trial to have
severe mental illness whose oenses occurred aer the
law’s enactment will be sentenced to life imprisonment
if convicted. e law became eective July 1, 2018.
TABLE 1
Status of the death penalty, December 31, 2018
Executions in 2018
Number of prisoners under
sentence of death in states
with a death-penalty statute
States with death-penalty statute
invalidated by state’s highest court
but not repealed by legislature
Jurisdictions with no
statute authorizing the
death penalty (17)
Texas 13 California 736 Delaware Alaska
Tennessee 3 Florida 344 New York Connecticut
Alabama 2 Texas 223 Washington District of Columbia
Florida 2 Alabama 176 Hawaii
Georgia 2 Pennsylvania 143 Illinois
Nebraska 1 North Carolina 140 Iowa
Ohio 1 Ohio 137 Maine
South Dakota 1 Arizona 116 Maryland
Nevada 75 Massachusetts
Louisiana 69 Michigan
Federal Bureau of Prisons 61 Minnesota
Tennessee 57 New Jersey
Georgia 50 North Dakota
Oklahoma 47 Rhode Island
Mississippi 43 Vermont
17 other states* 211 West Virginia
Wisconsin
Total 25 Total 2,628
Note: See table 2 for information on statutes.
*
New Mexico repealed its death penalty for capital oenses committed on or after July 1, 2009. As of December 31, 2018, two males in New Mexico
were under previously imposed death sentences. The other states with prisoners under sentence of death were Ark., Colo., Idaho, Ind., Kan., Ky., Mo.,
Mont., Neb., N.H., Ore., S.C., S.D., Va., and Utah. Wyoming held no prisoners under sentence of death during 2018.
Source: Bureau of Justice Statistics, National Prisoner Statistics program (NPS-8), 2018.

Capital Punishment, 2018 – Statistical Tables | September 2020 6
TABLE 2
Capital oenses, by state, 2018
State Oense
Alabama
Arizona
Arkansas
California
Colorado
Delaware
a
Florida
Georgia
Idaho
Indiana
Kansas
Kentucky
Louisiana
Mississippi
Missouri
Montana
Nebraska
Nevada
New Hampshire
New Mexico
b
New York
c
North Carolina
Ohio
Oklahoma
Oregon
Pennsylvania
South Carolina
South Dakota
Tennessee
Texas
Utah
Virginia
Washington
d
Wyoming
Intentional murder (Ala. Stat. Ann. § 13A-5-40(a)(1)-(20)) with 12 aggravating factors (Ala. Stat. Ann. § 13A-5-49).
First-degree murder, including pre-meditated murder and felony murder, accompanied by at least 1 of 14 aggravating
factors (A.R.S. § 13-703(F)).
Capital murder (Ark. Code Ann. § 5-10-101) with a nding of at least 1 of 10 aggravating circumstances; and treason (Ark.
Code Ann. § 5-51-201).
First-degree murder with special circumstances; military sabotage; train-wreck causing death; treason; perjury resulting in
execution of an innocent person; and fatal assault by a prisoner serving a life sentence.
First-degree murder with at least 1 of 17 aggravating factors; rst-degree kidnapping resulting in death; and treason.
First-degree murder (11 Del. C. § 636) with at least 1 statutory aggravating circumstance (11 Del. C. § 4209).
First-degree murder with aggravating factors; felony murder; and capital drug-tracking felonies.
Murder with aggravating circumstances; rape, armed robbery, or kidnapping with bodily injury or ransom when the victim
dies; aircraft hijacking; and treason (O.C.G.A. § 17-10-30).
First-degree murder with aggravating factors; rst-degree kidnapping; and perjury resulting in the execution of an
innocent person.
Murder with 18 aggravating circumstances (I.C. 35-50-2-9).
Intentional and pre-meditated killing of a person in 1 or more of 7 dierent circumstances (K.S.A. 21-5401).
Capital murder with the presence of at least 1 statutory aggravating circumstance; and capital kidnapping (K.R.S. 532.025).
First-degree murder with aggravating circumstances (La. R.S. 14:30); and treason (La. R.S. 14:113).
Capital murder with aggravating circumstances (Miss. Code Ann. § 97-3-19(2)); and aircraft piracy (Miss. Code Ann.
§ 97-25-55(1)).
First-degree murder with at least 1 statutory aggravating circumstance (565.020 R.S.M.O. 2000).
Capital murder with 1 of 9 aggravating circumstances (Mont. Code Ann. § 46-18-303); aggravated kidnapping resulting
in death of victim or rescuer; felony murder; aggravated assault or aggravated kidnapping while in detention; and capital
sexual intercourse without consent (Mont. Code Ann. § 45-5-503).
First-degree murder with a nding of 1 or more statutory aggravating circumstances.
First-degree murder with at least 1 of 15 aggravating circumstances (N.R.S. 200.030, 200.033, 200.035).
Murder committed in the course of rape, kidnapping, drug crimes, or home invasion; killing of a police ocer, judge,
or prosecutor; murder for hire; and murder by a prisoner while serving a sentence of life without parole (R.S.A. 630:1,
R.S.A. 630:5).
First-degree murder with at least 1 of 7 aggravating factors (N.M.S.A. 1978 § 31-20A-5).
First-degree murder with 1 of 13 aggravating factors (NY Penal Law §125.27).
First-degree murder (N.C.G.S. §14-17) with the nding of at least 1 of 11 statutory aggravating circumstances (N.C.G.S.
§ 15A-2000).
Aggravated murder with at least 1 of 10 aggravating circumstances (O.R.C. 2903.01, 2929.02, and 2929.04).
First-degree murder (21 O.S. § 701.7) in conjunction with a nding of at least 1 of 8 statutorily dened aggravating
circumstances (21 O.S. § 701.12) .
Aggravated murder (O.R.S. 163.095).
First-degree murder (18 Pa.C.S.A § 2502(a)) with 18 aggravating circumstances (42 Pa.C.S.A § 9711).
Murder with at least 1 of 12 aggravating circumstances (§ 16-3-20(C)(a)).
First-degree murder (S.D.C.L. 22-16-4) with 1 of 10 aggravating circumstances (S.D.C.L. 23A-27A-1).
First-degree murder (Tenn. Code Ann. § 39-13-202) with 1 of 15 aggravating circumstances (Tenn. Code Ann. § 39-13-204).
Criminal homicide with 1 of 9 statutory aggravators (Tex. Penal Code § 19.03).
Aggravated murder (Utah Code Ann. § 76-5-202).
Pre-meditated murder with 1 of 15 aggravating circumstances (VA Code § 18.2-31(1-15)).
Aggravated rst-degree murder.
First-degree murder; and murder during the commission of sexual assault, sexual abuse of a minor, arson, robbery,
burglary, escape, resisting arrest, kidnapping, or abuse of a minor younger than age 16 (W.S.A. § 6-2-101(a)).
a
The Delaware Supreme Court held that a portion of Delaware’s death-penalty-sentencing statute (11 Del. C. § 4209) was unconstitutional (Rauf v.
State, 145 A.3d 430 (Del. 2016)). No legislative action has been taken to amend the statute. As a result, capital cases are no longer pursued in Delaware.
b
New Mexico enacted a prospective repeal of its capital statute as of July 1, 2009. Oenders who committed capital oenses on or before that date
are eligible for the death penalty.
c
The New York Court of Appeals held that a portion of New York’s death-penalty-sentencing statute (CPL 400.27) was unconstitutional (People v. Taylor,
9 N.Y. 3d 129 (2007)). No legislative action has been taken to amend the statute. As a result, capital cases are no longer pursued in New York.
d
The Washington Supreme Court has declared the state’s death-penalty statute unconstitutional (State v. Gregory, 192 Wash. 2d 1, 427 P.3d 621
(2018)). No legislative action has been taken to repeal the statute.
Source: Bureau of Justice Statistics, National Prisoner Statistics program (NPS-8), 2018.

Capital Punishment, 2018 – Statistical Tables | September 2020 7
TABLE 3
Federal capital oenses, 2018
Federal statute Oense
8 U.S.C. § 1342 Murder related to the smuggling of aliens.
18 U.S.C. §§ 32-34 Destruction of aircraft, motor vehicles, or related facilities, resulting in death.
18 U.S.C. § 36 Murder committed during a drug-related drive-by shooting.
18 U.S.C. § 37 Murder committed at an airport serving international civil aviation.
18 U.S.C. § 115(b)(3) [by cross-reference
to 18 U.S.C. § 1111]
Retaliatory murder of a member of the immediate family of a law enforcement ocial.
18 U.S.C. §§ 241, 242, 245, 247 Civil-rights oenses resulting in death.
18 U.S.C. § 351 [by cross-reference to 18 U.S.C. § 1111] Murder of a member of Congress, an important executive ocial, or a U.S. Supreme
Court justice.
18 U.S.C. § 794 Espionage.
18 U.S.C. §§ 844(d), (f ), (i) Death resulting from oenses involving transportation of explosives, destruction of
government property, or destruction of property related to foreign or interstate commerce.
18 U.S.C. § 924(i) Murder committed by the use of a rearm during a crime of violence or a drug-tracking crime.
18 U.S.C. § 930 Murder committed in a federal government facility.
18 U.S.C. § 1091 Genocide.
18 U.S.C. § 1111 First-degree murder.
18 U.S.C. § 1114 Murder of a federal judge or law enforcement ocial.
18 U.S.C. § 1116 Murder of a foreign ocial.
18 U.S.C. § 1118 Murder by a federal prisoner.
18 U.S.C. § 1119 Murder of a U.S. national in a foreign country.
18 U.S.C. § 1120 Murder by an escaped federal prisoner already sentenced to life imprisonment.
18 U.S.C. § 1121 Murder of a state or local law enforcement ocial or other person aiding in a federal
investigation; or murder of a state correctional ocer.
18 U.S.C. § 1201 Murder during a kidnapping.
18 U.S.C. § 1203 Murder during a hostage-taking.
18 U.S.C. § 1503 Murder of a court ocer or juror.
18 U.S.C. § 1512 Murder with the intent of preventing testimony by a witness, a victim, or an informant.
18 U.S.C. § 1513 Retaliatory murder of a witness, a victim, or an informant.
18 U.S.C. § 1716 Mailing of injurious articles with intent to kill or resulting in death.
18 U.S.C. § 1751 [by cross-reference to
18 U.S.C. § 1111]
Assassination or kidnapping resulting in the death of the U.S. president or U.S. vice president.
18 U.S.C. § 1958 Murder for hire.
18 U.S.C. § 1959 Murder involved in a racketeering oense.
18 U.S.C. § 1992 Willful wrecking of a train resulting in death.
18 U.S.C. § 2113 Murder or kidnapping related to bank robbery.
18 U.S.C. § 2119 Murder related to a carjacking.
18 U.S.C. § 2245 Murder related to rape or child molestation.
18 U.S.C. § 2251 Murder related to sexual exploitation of children.
18 U.S.C. § 2280 Murder committed during an oense against maritime navigation.
18 U.S.C. § 2281 Murder committed during an oense against a maritime xed platform.
18 U.S.C. § 2332 Terrorist murder of a U.S. national in another country.
18 U.S.C. § 2332a Murder by the use of a weapon of mass destruction.
18 U.S.C. § 2340 Murder involving torture.
18 U.S.C. § 2381 Treason.
21 U.S.C. § 848(e) Murder related to a continuing criminal enterprise, or related murder of a federal, state, or local
law enforcement ocer.
49 U.S.C. §§ 1472-1473 Death resulting from aircraft hijacking.
Source: Bureau of Justice Statistics, National Prisoner Statistics program (NPS-8), 2018.
Capital Punishment, 2018 – Statistical Tables | September 2020 8
Authorized methods of execution in 2018
Methods of execution are dened by statute and
vary by jurisdiction. In 2018, all 34 states with a
death-penalty statute authorized lethal injection
as a method of execution (table 4). Sixteen states
authorized one or more alternative methods of
execution: electrocution (9 states), lethal gas (3),
hanging (3), ring squad (3), and nitrogen hypoxia (3).
In states that authorized multiple methods of
execution, the condemned prisoner could usually select
the method. Five states (Arizona, Arkansas, Kentucky,
Tennessee, and Utah) stipulated which method must
be used, depending on the date of either the oense
or sentencing. New Hampshire authorized hanging
only if lethal injection could not be given. Five states
authorized alternative methods if lethal injection was
ruled to be unconstitutional: Delaware authorized
hanging; Mississippi and Oklahoma authorized
electrocution, ring squad, or nitrogen hypoxia; Utah
authorized ring squad; and Wyoming authorized
lethal gas.
Federal prisoners are executed by lethal injection,
pursuant to 28 C.F.R. Part 26. For oenses prosecuted
under the federal Violent Crime Control and Law
Enforcement Act of 1994, the law of the state in which
the conviction took place dictates the method used
(18 U.S.C. § 3596).
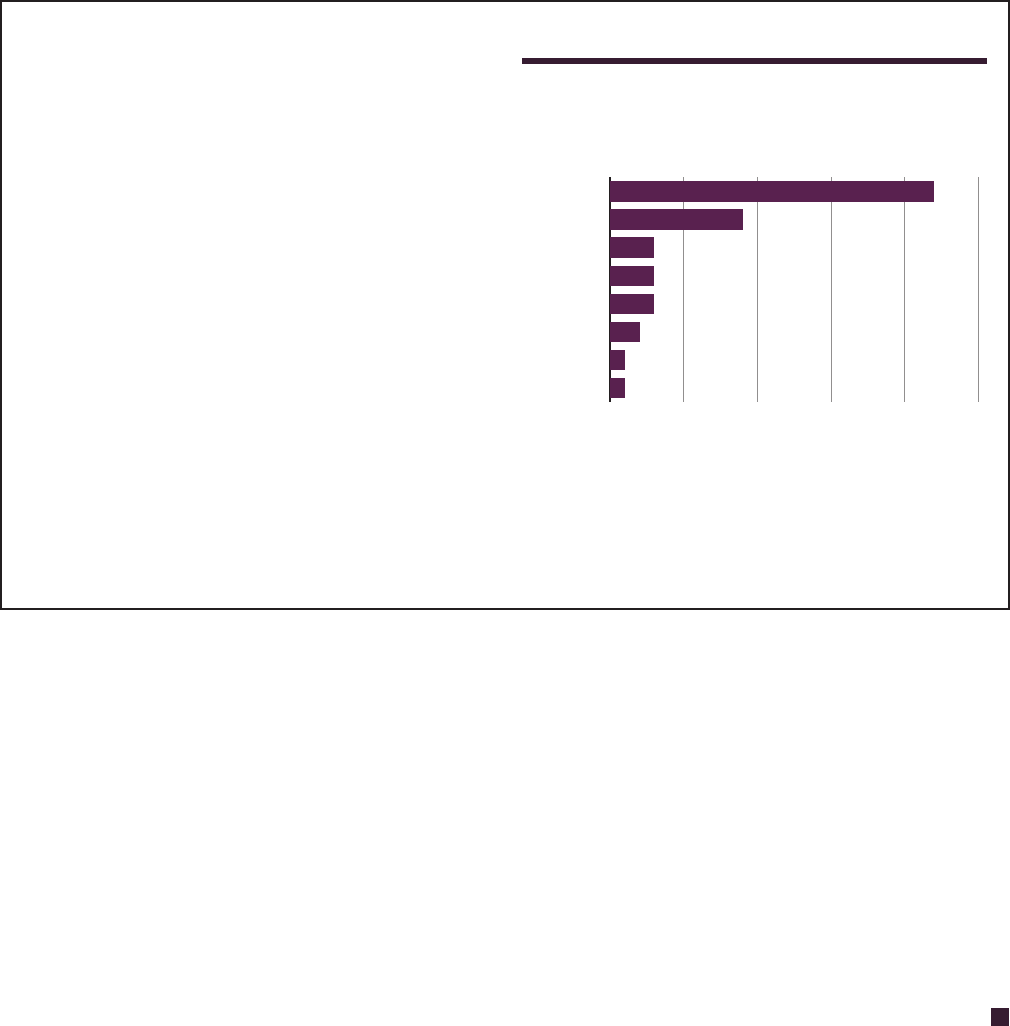
Advance count of executions in 2019
The Bureau of Justice Statistics gathers information
following each execution to provide the most recent
data on capital punishment in advance of the annual
data collection. The data include the date, jurisdiction,
and method of execution, and the race and Hispanic
origin for each person executed.
From January 1, 2019 to December 31, 2019, seven
states executed 22 prisoners, which was 3 fewer than
the number executed in 2018 (gure 5). Texas (9
prisoners) executed the largest number of prisoners
during this period, followed by Alabama, Georgia, and
Tennessee (3 prisoners each). Twenty of the executions
in 2019 were by lethal injection, while 2 (in Tennessee)
were by electrocution. Fourteen of those executed were
white, 7 were black, and 1 was Hispanic. No females
were executed during this period.
Final counts for 2019 will appear in Capital Punishment,
2019. This annual report will consist of data collected
from state and federal correctional agencies. The
report will cover all persons under sentence of death
on December 31, 2019, as well as those removed from
being under sentence of death during the year.
FIGURE 5
Advance count of executions, January 1, 2019-
December 31, 2019
Jurisdiction
Total
Texas
Alabama
Georgia
Tennessee
Florida
Missouri
South Dakota
Number of executions
0 5 10 15 20 25
Source: Bureau of Justice Statistics, National Prisoner Statistics
program (NPS-8), 2018.

Capital Punishment, 2018 – Statistical Tables | September 2020 9
TABLE 4
Authorized methods of execution by state 2018 , ,
Jurisdiction Lethal injection Electrocution Lethal gas Hanging Firing squad Nitrogen hypoxia
Total 34 9 3 3 3 3
Alabama
Arizona
a
Arkansas
b
California
c
Colorado
Delaware
d
Florida
Georgia
Idaho
Indiana
Kansas
Kentucky
e
Louisiana
Mississippi
f
Missouri
Montana
Nebraska
Nevada
New Hampshire
g
New Mexico
h
New York
North Carolina
Ohio
Oklahoma
f
Oregon
Pennsylvania
South Carolina
South Dakota
i
Tennessee
j
Texas
Utah
k
Virginia
Washington
Wyoming
l
Note: The method of execution of federal prisoners is lethal injection, pursuant to 28 C.F.R. Part 26. For oenses prosecuted under the Violent Crime
Control and Law Enforcement Act of 1994, the execution method is that of the state in which the conviction took place (18 U.S.C. § 3596).
a
Authorizes lethal injection for persons sentenced after November 23,1992. Prisoners sentenced before that date may select lethal injection or gas.
b
Authorizes lethal injection for persons whose oense occurred on or after July 4, 1983. Prisoners whose oense occurred before that date may select
lethal injection or electrocution. Electrocution is the authorized method if lethal injection is invalidated by an unappealable court order.
c
Both lethal injection and lethal gas are authorized by statute (Cal. Pen. Code 3604). However, use of lethal gas was invalidated by a federal court
(Fierro v. Terhune, 147 F.3d 1158, 1160 (9th Cir. 1998)).
d
Authorizes hanging if lethal injection is held to be unconstitutional by a court of competent jurisdiction.
e
Authorizes lethal injection for persons sentenced on or after March 31, 1998. Prisoners sentenced before that date may select lethal injection
or electrocution.
f
Authorizes nitrogen hypoxia if lethal injection is held to be unconstitutional, electrocution if both lethal injection and nitrogen hypoxia are held to be
unconstitutional, and ring squad if all other methods are held to be unconstitutional.
g
Authorizes hanging only if lethal injection cannot be given.
h
Authorizes lethal injection for persons whose capital oense occurred prior to July 1, 2009.
i
Any person sentenced to death before July 1, 2017 may choose to be executed in the manner provided by South Dakota law at the time of the
person’s conviction or sentence.
j
Authorizes lethal injection for persons whose capital oense occurred after December 31, 1998. Prisoners whose oense occurred before that date
may select electrocution by written waiver. Electrocution is the authorized method if a court or the commissioner of corrections determines that lethal
injection cannot be given. If both methods are ruled unconstitutional, state law allows for the use of any method that is constitutional.
k
Authorizes ring squad if lethal injection is held unconstitutional. Prisoners who selected execution by ring squad prior to May 3, 2004, may still be
entitled to execution by that method.
l
Authorizes lethal gas if lethal injection is held to be unconstitutional.
Source: Bureau of Justice Statistics, National Prisoner Statistics program (NPS-8), 2018.

Capital Punishment, 2018 – Statistical Tables | September 2020 10
Methodology
e Bureau of Justice Statistics (BJS) collects
information about capital punishment each year
through the National Prisoner Statistics program
(NPS-8). BJS collects this data series in two parts:
Data on persons under sentence of death are
obtained from the department of corrections in each
jurisdiction that authorizes capital punishment.
e status of death-penalty statutes is obtained
from the Oce of the Attorney General in each of
the 50 states, the Oce of the U.S. Attorney in the
District of Columbia, and the Federal Bureau of
Prisons for the federal government.
Data-collection forms are available on the BJS website
at www.bjs.gov
e NPS-8 covers all persons under a state or federal
civil sentence of death at any time during the year. is
includes capital oenders transferred from prison to
a mental institution and those who may have escaped
from custody. It excludes persons sentenced to death
under the Uniform Code of Military Justice and those
whose death sentences have been overturned by a
court or an executive action, regardless of their current
incarceration status.
Statistics in this report may dier from data collected
by other organizations for various reasons:
e NPS-8 adds prisoners to the population under
sentence of death at the time they are admitted to a
state or federal correctional facility, not at the time
they are sentenced.
If prisoners entered prison under a death sentence or
were reported as being relieved of a death sentence
in one year but the admission or removal occurred
in a previous year, counts are adjusted to reect the
actual date of sentence or removal.
NPS-8 counts are for the last day of the calendar year
and will dier from counts for more recent periods.

Capital Punishment, 2018 – Statistical Tables | September 2020 11
TABLE 5
Movement of prisoners under sentence of death, by region, jurisdiction, and race, 2017 and 2018
Region and
jurisdiction
a
U.S. total
Prisoners under sentence
of death, 12/31/17
Total
c
White
d
Black
d
2,703 1,508 1,129
Received under
sentence of death, 2018
Total
c
White
d
Black
d
38 28 9
Removed from death row
(excluding executions), 2018
b
Total
c
White
d
Black
d
88 48 38
Executed, 2018
Total
c
White
d
Black
d
25 19 6
Prisoners under sentence
of death, 12/31/18
Total
c
White
d
Black
d
2,628 1,469 1,094
Federal
e
60 33 26 2 2 0 1 0 1 0 0 0 61 35 25
State 2,643 1,475 1,103 36 26 9 87 48 37 25 19 6 2,567 1,434 1,069
Northeast 155 71 81 1 1 0 12 7 5 0 0 0 144 65 76
New Hampshire 1 0 1 0 0 0 0 0 0 0 0 0 1 0 1
New York 0 0 0 0 0 0 0 0 0 0 0 0 0 0 0
Pennsylvania 154 71 80 1 1 0 12 7 5 0 0 0 143 65 75
Midwest 196 102 93 6 4 2 4 3 1 3 3 0 195 100 94
Indiana 10 7 3 0 0 0 0 0 0 0 0 0 10 7 3
Kansas 10 7 3 0 0 0 0 0 0 0 0 0 10 7 3
Missouri 24 17 7 1 1 0 0 0 0 0 0 0 25 18 7
Nebraska 11 8 3 1 1 0 0 0 0 1 1 0 11 8 3
Ohio 138 60 77 4 2 2 4 3 1 1 1 0 137 58 78
South Dakota 3 3 0 0 0 0 0 0 0 1 1 0 2 2 0
South 1,286 668 600 22 16 5 39 16 22 22 16 6 1,247 652 577
Alabama 182 88 93 3 3 0 7 1 5 2 2 0 176 88 88
Arkansas 29 14 15 2 2 0 0 0 0 0 0 0 31 16 15
Delaware 1 0 1 0 0 0 1 0 1 0 0 0 0 0 0
Florida 350 215 134 7 6 1 11 4 7 2 2 0 344 215 128
Georgia 55 25 30 0 0 0 3 2 1 2 0 2 50 23 27
Kentucky 32 27 5 0 0 0 2 2 0 0 0 0 30 25 5
Louisiana 71 23 48 1 1 0 3 1 2 0 0 0 69 23 46
Mississippi 43 19 23 2 1 1 2 2 0 0 0 0 43 18 24
North Carolina 143 58 78 0 0 0 3 2 1 0 0 0 140 56 77
Oklahoma 48 22 23 1 0 0 2 0 2 0 0 0 47 22 21
South Carolina 35 16 19 0 0 0 0 0 0 0 0 0 35 16 19
Tennessee 60 32 27 0 0 0 0 0 0 3 3 0 57 29 27
Texas 234 128 102 6 3 3 4 1 3 13 9 4 223 121 98
Virginia 3 1 2 0 0 0 1 1 0 0 0 0 2 0 2
West 1,006 634 329 7 5 2 32 22 9 0 0 0 981 617 322
Arizona 120 94 19 2 0 2 6 5 1 0 0 0 116 89 20
California 742 438 272 5 5 0 11 7 3 0 0 0 736 436 269
Colorado 3 0 3 0 0 0 0 0 0 0 0 0 3 0 3
Idaho 9 9 0 0 0 0 0 0 0 0 0 0 9 9 0
Montana 2 2 0 0 0 0 0 0 0 0 0 0 2 2 0
Nevada 81 50 29 0 0 0 6 4 2 0 0 0 75 46 27
New Mexico 2 2 0 0 0 0 0 0 0 0 0 0 2 2 0
Oregon 30 27 2 0 0 0 0 0 0 0 0 0 30 27 2
Utah 9 7 1 0 0 0 1 1 0 0 0 0 8 6 1
Washington 8 5 3 0 0 0 8 5 3 0 0 0 0 0 0
Wyoming 0 0 0 0 0 0 0 0 0 0 0 0 0 0 0
Note: Some counts for year-end 2017 are revised from those reported in Capital Punishment, 2017: Selected Findings (NCJ 253060, BJS, July 2019). The revised
counts include 5 prisoners who were reported late to the National Prisoner Statistics program or were not in the custody of state correctional authorities on
December 31, 2017 (1 in the Federal Bureau of Prisons, 1 in Florida, 1 in Mississippi, and 2 in Oklahoma). The revised counts exclude 5 prisoners who were relieved
of a death sentence before December 31, 2017 (3 in Mississippi and 2 in Nevada).
a
Based on U.S. Census Bureau’s regions and divisions of the United States. https://www2.census.gov/geo/pdfs/maps-data/maps/reference/us_regdiv.pdf
b
Includes 16 deaths from natural causes (2 each in Alabama, Arizona, California, Georgia, and Pennsylvania and 1 each in Florida, Kentucky, Nevada, North Carolina,
Ohio, and Utah); 4 deaths by suicide (2 in California and 1 each in Alabama and Oklahoma); 3 deaths from acute drug toxicity (California), and 1 death from murder
by another prisoner (California).
c
Includes Asians, Native Hawaiians, Other Pacic Islanders, American Indians, Alaska Natives, and persons for whom only ethnicity was identied.
d
Includes persons of Hispanic origin.
e
Excludes persons held under the jurisdiction of the U.S. Armed Forces with a military death sentence for murder.
Source: Bureau of Justice Statistics, National Prisoner Statistics program (NPS-8), 2018.

Capital Punishment, 2018 – Statistical Tables | September 2020 12
TABLE 6
Demographic characteristics of prisoners under sentence of death, 2018
Demographic characteristic Total year-end Admissions Removals
Total 2,628 38 113
Sex
Male 98.0% 100% 100%
Female 2.0 0.0 0.0
Race
White
a
55.9% 73.7% 59.3%
Black
a
41.6 23.7 38.9
Other
a,b
2.5 2.6 1.8
Ethnicity
c
Hispanic 15.0% 23.7% 14.2%
Non-Hispanic 85.0 76.3 85.8
Age
18-19 0.0% 0.0% 0.0%
20-24 0.2 2.6 0.0
25-29 1.9 15.8 0.9
30-34 4.9 21.1 6.2
35-39 9.4 18.4 9.7
40-44 14.1 13.2 8.8
45-49 18.0 7.9 17.7
50-54 15.8 7.9 12.4
55-59 15.6 7.9 14.2
60-64 9.8 5.3 12.4
65 or older 10.2 0.0 17.7
Average age
Mean 50 yrs. 40 yrs. 53 yrs.
Median 50 38 51
Education
d
8th grade or less 11.8% 0.0% 14.8%
9th-11th grade 34.6 38.9 33.0
High-school graduate/GED 44.2 50.0 42.0
Any college 9.3 11.1 10.2
Median education level 12th grade 12th grade 12th grade
Marital status
e
Married 21.3% 26.1% 16.3%
Divorced/separated 19.5 17.4 28.3
Widowed 3.6 8.7 5.4
Never married 55.5 47.8 50.0
Note: Percentages are based on prisoners for whom data were reported. Details may not sum to 100% due to
rounding. See appendix table 1 for counts.
a
Includes persons of Hispanic origin.
b
Includes 38 Asians, 6 Native Hawaiians or Other Pacic Islanders, and 21 American Indians or Alaska Natives
(AIANs) at year-end 2018. One AIAN prisoner was admitted and 2 Asian prisoners were removed during 2018.
c
Excludes 238 prisoners from total year-end and 7 removals because ethnicity was unknown.
d
Excludes 541 prisoners from total year-end, 20 admissions, and 25 removals because education level
was unknown.
e
Excludes 368 prisoners from total year-end, 15 admissions, and 21 removals because marital status
was unknown.
Source: Bureau of Justice Statistics, National Prisoner Statistics program (NPS-8), 2018.

Capital Punishment, 2018 – Statistical Tables | September 2020 13
TABLE 7
Female prisoners under sentence of death, by region, jurisdiction, and race, 2017 and 2018
Region and
jurisdiction
a
U.S. total
Under sentence of death, 12/31/17
Total
b
White
c
Black
c
53 39 11
Received under
sentence of
death, 2018
0
Removed
from death
row, 2018
0
Under sentence of death, 12/31/18
Total
b
White
c
Black
c
53 39 11
Federal 1 1 0 0 0 1 1 0
State 52 38 11 0 0 52 38 11
Midwest 2 1 1 0 0 2 1 1
Indiana 1 0 1 0 0 1 0 1
Ohio 1 1 0 0 0 1 1 0
South 22 14 7 0 0 22 14 7
Alabama 5 4 1 0 0 5 4 1
Florida 3 1 2 0 0 3 1 2
Kentucky 1 1 0 0 0 1 1 0
Louisiana 1 0 1 0 0 1 0 1
Mississippi 1 1 0 0 0 1 1 0
North Carolina 3 1 1 0 0 3 1 1
Oklahoma 1 1 0 0 0 1 1 0
Tennessee 1 1 0 0 0 1 1 0
Texas 6 4 2 0 0 6 4 2
West 28 23 3 0 0 28 23 3
Arizona 3 3 0 0 0 3 3 0
California 23 18 3 0 0 23 18 3
Idaho 1 1 0 0 0 1 1 0
Oregon 1 1 0 0 0 1 1 0
a
Based on U.S. Census Bureau’s regions and divisions of the United States. https://www2.census.gov/geo/pdfs/maps-data/maps/reference/us_regdiv.pdf
b
Includes Asians, Native Hawaiians, Other Pacic Islanders, American Indians, and Alaska Natives.
c
Includes persons of Hispanic origin. Counts may dier from other tables in this report.
Source: Bureau of Justice Statistics, National Prisoner Statistics program (NPS-8), 2018.

Capital Punishment, 2018 – Statistical Tables | September 2020 14
TABLE 8
Hispanic prisoners under sentence of death, by region and jurisdiction, 2017 and 2018
Received under Removed from death
Region and jurisdiction*
Under sentence
of death, 12/31/17
sentence
of death, 2018
row (excluding
executions), 2018 Executed, 2018
Under sentence of
death, 12/31/18
U.S. total 365 9 10 5 359
Federal 7 0 0 0 7
State 358 9 10 5 352
Northeast 17 0 1 0 16
Pennsylvania 17 0 1 0 16
Midwest 9 1 0 0 10
Nebraska 5 1 0 0 6
Ohio 4 0 0 0 4
South 100 3 2 5 96
Alabama 1 0 0 0 1
Delaware 1 0 0 0 1
Florida 23 1 1 1 22
Georgia 2 0 0 0 2
Louisiana 2 0 0 0 2
Mississippi 1 0 0 0 1
North Carolina 4 0 1 0 3
Oklahoma 1 0 0 0 1
South Carolina 1 0 0 0 1
Tennessee 1 0 0 0 1
Texas 63 2 0 4 61
West 232 5 7 0 230
Arizona 24 0 0 0 24
California 193 5 5 0 193
Idaho 1 0 0 0 1
Nevada 8 0 1 0 7
Oregon 3 0 0 0 3
Utah 3 0 1 0 2
*Based on U.S. Census Bureau’s regions and divisions of the United States. https://www2.census.gov/geo/pdfs/maps-data/maps/reference/us_regdiv.pdf
Source: Bureau of Justice Statistics, National Prisoner Statistics program (NPS-8), 2018.

Capital Punishment, 2018 – Statistical Tables | September 2020 15
TABLE 9
Criminal history of prisoners under sentence of death, by race or ethnicity, 2018
All prisoners
a
White
b
Black
b
Hispanic
U.S. total 100% 100% 100% 100%
Prior felony conviction
c
Yes 67.8% 63.9% 73.1% 65.8%
No 32.2 36.1 26.9 34.2
Prior homicide conviction
d
Yes 9.4% 9.2% 10.1% 9.0%
No 90.6 90.8 89.9 91.0
Legal status at time of capital oense
e
Charge pending 8.1% 9.7% 7.4% 5.5%
Probation 11.2 10.2 11.1 14.4
Parole 16.3 14.0 18.1 17.7
On escape 1.2 1.7 0.8 0.9
Incarcerated 4.0 5.2 3.1 3.1
Other status 0.1 0.0 0.1 0.3
None 59.1 59.2 59.3 58.1
Note: Percentages are based on prisoners for whom data were reported. Details may not sum to totals due to rounding.
a
Includes Asians, Native Hawaiians, Other Pacic Islanders, American Indians, and Alaska Natives.
b
Excludes persons of Hispanic origin (e.g., “white” refers to non-Hispanic whites and “black” refers to non-Hispanic blacks).
c
Excludes 200 prisoners because data were not reported.
d
Excludes 33 prisoners because data were not reported.
e
Excludes 296 prisoners because data were not reported.
Source: Bureau of Justice Statistics, National Prisoner Statistics program (NPS-8), 2018.

Capital Punishment, 2018 – Statistical Tables | September 2020 16
TABLE 10
Prisoners removed from being under sentence of death, by region, jurisdiction, and method of removal, 2018
Region and
jurisdiction
a
Total Execution Other death
b
Sentence
commuted
Appeals court or higher court overturned—
Capital Capital conviction Death
statute and sentence sentence only
U.S. total 113 25 24 3 9 10 42
Federal 1 0 0 0 0 0 1
State 112 25 24 3 9 10 41
Northeast 12 0 2 0 0 4 6
Pennsylvania 12 0 2 0 0 4 6
Midwest 7 3 1 2 0 1 0
Nebraska 1 1 0 0 0 0 0
Ohio 5 1 1 2 0 1 0
South Dakota 1 1 0 0 0 0 0
South 61 22 9 1 1 3 25
Alabama 9 2 3 0 0 0 4
Delaware 1 0 0 0 0 0 1
Florida 13 2 1 0 0 0 10
Georgia 5 2 2 0 0 0 1
Kentucky 2 0 1 0 1 0 0
Louisiana 3 0 0 0 0 2 1
Mississippi 2 0 0 0 0 0 2
North Carolina 3 0 1 0 0 0 2
Oklahoma 2 0 1 0 0 0 1
Tennessee 3 3 0 0 0 0 0
Texas 17 13 0 1 0 1 2
Virginia 1 0 0 0 0 0 1
West 32 0 12 0 8 2 10
Arizona 6 0 2 0 0 0 4
California 11 0 8 0 0 1 2
Nevada 6 0 1 0 0 1 4
Utah 1 0 1 0 0 0 0
Washington 8 0 0 0 8 0 0
a
Based on U.S. Census Bureau’s regions and divisions of the United States. https://www2.census.gov/geo/pdfs/maps-data/maps/reference/us_regdiv.pdf
b
In 2018, other deaths were due to natural causes, suicide, acute drug toxicity, and homicide by another prisoner.
Source: Bureau of Justice Statistics, National Prisoner Statistics program (NPS-8), 2018.

Capital Punishment, 2018 – Statistical Tables | September 2020 17
TABLE 11
Average elapsed time between sentencing and
execution, 1977-2018
Year
a
Executions
Average elapsed time from
sentence to execution
b
Total 1,490 144 mos.
1977 1 3
1979 2 42
1981 1 13
1982 2 53
1983 5 71
1984 21 74
1985 18 71
1986 18 87
1987 25 86
1988 11 80
1989 16 95
1990 23 95
1991 14 116
1992 31 114
1993 38 113
1994 31 122
1995 56 134
1996 45 125
1997 74 133
1998 68 130
1999 98 143
2000 85 137
2001 66 142
2002 71 127
2003 65 131
2004 59 132
2005 60 147
2006 53 145
2007 42 153
2008 37 139
2009 52 169
2010 46 178
2011 43 198
2012 43 190
2013 39 186
2014 35 218
2015 28 195
2016 20 204
2017 23 243
2018 25 238
Note: In 1972, the U.S. Supreme Court invalidated capital-punishment
statutes in several states (Furman v. Georgia, 408 U.S. 238 (1972)),
eecting a moratorium on executions. Executions resumed in 1977
when the court found that revisions to statutes in several states had
eectively addressed the matters previously held unconstitutional
(Gregg v. Georgia, 428 U.S. 153 (1976) and its companion cases).
a
No executions were carried out in 1978 or 1980.
b
Average time was calculated from the most recent sentencing date.
Source: Bureau of Justice Statistics, National Prisoner Statistics program
(NPS-8), 1977-2018.
TABLE 12
Number of prisoners executed, by race or ethnicity,
1977-2018
Year
a
All
executions White
b
Black
b
Hispanic Other
b,c
Total 1,490 836 508 132 14
1977 1 1 0 0 0
1979 2 2 0 0 0
1981 1 1 0 0 0
1982 2 1 1 0 0
1983 5 4 1 0 0
1984 21 13 8 0 0
1985 18 9 7 2 0
1986 18 9 7 2 0
1987 25 11 11 3 0
1988 11 6 5 0 0
1989 16 6 8 2 0
1990 23 16 7 0 0
1991 14 6 7 1 0
1992 31 17 11 2 1
1993 38 19 14 4 1
1994 31 19 11 1 0
1995 56 31 22 2 1
1996 45 29 14 2 0
1997 74 41 26 5 2
1998 68 40 18 8 2
1999 98 53 33 9 3
2000 85 43 35 6 1
2001 66 45 17 3 1
2002 71 47 18 6 0
2003 65 41 20 3 1
2004 59 36 19 3 1
2005 60 38 19 3 0
2006 53 25 20 8 0
2007 42 22 14 6 0
2008 37 17 17 3 0
2009 52 24 21 7 0
2010 46 28 13 5 0
2011 43 22 16 5 0
2012 43 25 11 7 0
2013 39 23 13 3 0
2014 35 12 18 5 0
2015 28 11 10 7 0
2016 20 16 2 2 0
2017 23 13 8 2 0
2018 25 14 6 5 0
Note: In 1972, the U.S. Supreme Court invalidated capital-punishment
statutes in several states (Furman v. Georgia, 408 U.S. 238 (1972)),
eecting a moratorium on executions. Executions resumed in 1977
when the court found that revisions to statutes in several states had
eectively addressed the matters previously held unconstitutional
(Gregg v. Georgia, 428 U.S. 153 (1976) and its companion cases).
a
No executions were carried out in 1978 or 1980.
b
Excludes persons of Hispanic origin (e.g., “white” refers to non-Hispanic
whites and “black” refers to non-Hispanic blacks).
c
Includes Asians, Native Hawaiians, Other Pacic Islanders, American
Indians, and Alaska Natives.
Source: Bureau of Justice Statistics, National Prisoner Statistics program
(NPS-8), 1977-2018.

Capital Punishment, 2018 – Statistical Tables | September 2020 18
TABLE 13
Number of executions by method and jurisdiction 1977-2018 , ,
Jurisdiction All methods Lethal injection Electrocution Lethal gas Hanging Firing squad
U.S. total 1,490 1,313 160 11 3 3
Federal 3 3 0 0 0 0
Alabama 63 39 24 0 0 0
Arizona 37 35 0 2 0 0
Arkansas 31 30 1 0 0 0
California 13 11 0 2 0 0
Colorado 1 1 0 0 0 0
Connecticut 1 1 0 0 0 0
Delaware 16 15 0 0 1 0
Florida 97 53 44 0 0 0
Georgia 72 49 23 0 0 0
Idaho 3 3 0 0 0 0
Illinois 12 12 0 0 0 0
Indiana 20 17 3 0 0 0
Kentucky 3 2 1 0 0 0
Louisiana 28 8 20 0 0 0
Maryland 5 5 0 0 0 0
Mississippi 21 17 0 4 0 0
Missouri 88 88 0 0 0 0
Montana 3 3 0 0 0 0
Nebraska 4 1 3 0 0 0
Nevada 12 11 0 1 0 0
New Mexico 1 1 0 0 0 0
North Carolina 43 41 0 2 0 0
Ohio 56 56 0 0 0 0
Oklahoma 112 112 0 0 0 0
Oregon 2 2 0 0 0 0
Pennsylvania 3 3 0 0 0 0
South Carolina 43 36 7 0 0 0
South Dakota 4 4 0 0 0 0
Tennessee 9 6 3 0 0 0
Texas 558 558 0 0 0 0
Utah 7 4 0 0 0 3
Virginia 113 82 31 0 0 0
Washington 5 3 0 0 2 0
Wyoming 1 1 0 0 0 0
Note: In 1972, the U.S. Supreme Court invalidated capital-punishment statutes in several states (Furman v. Georgia,
408 U.S. 238 (1972)), eecting a moratorium on executions. Executions resumed in 1977 when the court found
that revisions to statutes in several states had eectively addressed the matters previously held unconstitutional
(Gregg v. Georgia, 428 U.S. 153 (1976) and its companion cases).
Source: Bureau of Justice Statistics, National Prisoner Statistics program (NPS-8), 1977-2018.

Capital Punishment, 2018 – Statistical Tables | September 2020 19
TABLE 14
Cumulative number of executions at year-end 2018,
by jurisdiction, since 1930 and since 1977
Jurisdiction Since 1930 Since 1977
U.S. total 5,349 1,490
Texas 855 558
Georgia 438 72
New York 329 0
North Carolina 306 43
California 305 13
Florida 267 97
Ohio 228 56
Virginia 205 113
South Carolina 205 43
Alabama 198 63
Mississippi 175 21
Oklahoma 172 112
Louisiana 161 28
Pennsylvania 155 3
Missouri 150 88
Arkansas 149 31
Kentucky 106 3
Illinois 102 12
Tennessee 102 9
Arizona 75 37
New Jersey 74 0
Maryland 73 5
Indiana 61 20
Washington 52 5
Colorado 48 1
Nevada 41 12
District of Columbia 40 0
West Virginia 40 0
Federal system 36 3
Delaware 28 16
Massachusetts 27 0
Connecticut 22 1
Oregon 21 2
Utah 20 7
Iowa 18 0
Kansas 15 0
Montana 9 3
New Mexico 9 1
Nebraska 8 4
Wyoming 8 1
Idaho 6 3
South Dakota 5 4
Vermont 4 0
New Hampshire 1 0
Note: Excludes 160 executions carried out by military authorities
between 1930 and 1961. The federal government has collected data on
executions under civil authority annually since 1930.
Source: Bureau of Justice Statistics, National Prisoner Statistics program
(NPS-8), 1930-2018.

Capital Punishment, 2018 – Statistical Tables | September 2020 20
APPENDIX TABLE 1
Demographic characteristics for prisoners under sentence of death 2018 ,
Demographic characteristic Total year-end Admissions Removals
Total 2,628 38 113
Sex
Male 2,575 38 113
Female 53 0 0
Race
White 1,469 28 67
Black 1,094 9 44
Other 65 1 2
Ethnicity
Hispanic 359 9 15
Non-Hispanic 2,031 29 91
Unknown 238 0 7
Age
18-19 0 0 0
20-24 6 1 0
25-29 49 6 1
30-34 130 8 7
35-39 248 7 11
40-44 370 5 10
45-49 473 3 20
50-54 415 3 14
55-59 410 3 16
60-64 258 2 14
65 or older 269 0 20
Education
8th grade or less 247 0 13
9th-11th grade 723 7 29
High-school graduate/GED 923 9 37
Any college 194 2 9
Unknown 541 20 25
Marital status
Married 482 6 15
Divorced/separated 441 4 26
Widowed 82 2 5
Never married 1,255 11 46
Unknown 368 15 21
Source: Bureau of Justice Statistics, National Prisoner Statistics program (NPS-8), 2018.

Capital Punishment, 2018 – Statistical Tables | September 2020 21
APPENDIX TABLE 2
Number of prisoners under sentence of death, 1953-2018
Year Prisoners Year Prisoners
1953 131
1986 1,800
1954 147
1987 1,967
1955 125
1988 2,117
1956 146
1989 2,243
1957 151
1990 2,346
1958 147
1991 2,465
1959 164
1992 2,580
1960 212
1993 2,727
1961 257
1994 2,905
1962 267
1995 3,064
1963 297
1996 3,242
1964 315
1997 3,328
1965 331
1998 3,465
1966 406
1999 3,540
1967 435
2000 3,601
1968 517
2001 3,577
1969 575
2002 3,562
1970 631
2003 3,377
1971 642
2004 3,320
1972 334
2005 3,245
1973 134
2006 3,233
1974 244
2007 3,215
1975 488
2008 3,210
1976 420
2009 3,173
1977 423
2010 3,139
1978 482
2011 3,065
1979 593
2012 3,011
1980 692
2013 2,983
1981 860
2014 2,942
1982 1,066
2015 2,872
1983 1,209
2016 2,797
1984 1,420
2017 2,703
1985 1,575
2018 2,628
Note: Data on the number of prisoners under sentence of death at year-end have been collected since 1953.
Source: Bureau of Justice Statistics, National Prisoner Statistics program (NPS-8), 1953-2018.

Capital Punishment, 2018 – Statistical Tables | September 2020 22
1975
1980
1985
1990
1995
APPENDIX TABLE 3
Admissions to and removals from a sentence of death 1973-2018 ,
Year Admissions Removals Year Admissions Removals
1973 44 240 1996 323 155
1974 161 55 1997 282 187
318 67 1998 312 175
1976 249 317 1999 287 220
1977 159 156 2000 235 173
1978 211 150 2001 164 194
1979 172 61 2002 172 191
202 101 2003 157 348
1981 249 84 2004 139 197
1982 287 79 2005 143 216
1983 266 123 2006 126 145
1984 306 90 2007 129 140
292 130 2008 122 138
1986 319 109 2009 118 166
1987 311 142 2010 116 143
1988 317 165 2011 84 155
1989 275 149 2012 85 124
270 152 2013 85 118
1991 284 159 2014 70 116
1992 300 173 2015 54 122
1993 299 162 2016 33 99
1994 330 153 2017 37 132
325 171 2018 38 113
Note: Removals can be due to any cause, including execution, other death, or appeal.
Source: Bureau of Justice Statistics, National Prisoner Statistics program (NPS-8), 1973-2018.

Capital Punishment, 2018 – Statistical Tables | September 2020 23
APPENDIX TABLE 4
Number of prisoners executed under civil authority in the United States, 1930-2018
Year Executions Year Executions
1930 155 1975 0
1931 153 1976 0
1932 140 1977 1
1933 160 1978 0
1934 168 1979 2
1935 199 1980 0
1936 195 1981 1
1937 147 1982 2
1938 190 1983 5
1939 160 1984 21
1940 124 1985 18
1941 123 1986 18
1942 147 1987 25
1943 131 1988 11
1944 120 1989 16
1945 117 1990 23
1946 131 1991 14
1947 153 1992 31
1948 119 1993 38
1949 119 1994 31
1950 82 1995 56
1951 105 1996 45
1952 83 1997 74
1953 62 1998 68
1954 81 1999 98
1955 76 2000 85
1956 65 2001 66
1957 65 2002 71
1958 49 2003 65
1959 49 2004 59
1960 56 2005 60
1961 42 2006 53
1962 47 2007 42
1963 21 2008 37
1964 15 2009 52
1965 7 2010 46
1966 1 2011 43
1967 2 2012 43
1968 0 2013 39
1969 0 2014 35
1970 0 2015 28
1971 0 2016 20
1972 0 2017 23
1973 0 2018 25
1974 0
Note: Excludes 160 executions carried out by military authorities from 1930 to 1961.
Source: Bureau of Justice Statistics, National Prisoner Statistics program (NPS-8), 1930-2018.

Capital Punishment, 2018 – Statistical Tables | September 2020 24
APPENDIX TABLE 5
Number of prisoners under sentence of death, by race, 1968-2018
Year White
a
Black
a
Other races
b
Year White
a
Black
a
Other races
b
1968 243 271 3 1994 1,653 1,203 49
1969 263 310 2 1995 1,732 1,284 48
1970 293 335 3 1996 1,833 1,358 51
1971 306 332 4 1997 1,864 1,408 56
1972 167 166 1 1998 1,917 1,489 59
1973 64 68 2 1999 1,960 1,515 65
1974 110 128 6 2000 1,989 1,541 71
1975 218 262 8 2001 1,968 1,538 71
1976 225 195 - 2002 1,939 1,551 72
1977 229 192 2 2003 1,882 1,417 78
1978 281 197 4 2004 1,856 1,390 74
1979 354 236 3 2005 1,802 1,366 77
1980 424 264 4 2006 1,806 1,353 74
1981 499 353 8 2007 1,806 1,338 71
1982 613 441 12 2008 1,795 1,343 72
1983 692 505 12 2009 1,779 1,318 76
1984 806 598 16 2010 1,743 1,309 87
1985 896 664 15 2011 1,721 1,274 70
1986 1,013 762 25 2012 1,684 1,258 69
1987 1,128 813 26 2013 1,670 1,251 62
1988 1,235 848 34 2014 1,647 1,233 62
1989 1,308 898 37 2015 1,606 1,202 64
1990 1,368 940 38 2016 1,553 1,179 65
1991 1,449 979 37 2017 1,508 1,129 66
1992 1,511 1,031 38 2018 1,469 1,094 65
1993 1,575 1,111 41
a
Includes persons of Hispanic origin.
b
Includes Asians, Native Hawaiians, Other Pacic Islanders, American Indians, Alaska Natives, and persons for
whom only ethnicity was identied.
Source: Bureau of Justice Statistics, National Prisoner Statistics program (NPS-8), 1968-2018.

e Bureau of Justice Statistics of the U.S. Department of Justice is the
principal federal agency responsible for measuring crime, criminal
victimization, criminal oenders, victims of crime, correlates of
crime, and the operation of criminal and civil justice systems at
the federal, state, tribal, and local levels. BJS collects, analyzes, and
disseminates reliable statistics on crime and justice systems in the
United States, supports improvements to state and local criminal
justice information systems, and participates with national and
international organizations to develop and recommend national
standards for justice statistics. Jerey H. Anderson is the director.
is report was written by Tracy L. Snell. Todd Minton, Stephanie
Mueller, and E. Ann Carson veried the report.
David Fialko and Edrienne Su edited the report. Carrie Epps-Carey
produced the report.
September 2020, NCJ 254786
Oce of Justice Programs
Building Solutions • Supporting Communities • Advancing Justice
www.ojp.gov
