
PUBLIC
SAP BusinessObjects Business Intelligence Suite
Document Version: 4.2 Support Package 4 – 2018-11-15
SAP BusinessObjects Web Intelligence User's
Guide
© 2018 SAP SE or an SAP aliate company. All rights reserved.
THE BEST RUN
Content
1 What's new, how and where to get help...........................................12
1.1 Documentation for SAP BusinessObjects Web Intelligence...............................12
1.2 What's New in 4.2 SP4.........................................................13
1.3 To access online help..........................................................17
1.4 To access the Web Intelligence guide via the internet....................................17
2 About Web Intelligence.......................................................19
2.1 Getting to know Web Intelligence and the BI Launch Pad................................ 20
About the Web Intelligence interfaces...........................................20
Application components.................................................... 26
Understanding the BI launch pad...............................................27
2.2 Conguring Web Intelligence Rich Client............................................32
To install Web Intelligence Rich Client from the BI launch pad...........................32
To install Web Intelligence Rich Client from the SAP Software Download Center..............33
Online help in a Web Intelligence Rich Client installation...............................34
Web Intelligence Rich Client processes...........................................35
Connection modes........................................................ 36
Connection modes in Web Intelligence Rich Client.................................. 43
To set the default universe for a document........................................44
To set viewing preferences...................................................45
To change your password....................................................45
2.3 Setting up preferences, the interface and the document locale............................46
About setting Web Intelligence preferences.......................................46
Interface and document locales............................................... 50
Selecting the measurement unit...............................................57
Increasing or decreasing the display size of a report in Web Intelligence................... 58
3 Building and running queries..................................................59
3.1 Introduction to query building...................................................59
3.2 Building and running queries....................................................60
Objects available in queries...................................................61
About query and document user rights ..........................................67
Non-hierarchical queries.....................................................67
Hierarchical queries........................................................68
To create a document without a data source.......................................70
Building queries on universes................................................. 71
Building queries on data les.................................................103
2
P U B L I C
SAP BusinessObjects Web Intelligence User's Guide
Content
Building queries on BEx queries...............................................107
Building queries on SAP HANA views with SAP HANA Direct Access.....................142
Building queries on SAP HANA views in SAP HANA Online mode........................149
Building queries on relational connections using Free-Hand SQL statements...............158
Building queries on Analysis View data sources....................................163
Building queries on web service data sources.....................................164
To create a query on a dierent data source in an existing document.....................169
The Data mode in Web Intelligence.............................................169
To open for edit the data provider of an existing query...............................172
To set the keydates of queries................................................173
To preview query results....................................................173
To sort query results.......................................................174
Interrupting and canceling queries.............................................174
To remove a query........................................................ 176
To duplicate a query.......................................................177
Changing the data source of a query............................................177
Working with multiple queries and data providers..................................183
Refreshing queries in parallel.................................................185
Filtering data using query lters...............................................188
Filtering data with query prompts.............................................207
Filtering data using subqueries...............................................219
4 Reporting data............................................................223
4.1 Introduction to reporting......................................................223
4.2 Working with reports.........................................................223
Web Intelligence features that are supported in reports for mobile devices................ 224
To rename a report........................................................226
To duplicate a report...................................................... 226
To delete a report.........................................................227
To change the order of reports................................................227
To add a report.......................................................... 228
Viewing document properties................................................228
Hierarchical and non-hierarchical data..........................................234
Finding text in a report page.................................................248
Viewing modes.......................................................... 249
Folding and unfolding report data............................................. 252
Formatting the report layout.................................................253
Reusing report elements in other documents.....................................257
Printing reports..........................................................258
Tracking changes in data................................................... 259
Highlighting data using conditional formatting....................................269
Ranking report data.......................................................275
SAP BusinessObjects Web Intelligence User's Guide
Content
P U B L I C 3
Merging data from dimensions and hierarchies....................................283
Formatting your reports using Cascading Style Sheets..............................298
Enhancing reports with calculations, formulas and variables..........................308
Displaying data in tables....................................................319
Displaying data in free-standing cells...........................................357
Formatting numbers and dates...............................................359
Using sections to group data.................................................366
Using breaks............................................................373
Using sorts to organize data in reports..........................................377
4.3 Working with charts in reports..................................................381
Chart types.............................................................382
Custom Elements........................................................ 395
Opening charts created with XI Web Intelligence 3.x................................ 395
To add a chart to a report...................................................396
To add a custom element to a report...........................................396
Assigning data to a chart................................................... 397
Geo-qualifying an object for a geomap chart......................................399
To remove a chart........................................................405
To copy a chart..........................................................405
Turning hierarchical queries into charts.........................................406
To set the position of a table or chart on the report page............................. 407
To position a chart in relation to another chart or table.............................. 408
Formulas in chart elements................................................. 408
Formatting charts........................................................409
4.4 Linking to other documents....................................................444
Cells dened as a hyperlink..................................................445
A hyperlink associated with a cell............................................. 446
Linking to another document in the CMS........................................447
To open a document from a hyperlink.......................................... 452
To edit a hyperlink in a cell.................................................. 452
To delete a hyperlink...................................................... 452
Formatting hyperlink colors................................................. 453
4.5 Saving and exporting documents, reports and data in Web Intelligence..................... 453
To save a document as an Excel spreadsheet.....................................455
To save a document as a PDF le..............................................456
To save a document in the corporate repository................................... 457
To save a document as a text le..............................................458
To save document data in a CSV le............................................459
Saving data in a document in a CSV archive zip le.................................460
Exporting documents, reports or data..........................................460
To export a document......................................................461
4
P U B L I C
SAP BusinessObjects Web Intelligence User's Guide
Content
Exporting HTML Code, URLs, and Images to Excel Spreadsheets and PDF Files.............462
Autosaved documents.....................................................463
5 Collaborating and sharing data............................................... 466
5.1 Commenting on report data....................................................466
Comments restrictions and limitations..........................................467
Security rights...........................................................468
To make a global comment with a free cell.......................................469
To comment on a report section.............................................. 470
To comment on a cell...................................................... 471
To comment on a block.....................................................471
To reply to a comment..................................................... 472
To delete a comment...................................................... 472
To copy a comment thread..................................................473
Cleaning up comments from the database.......................................474
To clean up comments in the database..........................................474
Displaying a specic comment............................................... 474
Saving a document with its comments..........................................476
5.2 Using shared elements to share report parts........................................476
Shared elements restrictions.................................................477
To create a shared element..................................................478
To insert a shared element using the toolbar......................................479
To insert a shared element using the Side Panel................................... 479
Document and shared element synchronization...................................480
Updating a shared element..................................................480
To update a shared element manually.......................................... 481
To update a shared element automatically.......................................482
To unlink a shared element from a document.....................................482
To unlink a specic instance of a shared element from a document......................483
To search for shared elements............................................... 484
To edit the properties of a shared element.......................................484
Modifying the content of a shared element linked to a document.......................485
Editing the content of a shared element in the CMS repository.........................485
6 Analyzing data............................................................486
6.1 Introduction to data analysis...................................................486
6.2 Drilling on report data........................................................486
Retrieving more levels of data to the report.......................................487
Drill paths and hierarchies.................................................. 488
Prompt when drill requires additional data option..................................488
Setting drill options.......................................................489
To switch to drill mode.....................................................492
SAP BusinessObjects Web Intelligence User's Guide
Content
P U B L I C 5
To choose a drill path when more than one is available...............................492
To take a snapshot of report drill results.........................................493
Drilling on measures in tables and sections...................................... 493
Drilling on dimensions in tables and sections.....................................494
Drilling on charts.........................................................499
Using lters when you drill..................................................504
Saving reports with drill lters................................................505
Refreshing data in a drilled report with prompts...................................505
Drilling with query drill.....................................................505
6.3 Filtering report data.........................................................509
Query lters and report lters compared........................................509
Report lter operators..................................................... 510
Types of report lter.......................................................513
To create, edit, and delete standard report lters...................................513
Using simple report lters...................................................517
To create nested lters in a report............................................. 519
Filtering data with prompts..................................................519
6.4 Filtering data using input controls................................................524
Using input controls with hierarchical data.......................................525
Available input controls.................................................... 526
To add an input control.....................................................527
To reuse an input control in another report within a Web Intelligence document.............529
To edit an input control.....................................................530
To view input control dependencies............................................530
To organize input controls...................................................531
To dene a table or chart as an input control......................................531
To lter data using input controls..............................................532
6.5 Filtering data dynamically with groups of input controls................................533
Input controls eligible to groups and dynamic ltering...............................534
To create a group of input controls.............................................535
To create a lter path......................................................536
To reset a lter path.......................................................537
To add an input control to a group.............................................537
To remove an input control from a group........................................ 538
To move an input control to another group.......................................538
To delete a group.........................................................539
Example: Creating a lter path............................................... 539
6.6 Using functions, formulas and calculations for data analysis.............................540
Document History: Web Intelligence Functions, Formulas and Calculations................540
About this guide..........................................................541
Using standard and custom calculations........................................ 542
6
P U B L I C
SAP BusinessObjects Web Intelligence User's Guide
Content
Understanding calculation contexts............................................551
Calculating values with smart measures.........................................563
Functions, operators and keywords............................................ 571
Building custom functions.................................................. 793
Troubleshooting formulas...................................................805
Comparing values using functions.............................................812
7 Scheduling and publishing documents..........................................821
7.1 Introduction to scheduling and publishing..........................................821
Scheduling and publishing concepts........................................... 821
Scheduling documents.....................................................842
Publishing documents.....................................................844
Managing publications and instances.......................................... 850
Publication performance................................................... 856
8 Sharing content with other applications.........................................861
8.1 Sharing content with other applications........................................... 861
Making data available for ltering in a web service..................................861
To publish a chart or table as a web service...................................... 862
Viewing and managing published content....................................... 864
Importing and using QaaWS queries as a BI service................................ 866
BI service structure.......................................................867
9 Working with documents in Reading mode.......................................887
9.1 Interacting with Web Intelligence documents in Reading mode...........................887
Features available in Web Intelligence Reading mode................................888
Saving and exporting documents in Reading mode.................................889
Printing reports..........................................................890
Finding text in a report page................................................. 891
To send a document by email................................................ 891
To send a document to another user or group in the CMS............................ 892
To send a document by FTP................................................. 893
Viewing modes..........................................................894
Tracking changes in data................................................... 895
Drilling on report data in Reading mode.........................................896
Freezing table headers, columns and rows .......................................901
Unfreezing table headers, columns and rows.....................................903
Using simple report lters.................................................. 905
Folding and unfolding report data............................................. 907
Warning icons in charts....................................................908
10 Rights appendix...........................................................909
10.1 General rights............................................................. 909
SAP BusinessObjects Web Intelligence User's Guide
Content
P U B L I C 7
10.2 Document rights............................................................910
10.3 Connection rights...........................................................912
11 Web Intelligence error messages.............................................. 914
11.1 Web Intelligence (WIJ) Error Messages............................................914
You need to use the Formula Editor to create a formula. (Error: WIJ
10000) ...............................................................914
You cannot position this report component in relation to a block, cell,
or section that is positioned relative to this report component. Select
a different block, cell or section in the dropdown list or unselect the
Relative To option. (WIJ 10500)........................................915
Web Intelligence requires the Java Runtime Environment (JRE) 1.4.2_01.
The currently installed JRE is {0}. Contact your administrator to
upgrade to 1.4.2_01 or select the [default VM] entry in the [Java Plug-
in Control Panel], if you already have the required version installed.
(WIJ 11111)...........................................................915
An error occurred while the document was being decoded. Try to open the
document in the BI Launch Pad, or contact your administrator for
further information. ( WIJ 20000)
......................................916
An unexpected problem occurred when during document refresh and open.
The data source has been modified or deleted, or a prompt on the
document has no value selected. (WIJ 20001).............................916
Unexpected error. If you cannot reconnect to the server, close your
session and start again. (WIJ 20002)................................... 917
Unable to get the first page of the current report.\nCheck the validity
of your report. (ERR WIJ 20003)........................................917
The current query contains unresolvable objects. The query will be
updated (WIJ 20004)....................................................917
The current request has returned corrupted data. Contact your
administrator for further information ( WIJ 20005)......................918
Unable to contact the application server. Contact your administrator
for further information (WIJ 20010)....................................918
The {0,number} MB report element you want to copy is too large to be
exported to an external application.\nThe maximum allowed size is
{1,number} MB. (Error: WIJ 30004)......................................918
Your user profile does not give you access to a document domain to save
corporate documents. Save this document as a personal document or
contact your administrator (ERR WIJ 40000)............................. 919
The query in this document is empty. Check that the Result Objects pane
on the query tab includes objects before running the query (ERR WIJ
30000)................................................................919
At least one query in this document is empty. Check that the Result
Objects pane on each query tab includes objects before running the
queries (ERR WIJ 30001)............................................... 920
Out of memory. Reduce the browser window size or re-launch the report
panel. (WIJ 30003)....................................................920
8
P U B L I C
SAP BusinessObjects Web Intelligence User's Guide
Content
Your user profile does not allow you to save personal or corporate
documents. Contact your administrator for further details. (WIJ 40001)
.....................................................................920
An unexpected error occurred. (WIJ 44444).............................. 921
Your version of Web Intelligence Rich Client is not up-to-date to
connect to this system (ERR WIJ 50003).You must upgrade your Web
Intelligence Rich Client by clicking <a href="{0}">here</a>............. 921
The information sent to the server contains invalid character(s). Use
the Undo button to cancel the latest changes to the document and then
retry. (Error: WIJ 55555)..............................................921
The session timed out. The document {document_name}.wid has been
autosaved in the Favorites\~InteractiveAnalysis folder. Click Restore
to retrieve it. (WIJ 60001)
...........................................922
The session timed out, but the document could not be autosaved because
the following security rights are not assigned (WIJ 60002):
{list_of_rights}
......................................................922
The document cannot be retrieved due to a server problem (WIJ 77777).
.....................................................................923
Your session timed out. Please close the Java interface and log on
again. (WIJ 77778)....................................................923
The Central Management System is not functioning. Contact your
administrator for further information. (WIJ 77779)......................923
Your user profile does not allow you to edit or create documents based
on Free-hand SQL. Please contact your BI administrator to be granted
this right. (WIJ 77780)............................................... 924
11.2 Web Intelligence Desktop HTML Interface (WIH) Error Messages..........................924
Invalid session. Please close your browser and log on again. (WIH
00013)................................................................924
The document could not be saved. (WIH 00014)........................... 925
The session timed out. The document {document_name}.wid has been
autosaved in the Favorites\~WebIntelligence folder. Click Restore to
retrieve it. (WIH 00015) ..............................................925
The session timed out, but the document could not be autosaved because
the following security rights are not assigned (WIH 00016):
{list_of_rights} ......................................................926
An unexpected error occurred. For information about this error, please
refer to SAP Knowledge Base Article 2054722 on the SAP Support Portal.
(WIH 44444)...........................................................926
11.3 Web Intelligence Desktop (WIO) Error Messages.....................................926
Web Intelligence Desktop cannot log in. (WIO 00001) ....................927
Cannot open the hyperlink (WIO 00002)..................................927
There is no more memory available. (WIS 30280) (WIO 30280)..............928
Cannot continue because memory is low. Please close documents to free
memory. (WIO 30284)...................................................928
SAP BusinessObjects Web Intelligence User's Guide
Content
P U B L I C 9
11.4 Web Intelligence Server (WIS) Error Messages.......................................928
The query in this document is empty. (WIS 30000) .......................929
At least one query in the document is empty. (WIS 30001) ...............929
Your security profile does not include permission to edit queries. (WIS
30251) ...............................................................929
Your security profile does not include permission to edit documents.
(WIS 30252) ..........................................................930
Your security profile does not include permission to refresh documents.
(WIS 30253) ..........................................................930
Your security profile does not include permission to refresh lists of
values. (WIS 30254) ..................................................930
Your security profile does not include permission to use lists of
values. (WIS 30255) .................................................. 931
Your security profile does not include permission to view the script
generated by the query. (WIS 30256) ...................................931
Your security profile does not include permission to use the formula
language. (WIS 30257) .................................................931
Your security profile does not include permission to perform drill
analysis. (WIS 30258) ................................................ 932
Your security profile does not include permission to extend the scope
of analysis. (WIS 30259)
............................................. 932
An internal error occurred while calling the {api_name} API. (WIS
30270) ...............................................................932
The document is too large to be processed by the server. (WIS 30271)
.....................................................................933
The document is too large to be processed by the server. (WIS 30272)
.....................................................................933
The query or report could not be generated.(WIS 30351) .................933
A query with this name already exists. (WIS 30371) .....................934
The Web Intelligence server memory is full. Log off and try to connect
later. If the problem persists, contact your administrator. (Error:
ERR_WIS_30280) (WIS 30280)............................................ 934
The Web Intelligence server is busy. Save any pending change and try
again later. If the problem persists, contact your administrator.
(Error: ERR_WIS_30284) (WIS 30284).....................................934
The Web Intelligence server is running out of memory, your document has
been closed. If the problem persists, contact your administrator.
(Error: ERR_WIS_30285) (WIS 30285)
.....................................935
You cannot edit this document because the query property option "Allow
other users to edit the query" was not enabled when the document was
created. (WIS 30381) .................................................935
An internal error has been generated by the WIQT. (WIS 30551) ..........936
Your WIQT session has reached timeout. Log out and log in again to the
BI launch pad. (WIS 30553)
........................................... 936
10
P U B L I C
SAP BusinessObjects Web Intelligence User's Guide
Content
No more WIQT servers are available. The maximum number of concurrent
users is already logged in. (WIS 30554) ...............................936
Your security profile does not include permission to save documents as
corporate documents or to send documents using the BI launch pad. (WIS
30555) ...............................................................937
A corporate document with this name already exists. Your security
profile does not include permission to delete corporate documents
created by other users. (WIS 30556) ...................................937
There is no document with this name in the repository. Specify a
different document name. (WIS 30557) ..................................938
Cannot perform the intended action on this document. (WIS 30650) ....... 938
The server failed to load the XML document. (WIS 30751) ................938
The XML file for this document cannot be opened. Contact your
administrator. (WIS 30752) ........................................... 939
An error occurred while parsing the XML document. Contact your
administrator. (WIS 30753) ........................................... 939
The Web Intelligence 2.x document could not be migrated. (WIS 30761)
.....................................................................940
This document cannot be migrated. The query and report of the original
Web Intelligence 2.x document are not synchronized. Try to refresh and
save the original document; then attempt migration again. (WIS 30762)
.....................................................................940
The Web Intelligence 2.x document could not be migrated, because the
WIQT module returned an error. Contact your administrator. (WIS 30763)
..................................................................... 941
Your user profile does not provide you with access to a document domain
to save corporate documents. Save this document as a personal document
or contact your administrator. (WIS 40000) ............................ 941
11.5 Information Engine Services (IES) Error Messages....................................941
IES 00001 -IES 01031 Query execution errors.....................................942
IES 01501 - IES 01513 Graph execution errors.....................................962
IES 10001 - IES 10903 Query execution errors (Web Intelligence only)....................964
11.6 ReportEngine Web Intelligence (RWI) Error Messages .................................994
RWI 00000 - RWI 00314....................................................995
RWI 00315 - RWI 00605...................................................1002
RWI 00606 - RWI 00850.................................................. 1009
11.7 Custom Data Source (CDS) Framework Error Messages............................... 1017
Custom Data Source User Interface Framework error messages.......................1017
Web Services Custom Data Source Plugin error messages...........................1021
Custom Data Source Framework error messages................................. 1025
SAP BusinessObjects Web Intelligence User's Guide
Content
P U B L I C 11
1 What's new, how and where to get help
1.1 Documentation for SAP BusinessObjects Web
Intelligence
The Web Intelligence documentation provides complete instructions for performing interactive analysis on
data from the BI launch pad using the SAP BusinessObjects Web Intelligence HTML or Applet interfaces, or
using SAP BusinessObjects Web Intelligence Rich Client which can be launched and installed from the BI
launch pad.
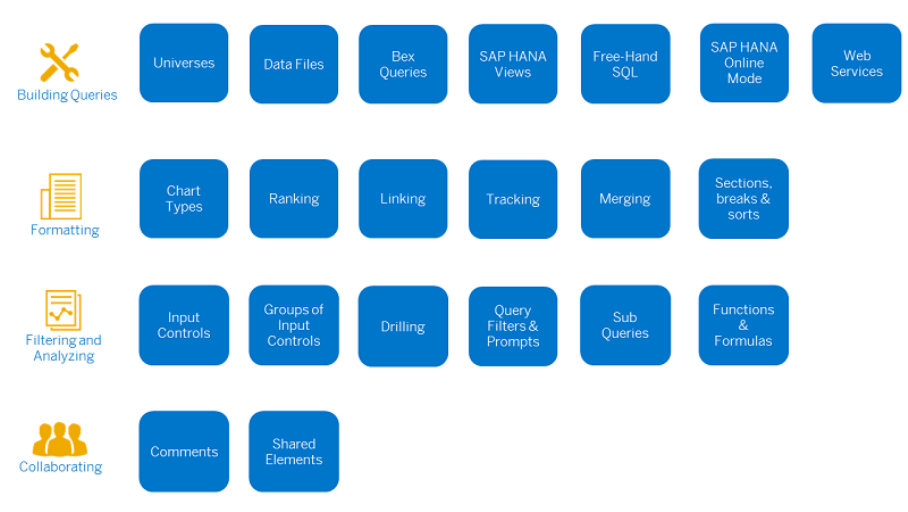
The image below will help you nd specic sections of the documentation you might be interested in. Click one
of the tile to access its dedicated sections.
● Building queries on universes [page 71]
● Building queries on data les [page 103]
● Building queries on BEx queries [page 107]
● Building queries on SAP HANA views with SAP HANA Direct Access [page 142]
● Building queries on relational connections using Free-Hand SQL statements [page 158]
● Building queries on SAP HANA views in SAP HANA Online mode [page 149]
● Building queries on web service data sources [page 164]
● Chart types [page 382]
● Ranking report data [page 275]
● Linking to other documents [page 444]
12
P U B L I C
SAP BusinessObjects Web Intelligence User's Guide
What's new, how and where to get help
● Tracking changes in data [page 259]
● Merging data from dimensions and hierarchies [page 283]
● Using sections to group data [page 366]
● Filtering data using input controls [page 524]
● Filtering data dynamically with groups of input controls [page 533]
● Drilling on report data [page 486]
● Filtering data using query lters [page 188]
● Filtering data using subqueries [page 219]
● About this guide [page 541]
● Commenting on report data [page 466]
● Using shared elements to share report parts [page 476]
1.2 What's New in 4.2 SP4
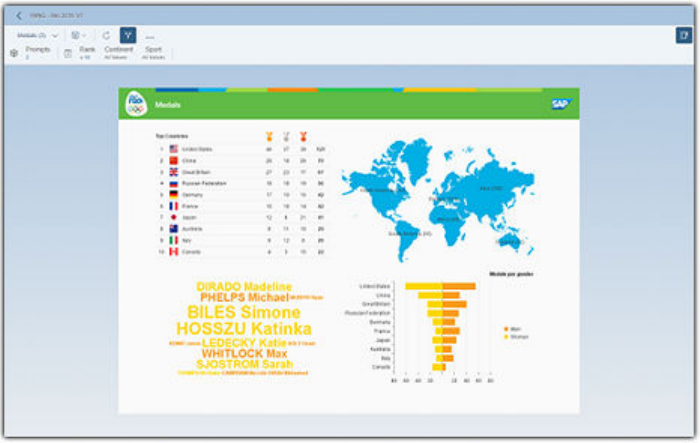
Web Intelligence Interactive Viewer
Web Intelligence Interactive Viewer is a redesigned version of Web Intelligence, with which you consume
documents and reports in a new way. It oers a new user experience and comes with the same features as Web
Intelligence Reading mode, plus some extra functionalities that will help you interact more with documents and
reports.
For more information, refer to the SAP BusinessObjects Web Intelligence Interactive Viewer User Guide.
SAP BusinessObjects Web Intelligence User's Guide
What's new, how and where to get help
P U B L I C 13

Client parity
The Right to Left content alignment option in the HTML client is now available, so that you can view any
document from right to left.
You can now create documents based on Free-Hand SQL scripts in the HTML client on top of relational
connections without using universes.
New gauge charts
Three new gauge charts are now available in Web Intelligence: Angular Gauge, Linear Gauge and Speedometer.
Gauges are charts that indicate the location of data points across a particular range.
Use gauge charts as value indicators in reports to display key performance indicators, progress indicators or
quantity indicators, and get instant comparisons between your data at a certain point in time and a dened
target.
Click here to learn more... [page 386]
Custom Elements
The support of custom elements has been extended to let you visualize thumbnails of custom elements right
before you insert them in your report.
This support package also oers compatibility between custom elements and extension points. You can now
congure a custom elements in the CMC using extension points, and grant custom elements access to
14
P U B L I C
SAP BusinessObjects Web Intelligence User's Guide
What's new, how and where to get help

extension points APIs. In the HTML client, you'll also be able to customize custom elements using extension
points.
For more information, refer to the SAP BusinessObjects BI Developer’s Guide for Web Intelligence and the BI
Semantic Layer guide.
New Free-Hand SQL security right
A new security right has been added so that administrators can decide whether it's possible to run SQL scripts
on a given relational connection. This addition is crucial for IT and SQL experts that want to run complex SQL
queries using database functions that aren't supported by universes.
Click here to learn more... [page 158]
Using BEx hierarchy levels as individual objects
Web Intelligence now creates individual objects when retrieving a BEx hierarchical object. Levels are displayed
in the Available Objects pane as individual objects so that you can reuse them in your reports.
Click here to learn more... [page 65]
New DatesBetween function
The new DatesBetween function allows you to calculate the number of periods between two dates, irrespective
of the time. You can calculate either in years, semesters, quarters, months, weeks, days or hours. This function
SAP BusinessObjects Web Intelligence User's Guide
What's new, how and where to get help
P U B L I C 15
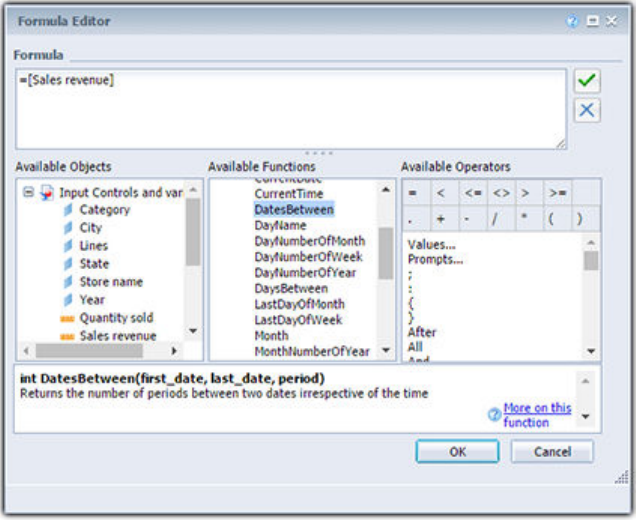
serves as an improvement to the DaysBetween and MonthsBetween functions that only return results in days
or months.
Click here to learn more... [page 639]
New TimeBetween function
The new TimeBetween function allows you to calculate the number of periods between two dates, taking the
time into account. You can calculate either in years, semetsers, quarters, weeks, days, hours, minutes, seconds
or milliseconds. This function serves as an improvement to the DaysBetween and MonthsBetween functions
that only return results in days or months.
16
P U B L I C
SAP BusinessObjects Web Intelligence User's Guide
What's new, how and where to get help
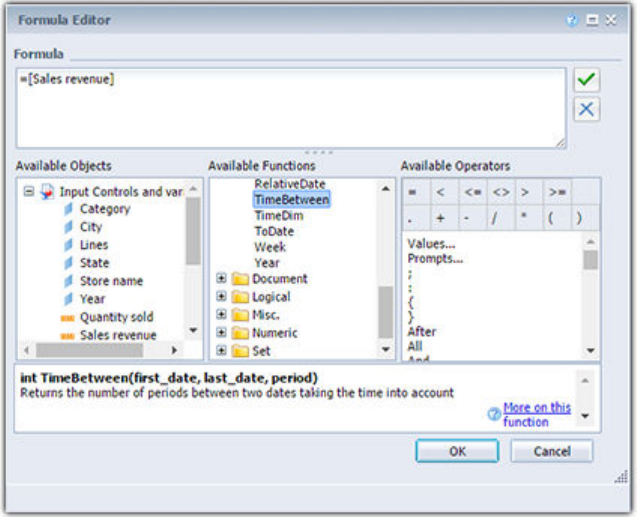
Click here to learn more... [page 651]
1.3 To access online help
Procedure
1. Open Web Intelligence.
2. From the Help button dropdown list in the application toolbar, select Help Contents.
1.4 To access the Web Intelligence guide via the internet
You can nd Web Intelligence guides on the SAP Help Portal.
At the SAP Help Portal (http://help.sap.com/) the following guides are available:
● SAP BusinessObjects Web Intelligence User's Guide - a complete guide to working with corporate data from
the BI launch pad using the Web Intelligence Applet, Web Intelligence HTML, and Web Intelligence Rich
Client interface.
The Web Intelligence Rich Client (Desktop interface) allows you to perform analysis oine as well as with
corporate data. This interface can be installed and accessed in the following ways:
○ via the BI launch pad
○ as a part of the BI platform
SAP BusinessObjects Web Intelligence User's Guide
What's new, how and where to get help
P U B L I C 17

Note
As of BI 4.1 Support Package 5, the SAP BusinessObjects Web Intelligence Rich Client User's Guide and
online help and the Building SAP BusinessObjects Web Intelligence queries based on BEx queries guide
have been merged into the SAP BusinessObjects Web Intelligence User's Guide.
● Using Functions, Formulas and Calculations in Web Intelligence - detailed information on the formula
language and advanced calculation-related topics such as calculation contexts and smart measures.
18 P UB L I C
SAP BusinessObjects Web Intelligence User's Guide
What's new, how and where to get help

2 About Web Intelligence
Web intelligence provides business users with exible and intuitive ad hoc reporting tools and interactive
analytics – on the Web, desktop, or mobile device.
You can also:
● Deliver personalized business intelligence to your colleagues, customers, and partners
● Improve productivity by giving users an intuitive tool and clearing IT backlogs
● Get the insights you need, when you need them, no matter where you are
Security rights
Depending on your license, user, and security rights, you can analyze the data in reports. For example, you can
perform the following actions:
● Filter data
● Drill down on data to reveal more details
● Merge data from multiple data sources
● Display and view data in charts
Customized interface
The Central Management Console (CMC) administrator can customize the user interface by hiding elements,
such as panels, panes, toolboxes, menus, and menu items. If a user interface element that you need is not
available, contact your CMC administrator.
Data sources
Data in Web Intelligence documents can come from:
● Universes, which organize data from relational or OLAP databases into objects or hierarchies
● Personal data providers (such as Microsoft Excel or .csv les), BEx queries based on SAP Info Cubes, web
services, or Analysis View workspaces
● Relational database queries via Free-Hand SQL statements
● You can connect to the HANA (High-Performance Analytical Appliance) data source to use in-memory
computing. HANA universes based on HANA views with variables are supported in Web Intelligence.
Note
Web Intelligence supports Hadoop data sources, but custom SQL is not supported.
SAP BusinessObjects Web Intelligence User's Guide
About Web Intelligence
P U B L I C 19

You build data providers to retrieve data from data sources and create reports from the data in data providers.
2.1 Getting to know Web Intelligence and the BI Launch
Pad
2.1.1 About the Web Intelligence interfaces
Three interfaces are available for Web Intelligence documents.
You select the interface you prefer in BI launch pad Web Intelligence preferences.
Via the BI launch pad, you can use the Web Intelligence HTML interface and Web Intelligence Applet interface
to create documents that analyze data. You can also use Web Intelligence Rich Client to perform data analysis,
however Web Intelligence Rich Client allows you to work locally without a connection to a repository.
The interface launched when you open a document to View or Modify in the BI launch pad depends on your
Web Intelligence BI launch pad Preferences settings.
Client parity starting from 4.2 SP3
In 4.2 SP3 or later releases, new functionalities are available in the HTML client so that it is aligned with the
capabilities oered by the Java applet:
● Save as (4.2 SP3)
● Format Number (4.2 SP3)
● Conditional Formatting (4.2 SP3)
● Create documents with BEx queries and Excel spreadsheets as data sources (4.2 SP3)
● Create ranking, subqueries and complex lters (4.2 SP3)
● Change Source wizard (4.2 SP3)
● Use Free-Hand SQL queries as a data source (4.2 SP4)
● Use RTL alignment (4.2 SP4)
Web Intelligence interfaces
Interface
Description
Web Intelligence HTML interface
Also sometimes referred to as the DHTML interface.
You launch this interface in the BI launch pad. Depending on your permissions,
you can do the following:
● Create and edit queries based on No data source, .unx, and .unv uni
verses, SAP HANA views, BEx queries, FHSQL queries, and Excel les.
● View, create, edit and refresh all types of reports.
20 P U B L I C
SAP BusinessObjects Web Intelligence User's Guide
About Web Intelligence

Interface Description
Web Intelligence Applet interface
Also sometimes referred to as the Java applet.
You launch this interface in the BI launch pad. Depending on your permissions,
you can do the following:
● Create and edit queries based on No data source, .unx and .unv universes,
SAP HANA views, BEx queries, FHSQL queries, Analysis views (Analysis View
workspaces), and Excel les.
● View, create, edit and refresh all types of reports.
SAP BusinessObjects Web Intelligence User's Guide
About Web Intelligence
P U B L I C 21

Interface Description
Web Intelligence Rich Client
Web Intelligence Rich Client, also referred to as Desktop, is a version of Web Intel
ligence that is installed on your computer and allows you to create and edit quer
ies, and view, create, edit and refresh reports. There are two ways to have Web In
telligence Rich Client installed on your computer:
● From BI launch pad.
● As part of a BI platform installation.
Note
When you have launched Web Intelligence Rich Client once and closed it, the
quick start icon is available in the Microsoft Windows toolbar. This quick start
icon allows you to launch the interface rapidly.
Both versions of Web Intelligence Rich Client can be used to create and edit quer
ies based on no data source, .unx and .unv universes, SAP HANA views and Ex
cel and text les.
Data sources you can access depend on the connection mode
Data source
Standalone Oine Connected
.unv universe No Yes* Yes
.unx dimensional uni
verse
No Yes* Yes
.unx relational uni
verse
No Yes* Yes
.unx multi-source uni
verse
No Yes* Yes
SAP HANA views No No Yes
BEx query No No Yes
Free-hand SQL query No No Yes
Analysis Views and Mi
crosoft Analysis Serv
ices 2005
No No Yes
Excel le Yes ** Yes ** Yes
Text le Yes ** Yes ** Yes
CSV le Yes ** Yes ** Yes
Web Services No No Yes
* In this case, you have imported the universe, and you still need to enter a CMS
password to access the universe.
** Locally installed only.
22
P U B L I C
SAP BusinessObjects Web Intelligence User's Guide
About Web Intelligence
Tip
In the BI launch pad preferences, you can choose in which Web Intelligence interface to open documents
when you right-click a document and select View. When you right-click a document and Modify, a dierent
Web Intelligence user interface appears. For example, you can link cells to documents in the Web
Intelligence HTML interface only, but you can work with queries based on QaaWS (Query as a Web Service)
data sources only in the Web Intelligence Applet or Rich Client interfaces.
You may need to use two Web Intelligence interfaces—one for viewing and one for modifying documents. In
that case, use the Web Intelligence HTML interface to view documents and the Web Intelligence applet or
rich client interface to modify documents.
Feature dierences between the Web Intelligence interfaces
This section provides you with an overview of the main functional dierences that exist between all the Web
Intelligence interfaces as of BI 4.1 Support Package 03. The availability of certain features depends on which
interface you are using.
Setting up and using the Web Intelligence interfaces
Feature
Web Intelligence HTML
Web Intelligence
Applet
Web Intelli
gence Rich Cli
ent
Use Web Intelligence locally and oine Yes *
Use Right To Left (RTL) alignment based on the Pre
ferred viewing locale setting
Yes Yes Yes
User Prompt Input appears in the side panel Yes Yes
* You can install Web Intelligence Rich Client from the BI launch pad or the administrator can install the BI
Platform, which includes Web Intelligence Rich Client, on your computer from the SAP Software Download
Center.
Creating and working with documents in each interface
Feature
Web Intelligence HTML
Web Intelligence App
let
Web Intelli
gence Rich Cli
ent
Select a folder in which local documents and universes
are stored by default on your local machine
Yes Yes
Edit and refresh a document using a SAP HANA view
data source
Yes Yes In Connected
mode only.
Edit and refresh a document using a BEx query Yes Yes Yes
SAP BusinessObjects Web Intelligence User's Guide
About Web Intelligence
P U B L I C 23

Feature Web Intelligence HTML
Web Intelligence App
let
Web Intelli
gence Rich Cli
ent
Edit and refresh a document using a Free-hand SQL
query
Yes Yes Yes
Edit and refresh a document using an Analysis View
data source
Refresh only Yes Yes
Edit and refresh a document using a text source Refresh only * Refresh only * Yes
Edit and refresh a document using a web service data
source
Refresh only Yes
Send a Web Intelligence document to another user in
the CMS
Yes Yes
Send a Web Intelligence document by FTP Yes Yes
Export a document as a CSV le Yes Yes Yes
Export a document as a CSV archive le Yes Yes No
Save a document as a CSV archive le No Yes Yes
Export a document as a PDF, text, Excel or Excel 2007
le
Yes Yes No
Save a document as a PDF, text, Excel or Excel 2007
le
No Yes Yes
Save a document to the corporate repository Yes Yes Yes
Autosave documents to My Favorites folder Yes Yes
* If the le has previously been copied into the BusinessObjects Enterprise Platform.
Building queries
Feature
Web Intelligence
HTML
Web Intelligence App
let
Web Intelli
gence Rich
Client
Build queries on an Analysis View data source No Yes Yes
Build queries on Excel les saved locally No No Yes
Build queries on Excel les saved to the CMS * Yes Yes Yes
Build queries on SAP HANA views Yes Yes In Connected
mode only.
Build queries on BEx queries Yes Yes Yes
Building queries on Free-hand SQL queries Yes Yes Yes
Build queries on text les No No Yes
Access Data mode No Yes Yes
24 P U B LI C
SAP BusinessObjects Web Intelligence User's Guide
About Web Intelligence
Feature
Web Intelligence
HTML
Web Intelligence App
let
Web Intelli
gence Rich
Client
Access the Change Source options in the Data Access
table
Yes Yes Yes
Change the data source of queries based on text and
Excel les.
No No Yes
For OLAP .unx universes, when ltering on measures,
you can only type a constant.
Yes Yes
Select all the members at a level in a hierarchy that is
organized into levels
Yes only for OLAP .unx Yes Yes
* Excel les have to be exported rst into the BI launch pad for Life Cycle management.
Creating reports
Feature
Web Intelligence
HTML
Web Intelligence App
let
Web Intelligence
Rich Client
Access a “Highlight All” button in the “Find” box to
highlight all occurrences of a text string in a report
page.
Yes Yes
Create and edit conditional formatting Yes Yes Yes
View the alignment grid from the report editor Yes Yes
View the “More on this function” button in the for
mula editor
Yes Yes
Publishing, formatting and sharing reports
Feature Web Intelligence HTML Web Intelligence Applet
Web Intelligence
Rich Client
Set a hyperlink to another document in the
CMS
Yes, with a wizard Yes, no wizard Yes, no wizard
Publish content as a web service Yes Yes
Print documents directly from the interface Export to PDF rst Yes Yes
Related Information
Changing the data source of a query [page 177]
SAP BusinessObjects Web Intelligence User's Guide
About Web Intelligence
P U B L I C 25
2.1.2 Application components
Web Intelligence oers several components that you can use to create, edit and navigate documents.
The application has the following components:
Component
Description
The main toolbar
You use the main toolbar to open, save and print documents, track data changes and
display the report outline.
The main toolbar appears in the File tab when the application is in Design mode.
Toolbars
You work with data providers and perform report design and analysis tasks using the
toolbars.
Toolbars appear at the top of the application in Data and Design mode only. In Data
mode, only those toolbars related to working with data providers are active.
Side Panel
The Side Panel groups several panes that provide dierent views of the current docu
ment.
File and Properties tabs
The File and Properties tabs are only available in Design and Data mode.
The File tab contains the main le menu tools.
The Properties tab allows you to set View, Document, and Application properties.
Report Panel
The Report Panel displays the reports in a document.
Status Bar The Status Bar appears beneath the Report Panel and allows you to perform actions
such as activating data tracking or changing the display mode. It can be activated
and deactivated in the
View menu of the Properties tab.
Report Filter toolbar This toolbar is used to add simple lters to reports.
Drill toolbar When Drill is activated in a document, this toolbar appears. It shows the active drill
objects.
Related Information
To create simple report lters [page 517]
Side Panel tabs in Web Intelligence [page 27]
Drilling down on report data [page 494]
26
P U B L I C
SAP BusinessObjects Web Intelligence User's Guide
About Web Intelligence

2.1.2.1 Side Panel tabs in Web Intelligence
The tabs available in the Side Panel depend on the Web Intelligence interface you are using and the mode in
which you are viewing the document.
Web Intelligence interfaces and document modes
Web Intelligence Applet
Web Intelligence HTML Web Intelligence Rich Client
Mode
Data Design Reading Design Reading Data Design Reading
Document Summary Yes Yes Yes Yes Yes Yes
Navigation Map Yes Yes
Report Map Yes Yes Yes Yes
Input Controls Yes Yes Yes Yes Yes Yes
User Prompt Input Yes Yes
Shared Elements Yes Yes Yes Yes Yes Yes
Comments Yes Yes Yes Yes Yes Yes
Available Objects Yes Yes Yes
Document Structure and Fil
ters
Yes Yes Yes
Web Service Publisher Yes Yes
Data Yes Yes
The tabs allow you access to panes in which you can view and congure document information and objects.
● The Document Summary pane provides an overview of the document properties.
● The Navigation Map and Report Map panes list all the reports in a document.
● The Input Controls pane allows you to add and edit input controls applied to the document.
● The Web Service Publisher pane lists the BI services published from the document.
● The Available Objects pane lists the data providers and objects available for inclusion in reports.
● The Document Structure and Filters pane displays the structure of the document in a tree view, and
displays lters applied to dierent report elements.
● The Data pane appears only in Data mode and allows you to navigate the data providers in a document.
● The User Prompt Input pane lists the default values for a prompt. You can also enter text in the values text
box. Multiple items are separated by a semi-colon (;).
● The Shared Elements pane lists all the shared elements used in the document.
● The Comments pane lists all the comments in the document.
2.1.3 Understanding the BI launch pad
The BI launch pad consists of the following areas:
● Toolbar
SAP BusinessObjects Web Intelligence User's Guide
About Web Intelligence
P U B L I C 27

● Home and Documents tabs
● My Applications Icons
Toolbar
The Applications menu allows you to start Web Intelligence.
The Preferences menu allows you to set the following application preferences:
● General preferences
● Password
● Locale and time zone preferences
● The Web Intelligence preferences
BI launch pad panes
The BI launch pad consists of the following objects:
The main tabs: Home, Documents, and any open documents.
BI launch pad panes
Tab pane
Description
Home Shows recently viewed documents, unread messages, unread alerts, and recently
run documents.
Documents Allows you to navigate through the available folders and documents. Click on a
folder tab to display any documents in that folder. You can view, organize, and
manage documents in this pane.
Web Intelligence documents One tab for each open document.
Related Information
About setting Web Intelligence preferences [page 46]
28
P U B L I C
SAP BusinessObjects Web Intelligence User's Guide
About Web Intelligence

2.1.3.1 To log into the BI launch pad
To access Web Intelligence via the BI launch pad, you need to log in.
Prerequisites
Before you can perform interactive analysis from the BI launch pad, you need the following information:
● a URL to the BI launch pad (for example http://[hostname]:8080/BOE/BI).
● your user name and password
● your authentication, which controls the resources available to you
Contact your administrator for these details if you do not already know them.
Note
By default the server name is not displayed on the BI launch pad log on page.
Context
To launch SAP BusinessObjects Web Intelligence:
Procedure
1. Launch a web browser.
2. Point your browser to the BI launch pad bookmark or URL.
The login page appears.
3. If the System box is blank, type the name of the server followed by a colon (:), and then type the port
number.
4. In the Username box, type your user name.
5. In the Password box, type your password.
6. In the Authentication box, select the authentication provided to you by your administrator.
7. Click Log On.
The BI launch pad home page appears.
SAP BusinessObjects Web Intelligence User's Guide
About Web Intelligence
P U B L I C 29

2.1.3.2 To log out of the BI launch pad
You need to log out when you have nished working in the BI launch pad instead of simply closing your web
browser.
Context
Logging out ensures that any preferences you modied during your session are saved.
BI administrators can track how many users are logged into the system at any given time and use this
information to optimize system performance.
Procedure
Click Log o on the BI launch pad toolbar.
2.1.3.3 To start Web Intelligence in the BI launch pad
You can launch Web Intelligence in more than one way.
Procedure
To start Web Intelligence, in the BI launch pad, do one of the following:
○ Click Applications Web Intelligence .
○ Select Web Intelligence in the application shortcuts.
○ Open a Web Intelligence document.
Web Intelligence starts. The Web Intelligence tab is active in the main pane. To check which interface has
started (Web Intelligence HTML, Web Intelligence Applet, or Web Intelligence Rich Client), click Preferences and
select Web Intelligence.
Related Information
Building and running queries [page 60]
Choosing the viewing and design interfaces [page 47]
30
P U B L I C
SAP BusinessObjects Web Intelligence User's Guide
About Web Intelligence

2.1.3.4 To open a document from the repository
You can open a document from the corporate repository.
Procedure
1. In the BI launch pad, click the Documents tab to show the documents available in the repository.
2. Click the Folders tab, and navigate to the folder containing your document.
3. Select the document, right-click and select View to open the document in Reading mode, or Modify to open
the document in Design mode.
The version of Web Intelligence that opens depends on the View and Modify settings in the BI launch pad
Web Intelligence preferences.
Note
When the Refresh on open document property is selected in the document properties, the document
displays the latest information each time you open it. The Refresh on open option is dependent on the
following settings in the CMC (congured by the BI administrator):
○ In Applications Web Intelligence , from the Manage list, select Properties. In the Automatic
Document Refresh on Open Security Right Setting section, the property Automatic Refresh security
setting is enabled.
○ In Applications Web Intelligence , from the Manage list, select User Security. When you select
a user prole and click View Security, verify that the Document - disable automatic refresh on open
security right is disabled.
Related Information
Choosing the viewing and design interfaces [page 47]
2.1.3.5 To delete a document from the repository
You can delete a document from the corporate repository, if you have been granted the permission to do so.
Procedure
1. Log into the BI launch pad
2. Click the Documents tab to show the documents available in the repository.
SAP BusinessObjects Web Intelligence User's Guide
About Web Intelligence
P U B L I C 31
3. Navigate to the folder that contains the document you want to delete.
4. Right-click the document that you want to delete and click Organize.
5. Click Delete.
2.2 Conguring Web Intelligence Rich Client
You can use SAP BusinessObjects Web Intelligence Rich Client to work with secured or unsecured documents,
with or without a connection to a Central Management Server.
The Web Intelligence Rich Client interface lets you create documents and edit, format, print, and save them.
The following are common scenarios for using this interface:
● You do not want to install a CMS or an application server.
● You cannot connect to a CMS while traveling or working in a location without network access.
● You want to work with documents continuously, if there are server-side interruptions or performance
issues.
● You want to improve calculation performance.
You can install Web Intelligence Rich Client interactively from the SAP BusinessObjects Business Intelligence
launch pad, or the administrator can install the BI Platform, which includes Web Intelligence Rich Client, on
your computer from the SAP Software Download Center.
2.2.1 To install Web Intelligence Rich Client from the BI
launch pad
You can download Web Intelligence Rich Client to your computer from the BI launch pad.
Procedure
1. Log into the BI launch pad.
2. Click Preferences.
3. Click Web Intelligence.
4. In the Modify section, click (installation required) after Desktop (Rich Client, Windows only, installation
required).
A panel appears asking you if you want to run or save WebSetup.exe on your computer.
5. Click Run.
Web Intelligence Rich Client is downloaded to your computer and launched when you launch the
application from the BI launch pad. Due to the le size, this process might take a few minutes.
6. Click Save & Close.
32
P U B L I C
SAP BusinessObjects Web Intelligence User's Guide
About Web Intelligence

7. If you receive HTTP connection errors in the report pages, refer to the following topic and then contact your
BI administrator to obtain the information required to dene your proxy settings: Dening the Proxy
Settings in Web Intelligence Rich Client [page 43].
Results
Note
When you install Web Intelligence Rich Client to your local computer, the online help system is also installed
to your local computer.
Related Information
Connection modes [page 36]
About the Web Intelligence interfaces [page 20]
2.2.2 To install Web Intelligence Rich Client from the SAP
Software Download Center
When you install the BI platform on your computer, you also install Web Intelligence Rich Client.
Prerequisites
You have access to the SAP Software Download Center and have administrator rights to install applications on
your computer.
Procedure
1. Refer to the following guides on the SAP Help Portal (http://help.sap.com/):
○ For BI Platform installation instructions: the UNIX or Windows version of the Business Intelligence
Platform Installation Guide for SAP BusinessObjects Business Intelligence platform 4.2
○ For information on installing and conguring Web Intelligence Rich Client on your computer: the Web
Intelligence Rich Client Installation Guide
2. To download the BI Platform, go to the SAP Software Download Center (https://support.sap.com/swdc )
SAP BusinessObjects Web Intelligence User's Guide
About Web Intelligence
P U B L I C 33
2.2.3 Online help in a Web Intelligence Rich Client
installation
If you install Web Intelligence Rich Client from the BI launch pad, the online help system is installed to your
computer.
Every time you open Web Intelligence Rich Client, and regardless of which work mode you are in, the help that
appears when you click the Help icon is that which was installed on your computer.
Note
To update the Web Intelligence Rich Client interface and its help on your computer, you can re-install this
interface from the BI launch pad preferences or ask the administrator to install the BI Platform, which
includes Web Intelligence Rich Client, on your computer.
You can make help available by specifying a local folder or a URL where Web Intelligence Rich Client can access
the help.
Related Information
Connection modes [page 36]
2.2.3.1 To specify the folder or URL for online help
You can select either select a folder for Web Intelligence online help or enter a URL.
Procedure
1. Launch Web Intelligence Rich Client.
2. Click the Options button in the upper right corner, or when a document is open, click Properties
Application .
3. In the Web Intelligence Options dialog box, select the General tab.
4. Click Browse next to Help and select a folder.
You can also type a URL as the location of the online help.
5. Click Open, then OK.
34
P U B L I C
SAP BusinessObjects Web Intelligence User's Guide
About Web Intelligence

2.2.4 Web Intelligence Rich Client processes
You can manage certain notication processes for Web Intelligence Rich Client.
Windows Notication Area
Any time you open the Web Intelligence Rich Client, an icon appears in the Windows notication area and
remains during a Windows session. The icon represents the processes of Web Intelligence that continue
running in the background.
You use the Web Intelligence Rich Client notication icon to do the following:
● Launch the application in a new window.
● Exit Web Intelligence Rich Client.
2.2.4.1 To activate and deactivate the Web Intelligence
Rich Client background process
You can activate or deactivate the Web Intelligence Rich Client background process.
Context
If you activate the Web Intelligence Rich Client background process, you improve the loading time of
documents.
Procedure
1. Launch the Web Intelligence Rich Client.
2. Click the Options button in the upper right corner, or when a document is open, click Properties
Application .
3. In the Web Intelligence Options dialog box, select the General tab.
4. In the Web Intelligence Rich Client process section, do one of the following:
○ To activate the background process, select Keep process active after closing last window. This is the
default setting.
○ To deactivate the background process, deselect Keep process active after closing last window. This will
also close the quick start icon.
5. Click OK.
SAP BusinessObjects Web Intelligence User's Guide
About Web Intelligence
P U B L I C 35

2.2.5 Connection modes
Web Intelligence Rich Client uses dierent connection modes.
You can use Web Intelligence Rich Client in the following connection modes: Connected, Oine, or Standalone.
2.2.5.1 About connection security rights and working
locally
BI administrators can use the Download connection locally security right in the CMS to control connection
security rights in Web Intelligence Rich Client.
When the Download connection locally security right is granted to connection objects a local refresh is
performed if the middleware is correctly installed and congured. When the security right is denied, no local
refresh is executed. The refresh is delegated to the server side. Query creation and modication is possible only
for queries not using secured connection.
When working with a document from BusinessObjects XI 4.0 or earlier, save the document and reopen it. The
security right will be correctly applied.
Note
The BI administrator must dene the security associated with the data source connection, for example the
sensitive data source connection information that can be downloaded locally and by which users.
When the security option has been activated:
● No connection information transit is allowed to the client side (extra secure mode).
● In a limited oine mode, it is not possible to refresh locally.
● In a fully oine mode, reports can be opened, viewed and modied, but not refreshed, and the query
cannot be modied.
Note
When working with multiple queries in a document, the refresh action works only for non-secured data
source connections. A warning is displayed when at least one query is using a secured data source
connection.
2.2.5.2 Connected mode
In Connected mode, you work while connected to a SAP BI BusinessObjects CMS (Central Management
Server).
You can work with documents on the CMS or with local secured or unsecured documents. According to your
security rights in the CMS, you can do the following:
● import documents and universes from the CMS
36
P U B L I C
SAP BusinessObjects Web Intelligence User's Guide
About Web Intelligence

● open, create, edit, and refresh local documents
● save documents locally
● export documents to the CMS
Security in Connected mode
When you work with documents in Connected mode, the security rights of your user account are applied by the
CMS.
Connecting to the CMS in Connected mode
There are two ways of launching Web Intelligence Rich Client, and each connects to the CMS dierently:
● When you launch Web Intelligence Rich Client from the BI launch pad, it connects to the CMS within the
same BI launch pad session, so no login is required. Communication with the CMS goes through HTTP to
an application server, which reroutes the calls to the CMS and repository. No local middleware is required.
● When you launch Web Intelligence Rich Client locally via the Windows Start menu or by double-clicking
a .wid document, Web Intelligence Rich Client connects to the CMS in client-server mode using the OCA/
CORBA framework of the Enterprise SDK. You need the appropriate database middleware on your local
machine.
Note
In order to connect to an Essbase OLAP data source from SAP BusinessObjects OLAP products including
universe design tool, Web Intelligence Rich Client and Web Intelligence, ensure that Essbase Client
middleware is properly installed and congured on machines hosting those SAP BusinessObjects OLAP
products. Specically, ensure that Essbase Client environment variables ARBORPATH and ESSBASEPATH
are created and set as Windows system environment variables instead of Windows user environment
variables.
Related Information
To work on an existing document locally in Connected mode [page 39]
To work in Connected mode from the BI launch pad [page 38]
SAP BusinessObjects Web Intelligence User's Guide
About Web Intelligence
P U B L I C 37
2.2.5.2.1 To work in Connected mode from the BI launch
pad
In Connected mode, security is handled by the CMS. You work with documents as you do when working in the
BI launch pad.
Context
You do not need database middleware on your local machine when you launch Web Intelligence Rich Client
from the BI launch pad.
Procedure
1. Log into the BI launch pad.
2. Click Preferences at the top of the BI portal.
3. In the Preferences dialog box, select Web Intelligence.
4. In the Modify section, select Desktop.
5. Click Save & Close to close the Preferences dialog box.
6. In the BI launch pad, click the Documents tab.
7. Right-click a document and select Modify.
Web Intelligence Rich Client is launched on your computer in the Connected mode. If it is not yet installed
on your computer, it is installed from the BI launch pad.
If Web Intelligence Rich Client was already running on your computer, launching from the BI launch pad
opens a new instance of the application. The document is not opened in the application instance that was
already open.
Related Information
Connection modes [page 36]
38
P U B L I C
SAP BusinessObjects Web Intelligence User's Guide
About Web Intelligence
2.2.5.2.2 To work on an existing document locally in
Connected mode
You can launched Web Intelligence Rich Client in Connected mode.
Prerequisites
To launch Web Intelligence Rich Client in Connected mode locally, it must be installed on your computer. You
must have already connected at least once to the CMS you want to work with using Web Intelligence Rich Client
from the BI launch pad.
You need to have the middleware required to connect to the CMS installed on your computer. In the Connected
mode, security is handled by the CMS.
Procedure
1. Launch the Web Intelligence Rich Client from the Windows Start menu.
2. Select a document from the Recent Documents dialog box.
3. In the User Identication dialog box, enter a valid user name and password.
4. Select an authentication mode from the list.
Do not choose Standalone from the System dropdown list if you want to work in Connected mode. When
you choose standalone authentication you work in Standalone mode, with no CMS connection.
5. Click Log in.
Results
If Web Intelligence Rich Client was already running on your computer, launching it again opens a new instance
of the application.
Related Information
Connection modes [page 36]
SAP BusinessObjects Web Intelligence User's Guide
About Web Intelligence
P U B L I C 39
2.2.5.3 Oine mode
In Oine mode, you are not connected to a CMS but CMS security still applies.
You can work with local documents and universes that are secured by the CMS you select at login, or with
unsecured local documents and universes. You can do the following:
● open local documents
● create documents (requires local universe and local connection server)
● edit documents
● refresh documents (requires local universe and local connection server)
● save documents locally
In Oine mode, you cannot import documents from or export documents to a CMS.
Security in Oine mode
When you connect to a CMS in Connected mode, your security rights in that CMS are downloaded to your
computer. Each document and universe downloaded from a CMS contains within it an access control list
identifying groups and users that have access rights to the document. In Oine mode, CMS security rights are
applied by matching the access rights for the document or universe against the locally stored security le. For
example, if a document was downloaded from a CMS to your local machine, and you do not have the right to
open the document in the CMS from which it was downloaded, you cannot open the document on your local
machine. If the security settings on objects do not allow working in oine mode, those objects cannot be
included when the document is used later.
Before you can work in Oine mode with documents or universes secured by a CMS, you must rst have
connected to that CMS at least once in Connected mode. This causes in the CMS security information to be
downloaded to your local machine and the CMS appears as a choice in the System dropdown list on the User
Identication page. You can then log in in Oine mode and work with no CMS connection because the CMS
security information is readable from the local le.
When working in Oine mode, you must have the appropriate universes and database middleware installed on
your machine to be able to create or refresh documents. If you do not, you can still open, edit, and save
documents locally as long as you have the appropriate security rights.
The security information for a CMS is stored in a local security information le with the LSI extension. One
computer can store LSI les for multiple CMSs.
40
P U B L I C
SAP BusinessObjects Web Intelligence User's Guide
About Web Intelligence
2.2.5.3.1 To work in Oine mode
There are a few ways you can work in Web Intelligence Rich Client in oine mode.
Prerequisites
You must have already connected at least once to the CMS from which the document you want to work was
exported, by launching Web Intelligence Rich Client from within the BI launch pad and opening the document in
it.
Procedure
1. Launch Web Intelligence Rich Client.
2. Do one of the following to open a document:
○ In the Recent Documents list of the Open Document pane, select a document exported from the CMS
whose security details are stored on your local machine.
○ Click Open in the toolbar, then browse to and double-click a .wid le.
3. In the User Identication dialog box, select the CMS from the System dropdown list.
4. Type your username and password.
5. Select the authentication method from the Authentication dropdown list.
6. Select Use in Oine mode.
7. Click Log On.
2.2.5.3.2 To select default folders for local documents and
universes
In Web Intelligence Rich Client, you can select a folder where local documents and universes are stored by
default on your local machine.
Procedure
1. In a Web Intelligence document in Design mode, click Application in the Properties tab.
2. In the Web Intelligence Options dialog box, select the General tab.
3. Next to User documents, click Browse, and select a folder for documents.
4. Next to Universes, click Browse, and select a folder for universes.
5. Click OK to close the Web Intelligence Options dialog box.
SAP BusinessObjects Web Intelligence User's Guide
About Web Intelligence
P U B L I C 41
2.2.5.4 Standalone mode
In Standalone mode, you are not connected to a CMS and no security is enforced.
You can work with local, unsecured documents and universes only. You can do the following:
● open, create, edit, and refresh documents
● save documents locally
You cannot import documents from or export documents to a CMS.
The middleware required to create and refresh local, unsecured documents with local, unsecured universes
must be installed on the computer on which you run Web Intelligence Rich Client.
2.2.5.4.1 To work in Standalone mode
You can work on documents in Web Intelligence Rich Client in Standalone mode.
Prerequisites
Any middleware required to work with unsecured documents and universes must be installed on your
computer.
Procedure
1. Launch Web Intelligence Rich Client.
2. Select Open from the menu, navigate to and double-click a .wid document.
3. In the User Identication dialog box, select Standalone from the System dropdown list.
4. Click Log On.
42
P U B L I C
SAP BusinessObjects Web Intelligence User's Guide
About Web Intelligence

2.2.5.5 Dening the Proxy Settings in Web Intelligence Rich
Client
You dene the proxy settings when you use an internet proxy server to access any URLs or images in your
reports.
Context
You do not need to dene these settings for images that are embedded in a report. Check the settings on your
internet browser or contact your BI administrator to obtain the information required to dene your proxy
settings.
To dene the proxy settings, perform the steps below:
Procedure
1. Launch Web Intelligence Rich Client.
2. Click the Options button in the upper right corner, or when a document is open, click Properties
Application .
3. In the Web Intelligence Options dialog box, click the Proxy tab.
4. Dene your Http Proxy Host.
5. Dene the Http Proxy Port.
6. Dene your Https Host and Port Settings, or select same as Http Proxy.
7. Click OK to save the settings and close the Web Intelligence Options dialog box.
2.2.6 Connection modes in Web Intelligence Rich Client
The connection mode in which you work in Web Intelligence Rich Client determines the actions you can
complete within a document.
The following topics explain the dierent connection modes.
2.2.6.1 Working with universes in Connected mode
When you perform desktop data analysis in Connected mode, you access CMS universes remotely.
The CMS applies the security rights directly, exactly as if you were performing data analysis from the BI launch
pad.
SAP BusinessObjects Web Intelligence User's Guide
About Web Intelligence
P U B L I C 43

2.2.6.2 Working with universes in Oine mode
You cannot access universes on the CMS remotely, because in Oine mode you are working without a CMS
connection.
To create or refresh a document in Oine mode, you must have rst connected to the CMS in Connected mode
so that a local security information (LSI) le containing your security rights to the resources in the CMS is
downloaded to your computer.
When you create or refresh a document in Oine mode, you can use:
● locally installed universes that are not secured by the CMS
● locally installed universes which you are authorized to access, as veried by the LSI le
2.2.6.3 Working with universes in Standalone mode
In Standalone mode in Web Intelligence Rich Client, you can work with a local universe, without need of a
connection to the CMS.
In Standalone mode, you cannot access local, CMS-secured universes. You must access the CMS universes
remotely. You can only work with unsecured, locally installed universes.
The middleware required to create and refresh local, unsecured documents with local, unsecured universes
must be installed on the computer where you perform desktop analysis.
When you copy the universe le locally, it should be saved in the following folder:
<install_path>\SAP BusinessObjects\SAP BusinessObjects Enterprise XI 4.0\Universes.
2.2.7 To set the default universe for a document
You can set the default universe in the Web Intelligence Options dialog box.
Procedure
1. Open a Web Intelligence document in Design mode.
2. Click the Options button in the upper right corner, or when a document is open, click Properties
Application .
3. In the Web Intelligence Options dialog box, select the General tab.
4. In the Select default universe section, click Select a universe.
5. Click Browse.
6. In the Universe dialog box, select a universe and click Select.
7. Click OK to close the Web Intelligence Options dialog box.
44
P U B L I C
SAP BusinessObjects Web Intelligence User's Guide
About Web Intelligence
2.2.8 To set viewing preferences
You can set Web Intelligence Rich Client viewing preferences in the Web Intelligence Options dialog box.
Procedure
1. Launch Web Intelligence Rich Client.
2. Click the Options button in the upper right corner, or when a document is open, click Properties
Application .
3. In the Web Intelligence Options dialog box, select the Viewing tab.
4. Select a measurement unit for report display in the Measurement unit section.
5. To display a grid for the alignment of report elements, select Show grid.
6. To align report elements to the grid automatically, select Snap to grid.
7. To set the amount of space between the lines in the grid, set the value in Grid spacing.
8. Click OK to close the Web Intelligence Options dialog box.
2.2.9 To change your password
You can change your password in the BI launch pad preferences.
Procedure
1. Launch Web Intelligence Rich Client from the Windows Start menu and connect to the server so that you
are in Connected mode.
2. Select Preferences from the BI launch pad toolbar.
3. Select Change Password.
Note
If this option is grayed out, then your ability to change your password has been disabled by the BI
Administrator.
4. Type your current password in the Old Password box.
5. Type your new password in the New Password box.
6. Type your new password again in the Conrm New Password box.
SAP BusinessObjects Web Intelligence User's Guide
About Web Intelligence
P U B L I C 45

Results
Your password is changed to the new password.
Related Information
To work on an existing document locally in Connected mode [page 39]
2.3 Setting up preferences, the interface and the document
locale
2.3.1 About setting Web Intelligence preferences
Use the Preferences tab of the BI launch pad to do the following:
Preferences pane items
Option
Description
General Set the user default settings. These are Administrator dened.
Change Password Change your password. Enter your old password, then enter the new password
twice.
Locales and Time Zone Set the Product Locale, Preferred Viewing Locale, and Current Time Zone.
Analysis edition for OLAP Set the Accessibility mode. (Not described here.)
Web Intelligence Choose the interfaces you want to use for View and Modify modes.
Select a default universe.
Set the drill options.
Set the saving priorities when saving as Excel.
Select your preferred document orientation.
BI workspaces
Set a default style. (Not described here.)
Crystal Reports Set Crystal Reports options. (Not described here.)
Related Information
Understanding the BI launch pad [page 27]
46
P U B L I C
SAP BusinessObjects Web Intelligence User's Guide
About Web Intelligence
2.3.1.1 Choosing the viewing and design interfaces
You can set options to determine how you view and explore existing documents and how you create documents
or edit and analyze existing documents.
You set these options in the Preferences panel in the BI launch pad.
Depending on your permissions and the Web Intelligence interface that you are using, you have a choice of
Reading mode, Design mode, and Data mode.
Note
Your choice of interface can be further restricted by your security prole.
When you right-click the title of existing document from the list of corporate documents and select View from
the shortcut menu, the document opens in Reading mode.When you create a document, or right-click the title
of an existing document and select Modify, the document opens in Design mode.
In the BI launch pad, you have the following choice of View interfaces:
Interface Description
HTML (no download required) You view documents using the Web Intelligence HTML
interface within the BI launch pad.
Applet (download required) You view documents using the Web Intelligence Applet
interface, also known as the Java applet, within the BI
launch pad.
Note
This interface requires the download of a Java applet.
Desktop (Rich Client, Windows only, installation required) You view documents using Web Intelligence Rich Client, a
standalone interface that works outside the BI launch pad
and allows you to work with documents without being
connected to a corporate repository.
Note
Web Intelligence Rich Client must be installed on your
local machine.
PDF
You view documents statically in PDF format.
In the BI launch pad, you have the following choice of Modify interfaces:
Interface Description
HTML (no download required) You create, edit and analyze documents using the Web
Intelligence HTML
interface within the BI launch pad.
Applet (download required) You create, edit and analyze documents using the Web
Intelligence Applet
interface within the BI launch pad. You
can select Design or Data mode.
SAP BusinessObjects Web Intelligence User's Guide
About Web Intelligence
P U B L I C 47

Interface Description
Note
This interface requires the download of a Java applet.
Desktop (Rich Client, Windows only, installation required) You create and edit documents using Web Intelligence Rich
Client
, also known as Desktop, a standalone interface that
works outside the BI launch pad and allows you to work with
documents without being connected to a corporate
repository. You can select Design or Data mode.
Note
Web Intelligence Rich Client must be installed on your
local machine.
Once you open a document in a specic interface, you remain in that interface for the rest of your session. For
example, if you select HTML as your Read interface and Web Intelligence Applet as your Modify interface, you
remain in the Web Intelligence HTML interface even if you switch to Design mode (which uses the Modify
interface) within the application.
Also, if you open a document using the Modify command with a specic interface chosen, the document will
continue to open in that interface, even if you change the modify selection. This is important if you are using a
feature that is available in one Web Intelligence interface, but not another, as in the case of documents based
on BEx queries.
Related Information
About Web Intelligence [page 19]
2.3.1.1.1 To change the document view settings in the BI
launch pad
In the BI launch pad preferences, you can select the type of document view and the Web Intelligence version
that appears when you open a document to read or modify.
Procedure
1. Click Preferences in the BI launch pad to open the Preferences dialog box.
2. Click Web Intelligence in the Preferences list.
3. Select the viewing interface from the View options.
This setting determines which version of Web Intelligence opens your document in Reading mode.
48
P U B L I C
SAP BusinessObjects Web Intelligence User's Guide
About Web Intelligence
4. Select the design interface from the Modify options.
This setting determines which version of Web Intelligence opens your document in Design modes.
5. Click Save and Close.
These changes take eect the next time you open a Web Intelligence document.
2.3.1.2 Setting application modes
Depending on the Web Intelligence application mode you are in, you can build queries, documents and reports
and analyze the data in reports.
Application modes described
Application Mode
Description
Data
In Data mode, you can do the following:
● Create, edit and manage queries that supply data to reports.
● Add and rename data providers.
● Change the source from which a data provider draws its data.
All the data providers used by the current document appear in a list in Data mode, and all
toolboxes not related to working with data providers are disabled.
Restriction
The Data mode is not available in the Web Intelligence HTML interface.
Reading
Reading mode allows you to do the following:
● View reports.
● Track changes in and drill down on report data.
The main application toolbar and the Side Panel are available in Reading mode. Toolboxes
are not available.
Design
Design mode allows you to do the following:
● Perform a wide range of analysis tasks.
● Add and delete report elements such as tables or charts.
● Apply conditional formatting rules.
● Enhance reports with formulas and variables.
● Work with the report structure or with the report populated with data. Working with the
report structure only allows you to make modications without accessing the server.
When you work with reports populated with data, each change you make is applied on
the server.
Tip
If you are making numerous modications, we recommend that you work with the re
port structure, and to populate the report with data when you have nished your modi
cations.
SAP BusinessObjects Web Intelligence User's Guide
About Web Intelligence
P U B L I C 49
2.3.1.2.1 To switch between application modes
Depending on the mode you choose, the toolboxes and toolbars relevant to the mode are made available and
other toolboxes and toolbars are either invisible or disabled.
Procedure
In a Web Intelligence document, do one of the following:
○ To work in Data mode, click Data.
Note
Data mode is only available in Web Intelligence Applet interface and Web Intelligence Rich Client.
○ To work in Reading mode, click Reading in the top corner of the toolbar.
○ To work in Design mode with only the report structure showing, click the arrow on the Design button and
select Structure Only from the dropdown list.
○ To work in Design mode with report data, click the arrow on the Design button and select With Data from
the dropdown list.
2.3.2 Interface and document locales
Locales determine the appearance of the application interface (for example, menu items and button text) and
data (for example, date and number formatting) in relation to local preferences.
The locales used by Web Intelligence are:
Locale
Description
Product locale
The language and interface alignment control of the Web Intelligence application inter
face. This locale can be selected in the following locations:
● In the Web Intelligence HTML or Web Intelligence Applet interface, the setting is in
the BI launch pad preferences.
● In the Web Intelligence Rich Client, the setting is in the Application Properties.
Preferred viewing locale
The preferred locale for displaying document data. This locale can be selected in the
following locations:
● In the Web Intelligence HTML or Web Intelligence Applet interface, the setting is in
the BI launch pad preferences.
● In the Web Intelligence Rich Client, the setting is in the Application Properties.
50 P U B L I C
SAP BusinessObjects Web Intelligence User's Guide
About Web Intelligence
Locale Description
Document locale
The date and number locale in the document.
● In the Web Intelligence HTML or Web Intelligence Applet interface, this locale can
not be selected.
● In the Web Intelligence Rich Client, the Permanent regional formatting setting is
available in the Document Properties.
Right to left alignment in Web Intelligence
The alignment of the application interface is from right to left (RTL) when you select Arabic or Hebrew. As of
Web Intelligence 4.2, any document can be viewed from right to left or left to right. To specify the orientation
used by default, you can:
● set a user preference for every document in the BI Launch Pad Preferences menu,
● set a preference for the current document only in the Document Summary.
You can set a parameter that overrides the document settings to dene the default orientation of every Web
Intelligence document. Depending on this parameter, a document created with a left-to-right alignment for
instance can be viewed with a right-to-left alignment.
Caution
The user interface, the printouts, the output generation (PDF and Excel les) and scheduled documents
inherit the orientation set by default. If you create a document with a right to left orientation, the generated
PDF will have the same orientation.
The parameter dened in the BI Launch Pad menu overrides the parameter dened for the document. If you
have not dened a default orientation in the BI Launch Pad, the document will be displayed according to the
parameter set at the document level.
Note
In Connected mode, Web Intelligence Rich Client does not take into account user preferences dened in the
BI Launch Pad. You have to change the document orientation manually at document level in the Document
Summary.
Product locale and Right to Left interface alignment
When you choose Arabic or Hebrew for the Product locale, the Web Intelligence application interface elements
are always right to left (RTL), in eect mirroring the left to right (LTR) alignment. For example, the side panel for
an RTL locale is on the right, whereas in an LTR locale, the side panel is on the left.
SAP BusinessObjects Web Intelligence User's Guide
About Web Intelligence
P U B L I C 51

Preferred viewing locale and Right to Left Alignment
When you choose Arabic, Hebrew, Farsi, Urdu or Divehi for the Preferred viewing locale, depending on the
system settings selected by the BI administrator, the elements and data in documents created in this locale
may be right to left (RTL). For example, in a cross table, in an LTR locale the side header column is on the left. In
an RTL locale, the side header column is on the right.
Note
Charts are LTR, per the SAP Globalization product standards.
Related Information
To set the Product locale in the BI launch pad [page 53]
To link the current document locale to a document in the BI launch pad [page 54]
To set the Preferred viewing locale in the BI launch pad [page 56]
To set the Product locale in Web Intelligence Rich Client [page 52]
To associate a locale with a document in Web Intelligence Rich Client [page 54]
To set the Preferred viewing locale in Web Intelligence Rich Client [page 55]
To set the document orientation from right to left in the current report [page 56]
To set the document orientation from right to left in all reports [page 57]
2.3.2.1 The Product locale
The Product locale controls the user interface.
For example, the Product locale determines the menu items and button text.
2.3.2.1.1 To set the Product locale in Web Intelligence Rich
Client
You can set the Product locale for Web Intelligence Rich Client in the Web Intelligence Options dialog box.
Procedure
1. Open a Web Intelligence document in Design mode.
2. In the Properties tab, click Application.
52
P U B L I C
SAP BusinessObjects Web Intelligence User's Guide
About Web Intelligence
3. In the Web Intelligence Options dialog box, select the Locale tab.
4. Choose a locale from the Product locale list.
5. Click OK to close the Web Intelligence Options dialog box.
6. Close and relaunch Web Intelligence Rich Client.
2.3.2.1.2 To set the Product locale in the BI launch pad
In the BI launch pad preferences, you can choose the product locale.
Procedure
1. Click Preferences on the BI launch pad toolbar to open the Preferences dialog box.
2. Click Locales and Time Zone in the Preferences list to display the available options.
3. Select the product locale from the Product Locale list.
4. Click Save and Close.
2.3.2.2 The document locale in documents
The document locale, generated by Web Intelligence, formats the data in documents.
For example, the document locale determines the display of dates and numbers.
By default, the browser locale is used. You can permanently associate the current document locale with a
document by saving the document with the Permanent regional formatting option selected in the Document
Summary dialog box. When you select this option the document data is always formatted using the document
locale you have set. This applies to all users who view the document, not just the user who activates Permanent
regional formatting.
In Web Intelligence Rich Client, if the Use the document locale to format the data setting is selected in the
application properties, the document locale determines how date and number formats.
Related Information
To associate a locale with a document in Web Intelligence Rich Client [page 54]
SAP BusinessObjects Web Intelligence User's Guide
About Web Intelligence
P U B L I C 53
2.3.2.2.1 To associate a locale with a document in Web
Intelligence Rich Client
You can associate a locale with a document in Web Intelligence Rich Client.
Prerequisites
This task does not work in the Web Intelligence HTML interface or Web Intelligence Applet interface.
Procedure
1. In a Web Intelligence document in Design mode, click Document on the Properties tab.
2. In the Document Summary dialog box, select Permanent regional formatting.
3. Click OK to close the Document Summary dialog box.
4. Save the document.
2.3.2.2.2 To link the current document locale to a
document in the BI launch pad
In the BI launch pad preferences, you can choose the locale language for open documents in Web Intelligence.
Procedure
1. Click Preferences on the BI launch pad toolbar to open the Preferences dialog box.
2. Click Web Intelligence in the Preferences list.
3. In the section When viewing a document, select one of the following:
○ Use the document locale to format the data
○ Use my preferred viewing locale to format the data
4. Click Save and close.
Related Information
The Preferred viewing locale [page 55]
To set the Preferred viewing locale in the BI launch pad [page 56]
54
P U B L I C
SAP BusinessObjects Web Intelligence User's Guide
About Web Intelligence

2.3.2.3 The Preferred viewing locale
The Preferred viewing locale is the locale you select that aects the display of document data.
When you create a document, your Preferred viewing locale is always assigned as the initial document locale,
whether or not the locale settings give the Preferred viewing locale priority.
Note
If the settings do not give your Preferred viewing locale priority, the data is formatted according to the
document locale saved with the document.
In Web Intelligence Rich Client, if the locale settings give your Preferred viewing locale priority through the Use
the Preferred viewing locale to format the data setting in the application properties, the document locale is set
to the Preferred viewing locale when you open a document. When you save the document, this document locale
is saved with the document.
2.3.2.3.1 To set the Preferred viewing locale in Web
Intelligence Rich Client
You can set the Preferred viewing locale for Web Intelligence Rich Client in the Web Intelligence Options dialog
box.
Procedure
1. Open a Web Intelligence document in Design mode.
2. In the Properties tab, cllick Application.
3. In the Web Intelligence Options dialog box, select the Locale tab.
4. Select a locale from the Preferred viewing locale dropdown list.
5. Click OK to close the Web Intelligence Options dialog box.
6. Close and reopen any open documents so that the locale setting is changed in the documents.
SAP BusinessObjects Web Intelligence User's Guide
About Web Intelligence
P U B L I C 55
2.3.2.3.2 To set the Preferred viewing locale in the BI
launch pad
In the BI launch pad preferences, you can choose a Preferred Viewing Locale language for Web Intelligence.
Procedure
1. Click Preferences on the BI launch pad toolbar to display the Preferences dialog box.
2. Click Locales and Time Zone in the Preferences list to display the available options.
3. Select the preferred viewing locale from the Preferred Viewing Locale list.
4. Click Web Intelligence to display the Web Intelligence options.
5. If you want data to be formatted using the preferred viewing locale, click Use my Preferred Viewing Locale
to format the data beneath When viewing a document.
6. Click Save and Close.
2.3.2.4 The Preferred document orientation
The document orientation parameter enables you to dene a default orientation for a single document, or
every document.
When you create a document, you can select its orientation. You can also set this paramater for every
document you open or edit in Web Intelligence via the BI Launch Pad.
Use this paramater whenever you need to change a document's orientation. For instance, if you are viewing a
document that has been created using the Arabic or Hebrew locale, you can set the document's orientation
from left to right without altering the original document.
2.3.2.4.1 To set the document orientation from right to left
in the current report
The parameter in the Document Summary only applies to the document you are currently working on.
Context
To edit this parameter, make sur you are in Design mode.
56
P U B L I C
SAP BusinessObjects Web Intelligence User's Guide
About Web Intelligence

Procedure
1. In the Document Summary, click Edit.
2. To view the document from right to left, check Right to Left Content Alignement.
3. Click OK.
2.3.2.4.2 To set the document orientation from right to left
in all reports
The BI Launch Pad orientation parameter overrides the document orientation preference dened when the
document was created.
Context
When you set a default orientation in the BI Launch Pad preferences, it applies to all reports.
Procedure
1. In BI Launch Pad, click Preferences Web Intelligence .
In Web Intelligence Rich Client interface, click Tools Options Locale .
2. In Select your preferred document orientation, select the default document orientation you want to use.
3. Click Save & Close.
2.3.3 Selecting the measurement unit
The measurement unit parameter enables you to select the unit in which measurements should be done in
Web Intelligence.
This parameter is useful when you have a specic amount of space in you report to allocate to specic report
elements, such as a header of a footer for example. The parameter is available in the Applications tab of the
properties. You can also nd it in the Tools Options menu in the Applet and Rich Client interfaces.
By default, the measurement unit is inches in the HTML interface, and centimeters in the Applet and Rich
Client interfaces.
SAP BusinessObjects Web Intelligence User's Guide
About Web Intelligence
P U B L I C 57

2.3.4 Increasing or decreasing the display size of a report in
Web Intelligence
You can zoom in and out in Web Intelligence reports using the zoom percentage list box on the bottom toolbar.
You can decrease and enlarge the report size from 10% to 500%.
In the Web Intelligence HTML interface, you can use the browser zoom feature to increase or decrease the
display size. However, the text size setting within a browser does not change the size of text in a Web
Intelligence report.
Restriction
Microsoft Windows allows users to change the display size of text and other items on the computer screen
using a magnier tool. This tool is not supported in the Web Intelligence interfaces.
58 P U B L I C
SAP BusinessObjects Web Intelligence User's Guide
About Web Intelligence

3 Building and running queries
3.1 Introduction to query building
In Web Intelligence, every reporting or analysis operation is done on what is called a query.
A query is a business question you ask to the application, and the application uses it in return to retrieve data.
To help you phrase your business question correctly, the query uses elements called objects that contain pre-
dened data.
In your company, the data are stored in storage units to which you go to nd specic and meaningful
information about customers, revenues, products and so on. In Web Intelligence, these storage units are called
data sources. You run queries on top of them to retrieve data. When you run a query, it searches the data
source to answer your business question. For example, you can use a query to ask for the sales margins per
product over a time period.
The following sections provide information on the dierent objects available to create queries, the various
types of data sources supported in Web Intelligence and how you can create queries on top on them.
To know more about
Read
Objects
● Objects available in queries [page 61]
● Classes and subclasses [page 62]
● Analysis dimensions [page 62]
● Dimensions [page 62]
● Attributes [page 63]
● Hierarchies [page 64]
● Level objects [page 65]
● Members [page 66]
● Named sets [page 66]
● Calculated members [page 66]
● Measures [page 66]
SAP BusinessObjects Web Intelligence User's Guide
Building and running queries
P U B L I C 59

To know more about Read
Data sources
● Building and running queries [page 60]
● Building queries on universes [page 71]
● Building queries on data les [page 103]
● Building queries on BEx queries [page 107]
● Building queries on SAP HANA views with SAP HANA
Direct Access [page 142]
● Building queries on SAP HANA views in SAP HANA On
line mode [page 149]
● Building queries on relational connections using Free-
Hand SQL statements [page
158]
● Building queries on Analysis View data sources [page
163]
● Building queries on web service data sources [page
164]
● To create a query on a dierent data source in an exist
ing document [page 169]
3.2 Building and running queries
You build queries using the Web Intelligence Query Panel.
The data sources you can use for a query depend on the interface you are using.
Available data sources for the Web Intelligence interfaces
Data source
Web Intelligence HTML Web Intelligence Applet Web Intelligence Rich Client
No data source Yes Yes Yes
Universe (.unx or .unv)
Yes Yes Yes
BEx query Yes Yes Yes
SAP HANA Views Yes Yes Yes
Free-hand SQL query Yes Yes Yes
Analysis View No Yes Yes
Text, Excel or CSV le
● Text: Refresh only, if the
le has previously been
copied to the CMS.
● Excel: Yes, if the le is
available in the CMS
● CSV le: no
●
Text: Refresh only, if the
le has previously been
copied to the CMS.
● Excel: Yes, if the le is
available in the CMS
● CSV le: no
Yes
Web Services No No Yes
You run the query to return data in a report which you can then analyze further by, for example, ltering or
ranking its data.
60
P U B L I C
SAP BusinessObjects Web Intelligence User's Guide
Building and running queries

Measures are common to all queries. Measures return data, often numeric, that is calculated based on the
other objects in the query (dimensions or hierarchies). For more information on measures, see Measures [page
66].
Queries based on universes can be hierarchical or non-hierarchical. Non-hierarchical queries organize data in
dimensions which have no hierarchical relationship. For example, a query containing a customer dimension and
a revenue measure calculates revenue per customer. For more information on universe queries, see Building
queries on universes [page 71].
Hierarchies organize data into hierarchical relationships. For example, a geographical hierarchy can contain
data about countries, states and cities (dierent levels of the hierarchy). A query containing a geographical
hierarchy and a revenue measure calculates revenue at the dierent levels of the hierarchy (country, state,
city). For more information on hierarchies, see Hierarchies [page 64].
Whether a universe query is hierarchical or non-hierarchical depends on the database from which the universe
retrieves its data.
Note
● You can create a blank document that does not use a data source.
● To connect to an Essbase OLAP data source from SAP BusinessObjects OLAP products including
universe design tool, Web Intelligence Rich Client and Web Intelligence via the BI launch pad, the BI
administrator must ensure that Essbase client environment variables ARBORPATH and ESSBASEPATH
are created and set as Windows system environment variables on machines hosting those SAP
BusinessObjects OLAP products .
3.2.1 Objects available in queries
You can use a variety of objects in Web Intelligence queries.
The following objects can be used in Web Intelligence queries:
● classes and subclasses
● dimensions
● attributes
● hierarchies
● level objects
● members
● named sets
● calculated members
● measures
Objects are displayed in the Available Objects pane. Objects can be arranged by:
● Alphabetical order
● Query
● Data Source
● Navigation paths
SAP BusinessObjects Web Intelligence User's Guide
Building and running queries
P U B L I C 61

3.2.1.1 Classes and subclasses
A class is a folder containing objects. A sub-class is a sub-folder.
The role of classes is to organize the objects into logical groups. When you create queries on the universe,
classes help you to nd the objects that represent the information that you want to use in a query.
Related Information
Building and running queries [page 60]
3.2.1.2 Analysis dimensions
An analysis dimension contains a collection of related hierarchies.
Analysis dimensions do not appear as result objects in queries. If you select an analysis dimension, its default
hierarchy appears in the query.
Analysis dimensions use the following icon:
Related Information
Hierarchies [page 64]
3.2.1.3 Dimensions
A dimension can represent non-hierarchical data in a report.
For example, in a query containing a non-hierarchical [Customer] dimension and the [Revenue] measure, the
results show the revenue generated by each customer in non-hierarchical columns.
In hierarchical data sources, hierarchies appear beneath the dimensions on which they are based in the list of
available objects. When you include the dimension in a query hierarchical data is returned.
Dimensions use the following icon:
Restriction
Web Intelligence only supports dimensions and hierarchies based on STRING data types in reports on the
top of OLAP connections. If your OLAP dimensions and hierarchies are based on other data types such as
DATE or INTEGER, their data will be converted as STRING.
62
P U B L I C
SAP BusinessObjects Web Intelligence User's Guide
Building and running queries

Related Information
Hierarchies [page 64]
3.2.1.4 Attributes
An attribute is an object attached to a parent object that provides additional descriptive information about the
parent. Age for instance can be an attribute of the Customer dimension.
An attribute can be associated with dimensions, hierarchies, measures and levels. There is no notion of
hierarchy between an attribute and its parent object, both objects remain independent.
Each value of a parent object can have only one associated value of any attribute. Using the example in the
above topic, each Customer value can have only one associated value in the Age attribute.
If, due to incorrect universe design, an attribute tries to return multiple values for one parent object value, its
cell displays a #MULTIVALUE error message.
Attributes use the following icon:
Note
For .unv universes, created with the universe design tool, attributes are referred to as details, and apply to
relational data sources.
Measure Attributes
In an OLAP business layer, measure attributes provides additional information about the formatted value.
Measure attributes were originally created to support BEx queries formatted values. Formatted values usually
consist of strings made of number with formatted characters such as currency symbols, for instance. Because
of this specicity, the way measure attributes are processed varies depending on how you use them.
In an explicit aggregation, measure attributes are processed like dimensions. If you use the SUM function in a
table footer for instance, Web Intelligence aggregates the unique values of the measure attribute and then
proceeds to count them. However, if you use a measure attribute in a default aggregation, the aggregation is
delegated to its data source. This happens when you drop a measure attribute in the body of a table for
instance.
Related Information
Dimensions [page 62]
Measures [page 66]
Default aggregation [page 244]
Explicit aggregation [page 245]
SAP BusinessObjects Web Intelligence User's Guide
Building and running queries
P U B L I C 63
Examples of default and explicit aggregation [page 246]
3.2.1.5 Hierarchies
A hierarchy is a set of data members arranged in levels or parent-child relationships.
For example, a [Geography] hierarchy might contain the [Country], [State] and [City] levels. Hierarchical
objects are used in BEx and OLAP data sources.
Hierarchies produce hierarchical columns in the result set produced by the query. You can expand the items in
the hierarchy to explore its data. For example, you can expand the [California] level in a [Geography] hierarchy
to explore data related to California.
You can select which members appear in the result set by using the Member Selector dialog box accessed via
the Query Panel.
In hierarchical data sources, hierarchies are associated with a dimension and appear beneath the dimension
with which they are associated in the list of available objects. The following information is also displayed with
the hierarchy objects:
Display object
Description
This is the Web Intelligence default hierarchy, it is the placeholder for the retrieved hier
archy.
A white checkmark (V) in a black circle. This is the validation or toggle, and indicates
that this object is the 'active' hierarchy in BEx, Microsoft Analysis Services (MSAS), and
Essbase. In MSAS, the term default is used to describe the active hierarchy.
[n] where 'n' is an integer This applies to BEx queries. This is the version number of the SAP BW hierarchy that
was used at design time. For these hierarchies, Web Intelligence now displays the ver
sion of the hierarchy after the hierarchy name. For example: Country hierarchy [2]. The
BEx query designer can prepend a string before the version number for clarity, for ex
ample: [version 2]. This version is also displayed in the report table header.
Restriction
Web Intelligence only supports dimensions and hierarchies based on STRING data types in reports on the
top of OLAP connections. If your OLAP dimensions and hierarchies are based on other data types such as
DATE or INTEGER, their data will be converted as STRING.
Related Information
Dimensions [page 62]
Hierarchical queries [page 68]
64
P U B L I C
SAP BusinessObjects Web Intelligence User's Guide
Building and running queries
3.2.1.6 Level objects
A level is a set of members in a hierarchy at the same distance from the root of the hierarchy.
For example, [City] might be a level in a [Geography] hierarchy which contains members such as [Los Angeles]
and [San Francisco]. The level names are prepended by their depth. The numbers are contiguous, and always
start from the root with the number 1 as follows:
1 - Level a
2 - Level b
3 - Level c
Levels produce at columns in the result set generated by the query. For example, a query containing the
[Country] level and [Revenue] objects produces a result such as the following:
Country
Revenue
US 10,123,121
France 8,232,231
Germany 7,342,342
UK 9,343,092
Not all hierarchies contain levels.
Levels use the following icon:
Using BW hierarchy levels as individual objects (New in 4.2 SP4)
In 4.2 SP4, you can use BW hierarchy levels as individual objects.
When executing a document, Web Intelligence automatically creates level objects for BEx hierachies and
displays them in the document outline as details of the hierarchies' objects. There are no modications in the
Query Panel.
Since they are processed as individual objects, you can use them to feed any chart or table. You can also use
them in formulas, lter them, rank them, sort them and so on.
Restriction
You can’t merge level objects.
When merging BEx hierarchies, their level objects are automatically created on the merged object.
Related Information
Building queries on BEx queries [page 107]
SAP BusinessObjects Web Intelligence User's Guide
Building and running queries
P U B L I C 65

Hierarchies [page 64]
3.2.1.7 Members
A member is an individual data item in a hierarchy.
For example, the [Geography] hierarchy can contain members such as [France] at the [Country] level, or [Las
Vegas] at the [City] level.
You select individual members from a hierarchy for inclusion in the query result if you do not want to include all
members in the hierarchy. You can also dene a named set containing a set of members.
Related Information
Hierarchies [page 64]
Named sets [page 66]
3.2.1.8 Named sets
A named set is a named expression that returns a set of members.
Named sets can be dened in OLAP databases, or in universes based on relational or OLAP databases.
3.2.1.9 Calculated members
Calculated members are members returned by a Multidimensional Expression (MDX) statement.
MDX is the language used to access hierarchical data in OLAP databases.
The administrator of an OLAP database can create calculated members that are available to MDX queries that
access the database.
Calculated members use the following icon:
3.2.1.10 Measures
Measures are objects composed of numeric data that represent calculations and aggregate functions that map
to statistical and analytic data in the database. In a business layer, measures represent the factual information
(data).
Measures return results based on the objects with which they are associated in a query. For example, a query
containing the [Customer] dimension and [Revenue] measure returns revenue by customer. A query
66
P U B L I C
SAP BusinessObjects Web Intelligence User's Guide
Building and running queries

containing the [Geography] hierarchy and [Revenue] measure returns revenue calculated for all the dierent
aggregations possible in the hierarchy.
Aggregating the information must make sense for the object to be a measure. For example, [Revenue] is the
calculation of the number of items sold multiplied by item price. Measures are often located in a Measures
class.
By default, measures are calculated by aggregating detailed values returned from the database.
Smart measures are a special kind of measure that are calculated by the database itself and returned by the
query already aggregated. In certain situations, smart measures impact the way in which calculations are
displayed. For more information on smart measures, see the Using functions, formulas and calculations in Web
Intelligence guide.
Measure objects use the following icon:
Related Information
Hierarchies [page 64]
3.2.2 About query and document user rights
Rights are dened by BI administrators.
BI administrators can view and edit queries even when the access rights have been limited to a restricted sub-
set of users. Whether you can view, create, modify, or delete queries and their related objects, documents or
reports, depends on your assigned user rights.
3.2.3 Non-hierarchical queries
You build a non-hierarchical query using dimensions, attributes and measures.
Dimensions represent business objects such as customers or cities. Measures derive results, usually
numerical, from the dimensions you include in the query. For example, a query containing the [Customer]
dimension and the [Revenue] measure returns revenue by customer.
Non-hierarchical queries produce result sets in which dimensions are not related. Each object in the query
produces one at column in the result set.
Non-hierarchical queries do not include the following objects: hierarchies, levels, members or named sets.
Related Information
To build a query on a universe [page 72]
SAP BusinessObjects Web Intelligence User's Guide
Building and running queries
P U B L I C 67
Measures [page 66]
Hierarchies [page 64]
Hierarchical member selection and query lters [page 74]
3.2.4 Hierarchical queries
A hierarchical query contains at least one hierarchy object.
You can build hierarchical queries on universes that support hierarchical data or on BEx queries which access
SAP Info Queries directly. Hierarchical data can come from relational or OLAP databases, depending on how
the data is structured in the universe.
Note
A relational data source is not a true hierarchy; it is a dened path between attributes.
You can include hierarchies either as result or lter objects. When you build a hierarchical query, the Web
Intelligence Query Panel provides you with additional features for working with hierarchical data.
For example, if you include a hierarchy as a result object, you have the ability to choose members from the
hierarchy to appear in the result. The features available in the hierarchical query panel also depend on the
source of the hierarchical data you are accessing.
The result set generated by a hierarchical query allows you to perform hierarchical data analysis. Each
hierarchy object in the query produces a hierarchical column in the report. You can expand members to reveal
their child members.
Tip
When running or refreshing a BEx query that contains a hierarchical object, make sure to put it rst in the
Query Panel. Indeed, it signicantly decreases the execution time of the query.
Example
If you expand the [US] member to reveal US states in a [Geography] hierarchy, then measures in the block
are aggregated depending on the member with which they are associated.
A hierarchical query containing the [Customers] hierarchy and the [Unit Sales] and [Store Cost] measures
gives the following result set:
Customers
Unit Sales Store Cost
All Customers 364,707 371,579
US
276,773 234,555
CA 45,506 67,999
OR 32,104 56,700
Albany 10,324 12,325
68 P U B L I C
SAP BusinessObjects Web Intelligence User's Guide
Building and running queries
Related Information
Hierarchical member selection in BEx queries [page 78]
Measures [page 66]
Hierarchies [page 64]
Hierarchical member selection and query lters [page 74]
Selecting members of a hierarchy [page 73]
3.2.4.1 Including multiple hierarchies in a query
When you combine multiple hierarchies in a query, the results for all the combinations of members in the
dierent hierarchies appear in the resulting document.
Example
Including two hierarchies in a query
You have two hierarchies, [Gender] (containing the members [All], [Male] and [Female]) and [Customer
Geography]. Combined in a query with a measure, the two hierarchies give the following result:
Customer Geography
Gender Internet Sales Amount
All Customers All Gender $29,358,677
Female $10,000,000
Male $19,358,677
France All Gender $2,644,017
Female $1,058,677
Male $1,285,340
Pierre All Gender $1,249
Female $1,249
Alain All Gender $1,155
Female $1,155
SAP BusinessObjects Web Intelligence User's Guide
Building and running queries
P U B L I C 69

3.2.5 To create a document without a data source
You can create a document without selecting a data source.
Context
One reason you might want to create a document with no data source is if you want to create a "template"
document that contains the standard title page as the rst report, standard copyright text as the second
report, and so on. You can set the header and footer layouts, and even include empty tables and charts that are
formatted. Later on, you can connect the document to a data source using a query.
Note
The rights set for you by the BI administrator determine your access to data sources and ability to create
documents in Web Intelligence.
Procedure
1. Open Web Intelligence.
2. Do one of the following:
○ In Reading mode, click the New icon in the toolbar.
○ In Design or Data mode, in the File tab, click the New icon.
Note
If you have just launched Web Intelligence Rich Client, click Blank Document in the New Document
dialog box.
3. Select No data source, and click OK.
Results
A blank document opens. The Available Objects pane contains no objects.
Related Information
Building queries on universes [page 71]
Building queries on BEx queries [page 107]
Building queries on SAP HANA views with SAP HANA Direct Access [page 142]
70
P U B L I C
SAP BusinessObjects Web Intelligence User's Guide
Building and running queries
Building queries on data les [page 103]
Building queries on web service data sources [page 164]
Building queries on Analysis View data sources [page 163]
Building queries on SAP HANA views in SAP HANA Online mode [page 149]
3.2.6 Building queries on universes
Universes present data from relational or OLAP data sources as collections of related objects.
Universes contain the following types of data:
Data Type
Description
Relational Relational data is organized as a collection of related objects (dimensions, details
and measures). You combine universe objects in a query which you run to generate
a report. For example, a query containing the Customer dimension and the Reve
nue measure generates a report showing revenue generated by customer.
Hierarchical
Hierarchical data is organized as members in related hierarchies. For example, a
Geography hierarchy can contain levels showing countries, states and cities. A
query built on the Geography hierarchy and Revenue measure generates a report
showing revenue generated at dierent levels of the hierarchy (revenue by country,
by state and by city). The query automatically calculates the revenue values at dif
ferent levels of the hierarchy.
Note
● In queries based on .unv or .unx universes, Web Intelligence only takes into account the following
display properties that are set in the information design tool Format Editor:
○ .unx format universes: only properties dened in the Data tab are supported.
○ .unv format universes: only properties dened in the Number tab are supported.
● You can set the default universe for Web Intelligence documents in the BI launch pad preferences. If you
select a default universe for universe-based queries, then when you create a document, the Select a
universe dialog box shows the default universe. For more information on setting a default universe,
consult the Business Intelligence Launch Pad User Guide.
Related Information
Hierarchies [page 64]
3.2.6.1 Hidden objects
The universe designer has the possibility to hide objects in a universe.
If the universe designer hides an object in the universe, you can no longer create a new report based on this
object. However, the existing reports that use this universe object are still valid, meaning that report blocks
SAP BusinessObjects Web Intelligence User's Guide
Building and running queries
P U B L I C 71
using that object still display the data related to it. In the Available Objects pane of the Side Panel, the hidden
objects is still visible.
However, the hidden object is no longer be visible and usable in the universe outline of the Query Panel. For
existing reports using the object that is now hidden, it still appears in the Results Objects pane according to the
query denition; but in the universe outline of the Query Panel, the hidden object is not visible. Note that if you
remove the object from the query, then the object is denitively lost as it doesn’t appear in the universe outline.
If you do a universe change source towards a target universe that contains hidden objects, the match happens
normally if and only if the target universe contains a hidden object with the same name and the same ID.
3.2.6.2 To build a query on a universe
You can build a query using a universe as a data source.
Procedure
1. Open Web Intelligence and click the New icon in the File toolbar.
2. Select the universe on which you want to create a document.
If you are using the Web Intelligence Rich Client, click Select .
Note
You can set the default universe for Web Intelligence documents in the BI launch pad preferences. If you
select a default universe for universe-based queries, then when you create a document, the Select a
universe dialog box shows the default universe. For more information on setting a default universe,
consult the Business Intelligence Launch Pad User Guide.
The Query Panel opens.
3. Select and drag dimensions and measures that you want to include in the query into the Result Objects
pane.
Note
For some OLAP .unv and .unx universes, you are required to select a measure for your query.
Tip
○ To add all the objects in the class to the Result Objects pane, double-click the class folder.
○ To view the details of an object, move your mouse over the object in the Result Objects. A tooltip
shows the object details. To copy the content for reuse in another application, right-click the object
and select Object Description. The Object Description dialog box displays all of the details. You can
also select the text in the text box and paste it in another application.
4. Repeat the previous step until the query contains all the objects you want to include.
72
P U B L I C
SAP BusinessObjects Web Intelligence User's Guide
Building and running queries

5. Select the objects on which you want to dene query lters and drag them to the Query Filters pane. To
create a quick lter on an object, select the object in the Result Objects pane then click the Add a quick
lter icon in the Result Objects toolbar.
Note
If the query is based on a HANA universe, and if the views contain HANA variables or input parameters
or both, there will be query prompts. If you add prompts in the Quick Filters pane, there could be a
duplication of prompts. We recommend that you run the query prior to dening any query prompts to
know what prompts may already exist.
6. Set the scope of analysis and other query properties. For information on scopes of analysis, see Setting the
scope of analysis [page 89].
7. To remove an object from the Result Objects or Query Filters panes, click the Remove icon in the top corner
of the pane.
8. To remove all objects from the Result Objects or Query Filters panes, click the Remove All icon in the top
corner of the pane.
9. Click Run Query. When you have more than one query and you want to run just one query, click Run
Queries and select the query that you want to run.
Note
○ If a document is created with two data providers (queries) based on same data source (universe)
and you change the source of one of the queries, the source of the other data provider is not
changed.
○ If you are querying a HANA data source that uses input parameters, then when you run the query,
you can encounter prompts that require you to enter values for variables and parameters. The
values available in the prompts come directly from the HANA data source.
Related Information
To preview query results [page 173]
Non-hierarchical queries [page 67]
HANA query prompts in Web Intelligence [page 209]
3.2.6.3 Selecting members of a hierarchy
When you have hierarchical members in a query, you use the Member Selector dialog box to select members of
the hierarchy to appear in the report generated from the query result set.
After you have selected members, they appear below the hierarchy object in the Query Panel.
You can select members explicitly, or implicitly through functions. For example, you can explicitly select the
[California] and [Los Angeles] members of the [Geography] hierarchy. You can select the child members of the
[US] member (to give US states). You can also select the members included in a named set, for example Top
Cities by Revenue to include the cities that generate the most revenue.
SAP BusinessObjects Web Intelligence User's Guide
Building and running queries
P U B L I C 73

Related Information
Overview of the Member Selector dialog box [page 75]
Hierarchical member selection and query lters [page 74]
3.2.6.3.1 Hierarchical member selection and query lters
When you lter members in a query lter, you also impact measure aggregation.
This is dierent from hierarchy member selection in the Member Selector dialog box, which does not impact
measures.
Example
Member selection and hierarchical ltering
In this example you have the following data:
Customer Geography
Internet Sales Amount
All Customers $29,358,677.22
France $2,644,017.71
Hauts de Seine $263,416.19
Seine (Paris) $539,725.80
Germany $2.894,312.34
Brandenburg $119,871.08
Hessen $794,876.08
If you select only the France-related members in the Member Selector dialog box, the measure value for All
Customers is not impacted:
Customer Geography
Internet Sales Amount
All Customers $29,358,677.22
France $2,644,017.71
Hauts de Seine $263,416.19
Seine (Paris) $539,725.80
If you lter Germany and its child members using a query lter, the All Customers measure is aected
because the German gures no longer appear in the aggregation:
Customer Geography
Internet Sales Amount
All Customers $26,464,364.08
France $2,644,017.71
74 P U B L I C
SAP BusinessObjects Web Intelligence User's Guide
Building and running queries
Customer Geography Internet Sales Amount
Hauts de Seine $263,416.19
Seine (Paris) $539,725.80
Related Information
Selecting members of a hierarchy [page 73]
Hierarchies [page 64]
3.2.6.3.2 Overview of the Member Selector dialog box
You use the Member Selector dialog box, accessed via the Query Panel to visualize and select members in a
hierarchy.
You can work with members explicitly, or with sets of members given, for example, by functions, named sets or
hierarchy levels.
You can also use the Member Selector dialog box to dene prompts, which allow users to select which
members they wish to include in a hierarchy when they run the query.
You launch the Member Selector dialog box from hierarchy objects that you add to the query in the Query
Panel.
The following table describes the tabs available in the Member Selector dialog box.
Tab
Description
Members The Members tab displays the members arranged hierarchically. Calculated members
appear at the position in the hierarchy dened by the BI administrator.
Levels The Levels tab shows the hierarchy levels (if the hierarchy supports levels), named sets
and calculated members. If a hierarchy doesn't contain any level, you'll see an icon
along with a No values to display message.
Prompt The Prompts allows you to defer member selection until the query is run, whereupon a
prompt appears that allows the users to select members.
Note
In the Member Selector dialog box, you can select the display of the technical and business names of
objects or hierarchy objects. The Technical Name (also known as the unique name) is the name that
identies the object in addition to its Business Name (also known as the caption name). Technical Names
are not localized whereas Business Names are. For example, a Business Name would be 'Customer', and
the Technical Name could be Z_CUSTOMER.
SAP BusinessObjects Web Intelligence User's Guide
Building and running queries
P U B L I C 75

Related Information
Selecting members of a hierarchy [page 73]
3.2.6.3.3 To select hierarchy members
You select hierarchy members for your query via the Query Panel.
Context
Caution
In the HTML interface, if you select a node that has linked nodes in the Member Selector dialog box, they
are selected as well after you run the query. If you open the Member Selector dialog box after you have run
the query, you can see that linked nodes are also selected.
Procedure
1. Open a Web Intelligence document in Design or Data mode.
2. In the Data Access tab, in the Data Providers subtab, click Edit.
The Query Panel appears.
3. Add a hierarchy object to the Result Objects pane in the Query Panel.
4. Click the arrow next to the hierarchy object to launch the Member Selector dialog box.
5. In the Members tab, select members for inclusion in the query.
6. Click OK to close the Member Selector dialog box.
The selected members appear below the hierarchy object in the Result Objects pane. When you run the
query, only those members are included in the query result.
Results
If you do not select members, the default member for the hierarchy as dened in the database is used in the
query result. If no default member is dened, the top-level member is used.
76
P U B L I C
SAP BusinessObjects Web Intelligence User's Guide
Building and running queries

3.2.6.3.4 To select hierarchy members explicitly
You select members from hierarchies for your query via the Query Panel.
Context
Caution
In the HTML interface, if you select a node that has linked nodes in the Member Selector dialog box, they
are selected as well after you run the query. If you open the Member Selector dialog box after you have run
the query, you can see that linked nodes are also selected.
Procedure
1. Open a Web Intelligence document in Design or Data mode.
2. In the Data Access tab, in the Data Providers subtab, click Edit.
The Query Panel appears.
3. In the Members tab, select the members by clicking the checkbox next to the member in the hierarchy
display.
The members appear in the list of selected members in the Member Selector dialog box.
4. Do one of the following for a member:
○ To select all members in the hierarchy, from the All Members Select dropdown list, click Select. You can
use this option to include all members, even if the hierarchy structure changes in the future.
○ To select members down to a named level, select a level from the Select All Members until Named Level
list. A named level is, for instance, Country or City. You want level Country or City, whatever its position
in the hierarchy.
○ To select all members until a specic level, select the level from the Select All Members until list.
5. Click OK to close the Member Selector dialog box.
The members you selected appear below the hierarchy object in the Query Panel.
Related Information
To select hierarchy members [page 76]
To search for members in the Member Selector dialog box [page 84]
SAP BusinessObjects Web Intelligence User's Guide
Building and running queries
P U B L I C 77

3.2.6.3.4.1 Hierarchical member selection in BEx queries
You use the Member Selector dialog box, available from a hierarchy object in the Query Panel, to select
members of a hierarchy for your query.
The following hierarchy illustrates member selection behavior in BEx queries.
World
EMEA
Europe
Middle East
Africa
North America
Asia PAC
Asia
Pacic
Australia
Philippines
New Zealand
South America
Hierarchy selection rules
Rule
Example
When you select a member of a hierarchy at a given level, all
of the parent members in the hierarchy are selected.
The root is always selected. It is not possible to select one
specic level.
If you deselect a member when its parent member is already
selected, all child members of the parent are also dese
lected.
If Pacic and all its child members are already selected and
you deselect Australia, Philippines and New Zealand are also
deselected. The following member selections appear:
● Europe
● Pacic
If you select a member with some of its child members al
ready selected, all child members are selected.
If Europe is selected and you select EMEA, the Middle East
and Africa are also selected. The following member selec
tions appear:
● EMEA
● Children of EMEA
78 P U B L I C
SAP BusinessObjects Web Intelligence User's Guide
Building and running queries

Rule Example
If you select a member when descendant members are al
ready selected, all children of the member, and all siblings of
the selected descendant members are also selected.
If you select Asia PAC when Australia was already selected,
Asia, Pacic (children of Asia PAC) and Philippines and New
Zealand (siblings of Australia) are also selected. The follow
ing member selections appear:
● Asia PAC
● Children of Asia PAC
● Pacic
● Children of Pacic
Related Information
Restrictions when using BEx queries [page 111]
Hierarchical member selection in BEx queries [page 78]
3.2.6.3.5 To select hierarchy members in OLAP universes
by relationship
You can select hierarchy members in OLAP relational universes via the Query Panel.
Procedure
1. Open a Web Intelligence document in Design or Data mode.
2. In the Data Access tab, in the Data Providers subtab, click Edit.
The Query Panel appears.
3. Add a hierarchy object to the Result Objects pane in the Query Panel.
4. Click the arrow next to the hierarchy object to launch the Member Selector dialog box.
5. In the Members tab, right-click a member.
The menu displays the following options:
SAP BusinessObjects Web Intelligence User's Guide
Building and running queries
P U B L I C 79
Option Description
Children Adds all child members of the member to the list of selected members.
The members appear as Children of [selected member] in the list.
Note
You cannot include children and descendants of the same member. If you select
Descendants, then select Children, the descendants are removed from the list and re
placed by children.
Descendants
Adds all descendant members of the member to the list of selected members.
The members appear as Descendants of [selected member] in the list.
Note
You cannot include children and descendants of the same member. If you select Children,
then select Descendants, the children are removed from the list and replaced by descend
ants.
Parent
The member immediately above the selected member is its parent.
This option adds the parent member of the member to the list of selected members
The member appears as Parent of [selected member] in the list.
Note
You cannot include the parent and ancestors of the same member. If you select
Ancestors, then select Parent, the ancestors are removed from the list and replaced by
the parent.
The Parent function is not available in BEx queries.
Ancestors
All members above the selected member in the hierarchy are its ancestors.
This option adds the ancestor members of the member to the list of selected members.
The members appear as Ancestors of [selected member] in the list.
You cannot include the ancestors and parent of the same member in the list. If you select
Parent, then select Ancestors, the parent is removed from the list and replaced by the ances
tors.
The Ancestors function is not available in BEx queries.
Siblings
All members at the same level as the selected member and that share the same parent are its
siblings. The members appear as
Siblings of [selected member] in the list.
This option adds the selected member and its sibling members to the list of selected mem
bers.
The Siblings function is not available in BEx queries.
6. Click OK to close the Member Selector dialog box.
80
P U B L I C
SAP BusinessObjects Web Intelligence User's Guide
Building and running queries

The selected members appear below the hierarchy object in the Result Objects pane. When you run the
query, only those members are included in the query result.
Related Information
To select hierarchy members [page 76]
To select BEx query hierarchy members by relationship [page 120]
3.2.6.3.6 About level-based member selection
You can select all members of a hierarchy to a specied depth. All members of the selected hierarchy until the
specied depth are displayed in the report.
You can select members of a hierarchical object by level in the Levels tab in the Member Selector dialog box,
accessed from the Query Panel.
When a hierarchy variable is dened on a characteristic, only one default hierarchy is displayed in the Query
Panel universe outline.
3.2.6.3.7 To select hierarchy members from a level
You can select all the members at a level in a hierarchy organized into levels in Web Intelligence Applet interface
or Web Intelligence Rich Client accessed via the BI launch pad.
Context
Note
Not all hierarchies are organized into levels.
Procedure
1. Open a Web Intelligence document in Design or Data mode.
2. In the Data Access tab, in the Data Providers subtab, click Edit.
The Query Panel appears.
3. Add a hierarchy object to the Result Objects pane in the Query Panel.
4. Click the arrow next to the hierarchy object to launch the Member Selector dialog box.
SAP BusinessObjects Web Intelligence User's Guide
Building and running queries
P U B L I C 81

5. In the Levels tab, select the levels you want to include.
The members appear as All members of the [selected level] level in the Summary list.
6. Click OK to close the Member Selector dialog box.
The selected members appear below the hierarchy object in the Result Objects pane. When you run the
query, only those members are included in the query result.
Related Information
To select hierarchy members [page 76]
3.2.6.3.8 To select calculated members
You can edit calculated members in the Query Panel.
Prerequisites
The database on which your universe is based supports calculated members.
Note
BEx queries can only be edited in Web Intelligence Applet interface or Web Intelligence Rich Client accessed
via the BI launch pad.
Procedure
1. Open a Web Intelligence document in Design or Data mode.
2. In the Data Access tab, in the Data Providers subtab, click Edit.
The Query Panel appears.
3. Add a hierarchy object to the Result Objects pane in the Query Panel.
4. Click the arrow next to the hierarchy object to launch the Member Selector dialog box.
5. In the Levels tab, select a calculated member.
Note
○ The position of the calculated member in the hierarchy is determined by the BI administrator.
○ You cannot apply functions, for example Children or Parent, to a calculated member.
6. Click OK to close the Member Selector dialog box.
The selected members appear below the hierarchy object in the Result Objects pane. When you run the
query, only those members are included in the query result.
82
P U B L I C
SAP BusinessObjects Web Intelligence User's Guide
Building and running queries
Related Information
To select hierarchy members [page 76]
Calculated members [page 66]
3.2.6.3.9 To select named sets
You can select named sets in the Query Panel.
Procedure
1. Open a Web Intelligence document in Design or Data mode.
2. In the Data Access tab, in the Data Providers subtab, click Edit.
The Query Panel appears.
3. Add a hierarchy object to the Result Objects pane in the Query Panel.
4. Click the arrow next to the hierarchy object to launch the Member Selector dialog box.
5. In the Levels tab, select a named set from within the Named Sets folder.
6. Click OK to close the Member Selector dialog box.
The selected members appear below the hierarchy object in the Result Objects pane. When you run the
query, only those members are included in the query result.
Results
You can also include a named set by selecting it from the list of available query objects. Named sets appear
beneath the analysis dimension containing the hierarchy with which they are associated. When you select a
named set, its parent hierarchy is included as a result object and the named set appears as a member selection
beneath the hierarchy object.
SAP BusinessObjects Web Intelligence User's Guide
Building and running queries
P U B L I C 83

3.2.6.3.10 To exclude hierarchy members
You exclude members from hierarchies in the Query Panel.
Context
Note
You cannot exclude members in BEx queries.
Procedure
1. Open a Web Intelligence document in Design or Data mode.
2. In the Data Access tab, in the Data Providers subtab, click Edit.
The Query Panel appears.
3. Add a hierarchy object to the Result Objects pane in the Query Panel.
4. Click the arrow next to the hierarchy object to launch the Member Selector dialog box.
5. Select the members or member sets that you want to exclude.
6. Click Exclude next to the selected members.
7. Click OK to close the Member Selector dialog box.
The excluded members appear below the hierarchy object in the Result Objects pane. When you run the
query, these members are excluded from the hierarchy.
3.2.6.3.11 To search for members in the Member Selector
dialog box
You can search a hierarchy for specic members in the Member Selector dialog box.
Procedure
1. Open a Web Intelligence document in Design or Data mode.
2. In the Data Access tab, in the Data Providers subtab, click Edit.
The Query Panel appears.
3. Add a hierarchy object to the Result Objects pane in the Query Panel.
4. Click the arrow next to the hierarchy object to launch the Member Selector dialog box.
5. In the Members tab, click the Search button to launch the Search dialog box.
84
P U B L I C
SAP BusinessObjects Web Intelligence User's Guide
Building and running queries
Note
The search is always performed on the entire hierarchy stored in the database, not on the members
already retrieved in the Member Selector dialog box.
6. Type text in the Search text box.
You can use wildcards in the search.
Wildcard
Description
* Replaces any string of characters
? Replaces any individual character
7. Select one of the following:
○ Click Search in Text to search the display text of the members.
○ Click Search in Key to search their database keys.
8. Click OK to close the Member Selector dialog box.
3.2.6.3.12 To build prompts for selecting members using the
Member Selector dialog box
You can defer member selection until the query is run. If you do so, the user are prompted to select members
when they run the query.
Context
Note
Selection of member prompts is restricted to explicit selection of members. The user cannot select
members using functions such as Ancestors or Parent.
To build member-selection prompts:
Procedure
1. Open a Web Intelligence document in Design or Data mode.
2. In the Data Access tab, in the Data Providers subtab, click Edit.
The Query Panel appears.
3. Add a hierarchy object to the Result Objects pane in the Query Panel.
4. Click the arrow next to the hierarchy object to launch the Member Selector dialog box.
SAP BusinessObjects Web Intelligence User's Guide
Building and running queries
P U B L I C 85

5. In the Prompts tab, click Enable Parameter.
Note
When you select this option, the selections in the other tabs are deactivated.
6. Enter text in the Prompt Text box.
7. If you want the prompt to select the previously-chosen values by default when it is displayed, click Keep
last values selected .
8. If you want the prompt to select default values when it is displayed, click Set default values, then Edit and
select the default values.
9. Click OK to close the List of Values dialog box.
10. Click OK to close the Member Selector dialog box.
The prompt text appears beneath the hierarchy in the Query Panel.
Related Information
To select BEx query hierarchy members by relationship [page 120]
3.2.6.4 Resolving ambiguous queries
An ambiguous query is a query that contains one or more objects that can potentially return more than one
type of information.
In a universe, certain dimensions may have values that are used for two dierent purposes in the database. For
example, the [Country] dimension in the query below can return two types of information:
● Customers and the country in which they spent their vacation.
● Customers and the country from which they have made their reservation.
The role that Country plays in this query is ambiguous. A country can be either the country where a vacation
was sold, or a country where a vacation is reserved. One is existing information (sales), and the other is future
information (reservations).
To avoid ambiguities in a query, the universe designer identies the dierent ways that objects can be used in
the universe, and implements restrictions on how these objects can be combined. These restrictions are called
contexts.
3.2.6.4.1 Contexts in a query
A context is a dened group of objects that share a common business purpose.
This business purpose is usually the type of information that these related objects represent. For example, a
sales context is a grouping of all the objects that can be used to create sales queries. A reservations context is a
grouping of all the objects that can be used in reservation queries. Contexts are dened in the universe by the
universe designer.
86
P U B L I C
SAP BusinessObjects Web Intelligence User's Guide
Building and running queries

You can combine any objects within the same context to create a query. You can also combine objects in
dierent contexts. If you use an object that is common to multiple contexts in a query and it is not possible to
determine the best context that ts all the other objects in the query, you are prompted to choose the context
to apply.
3.2.6.4.2 To choose a context when you run a query
When you create a query or refresh a document, you may be asked to choose a context before the query can
run. Contexts are set up in a universe to avoid ambiguous queries.
Context
You need to choose a context each time you run the query if the Reset contexts on refresh query property is
selected in the Query Properties panel. You will also need to choose contexts if you select the Clear contexts
option in the query properties
Note
● After selecting the Clear contexts option, the next prompt on contexts will still show the last selected
context and if you want to select another context, you must rst remove the existing selection.
● Clearing the Reset contexts on refresh setting does not apply to LOV refresh in Prompts. The user will
be prompted for the context if the prompt requires it.
● LOV's that prompt for context are not supported in the Web Intelligence HTML interface.
● Before you schedule a document that contains multiple contexts, you must rst select a context. To do
this, follow the steps below.
Restriction
● If you are migrating an XI 3.1 Desktop Intelligence document to BI 4.1 Web Intelligence using the Report
Conversion Tool, you also must have a context selected, otherwise the contexts are lost during the
conversion.
● In queries based on UNX universes:
○ Clearing the Reset contexts on refresh setting does not apply to LOV refresh in prompts. The user
will still be prompted for the context if the prompt requires it.
○ Lists of values that require a prompt context are not supported in the Web Intelligence HTML
interface.
Procedure
1. In a Web Intelligence document containing multiple contexts, run the query or refresh the document.
The Select a Context dialog box appears.
2. Select a context.
SAP BusinessObjects Web Intelligence User's Guide
Building and running queries
P U B L I C 87
Results
If prompts have been set for the document, then the Prompts dialog box appears. Otherwise the document
content reects the context you have selected.
Related Information
To reset contexts when a query is refreshed [page 88]
3.2.6.4.3 To reset contexts when a query is refreshed
You can allow contexts to be refreshed every time you refresh a query in the Query Panel
Procedure
1. Open a Web Intelligence document in Design or Data mode.
2. In the Data Access tab, in the Data Providers subtab, click Edit.
The Query Panel appears.
3. Click the Query Properties icon on the Query Panel toolbar to display the Query Properties dialog box.
4. Select Reset contexts on refresh.
5. Click OK to close the Query Properties dialog box.
Related Information
To choose a context when you run a query [page 87]
3.2.6.4.4 To clear contexts from a query
You can clear the contents of a query in the Query Properties dialog box.
Procedure
1. Open a Web Intelligence document in Design or Data mode.
88
P U B L I C
SAP BusinessObjects Web Intelligence User's Guide
Building and running queries

2. In the Data Access tab, in the Data Providers subtab, click Edit.
The Query Panel appears.
3. Click the Query Properties icon on the Query Panel toolbar to display the Query Properties dialog box.
4. Click Clear contexts.
5. Click OK to close the Query Properties dialog box.
3.2.6.5 Setting the scope of analysis
The scope of analysis for a query is extra data that you can retrieve from the database that is available to oer
more details on the results returned.
This extra data does not appear in the initial result report, but it remains available in the data cube, and you can
pull this data into the report to allow you to access more details at any time. This process of rening the data to
lower levels of detail is called drilling down on an object.
Note
The Scope of Analysis Panel option in the Query Panel is only available for relational .unx universes and not
for OLAP universes or BEx queries.
In the universe, the scope of analysis corresponds to the hierarchical levels below the object selected for a
query. For example, a scope of analysis of one level down for the object Year, would include the object Quarter,
which appears immediately under Year.
You can set this level when you build a query. It allows objects lower down the hierarchy to be included in the
query, without them appearing in the Result Objects pane. The hierarchies in a universe allow you to choose
your scope of analysis, and correspondingly the level of drill available. You can also create a custom scope of
analysis by selecting specic dimensions to be included in the scope.
Related Information
Retrieving more levels of data to the report [page 487]
To drill out of the scope of analysis [page 487]
Prompt when drill requires additional data option [page 488]
3.2.6.5.1 Levels of scope of analysis
You can set dierent levels for a scope of analysis in a document.
Level
Description
none Only the objects that appear in the Result Objects pane are included in the query.
SAP BusinessObjects Web Intelligence User's Guide
Building and running queries
P U B L I C 89
Level Description
● one level
● two levels
● three levels
For each object in the Result Objects pane, one, two, or three objects lower down
the hierarchy tree are included in the query. The data from these objects is stored
in the cube until you add them to the document.
custom All objects added manually to the Scope of analysis pane are included in the
query.
Tip
Including a scope of analysis in a document increases the document size signicantly because the data
necessary for the scope you specify is saved with the document. It is not visible in the reports unless you
start the Drill Mode and drill down to the data to display the corresponding values.
In order to minimize the size of documents and optimize performance, include a scope of analysis only in
documents where you are certain that users will need to drill.
3.2.6.5.2 To set the scope of analysis
You can set a scope of analysis for a query in the Scope of Analysis Panel at the bottom of the Query Panel.
Procedure
1. Open a Web Intelligence document in Design or Data mode.
2. In the Data Access tab, in the Data Providers subtab, click Edit.
The Query Panel appears.
3. Click the Scope of Analysis Panel button.
The Scope of Analysis Panel appears at the bottom of the Query Panel. The default scope of analysis is
None. Each dimension in the Result Objects pane appears in the Scope of analysis pane.
4. Click the down arrow in the Scope level dropdown list box and select a level for the scope of analysis.
The level appears in the list box and the dimensions that are hierarchically below each dimension in the
Result Objects pane appear in the Scope of analysis pane.
5. If you want to add selected dimensions to the scope of analysis or create a custom scope of analysis, select
dimensions in the data outline and drag them across to the Scope of analysis pane.
90
P U B L I C
SAP BusinessObjects Web Intelligence User's Guide
Building and running queries

3.2.6.5.3 To deactivate a scope of analysis in a query
You can deactivate a scope of analysis a Web Intelligence document in Design or Data mode.
Procedure
1. Open a Web Intelligence document in Design or Data mode.
2. In the Data Access tab, in the Data Providers subtab, click Edit.
3. In the Query Panel, click the Scope of Analysis Panel icon to show the Scope of Analysis pane.
4. In the Scope of analysis pane, set the Scope level to none.
5. Click Run Query.
3.2.6.6 Viewing the script generated by a query
When you build a query, it generates SQL or Multidimensional Expression (MDX) script behind the scenes to
run against the database to return the query result.
SQL is the query language understood by all relational databases. MDX is the query language understood by
OLAP databases.
You can view and edit the SQL generated by the query. You can view MDX queries but you cannot edit them.
Note
You cannot view the script of queries that call database stored procedures.
3.2.6.6.1 To view and edit the generated script
You can view and edit generated query script in the Query Script viewer dialog box.
Procedure
1. Open a Web Intelligence document in Design or Data mode.
2. In the Data Access tab, in the Data Providers subtab, click Edit.
The Query Panel appears.
3. Click the View Script button on the query toolbar to display the Query Script viewer dialog box.
SAP BusinessObjects Web Intelligence User's Guide
Building and running queries
P U B L I C 91

Note
You cannot edit the query SQL if the query contains optional prompts. Remove the optional prompts
from the query before attempting to edit the SQL.
If script cannot be edited, values supplied in response to prompts appear directly in the query.
For example, if "UK" was supplied in response to a prompt on [Country], a line similar to the following
appears in the query:
Resort_country.country In ('UK')
If no value has yet been supplied for the prompt, the Web Intelligence syntax for prompts (described
below) appears in the query.
4. To make the generated script editable, click Use custom query script.
When you make the script editable, the Web Intelligence syntax for prompts appears in the query.
For example, a line similar to the following appears in the query:
Resort_Country.country = @prompt('Enter Country:','A','Resort\Country',
Mono,Free,Persistent,,User:0)
5. Click Validate after editing the script to check that your edits are valid.
6. If you are using Web Intelligence Rich Client or the Web Intelligence Applet interface , you can click Copy to
copy the script to the clipboard.
7. If you are using Web Intelligence Rich Client, you can click Print to print the script.
Related Information
Filtering data with query prompts [page 207]
To remove a prompt [page 217]
3.2.6.7 Restricting the amount of data returned by a query
You can restrict the amount of data returned by queries by setting the maximum number of rows a query can
return, using a sampled result set, choosing whether to retrieve empty rows, and choosing whether to retrieve
duplicate rows.
Procedure
1. Open a Web Intelligence document in Design or Data mode.
2. In the Data Access tab, in the Data Providers subtab, click Edit.
The Query Panel appears.
92
P U B L I C
SAP BusinessObjects Web Intelligence User's Guide
Building and running queries

3. Click the Query Properties icon on the Query Panel toolbar.
4. In the Query Properties dialog box, select any of the following options:
Option Select to... Available in
Max rows retrieved To select a maximum numbers of rows for re
trieval. If you use this option, you also need to set
maximum number of rows to be retrieved.
All instances.
Retrieve duplicate rows To include duplicate rows.
In a database, the same data may be repeated
over many rows. You can choose to have these re
peated rows returned in a query, or to have only
unique rows returned.
This option is not available in BEx queries, or if it
is not supported by the underlying database.
Relational and OLAP .unx les.
Not available in BEx queries.
Sample result set To return a sample result set. To use xed sam
pling, click Fixed. Sampling is not available in BEx
queries. The Fixed option is visible, but not acti
vated if this option is not supported by your data
source.
Relational .unx and .unv les.
Not available in OLAP .unx or
BEx queries.
Retrieving empty rows To include empty rows in the result.
○ OLAP .unx
○ BEx queries
5. Click OK to return to the Query Panel.
Related Information
Sample result set query property [page 94]
Max rows retrieved query property [page 93]
Building queries on BEx queries [page 107]
3.2.6.7.1 Max rows retrieved query property
The Max rows retrieved query property determines the maximum number of rows of data that are displayed
when a query is run.
If you only need a certain amount of data, you can set this value to limit the number of rows of data in your
document.
Max rows retrieved is applied at the database level if the database supports it. If not, rows are discarded after
retrieval from the database.
Max rows retrieved does not distinguish between levels in hierarchical data. If Max rows retrieved is set to 3, the
data in the rst table below is truncated as in the second table.
SAP BusinessObjects Web Intelligence User's Guide
Building and running queries
P U B L I C 93
Customers Unit Sales Store Cost
US 276,773 234,555
CA 45,506 67,999
OR 32,104 56,700
Albany 10,324 12,325
Customers Unit Sales Store Cost
US 276,773 234,555
CA 45,506 67,999
OR 32,104 56,700
The Sample result set query property also applies a restriction on the number of rows in the query, but at the
database level. If you set Max rows retrieved to 2000 and Sample result set to 1000, the query retrieves a
maximum of 1000 rows only.
This setting can be overridden by the limits set by the BI administrator in your security prole. For example, if
you set the Max rows retrieved setting to 400 rows, but your security prole limits you to 200 rows, only 200
rows of data will be retrieved when you run the query.
Related Information
Sample result set query property [page 94]
Restricting the amount of data returned by a query [page 92]
3.2.6.7.2 Sample result set query property
The Sample result set property in the Query Panel determines the maximum number of rows that a query
returns.
This restriction is applied at the database level, in the generated script that is used to return the data.
Note
The Sample result set option is only available for relational .unx and .unv universes, and not for
OLAP
.unx universes or BEx queries.
The Fixed option uses xed sampling. At each data refresh, the query returns the same rows. If you do not set
the Fixed option, the sampling is random. At each data refresh, the query returns a dierent set of sampled
rows.
Sample result set is more ecient than the Max rows retrieved property, which discards rows beyond the
maximum limit only after retrieving all the rows in the query.
94
P U B L I C
SAP BusinessObjects Web Intelligence User's Guide
Building and running queries

Not all databases support sampling. If it is not supported, the option is deactivated . Similarly, the Fixed option
may not be supported by certain databases, in which case the Fixed option is deactivated. Sampling is not
available in BEx queries or OLAP .unx universes.
Related Information
Max rows retrieved query property [page 93]
Building queries on BEx queries [page 107]
Restricting the amount of data returned by a query [page 92]
3.2.6.8 To set the maximum amount of time a query can
run
You can set the maximum running time for a query in the Query Properties dialog box.
Context
Note
This feature is not available for BEx queries.
Procedure
1. Open a Web Intelligence document in Design or Data mode.
2. In the Data Access tab, in the Data Providers subtab, click Edit.
The Query Panel appears.
3. Click the Query properties button on the Query Panel toolbar to display the Query Properties dialog box.
4. Select Max retrieval time (s) and enter the amount of time in seconds.
5. Click OK to close the dialog box and return to the Query Panel.
SAP BusinessObjects Web Intelligence User's Guide
Building and running queries
P U B L I C 95
3.2.6.9 To allow other users to edit queries
By default, queries can by edited only by the user who created them. You can give the ability to edit queries to
users who have edit query rights assigned by the BI administrator.
Procedure
1. Open a Web Intelligence document in Design or Data mode.
2. In the Data Access tab, in the Data Providers subtab, click Edit.
The Query Panel appears.
3. Click the Query Properties icon on the Query panel toolbar to display the Query Properties dialog box.
4. Click Allows other users to edit queries.
5. Click OK to return to the Query Panel.
3.2.6.10 Using combined queries
A combined query is a group of queries that work together to return a single result.
Note
You can only use the combined query feature with relational universes.
You can combine queries in three relationships:
● union
● intersection
● minus
A UNION query takes all the data from both queries, eliminates duplicate rows, and builds a combined data set.
An INTERSECTION query returns the data that is common to both queries.
A MINUS query returns the data in the rst query that does not appear in the second.
Example
Union, intersection and minus queries
In this example you have two queries that return lists of countries as shown in the following table:
Query
Values
Query 1 US; UK; Germany; France
Query 2 US; Spain
The dierent types of combined query return the following values:
96
P U B L I C
SAP BusinessObjects Web Intelligence User's Guide
Building and running queries
Combination type Values
UNION US; UK; Germany; France;Spain
INTERSECTION US;
MINUS UK; Germany; France
Related Information
Building queries on BEx queries [page 107]
3.2.6.10.1 An example of a combined query
Combined queries allow you to answer questions that are otherwise dicult or impossible to frame in standard
query.
Note
You can only use the combined query feature with relational universes.
Example
Return a data set using a combined query
The Island Resorts Marketing sample universe contains the dimension Year, which, with Customers, returns
guests who have already stayed in a resort, and Reservation Year with Customers returns guests who have
reserved to stay in the future. Because of the structure of the database and universe, these objects are
incompatible, which means that you cannot include them in the same block in a report.
What if you want to return a single list of years that includes those years where more than n guests stayed
in a resort and those years where more than n guests reserved to stay in a resort? You can do this using a
combined query, as follows:
Query
Returns
Query 1 Years where more than n guests stayed in a resort
UNION
Query 2 Years where more than n guests reserved to stay in a re
sort
The union between these two queries returns the list of years that you want.
SAP BusinessObjects Web Intelligence User's Guide
Building and running queries
P U B L I C 97
3.2.6.10.2 How combined queries are generated
Combined queries work at the database level by altering the query submitted to the database.
They do so by generating query script containing UNION, INTERSECTION and MINUS operators.
If your database does not support the type of combination in your query, the combination occurs after data
retrieval. Multiple queries return data to the report and this data is then resolved into the same result generated
by a database-level combined query.
Note
You can only use the combined query feature with relational universes.
3.2.6.10.3 To build a combined query
If your query is based on a relational universe, you can create a combined query that allows you to answer a
question that is otherwise dicult or impossible to frame in a standard query.
Procedure
1. Open a Web Intelligence document in Design or Data mode.
2. In the Data Access tab, in the Data Providers subtab, click Edit.
The Query Panel appears.
3. Create an initial query in the Query Panel.
Note
You can only use the combined query feature with relational universes.
4. Click the Add a Combined Query icon on the toolbar to display the Combined Queries panel beneath the list
of query objects.
The Combined Queries panel shows the current query. You can change the query name by clicking the
query in the panel, selecting Edit Name from the menu, then typing a new name in the Name box in the
dialog box that appears.
5. Click Add a query. The second query appears in the Combined Queries pane and has the following
conditions:
○ It is combined with the original query in a UNION relationship.
○ It is named Combined Query #n.
6. To switch to the query, select it in the Combined Queries pane.
Note
To delete a query, select it in the Combined Queries pane and press the Delete key, or drag and drop the
query to the universe outline.
98
P U B L I C
SAP BusinessObjects Web Intelligence User's Guide
Building and running queries

7. To change the combination type, select the operator. The operator moves through the sequence UNION,
MINUS, INTERSECTION.
8. Build each query within the combined query as you build any normal query.
9. Click Run Query.
Related Information
To open for edit the data provider of an existing query [page 172]
3.2.6.10.4 Combined query structure
The queries within a combined query must return the same number of objects of the same data type and the
objects must be in the same order.
You cannot combine queries when the number of objects in the query results and the data types of those
objects are not identical. For example, you cannot combine a query that returns Year with a query that returns
Year and Revenue, or combine a query that returns Year with a query that returns Revenue.
You must also pay attention to the semantics of your combined queries. While it is possible to combine a query
that returns Year with a query that returns Region, if both dimensions are of the same data type, the result - a
mixed list of years and regions - is unlikely to be meaningful. Typically, if your rst query contains a Year
dimension, your second query also contains a dimension that returns a list of years.
Note
You can only use the combined query feature with relational universes.
3.2.6.10.4.1 Example: A query of guest occupancy and
reservation rates per year
You want to build a query that returns a list of years consisting of years where more than n guests stayed in a
resort and years where more than n guests placed reservations to stay in a resort.
Context
Note
This task requires access to the Island Resorts Marketing sample universe in Web Intelligence.
SAP BusinessObjects Web Intelligence User's Guide
Building and running queries
P U B L I C 99

Note
The object you are ltering on must also be in the Result Objects pane.
Procedure
1. In Web Intelligence, create a document and select the Island Resorts Marketing universe in the list of
universes.
2. In the Query Panel, drag the Year, Number of Guests, and Future Guests objects to the Result
Objects pane.
3. Drag the Number of Guests object to the Query Filters pane and create a report lter that restricts
Number of Guests to greater than n.
4. Click the Add a combined query icon.
Below the list of objects in the Query Panel, the Combined Query pane appears, displaying the two queries
joined by a union.
5. Click the second query and remove the Year and Number of Guests objects.
6. Drag the Reservation Year object to the Result Objects pane.
7. Drag the Future Guests object to the Query Filters pane and create a report lter that restricts the future
guests to greater than n.
8. Click Run Query.
Results
The query returns the combined list of years and reservation years.
Related Information
To build a query on a universe [page 72]
3.2.6.10.5 Combined query precedence
The order of execution in a combined query is crucial in determining the nal result.
In the simplest form of combined query you combine two or more queries in a relationship as follows:
Query 1
INTERSECTION Query 2
100 P U B L I C
SAP BusinessObjects Web Intelligence User's Guide
Building and running queries
Query 3
In such a case, the rst result to be calculated is the intersection between Combined Query n and Combined
Query n + 1. The next result is the intersection between the rst result and the result of Combined Query n + 2.
Query execution continues in this way through all the queries in the relationship. This gives the following result
for the above example:
Query
Data
Query 1 US; UK; France; Germany
Query 2 US; France; Finland
INTERSECTION of 1 and 2 US; France
Query 3 US; Spain
Final INTERSECTION US
3.2.6.10.5.1 Nested combined queries
By default, each time you add a combined query, it is combined at the initial combination level with existing
queries.
Each added query extends the list of combined queries. If you add Query 3 to Query 1 and Query 2, which are
already combined in a UNION relationship, you get the following result:
UNION
Query 1
Query 2
Query 3
You can also nest combined queries in complex, multi-level relationships to control the order of execution, as in
the following example, which combines the result of Query 1 MINUS Query 2 in an INTERSECT relationship with
Query 3.
Combined Query 1
MINUS
INTERSECT Combined Query 2
Query 3
In an LTR locale, query groups are processed from right to left and from top to bottom within each group. In an
RTL locale, query groups are processed from left to right and from top to bottom within each group. The way
query groups are processed depends on the Preferred Viewing Locale you have selected in the BI launch pad
preferences. Some locales, like the English locale, use the left-to-right (LTR) interface positioning, whereas
others, like the Arabic locale, use the right-to-left (RTL) interface positioning.
SAP BusinessObjects Web Intelligence User's Guide
Building and running queries
P U B L I C 101
Query Result
Query 1 US; UK; Spain; Germany
Query 2 Germany
Query 1 MINUS Query 2 US; UK; Spain
Query 3 US; Spain; Finland
(Query 1 MINUS Query 2)
INTERSECT
Query 3
US; Spain
Note
If your database directly supports the type of combined query you wish to execute, the script generated
from the query contains the combination operators directly. In this case the order of precedence depends
on the order of precedence dened in the database. See your database administrator for more details.
3.2.6.10.5.2 To set the order of precedence of combined
queries
You set an order of precedence in combined queries by placing queries into nested groups
Procedure
1. In a Web Intelligence document in Design or Data mode, open the Data Provider for edit.
The Query Panel appears.
2. Build the queries you want to organize in the Combined Queries panel.
3. To nest a pair of queries, click the Add new combined query node button.
This action creates a combined query node.
4. Drag and drop a query on to the query with which you want to associate the nested pair.
The new combined query node is by default a UNION relationship.
5. Continue adding queries to the nested group by dragging and dropping them on to the space between any
two queries already in the group.
6. To create further nested groups within an existing higher-precedence group, repeat the previous two steps.
7. Click the combination operators of all the groups in the query to change them as required.
8. Run the query.
102
P U B L I C
SAP BusinessObjects Web Intelligence User's Guide
Building and running queries
Related Information
To open for edit the data provider of an existing query [page 172]
To open for edit the data provider of an existing query [page 172]
To build a combined query [page 98]
3.2.7 Building queries on data les
You can build queries on data les, such as text or Excel les, that are available either locally or in the CMS.
Text les
If you are using the Applet or HTML interface, you can only refresh documents based on text les in they have
been previously copied to the CMS. You cannot build queries on text les using these interfaces.
Only the Web Inteligence Rich Client lets you build queries on data les.
Excel les
If you are using the Applet or HTML interface, you can only build queries on Excel les if you have previously
copied them to the CMS. You cannot build queries on Excel les saved locally.
Only the Web Intelligence Rich Client lets you build queries on Excel les saved locally.
Related Information
To build a query on a text le [page 104]
To build a query on an Excel le [page 105]
To edit a query based on a text le [page 106]
To edit a query based on an Excel le [page 107]
SAP BusinessObjects Web Intelligence User's Guide
Building and running queries
P U B L I C 103
3.2.7.1 To build a query on a text le
You can only build a query using a text le as a data source in the Web Intelligence Rich Client. Using the Applet
or HTML interface, you can only refresh a document based on a text le if it has been previously copied to the
CMS.
Procedure
1. Open Web Intelligence Rich Client.
2. To build a query using a text le, do one of the following:
○ Click New in the File menu.
○ In the Create a new Web Intelligence Document dialog box, select Text as the data source.
○ In the Data Access tab, in the Data Providers subtab, select From Text from the New Data Provider
dropdown list.
3. Click Browse and select the text le.
4. Set the options to import data from the le.
Option Description
Data Separator The character that separates the data relating to each
result object.
○ Tabulation - data is tab-separated
○ Space - data is separated by spaces
○ Character - data is separated by the character you
specify
Text Delimeter
The character that encloses the data relating to each
result object.
○ Double quote - data is enclosed in double quotes
○ Single quote - data is enclosed in single quotes
○ None - data is not enclosed
First row contains column names The rst row in each column supplies the name of the
column.
Locale The locale of the data in the text le. For example, if the
locale is French (France), commas in numbers are
interpreted as indicating decimals because decimals
contain commas in French.
Charset The character set used by the text le.
Date Format The date format to use in the report.
5. Click Next.
The Query Panel opens and displays the data in the text le as report objects.
6. Click Run query to create a report based on the data from the text le. When you have more than one query
and you want to run just one query, click Run Queries and select the query that you want to run.
104
P U B L I C
SAP BusinessObjects Web Intelligence User's Guide
Building and running queries
3.2.7.2 To build a query on an Excel le
You can build a query using an Excel le as a data source.
Context
You can use Excel les saved locally or available in the CMS.
Note
If you are using the Applet or HTML interface and want to build a query on an Excel le saved locally, make
sure to copy it rst to the CMS, as these interfaces do not allow to create queries based on Excel les saved
locally.
For information on saving Excel les to the CMS, consult the Saving objects directly to the CMS topic in the BI
Launch Pad help.
Procedure
1. To build a query using an Excel le, do one of the following:
○ Click New in the File menu.
○ In the Create a new Web Intelligence Document dialog box, select Excel as the data source.
○ In the Data Access tab, in the Data Providers subtab, select From Excel from the New Data Provider
dropdown list.
2. Click Browse to select the le you want to use.
3. Set the options to import data from the le.
Option Description
Sheet Name The name of the worksheet containing the data.
Field Selection All Fields All data in the worksheet is treated as query data.
Restriction
Web Intelligence only supports a contiguous cell
selection.
Field Selection Range Denition The data in the specied range is treated as query data.
Restriction
Web Intelligence only supports a contiguous Range
Name selection.
SAP BusinessObjects Web Intelligence User's Guide
Building and running queries
P U B L I C 105
Option Description
Field Selection Range Name The data in the named range is treated as query data.
First row contains column names The rst row in the range supplies the names of the result
objects.
4. Click Next.
The Query Panel opens and displays the data in the Excel le as report objects. In the Query Properties side
pane, you can choose to make the query refreshable and/or editable depending on your user
requirements.
5. Click Run query to create a report based on the data from the Excel le. When you have more than one
query and you want to run just one query, click Run Queries and select the query that you want to run.
3.2.7.3 To edit a query based on a text le
You can edit a query based on a text le in the Query Panel in the Web Intelligence Rich Client. Using the Applet
or HTML interface, you can only refresh a document based on a text le if it has been previously copied to the
CMS.
Procedure
1. Open Web Intelligence Rich Client in Design or Data mode.
2. In the Data Access tab, in the Data Providers subtab, click Edit.
3. Edit the query in the Query Panel.
Caution
If you select a dierent le containing source data for the Source Path, the structure of the new le
must match the structure of the existing le.
4. Edit the options for importing data from the le by clicking Edit Settings in the Query Denition pane. In the
Query Properties side pane, you can choose to make the query refreshable and/or editable depending on
your user requirements.
5. Click Run query to apply your changes to the query.
106
P U B L I C
SAP BusinessObjects Web Intelligence User's Guide
Building and running queries

3.2.7.4 To edit a query based on an Excel le
You can edit a query based on an Excel le in the Query Panel.
Procedure
1. Open Web Intelligence in Design or Data mode.
2. In the Data Access tab, in the Data Providers subtab, click Edit.
3. Edit the query in the Query Panel.
Caution
If you select a dierent le containing source data for the Source Path, the structure of the new le
must match the structure of the existing le.
4. Edit the options for importing data from the le by clicking Edit Settings in the Query Denition section.
5. In the Query Properties side pane, you can choose to make the query refreshable, depending on your user
requirements.
6. Click Run query to apply your changes to the query.
Results
You can also go to the Data mode, and in the Data Provider tab in the side panel, right-click the query and select
from the options in the contextual menu, which include Refresh, Edit, Purge, Delete, Rename, Copy, and Change
Source.
3.2.8 Building queries on BEx queries
BEx queries (SAP Business Explorer queries) are queries created using the SAP BEx Query Designer, based on
SAP Info Cubes in a SAP Business Warehouse (SAP BW).
BEx queries retrieve the metadata from the data source. You use Web Intelligence to connect to a BEx query by
using a BI Consumer services (BICS) connection, and retrieve data via the BEx query for reporting purposes.
You can create, edit and refresh documents and reports based on BEx queries using any of the three available
interfaces.
Web Intelligence automatically maps data from the BEx query to hierarchies, attributes, dimensions and
measures as in universe-based hierarchical queries. Direct access into a SAP BEx query (through a BICS
connection) does not allow you to rename, modify, or add metadata. You do not create a universe for BEx
queries.
The resulting microcube is represented in the Available Objects pane as a tree of objects, but uses a subset of
the features available in universe-based hierarchical queries. For example, the Siblings, Parent and
SAP BusinessObjects Web Intelligence User's Guide
Building and running queries
P U B L I C 107

Ancestor member functions are not available for BEx queries in the Member Selector dialog box. These
restrictions are noted in the documentation relating to the features.
Note
● You can only access BEx queries that have the ag Allow External Access to the Query enabled in the
SAP BEx Query Designer.
● The object mapping is not all equivalent, refer to the equivalents and restrictions pages to ensure that
the queries can be used correctly.
● Web Intelligence can create a document on a BEx query only when the BEx query connection
authentication is pre-dened. Prompted authentication mode is not supported on the BEx query at
document creation.
Related Information
To create a query based on a BEx query that has no variables [page 128]
3.2.8.1 Which interfaces should you use to work with BEx
queries?
To build queries, view reports, edit, or refresh reports, you use the interfaces described below.
Building queries
To create a document or build a query based on a BEx query, you should use one of the following:
● The Web Intelligence Applet interface, accessible from the BI launch pad
● The Web Intelligence HTML interface (accessible from the BI launch pad)
● Web Intelligence Rich Client installed from the SAP Business Objects suite
Working with reports
To view reports, edit, or refresh reports, you can use any of the Web Intelligence interfaces:
● The Web Intelligence HTML interface (accessible from the BI launch pad)
● The Web Intelligence Applet interface (accessible from the BI launch pad)
● The Web Intelligence Rich Client downloaded and installed from the BI launch pad
● Web Intelligence Rich Client installed as a component of the SAP Business Objects suite
108
P U B L I C
SAP BusinessObjects Web Intelligence User's Guide
Building and running queries
3.2.8.2 Supported BEx query metadata
Web Intelligence supports some metadata found in BEx queries.
The following SAP BW metadata features are supported:
● Characteristics (including Time and Unit)
● Display Attributes
● Navigational Attributes
● Hierarchies
● Basic Key Figures
● Calculated Key Figures/Formulas
● Restricted Key Figures
● Variables
● Custom Structures
The metadata types are mapped to universe objects that can be used to build your queries and run reports.
Restriction
Characteristics or key gures dependent on BEx text variables are not supported by Web Intelligence. Your
input won't be reected in the report's objects.
How BEx query metadata is mapped
BEx query metadata
Web Intelligence 4.x object
Characteristic Dimension
Hierarchy Hierarchy
Hierarchy level N/A (levels are displayed in the Member Selector dialog box)
Attribute Attribute
Characteristic properties (Key, Caption, Short description,
Medium description, Long description)
Attribute
Key gure without unit/currency Measure (numeric)
Property formatted value (string)
Key gure with unit/currency Measure (numeric)
Property unit/currency (string)
Property formatted value (string)
SAP BusinessObjects Web Intelligence User's Guide
Building and running queries
P U B L I C 109

How SAP Business Warehouse Characteristics map to Web Intelligence
dimension objects
For data sources based on BEx queries, SAP Business Warehouse (BW) characteristics are mapped to
dimension objects in Web Intelligence. Depending on the SAP BW Characteristic data type, these dimensions
have a specic type assigned (STRING or DATE).
Although you have dened a BW characteristic in the SAP BW as a numerical data type (NUMC), BW treats the
characteristic as a text character string (STRING). Consequently, when it is used in a Web Intelligence
document, it is treated as a text character string (STRING). It is not considered a numeric data type.
How SAP BW Key Figures map to Web Intelligence measure objects
For data sources based on BEx queries, SAP BW (BW) Key Figures are mapped to measure objects in Web
Intelligence. Depending on the BW Key Figure data type, these measures have a specic type assigned STRING,
DATE or NUMERIC)
However, in the BEx query design, if the Key Figure and Characteristic objects are arranged in columns and
rows so that the result set columns contain dierent object types in each row, and the measure object in the
Web Intelligence report to shows up as type "STRING". For Web Intelligence, in order to be agnostic, the rule
applies that one column equals one data type. The data type "STRING" is thus applied when it recognizes
heterogeneous data types in the column. This is the case when the Key Figure Structure is on the Columns Axis
only. You can also put both structures on the same axis in your BEx Query.
Example
When a BEx query has a structure that contains UNIT (Currency, for example), TIME (Date, for example) , a
formula ("City is X percent of State" for example) and a string-based Characteristic (City for example),
each, when added, is a separate row for the column. A Key Figure (for example Order Amount) is added in
the Columns section. When you execute the BEx query, a table appears that contains these dierent
objects/types in the rows of the column.
Note
● UNIT and STRING are DataTypes you cannot get in a DataCell (DataCell = each intersection of two
BEx structures). You can have NUMERIC (there is INTEGER and DOUBLE), PERCENT, DATE, and
TIME. When creating a Web Intelligence report against this query, the measure object is shown as
"STRING" due to the dierent object/types included in the result set for the column.
● If you want to manipulate the results by adding aggregations, for example, you have the choice to
change the mapped Web Intelligence measure in the report by converting it via a formula into
dierent data types.
110
P U B L I C
SAP BusinessObjects Web Intelligence User's Guide
Building and running queries
3.2.8.3 Restrictions when using BEx queries
Note
The BI administrator must ensure that the BEx query complies with reporting restrictions described in the
table below.
Calculations
BEx query feature
Web Intelligence restriction
Local calculations ("Rank", "Minimum"...) The key gures on which the local calculation are dened are
removed from the BEx query. Avoid the use of these, and use
instead the equivalent calculation function in the report.
Calculations/Local calculations
Measures which use "Calculate Single Value as" will be omit
ted because they would produce inconsistent results within
the client tools. The calculation depends heavily on the lay
out of the data requested (for example, the order in which
characteristics are requested, if the result line is switched on
or o, and #) and could therefore be misinterpreted. To
avoid those misinterpretations, these calculations are auto
matically switched o.
You should not use the following calculation functions:
● %GT
● %CT
● SUMCT
● SUMRT
● Leaf
They might not work correctly within the client tools (same
reason as above). It is not feasible to lter them out, as the
knowledge about the calculations are not exposed through
the interface, therefore the query designer should make sure
that those calculations are not used. If you switch on the
Multidimensional Expression (MDX) Flag in the BEx Query
Designer, the usage of those calculations is checked.
Formula with calculation
We recommend that you avoid using Formula with
calculation because it may not be supported in the report
layout, for example in the case of a Percentage Share of Re
sults report.
SAP BusinessObjects Web Intelligence User's Guide
Building and running queries
P U B L I C 111

Data characteristics
BEx query feature Web Intelligence restriction
Decimal number The BEx query decimal number denition is not consumed
in Web Intelligence. Use the formatted value instead if you
need to keep the exact decimal setting in your report. You
can also apply the decimal setting in the table and chart of
your report.
Variables on default values
Do not dene variables on default values in BEx queries. The
variables will be prompted without an eect on the BEx
query. Instead, dene the default value in the lter.
OR operator Not supported. The OR operator is not supported from some
OLAP data sources such as BEx queries, and OLAP .unx uni
verses on the top of Microsoft Analysis Services (MSAS) and
Oracle Essbase.
Merge on key for OLAP business object
The data synchronization of the same object from the same
source (cube or BEx query) is based on the internal key of
the value of these objects.
BEx query measure aggregation Measures which aggregate with the SUM function, aggregate
the sum in Web Intelligence. Other types of measure aggre
gation are delegated.
Complex selection When a variable is dened to support the complex selection,
there is no equivalent. This is limited to range selection.
Zero suppression Rows of zero values are not removed from the result table.
Query default layout Default positions of characteristics in Rows / Columns are
not reproduced.
Result rows We recommend that you rely on Web Intelligence summaries
instead.
Drill-replace capability There is no drill-replace capability on an object from a BEx
query (there is no navigation path).
Attributes in result sets and lters Cannot be used in the result set and in lters at the same
time.
Filters
BEx query feature
Web Intelligence restriction
Filters as default values Not supported, these are removed from the BEx query. The
lter will be ignored, or, if a variable is used, the variable
prompt will display, but the user response is ignored. Move
any restriction based on a variable into the lter zone in or
der for it to be taken into account for reporting.
Measures
Cannot be used in lters.
112 P U B L I C
SAP BusinessObjects Web Intelligence User's Guide
Building and running queries
Hierarchies
BEx query feature Web Intelligence restriction
Lower level nodes Lower level nodes are always shown after the main node.
Row/Column display as hierarchy It is not possible to show an overall hierarchy out of an axis
hierarchy. The characteristics, hierarchies, and key gures
that make up the hierarchy are retained.
Expand to level By default, hierarchies are not expanded to a given level.
Level00 is always the default level. To reproduce this behav
ior, expand the table and chart in the report, then save the
document. Your IT administrator can redene this default
value in the Central Management Console, but note that if
the value is set too high, Web Intelligence retrieves the entire
hierarchy data which will have an important impact on the
performance and stability of the system. The report creator
should always indicate explicitly the number of the hierarchy
levels they want to retrieve while designing their report quer
ies.
Ranking and hierarchies
Ranking on a table where there is a hierarchy des not take
into account the hierarchical structure of the data. When you
dene a ranking in a table that contains a hierarchy, the
ranking becomes at.
Position of lower level nodes
These are always below the upper levels.
Hierarchical measure structures Hierarchical measure structures are displayed as a at list of
measures, but you can use hierarchical non-measure struc
tures.
Hierarchical display of an entire axis This is not supported. You can achieve similar results directly
within Web Intelligence.
Hierarchies in result sets and lters Cannot be used in the result set and in lters at the same
time.
Prompts
BEx query feature
Web Intelligence restriction
Variables ready for input If you dene variables ready for input in BEx Query Designer,
it is not always possible to manually enter a string in the
prompt panel in Web Intelligence. In this situation, you can
only select from a list of values.
SAP BusinessObjects Web Intelligence User's Guide
Building and running queries
P U B L I C 113

Query structure
BEx query feature Web Intelligence restriction
Number of objects allowed in a query Do not use more than 50 objects in a BEx query, otherwise
an error occurs.
Variables dependent on compound characteristics and the
parent object
When there are dependencies between variables in com
pound characteristics and their parent, the dependencies
are not guaranteed.
Query stripping Available for .unv, OLAP, and BEx query sources. For other
types of sources it is not available.
Query exceptions These are not taken into account in Web Intelligence. Apply
conditional formatting in Web Intelligence instead.
Conditions Do not use conditions. When the query is run, the condi
tions, if present in the query, are not applied.
Default Layout The Web Intelligence access in general does not take the de
fault layout of the BEx query into account. Use the Query
Panel to obtain the following eects:
● Arrangement of characteristics in rows and columns
● Default presentation (for example, Text / Key-Presenta
tion)
● Structure members with the state hidden (can be
shown) or visible
Related Information
Query stripping in documents [page 233]
3.2.8.4 Accessing BEx queries
You must meet certain conditions before you can access BEx queries.
1. You can only access BEx queries that have the Allow External Access to the Query option enabled in the BEx
Query Designer.
2. You must have the appropriate security rights to access and use the BEx queries for reporting.
The BI administrator denes the connection in the Central Management Console (CMC), or you can use the
information design tool to publish the connection to the CMC. The simplest method is to use the CMC.
114
P U B L I C
SAP BusinessObjects Web Intelligence User's Guide
Building and running queries
3.2.8.4.1 To enable access to BEx queries
BEx queries can only be accessed by other tools including Web Intelligence if the BEx query property Allow
External Access to the Query is enabled in the BEx Query Designer.
Procedure
1. In the BEx Query Designer, select the query that you want to access with Web Intelligence.
2. In the Properties pane, select Advanced, and ensure that Allow External Access to the Query is selected.
3. Save the query.
4. Repeat the above steps for all BEx queries that you want to make available to Web Intelligence.
3.2.8.4.2 To dene a BICS connection with the Central
Management Console
You can connect to BEx queries via BICS connections that have been created and saved in the Central
Management Console (CMC).
Prerequisites
You need the appropriate administrator rights to dene a BICS connection in the CMC.
Context
You can dene a connection to a single BEx query or to an InfoProvider containing several BEx queries.
Procedure
1. Log in to the CMC.
2. Choose OLAP connections.
3. Dene a new connection.
In the New Connection window, in the Provider dialog box, select SAP Business Information Warehouse.
4. Enter the connection information and your system details.
5. Save the connection.
SAP BusinessObjects Web Intelligence User's Guide
Building and running queries
P U B L I C 115
Next Steps
To connect to a BEx query, you also dene a BICS connection in the information design tool.
3.2.8.4.3 To dene a BICS connection in the information
design tool
To connect to a BEx query, you can dene a BICS connection in the information design tool. You can dene a
connection to a single BEx query or to an InfoProvider containing several BEx queries.
Procedure
1. In the information design tool, use the New OLAP Connection wizard to dene an OLAP connection and
choose the SAP BW SAP BICS Client middleware driver.
2. Publish the connection to a repository where it can be accessed by Web Intelligence.
Results
You can now use Web Intelligence to select the connection and connect to the BEx query.
3.2.8.5 Building a Web Intelligence query on a BEx query
When you have connected to a BEx query, Web Intelligence maps the BEx query metadata to the Web
Intelligence query objects.
You use the Web Intelligence Query Panel to select the appropriate objects to build a hierarchical query. You can
add lters and prompts in the same way as you create queries on universes, but there are restrictions in certain
situations, refer to the section Restrictions when using BEx queries.
Related Information
Restrictions when using BEx queries [page 111]
Hierarchical member selection in BEx queries [page 78]
116
P U B L I C
SAP BusinessObjects Web Intelligence User's Guide
Building and running queries

3.2.8.5.1 Hierarchical queries
A hierarchical query contains at least one hierarchy object.
You can build hierarchical queries on universes that support hierarchical data or on BEx queries which access
SAP Info Queries directly. Hierarchical data can come from relational or OLAP databases, depending on how
the data is structured in the universe.
Note
A relational data source is not a true hierarchy; it is a dened path between attributes.
You can include hierarchies either as result or lter objects. When you build a hierarchical query, the Web
Intelligence Query Panel provides you with additional features for working with hierarchical data.
For example, if you include a hierarchy as a result object, you have the ability to choose members from the
hierarchy to appear in the result. The features available in the hierarchical query panel also depend on the
source of the hierarchical data you are accessing.
The result set generated by a hierarchical query allows you to perform hierarchical data analysis. Each
hierarchy object in the query produces a hierarchical column in the report. You can expand members to reveal
their child members.
Tip
When running or refreshing a BEx query that contains a hierarchical object, make sure to put it rst in the
Query Panel. Indeed, it signicantly decreases the execution time of the query.
Example
If you expand the [US] member to reveal US states in a [Geography] hierarchy, then measures in the block
are aggregated depending on the member with which they are associated.
A hierarchical query containing the [Customers] hierarchy and the [Unit Sales] and [Store Cost] measures
gives the following result set:
Customers
Unit Sales Store Cost
All Customers 364,707 371,579
US
276,773 234,555
CA 45,506 67,999
OR 32,104 56,700
Albany 10,324 12,325
Related Information
Hierarchical member selection in BEx queries [page 78]
Measures [page 66]
SAP BusinessObjects Web Intelligence User's Guide
Building and running queries
P U B L I C 117

Hierarchies [page 64]
Hierarchical member selection and query lters [page 74]
Selecting members of a hierarchy [page 73]
3.2.8.5.2 Scaling factors in BEx queries
When a BEx query contains measures that are mapped from scaled key gures, the factor of scaling on the
measure is displayed in the resulting report.
When the scaling factor is changed for the key gure, this change is reected in the report when the report is
refreshed. The scaling factor is displayed for the measure name in the report, and for the measure attribute in
the Query Panel..
3.2.8.5.3 Hierarchy node variables in BEx queries
When a prompt is present on a characteristic of a hierarchy node in a BEx query, this is referred to as a
hierarchy node variable.
If there is a hierarchy node variable, the member selection function is disabled for the hierarchy. The prompt
related to the hierarchy node variable appears at run time.
3.2.8.5.4 Hierarchical member selection in BEx queries
You use the Member Selector dialog box, available from a hierarchy object in the Query Panel, to select
members of a hierarchy for your query.
The following hierarchy illustrates member selection behavior in BEx queries.
World
EMEA
Europe
Middle East
Africa
North America
Asia PAC
Asia
Pacic
Australia
Philippines
118 P U B L I C
SAP BusinessObjects Web Intelligence User's Guide
Building and running queries

New Zealand
South America
Hierarchy selection rules
Rule
Example
When you select a member of a hierarchy at a given level, all
of the parent members in the hierarchy are selected.
The root is always selected. It is not possible to select one
specic level.
If you deselect a member when its parent member is already
selected, all child members of the parent are also dese
lected.
If Pacic and all its child members are already selected and
you deselect Australia, Philippines and New Zealand are also
deselected. The following member selections appear:
● Europe
● Pacic
If you select a member with some of its child members al
ready selected, all child members are selected.
If Europe is selected and you select EMEA, the Middle East
and Africa are also selected. The following member selec
tions appear:
● EMEA
● Children of EMEA
If you select a member when descendant members are al
ready selected, all children of the member, and all siblings of
the selected descendant members are also selected.
If you select Asia PAC when Australia was already selected,
Asia, Pacic (children of Asia PAC) and Philippines and New
Zealand (siblings of Australia) are also selected. The follow
ing member selections appear:
● Asia PAC
● Children of Asia PAC
● Pacic
● Children of Pacic
Related Information
Restrictions when using BEx queries [page 111]
Hierarchical member selection in BEx queries [page 78]
SAP BusinessObjects Web Intelligence User's Guide
Building and running queries
P U B L I C 119

3.2.8.5.4.1 To select BEx query hierarchy members by
relationship
You can select by relationship the members in a hierarchy for your BEx query.
Context
Procedure
1. Open in Design or Data mode a Web Intelligence document that uses a BEx query.
2. In the Data Access tab, in the Data Providers subtab, click Edit.
The Query Panel appears.
3. Add a hierarchy object to the Result Objects pane in the Query Panel.
4. Click the arrow next to the hierarchy object to launch the Member Selector dialog box.
5. In the Members tab, right-click a member to which you want to apply a function.
The menu displays the following options:
Option
Description
Children Adds all child members of the member to the list of selected members.
The members immediately below the selected member are its children.
The members appear as Children of [selected member] in the
list.
Note
You cannot include children and descendants of the same member. If
you had already selected Descendants before selecting Children, the
descendants are removed from the list and replaced by children.
120 P U B L I C
SAP BusinessObjects Web Intelligence User's Guide
Building and running queries
Option Description
Descendants Adds all descendant members of the member to the list of selected mem
bers.
All members below the selected member in the hierarchy are its descend
ants.
The members appear as Descendants of [selected member]
in the list.
Note
You cannot include children and descendants of the same member. If
you had already selected
Children before selecting Descendants, the
children are removed from the list and replaced by descendants
Parent The Parent function is not available in BEx queries.
Ancestors
The Ancestors function is not available in BEx queries.
Siblings
The Siblings function is not available in BEx queries.
Descendents until Named Level Use the list of level names to choose the level.
Descendents until Choose the number of levels that you want to include in the selection.
6. Click OK to close the Member Selector dialog box.
The selected members appear below the hierarchy object in the Result Objects pane. When you run the
query, only those members are included in the query result.
Note
You cannot exclude hierarchy members in BEx queries.
Related Information
To select hierarchy members [page 76]
About level-based member selection [page 81]
To build prompts for selecting members using the Member Selector dialog box [page 85]
Hierarchical member selection and query lters [page 74]
SAP BusinessObjects Web Intelligence User's Guide
Building and running queries
P U B L I C 121
3.2.8.5.4.2 To search for members in the Member Selector
dialog box
You can search a hierarchy for specic members in the Member Selector dialog box.
Procedure
1. Open a Web Intelligence document in Design or Data mode.
2. In the Data Access tab, in the Data Providers subtab, click Edit.
The Query Panel appears.
3. Add a hierarchy object to the Result Objects pane in the Query Panel.
4. Click the arrow next to the hierarchy object to launch the Member Selector dialog box.
5. In the Members tab, click the Search button to launch the Search dialog box.
Note
The search is always performed on the entire hierarchy stored in the database, not on the members
already retrieved in the Member Selector dialog box.
6. Type text in the Search text box.
You can use wildcards in the search.
Wildcard
Description
* Replaces any string of characters
? Replaces any individual character
7. Select one of the following:
○ Click Search in Text to search the display text of the members.
○ Click Search in Key to search their database keys.
8. Click OK to close the Member Selector dialog box.
122
P U B L I C
SAP BusinessObjects Web Intelligence User's Guide
Building and running queries

3.2.8.5.4.3 To build prompts for selecting members using the
Member Selector dialog box
You can defer member selection until the query is run. If you do so, the user are prompted to select members
when they run the query.
Context
Note
Selection of member prompts is restricted to explicit selection of members. The user cannot select
members using functions such as Ancestors or Parent.
To build member-selection prompts:
Procedure
1. Open a Web Intelligence document in Design or Data mode.
2. In the Data Access tab, in the Data Providers subtab, click Edit.
The Query Panel appears.
3. Add a hierarchy object to the Result Objects pane in the Query Panel.
4. Click the arrow next to the hierarchy object to launch the Member Selector dialog box.
5. In the Prompts tab, click Enable Parameter.
Note
When you select this option, the selections in the other tabs are deactivated.
6. Enter text in the Prompt Text box.
7. If you want the prompt to select the previously-chosen values by default when it is displayed, click Keep
last values selected .
8. If you want the prompt to select default values when it is displayed, click Set default values, then Edit and
select the default values.
9. Click OK to close the List of Values dialog box.
10. Click OK to close the Member Selector dialog box.
The prompt text appears beneath the hierarchy in the Query Panel.
Related Information
To select BEx query hierarchy members by relationship [page 120]
SAP BusinessObjects Web Intelligence User's Guide
Building and running queries
P U B L I C 123

3.2.8.5.4.4 To select members based on relative depth from a
selected node
You can dene to which depth of a hierarchy for which information is retrieved. Use the member selector to
dene the relative depth.
Context
Restriction
Web Intelligence does not support scenarios that have a static hierarchy for a hierarchy node variable and a
variable hierarchy for result displays. The prompted hierarchy is always used for results display and ltering
that aects the LOV of that hierarchy in the prompts dialog box. You must use the same hierarchy for the
hierarchy node variable and a prompt LOV.
Note
This feature is only available when the BEx query has a hierarchy node variable on the characteristic that
you are using for the query.
Procedure
1. Open in Design or Data mode a Web Intelligence document that uses a BEx query.
2. In the Data Access tab, in the Data Providers subtab, click Edit.
The Query Panel appears.
3. Add a hierarchy object to the Result Objects pane in the Query Panel.
4. Click the arrow next to the hierarchy object to launch the Member Selector dialog box.
5. In the Relative Depth tab, select:
○ All hierarchy node descendants for the query to handle all the descendants of the selected hierarchy
node.
○ Hierarchy members based on the relative depth in order to return data from a relative depth in the
hierarchy. Select the number of levels below the selected node for which data is returned. You can set a
dierent depth level for each hierarchy node variable.
6. Click OK to close the Member Selector dialog box.
Results
When you run the query, you are prompted to select a node, and the query returns the data from the selected
node down to the specied depth.
124
P U B L I C
SAP BusinessObjects Web Intelligence User's Guide
Building and running queries

3.2.8.5.4.5 To select members based on levels from a
selected node
You can dene the number of levels of a hierarchy from which to retrieve more detailed data.
Procedure
1. Open in Design or Data mode a Web Intelligence document that uses a BEx query.
2. In the Data Access tab, in the Data Providers subtab, click Edit.
The Query Panel appears.
3. Add a hierarchy object to the Result Objects pane in the Query Panel.
4. Click the arrow next to the hierarchy object to launch the Member Selector dialog box.
5. In the Levels tab, select Enable levels and select the levels down to which you want to return data.
6. Click OK to close the Member Selector dialog box.
Results
When you run the query, data is retrieved down to the selected level. If you select a dierent hierarchy at
refresh time, the level selection still applies on the new hierarchy and returns nodes and values of the new
hierarchy, down to the selected level.
3.2.8.5.5 About the Set Variables dialog box
The Set Variables dialog box is prompted before the Query Panel so you can manage variables of a BEx query.
When you rst create a document based on a BEx query that contains variables, if the query has at least one
mandatory or optional variable, the Set Variables dialog box automatically appears and displays all the
variables and their default values, if any. When you save the variable values, the Query Panel appears and you
can select the objects for your document.
Note
Currently, the Set Prompt check box for each variable is not displayed automatically when you rst select
the BEx query for your document. When the transient universe has been created and the Query Panel
displays the objects, you can open the Set Variables dialog box and access the Set Prompt dialog box.
Caution
If the BI administrator allows manual entry of values for a prompt, so that a start and end key selection is
changed to a values list, and your document was created when manual entry was not allowed, you need to
do the following for your document:
SAP BusinessObjects Web Intelligence User's Guide
Building and running queries
P U B L I C 125

● Purge the document.
● Change the default values for query prompts to be compatible with multivalue selection.
Related Information
Selecting prompt values in the Prompts dialog box [page 521]
3.2.8.5.6 Managing mandatory variables with no default
values
You can use the Set Variables dialog box to dene how the variable with no default value is managed for the
users.
When the report is published to multiple users, you can ensure that the user is presented with a prompt default
value that makes sense.
To use the BEx default values, in the Set Variables, select the option Use BEx query dened default values at
runtime. How the BEx default values are used depends on the settings in the Set Variables dialog box and how
the user responds to the Purge Last Selected Prompt Values prompt when the query is purged.
Caution
You cannot hide prompts and retrieve default values from BEx at the same time. Conversely, you have to
display prompts to be able to see dynamic values. If a document is purged with the Purge Last Selected
Prompt Values option but you have dened a default value and the Use BEx query dened default values at
runtime option is unchecked, it will still be retrieved after the purge as this value comes from the Query
Panel.
Workow when the query designer chooses to use the BEx query default
values at runtime
1. When the query contains a BEx mandatory variable, the designer chooses to use the BEx variable default
value and selects Use BEx query dened default values at runtime.
2. When a user runs the report, the query displays the prompt for the BEx variable. The default value
proposed is 'A'. The user chooses a dierent value ('C', for example).
3. The report contains the results for the user's selected value 'C'.
4. The user purges the report. The purge process displays a warning message asking the if the user wants to
purge the last selected prompt value ('C').
If the user:
● Selects Purge Last Selected Prompt Values, the query will retrieve 'A' as the default prompt value, since Use
BEx query dened default values at runtime was selected at query design time.
126
P U B L I C
SAP BusinessObjects Web Intelligence User's Guide
Building and running queries

● Does not select Purge Last Selected Prompt Values, the query will retrieve 'C' as the default prompt value,
since this value was the last selected prompt value.
Workow when the query designer chooses not to use the BEx query default
values at runtime
1. When the query contains a BEx mandatory variable, the designer chooses not to use the BEx variable
default value ('A', for example), but chooses a dierent value 'B', for example). The designer has not
selected Use BEx query dened default values at runtime.
2. When a user runs the report, the query displays the prompt for the BEx variable. The default value
proposed is 'B', the value selected by the query designer. However, the user chooses a dierent value ('C',
for example).
3. The report contains the results for the user's selected value 'C'.
4. The user purges the report. The purge process displays a warning message asking the if the user wants to
purge the last selected prompt value ('C').
If the user:
● Selects Purge Last Selected Prompt Values, the query will retrieve 'A' as the default prompt value, since Use
BEx query dened default values at runtime was selected at query design time.
● Does not select Purge Last Selected Prompt Values, the query will retrieve 'B' as the default prompt value,
since this value was selected in the Set Variables dialog box at query design time.
3.2.8.5.7 The Selection Option in prompts on BEx variables
If there is a characteristics value variable that is of type Selection Option, Web Intelligence interprets it as a
complex prompt.
The BI administrator can change this behavior to be an INLIST or BETWEEN operator, which allows multivalue
selection of variables on a Selection Option prompt. When this happens the start and end value selection is
changed to a multivalues list.
Caution
If a query was created when the Selection Option selection was interpreted as BETWEEN, then any values
selected for this prompt do not work. You need to do the following for any document created before the
change in selection behavior:
● Purge the document.
● Change the default values for query prompts to be compatible with multivalue selection.
SAP BusinessObjects Web Intelligence User's Guide
Building and running queries
P U B L I C 127

3.2.8.5.8 To create a query based on a BEx query that has
no variables
You can create a query using BEx data that contains no variables.
Prerequisites
To access the BEx query, it must have the Allow External Access to the Query option enabled in the BEx Query
Designer.
Procedure
1. In a Web Intelligence document in Design or Data mode, click the New icon in the File toolbar.
2. In the Select a data source list, select BEx, then OK.
3. Select the appropriate BICS connection in the dialog box.
4. Select the BEx query in the side pane and click OK. When a BICS connection is based on an InfoCube, there
may be several BEx queries available.
When there are variables in the BEx query, depending on the variable type, the Set Variables dialog box
appears and you dene the variable properties (see the link below for more information about BEx
variables and the Set Variables dialog box. The Query Panel appears, displaying the objects in the query as
hierarchies, dimensions and attributes. If you cannot see the BEx query that you want to use, use the BEx
Query Designer to ensure that the Allow External Access to the Query option is selected in the query.
5. Build the query and query lters using the available objects.
Note
○ When you create a Web Intelligence query based on a BEx query that contains one mandatory
variable (or more) that does not have a default value, when you select a list of values or try to use
the Member Selector dialog box, an error message appears. Use the Set Variables dialog box to set
values for the mandatory variable.
○ You cannot lter on attributes in BEx queries.
○ If the BEx query you connected includes SAP server-side variables, you can change the value of the
variable in the Query Panel. Click the Set Variables icon in the Query Panel toolbar, and select a new
variable.
6. Click Run Query. When you have more than one query and you want to run just one query, click Run
Queries and select the query that you want to run.
128
P U B L I C
SAP BusinessObjects Web Intelligence User's Guide
Building and running queries

3.2.8.5.9 To create a document based on a BEx query that
uses variables
You can create a document based on a BEx query that contains variables.
Procedure
1. In a Web Intelligence document in Design or Data mode, click the New icon in the File toolbar.
2. In the Select a data source list, select BEx, then OK.
3. Select the appropriate BICS connection in the dialog box.
4. Select the BEx query in the side pane and click OK. When a BICS connection is based on an InfoCube, there
may be several BEx queries available.
When there are variables in the BEx query, depending on the variable type, the Set Variable dialog box
appears and you dene the variable properties. See the table below for more information about dening
BEx variables and using the Set Variables dialog box.
5. Build the query and query lters using the available objects.
Note
○ When you create a Web Intelligence query based on a BEx query that contains one mandatory
variable (or more) that does not have a default value, when you select a list of values or try to use
the Member Selector dialog box, an error message appears. Use the Set Variables dialog box to set
values for the mandatory variable.
○ You cannot lter on attributes in BEx queries.
○ If the BEx query you connected includes SAP server-side variables, you can change the value of the
variable in the Query Panel. Click the Set Variables icon in the Query Panel toolbar, and select a new
variable.
Results
When you have selected a BEx query that contains variables, you use the Set Variables dialog box to dene or
modify the value(s) of the variable(s). The steps you have to perform depend on the variable type (mandatory
or optional), and on whether there is a default value or not.
SAP BusinessObjects Web Intelligence User's Guide
Building and running queries
P U B L I C 129
Setting variables for BEx queries
When the BEx Query has… Do this...
Mandatory variable(s) where at least one vari
able has no default value.
Use the Set Variables dialog box to ll in any mandatory variables. The OK
button is enabled when all mandatory variables have a value. After this, the
Query Panel is appears and the outline shows the content of the BEx query
as generated in the transient universe. At this point, you can open the Set
Variables dialog box again and change the Set Prompts properties.
Note
If at this point you cancel the Set Variables dialog box settings:
a. If you are using the Applet interface, the main Web Intelligence inter
face appears with no document open. If another document was al
ready open at step you will already have been prompted to save or dis
card the changes when you started to create the BEx query.
b. If you are using the Rich Client interface, this returns the interface to
the home page.
Mandatory variable(s) with default values (op
tional variables have no eect on the behav
ior).
The Set Variables automatically appears when the transient universe is
created, the Query Panel displays the metadata.
Only optional variable(s), at least one of the
variables has no default.
The transient universe is created and the Query Panel displays the meta
data without opening the Set Variables dialog box.
Optional variables that all have default values.
There are no mandatory variables.
The transient universe is created and the Query Panel displays the meta
data without opening the Set Variables dialog box.
You can now run the query for your document. You can modify variables later by accessing the Set Variables
dialog box through the Query Panel.
3.2.8.5.10 To add a second BEx query data provider to a
document
Your current document is already based on a BEx query and you want to add a second BEx query as an
additional data provider.
Procedure
1. In a Web Intelligence document in Design or Data mode, click the Add new data provider icon in the File
toolbar.
2. In the Select a data source list, select BEx, then OK.
3. Select the appropriate BICS connection in the dialog box.
4. Select the BEx query in the side pane and click OK. When a BICS connection is based on an InfoCube, there
may be several BEx queries available.
130
P U B L I C
SAP BusinessObjects Web Intelligence User's Guide
Building and running queries
When there are variables in the additional BEx query, depending on the variable type, the Set Variables
dialog box appears and you dene the variable properties. See the table below for more information about
dening BEx variables and using the Set Variables dialog box.
5. Build the query and query lters using the available objects.
Note
○ When you create a Web Intelligence query based on a BEx query that contains one mandatory
variable (or more) that does not have a default value, when you select a list of values or try to use
the Member Selector dialog box, an error message appears. Use the Set Variables dialog box to set
values for the mandatory variable.
○ You cannot lter on attributes in BEx queries.
○ If the BEx query you connected includes SAP server-side variables, you can change the value of the
variable in the Query Panel. Click the Set Variables icon in the Query Panel toolbar, and select a new
variable.
Results
Setting variables for an additional BEx query
When the BEx Query has…
Do this...
Mandatory variables where at least one varia
ble has no default value.
When you select the new BEx query, the Set Variables dialog box displays
all the variables of the newly added BEx query and their default values, if
any. Only variables of the newly added data provider are displayed.
If variables are shared by the original BEx query and the new BEx query,
then the values of those variables are not pre-lled by the values entered
for initial query. Although the merge option of BEx variables is active, no
merge is applied at this stage. Provide the mandatory variables and click
OK.
The Query Panel appears and the outline shows the content of the new BEx
query, generated by the underlying transient universe.
Create and execute the query.
The prompts dialog box displays and shows the variables of the two data
Providers depending on the option “Merge BEx variables” of the docu
ment:
● Merge is active: the dialog box merges the prompts that are shared by
the two BEx queries. The values to be displayed are the values entered
previously for the rst data provider.
● Merge is not active: the dialog box displays each prompt separately,
with separate values entered for each data provider.
Mandatory variables with default values (op
tional variables have no eect on the behav
ior).
The transient universe is created and the Query Panel displays the meta
data without opening the Set Variables dialog box.
SAP BusinessObjects Web Intelligence User's Guide
Building and running queries
P U B L I C 131

When the BEx Query has… Do this...
Only optional variables, at least one of the vari
ables has no default.
The transient universe is created and the Query Panel displays the meta
data without opening the Set Variables dialog box.
Optional variables that all have default values.
There are no mandatory variables.
The transient universe is created and the Query Panel displays the meta
data without opening the Set Variables dialog box.
3.2.8.5.11 To edit a document based on a BEx query
You edit data providers in a BEx query in the Set Variables dialog box.
Prerequisites
The document has multiple data providers; some of them (not all) are based on BEx Queries.
Context
When editing data providers, the Set Variables dialog box appears when a mandatory variable exists and has no
values. This situation can only happen if a mandatory variable was added to one of the underlying BEx Queries
after the document was created and saved.
Procedure
1. In a Web Intelligence document, in the Data Access tab, click Edit.
The Set Variables dialog box is displayed with variables of the BEx Query related to the rst Data Provider
based on BEx in the document, having mandatory variables with no values. All variables of the BEx Query
are displayed, not only the mandatory variables that are missing values.
2. Fill in the values for the missing mandatory valiables and click OK.
The Set Variables dialog box appears with variables of the BEx Query related to the second Data Provider
based on BEx in the document, having mandatory variables with no values. All variables of the BEx Query
are displayed, not only the mandatory variables that are missing values.
3. Fill in the values for the missing mandatory valiables for the second BEx query and click OK.
4. Repeat the previous step until there are no more BEx data providers with mandatory variables and no
default values.
The Query Panel appears and displays the available objects.
5. The prompts dialog box displays and shows the variables of all data Providers depending on the option
“Merge BEx variables” of the document:
a. When Merge BEx variables is enabled: the dialog box merges the prompts that are shared by the BEx
Queries. The values to be displayed are the values entered previously for the rst data provider.
132
P U B L I C
SAP BusinessObjects Web Intelligence User's Guide
Building and running queries
b. Merge BEx variables is disabled: the dialog box displays each prompt separately, with separate values
entered for each data provider.
Results
When you have entered the prompt values, you can run the query for the document.
3.2.8.5.12 To cancel an edit
You can cancel an edit action in a BEx query.
Context
You have a Web Intelligence document that has one or more Data Providers open for edit.
Procedure
1. In the Data Access tab, click Edit.
The Set Variables dialog box is displayed with variables of the BEx Query related to the rst Data Provider
based on BEx in the document, having mandatory variables with no values. All variables of the BEx Query
are displayed, not only the mandatory variables that are missing values.
2. Cancel the Set Variables dialog box.
The entire action of edit is cancelled, not only the Set Variables dialog box. The Set Variables dialog box is
not displayed for the other data providers.
3.2.8.5.13 About previewing data when a BEx query has
variables
Variables with missing values have no impact on this function.
The prompts dialog box (runtime prompts) displays and invites user to answer variables in all cases. In
addition, at this stage the variables should already have been answered in the Set Variables dialog box either at
document creation time, or when the query is edited. You can preview the query in the same way as any other
document.
SAP BusinessObjects Web Intelligence User's Guide
Building and running queries
P U B L I C 133

3.2.8.6 Runtime Conguration
This section describes the conguration options that can be set at runtime to change the behavior of the BW
Direct Access in the Semantic Layer and in the BI tools.
All these options are Java runtime options and need to be provided for the Java Virtual Machine (JVM) in the
Central Management Console (CMC).
You can provide them through the Adaptive Processing Server command line, in property les, or even through
environment variables.
An example of the Adaptive Processing Server command line is as follows:
-DoptionName=optionValue
Note
The Adaptive Processing Server uses parameters dened for the SAP Java Virtual Machine (SAP JVM).
Refer to SAP JVM documentation for more information. For information on modifying a server's command
line, refer to the Business Intelligence Platform Administrator Guide.
The following lists are valid for BI 4.1 versions Support Package (SP) 01 and higher. Some of these options are
also available in BI 4.0.
Infoprovider Browsing
Option Possible Values Description In 4.0
In
4.1
In
4.2
Long name:
sap.sl.bics.BExExternalAccessDeten
tionMode
Short name:
BExExternalAccessDetentionMode
Default value:
rfcPerInfoQuery
rfcPerInfoQuery
rfcProperty
infoArea
false
Set the Multidimen
sional Expression
(MDX) compliance
detection mecha
nism for BEx queries
when browsing BW
infoareas/info
cubes.
For more informa
tion, refer to the
“SAP BW Browsing
Runtime Congura-
tion” below.
Yes as
of
SP04
Yes Yes
Long name:
sap.sl.bics.browsingImplementation
Default value: bics
bics
olapClient
Set the SL imple
mentation to use for
BW query browsing.
Yes as
of
SP05
Yes Yes
134 P U B L I C
SAP BusinessObjects Web Intelligence User's Guide
Building and running queries
List of Values
Option
Possible
Values Description
In
4.0
In
4.1
In
4.2
Long name:
sap.sl.bics.lovSizeLimit
Short name:
lovSizeLimit
Default value: 5000
n > 0
Set the maximum number of mem
bers for a list of values.
No Yes Yes
Long name:
sap.sl.bics.intervalLimitForBigS
ets
Short name:
intervalLimitForBigSets
Default value: 0
n > 0
Set the maximum number of intervals
that can be retrieved for members
that exceed the number of LOV (see
property
bicslovlimit).
No
Yes Yes
Long name:
sap.sl.bics.variableComplexSelec
tionMapping
Short name:
variableComplexSelectionMapping
Default value: interval
multivalue
interval
Denes the method of selecting values
for BEx characteristic variables of the
type Selection Option.
Caution
If the BI administrator allows
manual entry of values for a
prompt so that a start and end
value selection is changed to a
values list, and a document was
created when manual entry was
not allowed, a document owner
needs to do the following for a
document:
● Purge the document.
● Change the default values for
query prompts to be compat
ible with multivalue selection.
No
Yes
as of
SP0
5
Yes
SAP BusinessObjects Web Intelligence User's Guide
Building and running queries
P U B L I C 135
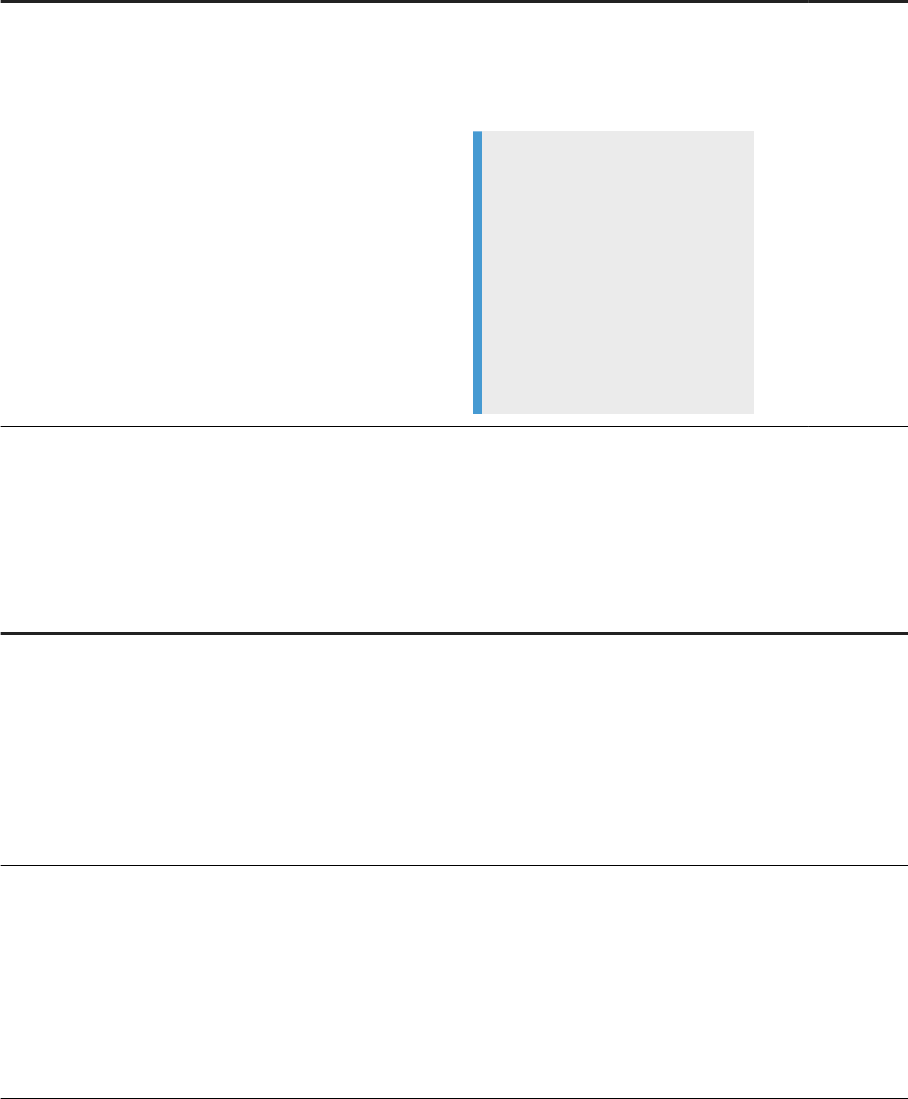
Option
Possible
Values Description
In
4.0
In
4.1
In
4.2
Long name:
sap.sl.bics.variableComplexSelec
tionUse
Short name:
variableComplexSelectionUse
Default value: true
true
false
Enables the selection options (with
condition operators such as =, !=, >,
>=, <, <=, BETWEEN, or NOT BE
TWEEN) in prompts on BEx variables.
Note
This parameter directly impacts
the
variableComplexSelectio
nMapping. If
variableComplexSelectio
nUse is set to false, then the
variableComplexSelectio
nMapping parameter is ignored.
No No Yes
as of
SP0
4
Member Selection and Result Set Scope
Option
Possible
Values Description In 4.0 In 4.1 In 4.2
Long name:
sap.sl.bics.defaultHierarchyDept
hRetrieved
Short name:
defaultHierarchyDepthRetrieved
Default value: 0
n > 0
Set the expandToLevel value for
hierarchies when fetching data ;n
is 1-based, 0 means "use the ex
pand-to-level value of the BEx
query".
No
Yes Yes
Long name:
sap.sl.bics.expandNotAssignedNod
es
Short name:
expandNotAssignedNodes
Default value: false
true
false
Expand the not assigned node
when no member selection has
been set on a dimension or hier
archy.
No
Yes Yes
136 P U B L I C
SAP BusinessObjects Web Intelligence User's Guide
Building and running queries
Option
Possible
Values Description In 4.0 In 4.1 In 4.2
Long name:
sap.sl.bics.depthRelativeTo
Short name:
depthRelativeTo
Default value: top
top
root
node
Denes the behavior of the rela
tive depth used in member selec
tors:
'top' means 'depth relative to the
selected top node, including out-
of-bounds selected nodes that
belong to another root'
'root' means 'depth relative to the
selected root node only, and out-
of-bounds nodes are excluded'
'node' means 'depth relative to
each selected node'
No
Yes Yes
Diagnosis and Debug
Option
Possible Values Description In 4.0 In 4.1 In 4.2
Long name:
sap.sl.bics.profileRFC
Short name:
profileRFC
Default value: false
true
false
txt
xml
csv
Enable/disable the BW RFC tracing, and
choose a specic tracing format if ena
bled.
No Yes Yes
Long name:
sap.sl.bics.traceBICSR
esultSet
Short name:
traceBICSResultSet
Default value: undened
1
undened
Print result sets. No Yes Yes
SAP BusinessObjects Web Intelligence User's Guide
Building and running queries
P U B L I C 137

BW Statistics
Option Possible Values Description In 4.0 In 4.1 In 4.2
Long name
sap.sal.bics
.postBWstati
stics
Short name
postBWstatis
tics
Default value:
false
true
false
Activates the fol
lowing BW statis
tics events:
● 20100:
fetches BEx’s
characteristic
members
● 20101:
fetches BEx
query’s re
sults
● 20102: sub
mits BEx vari
ables
● 20103: opens
a BEx query
using BICS
API.
● 20104: syn
chronizes with
BW
● 20105: set
variable’s in
put string
No
No Yes as of SP03
Miscellaneous
Option
Possible
Values Description
In
4.0
In
4.1
In
4.2
Long name:
sap.sl.bics.reverseKeyFigureStructure
Short name:
Reverse_KF
Default value: undened
1
undened
Reverse axis of
Structure contain
ing KeyFigures
(ROWS <-> COL
UMNS).
No
Yes Yes
138 P U BL I C
SAP BusinessObjects Web Intelligence User's Guide
Building and running queries

Option
Possible
Values Description
In
4.0
In
4.1
In
4.2
Long name:
sap.sl.bics.retrieveHierarchyLevels
Short name:
retrieveHierarchyLevels
Default value: true
true
false
Retrieve the BW
levels for every hi
erarchy, or com
pletely skip them.
No
Yes Yes
Long name:
sap.sl.bics.recycleGroupingSetView
Short name:
recycleGSView
Default value: true
true
false
Recycle and share
a single query
view for all group
ing sets.
No
Yes Yes
Long name:
sap.sl.bics.inlineGroupingSet
Short name:
inlineGroupingSet
Default value: false
true
false
Inline grouping set
in the main query
if possible.
No Yes Yes
Long name:
sap.sl.bics.displayKeyInResultSet
Short name:
displayKeyInResultSet
Default value: false
true
false
Always fetch the
member display
keys when execut
ing a query.
No
Yes Yes
Long name:
sap.sl.bics.useDesignTimeService
Short name:
useDesignTimeService
Default value: true
true
false
Use the design
time services of
BICS/BW.
No Yes Yes
SAP BusinessObjects Web Intelligence User's Guide
Building and running queries
P U B L I C 139
Option
Possible
Values Description
In
4.0
In
4.1
In
4.2
Long name:
sap.sl.bics.useDesignTimeQueryForRefresh
Short name:
useDesignTimeQueryForRefresh
Default value: false
true
false
Use the design-
time query for re
fresh workows as
well.
No
Yes Yes
Long name:
sap.sl.bics.useConcurrentDesignTimeQuery
Short name:
useConcurrentDesignTimeQuery
Default value: true
true
false
Instantiate the de
sign-time query
early in a concur
rent thread.
No
Yes Yes
Long name:
sap.sl.bics.useFallbackWithKeyForMemberResolutio
n
Short name:
useFallbackWithKeyForMemberResolution
Default value: false
true
false
If text is not found,
input is consid
ered a key; 4.0
SP8 and 4.1 SP2+.
No
Yes Yes
140 P UB L I C
SAP BusinessObjects Web Intelligence User's Guide
Building and running queries

Option
Possible
Values Description
In
4.0
In
4.1
In
4.2
Long name:
sap.sl.bics.hierarchyVariableAlwaysMandatory
Short name:
hierarchyVariableAlwaysMandatory
Default value: false
true
false
In BW system, Hi
erarchy Variables
can be dened as
optional. However,
in the BEX Ana
lyzer, this optional
Hierarchy Variable
is treated as man
datory and users
must provide an
answer. On the BI
platform, optional
hierarchy varia
bles are shown as
optional prompts
and users can skip
the prompt and
execute the query.
Incorrect LOV con
tent and incorrect
query execution
can occur if users
skip any prompts.
If you set this op
tion to True, users
cannot skip the
prompts.
No
Yes
as
of
SP0
5
Yes
SAP BW Browsing Runtime Conguration
This section explains the runtime conguration to get the Multidimensional Expression (MDX) compliance
information (detectMdxCompliance).
Previously, access to a dedicated system InfoArea (SystemMdxQueriesTopLevel) was hard-coded and you
could not congure it. As of BI 4.0 SP5, you can congure this method.
● Reverting to the infoArea conguration for the InfoArea dedicated system
You can still use this conguration on a new BW system, and it is very ecient for small systems. However,
it does not scale up. This method is for BW systems prior to BW version 7.30.
To activate this method, set the jvmArg to:
sap.sl.bics.detectMdxCompliance=infoArea
This is the default value for BI 4.0 up to version SP4.
This is not the default value for BI 4.0 version SP5 and higher.
This method works well with dierent languages.
● Conguring the BO or BI system to access the BW system with an RFC call per InfoQuery
This method is for BW systems prior to version 7.30. It still usable on new BW system, however it is not
ecient for an InfoProvider with a lot of InfoQueries. For large systems, it is more ecient for retrieving
information than the InfoArea system.
SAP BusinessObjects Web Intelligence User's Guide
Building and running queries
P U B L I C 141

To activate this method, set the jvmArg to:
sap.sl.bics.detectMdxCompliance=rfcPerInfoQuery
This is the default value.
● Conguring the BI system to access the BW system with an RFC call
This method is for BW systems from version 7.30 and 7.31. Refer to SAP note 1647346.
This method is less ecient than the former method for small systems, however the performance is good
and it scales up. Internally, an RFC call is done for a cluster of SAP BW nodes. It does not have any max
number limitations. All information is received with several RFC calls for a limited number of nodes.
To activate this method, set the jvmArg to:
sap.sl.bics.detectMdxCompliance=rfcProperty
This is not the default value.
To override the number of nodes per RFC calls, set jvArm:
sap.sl.bics.mdxComplianceInfoPerRfc=100
This is the default value. Folders appear in English.
● Deactivation of the MDX compliant ag retrieval
All InfoQuery queries will be assumed to be agged as MDX compliant. Only deactivate the MDX compliant
ag retrieval if all InfoQuery queries are veried to be MDX compliant.
To deactivate the MDX compliant ag retrieval, set the jvmArg to:
sap.sl.bics.detectMdxCompliance=false
This is not the default value.
3.2.9 Building queries on SAP HANA views with SAP HANA
Direct Access
You can build queries on SAP HANA views with SAP HANA Direct Access data providers.
You can use SAP HANA views as data sources to create reports without using universes. With SAP HANA Direct
Access, a transient universe is generated on the y so that you can create queries on a SAP HANA view. These
queries are then executed for data retrieval in Web Intelligence reports.
SAP HANA Direct Access data providers can be created on relational connections or OLAP connections.
You can execute query scripts using SQL for relational connections, or MDX for OLAP connections. These
connections can be dened and published from information design tool (IDT), universe design tool (UDT) or
the Central Management Console (CMC).
Restriction
● Only secured connections dened in the CMS are supported, you cannot use personal connections.
● SAP HANA ODBC connections are not supported.
Every Web Intelligence client supports SAP HANA Direct Access.
142
P U B L I C
SAP BusinessObjects Web Intelligence User's Guide
Building and running queries

SAP HANA Direct Access data providers support the same functions as other Web Intelligence data providers.
You can:
● Rename a SAP HANA Direct Access data provider
● Duplicate an existing SAP HANA Direct Access data provider
● Delete/Remove an existing SAP HANA Direct Access data provider
● Purge data (and prompt answer values) for a SAP HANA Direct Access data provider
● Refresh data for a SAP HANA Direct Access data provider
● Edit an existing SAP HANA Direct Access data provider with the Query Panel
● Export data from an existing SAP HANA Direct Access data provider
● Merge SAP HANA Direct Access data provider objects with another data provider
● Create Variables/Formulas from SAP HANA Direct Access data provider objects
3.2.9.1 SAP HANA view metadata
A transient universe is a universe created at runtime for the purpose of a query. The universe is not persisted
and cannot be accessed.
At the design time, Web Intelligence generates a transient universe that can display dierent metadata,
depending on the connection type, relational or OLAP. At the runtime, the transient universe based on the SAP
HANA view can be generated every time the SAP HANA view is modied in order to regenerate the query
before executing it.
SAP HANA view metadata for relational connections
The table below details the mapping between SAP HANA metadata and the relational transient universe
metadata.
SAP HANA view metadata
Relational universe metadata
Attributes Dimensions under folders representing their parent attribute
views
Calculated/Restricted columns Dimensions under the folder representing their parent attrib
ute views
Measures Measures
Measure aggregations (SUM, COUNT, COUNT DISTINCT,
AVG, VAR, STDDEV MIN, MAX)
By default, all SAP HANA measures are set to Delegated in
SAP HANA universes or for SAP HANA Direct Access
SAP HANA variables Universe prompt parameters (manageable in the query
panel)
SAP HANA input parameters Universe prompt parameters (manageable in the query
panel)
SAP BusinessObjects Web Intelligence User's Guide
Building and running queries
P U B L I C 143
SAP HANA view metadata for OLAP connections
The table below details the mapping between SAP HANA metadata and the metadata displayed in Web
Intelligence.
SAP HANA view metadata
OLAP universe metadata
Attribute views Analysis Dimensions
Attributes Dimensions under Analysis Dimensions representing their
parent attribute views
Calculated/Restricted columns Dimensions under the Analysis Dimensions representing
their parent attribute views
Measures Measures
Measure aggregations (SUM, COUNT, COUNT DISTINCT,
AVG, VAR, STDDEV MIN, MAX)
By default, all SAP HANA measures are set to Delegated in
SAP HANA universes or for SAP HANA Direct Access
Parent-child Hierarchies Parent-child Hierarchies under the Analysis Dimensions rep
resenting their parent attribute views
Level-based Hierarchies Level-based Hierarchies under the Analysis Dimensions rep
resenting their parent attribute views
SAP HANA variables Universe prompt parameters (manageable in the query
panel)
SAP HANA input parameters Universe prompt parameters (manageable in the query
panel)
SAP HANA view metadata for SAP HANA HTTP Info Access connections
The table below details the mapping between SAP HANA metadata and the OLAP transient universe metadata.
SAP HANA view metadata
OLAP universe metadata
Attribute views Dimensions
Attributes Measures
Measures Measures
Measure aggregations (SUM, COUNT, COUNT DISTINCT,
AVG, VAR, STDDEV MIN, MAX)
By default, all SAP HANA measures are set to Delegated in
SAP HANA universes or for SAP HANA Direct Access
Calculated/Restricted columns Dimensions or measures, depending on the attribute type in
SAP HANA Studio
Parent-child Hierarchies Parent-child hierarchies under their key dimension
Level-based Hierarchies Level-based hierarchies under their key dimension
SAP HANA variables Pormpt parameters (manageable in the query panel)
SAP HANA input parameters Pormpt parameters (manageable in the query panel)
144 P U B L I C
SAP BusinessObjects Web Intelligence User's Guide
Building and running queries

3.2.9.2 To build queries on SAP HANA views
You can build queries using a SAP HANA view as a data source.
Procedure
1. Open Web Intelligence and click the New icon in the File toolbar.
2. Click SAP HANA.
3. Select a secured SAP HANA connection.
4. Select a SAP HANA analytic view or a SAP HANA calculation view.
You can also search for a SAP HANA view on a given SAP HANA connection using the search bar. The
search bar is case insensitive.
5. Click OK.
6. Optional: If the SAP HANA view you have selected has mandatory variables or input parameters with no
default values, provide answers to the prompts in the Variable Manager wizard and click OK.
7. In the Query Panel, drag dimensions and measures you want to include in the query in the Result Objects
pane.
Note
On an OLAP connection, the dimensional query panel opens so you can use the Member Selector on
SAP HANA hierarchies. For SAP HANA HTTP connections, the features available in the query panel are
equal to that of BEx queries.
8. Select the objects on which you want to dene query lters and drag them to the Query Filters pane. To
create a quick lter on an object, select the object in the Result Objects pane then click the Add a quick
lter icon in the Result Objects toolbar.
9. Set the scope of analysis and other query properties.
10. Click Run Query.
Related Information
HANA query prompts in Web Intelligence [page 209]
3.2.9.3 Dening query limits
SAP HANA Direct Access data providers use transient universes, which means that they bypass universes and
therefore do not oer the same range of settings compared to other data providers.
Your database administrator can set query limits directly at the connection level in information desing tool and
universe design tool for relational connections, or in the CMC for OLAP connections.
SAP BusinessObjects Web Intelligence User's Guide
Building and running queries
P U B L I C 145
These limits the amount of data returned by a query:
● Query Execution Timeout: limits the time for the query execution. The limit is expressed in seconds.
● Max Cells: limits the number of cells returned by a query. This restricts the number of cells returned, but
does not restrict the database from processing all cells in the query. It only limits the number once the
databases has started to send rows.
Note
This setting is only available for SAP HANA OLAP connections.
● Max Rows: limits the number of rows returned by a query. This restricts the number of rows returned, but
does not restrict the database from processing all rows in the query. It only limits the number once the
databases has started to send rows.
Note
This setting is only available for SAP HANA relational connections.
Query limits are supported in SAP HANA Online mode.
Related Information
Retrieving partial results [page 156]
3.2.9.4 To dene query limits for SAP HANA OLAP
connections
You can limit the amount of time a query can run of the numbers of cells you wan the database to retrieve.
Context
Procedure
1. On the CMC home screen, click OLAP connections.
2. Right-click an SAP HANA connection.
3. Click Organize Edit .
4. In the Maximum Number of Cells and Query Timeout entry elds, set the limits you want to apply to the
connection.
146
P U B L I C
SAP BusinessObjects Web Intelligence User's Guide
Building and running queries

3.2.9.5 Managing mandatory variables with the Variable
Manager
The Variable Manager is a wizard that lets you to manage the variables of a data source. Use it to answer
prompts for SAP HANA variables and input parameters in documents that use SAP HANA views as data
sources.
The Variable Manager is displayed before the query panel so that you can:
● View available data source variables coming from the database
● Set or edit values for every data source variable
● Fix or prompt values of data source variables upon refresh with the Set as prompt option for each SAP
HANA variable
The Variable Manager is available when you edit or add new data providers to a document based on an SAP
HANA view. It is displayed automatically if the SAP HANA view has at least one mandatory input parameter or
SAP HANA variable without a default value. If there are mandatory or optional input parameters or SAP HANA
variables with default values, you can still access the
Variable Manager. Click the Variable Manager icon ( ) in
the Query Panel to change the values or the prompts.
You can also use the default values dened in SAP HANA Studio. To do so, check the Use BEx/HANA dened
default values at runtime option.
3.2.9.6 To merge or unmerge SAP HANA variables
You can merge or unmerge SAP HANA variables in a Web Intelligence.
Context
This is useful when a Web Intelligence document has multiple data providers based on the same SAP HANA
view.
Procedure
1. Go to the document properties.
2. Check or uncheck Merge prompts (BEx or HANA Variables) to merge or unmerge SAP HANA variables.
SAP BusinessObjects Web Intelligence User's Guide
Building and running queries
P U B L I C 147

3.2.9.7 Formulas for Web Intelligence HANA Direct Access
data providers
Once you have created an SAP HANA Direct Access data provider in a Web Intelligence document, you can use
the Data Provider functions.
The following table describes the expected values for the Data Provider functions based on SAP HANA Direct
Access.
Data Provider Function
Expected value for HANA Direct Access Data Provider
Connection(dp) 'DB Layer : "my-dbLayer". DB Type : "my-dbType"' for SAP
HANA Direct Access Data Provider (as for universe data pro
viders)
'DB Layer : "JDBC". DB Type : "HANA"'
DataProvider(obj)
Name of the data provider, for example, 'Query 1 on MyHA
NAView'
DataProviderKeyDate(dp) Empty string ('')
DataProviderKeyDateCaption(dp) Empty string ('')
DataProviderSQL(dp) SQL/MDX script of the data provider, for example, 'SELECT *
FROM COUNTRY'
DataProviderType(dp) SAP HANA Direct Access
IsPromptAnswered([dp;]prompt_string) Determines whether a prompt has been answered for this
data provider
LastExecutionDate(dp) Date on which a data provider was last refreshed
LastExecutionDuration(dp) Time in seconds taken by the last refresh of a data provider
LastExecutionTime(dp) Time at which a data provider was last refreshed
NumberOfDataProviders() Number of data providers in a report
NumberOfRows(dp) Number of rows in a data provider
RefValueDate() Date of the reference data used for data tracking
RefValueUserResponse([dp;]prompt_string[;Index]) Response to a prompt when the reference data was the cur
rent data
UniverseName(dp) Name of SAP HANA view used by SAP HANA Direct Access
Data Provider
UserResponse([dp;]prompt_string[;Index]) Response to a data provider prompt
QuerySummary(dp) Query Specication Summary used by SAP HANA Direct Ac
cess Data Provider
148 P U B L I C
SAP BusinessObjects Web Intelligence User's Guide
Building and running queries

3.2.10 Building queries on SAP HANA views in SAP HANA
Online mode
In SAP HANA Online mode, you can create Web Intelligence documents with live data leveraging the power of
SAP HANA.
You can use SAP HANA Online mode to build queries on SAP HANA views and delegate every calculation or
operation to SAP HANA. When you delegate calculations to SAP HANA, Web Intelligence no longer needs to ll
its cache in order to create queries and can bypass the Query Panel. As a result, you can create queries on the
y in a transient universe. This enables quicker interactions between Web Intelligence and SAP HANA and
provides better performance for data refresh.
The SAP HANA view metadata correspond to the transient universe available objects and are displayed in the
Web Intelligence report outline as available objects. You can create or insert report blocks using these data
source objects. In SAP HANA Online mode, every report operation that requires a calculation is delegated to
SAP HANA via a query execution that only returns data you actually need.
If you need to use a feature or function that SAP HANA Online mode does not support, you can switch to the
classic oine mode at any given time.
The following clients support SAP HANA Online mode:
● Web Intelligence HTML interface
● Web Intelligence Applet interface
● Web Intelligence Rich Client (in Online mode only)
Restriction
● SAP HANA Online mode is available for secured HANA relational connections only. You cannot use
personal connections dened in information design tool (IDT) or universe design tool (UDT).
● SAP HANA ODBC connections are not supported.
3.2.10.1 User interface limitations in Design mode
The Design mode is the default perspective when you create or modify a Web Intelligence document. However,
since the online mode does not support every feature present in oine mode, there are few modications in
the user interface and menu toolbars.
SAP BusinessObjects Web Intelligence User's Guide
Building and running queries
P U B L I C 149

Pane modications
Pane Description
Documents Summary
Use this pane to read, print and edit the document sum
mary.
The following options can be checked/unchecked:
● Refresh on open
● Permanent regional formatting
● Hide warning icons in charts
● Merge prompts
Navigation Map
Use this pane to navigate and switch through reports.
Input Control Use this pane to add or reset input controls and change lter
values. You can also show the input control map.
User Prompt Input
Use this pane to change the values set in prompt input for
SAP HANA variables and input parameters.
Note
Only for the DHTML client.
Available Objects
In SAP HANA Online mode, the SAP HANA view metadata
corresponding to the transient universe objects are dis
played in the report outline as available objects for the docu
ment.
Document Structure and Filters
Use this pane to view and modify the document structure.
The only change concerns the Hide cell/table and Format ta
ble options at the block table/chart/cell level. The following
options can be checked/unchecked:
● Show table headers
● Show table footers
● Hide always
Comments
Use this pane to manage comments in your document.
Shared Elements
Restriction
Shared elements aren't supported in SAP HANA Online
mode.
150 P U B L I C
SAP BusinessObjects Web Intelligence User's Guide
Building and running queries
Menu toolbar modications
Menu Description
Quick Commands The Edit Query button is deactivated.
Report Elements In the Behavior Tab, only the Hide option is enabled.
Data Access
● New Data Providers becomes New Data Source: users
can add new SAP HANA views
● Purge Data becomes Reset Prompts: reset or purge an
swer values for SAP HANA variables or input parame
ters
● New menu called New Variable: insert new variables
(measures only)
● The Merge Objects, Change Source and Export Data
panes are deactivated
Analysis
● The Group menu is deactivated
Formatting and Page Setup
● The Formula Bar is available with a restricted list of for
mula functions supported in SAP HANA Online mode.
This means that the formula editor displays only func
tions/operators supported in SAP HANA Online mode.
● The Status Bar displays the current status of the docu
ment, either online or oine.
3.2.10.2 To create a document in SAP HANA Online mode
Context
Procedure
1. Click the New icon in the File toolbar.
2. Click SAP HANA Online.
3. Select a secured SAP HANA relational connection.
4. Select a SAP HANA calculation view or a SAP HANA analytic view.
You can also search for a SAP HANA view on a given SAP HANA connection via the search bar.
5. Click OK.
SAP BusinessObjects Web Intelligence User's Guide
Building and running queries
P U B L I C 151

Note
If you are querying a SAP HANA view that uses input parameters, then when you run the query, you can
encounter prompts that require you to enter values for variables and parameters. The values available
in the prompts come directly from the SAP HANA view.
6. Provide answers for the SAP HANA variables and input parameters.
7. Click OK.
Objects are now visible in the report outline.
8. Drag and drop objects in the report to create or modify report blocks.
3.2.10.3 To add a new data source
You can have multiple SAP HANA views for a single document.
Context
When you add a data source, its available objects are displayed in the report outline under the name of the SAP
HANA view.
Procedure
1. Click New Data Source.
2. Select a secured SAP HANA relational connection.
3. Select a SAP HANA calculation view or a SAP HANA analytic view.
You can also search for a SAP HANA view on a given SAP HANA connection using the search bar.
4. Click OK.
Note
If you are querying a SAP HANA view that uses input parameters, then when you run the query, you can
encounter prompts that require you to enter values for variables and parameters. The values available
in the prompts come directly from the SAP HANA view.
5. Provide answers for the SAP HANA variables and input parameters.
6. Click OK.
New available objects are displayed in the report outline under the name of the SAP HANA view.
152
P U B L I C
SAP BusinessObjects Web Intelligence User's Guide
Building and running queries
3.2.10.4 To remove a data source
When you remove a SAP HANA view data source from a document in SAP HANA Online mode, all report blocks
based on this SAP HANA view are removed automatically from the document.
Context
Procedure
1. In the Available Objects pane, right-click an SAP HANA view you want to remove.
2. Click Delete.
3.2.10.5 To reset prompts
You can reset or purge all answer values for HANA variables or input parameters in a document in SAP HANA
Online mode.
Context
Procedure
1. In the Data Access tab, click Reset Prompts.
2. When asked if you are sure you want to reset prompts, click OK.
SAP BusinessObjects Web Intelligence User's Guide
Building and running queries
P U B L I C 153

3.2.10.6 To switch to Web Intelligence oine mode
You can go back to Web Intelligence Classic mode at any given time.
Context
SAP HANA Online mode does not support every feature available in Classic mode. When you leave SAP HANA
Online and switch to Classic mode. Make sure that you save the document before disconnecting.
Note
SAP HANA Online cannot be reactivated in the document you are working on once you have left it. If you
leave SAP HANA Online without saving the document rst, it is converted to a normal Web Intelligence
document.
Procedure
1. In the Data Access tab in the toolbar, click Disconnect from SAP HANA.
You are prompted to save the document before disconnecting. If you have not saved the document, click
Cancel and save the document.
2. Click Disconnect.
3.2.10.7 Formulas, functions and operators in SAP HANA
Online mode
You can add formulas in tables or charts using the formula editor. The formulas available in SAP HANA Online
mode are restricted, and the formula editor will only display formulas that are available.
Refer to Using functions, formulas and calculations in Web Intelligence to see the full list of supported formulas,
functions and operators.
Note
Extended syntax keywords are not supported in SAP HANA Online mode.
154
P U B L I C
SAP BusinessObjects Web Intelligence User's Guide
Building and running queries

3.2.10.8 Providing answers to SAP HANA variables or input
parameters
The SAP HANA view that you have selected when you created a document might contain SAP HANA variables
and input parameters that need to be answered before you can create queries.
Providing answers to SAP HANA variables or input parameters means that you declare a value for every
variable of input parameter that requires one. In SAP HANA Online mode, you must answer SAP HANA
variables and input parameters whenever you create or refresh a document.
When you answer variables or prompts that have a default value, it means that they are mandatory and that
you must answer them. You can skip optional variables or prompts.
3.2.10.9 Refreshing data
In SAP HANA Online mode, you can refresh the entire document.
When you refresh a document in SAP HANA Online mode, every report block in the entire document is
refreshed. Having multiple tables in a report generates multiple queries on SAP HANA that can aect
performance.
You might run a single query for instance that is split between ve dierent tables, all based on the same data
provider. When you refresh the document, Web Intelligence generates ve dierent queries on SAP HANA to
refresh the ve tables.
Note
If an SAP HANA view contains SAP HANA variables or input parameters, you will be prompted to provide
prompt answers values before you can refresh the document.
Related Information
Providing answers to SAP HANA variables or input parameters [page 155]
3.2.10.10 Navigation paths
When drilling in SAP HANA Online mode, you drill along what is called a navigation path. It corresponds to the
dimension hierarchies contained in the SAP HANA view on which the document you are working on is based.
In the Available Objects pane, you can view navigation paths. Using navigation paths, you can see how Web
Intelligence drills in your data and navigate through SAP HANA objects.
The navigation path is generated from the level-based hierarchies of the SAP HANA view on which the
document is based. To each level-based hierarchy corresponds a navigation path, and levels of a hierarchy
correspond to levels of the navigation path.
SAP BusinessObjects Web Intelligence User's Guide
Building and running queries
P U B L I C 155

3.2.10.11 To display navigation paths
Display navigation paths whenever you want to see how drilling has been performed on your data.
Context
Make sure your document is based on an SAP HANA view that contains level-based hierarchies.
Procedure
1. Click the Available Objects pane.
2. Click Arranged by at the bottom of the pane.
3. Click Navigation paths.
Results
You can now see the navigation path in the Available Objects pane.
3.2.10.12 Retrieving partial results
In the SAP HANA options, you can limit the results returned in data blocks by Web Intelligence when running a
query.
The data retrieved is restricted by default to a limit of 5000 rows, and the timeout limit is set to 60 seconds.
If the retrieved data of at least one of the data blocks exceeds the limits set in the SAP HANA options, a partial
result set is returned when you refresh the document. A warning icon displayed in the status bar and in the data
blocks lets you know if they display partial results. It is possible to hide the warning icon displayed in a chart or
a table. In the document properties, check Hide warning icons in charts and tables.
Caution
Make sure that the values you enter correspond to the values set by your administrator at a connection
level. If the values you enter in Web Intelligence exceed the values set by your administrator, they are not
taken into account during the data retrieval.
156
P U B L I C
SAP BusinessObjects Web Intelligence User's Guide
Building and running queries

Max Rows
If you want the database to return only a partial result set, you can limit the number of rows retrieved.
Whenever the limit is exceeded, the query stops and the database returns a partial result set.
This option is available in the Data Access Options menu.
Query Execution Timeout
You can set a time limit for queries. Whenever the timeout limit is exceeded, the query stops and the database
returns a partial result set.
This option is available in the Data Access Options menu.
Related Information
Max rows retrieved query property [page 93]
To set the maximum amount of time a query can run [page 95]
3.2.10.13 Displaying online query statistics per block
Use the Online Query Statistics command to see the query statistics for each data block in a Web Intelligence
document based on SAP HANA online.
This command is only available in With Data mode inside the Design mode.
This option provides the following information:
● Data source: name of the SAP HANA view
● Last execution date: date when the query was last run
● Last execution duration: duration of the refresh
● Last execution time: time when the query was last run
● Number or rows: number of rows retrieved
● Status: indicates whether the data block displays a partial result set or all data
SAP BusinessObjects Web Intelligence User's Guide
Building and running queries
P U B L I C 157

3.2.10.14 To display online query statistics per block
Context
Procedure
1. Right-click a data block.
2. Select Online Query Statistics.
3.2.11 Building queries on relational connections using Free-
Hand SQL statements
In Web Intelligence, you can use a Free-hand SQL (FHSQL) statement to query an RDBMS database.
FHSQL data providers are useful when you have complex SQL statements that use advanced database
functions not supported by the standard semantic layer. You can copy, paste or write new statements using the
Query Script Editor, dene prompts with static lists of values, use existing secured relational connections to the
database, and parse statements for SQL errors.
FHSQL data providers use secured relational connections which accept SQL statements. The BI administrator
publishes these connections in the CMS using the SAP BusinessObjects Universe Design Tool or SAP
BusinessObjects Information Design Tool.
In 4.2 SP4, a new connection security right gives BI administrators the possibility to decide whether creating
and running custom SQL scripts is allowed on a given relational connections. If the right is denied, the
connection doesn't appear when creating a document based on an FHSQL data source or adding a new FHSQL
data provider to an existing document. The Use connection for Free-Hand SQL scripts right can be managed in
the Central Management Console. It is denied by default for every relational connection, and your BI
administrator has to explicitly grant it. This right works together with the Query script – enable viewing (SQL,
MDX…) right. Make sure that you have both rights granted.
Restriction
● If you use SQL statements that return multiple result sets, only the rst result set will be displayed; the
others will be ignored.
● You cannot use the Change Source Wizard with FHSQL queries.
158
P U B L I C
SAP BusinessObjects Web Intelligence User's Guide
Building and running queries

Reusing Desktop Intelligence documents in Web Intelligence
Using the Report Conversion Tool, you can convert a Desktop Intelligence document into a Web Intelligence
document based on FHSQL statement. You can then open the document in Web Intelligence and in the Query
Panel edit the statement.
For more information on FHSQL report conversions, refer to the Report Conversion Tool Guide.
3.2.11.1 To build a query using a Free-hand SQL statement
You can query an RMDBS database using a Free-hand SQL (FHSQL) statement. As of SAP BusinessObjects
Web Intelligence 4.2 SP4, you can now edit queries based on FHSQL data providers using the HTML interface.
Procedure
1. Click New Free-Hand SQL .
You can also add a FHSQL data provider to an existing document by clicking the Data Access tab, then, in
the Data Providers subtab, click Edit Add Query From FHSQL .
2. Select a relational connection.
3. Enter or paste a SQL statement.
4. Click Validate to check the statement for SQL errors.
Web Intelligence runs the SQL against the database and displays any error message that the database
returns. Refer to the following topic for keys you should not use: Unsupported keywords in FHSQL SQL
statements [page 163]
When you submit a modied SQL statement, it is checked rst by the database. If the SQL is invalid, then
the SQL changes are not applied. If the SQL is valid, the FHSQL data provider saves it and applies it
automatically to the data source, making the following updates:
1. Any new SQL columns are added in the data source as new objects.
2. The SQL columns with the same name and data type as existing data source objects are retained.
3. Old data source objects are deleted if they did not map with the newly retrieved SQL columns.
5. Once you have resolved any SQL errors, click OK to accept the SQL statement.
6. In the Query Panel, you can do the following:
○ View the objects in the query.
○ Edit the properties of the data source objects.
○ Change the FHSQL connection.
○ Access the SQL for editing using the Edit SQL button.
7. Click Run Query.
SAP BusinessObjects Web Intelligence User's Guide
Building and running queries
P U B L I C 159
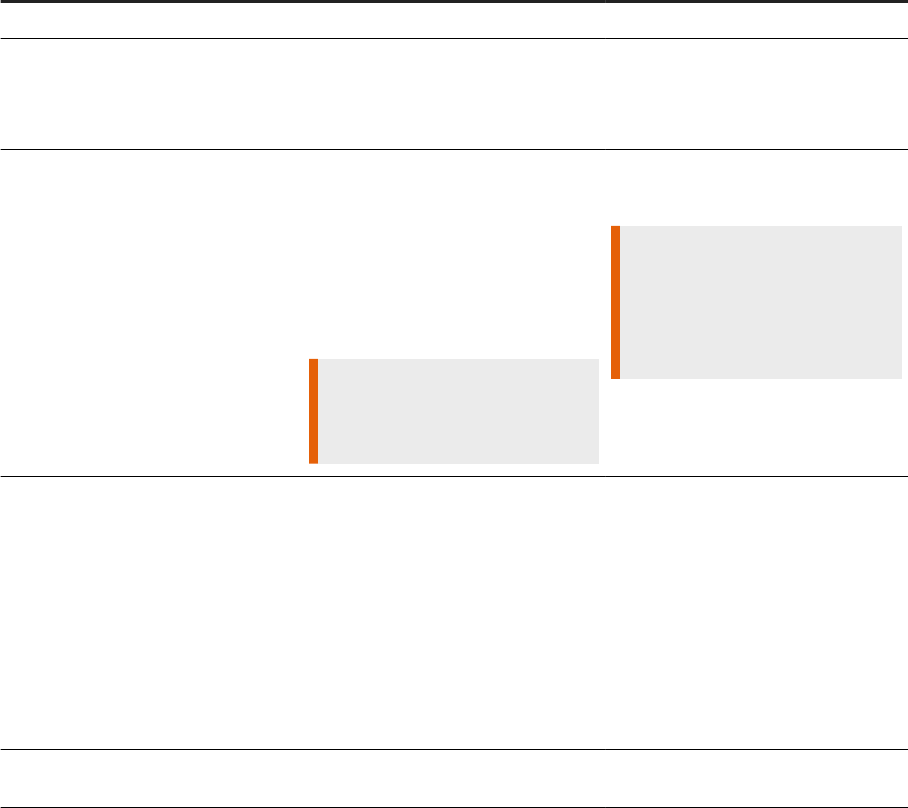
3.2.11.2 The FHSQL data provider conguration options in
the Query Panel
When you have set a valid connection to the data source, the FHSQL data provider connects to the database in
order to parse the SQL.
If the SQL is valid, a set of result objects appears in the Query Panel. The following table lists the default values
for the Object Properties in the Query Panel.
Data source object property
Default values Actions you can perform
Name Column name Change the column or object name.
Qualication
● Dimension for STRING and DATE/
DATETIME data type
● Measure for NUMBER data type
Change the object qualication.
Possible values include Dimension,
Measure, and Attribute.
Type
● STRING for SQL characters such
as VARCHAR, LONGVARCHAR,
and so on
● NUMBER for SQL numeric objects
such as INT, FLOAT, DOUBLE, and
so on
● DATE for SQL Date, SQL DateTime
or SQL Timestamp
Restriction
FHSQL does not support SQL
BLOB/BINARY data types.
Use values such as STRING, NUMBER,
and DATE/DATETIME.
Restriction
● You cannot change the object
data type.
● A given data type must match
the SQL data-type mapping
.
Aggregate Function
SUM for Measure.
For other objects, there is no default
value.
Change the object aggregation function
for measures.
Possible values include:
● None
● Sum (by default)
● Max
● Min
● Count
● Average
Associated Dimension
No default value Change the object-associated dimen
sion for the attribute (ex-detail).
160 P U B L I C
SAP BusinessObjects Web Intelligence User's Guide
Building and running queries

FHSQL Query Properties
In the Query Properties, you can edit the query name, change the connection, and manage the following refresh
options:
Refresh option
Description
Max Rows Retrieved
By default, this option is disabled and there is no limit to the
number of rows retrieved. You can set the range value to
[0,¥]. If you do this, the FHSQL data provider limits the num
ber of rows retrieved to the maximum rows given and re
turns a partial result set.
For more information on this option, see Max rows retrieved
query property [page 93].
Max Retrieval Time (s)
By default, this option is disabled and there is no limit to the
query execution time.
You can set the Max Retrieval Time (s) (in seconds) to the
range value of [0,¥]. If you do this, the FHSQL data provider
controls the query time; stopping it if it exceeds the given
timeout. It returns a partial result set of whatever data is al
ready fetched when the timeout occurred.
3.2.11.3 Using the @Variable and @Prompt functions in
FHSQL SQL statements
You can use the @Variable and @Prompt functions in FHSQL statements in Web Intelligence.
For general information on working with these functions, refer to the Information Design Tool User Guide or the
Universe Design Tool User Guide.
@Variable functions and FHSQL
You can use the @Variable syntax in SQL statements to insert BusinessObjects variables into the SQL. The
FHSQL data provider substitutes these variables before executing the SQL.
Restriction
FHSQL does not support User Attributes as congurable in the CMC User Attribute Management area in
the @Variable syntax.
SAP BusinessObjects Web Intelligence User's Guide
Building and running queries
P U B L I C 161
@Prompt functions and FHSQL
When a user selects a value in a prompt, FHSQL data provider substitutes this value for the @Prompt syntax
and then executes the SQL against the database to retrieve data.
When the FHSQL parses the @Prompt syntax in order to validate the SQL or get the data structure, the FHSQL
data provider substitutes the @Prompt syntax with:
● Default values (if set)
● The rst values of the associated static LOV (if set)
● Placeholders if no default values or static LOV are dened:
Prompt Data Type
Value
STRING 'string'
NUMBER 0
DATE Current Date
Restriction
Optional prompts are not supported.
3.2.11.4 Formulas for Web Intelligence FHSQL data providers
Once you have created a FHSQL data provider in a Web Intelligence document, you can use the Data Provider
functions.
The following table describes the expected values for the Data Provider functions when you use a FHSQL
statement to create a query.
Data Provider Function
Expected value for FHSQL Data Provider
Connection(dp)
'DB Layer: "my-dbLayer". DB Type: "my-dbType"' (as for uni
verse data providers)
For example, 'DB Layer: "JDBC". DB Type : "Oracle 11"'
DataProvider(obj)
Name of the data provider, for example, 'SQL 1 on MyCon
nection'
DataProviderKeyDate(dp) Empty string ('')
DataProviderKeyDateCaption(dp) Empty string ('')
DataProviderSQL(dp) SQL statement of the data provider, for example, 'SELECT *
FROM COUNTRY'
DataProviderType(dp) 'FreeHandSQL'
162 P U B L I C
SAP BusinessObjects Web Intelligence User's Guide
Building and running queries

Data Provider Function Expected value for FHSQL Data Provider
IsPromptAnswered([dp;]prompt_string)
Determines whether a prompt has been answered
for this data provider
LastExecutionDate(dp) Date on which a data provider was last refreshed
LastExecutionDuration(dp) Time in seconds taken by the last refresh of a data provider
LastExecutionTime(dp) Time at which a data provider was last refreshed
NumberOfDataProviders() Number of data providers in a report
NumberOfRows(dp) Number of rows in a data provider
QuerySummary(dp) Empty string ('')
RefValueDate() Date of the reference data used for data tracking
RefValueUserResponse([dp;]prompt_string[;Index]) Response to a prompt when the reference data was the cur
rent data
UniverseName(dp) Empty string ('')
UserResponse([dp;]prompt_string[;Index]) Response to a data provider prompt
3.2.11.5 Unsupported keywords in FHSQL SQL statements
Web Intelligence does not support certain DDL SQL keywords or commands in FHSQL SQL statements.
The unsupported DDL SQLs keywords and commands are:
● DROP TABLE [table]
● TRUNCATE TABLE [table]
● DELETE FROM «table» WHERE [condition]
● CREATE TABLE [table]
● ALTER TABLE [table]
● INSERT
● UPDATE
3.2.12 Building queries on Analysis View data sources
SAP BusinessObjects Analysis is an OLAP analysis tool that allows users to interactively dene analyses to
explore data in OLAP data sources.
Users can export data in their analysis as Analysis Views, for use in other applications including SAP
BusinessObjects Web Intelligence.
You can build queries on Analysis Views to analyze their data in Web Intelligence documents. The data in the
Analysis View appears in the Query Panel as report objects such as hierarchies, dimensions and attributes.
SAP BusinessObjects Web Intelligence User's Guide
Building and running queries
P U B L I C 163
Note
Queries built with SAP BusinessObjects Analysis and based on SAP HANA views are not supported in Web
Intelligence. In general, Analysis Views with custom objects are not supported. Only analysis views coming
directly from SAP BW are supported.
3.2.12.1 To build a query on an Analysis View
You can build a query on an Analysis View in the Web Intelligence Applet interface or Web Intelligence Rich
Client.
Procedure
1. Open a Web Intelligence document in Design or Data mode, select Data Access New From Analysis
View to display the Select an Analysis View dialog box.
2. To build a query using a text le, do one of the following:
○ Click New in the File menu, select Analysis View and click OK.
○ In the Create a new Web Intelligence Document dialog box, select Analysis View as the data source.
○ In the Data Access tab, in the Data Providers subtab, select From Analysis View from the New Data
Provider dropdown list.
3. Select the folder containing the Analysis View from the Folders list.
4. Select the Analysis View in the Side Panel.
The Query Panel appears, displaying the data in the Analysis View as a report object.
5. Click Run Query. When you have more than one query and you want to run just one query, click Run
Queries and select the query that you want to run.
3.2.13 Building queries on web service data sources
In the Web Intelligence Rich Client, the Web Services plug-in enables you to create a document using
"Document as a Web Service" (DaaWS) as a data source.
Note
You cannot use web service data sources in documents in the Web Intelligence Applet or HTML interfaces.
Although this plug-in is developed for DaaWS consumption, it can also be used for generic Web Service with the
following properties:
● Simple Object Access Protocol (SOAP) 1.1
● Web Services Description Language (WSDL) 1.0
● Document and RPC literal
164
P U B L I C
SAP BusinessObjects Web Intelligence User's Guide
Building and running queries

● Public WSDLs
For generic web services, Web Intelligence Rich Client does not support:
● Schemas with cyclic references
● Nested imports, only one level of imports is supported
● Attribute elements in an XML schema
● Schemas referring to specic platforms like Microsoft or Java types like: http://microsoft.com/wsdl/
types/, maps, objects and so on.
Note
For information on how to develop, congure, and deploy Custom Data Provider Plug-in, see the Custom
Data Provider Plug-in Developer Guide.
3.2.13.1 Prerequisite for using the Web Service plug-in
Before you use the Web Service plug-in to create a Web Intelligence document, the BI administrator must
ensure you have a DaaWS or a generic web service WSDL as input to the Web Service plug-in. DaaWS exposes
a set of Web Intelligence report part contents as a web service that can be called within and outside of Web
Intelligence clients.
For more information on creating a DaaWS WSDL, see the related topic below.
Related Information
Sharing content with other applications [page 861]
3.2.13.1.1 Proxy settings for the Web Service plug-in
When using internet proxy server to access any URLs or WSDLs through the Web Service plug-in, the BI
administrator must update the proxy settings in the net.properties le located at: <BOBJ_INST_DIR>/SAP
BusinessObjects Enterprise XI 4.1/win64_x86/jdk/jre/
with the following information:
● Provide the values for the following HTTP parameters:
http.proxyHost= <http proxy hostname>
http.proxyPort=<http proxy port number>
http.nonProxyHosts=<http hosts for which proxy is not
required>
Where:
○ proxyHost is the name of the proxy server. For example, proxy.mydomain.com
○ proxyPort is the port number to use. By default, the value is 80.
○ nonProxyHosts is list of hostnames separated by '|' which can be accessed directly within the
network, ignoring the proxy server. The default value is: localhost & 127.0.0.1
SAP BusinessObjects Web Intelligence User's Guide
Building and running queries
P U B L I C 165
● Provide the following values for HTTPS parameters:
https.proxyHost=<http proxy hostname>
https.proxyPort=<http proxy port number>
Where:
○ proxyHost is the name of the proxy server. For example, proxy.mydomain.com
○ proxyPort is the port number to use. By default the value is 443. The HTTPS protocol handlers use
the http nonProxyHosts list.
Note
The .pac les are not supported. The BI administrator has to explicitly congure the proxy server in
the proxy settings.
3.2.13.2 To build a query based on a web service
Context
You can build queries that use Document as a Web Service (DaaWS) or any generic web service as a data
source.
Procedure
1. Launch Web Intelligence Rich Client and connect to the CMS that is congured for web services.
2. To build a query using a web service as a data source, do one of the following:
○ Click New in the File menu, and select Web Services.
○ In the Create a new Web Intelligence Document dialog box, select Web Services as the data source.
○ In the Data Access tab, in the Data Providers subtab, select From Web Service from the New Data
Provider dropdown list.
3. Enter the URL from the QaaWS service in the Source Path text box and click Submit.
Note
This URL must be to a CMS enabled for web services.
Sample URL: http://dewdftv00458q.dhcp.corp:80/ dsws/qaawsservices/biws?WSDL=1&
cuid=AcFqxUlcxKVPtBMyI4M1ziY
Where:
Server name: http://dewdftv00458q.dhcp.corp:80/
Web service: dsws/qaawsservices/biws?WSDL=1&
CMS ID: cuid=AcFqxUlcxKVPtBMyI4M1ziY
166
P U B L I C
SAP BusinessObjects Web Intelligence User's Guide
Building and running queries
The Service Details and Message Details sections appear in the same dialog box.
4. In the Service Details section, set the following if they are not congured by default:
a. From the Service Name dropdown list, select the QaaWS service.
b. From the Port Name dropdown list, select the port name.
c. From the Operation Name dropdown list, select the operation name.
5. To enable SSO authentication, select the SSO Enabled check box.
Note
If SSO has not been enabled on the CMS, this option is not visible in the dialog box.
If you select the SSO Enabled check box, the login and password cannot be congured.
In SSO authentication, the session ID of Web Intelligence is used for authentication. When you log onto
Web Intelligence Rich Client using the Windows NT or Standalone authentication mode, the SSO option is
disabled. Hence, you must enter the login credentials to access the web service. When logging into Web
Intelligence Rich Client using any other authentication modes, you can either provide login and password
information or use the SSO authentication mode to access web services.
Note
The SSO authentication is supported only if the Web Intelligence Rich Client is connected to the CMS
on which the web service is deployed. Otherwise, you must provide login credentials to access the web
service. If the Web Intelligence Rich Client is connected to a dierent CMS, you cannot refresh the
documents created by using SSO authentication.
6. If you are not using SSO authentication, provide authentication details:
a. If the SSO Enabled option is available in the dialog box, ensure that it is not selected.
b. In the Message Details section, from the Input Message list, select login, enter the CMS user name in
the "Enter Value" text box.
c. In the same list, select password, enter the password for the CMS user in the Enter Value text box, and
click Apply.
7. To set a report lter for the GetReportBlock operation, do the following:
a. In the Message Details section, from the Output Message list, click + to expand the dimension on which
a lter has to be applied.
b. Select an object, enter a value in the Enter Value text box, and click Apply.
c. Select operator, and select a value from the Select Value dropdown list.
Note
Specify the value and operator only for the dimensions to which you want to apply the lter.
8. To set lters for a generic web service, do the following:
a. In the Message Details section, from the Input Message list, select an input eld, enter a value in the
Enter Value eld.
b. In the Output Message list, select output elds.
You must select at least one eld in the Output Message panel. To select multiple elds in the Output
Message panel, press the Control key, and select the elds.
9. Click Next.
SAP BusinessObjects Web Intelligence User's Guide
Building and running queries
P U B L I C 167

Note
You can use the Reset button to remove the value for each eld in the Message Details section of the
Select Web Service details panel. The Reset All button can be used to remove the values for all the elds
in the Message Details section.
Results
The Query Panel appears. Save the query and congure it as necessary.
Related Information
BI service structure [page 867]
GetReportBlock_<blockname> [page 867]
Drill_<blockname> [page 870]
3.2.13.3 To edit a query based on a web service
Procedure
1. In Web Intelligence Rich Client, open the document in Design or Data mode.
2. In the Data Access tab, in the Data Providers subtab, click Edit.
3. Edit the following query parameters in the Query Panel:
○ Object Properties: You can edit the object properties such as name, qualication, type, aggregate
function, and aggregate dimension.
○ Query Properties: You can edit query properties such as Name, Source URL, Refreshable, and Editable.
Note
If you edit the source URL in the Query Panel, ensure that the new URL from the QaaWS service
has the same structure as the WSDL that it replaces.
○ Query Denition: You can edit the query denition by clicking Edit settings.
4. Click Run query to apply your changes.
Results
A new report is displayed.
168
P U B L I C
SAP BusinessObjects Web Intelligence User's Guide
Building and running queries

Next Steps
For information on creating Custom Data Provider plug-in, see the Custom Data Provider Plug-in Developer
Guide.
3.2.14 To create a query on a dierent data source in an
existing document
If you have the right to edit queries in the Web Intelligence Rich Client or Applet interface, then you can selected
additional data sources in an existing document.
Procedure
1. Open a Web Intelligence document in Design or Data mode.
2. In the Data Access tab, in the Data Providers subtab, select a data source from the New Data Provider
dropdown list.
3. Build and run the query.
Related Information
Changing the data source of a query [page 177]
3.2.15 The Data mode in Web Intelligence
You can use the Data mode in the Web Intelligence Applet interface and Web Intelligence Rich Client to view,
explore and manage all the queries in a document.
In Data view, only the toolboxes in the Data Access tab are available.
Note
Data mode is not available in the Web Intelligence HTML interface.
SAP BusinessObjects Web Intelligence User's Guide
Building and running queries
P U B L I C 169

3.2.15.1 To view and lter the data in a data provider
You can lter data in a data provider based on the values you specify.
Procedure
1. Open a Web Intelligence document in Web Intelligence Rich Client or the Web Intelligence Applet interface
in Data mode.
2. Double-click a data provider to open it.
Note
If the data provider contains multiple contexts or grouping sets, they appear in a dropdown list at the
top right of the list pane. Each context or grouping set appears as Result n. Select a context or grouping
set from the list to display its data.
3. To lter the data, click the arrow on a column header and do one of the following:
○ Select a value from the dropdown list.
○ Select Custom and dene a custom lter.
A custom lter contains a lter operators and values that you select from the list of values or type
directly. The number of values you can specify depends on the operator.
The custom lters are as follows:
Operator Description
is anything The data is not ltered.
is The data is equal to a single value, which is the same
action as selecting a single value from the dropdown
list.
does not equal The data is not equal to a single value. All values apart
from that value are displayed.
is in The data is in a list of values. Only the selected values
are displayed.
is not in The data is not in a list of values. All values apart from
the selected values are displayed.
is empty Only rows with empty values are displayed.
is not empty Only rows with non-empty values are displayed.
begins with Only rows that begin with the text you type are
displayed.
ends with Only rows that end with the text you type are displayed.
contains Only rows that contain the text you type are displayed.
does not contain Only rows that do not contain the text you type are
displated.
170 P UB L I C
SAP BusinessObjects Web Intelligence User's Guide
Building and running queries

The lter also restricts the display in the other column. For example, if you lter the column for the
Customer dimension to show three values only, the Order Amount column displays only the values that
correspond to the remaining Customer values.
3.2.15.2 To switch to Data mode
In the Web Intelligence Applet interface or Web Intelligence Rich Client you can access the Data mode.
Procedure
1. Open a Web Intelligence document in the Web Intelligence Applet interface or Web Intelligence Rich Client.
Note
Data mode is not available in the Web Intelligence HTML interface.
2. Click Data in the top toolbar.
The data providers used in the query are listed, along with information about the data provider, such as the
number or rows it contains and its last refresh date.
3.2.15.3 To manage queries using the Data Manager
You can view, explore and manage all the queries in a document using the Data Manager.
Context
The Data Manager lists all the queries and allows you to perform actions such as renaming a query or changing
the source of the data on which a query is based.
Procedure
1. Open a Web Intelligence document in Web Intelligence Rich Client or the Web Intelligence Applet interface
in Data mode.
The Data mode lists the objects in the selected query. Only the toolbox items relevant to managing queries
are available.
2. Do one of the following:
○ To refresh a query, right-click it in the list and select Refresh.
SAP BusinessObjects Web Intelligence User's Guide
Building and running queries
P U B L I C 171

○ To edit a query, right-click it and select Edit, or in the Data Providers tab, click Edit. The Query Panel for
the query you selected appears.
○ To purge a query of data, do one of the following:
○ Right-click it and select Purge from the menu.
○ Click Purge in the Data Provider tab.
○ To delete a query, right-click it in the list and select Delete.
○ To rename a query, right-click it and select Rename, then type the new name.
○ To copy a query, right-click it in the list and select Copy.
○ To change the data source:
○ In the list of data providers, right-click the query whose source you want to change and select
Change Source.
○ In the Data tab in the Side Panel, right-click the data source or query and select Change Source.
○ In the Data Access tab, in the Tools tab, click Change Source and select the query whose source
you want to change. In the case where you are changing the data source for more than one query
based on the same data source, select one of the queries that uses that data source.
The Change Source Wizard appears. See To change the data source of a query [page 181] for information
on using this wizard.
Related Information
Changing the data source of a query [page 177]
3.2.16 To open for edit the data provider of an existing query
If you are able to edit queries, then you can open the Query Panel to edit the data provider.
Procedure
1. Open a Web Intelligence document in Design or Data mode.
2. Do one of the following:
○ In the toolbar above the Side Panel, click the Edit data provider button ( ).
○ In the Data Access tab, in the Data Providers subtab, click Edit.
Results
The Query Panel appears.
172
P U B L I C
SAP BusinessObjects Web Intelligence User's Guide
Building and running queries
3.2.17 To set the keydates of queries
You can set keydates in a query that uses an SAP BW data source.
Procedure
1. Open a Web Intelligence document in Design or Data mode.
2. In the Data Access tab, in the Data Providers subtab, select Keydates.
3. Select Use the default date for all queries to set each query to its default keydate.
4. Select Set date for all queries and choose the date to specify a keydate for all queries.
5. Select Prompt users when refreshing data to display a prompt for the keydate whenever a query containing
a key date is refreshed.
Results
To change keydate value variables, open the query for edit in the Query Panel and click the Set Variables icon.
3.2.18 To preview query results
You can activate a preview pane in the Query Panel.
Prerequisites
You have dened the result objects and lter objects in the Query Panel.
Procedure
1. Open a Web Intelligence document in Design or Data mode.
2. In the Data Access tab, in the Data Providers subtab, click Edit.
The Query Panel appears.
3. Click Show/Hide Data Preview Pane on the Query Panel toolbar to display the Data Preview pane.
SAP BusinessObjects Web Intelligence User's Guide
Building and running queries
P U B L I C 173

3.2.19 To sort query results
You can sort the results returned by a query.
Context
The sorts are added directly to the script generated by the query and the database returns the query results
already sorted.
For example, sorts added to queries that generate SQL appear in the ORDER BY clause of the generated SQL.
Note
Sorting is not available in queries based on OLAP data sources.
Procedure
1. In a Web Intelligence document in Design or Data mode, open the Data Provider for edit.
The Query Panel appears.
2. Click Sort on the Result Objects toolbar to display the Sort dialog box.
3. Click Insert sort object and select an object in the Select an Object dialog box.
4. Select the sort direction from the Sort type list.
5. Repeat the previous steps to add additional sorts to the query.
6. Select an object and click Delete selection to remove a sort from the query, or click Delete All to remove all
sorts from the query.
7. Click OK to close the Sorts dialog box.
The sorts are added to the script generated by the query.
Related Information
To open for edit the data provider of an existing query [page 172]
3.2.20 Interrupting and canceling queries
You can interrupt or cancel a query before all the data is returned to the document and choose the data you
want to display.
When you click Cancel in the Retrieving Data dialog box, in most cases Web Intelligence directs the database to
stop processing the query and gives you back control of the document.
174
P U B L I C
SAP BusinessObjects Web Intelligence User's Guide
Building and running queries

Query cancellation relies heavily on the type of database Web Intelligence is running on. Not all databases can
interrupt queries which can impact the behavior of Web Intelligence. The cancellation is either handled by the
database itself or by Web Intelligence.
Databases that support query cancellation are listed below.
● Relational
● OLAP
● SAP HANA Direct Access
● Personal Data Providers
When a database supports query cancellation, it interrupts the query which allows Web Intelligence to give you
back control of the document. The returned results are partially updated and the values displayed in the
document do not accurately reect the denition of the query.
When a database does not support query cancellation, the query cannot be interrupted. Web Intelligence still
gives you back control of the document, but the abandoned query continues to run in the background. To avoid
slowing down both database and Web Intelligence performance, the limit of abandoned queries has been set to
10 by default.
If you try to cancel a query after this limit has been reached, Web Intelligence only gives you back control of the
document when one of the other abandoned pending queries is complete, or when the current query refresh
action is complete.
Note
In the Web Intelligence HTML interface, when you cancel an ongoing query, the Web Intelligence HTML
interface returns to the previous state of the document, and the option to interrupt data retrieval is not
available.
BW databases
BW databases are a specic case. They do not support query cancellation after you have ordered a refresh
command. When you cancel a query, Web Intelligence sends a cancel order to the database so that you can get
back control of the document. However, the refresh action will still be carried out and completed in the
background by the database.
3.2.20.1 To interrupt or cancel a query
You can use Web Intelligence to interrupt or cancel a query.
Context
SAP BusinessObjects Web Intelligence User's Guide
Building and running queries
P U B L I C 175

Procedure
1. In a Web Intelligence document, click the Refresh icon.
2. In the Retrieving Data dialog box, click Cancel.
3. Select one of the following options in the Interrupt Data Retrieval dialog box:
Option
Description
Restore the results
from the previous data
retrieval.
Restores the values to the document that were retrieved the last time the query was run or
when the query was abandoned. The values displayed will not be the most up-to-date informa
tion available on the database. You can run the query later to retrieve the up-to-date values
from the database.
Purge all data from the
document.
Displays the document empty of values. The structure and formatting of the document is re
tained. You can run the query later to return the up to date values from the database.
Return the partial
results.
Displays the new values retrieved so far in the appropriate parts of the document. The rest of
the document will display the values retrieved the last time the query was run or abandoned.
4. Click OK.
3.2.21 To remove a query
You can remove a query in the Query Panel.
Procedure
1. Open a Web Intelligence document in Design or Data mode.
2. In the Data Access tab, in the Data Providers subtab, click Edit.
The Query Panel appears.
3. At the bottom of the Query Panel, select the tab for the query you want to remove.
4. Right-click and select Delete.
5. Click Run Query.
Related Information
To open for edit the data provider of an existing query [page 172]
176
P U B L I C
SAP BusinessObjects Web Intelligence User's Guide
Building and running queries

3.2.22 To duplicate a query
You can duplicate a query in the Query Panel.
Prerequisites
You must run the query rst before you are allowed to duplicate it.
Context
Tip
If you want to build a dierent query on a universe already included in the document, instead of starting
from scratch, duplicate the existing query on that universe and then modify it.
Procedure
1. Open a Web Intelligence document in Design or Data mode.
2. In the Data Access tab, in the Data Providers subtab, click Edit.
The Query Panel appears.
3. At the bottom of the Query Panel, select the tab for the query you want to duplicate.
4. Right-click the tab and select Duplicate.
5. Click Run Query.
Related Information
To open for edit the data provider of an existing query [page 172]
3.2.23 Changing the data source of a query
You can change the data source of a query using the Change Source Wizard.
The Change Source Wizard is useful, for example, when you want to develop a document on a universe in a test
environment, and then change to the universe when it has been moved or copied to the production
environment.
SAP BusinessObjects Web Intelligence User's Guide
Building and running queries
P U B L I C 177
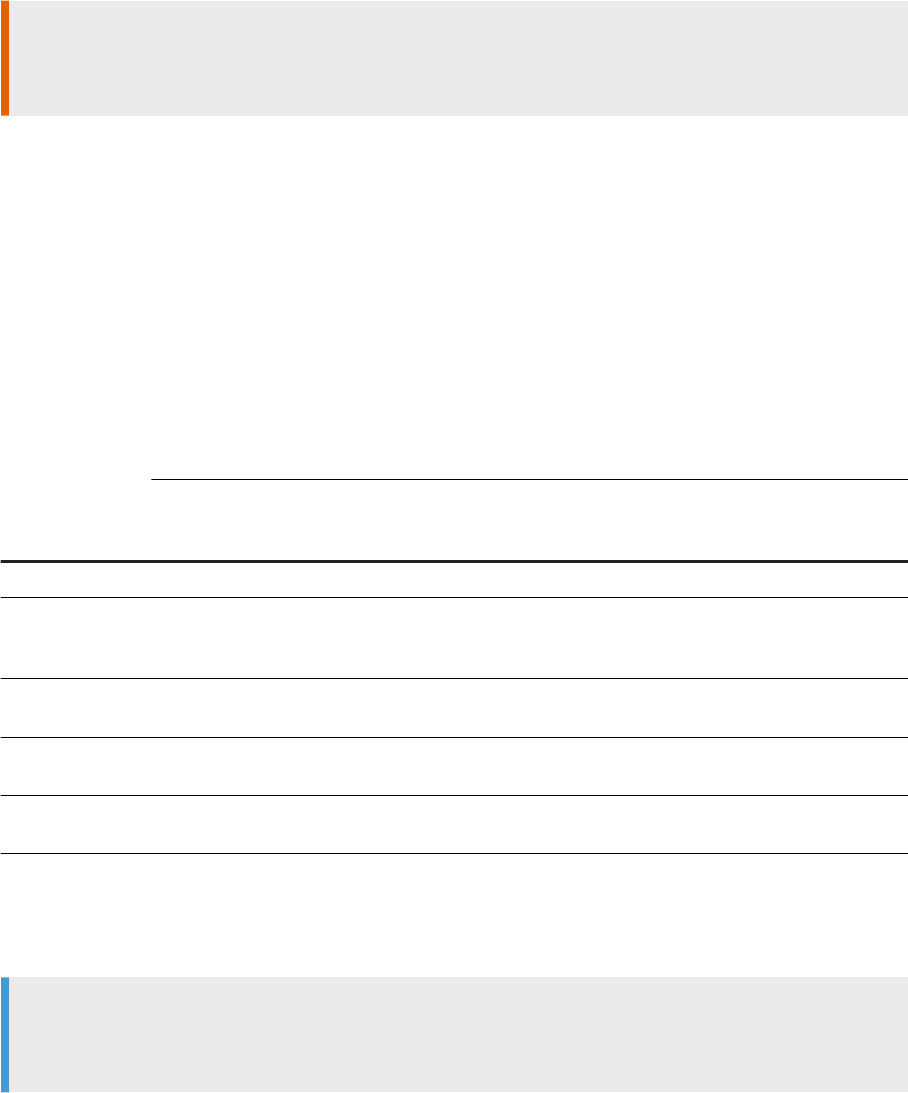
You can also use the Change Source Wizard to change the source of a universe created with the universe design
tool (UNV) to the same universe when migrated to the information design tool (UNX).
When you change the data source, you must map the objects coming from the current data source and used in
the document to objects in the target data source.
Restriction
The Change Source Wizard is not available for Free-hand SQL queries, Excel, CSV, Text les, Analysis Views,
and Web Service data sources.
New supported paths in 4.2 SP3
In the 4.2 SP3 release, additional paths are supported:
● SAP BW Direct Access > SAP BW Authored Universe
● SAP BW Direct Access > SAP HANA Direct Access
● SAP HANA Authored Universe > SAP HANA Direct Access
The following table lists the data source options supported by the Change Source Wizard.
Source
Target
UNV universe
UNX universe on
relational data
source
UNX universe on
OLAP data source
UNX BEx query uni
verse
SAP HANA Di
rect Access
UNV universe Yes Yes Yes Yes Yes
UNX universe on
relational data
source
Yes Yes Yes Yes
UNX universe on
OLAP data source
Yes * Yes Yes Yes
UNX BEx query
universe
Yes Yes Yes Yes
SAP HANA Direct
Access
Yes Yes Yes Yes
* When changing between these two sources, extensive remapping of objects may be required.
When you change the document from any data source type to a BEx query that has mandatory variables with
no default values, Web Intelligence applies the most appropriate values to the variables.
Note
When using an Excel, Free-hand SQL, web service, CSV or Text data source, the Change Source option is not
available. Open the Query Panel, and in the Query Properties tab, select a dierent Source Path le.
178
P U B L I C
SAP BusinessObjects Web Intelligence User's Guide
Building and running queries

Related Information
Object validation rules [page 180]
Web Intelligence mapping strategies for data sources [page 179]
3.2.23.1 Web Intelligence mapping strategies for data
sources
The Web Intelligence Change Source Wizard uses a list of criteria to map objects in data sources.
By default, the Change Source Wizard uses the following mapping order strategy.
Strategy Name
Strategy Description
Same ID To map with a valid object that has the same ID
Same technical name To map with a valid object that has the same technical name, if it exists.
Same path To map with a valid object that has the same path, the path including both
the objects name and type.
Closest name To map with a valid object that has the closest name. If Web Intelligence
encounters several objects with the same name but dierent object types,
then it selects the rst one in list based on the ID.
Same name To map with a valid object with exactly the same name.
The Change Source Wizard applies these strategies in the following order, until it nds an object to map in the
target data source:
● Same ID
● Same technical name
● Same path
● Closest name
If no matching object is found in the target data source, the Change Source Wizard ags it for removal. However,
you can still select the strategies to apply.
Mapping results
Depending on the number of objects in your query, it can take a few seconds for Web Intelligence to show the
list of mapped objects. You can check the results of the mapping with the Change Source Wizard. The icons
displayed next to each object that has been mapped indicate the result of the mapping.
SAP BusinessObjects Web Intelligence User's Guide
Building and running queries
P U B L I C 179
Change Source Wizard object map icons
Object map icon Description
The object has been mapped successfully..
The object has been mapped, however the path is ambiguous. An ambiguous mapping occurs
when the current data source object does not have the same name or path as the recommended
object in the target universe.
This icon remains even if you decide to manually map the object.
A source object could not be found in the data source because either the data source is no lon
ger available or the object was removed from the data source.
The source object type could not be deduced from the current context.
Web Intelligence cannot map this object to any object in the target data source. The object ap
pears as Remove object in the target data source.
Restriction
If you do not assign to it an object from the target data source, the unmapped object is per
manently removed from the query when you complete the data source change.
Related Information
Changing the data source of a query [page 177]
Object validation rules [page 180]
3.2.23.2 Object validation rules
The change source algorithm enforces rules that dene what objects are valid for mapping.
Combined with the selected strategies, the following rules can help you ne-tune the change of data source:
● A validation rule based on object type
● A validation rule based on object data type
Mapping setting options
Mapping settings
Description
Same object type only Select this option to map to an object of the same type.
180 P U B L I C
SAP BusinessObjects Web Intelligence User's Guide
Building and running queries

Mapping settings Description
Similar object type
Select this option to map to an object that is of a similar type.
When you select this option, the following rules apply:
● A dimension can only be mapped to a hierarchy, a level, a dimension at
tribute or a measure attribute.
● A dimension attribute can only be mapped to a dimension.
● A dimension or measure attribute can only be mapped to a dimension.
For example, if you want to convert a Dimension object to a Hierarchy object,
you can choose Similar object type for the mapping setting.
Any object type
Select this option to allow a mapping to any object type.
Same data type only Select this option to map to an object of the same data type.
Similar data type
Select this option to allow a mapping to an object of a similar data type.
When you select this option, the following rules apply:
● An object of data type Member to an object of any data type
● An object of any dened type to an object of type Member
● Object of type Date, DateTime, Time, or CalendarDate type to any object
of type Date, DateTime, Time, or CalendarDate.
Any data type
Select this option to allow a mapping to an object of any data type.
Related Information
Changing the data source of a query [page 177]
To change the data source of a query [page 181]
3.2.23.3 To change the data source of a query
Where possible, current and target objects are mapped by default based on their name, object type, data type
and location in the data source.
Context
Note
● When using an Excel, Free Hand SQL, web service, CSV or Text data source, the Change Source option
is not available. Open the Query Panel, and in the Query Properties tab, select a dierent Source Path
le.
● If the query contains custom SQL, it will be lost during the change source operation.
SAP BusinessObjects Web Intelligence User's Guide
Building and running queries
P U B L I C 181

Procedure
1. Do one of the following:
○ In the Design mode:
○ In the list of data providers, right-click the query whose source you want to change and select
Change Source.
○ In the Data mode:
○ In the list of data providers, right-click the query whose source you want to change and select
Change Source.
○ In the Data tab in the Side Panel, right-click the data source or query and select Change Source.
○ In the Data Access tab, in the Tools subtab, click Change Source and from the dropdown list, select
the query whose data source you want to change.
2. Specify whether you want to work with an existing data source that is already used in the document or a
new one.
Note
When you have other queries in your document based on the data source you have selected, use the
Apply changes in all queries sharing the same data source option to apply the data source changes to all
these queries. If you select this option, then the Object Mapping list shows all objects from all the
queries in the same list.
3. Click Next.
4. Optional: If your target data source has mandatory HANA variables or BEx variables without default
values, provide answers the prompts in the Set Variables or Variable Manager dialog boxes and click OK.
5. Dene a mapping strategy order using the left and right arrows to add or remove strategies, and the up and
down buttons to order them as you see t.
While editing the mapping strategy, you can also edit the mapping settings by clicking the Settings button.
To know more about the mapping settings, refer to the Object Validation Rules section.
6. Click Next.
Web intelligence displays the mapping results.
7. Optional: If you want to ne-tune the automatically generated mapping results, click the checkbox next to
an object whose mapping you want to edit and click Stategies to create your own custom mapping
strategy.
Tip
You can also map an object manually. To do so, click the ... button next to an object you want to edit and
select an object.
8. Click Finish.
9. Save the document to apply the change source.
Related Information
To open for edit the data provider of an existing query [page 172]
182
P U B L I C
SAP BusinessObjects Web Intelligence User's Guide
Building and running queries

To edit a query based on a text le [page 106]
To edit a query based on an Excel le [page 107]
To build a query on an Analysis View [page 164]
Object validation rules [page 180]
3.2.23.4 Changing the source path of a custom data provider
When using an Excel le, Free-hand SQL or a text le as a data source, the Change Source option is not
available. However you can change the source path of custom data providers. Changing the le path enables
you to modify the access path to a custom data provider you are using as a data source. Change the source
path whenever you have moved your original data source and need to indicate its new path.
In the Query Properties tab of the Query Panel, use the … (browse) button to indicate a dierent source path.
The new source path must point to the original data source. For FHSQL data sources, the browse button
enables you to indicate any valid connection available.
Restriction
In the HTML interface of the 4.2 SP3 release, you cannot change the le path of an Excel data provider.
3.2.24 Working with multiple queries and data providers
You can include one or multiple queries in a document. These queries can be based on any supported data
source.
For example, you can include product sales data and customer data in the same document. In this case, your
corporate data for product line sales is available on one universe and customer data is available on another
universe. You want to present product line sales results and information on customer age groups in the same
report. To do this, you create a single document that includes two queries; one query on each universe. You can
then include and format results from both queries in the same report.
Dening multiple queries in a single document is necessary when the data you want to include in a document is
available in multiple data sources, or when you want to create several dierently-focused queries on the same
data source. You can dene multiple queries when you create a document or add more queries to an existing
document. You can present the information from all of the queries on a single report or on multiple reports in
the same document.
Note
We recommend that you use no more than 15 data providers in a Web Intelligence document. The amount
of data providers you use can aect the time it takes to refresh document data and even the performance
of the Web Intelligence Processing Server.
SAP BusinessObjects Web Intelligence User's Guide
Building and running queries
P U B L I C 183
3.2.24.1 Multiple queries, combined queries and
synchronized queries compared
Multiple queries can be related in a document in dierent ways.
● Basic multiple queries draw unrelated data from dierent sources.
● Synchronized queries relate the data from dierent queries around a dimension that contains data
common to both queries. These dimensions are called merged dimensions.
You merge dimensions after you have created and run your multiple queries.
● Combined queries generate SQL containing the UNION, INTERSECT and MINUS operators (if the database
supports them) or simulate the eect of these operators.
Combined queries allow you to answer complex business questions that are dicult to formulate using
standard queries.
Note
This option is not accessible for OLAP databases or for .unx relational databases. It is available only
for .unv relational universes.
3.2.24.2 To add a query to an existing document
You can add queries to an existing document.
Procedure
1. Open a Web Intelligence document in Design or Data mode.
2. In the Data Access tab, in the Data Providers subtab, click Edit.
The Query Panel appears.
3. Click the Add a combined query icon in the toolbar.
4. Select a data source, if necessary.
5. Select objects for the additional query.
6. Click Run Query.
7. In the New Query box, specify in how the added data should be displayed:
Option
Description
Insert a table in a new report Display the data in a new report in the document
Insert a table in the current report Display the data in the currently selected report in a new
table
Include the result objects in the document without
generating a table
Include the data in the document without displaying the
data on a report.
184 P U B L I C
SAP BusinessObjects Web Intelligence User's Guide
Building and running queries
Option Description
Note
You can add the objects returned by the query to the
report later.
8. Click OK.
Related Information
To open for edit the data provider of an existing query [page 172]
To build a query on an Analysis View [page 164]
To create a query based on a BEx query that has no variables [page 128]
To build a query on a universe [page 72]
Building queries on data les [page 103]
To build a query based on a web service [page 166]
3.2.25 Refreshing queries in parallel
Parallel Data Provider Refresh feature improves data refresh performance in Web Intelligence documents that
contain multiple data providers.
To refresh queries in parallel, Web Intelligence spreads all data providers on several threads. This feature is
activated by default, and Web Intelligence can refresh up to 64 queries in parallel. Data providers based on
relational, OLAP and BICS connections are supported, as well as personal data providers (text les, FHSQL).
Restriction
Excel data providers are not supported.
You can decrease that value in the Central Management Console if the hardware running Web Intelligence does
not support such a workload. Make sure that your hardware has enough cores to guarantee optimal
performance.
Two global parameters are available in the Central Mangement Console:
● Maximum Parallel Queries per document: set the maximum number of data providers Web Intelligence can
refresh in parallel per document. The default value is set to 64.
● Enable Parallel Queries for Scheduling: enable or disable the parallel query processing when scheduling
documents. This option is enabled by default.
We also encourage you to ne-tune each database connection with a parameter that lets you specify the
number of queries that can be run in parallel. This parameter, called Maximum parallel queries, is available:
● In the Central Management Console or Information Design Tool for OLAP and BICS connections.
● In Information Design Tool or Universe Design Tool for relational connections.
SAP BusinessObjects Web Intelligence User's Guide
Building and running queries
P U B L I C 185
For each connection, the number of data providers that can be refresh in parallel is set to 4 by default. The
database administrator can change this value according to the database hardware. For text les however, the
default value is set to 1.
Example
In this example, all default values have been kept and each connection supports a maximum of 4 parallel
refresh jobs.
Connection
Number of Data Provider to Refresh
2 OLAP connections 6 (5 on Connection 1, 1 on Connection 2)
1 Relational conection 2
1 BICS connection 2
Excel les from a personal data provider 2
Both Excel les are refreshed sequentially as they are not supported by the parallel data provider refresh
feature.
Four of the data providers of the of the rst OLAP connection are refreshed in parallel on threads 1, 2, 3 and
4. The fth one is queued and will be processed after one of the data provider (of any connection) has been
refreshed, while the one coming from the second OLAP connection is refreshed on thread 5 since it is from
a dierent connection.
The four data providers of both relational and BICS connection are refreshed in parallel on threads 5, 6, 7
and 8.
Note
Whenever there are more data providers of the same type than the dened value, they are queued and
wait for other data providers to nish.
Related Information
To modify the number of data providers refreshed in parallel per document [page 187]
To disable parallel query processing for scheduling [page 187]
To modify the number of data providers refreshed in parallel for a specic OLAP connection [page 188]
186
P U B L I C
SAP BusinessObjects Web Intelligence User's Guide
Building and running queries

3.2.25.1 To modify the number of data providers refreshed in
parallel per document
Context
Procedure
1. On the CMC home screen, click Servers.
2. Click Web Intelligence Services.
3. Right-click Web Intelligence Processing Server and click Properties.
4. In the Maximum Parallel Queries entry eld, enter a number.
The possible values range from 0 to 64.
Note
If you enter 0, you disable the parallel data provider refresh function.
3.2.25.2 To disable parallel query processing for scheduling
Context
Procedure
1. On the CMC home screen, click Servers.
2. Click Web Intelligence Services.
3. Right-click Web Intelligence Processing Server and click Properties.
4. Uncheck Enable Parallel Queries for Scheduling.
SAP BusinessObjects Web Intelligence User's Guide
Building and running queries
P U B L I C 187
3.2.25.3 To modify the number of data providers refreshed in
parallel for a specic OLAP connection
Context
Procedure
1. On the home screen, click OLAP Connections.
2. Browse the connection you want to congure and right-click it.
3. Select Organize Edit .
4. In the Maximum Parallel Queries entry eld, enter a number.
The possible values range from 1 to 64.
Note
If you enter 1, data providers will be refreshed sequentially.
3.2.26 Filtering data using query lters
Query lters are dened on the query; they limit the data retrieved from the data source and returned to the
document.
Query lters allow you to:
● retrieve only the data you need to answer a specic business question
● hide the data you don’t want specic users to see when they access the document
● minimize the quantity of data returned to the document to optimize performance
For example, you can lter the Year dimension to view only sales revenue for Year 2003; or lter the Annual
Income dimension to view only customers whose annual income is equal to or greater than $1.5M.
Example
In Q4 2002, which stores in my sales region gained margins above $130K?
As Regional Marketing Manager for Texas, you are only interested in analyzing margins for Texas, but the
sales universe includes data US-wide. In addition, you only want to view information for stores where
margins reached over your 4Q 2002 quarterly target gure of $130K. To create a document with only the
information you need, you apply a lter on the State, Year, and Quarter dimensions and a lter on the
Margin measure.
188
P U B L I C
SAP BusinessObjects Web Intelligence User's Guide
Building and running queries

Filter objects
AND Year Equal to 2002
Quarter Equal to Q4
State Equal to Texas
Margin Greater than or equal to 130000
To avoid displaying the ltered values Texas, 2002, and Q4 in the table columns Year, Quarter, and State,
you exclude the Year, Quarter, and State objects from the Result Objects pane. When you generate the
report, the report values correspond to Texas stores with 4Q 2002 margins greater than or equal to $130K:
Store name
Sales Revenue Margin
e-Fashion Houston 307,914 133,802
e-Fashion Houston Leighton 316,232 136,055
Related Information
Using simple report lters [page 517]
To create simple report lters [page 517]
3.2.26.1 Structure of query lters
Query lters contain a ltered object, operator, and operand.
For example, in the lter [Country] In list (US;France), the [Country] dimension is the ltered
object, In list is the operator, and the list of values (US;France) is the operand. The lter removes all values
of [Country] other than US and France from the query result.
Query lter components
Component
Description
Filtered object
The Filtered object is the object whose values are ltered. Dimensions, attributes,
measures, hierarchies and levels can be used as ltered objects.
With the exception of BEx queries, the Filtered object is not required to appear as a
result object in the query. For example, a query that contains the [Customer] and
[Revenue] objects can lter on the [Region] object. If the lter is
[Region]
Equal to "South West", the query returns only those customers in the
South West region.
Operator
The Operator is used to compare the ltered object with the operand. For example,
the Equal to operator retains only those values of the ltered object that corre
spond exactly to the value of the operand.
SAP BusinessObjects Web Intelligence User's Guide
Building and running queries
P U B L I C 189
Component Description
Operand The Operand supplies the value or values used to lter the object. The next table
describes the operand types.
Operand types
Operand type
Description
Constant
The Constant operand is used to type values directly. For example, you can use a
constant to type "France" into the lter
[Country] Equal to France.
The operand cannot be a constant if the Filtered object is a hierarchy, unless the
hierarchy is used in conjunction with the
Matches pattern or Different
from pattern operator.
List of Values
The List of Values operand is used to select values from the list associated with the
ltered object. For example, if the ltered object is [City], you can use List of Val
ues to select one or more of the cities associated with the object.
Prompt
A Prompt is a dynamic lter that is answered when the query is refreshed.
Universe object
You can select an object from the universe to lter the ltered object against its
values.
Note
You cannot select a universe object as an operand on some OLAP data sour
ces or the ltered object is a hierarchy.
Result from another query
You can compare the ltered object against the values returned by another query.
Related Information
Building queries on BEx queries [page 107]
3.2.26.1.1 Query lter and prompt operators
You use operators to compare ltered objects.
The function of each operator depends on its context. Operators can perform mathematical operations and
concave concatenate strings, as well as perform a wide variety of comparisons yielding Boolean results.
190
P U B L I C
SAP BusinessObjects Web Intelligence User's Guide
Building and running queries
3.2.26.1.1.1 Equal to operator
Use the Equal to operator to obtain data equal to a value.
For example, to return data for the US only, create the lter "[Country] Equal to US".
3.2.26.1.1.2 Not Equal to operator
Use the Not Equal to operator to obtain data not equal to a value.
For example, to return data for all countries except the US create the lter "County Not Equal to US".
Note
This operator cannot be used for OLAP .unx universe parent-child hierarchies or for BEx queries.
3.2.26.1.1.3 Greater than operator
Use the Greater than operator to retrieve data greater than a value.
For example, to retrieve data for customers aged over 60, create the lter "[Customer Age] Greater than
60".
Note
This operator cannot be used for OLAP .unx universe parent-child hierarchies or for BEx queries.
3.2.26.1.1.4 Greater than or Equal to operator
Use the Greater than or equal to operator to retrieve data greater than or equal to a value.
For example, to retrieve data for revenue starting from $1.5M, create the lter "[Revenue] Greater than or
equal to 1500000".
Note
This operator cannot be used for OLAP .unx universe parent-child hierarchies or for BEx hierarchies.
SAP BusinessObjects Web Intelligence User's Guide
Building and running queries
P U B L I C 191
3.2.26.1.1.5 Less than operator
Use the Less than operator to retrieve data lower than a value.
For example, to retrieve data for exam grades lower than 40, create the lter "[Exam Grade] Less than 40".
Note
This operator cannot be used for OLAP .unx universes, hierarchies in lters, or for hierarchies in BEx
queries.
3.2.26.1.1.6 Less than or Equal to operator
Use the Less than or equal to operator to retrieve data less than or equal to a value.
For example, to retrieve data for customers whose age is 30 or less, create the lter "[Age] Less than or
equal to 30".
Note
This operator cannot be used for OLAP .unx universes, hierarchies in lters or for hierarchies in BEx
queries.
3.2.26.1.1.7 Between operator
Use the Between operator to retrieve data between two boundary values including the two boundary values.
The rst value declared must be lower than the second value.
For example, to retrieve data for weeks starting at week 25 and nishing at 36 (including week 25 and week 36),
create the lter "[Week] Between 25 and 36".
Note
This operator cannot be used for OLAP .unx universe or BEx hierarchies in lters.
3.2.26.1.1.8 Not between operator
Use the Not between operator to retrieve data outside the range of two values.
For example, to retrieve data for all the weeks of the year, except for and not including weeks 25 through 36,
create the lter "[Week] Not between 25 and 36".
192
P U B L I C
SAP BusinessObjects Web Intelligence User's Guide
Building and running queries

Note
This operator cannot be used for OLAP .unx universes or for BEx hierachies in lters.
3.2.26.1.1.9 In list operator
Use the In list operator to retrieve data corresponding to values in a list of values.
For example, to retrieve data only for the US, UK and Japan, create the lter [Country] In list, when you
can type values in the Type a value eld, you enter US;UK;Japan.
When used in a query lter with a hierarchical list of values, either from a dimension associated with a
hierarchical list of values or a hierarchy object, In list allows the selection of multiple members from any
levels of the hierarchy. For example, a prompt on the [Geography] hierarchy using the In list operator allows
the selection of [Paris] at the City level and [Canada] at the Country level in the prompt.
When used in a report lter, In list produces a at list of values.
3.2.26.1.1.10 Not In List operator
Use the Not in list operator to retrieve data that does not correspond to multiple values.
For example, if you do not want to retrieve data for the US, UK and Japan, create the lter "[Country] Not in
list". In the Type a value eld, you enter US;UK;Japan.
When used with a hierarchical list of values, either from a dimension associated with a hierarchical list of
values, a hierarchy object or a level object, Not in list allows the selection of multiple members from any
levels of the hierarchy. For example, a prompt on the [Geography] hierarchy using the Not in list operator
allows selection of [Paris] at the City level and [Canada] at the Country level in the prompt.
Note
This operator can only be used in certain types of hierarchies, for example, it can be used in level-based
hierarchies.
3.2.26.1.1.11 Matches Pattern operator
Use the Matches pattern operator to retrieve data that includes a specic string or part of a string.
For example, to retrieve customers whose date of birth is 1972, create the lter [DOB] Matches pattern
"1972".
If you're using a wildcard, use the "%" character for every data source, except for BEx data sources. For BEx
data sources, use the "*" character.
SAP BusinessObjects Web Intelligence User's Guide
Building and running queries
P U B L I C 193
Note
This operator cannot be used for BEx hierarchies.
3.2.26.1.1.12 Dierent From Pattern operator
Use the Different from pattern operator to return data that doesn't include a specic string.
For example, to retrieve customers whose date of birth is not 1972, create the lter [DOB] Different from
pattern '72'.
Note
This operator cannot be used for BEx or OLAP .unx universe parent-based hierarchies.
3.2.26.1.1.13 Both operator
Use the Both operator to retrieve data that corresponds to two values.
For example, to retrieve customers who have both xed and mobile telephone numbers, create the lter
[Account Type] Both 'Fixed' And 'Mobile'.
Note
This operator is not supported for lters based on hierarchy objects, or in universes based on OLAP data
sources.
3.2.26.1.1.14 Except operator
Use the Except operator to retrieve data that corresponds to one value and excludes another.
For example, to retrieve customers who have only a xed telephone number and no mobile telephone number,
create the lter [Account Type] 'Fixed' Except 'Mobile'.
The Except operator is more restrictive than Different from or Not in list. For example, a report that
returns customers and that includes the lter [Lines] Different From 'Accessories' excludes all
sales records where the item sold is part of the 'Accessories' line. If the same customer has purchased
Accessories and non-Accessories items, the customer still appears in the report, but their spending total
includes only non-Accessories sales.
If the lter is [Lines] Except 'Accessories', only customers who have bought no accessories are
included in the report.
194
P U B L I C
SAP BusinessObjects Web Intelligence User's Guide
Building and running queries

Note
This operator is not supported in universes based on OLAP data sources.
Related Information
Not In List operator [page 193]
3.2.26.1.1.15 Restrictions on lter operators
The following table lists the restrictions on prompt and lter operators based on the ltered object and query
type.
Object
Available lters
Level-based hierarchy
Equal to
Not equal to
In list
Not in list
Matches pattern
Different from pattern
Parent-child hierarchy
Equal to
In list
Matches pattern
Hierarchy in BEx query
Equal to
In list
3.2.26.2 Types of query lter
Several types of query lters are available in Web Intelligence.
Query
lter Description
Predened lters Filters created by the BI administrator.
Custom lters User-dened queries
SAP BusinessObjects Web Intelligence User's Guide
Building and running queries
P U B L I C 195

Query lter Description
Quick lters A simplied form of custom lter.
Prompts You can dene these dynamic lters to display a question or a list of values so that you or
other users can select dierent lter values at each run query.
You can mix dierent types of lters on a single query.
3.2.26.2.1 Predened query lters
Predened lters make the specic data you most typically need for reports permanently available.
They are created by a BI administrator and saved with the universe. Predened lters often contain complex
expressions that require a detailed knowledge of the database structure. Including predened lters on the
universe means you don’t need to create the same custom lters every time you create a new document based
on the same universe.
You cannot view the component parts of predened lters or edit predened lters.
3.2.26.2.1.1 Sets
A set lter is a predened query lter that is dened directly on the universe. It combines data from multiple
objects that you may use in a query, or want to include in more complex queries.
Sets are built in the information design tool by your universe designer, but are consumed in Web Intelligence.
They allow you to build and combine multiple lists of values with their restrictions, into a single entity called a
set lter that is available to in the Query Panel. Ultimately, the goal is to create complex query lters that return
data that would normally require time and skill to build in the Query Panel. A set lter saves time and provides
information that is not always easy to get to.
For more information on how to create and manage sets, refer to the Information Design Tool User Guide.
3.2.26.2.1.2 To select a predened query lter
When you select a predened query lter and run the query, the data corresponding to the query lter you
selected appears in the report.
Procedure
1. In a Web Intelligence document in Design or Data mode, open the Data Provider for edit.
The Query Panel appears.
196
P U B L I C
SAP BusinessObjects Web Intelligence User's Guide
Building and running queries

2. Double-click a predened lter or drag it to the Query Filters pane.
Related Information
To open for edit the data provider of an existing query [page 172]
3.2.26.2.2 Quick lters
Quick lters allow you to quickly dene the values you want to retrieve for a specic result object without
launching the Filter Editor.
By default, Quick lters use the Equal to operator if you select a single value or the InList operator if you select
multiple values.
For example:
● If you select the [Payment Status] dimension and the value “unpaid?", you are creating the following
lter: [Payment Status] Equal to “unpaid?"
● If you select the [Country] dimension and the values US, Japan, Germany, you are creating the following
lter: [Country] InList “US;Japan;Germany?"
Note
Quick lters are not available in BEx queries.
Related Information
Building queries on BEx queries [page 107]
3.2.26.2.2.1 To create or remove a quick lter
You can create and remove quick lters in the Query Panel.
Procedure
1. In a Web Intelligence document in Design or Data mode, open the Data Provider for edit.
The Query Panel appears.
2. Select the object you want to lter.
SAP BusinessObjects Web Intelligence User's Guide
Building and running queries
P U B L I C 197
3. Click the Add Quick Filter icon in the top corner of the Result Objects pane.
The Add Quick Filter dialog box appears. The values for the selected object are listed.
4. Select the values you want to retrieve from the database and click the arrow next to the Selected Value(s)
list.
For example, to lter the query for values in Q1, select the [Quarter] dimension, then select Q1 from the list
of values.
5. Click OK
The new lter appears on the Query Filters pane.
6. To remove the lter, select it in the Query Filters pane and press the Delete key.
7. Click Run Query.
8. Save the document.
Related Information
To open for edit the data provider of an existing query [page 172]
3.2.26.2.3 Custom query lters
You create custom query lters to limit document data to information corresponding to a specic business
question or the business information needs of a specic group of users.
For example, you can create custom lters to retrieve sales results data for specic dates, products, or
services, or to view customer information only for customers who are high wage earners or who live in a
particular region.
3.2.26.2.3.1 To add and remove custom query lters
You can edit and remove custom query lters in the Query Filters pane.
Procedure
1. In a Web Intelligence document in Design or Data mode, open the Data Provider for edit.
The Query Panel appears.
2. Select the object you want to lter and drag it to the Query Filters pane.
The query lter appears in an outline in the Query Filters pane.
3. Click the arrow next to the default operator (In list) and select a query operator from the list of operators.
4. Click the arrow next to the query lter and select the type of lter you want to apply:
198
P U B L I C
SAP BusinessObjects Web Intelligence User's Guide
Building and running queries

Option Description
Constant You compare the object against a constant value to lter the query result.
Value(s) from List
You compare the object against values from a list of values to lter the query result.
○ If the ltered object is a dimension, attribute or measure, you can select any of the values of
the object.
○ If the ltered object is a hierarchy, you can select any members of the hierarchy.
○ If the ltered object is a level, you can select any member from the level.
Prompt
You create a lter which requires the user to supply lter values on data refresh.
Object from this
query
You compare the object against the values returned by an object from in the same query.
Result from another
query, Result from
another query (Any),
Result from another
query (All)
You compare the object against the values returned by an object from another query (the lter-
ing query) to lter the query result.
5. Type/select the constant, list of values or object you want to include in the lter.
6. To remove the lter, do one of the following:
○ Select the lter and press Delete on your keyboard.
○ Click Remove in the top corner of the Query Filters pane.
○ To remove all lters, click Remove All in the top corner of the Query Filters pane.
Related Information
To open for edit the data provider of an existing query [page 172]
3.2.26.2.3.2 To select values from a list of values
When selecting from a list of values in a query, items in the list can appear either as a single or multi-column list
or a hierarchy, depending on the object.
Context
In a multi-column list, additional columns provide related values to the main value. In a hierarchical list, values
appear in a hierarchical relationship.
When you refresh a document with prompts, lists of values for the prompts appear in a at list without multiple
columns.
SAP BusinessObjects Web Intelligence User's Guide
Building and running queries
P U B L I C 199

Procedure
1. In a list of values, select items that you want to appear.
○ If the list of values does not appear when a dialog box opens, refresh the list, or search the list to
retrieve values. Some list of values require an initial search to display values because the list is too
large to be loaded in full.
○ If the list of values is divided into ranges, use the control above the list to navigate through the ranges.
Some large lists of values are divided into ranges to reduce the amount of data retrieved from the
database. When you select a range, the list displays the values in that range.
○ If the list of values depends on other lists of values, specify the dependent values in the prompt dialog
box that appears. A list of values can be dependent on other lists of values, for example when it is part
of a hierarchical list of values. For example, if the list of values contains cities, and the City object is part
of the hierarchy Country > Region > City, you need to specify values for country and region rst to lter
the list of cities.
Note
Dependent lists of values appear in queries only. They do not appear when you are selecting from a
list of values in a report.
When you rst display the list of values, you see the Prompts dialog box in which you specify the
dependent values. Once you have specied the dependent values, you can select the values from the
ltered list.
○ To display the value keys in OLAP or BEx queries, click Show/hide key values.
Key values are not indicated in the list of Selected Values, only in the list of available values. Some lists
of values contain key values, which are unique values that can be used to identify values with the same
display value. If the list of values contains multiple columns, only the key of the ltering column is
displayed.
○ To search for values in the list, type the search text in the box below the list and select one of the
following options from the Search icon dropdown list.
Option
Description
Match case The search is case-sensitive.
This option is not available when the Search in keys or Search on database op
tions are selected.
Search in keys
The search uses unique value keys rather than display values.
This option is available only in lists of values that support key values.
200 P U B L I C
SAP BusinessObjects Web Intelligence User's Guide
Building and running queries

Option Description
Search on database The search includes all values stored in the database rather than being re
stricted to the values loaded into the list. It improves search accuracy but re
duces search speed.
This option is available only in lists of values that support database searches.
Database searching improves search accuracy at the cost of performance. It is
useful when not all values in the list of values were retrieved. This can happen
when the total number of values in the list exceeds the Max rows retrieved
query property.
Database searching is particularly useful when the list of values is hierarchical
because values are loaded from the database only in response to their parent
value being expanded in the hierarchy. For example, in a geographical hierarchy,
the child values of the California value (cities in California) are not loaded from
the database until the value is expanded. If the option is selected, the search
includes these items even when the California value has not been expanded.
The search includes all ranges if the list of values is divided into ranges.
In search patterns, the '*' wildcard represents any string of characters and the '?' wildcard represents
any single character. For example, the value "March" can be returned by the search patterns "M*" or
"Mar?h". To include the "*" and "?" characters literally rather than as wildcards, precede them with "\"
in the search pattern.
○ Type values from the list directly if the list supports direct data entry or select values from the list.
2. Click OK or Run Query, as applicable.
Related Information
Max rows retrieved query property [page 93]
Selecting prompt values in the Prompts dialog box [page 521]
3.2.26.2.3.3 Filtering a query on values returned from
another query
You can lter a query on values returned from another query.
Note
When using query lters based on values returned from another query with a large amount of data,
performance can be aected due to converting and formatting operations. We recommend using query
lters based on values returned from another query only when you are working with small data sets.
SAP BusinessObjects Web Intelligence User's Guide
Building and running queries
P U B L I C 201

For example, if you want to return results for all the countries in Query 1 that have a corresponding country in
Query 2, you can lter the [Query 1].[Country] object on the values of the [Query 2].[Country]
object.
The ltered query must be in a universe based on a relational (RDBMS) data source. The query that supplies
the ltering values (ltering query) can be based on a relational, OLAP or local data source.
When you are building a query on a query, the ltering query does not appear in the list of queries that can be
used as ltering queries until it has been run or saved.
The query lter can lter against all or any of the values returned by the ltering query. The supported
combinations of operator and lter mode appear in the table below. If you do not choose an operator from the
table, the Result from another query menu item is not available.
Operator Filter mode Description
Equal to Any
Keep values in the ltered query that
are equal to any value returned by the
ltering query.
Not equal to All
Keep values in the ltered query that
are dierent from all the values
returned by the ltering query.
Greater than
Greater than or equal to
Any
Keep values in the ltered query that
are greater than/greater than or equal
to any of the values in the ltering
query.
In other words, keep values in the
ltered query that are greater than/
greater than or equal to the minimum
value returned by the ltering query.
Greater than
Greater than or equal to
All
Keep values in the ltered query that
are greater than all of the values in the
ltering query.
In other words, keep values in the
ltered query that are greater than/
greater than or equal to the maximum
value returned by the ltering query.
Less than
Less than or equal to
Any
Keep values in the ltered query that
are less than/less than or equal to any
of the values in the ltering query.
In other words, keep values in the
ltered query that are less than/less
than or equal to the maximum value
returned by the ltering query.
202 P U B L I C
SAP BusinessObjects Web Intelligence User's Guide
Building and running queries
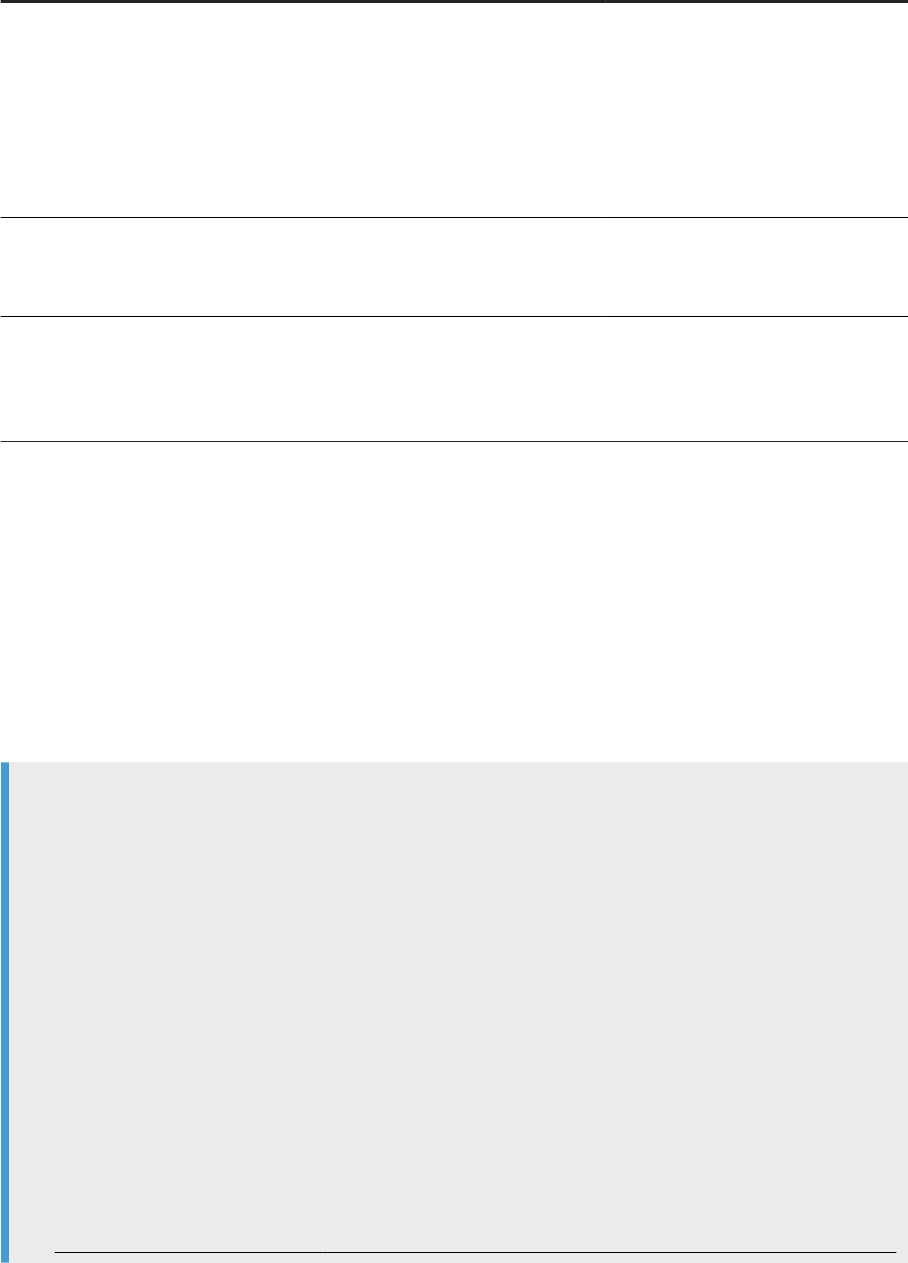
Operator Filter mode Description
Less than
Less than or equal to
All
Keep values in the ltered query that
are less than/less than or equal to any
of the values in the ltering query.
In other words, keep values in the
ltered query that are less than/less
than or equal to the minimum value
returned by the ltering query.
In list
Any
Keep values in the ltered query that
are equal to any value in the list of
values returned by the ltering query.
Not In list Any
Keep values in the ltered query that
are not equal to any of the values in the
list of values returned by the ltering
query.
3.2.26.2.4 Combining query lters
You can retrieve data that answers several criteria by combining lters in the same query.
Typical business questions require you to retrieve information that matches more than one criteria. For
example, if you are analyzing customer services data, you will most likely want to focus on customers for a
specic time period and also for a specic region, and probably also for a specic level of customer service
contract.
Example
Analyze sales revenue this year at stores where the oor size is over 4,000 square feet and sales revenue
gures are equal to or less than $1.5M
In this example, you are an operations manager for a retail chain. You want to analyze information about the
large retail stores in your chain that are making less than the sales revenue gure your company has set as
the target.
To do this:
1. Add a predened lter on the [Year] dimension to specify that you only want to retrieve values for this
year.
2. Create a second lter on the [Sales Floor Size] dimension to specify that you only want to retrieve data
for stores where the oor size is greater than 4,000 square feet.
3. Create a third lter on the [Sales Revenue] measure to specify that you only want to retrieve data for
stores where the sales revenue gures are equal to or less than $1.5M.
4. Combine these three lters with the And operator:
And
Last Year
SAP BusinessObjects Web Intelligence User's Guide
Building and running queries
P U B L I C 203

Sales Floor Size Group Greater than or equal to: 4000
Sales Revenue Less than 1,500,000
When you run the query, only data for stores that satisfy all three criteria will be returned to the report.
Related Information
To combine query lters [page 204]
Nested query lters [page 205]
3.2.26.2.4.1 To combine query lters
You can combine query lters in the Query Filters pane.
Procedure
1. In a Web Intelligence document in Design or Data mode, open the Data Provider for edit.
The Query Panel appears.
2. Create the lters and add them to the Query Filters pane.
Filters are combined by default with the And operator.
3. Click the operator or the arrow next to the operator checkbox and select the other operator to toggle
between And and Or.
Note
The Or operator is not supported from some OLAP data sources such as BEx queries, and OLAP .unx
universes on the top of Microsoft Analysis Services (MSAS) and Oracle Essbase.
Related Information
Combining query lters [page 203]
To open for edit the data provider of an existing query [page 172]
204
P U B L I C
SAP BusinessObjects Web Intelligence User's Guide
Building and running queries

3.2.26.2.4.2 Nested query lters
Nested query lters allow you to create more complex lter conditions than is possible when you combine
lters at the same level.
When you nest lters, you set the order in which they are evaluated. For example, you can return the data given
by two query lters joined in an Or relationship (where either one lter condition or the other is true) and then
further restrict this data by applying another lter to it. In this case, the two lters in an Or relationship are
nested, then compared with the other lter in an And relationship.
Example
List all sales made in Japan either in Q4 or where the revenue was greater than 1000000
To answer this question, you create the following nested query lter:
And
Country Equal To Japan
Or
Quarter Equal To Q4
Revenue Greater Than 1000000
This combination of query lters rst returns sales data where the sale was made in Q4 or the revenue was
greater than 1000000, then restricts this data further by returning only those sales made in Japan.
Related Information
To nest query lters [page 205]
Combining query lters [page 203]
3.2.26.2.4.2.1 To nest query lters
You can create nested query lters in the Query Panel.
Procedure
1. In a Web Intelligence document in Design or Data mode, open the Data Provider for edit.
The Query Panel appears.
2. Drag and drop a report object onto an existing query lter.
A query lter outline on the report object appears in a nested AND relationship with the existing query
lter.
3. Dene the new query lter.
SAP BusinessObjects Web Intelligence User's Guide
Building and running queries
P U B L I C 205

Related Information
To open for edit the data provider of an existing query [page 172]
Nested query lters [page 205]
Combining query lters [page 203]
3.2.26.3 How levels lter hierarchical queries
A level used as a query lter removes the specied members from the level and all their child members from
the hierarchy.
The lter also impacts measure aggregation.
Example
Filtering on a level
You have the following data on which the level lter [Country] Not equal to Germany is applied.
You apply the lter by dragging the [Country] level to the Query Filters pane in the Query Panel, selecting
the Not equal to operator and selecting "Germany" from the list of values of the level.
Customer Geography
Internet Sales Amount
All Customers $29,358,677.22
France $2,644,017.71
Hauts de Seine $263,416.19
Seine (Paris) $539,725.80
Germany $2.894,312.34
Brandenburg $119,871.08
Hessen $794,876.08
After ltering, the data appears as follows:
Customer Geography
Internet Sales Amount
All Customers $26,464,364.88
France $2,644,017.71
Hauts de Seine $263,416.19
Seine (Paris) $539,725.80
When the lter is applied, Germany and all descendant members are ltered from the hierarchy. The value
of [Internet Sales Amount] for All Customers is also reduced because the value for Germany is
no longer part of the aggregation.
206
P U B L I C
SAP BusinessObjects Web Intelligence User's Guide
Building and running queries
3.2.26.4 How measures lter hierarchical queries
A lter on a measure applies to all levels in a hierarchy and does not impact measure aggregation in the ltered
result.
Example
Filtering on a measure
You have the following data, to which you apply the lter [Internet Sales Amount] Greater than
500,000.
Customer Geography
Internet Sales Amount
All Customers $29,358,677.22
France $2,644,017.71
Hauts de Seine $263,416.19
Seine (Paris) $539,725.80
Germany $2,894,312.34
Brandenburg $119,871.08
Hessen $794,876.08
The ltered data appears as follows:
Customer Geography
Internet Sales Amount
All Customers $29,358,677.22
France $2,644,017.71
Seine (Paris) $539,725.80
Germany $2,894,312.34
Hessen $794,876.08
The lter is applied to all members, irrespective of their level in the hierarchy, and the aggregated measures
are not impacted by the removal of the ltered members. For example, the All Customers amount remains
at $29,358,677.22.
3.2.27 Filtering data with query prompts
A query prompt is a dynamic lter in a document that displays a question every time a user opens or refreshes
the data in a document.
Users answer prompts by either typing or selecting the values they want to view when they refresh the data.
The query then retrieves from the database only the values specied in the Prompts dialog box.
SAP BusinessObjects Web Intelligence User's Guide
Building and running queries
P U B L I C 207
Prompts allow multiple users viewing a single document to specify a dierent sub-set of the database
information and display it in the same report tables and charts. Prompts also reduce the time it takes for the
data to be retrieved from the database.
A prompt contains the following elements:
● a ltered object
● an operator
● a message
For example, to prompt users to select a specic year, you dene a prompt on the [Year] dimension:
Year Equal To ("Which year?")
In this prompt, the ltered object is [Year], the operator is Equal To, and the prompt message is "Which year?".
You can dene prompts on dimensions, measures, attributes, hierarchies and levels. For example, you can lter
the [Year] dimension to return values for a specic year, lter the [Sales Revenue] measure to return values for
a range of revenue gures, or lter the [Geography] hierarchy to return members from the hierarchy.
Note
● Prompts of type universe parameter can have dynamic default values set through a formula expression
in the information design tool. Web Intelligence displays them as regular default values.
● In Web Intelligence Rich Client or Web Intelligence Applet interface, for OLAP .unx universes, when
ltering on measures, you can only type a constant.
● In Web Intelligence Rich Client or Web Intelligence Applet interface, you cannot add measures or detail
objects in the lter panel for BEx queries.
You can create multiple prompts, related by the AND or OR operators, in the same query. You can also nest
prompts. When the user runs a query, the prompts are displayed.
Note
On BEx queries and OLAP .unx universes, you can only use the AND operator.
Prompts appear in the script generated by the query as either the value supplied in response to the prompt or
as special prompt syntax. For example, a prompt on [Country] can appear in generated SQL as:
Resort_Country.country = @prompt('Enter Country:','A',
'Resort\Country', Mono,Free,Persistent,,User:0)
or as
Resort_country.country In ('UK')
Prompts can be optional. You are not obliged to supply values for optional prompts. If you do not supply a
value, the prompt is ignored.
Related Information
Selecting prompt values in the Prompts dialog box [page 521]
208
P U B L I C
SAP BusinessObjects Web Intelligence User's Guide
Building and running queries

3.2.27.1 Merged prompts
When a document contains multiple data providers, any prompts that include objects with the same data type,
operators of the same operator type, and that use the same prompt text are merged.
When all the data providers are refreshed, a single prompt message appears for such prompts.
The List of Values displayed by the merged prompt is the list associated with the object in the prompt that has
the most display property constraints.
3.2.27.2 HANA query prompts in Web Intelligence
In Web Intelligence, HANA universes behave like any other relational UNX universe; variables and input
parameters in SAP HANA information models are associated with the corresponding tables in the data
foundation.
If there are variables and input parameters, then when you run a query in the Query Panel, prompts will appear
that require you to enter values for the variables and parameters, and also when the document is refreshed.
The values available in the prompts come directly from a HANA source.
For more information on HANA universes and query prompts at the universe level, see the Information Design
Tool User Guide.
Note
If you add prompts in the Query Panel, there could be a duplication of prompts. We recommend that you
run the query prior to dening any query prompts to know what prompts may already exist.
3.2.27.3 Hierarchical prompts
Depending on the lter operator in the prompt, you can select items from dierent levels of the list of values, or
at the lowest level only.
The following objects display their lists of values hierarchically in a prompt:
● Hierarchies
● Levels
● Dimensions associated with a hierarchical list of values
A hierarchical list of values appears in tree form. You can navigate up and down the tree to the items you want.
SAP BusinessObjects Web Intelligence User's Guide
Building and running queries
P U B L I C 209

3.2.27.4 Query lter and prompt operators
You use operators to compare ltered objects.
The function of each operator depends on its context. Operators can perform mathematical operations and
concave concatenate strings, as well as perform a wide variety of comparisons yielding Boolean results.
3.2.27.4.1 Equal to operator
Use the Equal to operator to obtain data equal to a value.
For example, to return data for the US only, create the lter "[Country] Equal to US".
3.2.27.4.2 Not Equal to operator
Use the Not Equal to operator to obtain data not equal to a value.
For example, to return data for all countries except the US create the lter "County Not Equal to US".
Note
This operator cannot be used for OLAP .unx universe parent-child hierarchies or for BEx queries.
3.2.27.4.3 Greater than operator
Use the Greater than operator to retrieve data greater than a value.
For example, to retrieve data for customers aged over 60, create the lter "[Customer Age] Greater than
60".
Note
This operator cannot be used for OLAP .unx universe parent-child hierarchies or for BEx queries.
3.2.27.4.4 Greater than or Equal to operator
Use the Greater than or equal to operator to retrieve data greater than or equal to a value.
For example, to retrieve data for revenue starting from $1.5M, create the lter "[Revenue] Greater than or
equal to
1500000".
210
P U B L I C
SAP BusinessObjects Web Intelligence User's Guide
Building and running queries
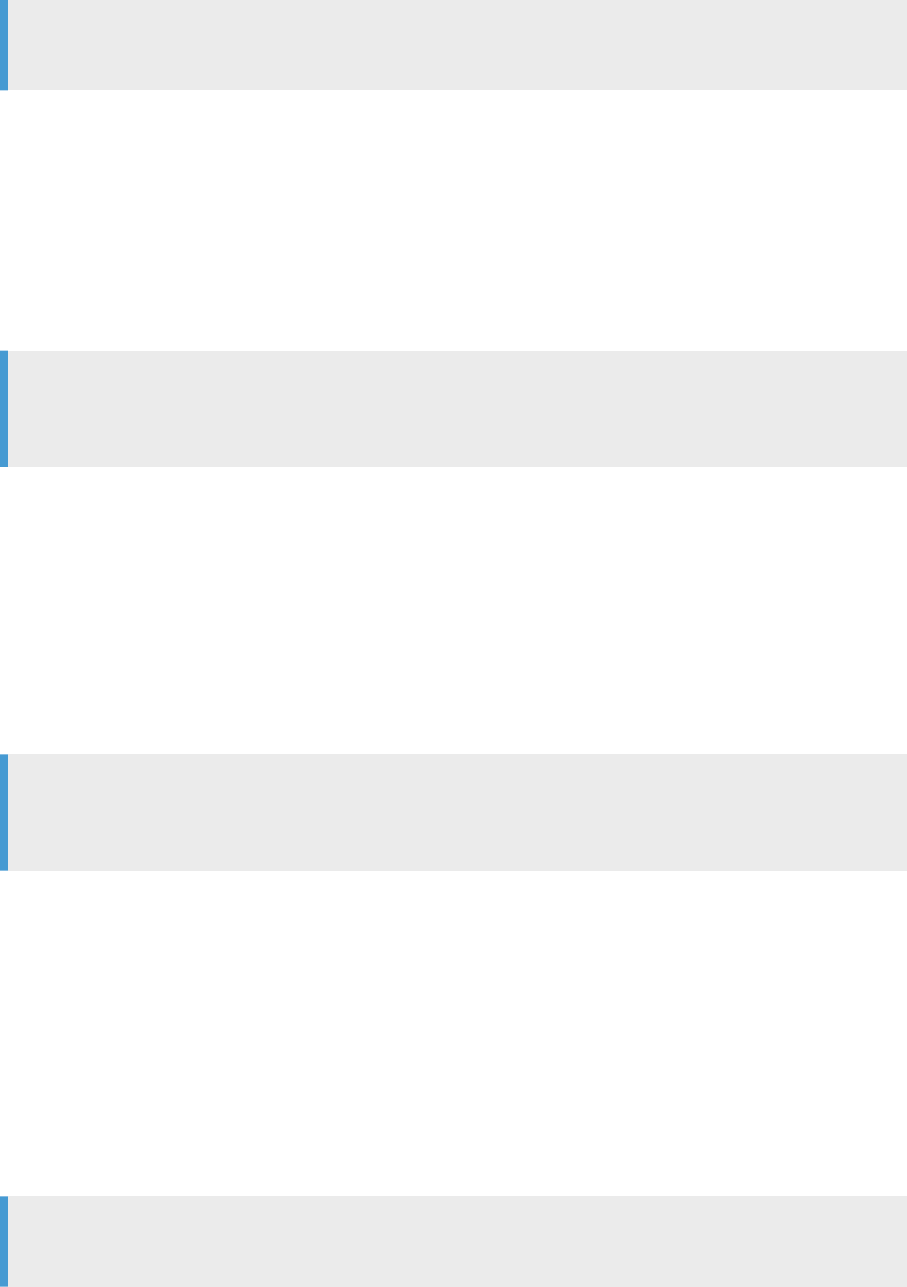
Note
This operator cannot be used for OLAP .unx universe parent-child hierarchies or for BEx hierarchies.
3.2.27.4.5
Less than operator
Use the Less than operator to retrieve data lower than a value.
For example, to retrieve data for exam grades lower than 40, create the lter "[Exam Grade] Less than 40".
Note
This operator cannot be used for OLAP .unx universes, hierarchies in lters, or for hierarchies in BEx
queries.
3.2.27.4.6 Less than or Equal to operator
Use the Less than or equal to operator to retrieve data less than or equal to a value.
For example, to retrieve data for customers whose age is 30 or less, create the lter "[Age] Less than or
equal to 30".
Note
This operator cannot be used for OLAP .unx universes, hierarchies in lters or for hierarchies in BEx
queries.
3.2.27.4.7 Between operator
Use the Between operator to retrieve data between two boundary values including the two boundary values.
The rst value declared must be lower than the second value.
For example, to retrieve data for weeks starting at week 25 and nishing at 36 (including week 25 and week 36),
create the lter "[Week] Between 25 and 36".
Note
This operator cannot be used for OLAP .unx universe or BEx hierarchies in lters.
SAP BusinessObjects Web Intelligence User's Guide
Building and running queries
P U B L I C 211

3.2.27.4.8 Not between operator
Use the Not between operator to retrieve data outside the range of two values.
For example, to retrieve data for all the weeks of the year, except for and not including weeks 25 through 36,
create the lter "[Week] Not between 25 and 36".
Note
This operator cannot be used for OLAP .unx universes or for BEx hierachies in lters.
3.2.27.4.9 In list operator
Use the In list operator to retrieve data corresponding to values in a list of values.
For example, to retrieve data only for the US, UK and Japan, create the lter [Country] In list, when you
can type values in the Type a value eld, you enter US;UK;Japan.
When used in a query lter with a hierarchical list of values, either from a dimension associated with a
hierarchical list of values or a hierarchy object, In list allows the selection of multiple members from any
levels of the hierarchy. For example, a prompt on the [Geography] hierarchy using the In list operator allows
the selection of [Paris] at the City level and [Canada] at the Country level in the prompt.
When used in a report lter, In list produces a at list of values.
3.2.27.4.10 Not In List operator
Use the Not in list operator to retrieve data that does not correspond to multiple values.
For example, if you do not want to retrieve data for the US, UK and Japan, create the lter "[Country] Not in
list". In the Type a value eld, you enter US;UK;Japan.
When used with a hierarchical list of values, either from a dimension associated with a hierarchical list of
values, a hierarchy object or a level object, Not in list allows the selection of multiple members from any
levels of the hierarchy. For example, a prompt on the [Geography] hierarchy using the Not in list operator
allows selection of [Paris] at the City level and [Canada] at the Country level in the prompt.
Note
This operator can only be used in certain types of hierarchies, for example, it can be used in level-based
hierarchies.
212
P U B L I C
SAP BusinessObjects Web Intelligence User's Guide
Building and running queries
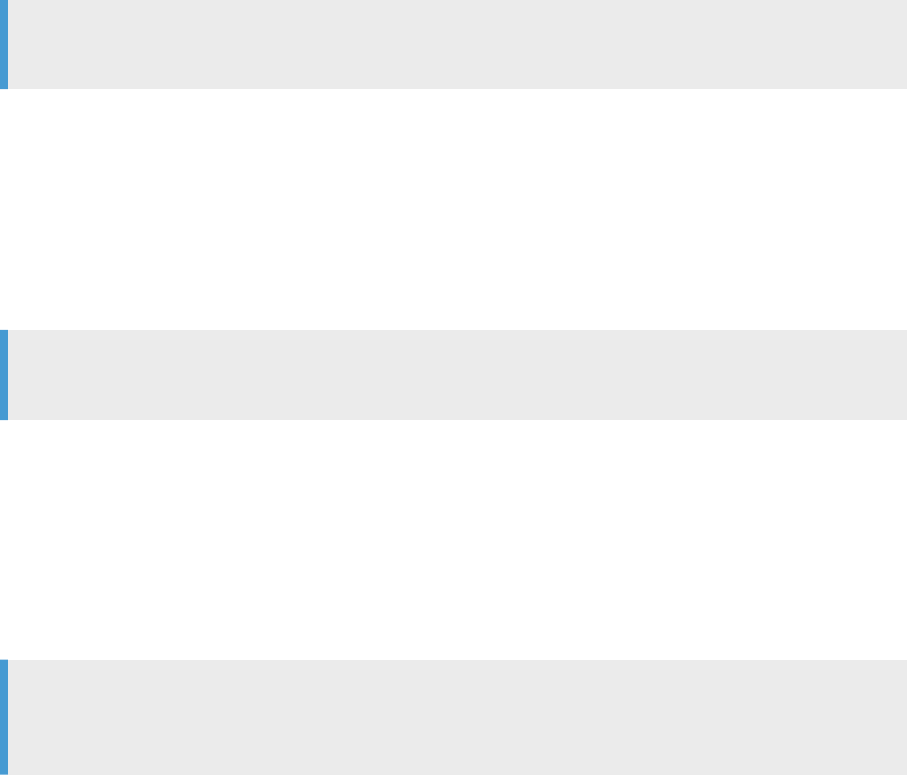
3.2.27.4.11 Matches Pattern operator
Use the Matches pattern operator to retrieve data that includes a specic string or part of a string.
For example, to retrieve customers whose date of birth is 1972, create the lter [DOB] Matches pattern
"1972".
If you're using a wildcard, use the "%" character for every data source, except for BEx data sources. For BEx
data sources, use the "*" character.
Note
This operator cannot be used for BEx hierarchies.
3.2.27.4.12 Dierent From Pattern operator
Use the Different from pattern operator to return data that doesn't include a specic string.
For example, to retrieve customers whose date of birth is not 1972, create the lter [DOB] Different from
pattern '72'.
Note
This operator cannot be used for BEx or OLAP .unx universe parent-based hierarchies.
3.2.27.4.13 Both operator
Use the Both operator to retrieve data that corresponds to two values.
For example, to retrieve customers who have both xed and mobile telephone numbers, create the lter
[Account Type] Both 'Fixed' And 'Mobile'.
Note
This operator is not supported for lters based on hierarchy objects, or in universes based on OLAP data
sources.
3.2.27.4.14 Except operator
Use the Except operator to retrieve data that corresponds to one value and excludes another.
For example, to retrieve customers who have only a xed telephone number and no mobile telephone number,
create the lter [Account Type] 'Fixed' Except 'Mobile'.
The Except operator is more restrictive than Different from or Not in list. For example, a report that
returns customers and that includes the lter [Lines] Different From 'Accessories' excludes all
SAP BusinessObjects Web Intelligence User's Guide
Building and running queries
P U B L I C 213

sales records where the item sold is part of the 'Accessories' line. If the same customer has purchased
Accessories and non-Accessories items, the customer still appears in the report, but their spending total
includes only
non-Accessories sales.
If the lter is [Lines] Except 'Accessories', only customers who have bought no accessories are
included in the report.
Note
This operator is not supported in universes based on OLAP data sources.
Related Information
Not In List operator [page 193]
3.2.27.4.15 Restrictions on lter operators
The following table lists the restrictions on prompt and lter operators based on the ltered object and query
type.
Object
Available lters
Level-based hierarchy
Equal to
Not equal to
In list
Not in list
Matches pattern
Different from pattern
Parent-child hierarchy
Equal to
In list
Matches pattern
Hierarchy in BEx query
Equal to
In list
214 P U B L I C
SAP BusinessObjects Web Intelligence User's Guide
Building and running queries
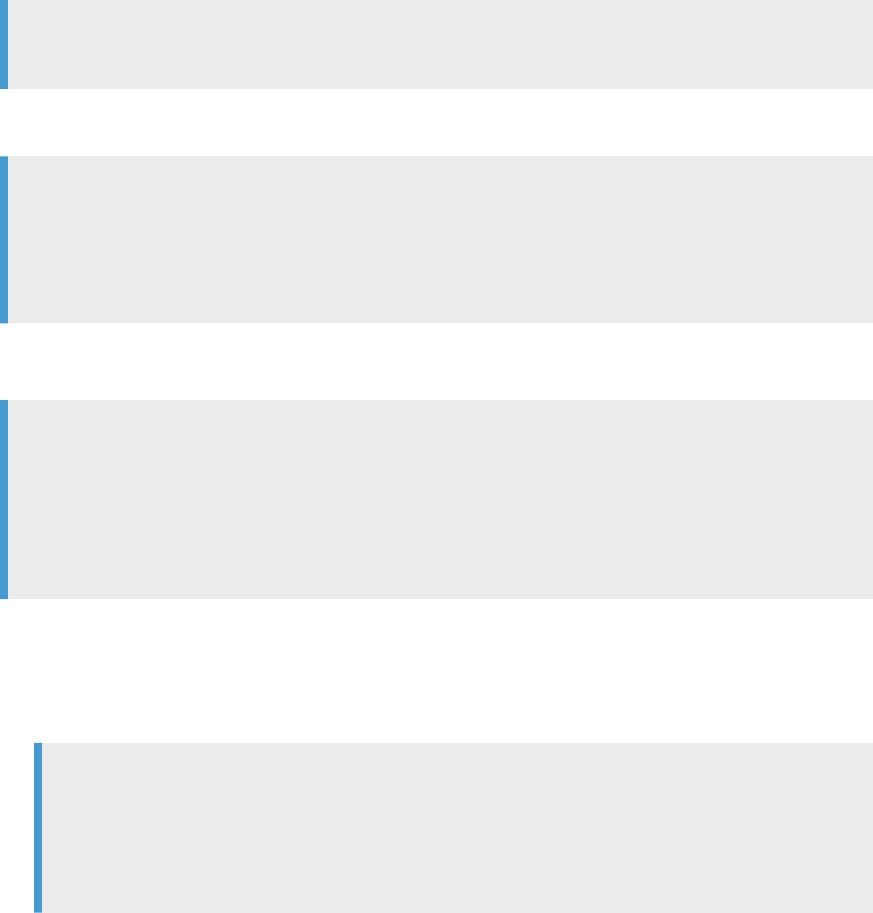
3.2.27.5 To build a prompt
You build a query prompt in the Query Panel.
Procedure
1. In a Web Intelligence document in Design or Data mode, open the Data Provider for edit.
The Query Panel appears.
2. Drag the object you want to lter with a prompt and drop it into the Query Filters pane.
The query lter appears in outline in the Query Filters pane. The outline shows the ltered object, the
operator and the type of lter applied to the object. By default the lter is a constant.
3. Select a lter operator from the list.
Note
The list of available operators depends on the type of ltered object.
4. Click the arrow next to the outline query lter and select Prompt from the menu to lter the object using a
prompt.
Note
If the document contains multiple data providers, and there is already a prompt that includes objects
with the same data type, operators of the same operator type, and that uses the same prompt text as
the new prompt, a warning appears, telling you that the two prompts will be merged. This means that
whenever all the data providers are refreshed, a single prompt message appears for the two prompts.
The Prompts dialog box appears.
5. Select Prompt with list of values to allow the user to select from a list of values when answering the prompt.
Note
○ The option is selected by default if the ltered object has an associated list of values in the
universe.
○ The option is selected by default and cannot be deselected if the ltered object is a hierarchy.
○ Do not select this option if the ltered object is a date and you want users to see a popup calendar
to select the date.
If you deselect the Prompt with list of Values option, type the prompt text (for example "Enter a City") in the
Prompt text box.
6. In the Parameter Properties dialog box, do any of the following:
○ Select Select only from list to restrict the user choice to values available in the list.
Note
○ The option is selected by default if the ltered object has an associated list of values in the
universe, and cannot be deselected if the ltered object is a hierarchy.
○ Do not select this option if the ltered object is a date and you want users to see a popup
calendar to select the date.
SAP BusinessObjects Web Intelligence User's Guide
Building and running queries
P U B L I C 215

○ Select Keep last values selected to ensure that, by default, the prompt selects the values the user
selected the last time they answered the prompt.
The option is selected by default if the ltered object has an associated list of values in the universe,
and cannot be deselected if the ltered object is a hierarchy.
○ Select Set default values if you want the prompt to select values by default when it appears, and type a
value in the Type a value box, or click ... and select default values in the List of Values dialog box.
Note
This button is disabled if the ltered object has no associated list of values.
○ Select Optional prompt to make the prompt optional. If the user does not supply a value for an optional
prompt, the prompt is ignored. Click the icon next to the text box and use the dialog box that appears
to set the prompt properties.
Results
The prompt appears at each document refresh.
Related Information
To open for edit the data provider of an existing query [page 172]
Dening how prompts display [page 217]
Merged prompts [page 209]
Selecting prompt values in the Prompts dialog box [page 521]
3.2.27.6 To select an existing prompt
You can select from pre-existing prompts to add to a query. Only pre-existing prompts that are compatible with
the object you are ltering are displayed.
Procedure
1. In a Web Intelligence document in Design or Data mode, open the Data Provider for edit.
The Query Panel appears.
2. Drag the object on which you want to apply a prompt and drop it onto the Query Filters pane.
The query lter appears in outline in the Query Filters pane.
3. Click the arrow next to the query lter and select Prompt from the menu.
4. Click Select from universe, select an existing prompt and click OK.
216
P U B L I C
SAP BusinessObjects Web Intelligence User's Guide
Building and running queries

The list displays only those universe prompts that are compatible with the object you are ltering. For
example, the ltered object and the universe prompt must have the same data type.
Related Information
To open for edit the data provider of an existing query [page 172]
3.2.27.7 To remove a prompt
You can delete query prompts in the Query Panel.
Procedure
1. In a Web Intelligence document in Design or Data mode, open the Data Provider for edit.
The Query Panel appears.
2. Select the prompt in the Query Filters pane and click the Delete icon.
Related Information
To open for edit the data provider of an existing query [page 172]
3.2.27.8 Dening how prompts display
You can modify how prompts appear in the Prompts dialog box.
In the Prompts dialog box, users select values by either entering a value in the Type a value text box, if available,
and adding it to the selected value list, or by selecting values from a list of values dened by the query prompt.
Options available in the Parameter Properties dialog box
If you want the prompt to display...
(useful when you...) then...
the list of values associated with the l-
tered dimension, measure, or detail
want to view all the values for the object
and then select from those values
leave the option selected by default:
Prompt with List of Values
the values specied the last time the
prompt was answered (users can select
a dierent values)
default to the same values when you re
fresh the document, but want the ability
to select a dierent value when neces
sary, such as the name of the current
month
select the option:
Keep last values
selected
SAP BusinessObjects Web Intelligence User's Guide
Building and running queries
P U B L I C 217
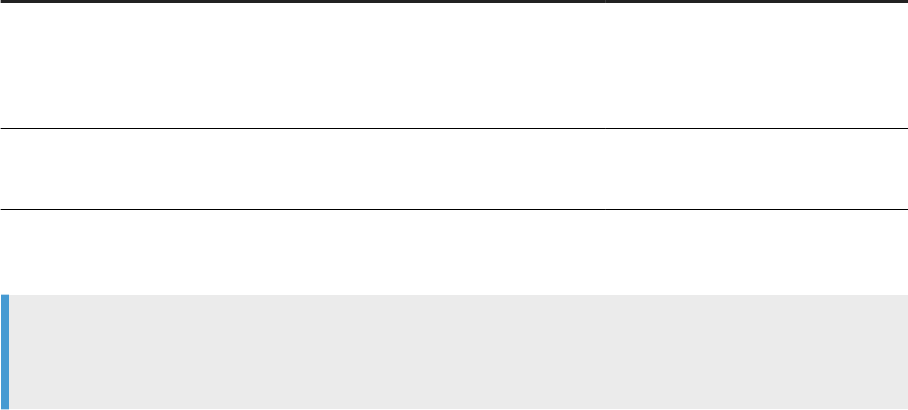
If you want the prompt to display... (useful when you...) then...
the values you specify as the default
(users can select a dierent values)
almost always reselect the same values
when you refresh the document, but
want the ability to select a dierent
value when necessary, such as the
number for the current year
select the option:
Set default value(s)
a list of values from which users select a
value
prevent users from typing a value that
might not exist on the database or that
you do not want them to view
select the option: Select only from List
To make the prompt optional, select Optional prompt. You are not obliged to specify a value for the prompt, in
which case it is ignored.
Note
If the prompt is for a date, the users will see the popup calendar and a list of values. If you want users to see
the popup calendar in order to select the dates, deselect Prompt with List of Values
Related Information
Selecting prompt values in the Prompts dialog box [page 521]
3.2.27.9 Combining prompts
Combining multiple prompts on a single query enables you to lter the data returned to the document so that
each person viewing the reports sees only the information relevant to their business need.
For example, you can combine the following three prompts on a Customer Accounts document:
● Which customer?
● Which account?
● Which calendar period: from? to?
This enables each accounts manager viewing the document to view report values for a specic customer
account during a specic period.
You combine prompts in the same way that you combine query lters.
3.2.27.9.1 Combining prompts with query lters
Combining prompts and lters on a single query enables you decide the values for some of the selected objects
on the query using lters and allow users to decide the values of other selected objects using prompts.
For example, if you combine the following lters and prompts on a Human Resources document:
218
P U B L I C
SAP BusinessObjects Web Intelligence User's Guide
Building and running queries
● [Year] Equal to This Year
● [Job title] Not equal to Senior Executive
● Which employee?
Users viewing the document can choose which employee they view information for, but they can only view data
for the current year and they can’t view data for senior executives.
3.2.27.10 To change the order of prompts
You change the order of query prompts in the Query Panel.
Procedure
1. In a Web Intelligence document in Design or Data mode, open the Data Provider for edit.
The Query Panel appears.
2. Click the Query properties icon on the Query Panel toolbar.
3. Select the prompt you want to move up or down in the prompt order in the Prompt Order dialog box, then
press the up or down arrow next to the box.
Related Information
To open for edit the data provider of an existing query [page 172]
3.2.28 Filtering data using subqueries
A subquery is a exible query lter that allows you to restrict values in more sophisticated ways than is possible
with an ordinary query lter.
Subqueries are more powerful than ordinary query lters for the following reasons:
● They allow you to compare the values of the object whose values are used to restrict the query with values
from other objects.
● They allow you to restrict the values returned by the subquery with a WHERE clause.
● They allow you to pose complex questions that are dicult or impossible to formulate with simple query
lters. For example: what is the list of customers and their associated revenue where the customer
purchased a service that had previously been reserved (by any customer) in Q1 of 2003?
Subqueries work by modifying the SQL that is generated to retrieve the query data. The SQL contains a
subquery that restricts the data returned by an outer query. SQL is the query language supported by all
relational databases (RDBMS), although each database has its own syntax. For more information on SQL
subqueries, see any book on SQL.
SAP BusinessObjects Web Intelligence User's Guide
Building and running queries
P U B L I C 219
Note
Subqueries are not supported in all databases. If they are not supported, the option to build subqueries
does not appear in the Query Panel.
Note
You can build subqueries using dimensions, attributes and measures. You cannot build subqueries using
hierarchical objects.
Related Information
To build a subquery [page 220]
Subquery parameters [page 222]
3.2.28.1 To build a subquery
You can build subqueries in the Query Panel.
Procedure
1. In a Web Intelligence document in Design or Data mode, open the Data Provider for edit.
The Query Panel appears.
2. Add the objects that you want to appear in the query to the Result Objects pane.
3. Select the object in the Result Objects pane that you want to lter with a subquery and click the Add a
subquery icon at the top of the Query Filters pane.
The subquery outline appears in the Query Filters pane. By default the object you selected appears as the
Filter object and Filter By object.
4. To add a WHERE condition to the subquery, drag a report object to the area of the subquery below the Drop
an object here image.
You can use an existing subquery or standard query lter as a WHERE condition in a subquery. To do so,
drag and drop the existing lter or subquery to the area of the subquery below the Drop an object here
boxes. In the HTML client, to copy rather than move the existing lter to the WHERE condition, hold down
the Control key while dragging and dropping. In this case the existing lter remains in its initial place and
becomes part of the WHERE condition of the subquery.
5. Select the operator and values used to lter the object in the WHERE condition.
6. Click Subquery to add an additional subquery to the query lter.
In addition to linking subqueries in AND or OR relationships, you can nest them (create subqueries within
subqueries) by dragging an existing subquery to the area beneath the Drop an object here boxes. In this
case the inner subquery becomes part of the WHERE condition of the outer subquery. To copy rather than
move the subquery to the WHERE condition, hold down the Control key while dragging and dropping. In
220
P U B L I C
SAP BusinessObjects Web Intelligence User's Guide
Building and running queries

this case the second subquery remains at the same level as the rst, and becomes part of the WHERE
clause of the rst.
By default the two subqueries are linked in an AND relationship. Click the AND operator to toggle between
AND and OR.
7. To nest a subquery (create a subquery within a subquery), drag an existing subquery to the area beneath
the Drop an object here image.
To copy rather than move the subquery to the WHERE condition, hold down the Control key while
dragging and dropping. In this case the second subquery remains at the same level as the rst, and
becomes part of the WHERE clause of the rst.
The inner subquery becomes part of the WHERE condition of the outer subquery.
Related Information
To open for edit the data provider of an existing query [page 172]
Filtering data using subqueries [page 219]
Example: Customers bought a service reserved in Q1 of 2003, and how much revenue they generated [page
221]
Subquery parameters [page 222]
Nested combined queries [page 101]
3.2.28.2 Example: Customers bought a service reserved in Q1
of 2003, and how much revenue they generated
This example uses the Island Resorts Marketing sample universe in Web Intelligence to build a subquery.
Procedure
1. In a Web Intelligence document in Design or Data mode, open the Data Provider for edit.
The Query Panel appears.
2. Drag the Customer and Revenue objects to the Result Objects pane in the Query Panel.
3. Select the Service object.
4. Click Subquery.
The subquery outline appears in the Query Filters pane.
Note
The selected object appears in both boxes in the subquery outline. You often use the same object in
both boxes, although this is not required. If the objects do not return any common values, the subquery
returns no values, and the query therefore returns no values.
SAP BusinessObjects Web Intelligence User's Guide
Building and running queries
P U B L I C 221

5. Drag the Reservation Year object to the area of the subquery outline beneath the Service object,
which adds a WHERE condition on the Reservation Year object .
6. Set the Reservation Year condition operator to Equal to.
7. Type FY2003 in the Type a constant box.
8. Drag the Reservation Quarter object to the area of the subquery outline beneath the Service object,
which adds the Reservation Quarter object to the WHERE condition.
9. Set the Reservation Quarter condition operator to Equal to.
10. Type Q1 in the Type a constant box.
11. Click Run Query.
3.2.28.3 Subquery parameters
A subquery or set of subqueries contains several parameters.
Parameter
Description
Filter objects
The object whose values are used to lter the result objects.
You can include more than one lter object. If you do, the values of the objects you
select are concatenated.
Filter by objects
The object that determines which Filter object values the subquery returns.
You can include more than one Filter by object. If you do, the values of the objects you
select are concatenated.
Operator
The operator that species the relationship between the Filter object and the Filter by
object.
Because of database restrictions you cannot use certain combinations of operators
and Filter by objects together. For example, if you use the Equal to operator with a Fil
ter by object that returns multiple values, the database rejects the SQL because this
type of subquery requires the Filter by object to return one value only.
In cases where the generated SQL is rejected by the database, you see an error mes
sage showing the error description returned by the database
WHERE condition (optional)
An additional condition that constrains the list of values of the Filter by object. You can
use ordinary report objects, predened conditions or existing query lters, including
subqueries, in the WHERE condition.
Relationship operator
If there is more than one subquery, this operator determines the relationship between
the subqueries.
AND - the conditions in all of the subqueries must be satised.
OR - the conditions in any one of the subqueries must be satised.
222 P U B L I C
SAP BusinessObjects Web Intelligence User's Guide
Building and running queries

4 Reporting data
4.1 Introduction to reporting
Now that you have built and run your query, you have to organize your data before you can start performing
analysis operations.
Organizing your data helps you make your report understandable and avoid information overload. As a best
practice, try to keep it simple and remove all irrelevant data that would get in the way of what you are trying to
demonstrate.
Use the chart library and tables to design the report. Other tools are available so that you can perform
formatting operations. You can for instance sort, rank, or merge data so that information is displayed according
to your business requirements and questions.
The following sections provide you with information on how to choose the correct graphics according to your
data, and how to format your report to make it look professional and easy to understand.
To know more about
Read
Organizing and formatting data
● Tracking changes in data [page 259]
● Highlighting data using conditional formatting [page
269]
● Ranking report data [page 275]
● Merging data from dimensions and hierarchies [page
283]
● Enhancing reports with calculations, formulas and vari
ables [page 308]
● Using sections to group data [page 366]
● Using breaks [page 373]
● Using sorts to organize data in reports [page 377]
Charts
● Choosing the correct Web Intelligence chart for your
data [page 382]
● Assigning data to a chart [page 397]
● Geo-qualifying an object for a geomap chart [page 399]
4.2 Working with reports
You can create and update ad hoc reports based on your business requirements.
In reports you can add charts, free-standing cells, formulas, and much more.
SAP BusinessObjects Web Intelligence User's Guide
Reporting data
P U B L I C 223
4.2.1 Web Intelligence features that are supported in reports
for mobile devices
You can use several Web Intelligence query and report features in reports for mobile devices.
In the following table are the major features of Web Intelligence and if they are supported on mobile devices.
This is not a complete list; the features listed below have been tested for viability on mobile devices. For more
information on designing Web Intelligence reports for mobile devices, see the Mobile BI Report Designer's
Guide.
Feature
Purpose and how it helps Supported on Mobile
Hierarchies You can use hierarchies to navigate through
data that uses parent-child relationships.
Yes
Free-standing blank cells You can use free-standing cells display text or
formulas. For example, you can use these cells
for report titles and images. You can put in them
basic formulas, for example a conditional status
indicator.
Yes
Pre-dened cells You can use free-standing cells with dened for
mulas that show information like drill lters, the
last refresh date, and the document name.
Yes
Tables You can use tables to show data in a list format
that is easy to scroll through.
Yes
Restriction
There is a limit to the maximum num
ber of rows and columns that can be
displayed on the screens of mobile de
vices. For more information, see the
Mobile BI Report Designer's Guide.
Groups in tables
You can group dimension values. This feature
can save space in a table. For example, if you
have branches of stores in several states, you
may prefer to group the stores into groups by
region.
No
Table breaks To save space by removing repetitive data in a
table, you can use table breaks.
Yes
Sections You can use sections to split information into
smaller parts. For example, in a table with City,
Quarter, and Sales Revenue, the city and quar
ter content can be repetitive. You can create
section based on Quarter, which gives you quar
terly tables on Sales Revenue by City.
Yes
Sorts In tables, you can use sorts to organize the or
der in which values are displayed in a table. For
example, you sort the revenue values in De
scending order.
Yes
224 P U B L I C
SAP BusinessObjects Web Intelligence User's Guide
Reporting data
Feature Purpose and how it helps Supported on Mobile
Ranking You can use ranking in a table to show only top
or bottom items based on certain criteria. This
helps readers to focus on the top or bottom
items in a data set.
Yes
Restriction
Supported only the following Mobile
server versions:
● BI 4.1 SP03 Patch 01 and higher
● BI 4.0 SP09 Patch 01 and higher
Charts
You can use charts to show data in a visual way
that adds impact to the results.
Yes
Restriction
There is a limit to the maximum num
ber of rows and columns that can be
displayed on the screens of mobile de
vices. For more information, see the
Mobile BI Report Designer's Guide.
Prompts
You can use prompts in reports to allow users
rene the data that is shown on the mobile de
vice. You can also control the type or amount of
data the user can access and that appears on
the mobile device.
Yes
Query lters You can use query lters to limit the amount of
data retrieved from the data source, reducing
the data retrieval time.
Yes
Report lters You can use report lters to limit the retrieved
data displayed in a report.
Yes
Input controls You can use input controls as report element-
specic lter controls.
Yes
Folding and unfolding data You can fold and unfold report data to see only
the amount of data you want at a given time.
No
Drilling You can use drilling to move through the data
levels. For example, you can drill down from re
gion to city to store.
Yes
Conditional formatting You can use rules in reports to have table cell or
section format change based on rules. You can
highlight in a visual fashion important results by,
for example, text, cell border and background
display color and size changes, and even via im
ages or web pages.
Yes
Data tracking You can display data changes in a report in a
document, for when the changes in data is the
focus of a report.
No
Linking to other documents You can link to other documents in the report,
as in the case where you want to oer users ac
cess to related documents.
Yes
SAP BusinessObjects Web Intelligence User's Guide
Reporting data
P U B L I C 225
4.2.2 To rename a report
You can rename a report in a Web Intelligence document in Design mode.
Procedure
1. In a Web Intelligence document in Design mode, right-click the Report tab of the report you want to
rename.
2. Select Rename Report on the menu and type the new report name.
3. Click outside the report name tab and save the document.
4.2.3 To duplicate a report
You can duplicate a report in a Web Intelligence document in Design mode.
Procedure
1. In a Web Intelligence document in Design mode, right-click the report tab of the report you want to
duplicate.
2. Click Duplicate Report.
3. Rename the duplicated report, if required.
4. Save the document.
Related Information
To reuse an input control in another report within a Web Intelligence document [page 529]
226
P U B L I C
SAP BusinessObjects Web Intelligence User's Guide
Reporting data
4.2.4 To delete a report
You can delete a report from a Web Intelligence document in Design mode.
Procedure
1. In a Web Intelligence document in Design mode, right-click the report tab of the report you want to delete
and select one of the following:
Option
Description
If you are using the Web Intelligence HTML interface: Remove Report
If you are using the Web Intelligence Applet or Rich Client interface: Delete Report
2. Click Yes to conrm the deletion.
3. Save the document.
4.2.5 To change the order of reports
You can change the order of reports in a Web Intelligence document in Design mode.
Procedure
1. In a Web Intelligence document in Design mode, right-click the report tab of the report whose order you
want to change in the document.
2. Click Move Report on the menu, then select one of the menu options.
Menu options in the Web Intelligence HTML interface
Menu option
Description
First The report becomes the rst report in the document.
Previous The report tab is moved to the left of another report tab in
the report zone.
Next The report tab is moved to the right of another report tab
in the report zone.
Last The report becomes the last report in the document.
SAP BusinessObjects Web Intelligence User's Guide
Reporting data
P U B L I C 227
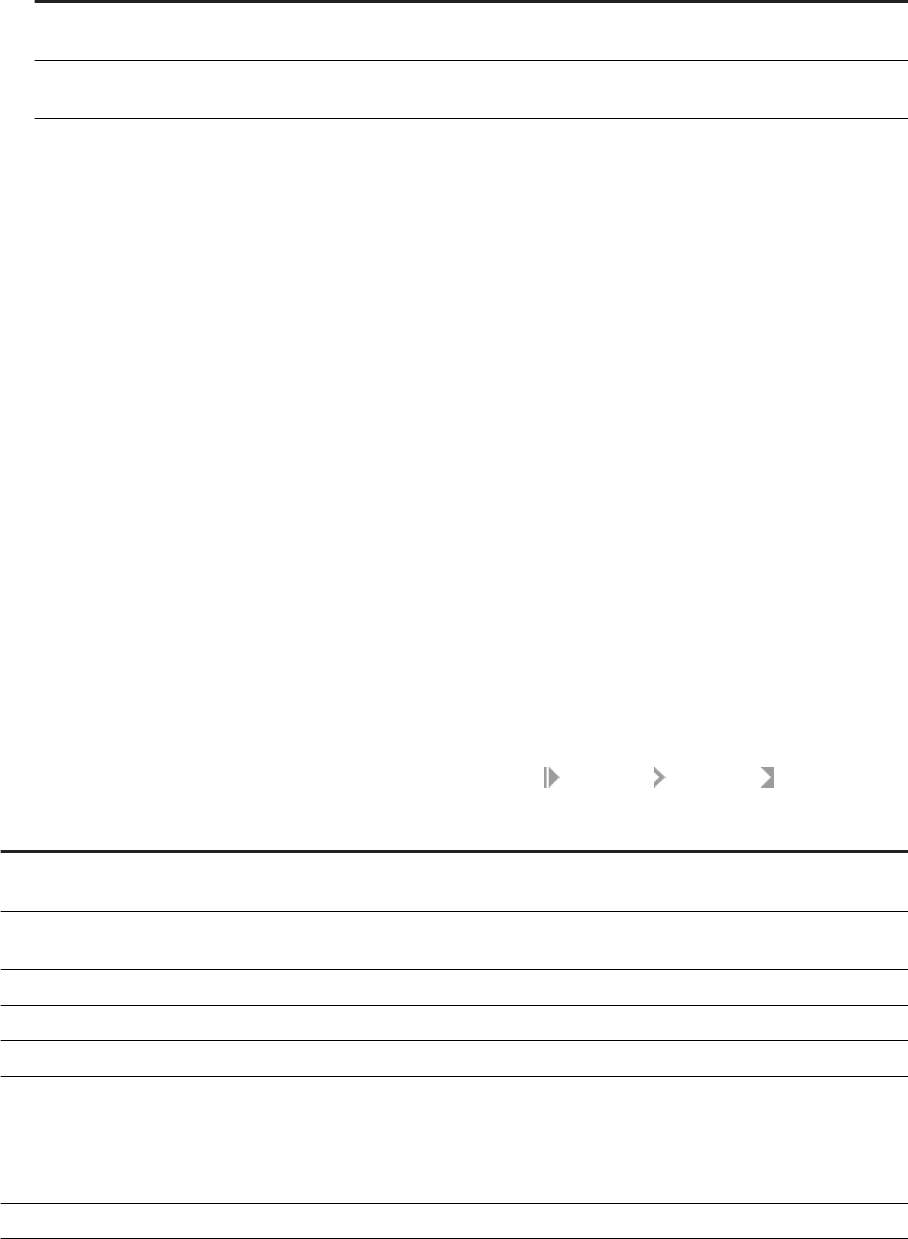
Menu options in the Web Intelligence Applet and Rich Client interfaces
Menu option Description
Move Left The report tab is moved to the left of another report tab in
the report zone.
Move Right The report tab is moved to the right of another report tab
in the report zone.
4.2.6 To add a report
You can add a report to a Web Intelligence document in the Design mode.
Procedure
In a Web Intelligence document in Design mode, right-click the report tab of any existing report and click Add
Report.
A blank report is added to the document with the default name Report n.
4.2.7 Viewing document properties
You can view the document properties in the Document Summary pane in the Side Panel and edit them in the
Document Summary dialog box.
The following table lists the document properties that you can view in the Document Summary pane in the Side
Panel or edit in the Document Summary dialog box that is found at Properties Document :
Property
Description
Title The name of the document in the BI launch pad. This is displayed above the
general properties and cannot be edited.
Type The type of document. This option is only available in the Web Intelligence
HTML interface.
Author The creator of the document.
Creation date The date the document was created.
Locale Tells you the formatting locale of the document.
Content Alignment You can see the alignment in the document based on your locale settings in the
Document Summary, in the Side Panel. The alignment of the application inter
face is from right to left (RTL) when you select Arabic or Hebrew. The alignment
of the document content may be RTL, depending on the system settings se
lected by the BI administrator.
Description
Optional information that describes the document.
228 P U B L I C
SAP BusinessObjects Web Intelligence User's Guide
Reporting data
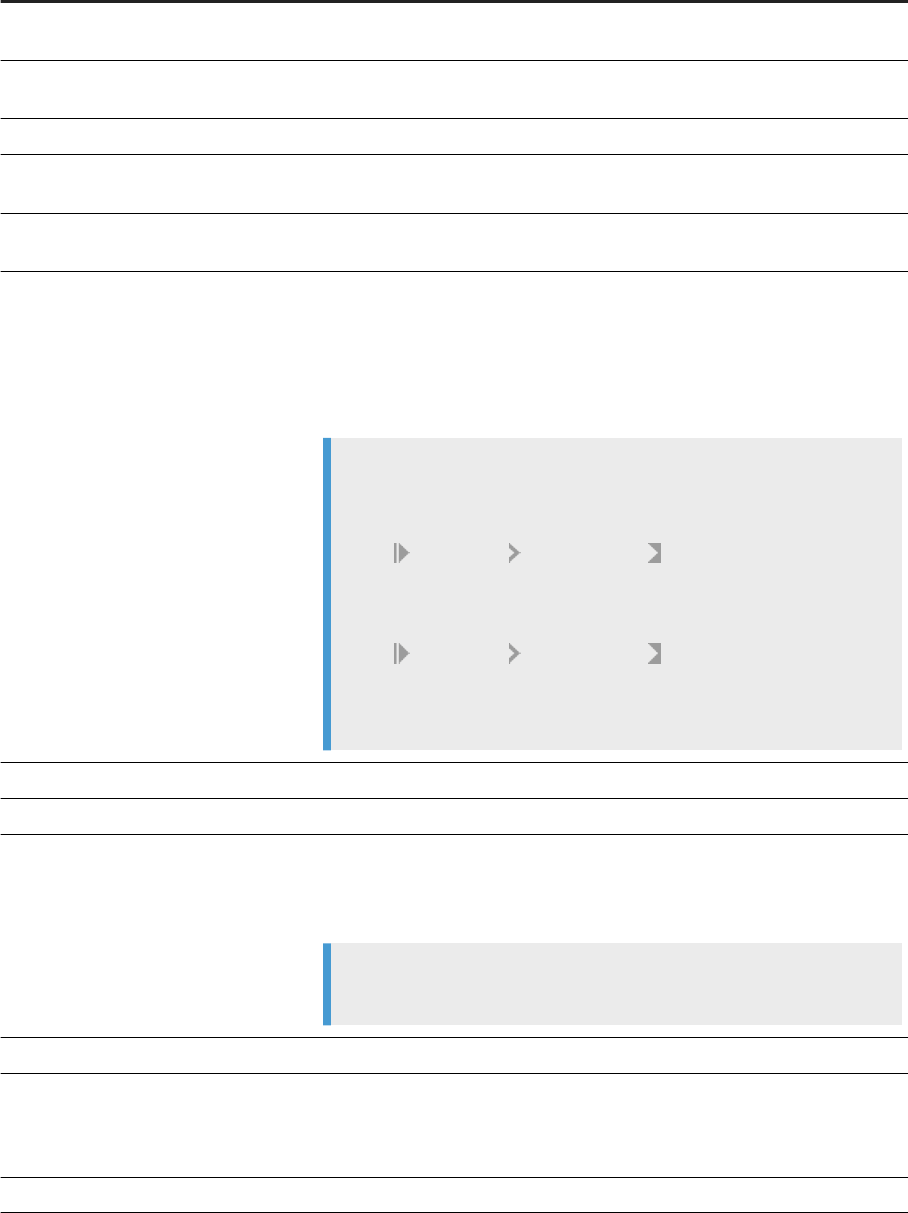
Property Description
Keywords Optional keywords that can be used to search for the document in the BI launch
pad.
Last refresh date In the Side Panel, this eld informs you of when the results were last refreshed
with the latest data from the database.
Last modied In the Side Panel, this eld informs you when the document was last modied.
Last modied by In the Side Panel, this eld informs you who the last person was to modify the
document.
Duration of the previous refresh In the Side Panel, this eld informs you how long it took to retrieve the data
from the database the last time the results were refreshed.
Refresh on open
Automatically refreshes the results in reports with the latest data from the data
base each time the document is opened.
When Refresh on open is selected, data tracking does not display the dierence
between the data prior to the refresh and the data after the refresh. Data after
the refresh is treated as new data because the refresh purges the document.
Note
The Refresh on open option is dependent on the following settings in the
CMC (congured by the BI administrator):
● In Applications Web Intelligence , from the Manage list, select
Properties. In the Automatic Document Refresh on Open Security Right
Setting section, the property Automatic Refresh security setting is ena
bled.
● In Applications Web Intelligence , from the Manage list, select
User Security. When you select a user prole and click View Security,
verify that the Document - disable automatic refresh on open security
right is disabled.
Permanent regional formatting
Formats the document according to the format locale with which it was saved.
Use query drill Allows drilling in query drill mode.
Enable query stripping Generates queries that only use objects that contribute to the reports in which
they are used. Each time a query is refreshed, non-contributing objects are ig
nored. Only relevant data is retrieved from the data provider. This feature en
hances performance.
Note
Query stripping is enabled by default for BEx queries.
Hide warning icons in chart
Hides General Warning icons in order to enhance readability.
Change Default Style This button is only available in the Web Intelligence Applet interface and Web
Intelligence Rich Client. In the Document Summary edit dialog box, you can
change the default style for the document. You can import a new style or export
the current style.
Data tracking reference mode
In the Side Panel, this eld indicates whether data tracking is turned on or o.
SAP BusinessObjects Web Intelligence User's Guide
Reporting data
P U B L I C 229
Property Description
Data tracking Track the following kinds of data changes:
● Inserted data
● Deleted data
● Changed data
● Increased values
● Decreased values
Auto-merge dimensions
Automatically merges dimensions with the same name and from the same uni
verse. You see the merged dimension in the list of available objects with the di
mensions merged within it below.
Merged dimensions are the mechanism for synchronizing data from dierent
data providers.
Extend merged dimension values
The option when selected extends values of merged dimensions. Merged di
mensions are the mechanism for synchronizing data from dierent data provid
ers. This controls the results when a table contains synchronized data.
If a table contains a dimension used in a merge, this dimension returns the
value of its query plus the values of the other dimensions merged from other
data providers for which there is an object in the table.
When this option is not selected and a table contains a dimension used in a
merge, this dimension returns the value of its query.
Restriction
You should only activate the Extend merged dimension values option when
you want to reproduce the merged dimension behavior of SAP
BusinessObjects Desktop Intelligence.
230 P U B L I C
SAP BusinessObjects Web Intelligence User's Guide
Reporting data
Property Description
Auto-refresh
This option, available in Document Summary panel, when activated causes the
document to be automatically refreshed.
The Auto-refresh option applies to the use of delegated measures. Block ele
ments that are aected by this include adding/deleting a column, inserting a
break, including a footer, lter bar, input control and so on. When this option is
selected, and an object is added to or removed from the query, or when a dier-
ent value is selected from a list in the Report Filter bar (all values, simple val
ues), for example, the document is refreshed automatically. The
#TOREFRESH
message will not appear in the report because the refresh is automatic.
This option only applies to aggregated delegated measures. For example when
you add a total to a table in a report.
Using this option can slow down the performance. If the drop in performance is
a problem, consider deselecting this option. In this case
#TOREFRESH will dis
play when the report is modied.
Note
This option can only be modied if the BI administrator has enabled it in
the Web Intelligence application properties in the Central Management
Console (CMC).
Default Style
You can change the default style that is used for the document. You can do the
following:
● Import a dierent .css style sheet to replace the existing style sheet.
● Export the current style sheet to save or use elsewhere.
● Reset the document to use the original style sheet installed with the prod
uct. This option is only available when the current document style sheet is
dierent from the original style sheet.
Note
This option is only available in the Web Intelligence Applet interface and
Web intelligence Rich Client.
Merge prompts (BEx variables)
Select this option if you want to merge prompts that are created in Web
Intelligence from BEx variables in the original BEx query. Only BEx variables that
have the same technical name are merged. When this option is unselected, any
previously merged BEx variables are unmerged and treated as separate
prompts.
Prompts
In the Side Panel, this box indicates the prompts entered for the current view of
the document.
KeyDates In the Side Panel, this box indicates any keydates associated with the document
Related Information
Merging data from dimensions and hierarchies [page 283]
SAP BusinessObjects Web Intelligence User's Guide
Reporting data
P U B L I C 231
Drilling with query drill [page 505]
Data tracking and Refresh on Open [page 268]
4.2.7.1 To congure document properties
You can congure the document properties in the Document Summary dialog box.
Procedure
1. In a Web Intelligence document in Design or Data mode, do one of the following:
○ Click Document on the Properties tab.
○ In the Side Panel, select the Document Summary pane, then click Edit.
2. In the Document Summary dialog box, edit the document properties.
3. Click OK to close the Document Summary dialog box.
Related Information
Viewing document properties [page 228]
4.2.7.2 To select default folders for local documents and
universes
In Web Intelligence Rich Client, you can select a folder where local documents and universes are stored by
default on your local machine.
Procedure
1. In a Web Intelligence document in Design mode, click Application in the Properties tab.
2. In the Web Intelligence Options dialog box, select the General tab.
3. Next to User documents, click Browse, and select a folder for documents.
4. Next to Universes, click Browse, and select a folder for universes.
5. Click OK to close the Web Intelligence Options dialog box.
232
P U B L I C
SAP BusinessObjects Web Intelligence User's Guide
Reporting data

4.2.7.3 Query stripping in documents
Query stripping is a reporting feature that can be used to optimize performance.
Query stripping is used only by Web Intelligence.
For relational universes, query stripping is only enabled if the following parameters are set:
● The Allow query stripping option is selected in the business layer properties in the information design tool
(unselected by default).
● The Enable query stripping option is selected for the data provider in the Query Properties in Web
Intelligence.
● The Enable query stripping option is selected in the Document Properties in Web Intelligence (selected by
default if query stripping is enabled for the data provider).
For OLAP universes, query stripping is enabled by default.
When query stripping is enabled, the query is rewritten to reference only objects that are used in the report.
Let's take for example a query that contains three result objects: Country, City, and Revenue. A report based
on this query may contain only City and Revenue. If query stripping is enabled, when the report is refreshed,
in most cases the query will only retrieve the data for City and Revenue.
In relational universes, a report with query stripping enabled may return dierent data than when query
stripping is disabled, depending on the schema of the data foundation. Let's look again at the example of a
query that contains Country, City, and Sales Revenue. In the data foundation, there is a self-restricting join
on the Country table that restricts the country to the US. With query stripping disabled, the report on City
and Revenue returns revenue for only cities in the US. With query stripping enabled, the report returns revenue
for cities in all countries, because the Country table was stripped out of the query.
Caution
Web Intelligence cannot strip every object if there is no report element in the document: the report must
contain at least one object.
Enhanced Query Stripping
The USE_ENHANCED_QUERY_STRIPPING parameter allows you to take advantage of enhancements to the
query stripping method. Normal query stripping rewrites the query to contain only the objects referenced in
the report and any joins concerned by those objects. Enhanced query stripping only optimizes the SELECT and
GROUP BY clauses to avoid fetching unused data, but it doesn't modify the other clauses or the joins. It is
recommended to use enhanced query stripping in the following situations:
● The data foundation contains outer joins.
● The data foundation contains self-restricting joins (column lters).
● The data foundation contains shortcut joins.
If aggregate awareness is dened in the business layer (using the @Aggregate_aware function in the denition
of business layer objects), enhanced query stripping is used in every case, even if the
USE_ENHANCED_QUERY_STRIPPING parameter is not set.
SAP BusinessObjects Web Intelligence User's Guide
Reporting data
P U B L I C 233

The USE_ENHANCED_QUERY_STRIPPING parameter is not set by default. It can be set in the data foundation or
business layer. For more information on query stripping, see the Information Design Tool user guide.
Related Information
Viewing document properties [page 228]
Restrictions when using BEx queries [page 111]
4.2.8 Hierarchical and non-hierarchical data
Depending on their data source, reports can contain non-hierarchical or hierarchical data.
Non-hierarchical and hierarchical data behaves dierently and you work with it in dierent ways.
4.2.8.1 Working with non-hierarchical data
Non-hierarchical data has no parent-child relationships. A dimension is an example of a non-hierarchical
object.
For example, the [Country] and [City] dimensions displayed in a table, show the following values:
Country
City
US New York
US Atlanta
France Paris
France Rennes
Although the data has a hierarchical relationship (for example, "New York" and "Atlanta" are child values of
"US"), the data appears in non-hierarchical columns and the parent-child relationship is not expressed in the
data structure.
You can analyze non-hierarchical data in many ways in your reports, for example by sorting or ltering it.
4.2.8.2 Working with hierarchical data
Hierarchical data organizes data in parent-child relationships, and you can use these relationships to navigate
and analyze the data and the results returned by related measures.
Measures associated with hierarchies are aggregated based on the position of the data in the hierarchy. For
example, the [Revenue] measure calculates total revenue for [San Diego], and total revenue for [California], at
234
P U B L I C
SAP BusinessObjects Web Intelligence User's Guide
Reporting data

a less detailed level of aggregation, when associated with a [Geography] hierarchy. Navigating the hierarchy
allows you to explore dierent measure values at dierent levels of the hierarchy.
How hierarchical data appears and behaves depends on the report element that contains it.
Collapsing and expanding hierarchies
When the user is executing a collapse or expand on a hierarchy that is next to another hierarchy, the system is
doing an asymmetric collapse or expand. The collapse or expand action is done only for the selected member
for a given member on the hierarchy. The user can explicitly ask for a symmetric collapse or expand, in that
case the action is done for any instances of the selected member.
The system is doing symmetric collapse or expand by default on a hierarchy that is next to a dimension (in that
case default collapse or expand and symmetric collapse or expand is producing the same result).
Collapse or expand on a hierarchy which is changing on refresh (hierarchy node variable, prompted member
selection, modication at the cube level), may be blocked after a refresh from the preview from the Query
Panel. In that case, the user can drag and drop the hierarchy again in the column.
Related Information
Working with non-hierarchical data [page 234]
4.2.8.2.1 Restrictions concerning reporting with
hierarchical data
Some restrictions can apply when you are using hierarchical data.
These restrictions are repeated in the appropriate sections in this guide.
Restrictions when reporting with hierarchies
The restriction concerns...
Description
BEx query measures Measures which aggregate with the SUM function in Web Intelligence, and not in
the BEx query. The other types of measure aggregation are delegated.
Break on measure or detail A break is always associated with the sort on the object where it is applied. For
this reason, any hierarchy in the table the where break applies, the hierarchy be
comes at. The user can remove the break on the underlying object to restore
the hierarchy.
SAP BusinessObjects Web Intelligence User's Guide
Reporting data
P U B L I C 235

The restriction concerns... Description
Delegated measure aggregation This restriction applies whenever delegated measures are used, and is not spe
cic to reporting on hierarchical data. Delegated measure aggregation returns
#TOREFRESH, when the required aggregation is not available in the query. The
user has to refresh the document to get the new level of aggregation. This oc
curs, for example, when using the lter bar, and the user selects a value before
“all value” and vice verse when selecting “all value” before a selected value.
Delegated measure aggregation returns the #UNAVAILABLE message if the
delegated measure is in a formula on a dimension, or if it is in a multi-valued l-
ter (for example, an input control) on a dimension that is not in the context of
the aggregation of the measure. This occurs for example when dening a URL on
top of a dimension in a table where there is a delegated measure. In that case,
we recommend that you create a variable on top of the URL formula as a detail
of the original dimension and include, but hide, the original dimension in the
block.
In the formula: If ( condition) then [dimension1] else [dimension2] , any dele
gated measure that is given against this formula will still return
#UNAVAILABLE.
Drilling There is no drill-replace capability on objects from a BEx query (there is no navi
gation path).
There is no query drill on OLAP .unx sources.
Filtering on hierarchies A report/table lter where there is a hierarchy may remove rows without re
specting the hierarchy structure. For this reason, a lter can remove a parent
node currently expanded and but keep leaves or nodes collapsed. To avoid re
turning an empty table, the system automatically expands the hierarchy in the
block to shows the resulting members.
A lter can remove an intermediary node of a hierarchy. In that case, the user
cannot access the next level of member from the parent node with a simple ex
pand action. To see the descendant of the parent node, the user can do an ex
pand all.
It is not possible to lter on a merge object based on a hierarchy.
Filter bar (drill bar): when ltering through the lter bar on a hierarchy, selecting
a node that is not shown in the table because it is collapsed, the table is shown
empty. The user can do an expand all to see all the value.
To lter from the lter bar is to lter on the caption, even for OLAP business ob
jects that have a key.
Report lters When the user changes any report lter, the system proceeds with an “expand
all” on any hierarchy in the report.
Flattening hierarchies When a hierarchy becomes at, the system shows all the members of the hierar
chy at the same level, like for a dimension, without using + or - to navigate and
without contextual menu “collapse/expand”.
236 P U B L I C
SAP BusinessObjects Web Intelligence User's Guide
Reporting data

The restriction concerns... Description
Merged objects A merged object based on a hierarchy cannot be directly used in the report. This
is because where the original hierarchy has a conicting hierarchy structure (a
member A is descendant of another member B, whereas in the other hierarchy
the member A is ancestor of member B), the system cannot build a merge hier
archy. The system prevents you from dragging the merged object.
If the user builds a formula using the merged object, the system returns
#SYNTAX. The user can use directly the original hierarchy instead in the report.
A merge on a key for a OLAP business object is a data synchronization of the
same object from the same source (cube or BEx query), and is based on the in
ternal key of the value of these objects. It can also be based on the caption.
It is not possible to lter on a merged object based on a hierarchy.
OLAP The order of an OLAP dimension member in a report LOV (lter bar, input con
trol) is ascending in lexicographical order.
Filtering on an OLAP object from the lter UI lter is based on the key of the
given object.
Filtering from an input control on an OLAP dimension is ltering on the caption.
Filtering on a hierarchy is ltering on a key.
Query stripping
Query stripping is only available for .unv, OLAP, and BEx query sources.
Refreshing documents When you refresh a document, the system proceeds with a “collapse all” for any
hierarchy whose root value has changed.
Ranking on hierarchical data in a table A ranking on a table where there is a hierarchy does not take into account the
hierarchy structure of the data. For this reason, any hierarchy in a table where
the user denes a ranking becomes at.
Sorting Sorting a hierarchy and, in the case of OLAP sources, a dimension is based on
the order of the member in the underlying system. It is based on the source ordi
nal called natural order, but not lexicographical order like for other type of busi
ness object. The sort on a hierarchy respects the structure of the hierarchy; it is
sorting sibling members at a given level.
Sorting on a measure does not preserve the order of member within a hierarchy
in the same table. For this reason the system is showing the hierarchy at in a
table, where the user applied a sort on measure.
Variables Variable (formula) on hierarchy: a formula based on a hierarchy is always result
ing in at value list (no hierarchical data).
SAP BusinessObjects Web Intelligence User's Guide
Reporting data
P U B L I C 237
4.2.8.2.2 Working with hierarchical data in tables
Hierarchies appear in tables as hierarchical columns.
A hierarchical column displays the hierarchy in parent-child relationships. You can explore the hierarchy by
expanding and collapsing its values.
Example
A hierarchical column in a table
The following table displays the [Product] hierarchy and the [Revenue] measure:
Product
Revenue
Grocery 203,124
Baking Goods 100,101
Beverages 54,345
Breads 48,678
The measure displays the total revenue for the corresponding value in the hierarchy. For example, the total
revenue for Grocery products is 203,124.
You can nd more information about Beverages by expanding the [Beverages] member:
Product
Revenue
Grocery 203,124
Baking Goods 100,101
Beverages 54,345
Soft Drinks 10,100
Soda 20,200
Milk 24,045
Breads 48,678
When you expand the member, the Revenue column also displays the measure values associated with
dierent kinds of beverage.
4.2.8.2.3 Hierarchical data in cross tables
Hierarchical data behaves similarly in cross table to how it behaves in tables.
If an axis of the crosstab is based on a hierarchy, you can click a data item to expand it.
238
P U B L I C
SAP BusinessObjects Web Intelligence User's Guide
Reporting data
Example
Hierarchical data in a cross table
The following crosstab has the [Time] hierarchy on the vertical axis and the [Product] hierarchy on the
horizontal axis.
Time
Grocery
2008 203,110
2009 321,400
2010 350,444
If you click the [Grocery] item, it expands to display its child items and displays the corresponding measure
values.
Time
Grocery
Baking Goods Beverages Bread
2008 54,570 67,000 81,540
2009 101,000 98,990 121,410
2010 124,000 133,000 93,444
4.2.8.2.4 To expand and collapse all the hierarchies in a
table
In a table with hierarchical values, you can expand all the hierarchies to show all possible combinations of
hierarchy members.
Procedure
1. From the BI launch pad, open a document based on a .unx OLAP universe in Web Intelligence Rich Client
or Web Intelligence Applet interface.
2. Switch to Reading or Design mode.
3. To expand all the hierarchies in a table, right-click anywhere in the table and select Hierarchical
Navigation All Expand All Hierarchies .
4. To collapse all the hierarchies in a table, right-click anywhere in the table and select Hierarchical
Navigation All Collapse All Hierarchies .
SAP BusinessObjects Web Intelligence User's Guide
Reporting data
P U B L I C 239
4.2.8.2.5 Exploring a hierarchy asymmetrically
Asymmetric exploration is the way you explore a hierarchy by default when you select members to expand or
contract them.
When you explore a hierarchy asymmetrically, your expand and collapse actions are applied only to the current
value of the other dimensions that appear next to the explored hierarchy.
Example
Asymmetric exploration
A table contains the [Product] dimension and the [Geography] hierarchy.
Product
Geography Revenue
Grocery California 540,000
Beverages California 453,300
If you expand the [California] member to display cities in California in the rst row of the table, the
expansion applies only to the currrent value (Grocery) of the [Product] dimension.
Product
Geography Revenue
Grocery California 540,000
Los Angeles 320,000
San Diego 100,000
San Francisco 120,000
Beverages California 453,300
Related Information
To explore a hierarchy asymmetrically [page 241]
To expand and collapse all the hierarchies in a table [page 239]
240
P U B L I C
SAP BusinessObjects Web Intelligence User's Guide
Reporting data
4.2.8.2.5.1 To explore a hierarchy asymmetrically
You can expand a hierarchy for only the current values of a dimension or hierarchy.
Procedure
1. Open a Web Intelligence document based on a hierarchical data source in any mode.
2. To expand the child members of a member, click the member, or right-click and select Expand
Children from the menu.
The hierarchy expands only for the current value of the dimensions or hierarchies next to the expanded
hierarchy in the table.
3. To expand all descendant members of a member, click the member, or right-click and select Expand
Descendants .
The hierarchy collapses only for the current value of the dimensions or hierarchies next to the expanded
hierarchy in the table.
4. To collapse the child members of a member, click the expanded member, or right-click and select
Collapse Children
The hierarchy collapses only for the current value of the dimensions or hierarchies next to the collapsed
hierarchy in the table.
4.2.8.2.6 Exploring a hierarchy symmetrically
When you explore a hierarchy symmetrically, your expand and collapse actions are applied in relation to all
values of the other hierarchies or dimensions that appear next to the explored hierarchy in the table.
Example
Symmetric exploration
A table contains the [Product] dimension and the [Geography] hierarchy.
Product
Geography Revenue
Grocery California 540,000
Beverages California 453,300
If you expand the [California] member on the rst row to display cities in California, the expansion applies
to both values of the [Product] dimension.
Product
Geography Revenue
Grocery California 540,000
Los Angeles 320,000
SAP BusinessObjects Web Intelligence User's Guide
Reporting data
P U B L I C 241

Product Geography Revenue
San Diego 100,000
San Francisco 120,000
Beverages California 453,300
Los Angeles 120,000
San Diego 200,000
San Francisco 133,300
Related Information
To expand and collapse all the hierarchies in a table [page 239]
To explore a hierarchy symmetrically [page 242]
4.2.8.2.6.1 To explore a hierarchy symmetrically
You can expand a hierarchy for all values of a dimension or hierarchy.
Procedure
1. Open a Web Intelligence document based on a hierarchical data source in any mode.
2. To expand the child items of a member, right-click the member and select Hierarchical Navigation
Symmetric Expand Children .
The hierarchy expands for all values of the dimensions or hierarchies next to the expanded hierarchy in the
table.
3. To expand all descendant items of a member, right-click the member and select Hierarchical Navigation
Symmetric Expand Descendants .
The hierarchy expands for all values of the dimensions or hierarchies next to the expanded hierarchy in the
table.
4. To collapse the child members of a member, right-click the member and select Hierarchical Navigation
Symmetric Collapse Children
The hierarchy collapses for all values of the dimensions or hierarchies next to the collapsed hierarchy in the
table.
242
P U B L I C
SAP BusinessObjects Web Intelligence User's Guide
Reporting data

4.2.8.2.7 Changing the drill focus of a hierarchy
You can change the drill focus when exploring hierarchies.
When you change the drill focus you lter out the parent member and all members at and above its level when
expanding it.
Changing the drill focus is useful when creating charts on hierarchical data. Because measure values
associated with parent members are more aggregated than their child members, it is dicult to display them
on the same chart axis using the same scale. By removing the parent member, it is possible to display the
values for the child members using the same scale.
Example
Drilling down on a hierarchy
You have the following data in a table:
Time
Revenue
2008 29,358,677.22
2009 30,242,323
2010 45,320,243
When you drill down on the [2010] member, you see the following display:
Time
Revenue
Q1 12,500,650
Q2 14,353,231
Q3 8,342,231
Q4 10,124,131
The year members, with values that are much larger than the measure values of the quarter members, do
not appear in the display.
4.2.8.2.7.1 To change the drill focus of a hierarchy
You can drill up and down in a table hierarchy.
Procedure
1. Open the Web Intelligence document in Design mode.
2. To drill down on a table hierarchy, do one of the following:
SAP BusinessObjects Web Intelligence User's Guide
Reporting data
P U B L I C 243

○ In the Web Intelligence HTML interface, right-click the member you want to expand and select Start
Drill Drill down to .
○ In the Web Intelligence Applet interface or Web Intelligence Rich Client, right-click the member you
want to expand and select
Start Drill Drill .
3. To drill up on a table hierarchy, right-click any child member of a member you previously drilled down on
and select Drill Focus Drill Up .
4.2.8.2.8 Aggregating hierarchical data
Hierarchical measure data is aggregated dierently depending on whether the method of aggregation is default
or explicit.
The aggregation logic is based on the following rules:
● Data sets used for aggregation:
1. When there is a hierarchy in a measure context the measure values for the root members of the
hierarchy are aggregated - this is by default (the Aggregate() mechanism is not explicitly declared).
2. For explicit types (SUM, MAX, MIN), the hierarchical nature of the data is ignored. All the visible data is
aggregated, including data that has already been aggregated (parent members already aggregated).
● Sensitivity to the collapse/expand status.
1. Explicit aggregation only aggregates visible data, except when the set expression is used for a specic
hierarchy, then an aggregation is performed on the objects dened in the set expression.
2. Default aggregation including the aggregate() function is not sensitive to the state of the collapse/
expand.
4.2.8.2.8.1 Default aggregation
In a default aggregation, the collapsed or expanded state of a hierarchy's item is not taken into account.
A measure in a report block is always aggregated with the context of that block. For example, if the block
contains only one [Year] dimension, the measure will be aggregated for each value of the dimension: 2004,
2005, 2006 and so on. Also, if you aggregate every value of the measure for each quarter of each [Year] value
using the Sum() function by default, Web Intelligence returns the sum of the measure for every quarter of each
[Year] value.
This method of aggregation is called default aggregation, where it uses the default universe aggregation
function specied by the universe designer at the universe creation. The default aggregation function is usually
specied in the universe, although not always. For Excel data sources for instance, it is specied in the Query
Panel. The aggregation is processed by Web Intelligence's calculator. The calculator can run aggregations using
functions such as Sum(), Average(), Count(), Min() or Max().
A default aggregation uses the rolled-up values returned by the database. In other words, it is compatible with
the aggregated values returned by the database. Default values are calculated by applying the default
aggregation function to all the root values in the hierarchy. This means that a default aggregation does not
count values more than once except in situations where the same value appears beneath dierent root items in
a hierarchy.
244
P U B L I C
SAP BusinessObjects Web Intelligence User's Guide
Reporting data
Delegated aggregation
You can declare a function for a measure, which, by default, is delegated to the database. This means that when
you use this measure in a report block, a query is sent to the database to retrieve the result of the aggregation
depending on the context.
Delegated aggregations are mainly used for measures associated with hierarchical objects coming from SAP
Business Explorer (BEx). That is because Web Intelligence cannot aggregate the values of a hierarchy that
depends on the nodes and leaves retrieved by the query. Only the database knows the content of the
hierarchical object in its entirety and is therefore able to aggregate a measure depending on that content.
Related Information
Examples of default and explicit aggregation [page 246]
4.2.8.2.8.2 Explicit aggregation
In an explicit aggregation, you declare an aggregation function for the measure you want to aggregate.
In an explicit aggregation, Web Intelligence references the visual state of the hierarchy and uses the collapsed
or expanded state of the members of the hierarchy to run calculations. As a result, values can be counted more
than once, and the result of calculations can change depending on whether an item is collapsed or expanded.
For example, if an item is expanded and an explicit aggregation references both the item and one if its child
items, depending on the rollup calculation, the value of the child may be counted twice: once for itself and once
with the value of its parent. That is because Web Intelligence is adding the child and parent value.
Restriction concerning set-based explicit aggregation
When a measure is aggregated along hierarchies that are not part of the set expression declared in the
aggregation function, the aggregation is not implicit.
For example, when hierarchies are present in a table and aggregation using set is in the table footer and the
hierarchies in the table are not specied in the set expression, if there is a lter somewhere in the report which
removes the initial roots of the hierarchy in the table, the system will not aggregate values for these roots, but
along the original unltered roots (the original query result).
Related Information
Examples of default and explicit aggregation [page 246]
SAP BusinessObjects Web Intelligence User's Guide
Reporting data
P U B L I C 245

4.2.8.2.8.3 Examples of default and explicit aggregation
If you include a measure in a cell without speciying an aggregation function, or if you use the Aggregate
function, the measure is calculated using the default aggregation function.
Example
Default and explicit aggregation
You have a hierarchy with the following data and the hierarchy appears fully expanded in a report:
Product
Unit Sales
Drink 24,597
Alcoholic Beverages 6,838
Beverages 13,573
Food 19,194
Baked Goods 7,870
● Placed in the table footer, [Unit Sales] returns 43,791. This default aggregation returns the total
aggregated value of the measure (24,597 + 19,194).
● Placed in a table footer, Sum(Unit Sales]) returns 72.072. This explicit aggregation counts every
visible value in the hierarchy (24,597 + 6,838 + 13,573 + 19,194 + 7,870).
● The explicit aggregation Sum([Unit Sales];[Product]&[Drink].children) returns 20,411
(6,838 + 13,573) because [Drink] is expanded.
● The explicit aggregation Sum([Unit Sales];{[Product]&[Drink];[Product]&[Beverages]})
returns 38.170 (24,597 + 13,573). The value for [Beverages] appears twice in the calculation because
[Drinks] is expanded.
● The default aggregation Aggregate([Unit Sales];{[Product]&[Drink];[Product].
[Beverages]}) returns 24,597. The value for [Beverages] does not appear twice in the calculation.
If you collapse the [Drink] node in the report, the calculations are as follows:
● [Unit Sales] returns 43,791. The default aggregation is not aected by the change in display.
● Sum([Unit Sales]) returns 51,661 (24,597 + 19,194 + 7,870). The explicit aggregation uses all the
visible values to return the value.
● Sum([Unit Sales];[Product].&[Drink].children) returns a non-NULL value even though the
child members of [Drink] are not visible.
● Sum([Unit Sales];{[Product].&[Drink];[Product].&[Beverages]}) returns 38,170
because [Beverages] is not visible. The explicit aggregation uses visible values only.
● Aggregate([Unit Sales];{[Product].&[Drink];[Product].&[Beverages]}) returns
24,597. The default aggregation is not aected by the change in display.
246
P U B L I C
SAP BusinessObjects Web Intelligence User's Guide
Reporting data

4.2.8.2.9 Setting default hierarchy levels in a report table
Using the Hierarchical Navigation option, you can set the default hierarchy member levels that are visible in a
hierarchy table so that they will remain visible to the preferred level or xed at the root level, even after refresh
and data purge actions.
Note
If you set a default level, and then add a quick lter, all hierarchical levels are exposed for selection in the
lter. If you select a level that is lower than the level set for hierarchy expansion, then you receive no values.
This option is available from the right-click contextual menu for a report table. If the lter is searching for
hierarchy members that are on levels lower that those specied for the Hierarchical Navigation, then the table
will appear empty.
Normally, the hierarchy in a table is automatically collapsed to the root hierarchy member in the following
cases:
● You have just opened the document.
● You have changed the root members of the hierarchy.
● You have purged or refreshed a document.
If you do not use this option, then when a document is refreshed and the root members of the hierarchy are
changed, or when the document has been purged and refreshed, the hierarchy in the table is automatically
collapsed to the root hierarchy member.
Impact of a document refresh on hierarchies
Refreshing a document that contains hierarchies can impact the way they appear in a report. A collapsed
hierarchy for example might expand after your refresh the document.
If the Refresh on open option is activated, the data is purged when you open the document. As a consequence,
hierarchies are reset and collapsed to avoid having missing nodes after a refresh that could corrupt the
document. However, if the document contains lters that apply to hierarchies, they are expanded to prevent
the creation of empty blocks caused by a negative lter on the roots of a hierarchy that could potentially be
ltered out.
This behavior does not apply when you do a standard refresh in a document because there is no data purge.
Therefore, Web Intelligence has a reference to compare with and does not need to reset the hierarchies.
4.2.8.2.9.1 Using the Default Level Expansion setting
To avoid expanding all levels of a hierarchy, you can use the Default Level Expansion setting to specify which
levels of the hierarchy should be expanded.
In Web Intelligence, hierarchies support up to 99 levels. If you set the Default Level Expansion to None in a
hierarchy that has four levels for instance, the setting does not apply to the hierarchy. In this instance, all levels
SAP BusinessObjects Web Intelligence User's Guide
Reporting data
P U B L I C 247
will be collapsed in the report after a refresh with data purge or a refresh on open. However, if a lter is applied
to that hierarchy, the four levels will be expanded.
Caution
Setting the Default Level Expansion setting to None in a hierarchy does not mean that it will be collapsed. It
means that you do not apply any default expansion level.
Related Information
Setting default hierarchy levels in a report table [page 247]
To set the default hierarchy level in a report table [page 248]
4.2.8.2.9.2 To set the default hierarchy level in a report table
You can set the default number of hierarchy levels on a hierarchy member that are visible in a report table.
Procedure
1. From the BI launch pad, open a document in Web Intelligence.
2. In Design mode, select the report that contains the table you want to congure.
3. Right-click in the table the hierarchy whose level you want to set, and select Hierarchical Navigation
Default Level Expansion .
4. In the Default Level Expansion contextual list, do one of the following:
○ Set the default level expansion from None to 4.
○ Select More to select or enter in the Default level expansion dialog box any level between 1 and 99.
4.2.9 Finding text in a report page
You can search for text in a report in a Web Intelligence document in Reading or Design mode.
Procedure
1. Open a Web Intelligence document.
2. Do one of the following:
248
P U B L I C
SAP BusinessObjects Web Intelligence User's Guide
Reporting data
○ If you are in Reading mode, click the Find icon on the toolbar.
○ If you are in Design mode, click the Find icon on the toolbar in the File tab toolbar.
The Find or Search Bar appears at the bottom of the report panel.
3. Type text in the Find or Search Bar box and press Enter or click the Find icon.
Note
To perform a case-sensitive search, click the arrow next to the box and select Match case.
4. If the text occurs more than once, click the Next or Previous icon to highlight other occurrences of the text.
Note
If you are creating a report using the Web Intelligence Applet interface or Web Intelligence Rich Client,
you can click Highlight all to highlight all occurrences of the text on the page. This option is not available
once you have saved or closed the document.
Results
To close the Find or Search Bar box, click the X located at the far end of the Find or Search Bar.
4.2.10 Viewing modes
In the Reading and Design document modes, you can view reports in dierent modes depending on how you
want to work with data and how you want the data to appear.
The viewing modes are controlled by buttons at the bottom of the Web Intelligence screen, on the status bar.
4.2.10.1 Page view mode
In the Reading and Design document modes, the Page view mode displays the page layout of reports, including
page margins, headers, and footers.
Use Page view mode when you want to ne-tune the formatting of tables and charts and the layout of report
pages.
4.2.10.1.1 Setting the report size in Page mode
You can set a report size to a specic percentage or to a specic number of pages in Page mode.
For example, if you set a report to be one page tall, all elements on the report are re-organized to t on one
horizontal page.
SAP BusinessObjects Web Intelligence User's Guide
Reporting data
P U B L I C 249

Setting the report size overrides all other settings that control the page layout of a report. For example, if you
have a report with three sections and the report is set to start each section on a new page, the report still
contains one page if the report is set to be one page tall.
The report size setting takes eect in Page mode only.
4.2.10.1.1.1 To set the report size
You can set the width and height of the report, or even set the size as a percentage.
Procedure
1. In a Web Intelligence document in Design mode, select the Page Setup tab.
2. In the Scale to Page subtab, select the report width in the Width box and the height in the Height box, or set
the report size as a percentage in the Scale box.
If you dene a percentage, the width and height are calculated automatically.
4.2.10.2 Quick Display view mode
In the Reading and Design document modes, the Quick Display view mode is the default display mode.
It is a pagination mode that is based on the data, rather than the physical size of report pages. The Quick
Display view mode displays just the tables, reports, and free standing cells in reports and displays a maximum
number of records vertically and horizontally, depending on the Quick Display settings. The Quick Display view
mode also species the minimum page width and height and the amount of padding around the edges of the
report.
Because the Quick Display view mode restricts the number of horizontal and vertical rows, a report might not
contain all possible data.
Use the Quick Display view mode when you want to focus on analyzing results, add calculations or formulas, or
add breaks or sorts to tables to organize results.
The Quick Display view mode properties are congurable either by the BI administrator, or directly in the
interface.
Conguration
Property
BI administrator
● Maximum vertical records
● Maximum horizontal records
● Minimum page width
● Minimum page height
● Right padding
250 P U B L I C
SAP BusinessObjects Web Intelligence User's Guide
Reporting data
Conguration Property
● Bottom padding
Interface
● Vertical records per page
Note
○ This property impacts only horizontal tables
and cross tables.
○ Horizontal tables are never cut vertically.
○ The number of rows in a horizontal table is
ignored in vertical records calculations.
●
Horizontal records per page
Note
○ This property impacts only vertical tables,
forms and cross tables.
○ The number of rows in a vertical table is
ignored in horizontal records calculations.
Other notes:
● Table headers and footers do not count as rows.
● Free standing cells and charts do not count as rows.
● Section cells do not count as rows when the section is not empty.
● Sections cells count as vertical rows when the section is empty.
● The Avoid Page Break in Block option has no eect in Quick Display view mode.
4.2.10.2.1 To change Quick Display mode settings
You can change the number of horizontal and vertical records per page in Quick Display mode.
Procedure
1. In a Web Intelligence document in Design mode, right-click the report and select Format Report to display
the Format Report dialog box.
2. Select the General tab.
3. Select the number of horizontal and vertical records per page in the Page content (Quick Display mode
only) section.
4. Click OK to return to the document.
SAP BusinessObjects Web Intelligence User's Guide
Reporting data
P U B L I C 251

4.2.10.3 To switch between viewing modes
You can switch between Quick Display and Page view modes.
Procedure
1. Open a Web Intelligence document, in the Reading or Design document mode.
2. In the status bar at the bottom of the document, select one of the following icons:
○ To display a report in Quick Display view mode, click the Quick Display icon.
○ To display a report in Page view mode, click the Page icon.
4.2.11 Folding and unfolding report data
You can hide and display report data by folding and unfolding the display of dierent report elements.
You can fold and unfold sections, breaks and tables. Data is concealed and displayed in dierent ways
depending on the report element.
Report element Result
Section
When a section is folded, section details are hidden and free
cells only are displayed. In Reading mode, you can fold and
unfold sections.
Table or break
When a table or break is folded, the rows are concealed, and
only headers and footers are displayed. Tables must have
headers and footers to be folded and unfolded.
Vertical tables, horizontal tables and cross tables can be
folded and unfolded.
In Reading mode, you can fold and unfold sections.
4.2.11.1 To fold and unfold report data
You can fold and unfold data in Reading and Design mode by activating the outline.
Procedure
1. Open a Web Intelligence document.
252
P U B L I C
SAP BusinessObjects Web Intelligence User's Guide
Reporting data
2. Select a cell in the table.
3. Do one of the following:
○ In the Reading mode, click Outline.
○ In the Design mode, in the Analysis tab, select the Interact subtab and click Outline.
The fold and unfold bars appear to the side of and above the report panel, depending on the report
structure.
4. Use the +/- or arrow icons on the bars, which correspond to and are aligned with individual report
elements, to fold and unfold them.
5. Use the icons at the side or upper part of the bar to fold and unfold all instances of a type of report element.
4.2.11.2 To redisplay all hidden content in a report
You can hide tables, cells and sections in reports.
Procedure
1. Open a Web Intelligence document in Design mode.
2. Right-click the report containing hidden content and click Hide Show All Hidden Content .
4.2.12 Formatting the report layout
You can format your report and report elements in order to present the report with a company style.
You can format the report layout manually, or you can create a company stylesheet using a CSS le. You can
add color background, corporate images, and so on. To change the report format, you must view the report in
Design mode in order to access the report formatting options. You can format the following report elements:
To set the... Do this...
Name the report
Right-click in the report, select Format Report
General , then name the report.
Number of records per page
Right-click in the report, select Format Report
General , then set the number of records per page.
Report border style
Right-click in the report, select Format Report
Border , set the border style, thickness, and color.
Report background
Right-click in the report, select Format Report
Appearance and set the background (color, pattern,
image).
SAP BusinessObjects Web Intelligence User's Guide
Reporting data
P U B L I C 253
To set the... Do this...
Page size
Right-click in the report, select Format Report
Layout , select a page size.
Page orientation
Right-click in the report, select Format Report
Layout , select landscape or portrait orientation.
Page scaling
Right-click in the report, select Format Report
Layout , select the page scaling/
Page margins
Right-click in the report, select Format Report
Layout , and set the dierent margin sizes, as required.
Show/hide header
Right-click in the report, select Format Report
Layout , select or unselect Show header.
or
Right-click in the report header, select Format Header,
select or unselect Show header.
Header size
Right-click in the report, select Format Report
Layout , enter a size for the header.
or
Right-click in the report header, select Format Header, enter
a size for the header.
Header border style
Right-click in the report header, select Format Header,
select a style for the header border.
Header background Right-click in the report header, select Format Header,
select a background color, a pattern or enter an address for
an image.
Show/hide footer
Right-click in the report, select Format Report
Layout , select or unselect Show footer
or
Right-click in the report footer, select Format Footer and
select or unselect Show footer.
Footer size
Right-click in the report, select Format Report
Layout , enter a size for the footer.
or
Right-click in the report footer, select Format Footer, enter a
size for the footer.
Footer border style
Right-click in the report footer, select Format Footer, select
a style for the footer border.
254 P U B L I C
SAP BusinessObjects Web Intelligence User's Guide
Reporting data

To set the... Do this...
Footer background Right-click in the report footer, select Format Footer, select
a background color, pattern or enter an address for an
image.
Related Information
To format the appearance of reports and their headers, footers, sections, tables, and table cells [page 255]
Formatting your reports using Cascading Style Sheets [page 298]
Creating a corporate palette for charts [page 424]
Formatting tables and table cells [page 327]
4.2.12.1 To format the appearance of reports and their
headers, footers, sections, tables, and table cells
You can dene the background color and pattern of a report, or its headers, footers, sections, tables, and even
specic cells in tables. The pattern can be a skin, also known as a theme, an image from a URL address or a le.
Procedure
1. In a Web Intelligence document in Design mode, right-click the report, a header, footer, report section,
table, or a selection of one or more cells in a table and select the applicable Format option from the
contextual menu.
For example, if you right-click on a selection of a group of cells, select Format Cells from the contextual
menu.
2. In the format dialog box that appears, select the Appearance tab.
The Background section in this tab shows the settings you can apply to your selected items.
3. To select a color for the background of the selected items:
a. Click the radio button next to the color palette icon.
b. Click the arrow next to the color palette icon to display the palette.
c. Select a color from the palette.
d. Click OK to return to the document.
Note
When the background color of cells are dened (even as white), they take precedence over the
table background color. If you apply a background color to an entire table but one or more cells
remain white, open the Format Cells dialog box for these cells and check their color background
setting.
SAP BusinessObjects Web Intelligence User's Guide
Reporting data
P U B L I C 255
4. To format the pattern for the selected items, do one of the following:
○ To select a skin, select the Skin radio button, and select a skin from the dropdown list.
Note
If you are formatting the table appearance, you need to set the horizontal or vertical padding value
to greater than 0 in the Spacing and Padding section of the Appearance tab, otherwise the skin will
not appear.
○ To select an image at a URL location, select the Image from address radio button, and do one of the
following:
○ Paste in the text box the URL address for an image. Click the Validate icon.
○ To create a dynamic image using a complex formula, click the Formula Editor icon next to the text
box.
Example: Table cell syntax
“<URL>”+”<column header object>”+”.<image format>”
Note
○ To access an image on the corporate server, type the image name. The application inserts
boimg:// when you click Apply.
○ The dynamic image appears only if the column header object used to dene the image is in
the table. However, the object can be hidden. If the object is not in the table, then there is
no context available to calculate the images address.
○ To select use an image from a le on your computer or a server, select the Image from le radio button,
click Add or Browse, navigate to the image and click Open.
○ If you are using an image, you can select a display location from the Display dropdown list.
○ If you select a Normal display, then you can set the position of the image from the Position
dropdown lists.
○ If you select Stretch, the image adjusts to t the entire space, irrespective of the image height and
width settings.
○ If you select Tile, the image is repeated in the space.
○ If you select a Horizontal Tile or Vertical Tile location, then you also have additional Position
options.
Note
To remove an image or pattern, select None for the pattern.
5. Click OK to return to the document.
Results
Restriction
Because there is no background image feature in Excel, when you save or export a report to the Excel
format any background images are not exported to the output le.
256
P U B L I C
SAP BusinessObjects Web Intelligence User's Guide
Reporting data
Related Information
To build a formula in the Formula Editor [page 311]
Formatting the report layout [page 253]
Formatting tables and table cells [page 327]
4.2.13 Reusing report elements in other documents
You can reuse a report element in other applications. When you copy a report element, Web Intelligence
automatically stores a copy in several formats:
● In an image format.
● In a text format so that it can be pasted in a text editing application.
● In a Web Intelligence format so that it can be pasted in the same document.
● In a shared object so that it can be pasted in a dierent Web Intelligence document.
In the Web Intelligence Applet interface, the creation of the shared object can take a while and aect
performance as a result.
You can make the shared object creation optional and disable it to avoid performance drops.
Note
If you disable this option, you will not be able to paste report elements in other Web Intelligence
documents.
Related Information
To enable or disable report elements reuse in other documents [page 257]
4.2.13.1 To enable or disable report elements reuse in other
documents
If you do not plan on reusing report elements in other documents, you can disable the reuse option.
Procedure
1. Click Properties Application .
If you are using Web Intelligence Rich Client, click the Viewing tab.
SAP BusinessObjects Web Intelligence User's Guide
Reporting data
P U B L I C 257

2. Uncheck Reuse copied report elements in other Web Intelligence documents to disable the reuse option.
4.2.14 Printing reports
You can print one or multiple reports from a Web Intelligence document.
You print documents directly from Web Intelligence Applet interface and Web Intelligence Rich Client. However,
when you print from the Web Intelligence HTML interface, you export the document to a PDF le that you can
then print.
Note
If a report is wider than the width of the paper size dened in the Report Page Layout, page breaks are
inserted. The paper size and page orientation for printing can be dierent from the paper size and page
orientation set for the reports when you view them in Web Intelligence Applet interface or Web Intelligence
Rich Client.
4.2.14.1 To print reports in Web Intelligence
A variety of methods are available for printing reports in Web Intelligence.
Procedure
1. Open a Web Intelligence document.
2. Do one of the following:
○ In the Web Intelligence HTML interface:
○ If you are in Reading mode, click the arrow next to the Print icon on the toolbar.
○ If you are in Design or Data mode, click the arrow next to the Print icon in the File tab toolbar.
○ In the Web Intelligence Applet interface or Web Intelligence Rich Client interface:
○ If you are in Reading mode, click the Print icon on the toolbar.
○ If you are in Design or Data mode, click the Print icon in the File tab toolbar.
The Print dialog box appears.
3. Do one of the following:
○ In the Web Intelligence HTML interface: choose your printing options and click Print.
○ In the Web Intelligence Applet interface or Web Intelligence Rich Client interface: choose your printing
options and click OK.
○ In the Web Intelligence HTML interface: the File Download dialog box appears. Open the PDF le and
print the report.
○ In the Web Intelligence Applet interface or Web Intelligence Rich Client interface: the report is sent to
the printer.
258
P U B L I C
SAP BusinessObjects Web Intelligence User's Guide
Reporting data

Note
In the Web Intelligence HTML interface, click the Print icon to print the report with current settings.
4.2.15 Tracking changes in data
To make informed and eective business intelligence decisions, you need to understand how the data on which
you base those decisions changes over time.
You can track and display data changes to help you focus your analysis on key areas and avoid wasting time
exploring irrelevant data.
When you track data changes, you select a particular data refresh as a reference point. This data is known as
the reference data. When you activate data tracking, you see your data in relation to the reference data.
Here are some examples of data tracking:
● If an outlet no longer appears in a list of the top outlets by sales, it would be interpreted as deleted from the
list. You can use this information to investigate why the outlet is no longer a top performer.
● If sales have decreased in a region, data tracking displays the decrease. You can then drill down into the
data for the region to understand why revenue is falling.
In both these cases, data tracking makes the current data more meaningful by placing it in context with older
data. Without this context it is much more dicult to identify trends.
Note
● The information in the Status Bar at the bottom of the report indicates the document level status. An
asterisk on a report tab indicates that change tracking is activated on the report.
● Status “changes” of tracking data changes is only for a detail value when displayed with its associated
dimension in the table. When the detail is given without it is associated dimension it is considered as a
dimension and does not show the status changes (but only shows when the detail is inserted/deleted).
Related Information
Types of data change [page 260]
Automatic update tracking mode [page 260]
Absolute reference data tracking mode [page 260]
To activate data tracking [page 261]
To display changed data [page 262]
Conguring the appearance of changed data [page 261]
To congure the appearance of changed data [page 262]
How changed data is displayed in blocks [page 263]
How changed data is displayed in blocks with breaks [page 266]
How changed data is displayed in sections [page 265]
How changed data is displayed in reports with merged dimensions [page 264]
SAP BusinessObjects Web Intelligence User's Guide
Reporting data
P U B L I C 259

How changed data is displayed in charts [page 267]
4.2.15.1 Types of data change
You congure the display of data changes through the interface or formula language.
You can track the following types of data change:
● Inserted data
● Deleted data
● Changed data
● Increased values
● Decreased values
The formula language provides advanced users with additional power and exibility in displaying and
formatting changed data.
4.2.15.2 Automatic update tracking mode
In the Auto-update data tracking mode, you always compare the current data with the data before the last
refresh.
This is achieved by automatically setting the current data as the reference data just before each refresh. The
reference data is always one refresh behind the current data.
Automatic data tracking is appropriate for scheduled documents when you want to compare the current data
with the data before the last refresh.
Restriction
This applies only to documents scheduled to the Web Intelligence output format.
4.2.15.3 Absolute reference data tracking mode
In the Fixed data tracking mode, you manually select the reference data in the Data Tracking dialog box.
You continue to use this data as a reference point until you update the reference point.
260
P U B L I C
SAP BusinessObjects Web Intelligence User's Guide
Reporting data

4.2.15.4 To activate data tracking
You can activate data tracking in the Data Tracking dialog box.
Context
Note
If your user rights do not permit document tracking, then the options mentioned below are grayed out.
Procedure
1. Open a Web Intelligence document.
2. Do one of the following:
○ In any mode, click Track changes on the status bar at the bottom of the window.
○ In the Reading mode, click Track in the toolbar.
○ In the Design mode, in the Analysis tab, select the Data Tracking subtab and click Track.
3. In the Data Tracking dialog box, select the Data tab.
4. To compare the data with the last refresh, select Compare with last data refresh.
When you select this option, the current data becomes the reference data after each data refresh. The
report always shows the dierence between the most recent data and the data before the last refresh.
If this option is selected, the status bar displays Track changes: Auto-update.
5. To compare the data with a specic data refresh, select Compare with data refresh from and select the date
of the data refresh from the list.
When you select this option, the data refresh you choose becomes the reference data. The report always
shows the dierence between the most recent data and the data refresh you chose.
If this option is selected, the status bar displays Track changes: Fixed data.
6. Select the reports that you want to display data tracking from the Reports with data tracking shown list.
7. Select Refresh data now to refresh the data when the dialog box closes.
8. Click OK to close the Data Tracking dialog box.
4.2.15.5 Conguring the appearance of changed data
You can congure the appearance (font style, size and color) of changed data in your document.
You can seperately congure the appearance of the following changes:
● Inserted, deleted dimensions and changed detail values
SAP BusinessObjects Web Intelligence User's Guide
Reporting data
P U B L I C 261

● Increased or decreased measure values
Measure values can also adopt the formatting of inserted or deleted dimension values. For example, if a
dimension value disappears from a list of values in a block, and the block also shows a measure value for the
dimension, both the dimension and measure values appear as deleted data.
The BI administrator denes the default appearance of changed data in the Central Management Server
(CMS). When you congure the appearance of changed data locally, you override the CMS defaults.
4.2.15.5.1 To congure the appearance of changed data
You can congure the appearance of changed data in the Data Tracking dialog box.
Procedure
1. Open a Web Intelligence document in Reading or Design mode.
2. Click Track Changes on the status bar at the bottom of the window to display the Data Tracking dialog box.
3. In the Options tab, select each type of changed data you wish to display and click Format to specify how
you want the changes to appear.
4. Click OK to close the Data Tracking dialog box.
Related Information
Highlighting data using conditional formatting [page 269]
4.2.15.5.2 To display changed data
You can choose whether to display changed data when data tracking is activated.
Procedure
1. Open a Web Intelligence document in Reading or Design mode.
2. Activate data tracking.
3. Do one of the following:
○ If you are in Reading mode, select Track Show Changes .
○ If you are in Design mode, in the Analysis tab, in the Data Tracking subtab, click Show Changes
262
P U B L I C
SAP BusinessObjects Web Intelligence User's Guide
Reporting data
4. Select the option again to turn o the display of changed data.
Related Information
Conguring the appearance of changed data [page 261]
To activate data tracking [page 261]
4.2.15.5.3 How changed data is displayed in blocks
This example uses a document with a block showing [Country], [Year] and [Revenue].
Example
Changed data in a simple block
The original data is as follows:
Country
Year Revenue
France 2003 1000
France 2004 2000
Japan 2002 1000
Poland 2002 1200
After a refresh, the data is as follows:
Country
Year Revenue
France 2004 3000
Japan 2003 900
Poland 2002 800
UK 2004 900
When data tracking is activated and data changes displayed, the block appears as follows:
Country
Year Revenue Formatting
France 2003 1000 [deleted data formatting on all
cells]
France 2004 3000 [increased data formatting on Rev
enue cell]
Japan 2002 1000 [deleted data formatting on all
cells]
SAP BusinessObjects Web Intelligence User's Guide
Reporting data
P U B L I C 263
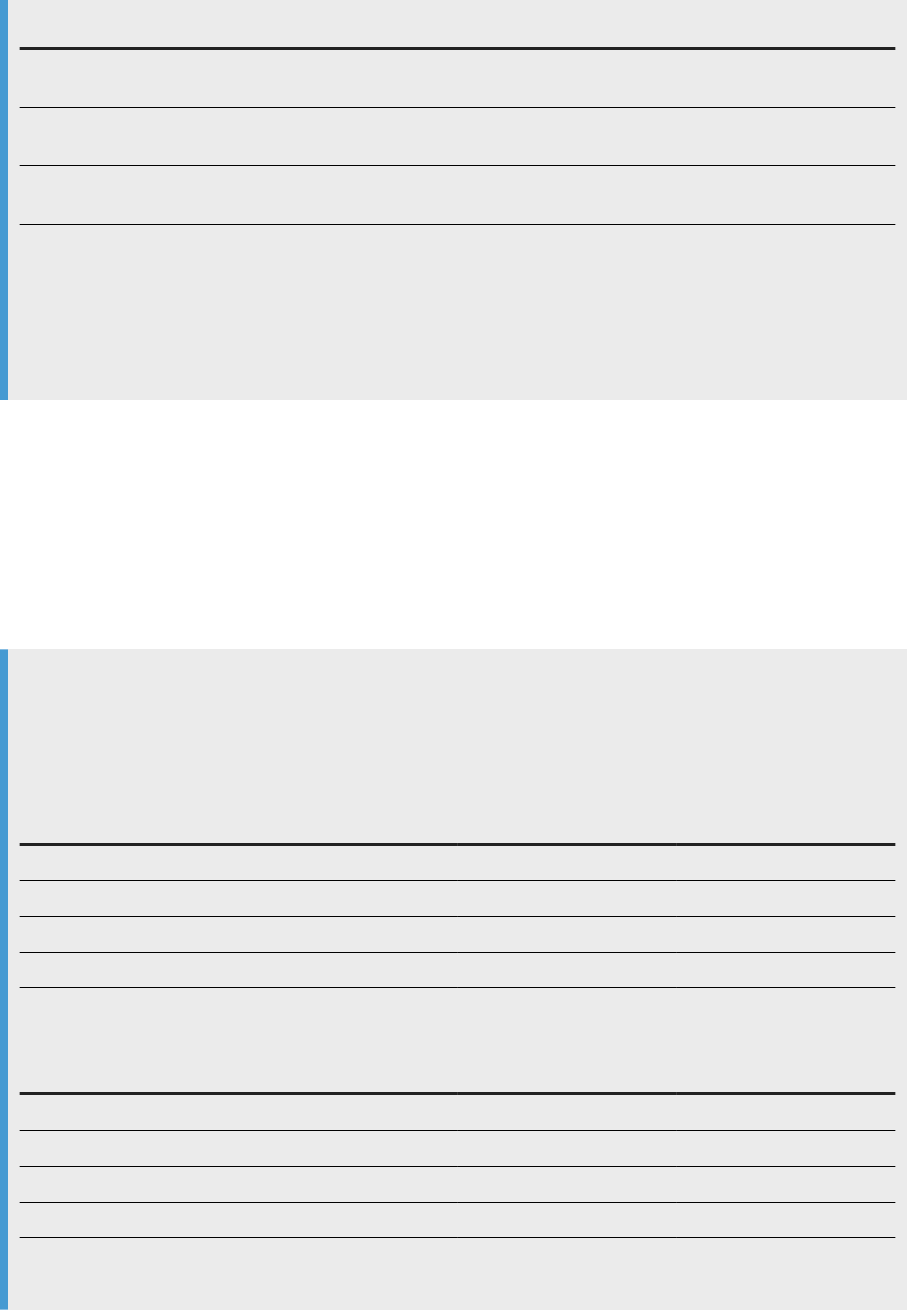
Country Year Revenue Formatting
Japan 2003 900 [inserted data formatting on all
cells]
Poland 2002 800 [decreased data formatting on
Revenue cell]
UK 2004 900 [inserted data formatting on all
cells]
● The rows showing revenue for France in 2003 and Japan in 2002 represent data that no longers exist
after the refresh.
● The revenue for France in 2004 has increased.
● The revenue for Poland in 2002 has decreased.
● The rows showing revenue for Japan in 2003 and the UK in 2004 appeared after the refresh.
4.2.15.5.4 How changed data is displayed in reports with
merged dimensions
A dimension appears as changed only if all the dimensions that participate in the merge are changed.
Example
Changed data and merged dimensions
In this example, Country is a merged dimension containing the Country dimensions from two data
providers. Before data refresh, the data is as follows:
Country (DP1)
Revenue (DP1) Country (DP2) Sales (DP2)
US 10000 US 5000
France 4000
UK 5000 UK 3000
Germany 1000 Germany 1000
After a data refresh, the data becomes:
Country (DP1)
Revenue (DP1) Country (DP2) Sales (DP2)
US 10000 US 4000
France 4000 France 3000
UK 6000 UK 4000
Poland 2000
When displayed in a block with the merged Country dimension and data changes displayed, the data
appears as follows:
264
P U B L I C
SAP BusinessObjects Web Intelligence User's Guide
Reporting data
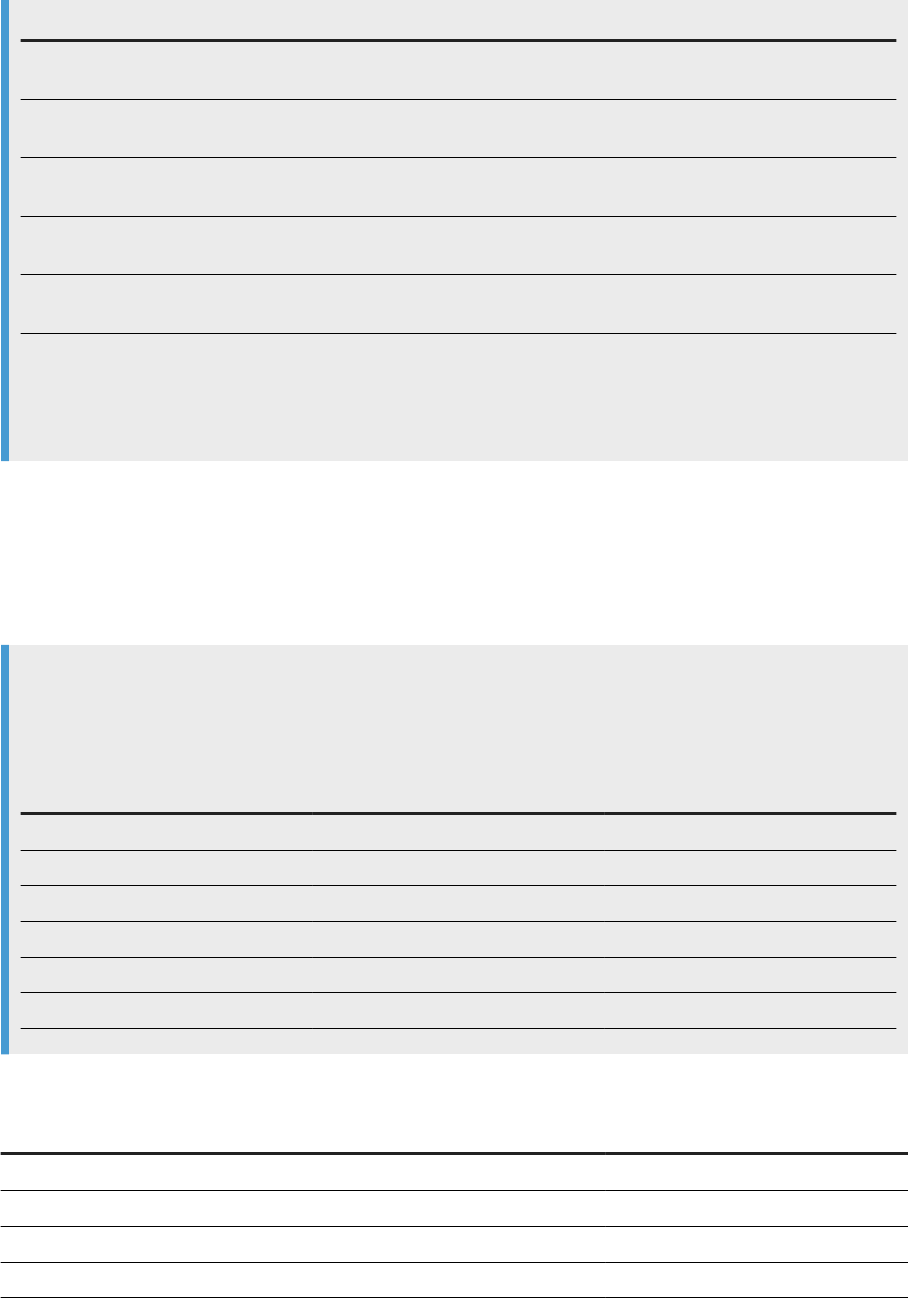
Country Revenue Sales Formatting
US 10000 4000 [decreased data formatting on
Sales cell]
France 4000 3000 [inserted data formatting on Reve
nue cell]
UK 6000 4000 [increased data formatting on Rev
enue and Sales cells]
Germany 1000 1000 [deleted data formatting on all
cells]
Poland 2000 [inserted data formatting on Coun
try and Revenue cells]
In the France row, France does not appear as inserted because a France row was not inserted in both data
providers. Revenue appears as inserted because it is a new measure value after the data refresh.
In the Poland row, Poland appears as inserted because it is a new dimension value after the data refresh.
4.2.15.5.5 How changed data is displayed in sections
In this example you have a document with a block showing [Country], [Year] and [Revenue].
Example
Changed data in a report with sections
The original data is as follows:
Country
Year Revenue
France 2003 1000
France 2004 2000
Japan 2002 1000
Poland 2002 1200
US 2003
US 2004
After a refresh, the data is as follows:
Country
Year Revenue
France 2004 3000
Japan 2003 900
Poland 2002 800
UK 2004 900
SAP BusinessObjects Web Intelligence User's Guide
Reporting data
P U B L I C 265
If you create a section on [Country] and display data changes, the report appears as follows:
France [no formatting]
Year Revenue Formatting
2003 1000 [deleted data formatting on all cells]
2004 3000 [increased data formatting on Revenue cell]
Japan [no formatting]
Year
Revenue Formatting
2002 1000 [deleted data formatting on all cells]
2003 900 [inserted data formatting on all cells]
Poland [no formatting]
Year
Revenue Formatting
2002 800 [decreased data formatting on Revenue
cell]
UK [inserted data formatting]
Year
Revenue Formatting
2004 900 [inserted data formatting on all cells]
The data appears in the section header in either of two ways, depending on the changes in the data in the
section:
● If all the rows in the block in the section have changed in the same way, the section header is displayed with
the same formatting as the rows.
● If the rows have changed in dierent ways, or only some rows have changed, the section header retains its
default format.
4.2.15.5.6 How changed data is displayed in blocks with
breaks
When a block contains a break and the Merge block property is set, the display of the centered value follows
rules similar to those for section headers.
● If all the rows in the break have changed in the same way, the centered value is displayed with the same
formatting as the rows.
● If the rows have changed in dierent ways, or only some rows have changed, the centered value retains the
default formatting.
266
P U B L I C
SAP BusinessObjects Web Intelligence User's Guide
Reporting data

4.2.15.5.7 How changed data is displayed in charts
When the data in a chart has changed, a changed data icon appears above the chart.
When you click the icon, the chart changes to a table to allow you to see the details of the changes.
4.2.15.6 Data tracking restrictions
If you change or purge a data provider, the report no longer displays changed data.
If the data provider is changed, the current version of the document is no longer compatible with the reference
version. If the data is cleared, the old data no longer exists for comparison.
As a result, the following actions are incompatible with data tracking:
● Drill out of scope
● Query drill
● Deleting a query
● Any modication (including modications to security rights) that changes the SQL generated by a data
provider
● Purging the document
When you perform any of these actions, the data history of the document is cleared because the actions are
incompatible with the display of changed data. For example, if you modify a query, the data in the document
changes because of the modication. Any comparison between this data and old data generated from a
dierent query is misleading.
Note
When you use query drill or drill out of scope, the data history is cleared because these actions change the
data provider. This should not aect you because, when you start to drill, you have already identied the
data that requires further analysis. Data tracking has served its purpose and you can now continue with
your data analysis.
Related Information
To drill out of the scope of analysis [page 487]
Drilling with query drill [page 505]
To manage queries using the Data Manager [page 171]
SAP BusinessObjects Web Intelligence User's Guide
Reporting data
P U B L I C 267

4.2.15.6.1 Data tracking and Refresh on Open
When a document is set to refresh its data on opening (when the Refresh on open document property is
selected), data tracking does not display the dierence between the data prior to the refresh and the data after
the refresh.
The data after the refresh is considered to be new data because the refresh purges the document.
Note
When you enable the Refresh on open document property, the document displays the latest information
each time you open the document. The Refresh on open option is dependent on the following settings in the
CMC (congured by the BI administrator):
● In Applications Web Intelligence , from the Manage list, select Properties. In the Automatic
Document Refresh on Open Security Right Setting section, the property Automatic Refresh security
setting is enabled.
● In Applications Web Intelligence , from the Manage list, select User Security. When you select a
user prole and click View Security, check that the Document - disable automatic refresh on open
security right is disabled.
In the settings are set as listed above, then even if the document is not set as being Refresh on open, the data
will still be refreshed when the document is opened.
Related Information
To save a document in the corporate repository [page 457]
4.2.15.7 Using formulas to track changed data
You can use formulas to create alerters that let you know when data has changed in a document.
These custom alerters do not appear in the list of standard alerters.
You use the RefValue, RefValueDate, and RefValueUserResponse functions in cell formulas to build these
custom alerters. You can also use formulas with special calculations based on data changes. For example, you
can include a calculation to show the dierence between the previous value and the current value of a measure.
For more information on the functions, see the Using Functions, Formulas and Calculations in Web Intelligence
guide or the related section in the Web Intelligence online help.
268
P U B L I C
SAP BusinessObjects Web Intelligence User's Guide
Reporting data

4.2.15.8 Changed data and the calculation context
When data tracking is activated, data only appears as changed when the calculation context remains the same.
For example, if a measure value changes because you have changed the calculation context of a block, the new
value is not agged as changed.
Example
Changing the calculation context
In this example you have a block showing [City], [Customer] and [Revenue] as follows:
City
Customer Revenue
San Francisco Smith 1000
San Francisco Jones 2000
Los Angeles Wilson 3000
Los Angeles Harris 4000
If you remove [Customer] from the block, revenue is aggregated by city:
City
Customer
San Francisco 3000
Los Angeles 7000
The revenues do not appear as increased because the amount of revenue has not changed. Only the
calculation context has changed. Revenues are now aggregated by city only, giving higher gures.
If, after a data refresh, Jones’ revenue falls to 1000 and Wilson’s revenue rises to 4000, the data appears as
follows:
City
Customer
San Francisco 2000
Los Angeles 8000
The data appears as changed because, independently of the change of calculation context, the total
revenue for San Francisco has decreased and the total revenue for Los Angeles has increased.
4.2.16 Highlighting data using conditional formatting
Conditional formatting enables you to highlight results or change formatting based on data.
You can, for example, conditionally format results to highlight particularly high or low results with specic
colors or with text comments, such as High Performer or Low Performer.
You can apply conditional formatting to the following elements:
SAP BusinessObjects Web Intelligence User's Guide
Reporting data
P U B L I C 269

● Columns in a vertical table
● Rows in a horizontal table
● Cells in forms and crosstables
● Section headers
● Free-standing cells
You can apply up to 30 conditional formatting rules in a document. You can apply these rules to a maximum of
20 table columns or rows, free-standing cells, or section cells on the reports. You can apply up to 10 dierent
rules on a single table column or row, free-standing cell, or section cell.
You can dene conditional formatting rules to activate the following formatting changes:
● text color, size and style
● cell border colors and style
● cell background display – specic colors, images, or hyperlinks to web pages
You can also dene rules that display a text or formula, an image, or a hyperlink. In this case, the results that
meet the condition dened in the rule will be replaced by the text or formula.
Conditional formatting is dynamic. When you refresh reports with the latest data from the database, the rules
highlight the new results accordingly.
If you apply conditional formatting to a table row or column with a break, the rule is only activated when the
value that meets the conditional rule appears on the rst row of that break.
4.2.16.1 Conditions in conditional formatting
Conditional formatting rules contain multiple conditions, allowing you to apply multiple formats depending on
the data.
A conditional formatting rule operates as follows:
If <Main Condition> is true, Apply <Main Format>
ElseIf <Second Condition> is true, Apply <Second Format>
ElseIf <Third Condition> is true, Apply <Third Format>
ElseIf...
Else Apply <Default Format>
In the above example, if <Main Condition> is Sales Revenue > 100,000 and <Main Format> formats
the text in blue, the conditional formatting displays the measure in blue whenever the Sales Revenue measure
is greater than 100,000.
If <Second Condition> is Sales Revenue < 10,000 and <Second Format> formats the text in red, the
conditional formatting also displays the measure in red whenever its value is less than 10,000.
Each condition can contain multiple tests, and all tests must return True for the conditional formatting to be
applied. For example, a condition can test the values of the [Country] and [Resort] objects. Both objects must
return the value specied in the test for the formatting to be applied.
270
P U B L I C
SAP BusinessObjects Web Intelligence User's Guide
Reporting data
4.2.16.2 To build a conditional formatting rule
Procedure
1. Open a Web Intelligence document in Design mode.
2. In the Analysis tab, select the Conditional subtab.
3. Click New Rule to display the Formatting Rule Editor panel.
4. Enter a rule name and rule description.
5. Click ... next to the Filtered object or cell box and select objects.
You cannot dene a rule on a cell containing a date or numeric type data (for example, a date or a
calculation) because the application considers any value you type into the Value text box as a character
string.
6. Select an operator.
7. Enter the value that triggers the formatting rule in the Operands box.
○ To enter a value directly, type it in the box.
○ To select a value from the list of values, click ... next to the Operands box and select a value.
○ To change the object or variable as the value, click ... next to the Operands box, click Select an Object or
Variable on the menu, then select a dierent object or variable.
○ To clear the Operands box, click ... next to the box, then select Empty.
8. To add an additional test within the condition, click + by the existing conditions, then choose the ltered
cell or object, operator and value as described above.
9. To remove a condition, click x next to the Condition box.
10. To trigger the condition using a formula, click the arrow next to Condition and select Fx.
11. Click Fx next to the formula box to display the Formula Editor in which you can build formulas.
○ If you want your formula to return a text string, do not include quote marks before or after the text. For
example, if you want the alerter to display OVERDUE, then type: OVERDUE.
○ The formula must return True or False. True triggers the condition; False does not. For example, if the
formula is RowIndex()=3, the conditional formatting appears on the fourth row of the table.
12. To add an additional condition to the rule, click Add at the top corner of the box to display an additional
condition box, then dene the conditions or build a formula as described above.
You can add multiple conditions.
13. To set the format that appears when the rule is triggered, click Format in the If the above is true, then
display panel.
The Formatting Rules Display dialog box to set the format appears.
14. Click OK to save the IF/THEN formats, then OK to set the rule format in the report.
SAP BusinessObjects Web Intelligence User's Guide
Reporting data
P U B L I C 271

4.2.16.3 To set the format displayed by a conditional
formatting rule
Procedure
1. Open a Web Intelligence document in Design mode.
2. In the Analysis tab, select the Conditional subtab.
3. Click Formatting Rules.
4. Select a rule from the list and click Edit.
5. In the Formatting Rule Editor dialog box, click Format to display the Formatting Rule Display dialog box.
6. To display text or a formula, select the Display tab and build the formula in the box.
○ To dene the displayed text or formula as HTML, an image URL or a hyperlink, click Read content as,
then select HTML, Image URL or Hyperlink from the list.
Note
When you select Read content as: HTML, the Autot Width and Autot Height properties do not
work because the size of the HTML data in a cell cannot be decoded by the browser properly. The
HTML content that is provided by the user is rendered by the browser directly. Web Intelligence
does not modify the HTML code provided by the user to set the width and height.
○ To change the number format, select the format from the Format Number list or click Custom and
select the format from the Format Number dialog box.
7. To change the font style, click the Text tab, and dene the font using the controls in the tab.
8. To change the background style, select the Background tab then dene the background using the controls
in the tab.
9. To change the border style, select the Border tab and dene the border using the controls in the tab.
10. Click OK, then OK again to return to the document.
Related Information
To build a conditional formatting rule [page 271]
272
P U B L I C
SAP BusinessObjects Web Intelligence User's Guide
Reporting data
4.2.16.4 To apply conditional formatting
You can apply previously-dened conditional formatting rules to report elements.
Context
You can format the following report elements:
● Columns in a vertical table
● Rows in a horizontal table
● Cells in forms and crosstables
● Section headers
● Free-standing cells
Procedure
1. In a Web Intelligence document in Design mode, select a report element on which you want to conditionally
format.
2. In the Analysis tab, select the Conditional subtab.
3. Click the arrow next to Formatting Rules and select the rule you want to apply from the list.
4. Save the document.
4.2.16.5 To manage conditional formats
Procedure
1. Open a Web Intelligence document in Design mode.
2. In the Analysis tab, select the Conditional subtab.
3. From the Formatting Rules dropdown list, select Manage Rules to display the Conditional Formats dialog
box.
4. To give a rule higher or lower priority in the list, select the rule and click the up or down arrow button to the
side of the list.
5. To duplicate a rule, select the rule and click Duplicate.
6. To remove a rule, select the rule and click Remove.
7. Click OK to return to the document.
SAP BusinessObjects Web Intelligence User's Guide
Reporting data
P U B L I C 273

4.2.16.6 Using formulas to create advanced conditional
formatting rules
You can build advanced conditional formatting rules using the formula language rather than using the Filtered
object or cell, Operator and Value choices oered by in the Formatting Rules Editor.
Example
Highlighting three ranges of quarterly sales revenue results calculated as percentages of the average sales
revenue
In this example, you build three rules to color-code sales revenues, depending on their relationship to the
average sales revenue. The table includes results for three years, and this is the average to which you want
to compare each sales revenue result calculated per quarter per product line.
Using the formula option in the Formatting Rules Editor, you build the following rule, which contains three
conditions The conditions are as follows:
Condition:
[Sales revenue] < ((Average([Sales revenue]) In Block) * 0.8)
Else Condition:
=[Sales revenue] < ((Average([Sales revenue]) In Block) * 1.2)
Else Condition:
=[Sales revenue] > ((Average([Sales revenue]) In Block) * 1.2)
The formula you specify for each condition works as follows:
● The rst condition applies when sales revenues are are < 0.8, or 80%, of the average.
● The second condition applies when sales revenues are < 1.2, or less than 120%, of the average.
● The third applies when sales revenue are > 1.2, or greater than 120%, of the average.
You then use the Formatting Rules Display dialog box to specify the conditional formatting you want
displayed in report cells that meet one of the conditions. You choose the following formatting:
● Report cells containing sales revenue that is less than 80% of the average revenue (the rst condition)
display the revenue in red.
● Report cells containing sales revenue that is less than 20% above the average revenue (the second
condition) display the revenue in blue.
Note
This condition covers values also covered by the rst condition. For example, if the average is 100,
79 is less than 80% below the average and less than 20% above the average. In this case, the rst
condition takes precedence.
● Report cells containing sales revenue that is greater than 20% above the average revenue (the third
condition) display the revenue in green.
This formatting enables you to see at a glance which product lines are generating above average, below
average, or close to average sales revenue.
274
P U B L I C
SAP BusinessObjects Web Intelligence User's Guide
Reporting data

4.2.17 Ranking report data
Ranking allows you to isolate the top and bottom records in a set based on a variety of criteria.
For example, if you have a block showing countries and associated revenues, ranking allows you to rank the
data in the block to show the top 3 countries only, based on the revenue they generate.
Ranking allows you to answer business questions such as:
● Which 3 regions generate the most revenue?
● Which are the bottom 10% of stores in terms of revenue generation?
● What is the group of the best-performing stores that generates a combined revenue of up to $10,000,000?
You can rank data in many ways to answer these kinds of business questions. You can:
● Rank the top and/or bottom n records by dimension (for example Country) based on the sum of a related
measure (for example Revenue).
● Rank the top and/or bottom n% of the total number of records by dimension. based on the value of a
related measure as a percentage of the total value of the measure.
● Rank the top and/or bottom n records by dimension based on the cumulative sum of a related measure.
● Rank the top and/or bottom n records by dimension based on the value of a related measure as a
cumulative percentage of the total value of the measure.
4.2.17.1 Rankings and sorts
When you rank data, the data will be sorted according to the dimensions by which it is ranked.
For example, using the following table:
Dimension A
Dimension B Measure
A1 B1 1
A1 B2 4
A2 B1 5
A2 B2 2
A3 B1 3
A3 B2 6
If you rank the top 2 measure values and no ranked-by dimension has been dened, then the data is sorted
according to that measure, across all dimensions:
Dimension A
Dimension B Measure
A3 B2 6
A2 B1 5
SAP BusinessObjects Web Intelligence User's Guide
Reporting data
P U B L I C 275
If you rank the top 2 measure values by a specic dimension, for example [Dimension A], the data is sorted
according to the aggregated value of that measure, in the chosen dimension [Dimension A]:
Dimension A Dimension B Measure
A3 B1 3
A3 B2 6
A2 B1 5
A2 B2 2
Sorts applied to display rankings take precedence over sorts that you previously applied to data. For example, if
you previously sorted the list of stores in alphabetical order, the ranking sort overrides the alphabetical sort.
Sorts applied to display rankings can be managed like any other sort, using the dedicated Web Intelligence
menus.
Removing the ranking on a measure will also remove the sort applied to the data.
Note
● If the dimension used to rank by is not present in the table, then the ranking cannot sort the data.
● Null measure values are not taken into account when a ranking is applied to that measure.
Related Information
Using sorts to organize data in reports [page 377]
4.2.17.2 Tied rankings
Tied rankings are assigned equal ranking values and subsequent ranking values are pushed back to
compensate.
This means that a top or bottom n ranking can return more than n records.
Example
Top and bottom tied rankings
The following table shows a tied top 3 ranking and a tied bottom 3 ranking.
Dimension
Measure Top 3 Ranking Bottom 3 Ranking
A 10 4 1
B 20 3 2
C 30 1 3
D 30 1 3
276 P U BL I C
SAP BusinessObjects Web Intelligence User's Guide
Reporting data
Each ranking includes records up to and including rank 3. This results in the following result for a top 3
ranking:
Dimension Measure
C 30
D 30
B 20
It results in the following for a bottom 3 ranking:
Dimension
Measure
A 10
B 20
C 30
D 30
Because the 2 largest measure values are identical, a top 1 or 2 ranking in the same table will result in the
same table content.
Dimension
Measure
C 30
D 30
4.2.17.3 Ranking and data order
You cannot rank on an object whose values depend on the data order because the ranking changes the data
order.
If the data order is changed, the object data is changed and results in a recalculation of the ranking. The result
is a circular dependency between the ranking and the object that cannot be resolved.
If you create a rank on a measure whose values depend on the data order, for example a measure that uses the
Previous function, the #RANK error code appears in all cells in the block.
For similar reasons, ranking on a measure using a running aggregation function such as RunningSum will not
give any meaningful result, however no error code will be displayed in the block cells. The ranking cannot be
meaningful because running calculations depend on the data context, which will be modied by the ranking
operation.
For more information on the functions, see the Using Functions, Formulas and Calculations in Web Intelligence
guide or the Web Intelligence online help.
SAP BusinessObjects Web Intelligence User's Guide
Reporting data
P U B L I C 277
4.2.17.4 Ranking in sections
You can apply ranking on blocks located within sections.
However, ranking on a measure using a context modier such as ForEach or ForAll is not supported. If you
use a context modier, you will encounter unexpected results, because of the interaction of the implicit lter
dened by the section instance with the calculation context modier that is used in the ranked measure.
For more information on the functions, see the Using Functions, Formulas and Calculations in Web Intelligence
guide or the Web Intelligence online help.
4.2.17.5 Ranking parameters
The following parameters can be congured in the Ranking dialog box.
Parameter
Description
Top/Bottom
When the calculation mode is Count, the ranking returns the top/bottom n records based
on the measure specied as the Based on parameter. For example, the top 3 countries by
revenue generated, the bottom 3 year/quarter combinations by revenue generated.
When the calculation mode is Percentage, the ranking returns the top/bottom n% of the
total number of records based on the measure specied as the Based on parameter. For
example, if there are 100 records and you rank the top 10%, the ranking returns the top 10
records.
When the calculation mode is Cumulative Sum, the ranking returns the top/bottom re
cords, for which the cumulative sum of the measure specied as the Based on parameter
does not exceed the value specied in the top/bottom.
When the calculation mode is Cumulative Percentage, the ranking returns the top/bottom
records, for which the cumulative sum of the measure specied as the Based on parame
ter does not exceed n% of the total of the measure, specied in the top/bottom.
Based on
The measure on which the ranking is based.
Ranked By
The ranking dimension. If you specify a ranking dimension, the aggregated values of the
Based on parameter, calculated for the dimension, determine the ranking. If you do not
specify this dimension, the values of the Based on parameter calculated for all dimensions
in the block determine the ranking. In other words, the ranking returns the top/bottom X
rows in the block based on the measure.
The ranked by dimension does not need to be part of the block where the ranking is ap
plied. However, in this case, the ranked data cannot be sorted.
Calculation mode
The type of calculation used to create the ranking. See the description of the Top/Bottom
parameters in this table for more information.
278 P U B L I C
SAP BusinessObjects Web Intelligence User's Guide
Reporting data

Related Information
To create a ranking [page 280]
4.2.17.5.1 Example of a ranking
If you rank the top 2 of each Quarter based on Revenue, the ranking lters out all the rows for Q1 and Q3
because Q4 and Q2 have the highest aggregated revenues.
A table contains the following data:
Year
Quarter Revenue
2006 Q1 100
2006 Q2 200
2006 Q3 300
2006 Q4 500
2007 Q1 400
2007 Q2 700
2007 Q3 300
2007 Q4 600
2008 Q1 200
2008 Q2 200
2008 Q3 400
2008 Q4 500
Total for Q1: 700
Total for Q2: 1100
Total for Q3: 1000
Total Q4: 1600
4.2.17.6 Ranking workows
A ranking uses sorts and lters that are applied transparently according to the ranking you specify.
There are two ways of ranking data. You can:
● create a ranking by using the interface
● use the Rank function to return a ranking value
SAP BusinessObjects Web Intelligence User's Guide
Reporting data
P U B L I C 279
For example, if you rank the top 3 countries in a block by revenue, you implicitly sort the countries in
descending order by revenue, then lter the block to remove all countries other than the 3 with the highest
revenue.
Note
● When you create a ranking using the interface, the Rank function is used behind the scenes to assign
ranking values.
● When the dimension used to rank by is not part of the block where the ranking is applied, then the
ranked data cannot be sorted.
4.2.17.6.1 To create a ranking
You congure ranking lters in the Ranking dialog box.
Procedure
1. Open a Web Intelligence document in Design mode.
2. Select the block that you want to rank.
3. Do one of the following:
○ In the Analysis tab, in the Filters subtab, click Ranking.
○ Right-click the measure you want to rank, and from the contextual menu, choose Ranking Add
Ranking .
4. In the Ranking dialog box, any one of the following:
○ To rank the highest records in the block, click Top and select the number of records you want to rank.
○ To rank the lowest records in the block, click Bottom and select the number of records you want to
rank.
○ Select the measure on which the ranking is based in the Based on list.
○ To rank by a particular dimension rather than by all dimensions in the block, click Ranked by and select
the dimension on which the ranking is based.
○ Select a rank calculation mode in the Calculation mode list.
5. Click OK to close the Ranking dialog box.
Related Information
Ranking parameters [page 278]
280
P U B L I C
SAP BusinessObjects Web Intelligence User's Guide
Reporting data
4.2.17.7 Ranking examples
In the following examples, you have a dimension, Region, and a measure, Revenue.
Region
Revenue % of Total Revenue
South East 1000000 7%
South West 2000000 13%
North East 3000000 20%
North West 4000000 24%
Central 5000000 33%
Example
Rank the top 3 regions by revenue generated
To perform this ranking you set the following parameters:
Parameter
Value
Top 3
Ranked by Region (or unspecied because region is the only dimen
sion in the block and therefore the default ranking dimen
sion)
Based on Revenue
Calculation mode Count
This ranking gives the following result:
Region
Revenue
Central 5000000
North West 4000000
North East 3000000
The implicit steps in calculating this ranking are:
● Sort the records in descending order.
● Display the top 3 records.
Example
Rank the bottom 40% of regions by revenue
To perform this ranking you set the following parameters:
Parameter
Value
Bottom 40%
SAP BusinessObjects Web Intelligence User's Guide
Reporting data
P U B L I C 281
Parameter Value
Ranked by Region
Based on Revenue
Calculation mode Percentage
This ranking gives the following result:
Region
Revenue
South East 1000000
South West 2000000
The implicit steps in calculating this ranking are:
● Sort the record in ascending order.
● Work through the records until 40% of the total number of records are displayed.
Example
Rank the top regions whose cumulative revenue is less than or equal to 10,000,000
To perform this ranking you set the following parameters:
Parameter
Value
Top 10000000
Ranked by Region
Based on Revenue
Calculation mode Cumulative sum
This ranking gives the following result:
Region
Revenue
Central 5000000
North West 4000000
The implicit steps in calculating this ranking are:
● Sort the records in descending order.
● Work through the records until the record that causes the cumulative total of the measure to pass
10,000,000.
● Include those records that do not cause the cumulative total to pass 10,000,000.
Example
Rank the bottom regions whose cumulative revenue is less than or equal to 30% of the total revenue
To perform this ranking you set the following parameters:
282
P U B L I C
SAP BusinessObjects Web Intelligence User's Guide
Reporting data

Parameter Value
Bottom 30%
Ranked by Region
Based on Revenue
Calculation mode Cumulative percentage
This ranking gives the following result:
Region
Revenue
South East 1000000
South West 2000000
North East 3000000
The implicit steps in calculating this ranking are:
● Sort the records in ascending order.
● Work through the records until the record that causes the cumulative total of the measure, expressed
as a percentage of the overall total of the measure, exceeds 30%.
● Display those records that do not cause the cumulative percentage to pass 30%.
4.2.18 Merging data from dimensions and hierarchies
You can synchronize the data returned by dimensions, hierarchies or attributes by creating merged objects
which incorporate them.
You merge data from dierent data providers. For example, if you have one data provider that contains detailed
customer information and another data provider that contains sales data, you can synchronize the two data
providers around the customer.
When you merge data from the same data source (for example the same universe or BEx query), the merge is
based on the internal ID of each data member. When you merge data from dierent data sources, the merge is
based on the caption of each data member. For example, if you synchronize two [Geography] hierarchies, the
data member [Los Angeles] is merged with [Los Angeles] through its internal ID when the hierarchies are based
on the same data source. The members are merged on the caption "Los Angeles" when the hierarchies are in
dierent data sources.
In cases where merging is based on the caption, and dierent members with the same caption have dierent
parent members, it is not possible to merge the members and the #MULTIVALUE error occurs.
When a merged object contains a hierarchy, you cannot include it directly in a report, but you can still see
synchronized hierarchical data by using the original hierarchies. If you include a merged object without
hierarchies in a report, the object returns the #COMPUTATION error if hierarchies are subsequently added to it.
SAP BusinessObjects Web Intelligence User's Guide
Reporting data
P U B L I C 283
When merged objects are from dierent data providers
When two merged objects are from dierent data providers, note the following restriction concerning the
dimension value for a merged object and object participating in a merge:
When [DIM1] coming from data provider 1, and [DIM2] coming from data provider 2), are merged, the value for
the [MERGE] is the union of the values of [DIM1] and [DIM2].
● When you use [DIM1] ( or [DIM2]) in a table, the table shows only the value from [DIM1] (or [DIM2]) This
behavior is as expected.
● When you lter (using an input control, drill bar, or lter panel) on one of these dimensions, this shows the
list of values of the [MERGE] because it will result in a lter on the [MERGE].
● When [DIM1] (or [DIM2]) is used with a context modier (In, foreach, forall), the calculation will be done
based on the [MERGE ]. For example, count([measure] foreach ([DIM1])) counts all the measure items
given against [MERGE].
Related Information
Merging hierarchies [page 286]
4.2.18.1 Merging data providers based on keys
When you merge two data sources based on detail objects for a query based on BICS, the BEx query keys are
mapped to details. In this way it is possible to merge data providers based on keys. Once merged, the attribute
is used in the report in the same way as a dimension.
4.2.18.2 Choosing which data to merge
You merge data when your report draws data from dierent but related sources.
For example, you have a report showing revenue and sales targets. The report contains sections based on the
year, and each section shows revenue and sales targets. If revenue and sales target data comes from two
dierent data providers, it is not synchronized. You synchronize the data by merging the two data providers on
the common dimension, Year.
The only technical restriction imposed on merged dimensions is that they must be of the same data type. You
can, for example, merge two dimensions containing character data. But it does not make sense to merge
unrelated dimensions even when their data types are the same. For example, it does not make sense to merge
a dimension containing customer names with a dimension containing sales regions.
Merged dimensions often have the same name in both data sources, but this is not obligatory. It can make
sense to merge dimensions with dierent names if they contain related data.
284
P U B L I C
SAP BusinessObjects Web Intelligence User's Guide
Reporting data

To merge dimensions correctly you need to be aware of the semantics of the data (what the data refers to) in
the dierent data sources. The dimension data types and names are an approximate guide only to suitability of
a dimension for merging.
4.2.18.3 Merged dimension example
In this topic, you can see an example of merged dimensions with two data providers.
Example
Merging City dimensions
Data Provider 1:
Country
City
US New York
US Los Angeles
France Paris
France Toulouse
Data Provider 2:
City
Revenue
New York 100000
Los Angeles 75000
Paris 90000
Toulouse 60000
If you do not merge the City dimensions, you get the following result if you place the Country, City and
Revenue objects in a table:
Country
City Revenue
US New York 325000
US Los Angeles 325000
France Paris 325000
France Toulouse 325000
Because there is no link between the two data providers through a merged dimension, city revenues are not
related to countries. The table shows the total revenue in data provider 2 against each Country/City pair.
If you merge the City dimensions, you get the following result:
SAP BusinessObjects Web Intelligence User's Guide
Reporting data
P U B L I C 285
Country City Revenue
US New York 100000
US Los Angeles 75000
France Paris 90000
France Toulouse 60000
4.2.18.4 Merging hierarchies
You can take advantage of data synchronization by using the original hierarchies that make up a merged
hierarchy.
The data in the report takes the structure of the hierarchy you select.
Example
Merged hierarchies
You have two data sources, each using a hierarchy that you have merged into a merged object. Data
provider 1 contains the following data:
Product
Store Invoice
Sport 5401
Gym 4073
Bottoms 1236
Tops 1208
Weights 1629
Swimming 1328
Camping 16961
Tents 3534
Sleeping Bags 3423
Kitchen Equipment 5352
Electrical 4652
Data provider 2 contains the following data:
Product
Units Ordered
Sport 13348
Gym 8814
Bottoms 1231
Tops 3241
286 P U B L IC
SAP BusinessObjects Web Intelligence User's Guide
Reporting data
Product Units Ordered
Weights 4342
Swimming 4534
Camping 34234
If you use the rst hierarchy in a report, the merged data is structured as follows:
Product
Store Invoice Units Ordered
Sport 5401 13348
Gym 4073 8814
Bottoms 1236 1231
Tops 1208 3241
Weights 1629 4342
Swimming 1328 4534
Camping 16961 34234
Tents 3534
Sleeping Bags 3423
Kitchen Equipment 5352
Electrical 4652
The child members of [Camping] appear in the hierarchy because they appear in the hierarchy you
selected. The [Units Ordered] measure does not display values for these members because they do not
exist in the second data source.
If you select the second hierarchy, the merged data is structured as follows:
Product
Store Invoice Units Ordered
Sport 5401 13348
Gym 4073 8814
Tops 1236 1231
Bottoms 1208 3241
Weights 1629 4342
Swimming 1328 4534
Camping 16961 34234
The child members of [Camping] do not appear because they do not appear in the orignal hierarchy you
selected.
SAP BusinessObjects Web Intelligence User's Guide
Reporting data
P U B L I C 287

4.2.18.5 Merging dierent types of objects
You can include dimensions, attributes and hierarchies in merged objects.
The structure of the data that appears in the report depends on which object you chose.
Example
Merging a dimension and a hierarchy
You have two data sources, one containing a dimension and the other a hierarchy. Data provider 1 contains
the [Country] dimension as follows:
City
Stock Items
Los Angeles 4545
San Francisco 6465
San Diego 4564
Data provider 2 contains the [Geography] hierarchy as follows:
Geography
Revenue
US 54342
California 6996
Los Angeles 3423
San Francisco 2342
San Diego 1231
You merge the dimension and hierarchy in a merged object. If you include the [Country] dimension in a
report, the data appears as follows:
City
Stock Items Revenue
Los Angeles 4545 3423
San Francisco 6465 2342
San Diego 4564 1231
If you place the [Geography] hierarchy in a report, the result is as follows:
Product
Stock Items Revenue
US 54342
California 6996
Los Angeles 4545 3423
San Francisco 6465 2342
San Diego 4564 1231
288 P U B L I C
SAP BusinessObjects Web Intelligence User's Guide
Reporting data
4.2.18.6 Forcing merged calculations with the ForceMerge
function
By default, calculations do not account for merged dimensions if the merged dimensions do not explicitly
appear in the calculation context.
Example
Calculating revenue with ForceMerge
This example has two data providers as follows:
Data Provider 1:
Country
City
US New York
US Los Angeles
France Paris
France Toulouse
Data Provider 2:
City
Revenue
New York 100000
Los Angeles 75000
Paris 90000
Toulouse 60000
If you merge the City dimensions, then create a table with Country and Revenue, you get the following
result:
Country
Revenue
US 325000
US 325000
France 325000
France 325000
Because City, the merged dimension, does not appear in the table, it does not inuence the calculation of
the revenue. The total revenue in the second data provider appears against each country.
To display the correct result, replace Revenue in the second column with the formula
ForceMerge([Revenue]):
City
Revenue
US 175000
SAP BusinessObjects Web Intelligence User's Guide
Reporting data
P U B L I C 289
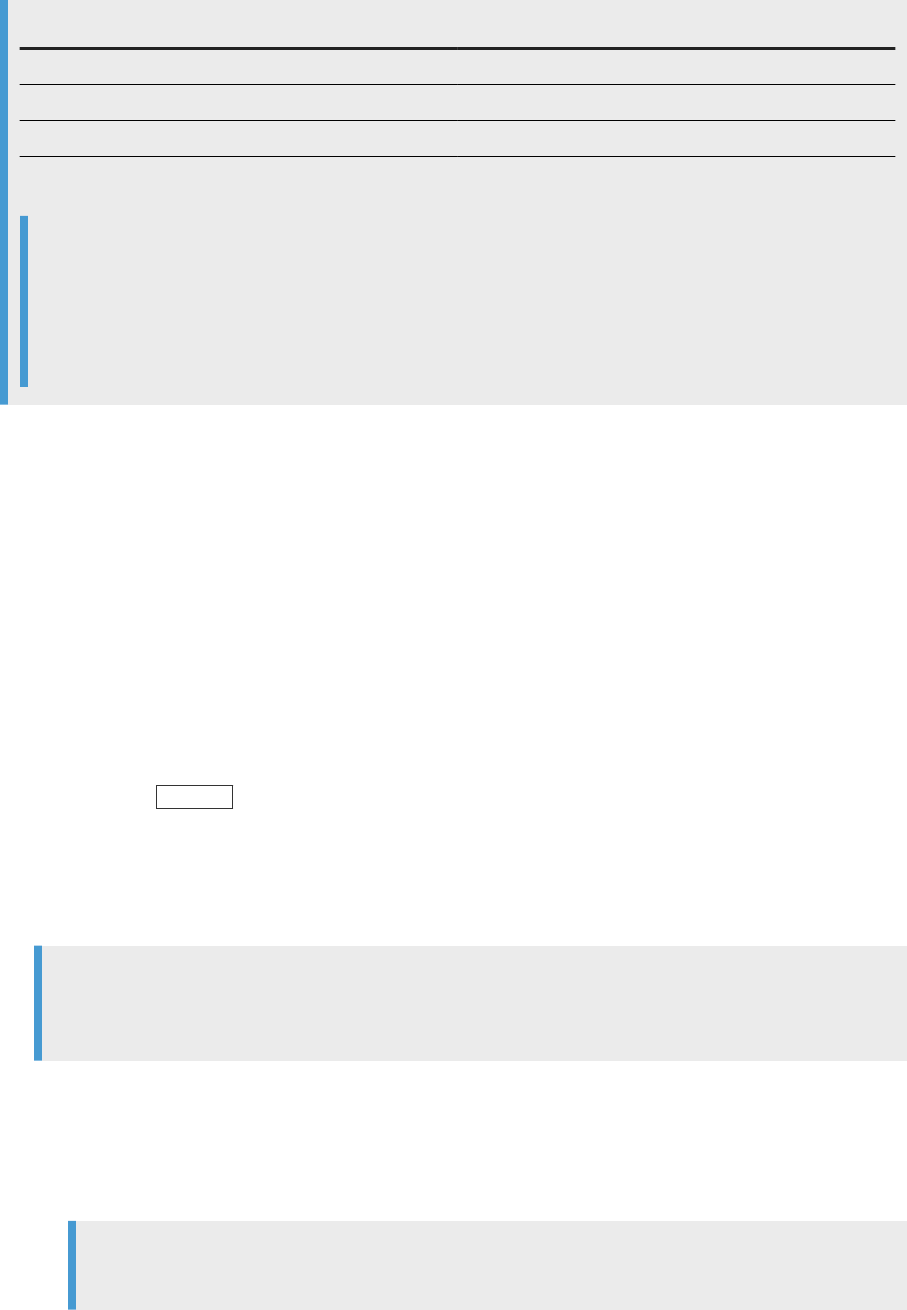
City Revenue
US 175000
France 150000
France 150000
The relationship between countries and cities now inuences the calculation of the revenue.
Note
If Revenue is a smart measure in the above example, ForceMerge([Revenue]) returns
#MULTIVALUE. This is because the grouping set (Country) does not exist for the Revenue measure.
ForceMerge([smart_measure]) always returns #MULTIVALUE, unless by chance no aggregation is
required to calculate the measure.
4.2.18.7 To merge details, dimensions, or hierarchies
You can merge data objects in the Available Objects pane.
Procedure
1. Open a Web Intelligence document in Design mode.
2. In the Data Access tab, in the Data Objects subtab, click Merge.
3. Hold down the Control key and select the dimensions or hierarchies you want to merge.
4. Click OK.
You can view the merged object in the Available Objects pane of the Side Panel. The original hierarchies or
dimensions that make up the merged object appear beneath it. You edit or remove the merged dimension
or hierarchy in the Available Objects pane.
Tip
You can also select objects in the Available Objects pane, right-click the selected objects and click
Merge.
5. To add additional objects to a group of merged objects:
a. Select the Available Objects button in the Side Panel.
b. Select the merged object.
c. Hold down the Control key on your keyboard and select one or several object you want to add to the
group.
Note
The objects you select must be of the same data type as the objects already merged.
290
P U B L I C
SAP BusinessObjects Web Intelligence User's Guide
Reporting data

d. Right-click the selection and select Add to Merge from the contextual menu.
Related Information
To unmerge objects [page 292]
To edit merged objects [page 291]
4.2.18.8 To merge dimensions automatically
You can merge dimensions automatically if the dimensions have the same name and data type, and are in the
same universe. The auto-merge happens only at the document level.
Procedure
1. Open a Web Intelligence document in Design mode.
2. In the Properties tab, click Document.
3. In the Document Summary dialog box, select Auto-merge dimensions.
Restriction
If this option is activated, Web Intelligence searches for all dimensions sharing the same name and data
type in a universe and merges them. In the case where you have the same object with dierent names,
we recommend that you merge dimensions manually.
Note
We recommend that you activate this option at the beginning so that all similar dimensions are
merged, and then deactivate the option afterward.
4. Click OK to close the Document Summary dialog box.
4.2.18.9 To edit merged objects
You can edit merged objects in the Edit Merged Dimension dialog box.
Procedure
1. In a Web Intelligence document in Design mode, select the Available Objects button in the Side Panel.
SAP BusinessObjects Web Intelligence User's Guide
Reporting data
P U B L I C 291

2. Right-click a merged dimension, then select Edit Properties.
3. In the Edit Merged Dimension dialog box, type the merged dimension name in the Merged Dimension Name
text box.
4. Type a description in the Description box.
5. Select a dimension that provides default properties for the merged dimension from the Source Dimension
dropdown list.
6. Click OK to close the Edit Merged Dimension dialog box.
4.2.18.10 To unmerge objects
You can unmerge data objects in the Available Objects pane.
Procedure
1. In a Web Intelligence document in Design mode, select the Available Objects button in the Side Panel.
2. Do one of the following:
○ To unmerge a group of objects, right-click a merged dimension and click Unmerge from the contextual
menu.
○ To remove an object from a merged group, right-click it in the group and select Remove from Merge
from the contextual menu.
3. Click Yes to conrm.
4.2.18.11 Synchronizing data providers with dierent
aggregation levels
You can synchronize data providers with dierent aggregation levels. This can have implications for the
calculation of measures.
Example
Synchronizing data providers with dierent aggregation levels
In this example you have two data providers as follows:
Customer
Year Revenue
Jones 2004 1500
Jones 2005 2000
Smith 2005 1200
292 P U B L I C
SAP BusinessObjects Web Intelligence User's Guide
Reporting data
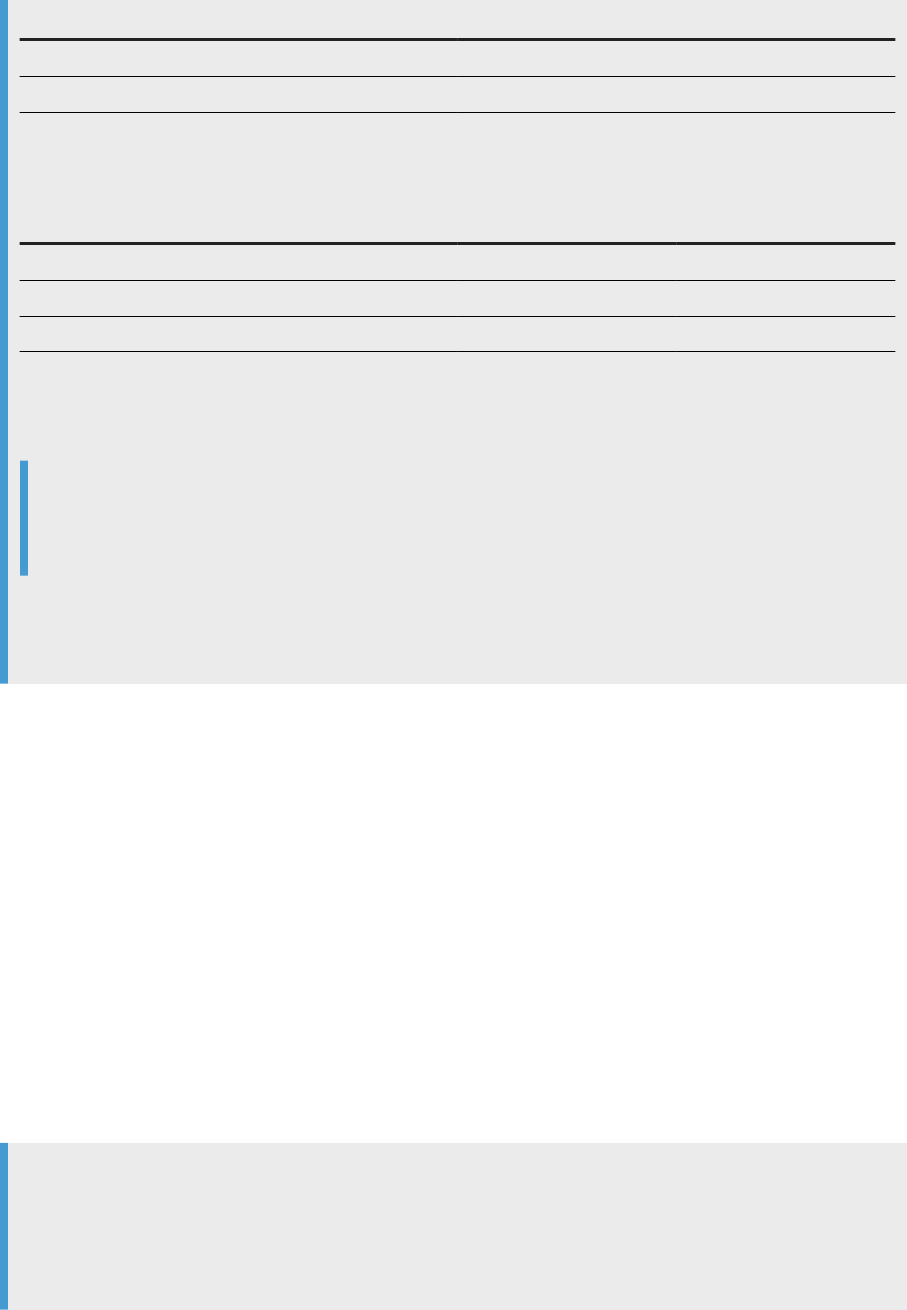
Customer Number of sales
Jones 12
Smith 10
If you merge the two data providers and the table properties Avoid duplicate row aggregation and Show rows
with empty dimension values are unchecked, the result is as follows:
Customer
Year Revenue Number of sales
Jones 2004 1500 12
Jones 2005 1200 12
Smith 2005 1200 10
It is not possible to determine the number of sales per year for customer Jones because the data provider
that stores the number of sales does not break them down by year. Instead you see the total number of
sales on each row.
Note
Although the Number of Sales values are duplicated, if you add a standard calculation to the bottom of
the column (for example a Sum or Average calculation), the result is correct.
One way of adressing this issue is to add the dimensions to the second data provider that allow calculation
to the appropriate level of data. If this is not possible, you must be aware of any situations where it is not
possible to aggregate the data to the necessary level of detail.
Related Information
To show or hide tables [page 339]
To avoid duplicate row aggregation [page 343]
4.2.18.12 Attributes and merged dimensions
Attributes are associated with dimensions and provide additional information about the dimension.
There must be a one-to-one relationship between dimensions and attributes. An attribute can have one value
only for each value of its associated dimension. Attribute objects are not taken into account when
synchronizing data. The following example illustrates why this is necessary.
Note
Some previous versions of SAP BusinessObjects Web Intelligence (Web Intelligence, Desktop Intelligence
and BusinessObjects), allowed a one-to-many relationship between dimensions and attributes. If you
migrate a report created using any of these products and the attribute contains multiple values, you see the
#MULTIVALUE error in the attribute cell.
SAP BusinessObjects Web Intelligence User's Guide
Reporting data
P U B L I C 293
Example
Synchronizing data providers with attributes
In this example you have two data providers, and Address is an attribute of Customer:
Customer Address Revenue
John London 10000
Paul Liverpool 15000
Paul London 27000
Customer Telephone Number
John 1234
Paul 5678
If you create a merged Customer dimension to synchronize the data providers, and Address can have more
than one value for each customer, the result is ambiguous because there is no common value for data
synchronization.
In the example, Paul has addresses in Liverpool and London, which means that there is no unique ‘Paul’ row
for synchronization of Paul's telephone number. Paul has a dierent telephone number for each address,
and we do not know which address to associate with the telephone number:
Customer
Address Telephone Number
John London 1234
Paul
#MULTIVALUE
5678
If the relationship between Customer and Address is one-to-one, Address can be ignored in the
synchronization. This removes the ambiguity:
Customer
Address Telephone Number
John London 1234
Paul Liverpool 5678
Related Information
Attributes [page 63]
294
P U B L I C
SAP BusinessObjects Web Intelligence User's Guide
Reporting data
4.2.18.13 Incompatible objects and merged dimensions
As a general rule, you cannot place dimensions from dierent data providers in the same table.
This is to avoid Cartesian products (the display of all possible combinations of values from unrelated objects)
or other ambiguous results, depending on the universe structure.
You can always place measures from dierent data providers in a table. The measure calculation depends on
what dimensions are available. For example, if you place a measure in a table that contains no dimensions from
the same data provider as the measure, the calculation displays its total value in the table.
You can place a merged dimension in a table as long as the table contains other dimensions from a data
provider that participates in the merge. You can also place attributes from dierent data providers in a table, as
long as the details are associated with dimensions that participate in a merged dimension.
In certain situations, it can be valid to place a dimension from another data provider in a table, even when this is
not allowed by the software. This occurs when the incompatible dimension has a one-to-one or one-to many
relationship with a dimension already in the table. The important point is that there is only one value of the
incompatible dimension associated with the dimension in the table (one-to-one). On the other hand, the same
value of the incompatible dimension can be associated with multiple values of the dimension in the table (one-
to-many).
In the table below, the relationship between Address and Name conforms to these rules: Address has a one-to-
one or one-to-many association with Name. There is no one-to-many association in the other direction,
between Name and Address (one name with more than one address):
Dimension in table (Name) Incompatible dimension (Address)
John London
Paul London
George Liverpool
In this case the universe design is incorrect - the incompatible dimension (Address) should be dened as a
detail of the dimension in the table (Name). If you encouter this situation, contact the BI administrator and ask
for a redesign of the universe.
Tip
If it is not practical to change the universe:
1. Create a variable at the report level.
2. Dene this variable as a detail.
3. Associate it with the dimension in the table.
4. Supply the name of the incompatible dimension as the variable denition.
The variable simply returns the same values as the incompatible dimension. Because it is dened as a
detail of the dimension in the table, you can place it in the same table as the dimension.
Related Information
To create a variable [page 312]
SAP BusinessObjects Web Intelligence User's Guide
Reporting data
P U B L I C 295

4.2.18.14 Filtering and drilling on merged dimensions
Merging dimensions has implications for the application of lters.
Note
You cannot apply a lter on a merged object containing hierarchies.
Block lters and merged dimensions
When you apply a block lter to a dimension that is part of a merged dimension, the lter is applied to the
block. It is not applied to other data providers synchronized through the merged dimension.
Section lters and merged dimensions
When a dimension that is part of a merged dimension is set as a section header, any lter applied to the section
also applies to blocks from synchronized data providers within the section.
Report lters and merged dimensions
When you apply a report lter to a dimension that is part of a merged dimension, then the lter will impact all
related blocks in the report that use the merged dimension (or any dimensions that participate in the merge).
Example
When you have two queries with a common dimension that you have merged, and you have two tables in a
report, each table with data coming from a dierent query, when you lter on the merged dimension in one
query, the lter will also impact the corresponding dimension in the second query and therefore in the
second table.
Drilling on merged dimensions
When you merge dimensions, the new merged dimension belongs to the hierarchies of all dimensions involved
in the merge.
296
P U B L I C
SAP BusinessObjects Web Intelligence User's Guide
Reporting data
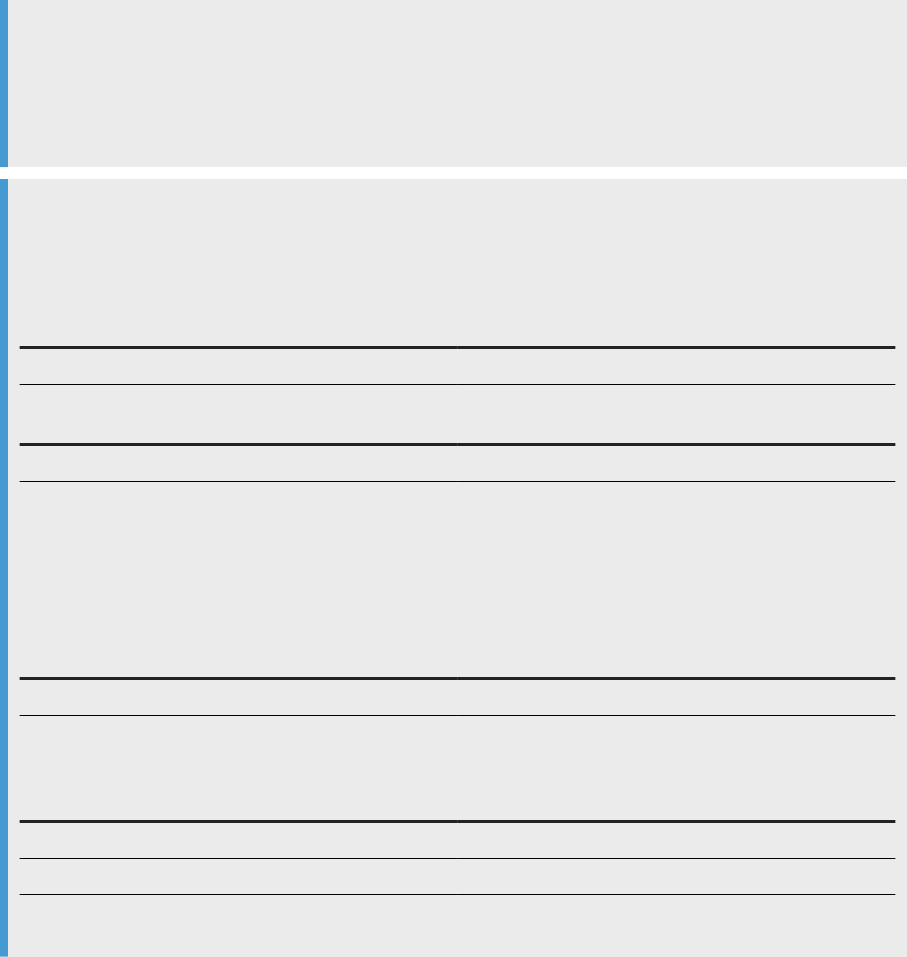
4.2.18.15 Extending the values returned by merged
dimensions
When you merge dimensions from dierent data providers, Web Intelligence creates a merged dimension.
When you place the merged dimension in the report, only those dimension values that have corresponding
values in the data providers synchronized through the merge are returned.
Note
Web Intelligence and Desktop Intelligence handle merged dimensions dierently, you need to be aware of
this when migrating reports from Desktop Intelligence and Web Intelligence. Desktop Intelligence does not
create a dimension based on the merged dimension for the report. The following section describes how the
dierences aect your reports.
Example
Web Intelligence and Desktop Intelligence behavior when dimensions are merged
You have a report with the following data providers:
Country of origin
Revenue
Germany 470
Country of origin Quantity
Japan 499
Web Intelligence returns the values of the Country of Origin dimension through the values returned by the
Revenue measure.
If you include the Country of Origin dimension from Data Provider 1 and the Quantity measure from Data
Provider 2 in the same block, in Web Intelligence, you get the following result:
Country of origin
Quantity
Germany
The same block in Desktop Intelligence returns the following result:
Country of origin
Quantity
Germany
Japan 499
To get the same results table as above with Web Intelligence, you must extend the dimension values.
SAP BusinessObjects Web Intelligence User's Guide
Reporting data
P U B L I C 297
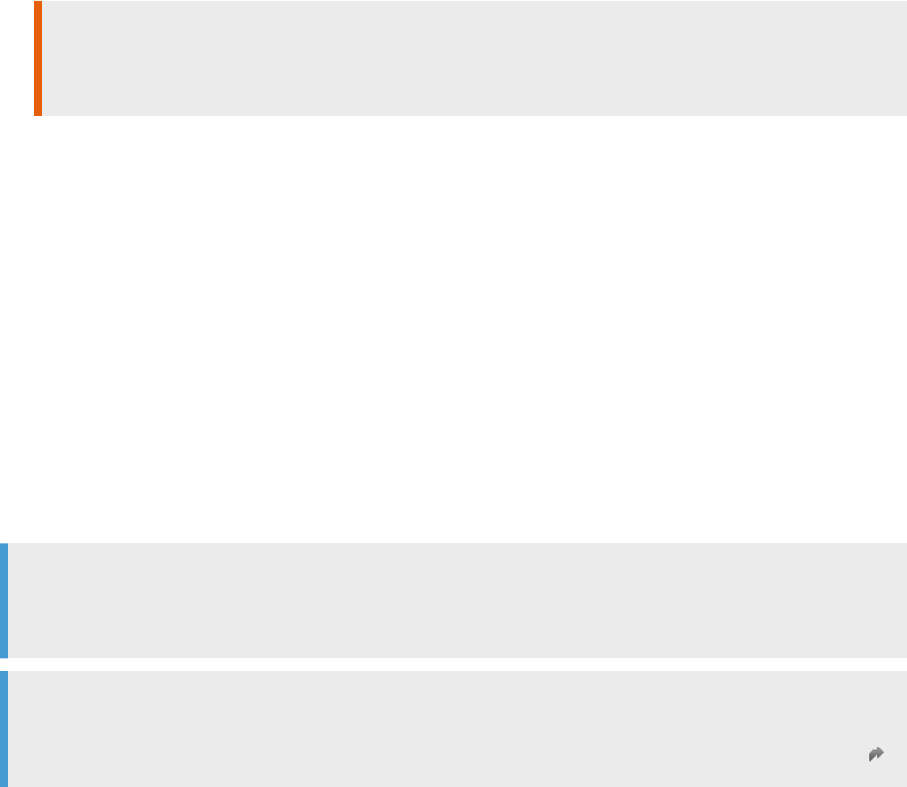
4.2.18.15.1 To extend dimension values
You can activate the dimension extension option in the Document Properties pane.
Procedure
1. Open a Web Intelligence document in Design mode.
2. In the Properties tab, select Document.
3. In the Document Properties pane, select the Extend merged dimension values option.
Restriction
You should only activate the Extend merged dimension values option when you want to reproduce the
merged dimension behavior of SAP BusinessObjects Desktop Intelligence.
4. Click OK to close the Document Properties pane.
4.2.19 Formatting your reports using Cascading Style Sheets
Web Intelligence Cascading Style Sheets (CSS) dene how to display your reports and determine the
presentation of documents.
You can edit the CSS to apply a specic style to the presentation of documents. You can export the le, modify
the styles according to your needs and then import the le back. You can also distribute the style sheet to other
users as a standard style.
The Web Intelligence CSS conforms to the W3C CSS core syntax. However, the core syntax does not imply
anything about property names, types and semantic. Web Intelligence CSS supports locale-specic style
sheets.
Note
The CSS style sheet does not control the color of charts. There is a separate le for dening corporate
palettes for charts.
Note
The Cascading Style Sheets are derived from the W3C CSS. In order to modify the CSS of your documents,
you must be familiar with the CSS core syntax of the W3C. For more information, see http://www.w3.org .
Using a CSS allows you to:
● Dene a company-wide style sheet in order to dene standard settings (such as a company logo).
298
P U B L I C
SAP BusinessObjects Web Intelligence User's Guide
Reporting data
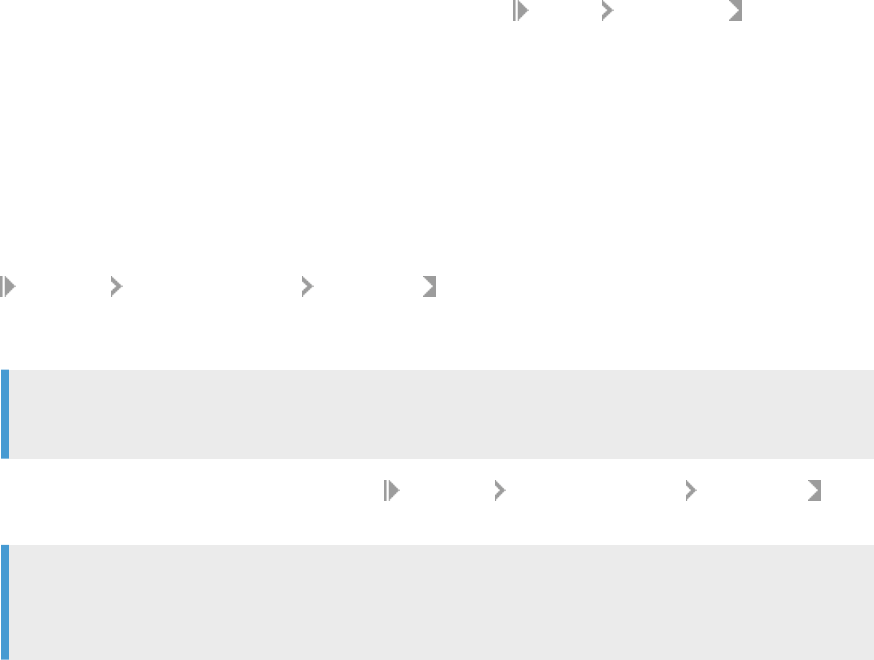
● Dene dierent styles to present a specic type of information. For example, you can use one color for
products sold, another color for expenses and another color for revenues.
● Create a style sheet in order to encode personal preferences.
● Personalize the presentation of the documents you create.
Related Information
Formatting the report layout [page 253]
Creating a corporate palette for charts [page 424]
Formatting tables and table cells [page 327]
4.2.19.1 Using a Cascading Style Sheet in documents
When you create a report or a report element in a Web Intelligence document, the formatting is entirely based
on the default style.
If specic formatting is done on these elements by the user from the Right-click context menu (Format option),
the modied properties overwrite locally the values taken from the default style.
To remove this specic formatting, right-click the report and select Format Clear Format .
4.2.19.2 Modifying the document default style
The document default style is stored in a Cascading Style Sheet (CSS) le that is embedded into the document
itself.
● To modify the default style, you can export the CSS le. To export a CSS le, in the Properties tab, click
Document Change Default Style Export Style .
● You can use any text editor to edit a CSS le. Once you have edited the le, save and import it to apply the
changes.
Note
You have to import the CSS le every time you edit it.
To import a CSS le, in the Properties tab, click Document Change Default Style Import Style . The
CSS le you import is applied to the report.
Note
If the properties of an element have been set through the user interface (toolbox, context menu, dialog
box), these properties are not aected by the CSS you import.
SAP BusinessObjects Web Intelligence User's Guide
Reporting data
P U B L I C 299
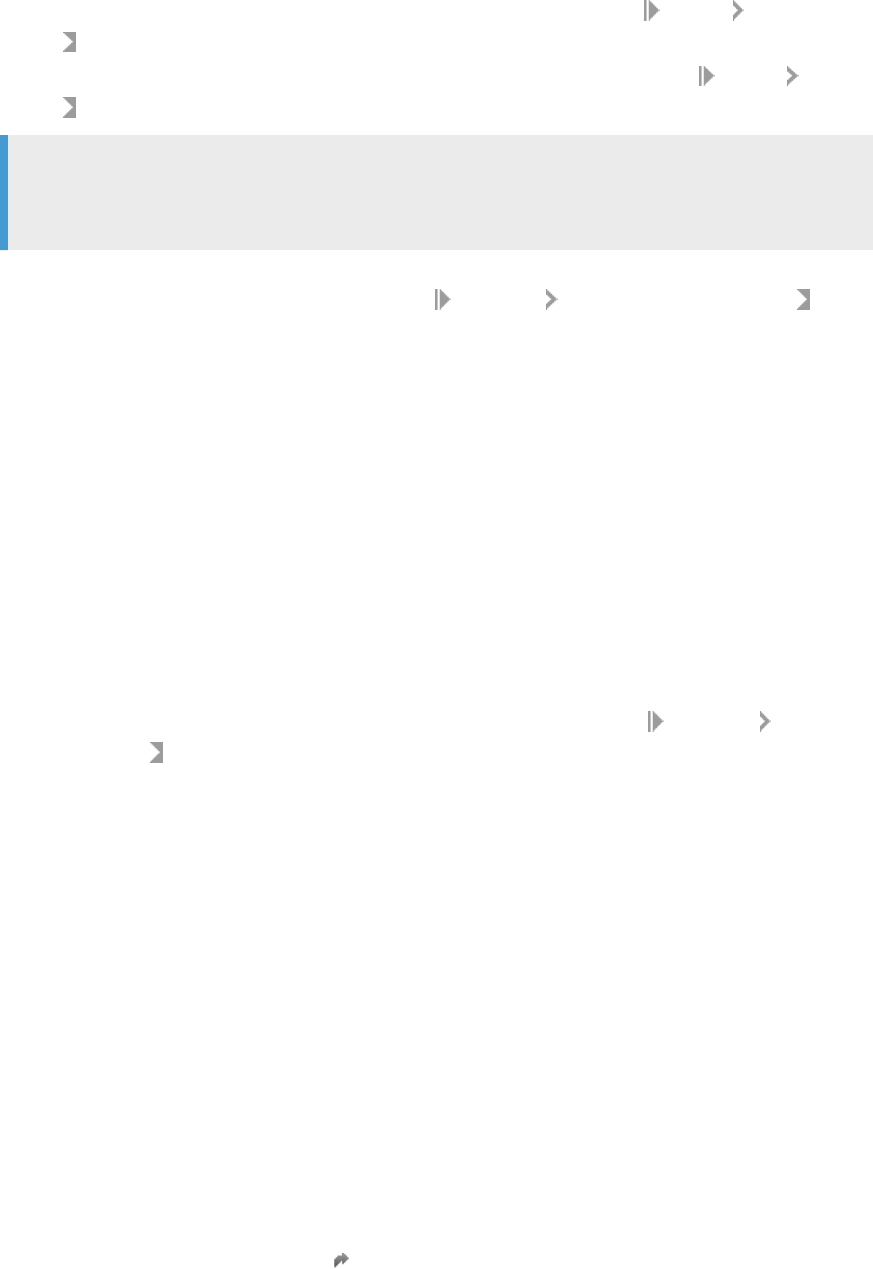
● To apply a CSS to an element that has already been formatted through the user interface, you have to clear
its format. To clear the format of an element, right-click the element and select Format Clear
Format .
● To clear the format of all the elements in a page, right-click the report body and select Format Clear
Format .
Note
You have to clear the format of the header and footer manually because they are not a part of the
report body.
● You can undo changes at any time by clicking the Undo button.
● To restore the default CSS, in the Properties tab, click Document Reset standard Default Style .
4.2.19.3 Modifying and using the standard default style
The standard CSS le is named WebIDefaultStyleSheet.css.
This standard CSS le is located by default at:
c:\Program Files(x86)\SAP BusinessObjects Entreprise XI\images
\WebIDefaultStyleSheet.css
When you create a 4.X document, or when you edit a Web Intelligence 3.1 document for the rst time, the
standard CSS is embedded into the Web Intelligence document to become the document style. This default
style document diverges from the standard and can be locally modied.
To reset the document default style to the standard style, in the Properties tab, click Document Reset
standard Default Style
. The standard CSS will replace the previous CSS in the document.
To publish a standard default le, you must have access to the ../images/ folder of your servers and Web
Intelligence Rich Client
installations to put a new version of WebiDefaultStyleSheet.css.
4.2.19.4 Web Intelligence CSS syntax
The Web Intelligence CSS conforms to the W3C CSS core syntax.
However, the core syntax does not imply anything about property names, types and semantic.
Web Intelligence CSS supports locale-specic style sheets.
Related Information
http://www.w3.org/TR/CSS21/syndata.html
300
P U B L I C
SAP BusinessObjects Web Intelligence User's Guide
Reporting data

4.2.19.4.1 Cascading Style Sheet elements
In order to modify the way your document is displayed, you have to modify the Web Intelligence CSS elements
of the document.
To modify an element, you have to modify its properties.
This table shows the elements you can edit in the CSS le:
Element Denition
REPORT
Tag that contains the report
PAGE_BODY
Tag that contains the page
PAGE_HEADER Tag that contains the area on top of the PAGE_BODY
PAGE_FOOTER Tag that contains the area in the bottom of the PAGE_BODY
SECTION Tag that contains an area inside the PAGE_BODY
TABLE
Tag that contains a table
VTABLE
Tag that modies a table vertically
HTABLE
Tag that modies the table horizontally
COLINFO
Tag that contains the columns of a table
ROWINFO
Tag that contains tha rows of a table
CELL
Tag that contains the cells of a table
AXIS
Tag that denes the relationship between the columns and
rows of a table
FORM
Tag that contains a form
XELEMENT
Tag that contains a graphic
BAG
Tag that contains elements and places them relatively using
X and Y
WOB
Tag that contains elements and places them automatically
4.2.19.4.2 Cascading Style Sheet properties
For many properties, Web Intelligence CSS uses the same names as the W3C CSS.
Some property names change and some are ignored.
Example
Web Intelligence CSS uses the property min-width and the W3C CSS uses the property width. Both
properties have the same use.
SAP BusinessObjects Web Intelligence User's Guide
Reporting data
P U B L I C 301

4.2.19.4.2.1 Report page properties
For cascading style sheets, you can edit the following report page properties.
This table shows the properties that can be applied to the element REPORT:
Property name Description Default value Value range
page-format-
dimension-height
Height of page 42094 Numeric value
page-format-
dimension-width
Width of page 29764 Numeric value
page-format-margin-
bottom
Size of the bottom margin of
the page
0 Numeric value
page-format-margin-
left
Size of the left margin of the
page
0 Numeric value
page-format-margin-
right
Size of the right margin of
the page
0 Numeric value
page-format-margin-
top
Size of the top margin of the
page
0 Numeric value
page-format-
orientation
Orientation of page
portrait landscape, portrait
page-records-
horizontal
In Quick Display mode,
species how many data
records can be horizontally
displayed before triggering a
page break
150 Numeric value
page-records-
vertical
In Quick Display mode,
species how many data
records can be vertically
displayed before triggering a
page break
50 Numeric value
page-scaling-factor
Zoom percentage 100 Numeric value
page-scaling-tall
When this property is
dened, the report will be
scaled so that it ts in the
given height
100 Numeric value
page-scaling-wide
When this property is
dened, the report will be
scaled so that it ts in the
given width
0 Numeric value
page-target-mode
Pagination mode: quick
display or not
undefined undefined, quick,
all
302 P U B L I C
SAP BusinessObjects Web Intelligence User's Guide
Reporting data
4.2.19.4.2.2 Report element properties
For cascading style sheets, you can edit the properties in report elements.
Property name Description Default value Value range
autofit-height
Species whether the height
of the element can be
adjusted to t its content
yes yes/no
autofit-width
Species whether the width
of the element can be
adjusted to t its content
yes yes/no
bookmark
Species whether the
element will be bookmarked
no yes/no
h-align
Horizontal positioning of the
element
none none, top, center,
bottom
hide
Species whether the
element is hidden
no yes/no
min-height
Minimal height of the
element
0 Numeric value
min-width
Minimal width of the element 0 Numeric value
never-alternate
This property can be used to
avoid the application of the
alternate style on the
element
no yes/no
padding-bottom
How much space to put
between the bottom border
and the content of the
element
0 Numeric value
padding-left
How much space to put
between the left border and
the content of the element
0 Numeric value
padding-right
How much space to put
between the right border and
the content of the element
0 Numeric value
padding-top
How much space to put
between the top border and
the content of the element
0 Numeric value
struct-min-height
Minimal height of the
element when displayed in
structure mode
900 Numeric value
struct-min-width
Minimal width of the element
when displayed in structure
mode
4050 Numeric value
v-align
Vertical positioning of the
element
none none, top, center,
bottom
These properties can be applied to the following elements:
SAP BusinessObjects Web Intelligence User's Guide
Reporting data
P U B L I C 303
● BAG
● WOB
● CELL
● VTABLE
● HTABLE
● XTABLE
● TABLE
● XELEMENT
● SECTION
4.2.19.4.2.3 Formatting properties
For cascading style sheets, you can edit the Formatting elements.
This table shows the properties that you can edit to modify the Formatting elements:
Property name Description Default value Value range
background-color
Color to be displayed in
background
#000000 Any hexadecimal color
background-fill
Describes what will be
displayed in background
none color, bitmap,
bitmapAndColor,
skin, none
background-h-align
Horizontal position of the
background image
center left, center, right
background-image
Image to be displayed in
background
None Any image you want
background-inner-
height
Inner height of background 0 Numeric value
background-inner-
width
Inner width of background 0 Numeric value
background-type
Determines how the
background image will be
laid out or repeated
box box, tile, vtile,
htile, stretch
background-v-align
Vertical position of the
background image
center top, center, bottom
border-bottom-color
Color of an element's
bottom border
#000000 Any hexadecimal color
border-bottom-style
Style of an element's bottom
border
none none, dashed,
dotted, double,
plain
border-bottom-width
Width of an element's
bottom border
0 Numeric value
304 P U B L I C
SAP BusinessObjects Web Intelligence User's Guide
Reporting data

Property name Description Default value Value range
border-left-color
Color of an element's left
border
#000000 Any hexadecimal color
border-left-style
Style of an element's left
border
none none, dashed,
dotted, double,
plain
border-left-width
Width of an element's left
border
0 Numeric value
border-right-color
Color of an element's right
border
#000000 Any hexadecimal color
border-right-style
Style of an element's right
border
none none, dashed,
dotted, double,
plain
border-right-width
Width of an element's right
border
0 Numeric value
border-top-color
Color of an element's top
border
#000000 Any hexadecimal color
border-top-style
Style of an element's top
border
none none, dashed,
dotted, double,
plain
border-top-width
Width of an element's top
border
0 Numeric value
color
Foreground color #000000 Any hexadecimal color
default-date-h-
align
Default horizontal alignment
when a date is being
displayed
right lleft, center,
right, auto
default-numeric-h-
align
Default horizontal alignment
when a numeric value is
being displayed
right left, center,
right, auto
default-text-h-
align
Default horizontal alignment
when a text is being
displayed
left left, center,
right, auto
font-family
Name of font family
default
Web Intelligence-supported
fonts
font-orientation
Describes the orientation of
the displayed text
normal normal, hotel, 45D,
90D, 180D, 270D,
315D
font-size
Size of the displayed font 0 Numeric value in points (pt.)
font-style-italic
Activates the italic font style
no yes/no
font-weight-bold
Activates the bold font style
no yes/no
text-align
Horizontal alignment of the
text
left left, center,
right, auto
SAP BusinessObjects Web Intelligence User's Guide
Reporting data
P U B L I C 305
Property name Description Default value Value range
text-decoration-
line-through
Activates the line-through
text decoration
no yes/no
text-decoration-
underline
Activates the underline text
decoration
no yes/no
text-v-align
Vertical alignment of the text
bottom top, center, bottom
text-wrap
Species whether the text
may be wrapped
no yes/no
These properties can be applied to the following elements:
● BAG
● WOB
● CELL
● VTABLE
● HTABLE
● XTABLE
● TABLE
● XELEMENT
● SECTION
4.2.19.4.2.4 Spacing properties
For cascading style sheets, you can edit the spacing element properties.
This table shows the properties that you can edit to modify the spacing elements:
Property name Description Default value Value range
h-spacing
Horizontal spacing of
children
0 Numeric value
v-spacing
Vertical spacing of children 0 Numeric value
These properties can be applied to the following elements:
● BAG
● WOB
4.2.19.4.2.5 Hyperlink properties
For cascading style sheets, you can edit the hyperlink elements.
This table shows the properties that you can edit to modify the hyperlink elements:
306
P U B L I C
SAP BusinessObjects Web Intelligence User's Guide
Reporting data

Property name Description Default value Value range
active-color
Color of hyperlinks when
they are being activated
#000000 Any hexadecimal color
hover-color
Color of hyperlinks when the
user designates it (by a
pointing device)
#000000 Any hexadecimal color
link-color
Color of hyperlinks #0000 Any hexadecimal color
visited-color
Color of visited hyperlinks #000000 Any hexadecimal color
These properties can be applied to the following elements:
● REPORT
4.2.19.4.2.6 Break properties
For cascading style sheets, you can edit the break element properties.
This table shows the properties that can be applied to the BREAK element:
Property name Description Default value Value range
break-newpage
Reports always start on a
new page
false true/false
break-onepage
Reports start on a new page
only if they do not t in the
current page
true true/false
4.2.19.4.3 Cascading Style Sheet units
Numeric values can be very important in Cascading Style Sheet units.
Numeric values in fonts
When you assign a numeric value to the property font-size, you can only use the unit "points" (pt).
For example: font-size : 14pt;
Numeric values in dimension properties
When you assign a numeric value to any other dimension property, you can use centimeters (cm), inches (in)
or "metric" (without any unit).
SAP BusinessObjects Web Intelligence User's Guide
Reporting data
P U B L I C 307
width : 1.0in; would be the same as width : 2.54cm; and the same as width : 3600;
4.2.19.5 Style and 3.x documents
When you open a Web Intelligence 4.x document with a Web Intelligence 3.x format, the style of the document
does not change, regardless of the style dened in the standard CSS.
However, the style used while creating report elements or during Turn into operations will come from the CSS.
The Web Intelligence CSS replaces the old way of personalizing your documents.
To set the default style dened by the report elements in the document, select the report elements and go to
Format Clear Format . The formatting of the selected objects will be cleared and the default style will be
applied.
The DefaultConfig.xml le used in the previous versions is obsolete.
Here are some correspondances between the entries of Web Intelligence CSS and the obsolete entries of the
DefaultConfig.xml le used in previous versions.
WebI selector Corresponding entry in defaultCong.xml
TABLE table*Table
FORM table*Form
SECTION Section*background
CELL freeCell*default
4.2.20 Enhancing reports with calculations, formulas and
variables
You can use calculations, formulas and variables to manipulate data in reports.
Refer to the Using Functions, Formulas and Calculations in Web Intelligence guide for detailed information on
the advanced calculation capabilities that you can use when you perform data analysis. This guide also
provides a syntax reference to the available functions and operators.
4.2.20.1 Standard calculations
You can use standard calculation functions to make quick calculations on data.
The following standard calculations are available:
308
P U B L I C
SAP BusinessObjects Web Intelligence User's Guide
Reporting data

Calculation Description
Sum Calculates the sum of the selected data.
Count Counts all rows for a measure object or count distinct rows for a dimension or detail object.
Average Calculates the average of the data.
Minimum Displays the minimum value of the selected data.
Maximum Displays the maximum value of the selected data.
Percentage Displays the selected data as a percentage of the total. The results of the percentage are
displayed in an additional column or row of the table.
Note
Percentages are calculated for the selected measure compared to the total results for
that measure on the table or break. To calculate the percentage of one measure com
pared to another measure, you need to build a custom calculation.
Default
Applies the default aggregation function to a standard measure, or the database aggrega
tion function to a smart measure.
When you apply standard calculations to table columns, the calculation results appear in footers. One footer is
added for each calculation.
4.2.20.1.1 To insert a standard calculation in a table or cross
table
You can insert standard calculations in tables or cross tables to make quick calculations on table data.
Context
For more information on the standard calculations, see the Using Functions, Formulas and Calculations in Web
Intelligence guide or in the online help.
You can insert multiple calculations in a table or cross table. When you apply two calculations to a table or
crosstab, a footer is added for each calculation result. You insert multiple calculations in a table or cross table
in the same way that you insert one calculation, but you repeat the procedure for as many calculations as you
want to insert.
Procedure
1. In a Web Intelligence document in Design mode, click the table cell that contains the data you want to
calculate.
2. In the Analysis tab, in the Functions subtab, select a calculation.
SAP BusinessObjects Web Intelligence User's Guide
Reporting data
P U B L I C 309

You can repeat this step to add multiple calculations to the same column.
Tip
Double-click a cell to launch the Formula Editor toolbar, in which you can edit the formula.
A footer containing the result of the calculation is added below the column.
4.2.20.1.2 To remove a standard calculation
You can remove a standard calculation in Web Intelligence.
Procedure
1. Open a Web Intelligence document in Design mode.
2. Right-click that contains the calculation that you want to remove and select Delete.
4.2.20.2 Using formulas to build custom calculations
Custom calculations allow you to add additional calculations to your report beyond its base objects and
standard calculations.
You add a custom calculation by writing a formula. A formula can consist of base report variables, functions,
operators and calculation contexts.
A custom calculation is a formula that can consist of report objects, functions and operators. Formulas have a
calculation context that you can specify explicitly if you choose.
Example
Showing average revenue per sale
If you have a report with Sales Revenue and Number Sold objects and you want to add revenue per sale to
the report, the calculation [Sales Revenue]/[Number Sold] gives this value by dividing the revenue by
the number of items sold in order to give the revenue per item.
310
P U B L I C
SAP BusinessObjects Web Intelligence User's Guide
Reporting data

4.2.20.2.1 To enter a formula by typing
You can manually enter formulas in the Formula Editor in Web Intelligence.
Procedure
1. In a Web Intelligence document in Design mode, select the Properties tab.
2. From the View dropdown list, select Formula Bar to display the Formula Bar.
3. Select or insert a cell or text box in the report.
4. Type a formula in the Formula box.
5. To build a formula using the Formula Editor, click the Formula Editor icon on the Formula Bar.
6. Build the formula.
7. To conrm and apply the formula, click OK.
4.2.20.2.2 To build a formula in the Formula Editor
You can use the Formula Editor to dene the formula for a table cell.
Context
In the Formula Editor, you can dene a formula, include a list of values in the formula, and include a prompt in
the formula.
Note
For more information about operators and functions, refer to the Using functions, formulas and calculations
in Web Intelligence guide or the Web Intelligence online help. You can also access this information by
selecting an operator or function and clicking More on this function in the Description box.
Procedure
1. In a Web Intelligence document in Design mode, select the table cell where you want to insert the formula.
2. In the Properties tab, select Formula Bar from the View dropdown list to display the Formula Bar.
3. To build a formula using the Formula Editor, click the Formula Editor icon on the Formula bar.
4. Double-click to select an object for the formula from the Available Objects pane.
5. Double-click to select a function for the formula from the Available Functions or Functions pane.
6. Double-click to select an operator for you formula from the Available Operators or Operators pane.
SAP BusinessObjects Web Intelligence User's Guide
Reporting data
P U B L I C 311
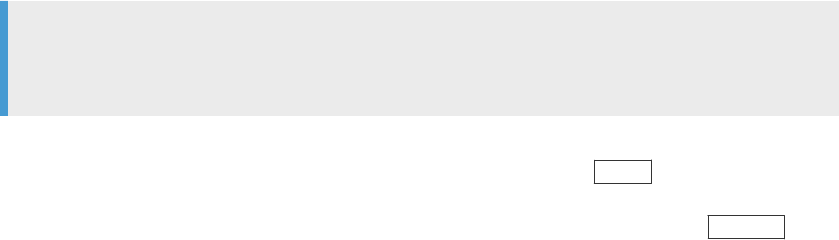
If your formula requires you to select one or more values from a list of values, perform the following steps:
a. Select an object in the Available Operators list.
b. Double-click Prompts to open the prompt editor and dene a prompt.
c. Double-click the Values item to open the List of Values dialog box.
d. Do one of the following:
Note
For more information about including prompts in the formula, refer to the pdf version of the Web
Intelligence user documentation.
○ To select one value, select the value and then click OK.
○ To select contiguous values, select the rst value. While pressing the Shift key, click the last
value and then click OK.
○ To select several (non-contiguous) values, select the rst value. While pressing the Control key,
click the other values you want to select and then click OK.
7. To conrm and apply the formula, click OK.
Related Information
Filtering data with prompts [page 519]
4.2.20.3 Using variables to simplify formulas
Variables are useful to break down formulas into manageable parts and make them easier to read. They also
make building a formula less error-prone.
Variables are available in the Available Objects pane, under the Variables folder.
As of the 4.2 SP4 release, a new Description eld is available so that you can provide context and details about
a specic variable. The description that you enter is then displayed in the Query Panel when you hover over the
variable. You can edit this description when creating, editing or renaming a variable.
4.2.20.3.1 To create a variable
You can create a variable in Web Intelligence.
Procedure
1. Open a Web Intelligence document in Design mode.
312
P U B L I C
SAP BusinessObjects Web Intelligence User's Guide
Reporting data

2. To display the Formula Bar, in the Properties tab, select Formula bar from the View dropdown list.
3. Click the Create Variable icon in the Formula Bar to display the Create New Variable or Create Variable
panel.
4. Type the variable name in the Name box.
5. In the Formula box, build a formula for the variable, if one is not already displayed.
Note
○ If a cell is selected before you open the Formula Editor, the formula you create is assigned to the
cell.
○ For detailed information on building formulas, including a syntax reference to the available
functions and operators, refer to the Using functions, formulas and calculations in Web Intelligence
guide or the Web Intelligence interface help.
6. Select a variable qualication.
7. Click OK to save the variable and return to the document.
4.2.20.3.2 To edit a variable
You can edit a variable in Web Intelligence.
Procedure
1. In a Web Intelligence document in Design mode, select the Available Objects tab on the Side Panel.
2. Right-click the variable you want to edit and select Edit .
The Variable Editor or Edit Variable panel appears.
3. Edit the variable.
Note
For detailed information on building formulas, including a syntax reference to the available functions
and operators, refer to the Using functions, formulas and calculations in Web Intelligence guide or the
Web Intelligence interface help.
4. Click OK to return to the document.
The following warning message appears: Are you sure you want to modify this variable?
5. Click Yes to return to the document.
SAP BusinessObjects Web Intelligence User's Guide
Reporting data
P U B L I C 313

4.2.20.3.3 To delete a variable
You can delete a variable in Web Intelligence.
Procedure
1. In a Web Intelligence document in Design mode, select the Available Objects tab on the Side Panel.
2. Right-click in the list the variable that you want to delete and select Remove.
4.2.20.3.4 To rename a variable
You can rename a variable in the Web Intelligence Applet interface and Web Intelligence Rich Client.
Procedure
1. In a Web Intelligence document in Design mode, select the Available Objects tab on the Side Panel.
2. Right-click the variable that you want to rename and select Rename.
Note
The Rename options is not available in the Web Intelligence HTML interface, however you can rename
the variable in the Variable Editor or Edit Variable panel.
3. Rename the variable and click OK to save it.
Related Information
To edit a variable [page 313]
314
P U B L I C
SAP BusinessObjects Web Intelligence User's Guide
Reporting data

4.2.20.3.5 To duplicate a variable
You can duplicate a variable in Web Intelligence.
Procedure
1. In a Web Intelligence document in Design mode, select the Available Objects tab in the Side Panel.
2. Right-click the variable that you want to duplicate and select Copy.
3. Right-click the Variables folder icon and select Paste.
The duplicated variable appears below the original variable, with a number in parenthesis in its name, for
example (1) for the rst duplicate, (2) for the second duplicate, and so on.
4.2.20.3.6 To merge variables
You can merge two variables, or merge a variable with another object.
Context
The variables must be dimension objects, and must come from dierent queries. You cannot merge objects
coming from the same query.
Tip
To have a better visibility of the variables you can merge, switch to the Arranged by: Query view in the
Available Objects pane. Using this view, you can see the variables coming from the dierent queries used in
your document.
Procedure
1. In Design mode, select the Available Objects tab on the Side Panel.
2. Select two variables you want to merge by holding the Ctrl or Cmd key.
3. Right-click one of the variables you have selected.
4. Click Merge.
SAP BusinessObjects Web Intelligence User's Guide
Reporting data
P U B L I C 315
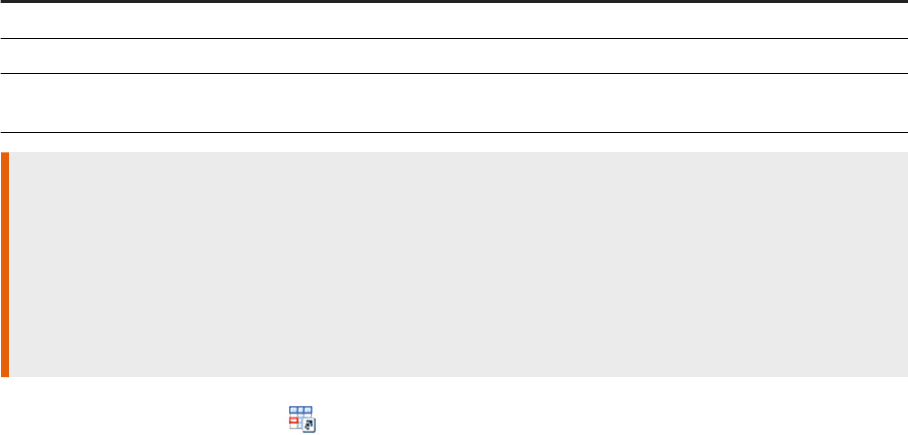
4.2.20.4 Using references to reuse data
A reference is a variable whose denition and content are based on another cell. It is useful whenever you want
to leverage data of a cell that has been obtained using a complex formula.
You use a reference to point to another cell and reuse its value. Using a reference as a direct pointer to the
content of a referenced cell is a direct shortcut to the value you are interested in. After you have created a
reference in a document, it is replaced by the content of it referenced cell. In the 4.2 SP4 release, a new
Description eld is available so that you can provide context and details about a specic reference. The
description that you enter is then displayed in the Query Panel when you hover over a reference. It gives
information on how to use it, and you can edit this description when creating, editing or renaming a reference.
You can use references anywhere in a document, in any report or formula. As an example, you could use
references to create a summary report that references gures from other reports.
A reference always inherits the type of the cell it references. If the referenced cell type is a string for instance,
then the reference type is a string as well. If the referenced cell type changes, then the reference adapts so.
The denition of a reference is made of two elements:
● A name
● The path of the cell it references
The following table lists the denitions related to references:
Concept
Denition
Reference Variable whose denition and value references a target cell
Referenced cell Target cell of the reference
Referenced cell content Data contained in the reference, reused from the referenced
cell
Restriction
● A reference doesn’t keep the format of its target cell. If a target cell has a specic color or font for
instance, it is not reected in the reference.
● When hiding a column table that contains a referenced cell or a commented cell, the reference is lost as
well as the comment.
● When turning a table into a chart and then turning it back into a table, it is empty if the original table
contained a reference. That is because references are constant strings and aren't supported by charts.
References use the following icon:
316
P U B L I C
SAP BusinessObjects Web Intelligence User's Guide
Reporting data
4.2.20.4.1 To assign a reference
Context
Procedure
1. Right-click a cell whose content you want to reuse.
2. Click Assign Reference.
3. Select whether you want to assign a new reference to the cell or an existing one.
4. Click OK.
Results
The reference now appears in the Available Objects pane, under the References folder. Note that if you copy and
paste a cell using a reference, then the reference in the copied cell points to the same target cell.
4.2.20.4.2 To rename a reference
Context
Procedure
1. In the Available Objects pane, right-click the reference you want to rename.
2. Click Rename.
3. Enter a name in the New name text eld.
4. Click OK.
SAP BusinessObjects Web Intelligence User's Guide
Reporting data
P U B L I C 317
Results
The reference has been updated with its new name in the Available Objects pane, under the References folder.
4.2.20.4.3 To delete a reference
Context
Procedure
1. In the Available Objects pane, right-click a reference you want to delete.
2. Click Delete.
3. Click OK.
Results
In the Available Objects pane, the reference you have deleted no longer appears under the References folder.
4.2.20.4.4 To display a referenced cell
Context
Procedure
1. In the Available Objects pane, right-click a reference whose referenced cell you want to display.
2. Click Show referenced cell.
318
P U B L I C
SAP BusinessObjects Web Intelligence User's Guide
Reporting data

Results
The cell is automatically selected on the report page.
4.2.21 Displaying data in tables
When you create a document and run the query the rst time to display the results, the document contains a
report that includes the query results in a vertical table.
You can do the following:
● Modify how the table is organized
● Remove or add data
● Insert other rows or columns
● Hide columns (see note below)
● Change the table type
● Turn the table into a chart
● Insert other tables
Tip
When you create a new name for a column, it becomes a custom header and it is no longer attached to the
dimension. When you hide the column and show it again, it will revert to the original, default column name.
If you want the custom header name to be permanent, you can create a variable.
Related Information
To create a variable [page 312]
4.2.21.1 Vertical tables
Vertical tables display header cells at the top of the table and the corresponding data in columns.
By default, the header cells display the names of the dimensions, details, and measures included in the table.
The body cells display the corresponding values.
SAP BusinessObjects Web Intelligence User's Guide
Reporting data
P U B L I C 319
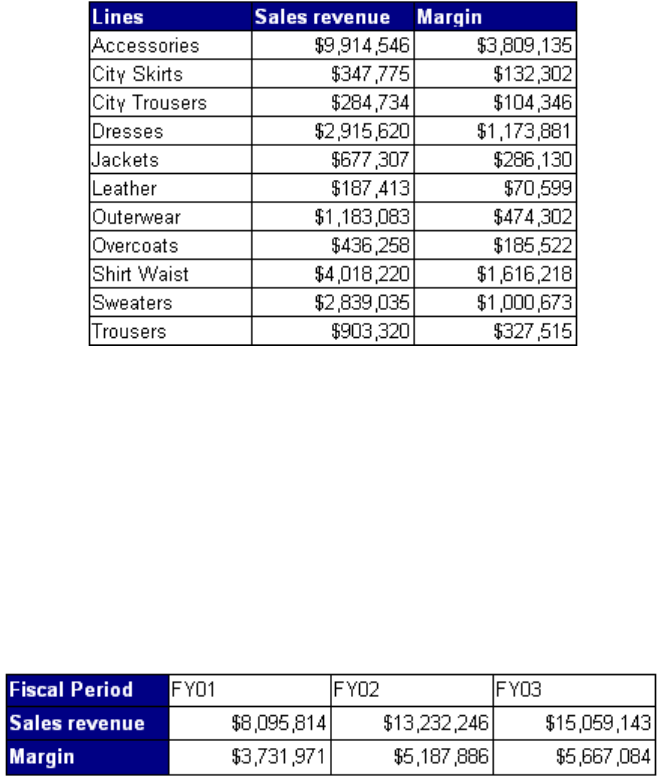
4.2.21.2 Horizontal tables
Horizontal tables display header cells on the side of the table and the corresponding data in rows.
By default, the header cells display the names of the dimensions, details, and measures included in the table.
The body cells display the corresponding values.
4.2.21.3 Cross tables
Cross tables display values for dimensions across the top axis and on the side axis.
The body displays the values of a measure that correspond to the cross-section of the dimensions.
Values in cross tables
In the following example, the cross table displays values for [Quarter] across the top axis and displays values
for [State] on the side axis. The body displays values that [Sales Revenue] for each quarter in each state.
320
P U B L I C
SAP BusinessObjects Web Intelligence User's Guide
Reporting data
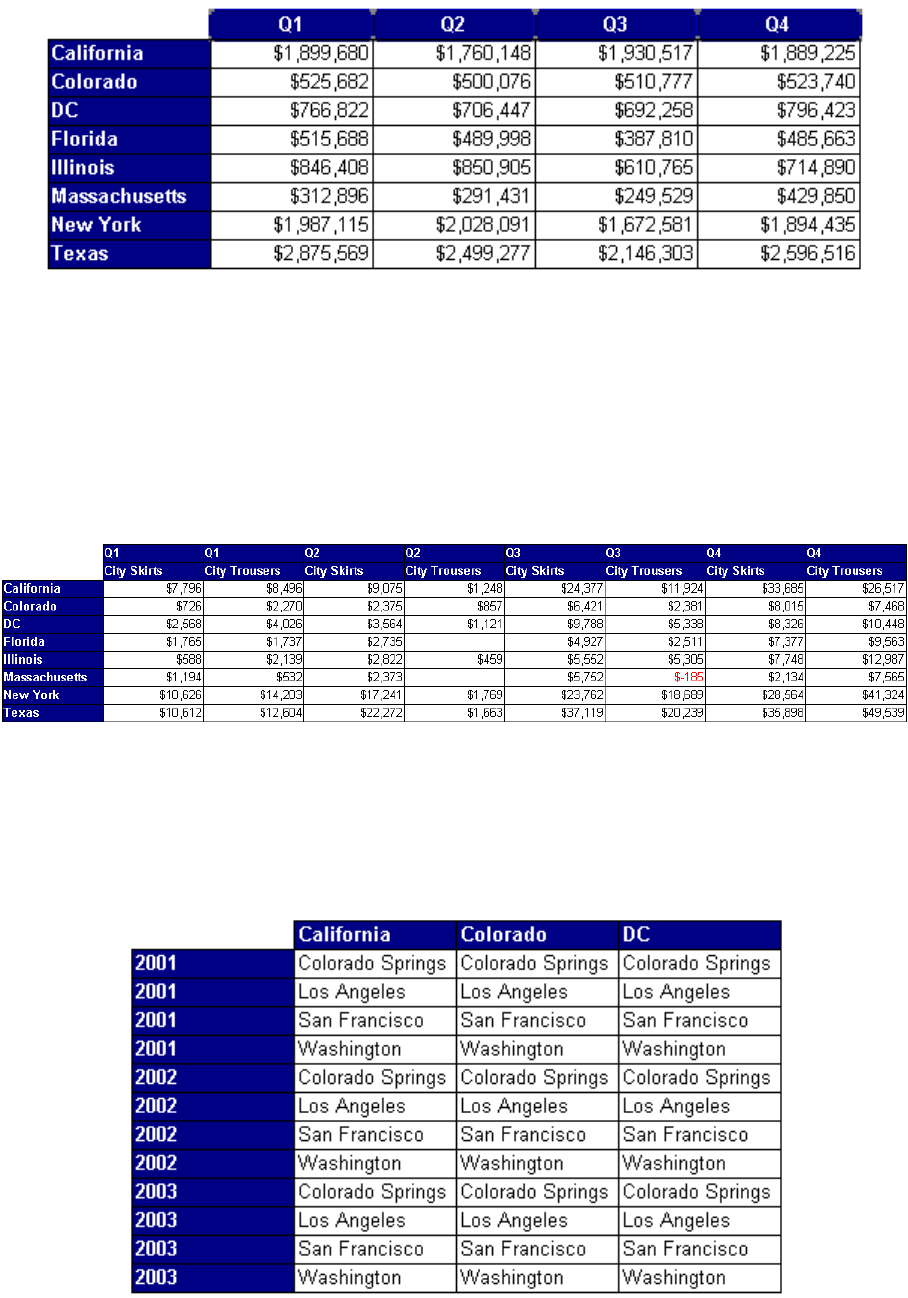
Multiple dimensions in cross tables
You can include multiple dimensions in cross tables. In the following example, the cross table displays two
dimensions. The values for the [Sales Revenue] measure are values each state by quarter for each line.
When you create cross tables that include dimensions in the body, the body cell values are calculated
according to a multi-dimensional data model. In the following example, the values displayed in the body are
calculated according to all of the coordinates on the table axes, whether or not there is a row for the specic
coordinate in the data.
SAP BusinessObjects Web Intelligence User's Guide
Reporting data
P U B L I C 321
4.2.21.4 Forms
You can use in your report to display detailed information per customer, product, or partner.
For example, you can use a form to display customer information such as the account, name, address, and so
on.
Forms are also useful for formatting address labels for envelopes.
4.2.21.5 To create a table by dragging objects onto a report
You are working with a report and want to insert a table into the report. You use the available objects from the
query.
Procedure
1. In a Web Intelligence document in Design mode, click the Available Objects icon to display the Available
Objects list in the Side Panel.
2. Select an object or objects and drag and drop them with the mouse cursor to an empty part of the report.
When you release the mouse button the objects appear as columns in a vertical table.
3. To add another object or objects to the table, drag them onto an existing table.
For example:
○ To add a column next to an existing column, drag and drop the object to the border of the column.
○ To replace an existing column, drag and drop the object to the middle of the column.
4.2.21.6 To create a table
Working in Structure mode allows you to dene and preview a new table without data from the server.
Procedure
1. In a Web Intelligence document, from the Design mode dropdown list in the top corner of the toolbar, click
Structure only to switch to Structure mode.
2. In the Report Elements tab, select the Tables subtab.
3. Select one of the following:
322
P U B L I C
SAP BusinessObjects Web Intelligence User's Guide
Reporting data

○ Dene Vertical Table
○ Dene Horizontal Table
○ Dene Cross Table
○ Dene Form
4. Click the report at the position where you want the table to appear.
5. Right-click the table border and select Assign Data from the contextual menu
The Assign Data dialog box appears.
6. Click the arrow in the Pick text box and from the dropdown list select the object to associate with the table
column, row or body cell.
Note
You can associate a formula rather than a report object with the component by clicking the arrow next
to the component, selecting Edit Formula and dening the formula in the Formula Editor.
7. To add another table element, click + next to the Pick text box.
8. To delete a table component, do one of the following:
○ Click the X icon.
○ Click the arrow next to an element text box and select Delete from the contextual menu.
9. When you have nished dening the table, click OK.
4.2.21.7 To change the format of a table
You can turn a table into a dierent format or into a chart using the Turn Table Into option.
Procedure
1. In a Web Intelligence document in Design mode, right-click the table you want to reformat, then select Turn
Table Into to display the Turn Into options.
You can also select the table or chart style from the Tools section of the Report Elements tab.
2. Choose a table or chart type.
Next Steps
Note
When you turn a table with a unicode font into a chart, the font is not retained unless unicode is dened as
your default font for charts. Contact the BI administrator for further information on setting unicode as your
default font.
SAP BusinessObjects Web Intelligence User's Guide
Reporting data
P U B L I C 323
4.2.21.8 To add table rows or columns
You can add table rows and columns in Web Intelligence document in Design mode.
Procedure
1. In a Web Intelligence document in Design mode, select a cell in the column or row next to which you want to
insert another column or row.
2. Do one of the following procedures:
○ Select the Report Element tab, and in the Table Layout subtab, from the Insert list, select one of the
following:
○ Insert Rows Above
○ Insert Rows Below
○ Insert Columns on Left
○ Insert Columns on Right
○ Right-click the cell and select Insert, then one of the following:
○ Row Above
○ Row Below
○ Column on Left
○ Column on Right
3. Drag an object from the Available Objects pane in the Side Panel to the empty column or row you inserted.
4.2.21.9 To remove table rows or columns
You can remove table rows or columns in a Web Intelligence document in Design mode.
Procedure
1. In a Web Intelligence document in Design mode, right-click the table column or row you want to remove
and select Delete from the menu.
By default, if you select Delete from the menu, it deletes the column in a vertical table or a row in a
horizontal table.
2. Select Row or Column.
3. Click OK.
324
P U B L I C
SAP BusinessObjects Web Intelligence User's Guide
Reporting data

4.2.21.10 To move a row or column
You can move a row or column in a table in a Web Intelligence document in Design mode.
Procedure
In a Web Intelligence document in Design mode, drag the selected column or row and drop it before or after
another column or row on the table.
When you drag a row or column, the column or row header displays next to your pointer.
4.2.21.11 To swap a row or column
You can swap rows and columns in tables in a Web Intelligence document in Design mode.
Procedure
1. Open a Web Intelligence document in Design mode.
2. Drag the selected column or row onto the column or row that you want to swap.
Tip
The drag and drop is not available if you are using Chrome as a web brower. To work around the issue,
move the mouse outside the table before you drop the colum or row.
4.2.21.12 To clear cell contents from a table
You can clear dierent types of cells in a table.
Context
You can clear the following types of cell in a table:
● Header cells – you can clear each header cell separately
● Footer cells – you can clear each footer cell separately
● Related body cells – when you clear one body cell, you automatically clear all of the body cells in the same
column or row of the table
SAP BusinessObjects Web Intelligence User's Guide
Reporting data
P U B L I C 325

Procedure
1. In a Web Intelligence document in Design mode, select the cell you want to clear.
The cell borders are highlighted.
2. Right-click the selected cell and click Clear Contents.
4.2.21.13 To remove a table
You can remove a table in a Web Intelligence document in Design mode.
Procedure
1. In a Web Intelligence document in Design mode, click the top edge of the table you want to remove.
A gray border appears around the table.
2. Press the Delete key on your keyboard.
4.2.21.14 To copy a table
You can copy and paste tables within a report or into external applications such as Microsoft Word and Excel.
Procedure
1. In a Web Intelligence document in Design mode, select and right-click the table you want to copy.
2. Select Copy.
3. To paste the table to another part of the report, right-click where you want the table to appear and select
Paste.
Restriction
You cannot copy tables from one version of Web Intelligence to another.
4. To paste the table into another application, paste the contents in the other application.
326
P U B L I C
SAP BusinessObjects Web Intelligence User's Guide
Reporting data
4.2.21.15 Formatting tables and table cells
In Web Intelligence, you can dene several visual aspects of tables and cells in reports.
● Select a background color for the table
● Insert an image or skin in a table or one or more of its cells
● Format table cells or borders
● Format text in table cells
● Set cell height and width
● Copy and paste formatting
● Set the position of the table in the report page
● Layer tables and cells
● Merge table cells
Related Information
To format the appearance of reports and their headers, footers, sections, tables, and table cells [page 255]
To format the appearance of reports and their headers, footers, sections, tables, and table cells [page 255]
To select a background color for the table or cells [page 327]
To dene alternate row and column colors for a table [page 328]
To format table or cell borders [page 329]
To format text in table cells [page 330]
To set cell height and width [page 332]
To copy formatting using the Format Painter tool [page 334]
To set the position of a table or chart on the report page [page 335]
To layer tables and cells [page 336]
To merge table cells [page 338]
Formatting the report layout [page 253]
Formatting your reports using Cascading Style Sheets [page 298]
Creating a corporate palette for charts [page 424]
4.2.21.15.1 To select a background color for the table or cells
You can set the background color for a table or its cells. When the background color of cells are dened (even
as white), they take precedence over the table background color.
Procedure
1. In a Web Intelligence document in Design mode, right-click the table or cell and select Format Table or
Format Cell from the contextual menu.
SAP BusinessObjects Web Intelligence User's Guide
Reporting data
P U B L I C 327

2. In the Appearance tab, click the radio button next to the color palette icon.
3. Click the arrow next to the color palette icon to display the palette.
4. Select a color from the palette.
5. Click OK to return to the document.
Tip
If you try to apply a background color to all of a table, and the cells remain white, make sure that the
cells are not set with a white background.
Related Information
To format the appearance of reports and their headers, footers, sections, tables, and table cells [page 255]
To format the appearance of reports and their headers, footers, sections, tables, and table cells [page 255]
To dene alternate row and column colors for a table [page 328]
To format table or cell borders [page 329]
To format text in table cells [page 330]
To set cell height and width [page 332]
To copy formatting using the Format Painter tool [page 334]
To set the position of a table or chart on the report page [page 335]
To layer tables and cells [page 336]
To merge table cells [page 338]
Formatting the report layout [page 253]
Formatting your reports using Cascading Style Sheets [page 298]
Creating a corporate palette for charts [page 424]
4.2.21.15.2 To dene alternate row and column colors for a
table
You can dene row colors in a table in a Web Intelligence document in Design mode.
Procedure
1. In a Web Intelligence document in Design mode, right-click the table and select Format Table from the
contextual menu.
2. In the Appearance tab, in the Alternate Color section, set the frequency with which you want the alternate
color to appear for the alternate row color in the combo box next to Frequency.
3. Click the arrow next to Color and select the color using the color palette.
4. Click OK to return to the document.
328
P U B L I C
SAP BusinessObjects Web Intelligence User's Guide
Reporting data

Related Information
To format the appearance of reports and their headers, footers, sections, tables, and table cells [page 255]
To select a background color for the table or cells [page 327]
To format table or cell borders [page 329]
To format text in table cells [page 330]
To set cell height and width [page 332]
To copy formatting using the Format Painter tool [page 334]
To set the position of a table or chart on the report page [page 335]
To layer tables and cells [page 336]
To merge table cells [page 338]
Formatting the report layout [page 253]
Formatting your reports using Cascading Style Sheets [page 298]
Creating a corporate palette for charts [page 424]
4.2.21.15.3 To format table or cell borders
You can format the border of a table or cell in a table in a Web Intelligence document in Design mode.
Procedure
1. In a Web Intelligence document in Design mode, right-click the table or cell and select Format Table or
Format Cell from the contextual menu.
2. In the Border tab, use the controls in the tab to congure the border styles and colors.
Each time you change a style setting, you need to click the square or one of the line buttons so that it is
applied to the Preview section, or it will not be applied to the cell or table.
When borders are dened between two adjacent cells, priority is given to lines in the order Double
Dashed Dotted Plain none . In case of equivalent priorities between the two cells, the right border of
the left cell or the bottom border of the top cell will be shown.
3. Click OK to return to the document.
Related Information
To format the appearance of reports and their headers, footers, sections, tables, and table cells [page 255]
To select a background color for the table or cells [page 327]
To dene alternate row and column colors for a table [page 328]
To format text in table cells [page 330]
SAP BusinessObjects Web Intelligence User's Guide
Reporting data
P U B L I C 329
To set cell height and width [page 332]
To copy formatting using the Format Painter tool [page 334]
To set the position of a table or chart on the report page [page 335]
To layer tables and cells [page 336]
To merge table cells [page 338]
Formatting the report layout [page 253]
Formatting your reports using Cascading Style Sheets [page 298]
Creating a corporate palette for charts [page 424]
4.2.21.15.4 To format text in table cells
You can format text in tables in a Web Intelligence document in Design mode.
Procedure
1. In a Web Intelligence document in Design mode, select the cells whose text you want to format.
Note
If you select one cell in the column, depending on the type of table, the following cells are also selected:
Table type
Resulting cells are selected
Horizontal Row
Vertical Column
Cross Entire table body
Tip
You can select multiple cells in one of the following ways:
○ Select the rst cell, hold down the Control key, and then click additional cells.
○ To select a contiguous group of columns or rows, select the beginning row or column, hold down
the Shift key, and then click the end location of the group of rows or columns.
2. Right-click on the cell selection and click Format Cell.
3. In the Font tab, select the font, style, size and eects, as needed.
4. Click OK to return to the document.
Related Information
To format the appearance of reports and their headers, footers, sections, tables, and table cells [page 255]
330
P U B L I C
SAP BusinessObjects Web Intelligence User's Guide
Reporting data
To select a background color for the table or cells [page 327]
To dene alternate row and column colors for a table [page 328]
To format table or cell borders [page 329]
To set cell height and width [page 332]
To copy formatting using the Format Painter tool [page 334]
To set the position of a table or chart on the report page [page 335]
To layer tables and cells [page 336]
To merge table cells [page 338]
Formatting the report layout [page 253]
Formatting your reports using Cascading Style Sheets [page 298]
Creating a corporate palette for charts [page 424]
4.2.21.15.5 To activate text wrapping in a table cell
You can activate the text wrapping in a cell in a table.
Procedure
1. Open a Web Intelligence document in Design mode.
2. Select a cell in the table and do one of the following:
○ In the Format or Formatting tab and in the Alignment subtab, click the Wrap Text icon.
○ Right-click the cell and do one of the following:
○ Select Text, then Wrap Text.
○ Select Format Cell. In the Format Cell dialog box, select Alignment in the Side Pane and activate
Wrap Text. Click OK to close the dialog box.
Next Steps
To deactivate text wrapping in a cell, select it and do one of the following techniques oered above and unselect
Wrap Text.
SAP BusinessObjects Web Intelligence User's Guide
Reporting data
P U B L I C 331
4.2.21.15.6 To set cell height and width
You can dene the height and width of cells by using drag and drop or specifying the size of cells in the Format
Cell dialog box.
Context
Tip
If you want to hide the contents of a cell, right-click the cell and select Hide Hide dimension .
Procedure
1. Open a Web Intelligence document in Design mode.
2. To set a xed cell height and width, do one of the following:
○ Drag the cell borders until the cell is the height and width you want.
○ Select the cells you want to change, then right-click the cells and select Format Cell. In the General tab,
set the cell height and width.
3. To set the cell to automatically t to its text contents, do one of the following:
○ Select Autot width to content or Autot height to content or both, and set the minimum width and
height.
Autot retains the current cell size as the minimum size and enlarges the cell size if the string that the
cell contains is larger than the minimum size specied.
Some functions are incompatible with autotted cells. If you place any of these functions in an
autotted cell, the function returns the #RECURSIVE error message.
○ To set an autot cell width, double-click either sides of the cell.
○ To set an autot cell height, double-click the bottom border of the cell.
Restriction
○ Documents that contain tables with the cell size set to autot take longer to display than
documents where tables contain cells with a xed cell width and height.
○ Autot height to content and Autot width to content properties do not work as well when the Read
content as option is set to HTML.
Related Information
To format the appearance of reports and their headers, footers, sections, tables, and table cells [page 255]
To select a background color for the table or cells [page 327]
332
P U B L I C
SAP BusinessObjects Web Intelligence User's Guide
Reporting data

To dene alternate row and column colors for a table [page 328]
To format table or cell borders [page 329]
To format text in table cells [page 330]
To copy formatting using the Format Painter tool [page 334]
To set the position of a table or chart on the report page [page 335]
To layer tables and cells [page 336]
To merge table cells [page 338]
Formatting the report layout [page 253]
Formatting your reports using Cascading Style Sheets [page 298]
Creating a corporate palette for charts [page 424]
4.2.21.15.6.1 Eects of autot and text wrapping in table
cells
This topic lists the eects of the autot and wrap text features when used separately and in combination.
Feature Eect
Wrap text Text is wrapped at the end of the cell.
Autot width to content Cell width is adjusted to display all the text.
Autot height to content Cell height is adjusted to display all the text.
Autot width to content + Autot height to content Cell width and height is adjusted to display all the text
Wrap text + Autot width to content Cell width is adjusted to accomodate the longest word.
Because the cell height is not adjusted to the number of
lines of text, text might be truncated vertically.
Wrap text + Autot height to content Cell height is adjusted to accommodate the number of lines
of text created by the wrap text. Because the cell width is
not adjusted to the longest word, text might be truncated
horizontally.
Wrap text + Autot height to content + Autot width to
content
Cell height and width is adjusted to the text and there is no
horizontal or vertical truncation.
Related Information
To activate text wrapping in a table cell [page 331]
To set cell height and width [page 332]
SAP BusinessObjects Web Intelligence User's Guide
Reporting data
P U B L I C 333

4.2.21.15.7 To copy formatting using the Format Painter tool
You use the Format Painter tool to quickly apply the formatting from a report, table or cell to other reports,
tables or cells.
Context
The formatting options applied depend on the objects you choose as the source and target. In general, only
properties that aect the visual formatting, for example font style, background color, are applied. Properties
that aect the display of data, for example table properties such as Avoid duplicate row aggregation, are not
applied.
Procedure
1. In a Web Intelligence document in Design mode, select the report, table or cell whose formatting you want
to apply.
2. In the Tools subtab under the Formatting tab, click the Format Painter icon to apply the formatting once, or
double-click to apply the formatting multiple times.
3. Click the report, table or cell to which you want to apply the formatting.
If you single-clicked the Format Painter icon, it is deactivated.
If you double-clicked the Format Painter, it remains activated. To deactivate it, click the Format Painter icon
again or press Esc to cancel the formatting operation.
Related Information
To format the appearance of reports and their headers, footers, sections, tables, and table cells [page 255]
To select a background color for the table or cells [page 327]
To dene alternate row and column colors for a table [page 328]
To format table or cell borders [page 329]
To format text in table cells [page 330]
To set cell height and width [page 332]
To set the position of a table or chart on the report page [page 335]
To layer tables and cells [page 336]
To merge table cells [page 338]
Formatting the report layout [page 253]
Formatting your reports using Cascading Style Sheets [page 298]
Creating a corporate palette for charts [page 424]
334
P U B L I C
SAP BusinessObjects Web Intelligence User's Guide
Reporting data

4.2.21.15.8 To set the position of a table or chart on the
report page
You can set the position of a table or chart in a report.
Procedure
1. In a Web Intelligence document in Design mode, right-click the border of the table or chart, and select
Format Table or Format Chart.
2. In the Global Layout section of the table or chart format panel, use the controls in the Relative
Position section to set the position of the table or chart in relation to other report elements.
Tip
You can also reach the Layout tab in the table or chart format panel by one of the following ways:
○ In the Report Elements tab, in the Position subtab, click Align, then an alignment option.
○ Right-click the table or chart and select Align, then an alignment option.
3. Click OK.
Related Information
To format the appearance of reports and their headers, footers, sections, tables, and table cells [page 255]
To select a background color for the table or cells [page 327]
To dene alternate row and column colors for a table [page 328]
To format table or cell borders [page 329]
To format text in table cells [page 330]
To set cell height and width [page 332]
To copy formatting using the Format Painter tool [page 334]
To layer tables and cells [page 336]
To merge table cells [page 338]
Formatting the report layout [page 253]
Formatting your reports using Cascading Style Sheets [page 298]
Creating a corporate palette for charts [page 424]
SAP BusinessObjects Web Intelligence User's Guide
Reporting data
P U B L I C 335

4.2.21.15.9 To layer tables and cells
Layering determines how tables and cells appear when they occupy the same space in a report. An object
further forward in the layering order appears over an object further backward in the layering order.
Procedure
1. In a Web Intelligence document in Design mode, select the table or cell whose layer you want to set.
2. Right-click the selection, click Order and select the layering option.
Option
Description
Bring to Front Make the table or cell the rst object in the layering order.
Send to Back Make the table or cell the last object in the layering order.
Bring Forward Bring the table or cell one layer forward in the layering order.
Send Backward Send the table or cell one layer backward in the layering order.
Related Information
To format the appearance of reports and their headers, footers, sections, tables, and table cells [page 255]
To select a background color for the table or cells [page 327]
To dene alternate row and column colors for a table [page 328]
To format table or cell borders [page 329]
To format text in table cells [page 330]
To set cell height and width [page 332]
To copy formatting using the Format Painter tool [page 334]
To set the position of a table or chart on the report page [page 335]
To merge table cells [page 338]
Formatting the report layout [page 253]
Formatting your reports using Cascading Style Sheets [page 298]
Creating a corporate palette for charts [page 424]
336
P U B L I C
SAP BusinessObjects Web Intelligence User's Guide
Reporting data

4.2.21.15.10 To exclude zero values in charts and tables
In charts and tables, you can exclude zero values from the displayed data.
Context
If a chart or table has zero values, you can choose to remove them from the visible output. You can also have
hidden items that have zero values.
If you deactivate either of the zero value options:
● In a chart, there are no items.
● In a table, if the values in a column or row for an item equal zero, the column or row does not appear.
Procedure
1. In a Web Intelligence document in Design mode, right-click the chart or table frame and select Format
Chart or Format Table.
2. Do one of the following:
○ For a chart, in the Global chart area, select the General tab.
○ For a table, select the General tab.
3. Select the following Display options as required:
Option
Description
Show rows for which all measure values =
0
In vertical and cross tables, to suppress rows where all measure values
are equal to zero.
Show rows for which the sum of measure
values = 0
In vertical and cross tables, to suppress rows where the sum of the meas
ure values is equal to zero.
Show columns for which all measure val
ues = 0
In horizontal and cross tables, to suppress columns where all measure
values are equal to zero.
Show columns for the sum of measure
values = 0
In horizontal and cross tables, to suppress columns where the sum of the
measure values is equal to zero.
Show measure values where values = 0 In charts, to suppress a chart item if its measure values are equal to zero.
Show measure values for which the sum
of values = 0
In charts, to suppress a chart item where the sum of its measure values is
equal to zero.
Note
In charts and tables, empty values are considered the same as zero values, and therefore are also
aected by these Display options.
4. Click OK to close the dialog box.
SAP BusinessObjects Web Intelligence User's Guide
Reporting data
P U B L I C 337
4.2.21.15.11 To merge table cells
You can merge table cells in a Web Intelligence document in Design mode.
Procedure
1. In a Web Intelligence document in Design mode, to select the cells you want to merge, hold down the
Control key and click the cells.
2. Keep the Control key pressed, right-click the selected cells, and select Merge.
Caution
When you merge cells, the resulting merged cell contains the data only from the rst cell you selected
only. Data from all the other cells is lost.
Related Information
To format the appearance of reports and their headers, footers, sections, tables, and table cells [page 255]
To select a background color for the table or cells [page 327]
To dene alternate row and column colors for a table [page 328]
To format table or cell borders [page 329]
To format text in table cells [page 330]
To set cell height and width [page 332]
To copy formatting using the Format Painter tool [page 334]
To set the position of a table or chart on the report page [page 335]
To layer tables and cells [page 336]
Formatting the report layout [page 253]
Formatting your reports using Cascading Style Sheets [page 298]
Creating a corporate palette for charts [page 424]
4.2.21.16 Controlling the presence of tables, measures, and
dimensions in tables
You can display or hide tables or table objects in a Web Intelligence document.
Sometimes tables or specic rows and columns display no values. For example, if a sales of a specic product
are discontinued, table rows or columns that normally show results for that product appear empty. By default,
these empty rows, columns, or tables are displayed.
You can also display and hide tables based on the result of a formula.
338
P U B L I C
SAP BusinessObjects Web Intelligence User's Guide
Reporting data
4.2.21.16.1 To show or hide tables
You can display or hide tables in a Web Intelligence document in Design mode.
Procedure
1. Open a Web Intelligence document in Design mode.
2. Hover the mouse over the table border until the cursor becomes a + sign, click the table and do one of the
following:
○ In the Document Structure and Filters pane in the Side Panel, right-click the table and select one of the
following options:
Option When selected
Hide The table or dimension column is always hidden.
Hide when Empty The table is hidden when there is no data.
Hide When... The table is hidden when the formula you create is true.
Show Hidden Dimensions The hidden dimension columns in the table appear in
the table.
Show The hidden table appears in the report.
○ While the table is selected, click the right mouse button and select one of the following from the
contextual menu:
1. Select Hide, and then one of the following options.
Note
If you only want to hide a column containing a dimension in a vertical or cross table, or a row in
a horizontal or cross table, right-click only the dimension in the table.
Option When selected
Hide The table is always hidden.
Hide when Empty The table is hidden when there is no data.
Hide When... The table is hidden when the formula you create is
true. To hide the table when the formula is true,
select and type a formula in the box.
2. Select Format Table, and in the General tab congure the following options:
Option
When selected When deselected
Hide always The table is always hidden. The table is never hidden.
Hide when empty The table is hidden when there is
no data.
The table is always visible, even if
it contains no data.
SAP BusinessObjects Web Intelligence User's Guide
Reporting data
P U B L I C 339
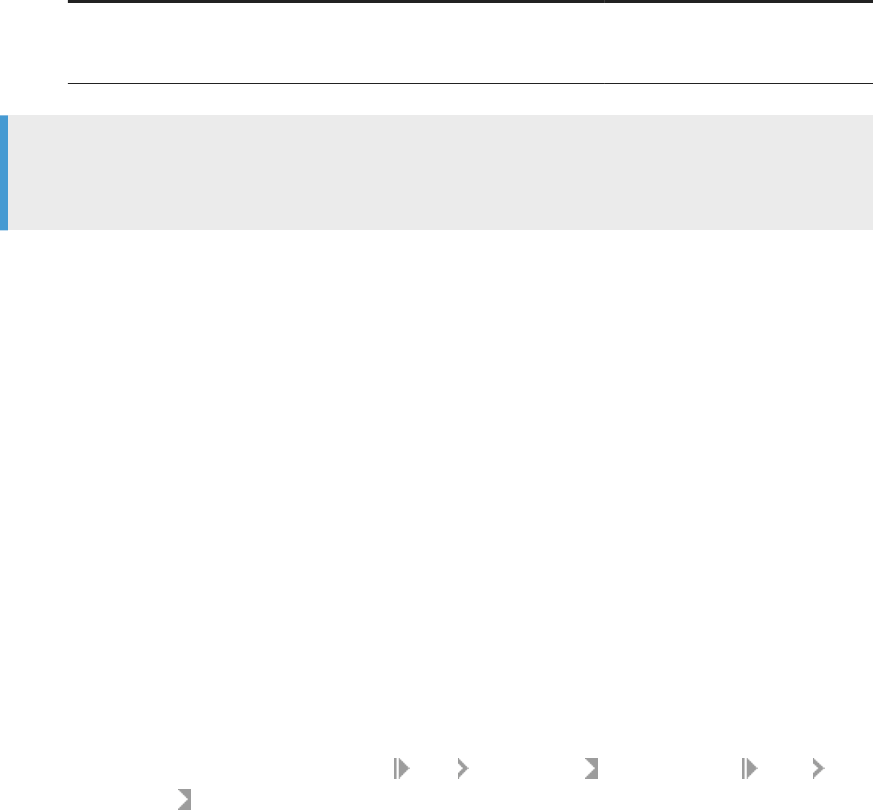
Option When selected When deselected
Hide when following formula is true The table is hidden when the
formula you create is true.
The table is never hidden based on
any formula in the Formula text
box.
Note
For information on creating formulas, refer to the Web Intelligence online help or the Using functions,
formulas and calculations in Web Intelligence guide.
3. Click OK to return to the document.
When a table or element is hidden, its name is italicized in grey in the Document Structure and Filters pane
in the Side Panel.
4.2.21.16.2 To show or hide dimensions and measures in
tables
Depending on the type of table you are using, you can hide or show dimensions and measures in columns or
rows.
Procedure
1. In Design mode, select the table column containing the dimension or measure you want to show or hide.
2. Right-click a dimension or a measure and select Hide Hide Column or Hide Row, and Show
Show Hidden Objects to display hidden dimensions or measures.
4.2.21.16.3 To conditionally show or hide measures or
dimensions values in tables
Depending on the type of table you are using, you can conditionally hide or show measures or dimensions
values in columns or rows.
Procedure
1. Open a Web Intelligence document in Design mode.
2. Hover the mouse over the table border until the cursor becomes a + sign, click the right mouse button and
select Format Table from the contextual menu.
340
P U B L I C
SAP BusinessObjects Web Intelligence User's Guide
Reporting data

3. In the General tab, congure the following options:
○ For form, cross, and vertical tables:
Option When selected When deselected
Show rows with all empty measure
values
Rows are displayed in the table, even
if they do not contain values.
Rows are hidden if they do not con
tain values.
Show rows with empty dimension
values
Rows are displayed in the table, even
if they do not contain values.
Rows are hidden if they do not con
tain any values.
Shows rows for which all measure
values = 0
Even if the measure value is 0 in all
cells of the row, the row still appears
in the table.
If the measure value is 0 in all cells,
the row does not appear in the table.
Shows rows for which the sum of
measure values = 0
Even if the sum of measure value is
0 in the row, the row still appears in
the table.
If the sum of the measure value is 0
in all cells, the row does not appear
in the table.
Restriction
You cannot conditionally hide or show column values in vertical tables and forms.
○ For horizontal and cross tables:
Option
When selected When deselected
Show columns with empty measure
values
Columns are displayed in the table,
even if they do not contain values.
Columns are hidden if they do not
contain values.
Show columns with empty
dimension values
Columns are displayed in the table,
even if they do not contain values.
Columns are hidden if they do not
contain any values.
Shows columns for which all
measure values = 0
Even if the measure value is 0 in all
cells of the column, the column still
appears in the table.
If the measure value is 0 in all cells
of the column, the column does not
appear in the table.
Shows columns for which the sum of
measure values = 0
Even if the sum of measure value is
0 in the column, the column still ap
pears in the table.
If the sum of the measure value is 0
for the column, the column does not
appear in the table.
Restriction
You cannot conditionally hide or show row values in horizontal tables.
4. Click OK to return to the document.
SAP BusinessObjects Web Intelligence User's Guide
Reporting data
P U B L I C 341
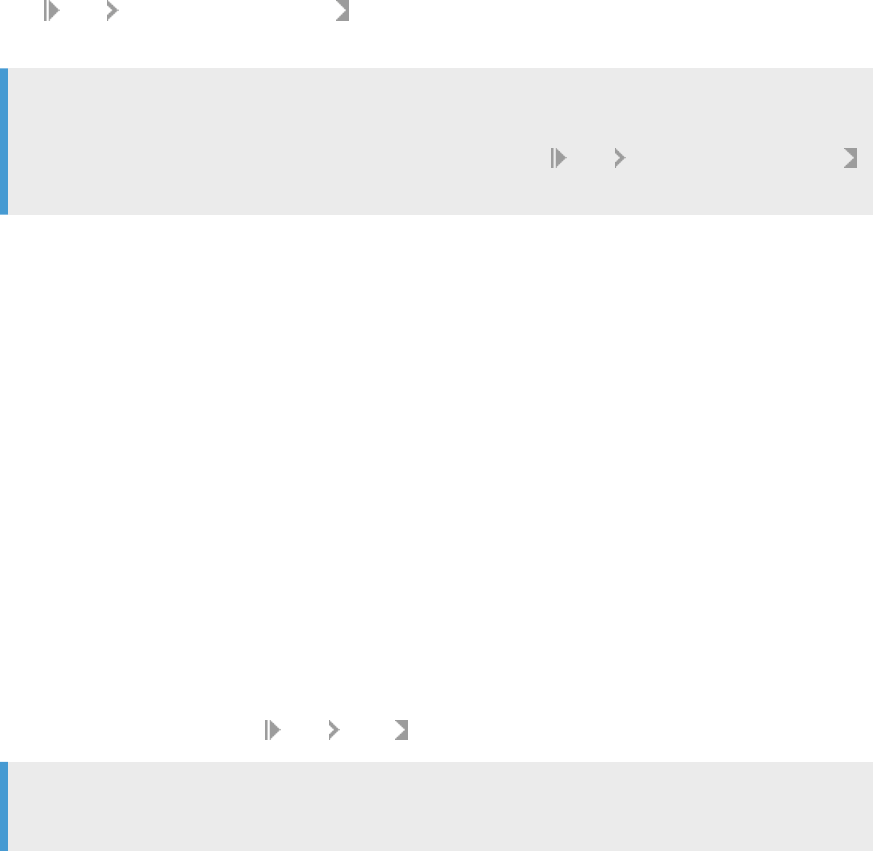
4.2.21.16.4 To redisplay hidden dimensions or measures
You can redisplay dimensions or measures that have been hidden in a report.
Procedure
1. In Design mode, select a table containing hidden dimensions or measures.
2. In the Report Elements tab, select the Behaviors subtab.
3. Click Hide Show Hidden Dimensions or Show Hidden Measures to redisplay the dimensions or
measures.
Tip
If the hidden dimensions or measures were the only objects in the table, right-click the table in the
Document Structure and Filters pane of the Side Panel and select Hide Show Hidden Dimensions
or Show Hidden Measures.
4.2.21.16.5 To redisplay hidden tables, cells or sections
You can redisplay hidden objects in a Web Intelligence document in Design mode.
Procedure
1. In a Web Intelligence document in Design mode, select one of the following:
○ The hidden table, free-standing cell or section in the Document Structure and Filters tab in the Side
Panel.
○ The hidden report object in the table in which it is displayed.
2. Right-click the object and select Hide Show .
Tip
To show all hidden elements in a report, right-click in the report and select Show All Hidden Content.
342
P U B L I C
SAP BusinessObjects Web Intelligence User's Guide
Reporting data

4.2.21.16.6 To avoid duplicate row aggregation
When rows contain duplicate data, measure values are aggregated by default. You can choose not to aggregate
measure values in this situation.
Procedure
1. Open a Web Intelligence document in Design mode.
2. Hover the mouse over the table border until the cursor becomes a plus sign, click the right mouse button
and select Format Table from the contextual menu.
3. In the General tab, select Avoid duplicate row aggregation.
Note
This option does not work in tables containing hierarchical data.
4. Click OK to return to the document.
4.2.21.17 To show or hide table headers and footers
You can show and hide table headers in a Web Intelligence document in Design mode.
Procedure
1. Open a Web Intelligence document in Design mode.
2. Hover the mouse over the table border until the cursor becomes a plus sign, click the right mouse button
and select Format Table from the contextual menu.
3. In the Format Table dialog box, select the General tab.
4. For the table header, do one of the following:
○ To display the headers:
○ If you are using Web Intelligence HTML Interface, select Table headers or, in the case of a cross
table, Top header or Left header or both.
○ If you are using Web Intelligence Applet interface or Web Intelligence Rich Client, select Show table
headers or, in the case of a cross table, Show top header or Show left header or both.
○ To hide the headers, unselect the header options.
5. For the table footer, do one of the following:
○ To display the footers:
○ If you are using Web Intelligence HTML Interface, select Table footers or, in the case of a cross
table, Bottom footer or Right footer.
○ If you are using Web Intelligence Applet interface or Web Intelligence Rich Client, select Show table
footers or, in the case of a cross table, Show bottom footer or Show right footer.
SAP BusinessObjects Web Intelligence User's Guide
Reporting data
P U B L I C 343
○ To hide the footers, unselect the footer options.
6. Click OK to return to the document.
4.2.21.18 To start tables on a new report page
You can set a table to start on a new Web Intelligence report page in Design mode.
Procedure
1. Open a Web Intelligence document in Design mode.
2. Hover the mouse over the table border until the cursor becomes a plus sign, click the right mouse button
and select Format Table from the contextual menu.
3. In the Layout tab, select Start on a new page in the Vertical or Horizontal panes.
The Horizontal and Vertical panes refer to the table axes.
4. Click OK to return to the document.
4.2.21.19 To display object names in headers on cross tables
You can display object names in headers in cross tables in a Web Intelligence document in Design mode.
Procedure
1. Open a Web Intelligence document in Design mode.
2. Hover the mouse over the table border until the cursor becomes a plus sign, click the right mouse button
and select Format Table from the contextual menu.
3. In the General tab, click Show object names to display the object names in additional headers on the cross
table.
4. Click OK to return to the document.
344
P U B L I C
SAP BusinessObjects Web Intelligence User's Guide
Reporting data
4.2.21.20 To avoid page breaks in tables
You can stop page breaks from occurring in tables in a Web Intelligence report in Design mode.
Procedure
1. Open a Web Intelligence document in Design mode.
2. Hover the mouse over the table border until the cursor becomes a plus sign, click the right mouse button
and select Format Table from the contextual menu.
3. In the Layout tab, select Avoid page breaks in table in the Vertical or Horizontal panes.
The Horizontal and Vertical panes refer to the table axes.
4. Click OK to return to the document.
4.2.21.21 To repeat table headers or footers on report pages
You can set table headers and footers to be repeated in Web Intelligence report pages in Design mode.
Procedure
1. Open a Web Intelligence document in Design mode.
2. Hover the mouse over the table border until the cursor becomes a plus sign, click the right mouse button
and select Format Table from the contextual menu.
3. In the Layout tab, select Repeat header on every page or Repeat footer on every page in the Vertical or
Horizontal panes.
The Horizontal and Vertical panes refer to the table axes.
4. Click OK in the document.
4.2.21.22 Transforming a dimension in a table using
dimension value groups
In a table column in a Web Intelligence report, you can collect the values of a dimension into an aggregated
group to which you can assign a unique name. For example, if your company has branch oces in the US cities
of New York, Washington, and Boston, you can place them in a group called Eastern branch offices.
In a table, when you group the values of a dimension, they are no longer visible in the table as single entities;
they and their data are aggregated into the group until you choose to remove any of the values of a dimension
from the group.
SAP BusinessObjects Web Intelligence User's Guide
Reporting data
P U B L I C 345

The Group option is available in the Design mode in the following locations:
● From the Analysis Display tabs
● From the right-click contextual menu
A variable object for this aggregated group is created in the Available Objects tab on the Side Panel and allows
you to manage the group conguration.
Ungrouped values
Any ungrouped values of a dimension remain separate in the table column unless you activate the
Automatically grouped option. If you select Automatically grouped for ungrouped values, then the values of a
dimension are removed from the table and aggregated into the selected group’s data.
Tips about grouping values of a dimension in a table
● You can reuse the aggregated group variable in other tables.
Note
If the original dimension can be used in the same or other tables and is not aected by the group
variable.
● A dimension value can only belong to one group.
● A dimension value group is a text data type, even if the original values of a dimension are dates or numbers.
● We recommend that you do not have more than 1,000 values of a dimension in a group. To use more than
this amount could cause performance issues.
4.2.21.22.1 To group values of a dimension in a table using
the Group dropdown list
The Group option allows you to assign two or more selected values of a dimension in a table column to an
aggregated group and assign that group a unique name.
Procedure
1. Open a Web Intelligence document in Design mode.
2. Select two or more values of a dimension in a table column and do one of the following:
○ In the Analysis tab, in the Display subtab, select Group from the Group dropdown list.
○ Right-click the selection and from the Group contextual menu, select Group.
346
P U B L I C
SAP BusinessObjects Web Intelligence User's Guide
Reporting data
3. In the New Group dialog box, change the proposed group name if necessary, and click OK.
Results
The values are grouped in the dimension column in the table, and the column header name changes to
"[dimension name]+". For example, if you group values for dimension "City", the column header changes to
show "City+". A group variable is created in the Variables folder in the Available Objects tab on the Side Panel.
You can change the group variable name in the
Manage Groups dialog box or using the right-click contextual
menu for the group variable in the Variables folder.
Related Information
To edit Group variables in the Available Objects tab in the Side Panel [page 355]
To group values of a dimension in a table using the Manage Groups dialog box [page 348]
To add values of a dimension to an existing group using the Manage Groups dialog box [page 351]
To ungroup values of a dimension from an existing group using the Manage Groups dialog box [page 349]
To rename a dimension value group using the Manage Groups dialog box [page 354]
To rename a dimension value group using the Group dropdown list [page 353]
4.2.21.22.2 To ungroup values of a dimension from an
existing group using the Group dropdown list
The Ungroup option in the Group dropdown list allows you to ungroup the values of a dimension in a table
column.
Procedure
1. Open a Web Intelligence document in Design mode.
2. Select at least one dimension value group of a group variable in a table column and do one of the following:
○ In the Analysis tab, in the Display subtab, from the Group dropdown list, select Ungroup.
○ Right-click the table and from the Group contextual menu, select Ungroup.
Results
The values of the dimension reappear in the table column.
SAP BusinessObjects Web Intelligence User's Guide
Reporting data
P U B L I C 347

Caution
If you have selected Automatically grouped for ungrouped values, then the values of the dimension do not
appear singly in the table column because they are aggregated into the "ungrouped" group data.
Related Information
To edit Group variables in the Available Objects tab in the Side Panel [page 355]
To add values of a dimension to an existing group using the Manage Groups dialog box [page 351]
To ungroup values of a dimension from an existing group using the Manage Groups dialog box [page 349]
To add values of a dimension to an existing group using the Group dropdown list [page 350]
4.2.21.22.3 To group values of a dimension in a table using
the Manage Groups dialog box
The Manage Group dialog box allows you to assign two or more values of a dimension in a table column to an
aggregated group and assign that aggregated group a unique name.
Procedure
1. Open a Web Intelligence document in Design mode.
2. Click a dimension column in the table and do one of the following:
○ In the Analysis tab, in the Display subtab, select Manage Groups from the Group dropdown list.
○ Right-click the dimension column in the table and from the Group contextual menu, select Manage
Groups.
○ Right-click the group variable in the Available Objects tab on the Side Panel and select Manage Groups.
3. In the Manage Groups dialog box, select the checkboxes for the dimension value categories that you want
to group.
4. Click Group.
5. In the New Group dialog box, type a name for the group and click OK.
The groups of values appear in the Groups column.
6. To have any ungrouped values of a dimension automatically grouped:
a. From the Ungrouped Values dropdown list, select Automatically Grouped.
b. In the Automatically grouped values dialog box, enter a name for the group in the Name text box if you
prefer a name dierent from Others.
c. Click OK.
7. Click OK to close the Manage Groups dialog box.
348
P U B L I C
SAP BusinessObjects Web Intelligence User's Guide
Reporting data
Results
The values are grouped in the dimension column in the table, and the column header name changes to
"[dimension name]+". For example, if you group values for dimension "City", the column header changes to
show "City+". A group variable is created in the Variables folder in the Available Objects tab on the Side Panel.
You can change the group variable name in the Manage Groups dialog box or using the right-click contextual
menu for the group variable in the Variables folder.
Related Information
To edit Group variables in the Available Objects tab in the Side Panel [page 355]
To group values of a dimension in a table using the Group dropdown list [page 346]
To ungroup values of a dimension from an existing group using the Manage Groups dialog box [page 349]
4.2.21.22.4 To ungroup values of a dimension from an
existing group using the Manage Groups dialog
box
The “Manage Group” dialog box allows you to remove values of a dimension from an aggregated group.
Procedure
1. Open a Web Intelligence document in Design mode.
2. Click a dimension column in the table and do one of the following:
○ In the Analysis tab, in the Display subtab, select Manage Groups from the Group dropdown list.
○ Right-click the dimension column in the table and from the Group contextual menu, select Manage
Groups.
3. In the Manage Groups dialog box, select the checkbox next to the values that you want to remove from a
group.
4. Click Ungroup.
The group name disappears in the “Groups” column next to the values that you selected.
5. Click OK to close the Manage Groups dialog box.
Results
The values you removed from a group reappear in the table.
SAP BusinessObjects Web Intelligence User's Guide
Reporting data
P U B L I C 349

Caution
If you have selected Automatically grouped for ungrouped values, then the values of the dimension do not
appear singly in the table column because they are aggregated into the "ungrouped" group data.
Related Information
To ungroup values of a dimension from an existing group using the Group dropdown list [page 347]
To group values of a dimension in a table using the Manage Groups dialog box [page 348]
To group values of a dimension in a table using the Group dropdown list [page 346]
4.2.21.22.5 To add values of a dimension to an existing group
using the Group dropdown list
The Move to Group option in the Group dropdown list allows you to add selected values of a dimension in a table
to an aggregated group.
Procedure
1. Open a Web Intelligence document in Design mode.
2. Select one or more dimension value in a table column and do one of the following:
○ In the Analysis tab, in the Display subtab, select Group from the Group dropdown list.
○ Right-click the selection and from the Group contextual menu, select Group.
Results
The selected values of the dimension disappear from the dimension column and are aggregated into the
selected group.
Related Information
To add values of a dimension to an existing group using the Manage Groups dialog box [page 351]
To add a group of dimension values to another group of dimension values using the Manage Groups dialog box
[page 352]
To ungroup values of a dimension from an existing group using the Group dropdown list [page 347]
350
P U B L I C
SAP BusinessObjects Web Intelligence User's Guide
Reporting data
To ungroup values of a dimension from an existing group using the Manage Groups dialog box [page 349]
4.2.21.22.6 To add values of a dimension to an existing group
using the Manage Groups dialog box
The Manage Group dialog box allows you to add values of a dimension to an existing aggregated group in a table
column.
Procedure
1. Open a Web Intelligence document in Design mode.
2. Click a dimension column in the table and do one of the following:
○ In the Analysis tab, in the Display subtab, select Manage Groups from the Group dropdown list.
○ Right-click the dimension column in the table and from the Group contextual menu, select Manage
Groups.
○ Right-click the group variable in the Available Objects tab on the Side Panel and select Manage Groups.
3. In the Manage Groups dialog box, select the checkbox next to the dimension value that you want to add to a
group.
4. Select a group from the Move to dropdown list.
The group name appears in the Groups column next to the variables that you have selected.
5. Click OK to close the Manage Groups dialog box.
Results
The selected values of the dimension disappear from the table column and are aggregated into the selected
group.
Related Information
To add values of a dimension to an existing group using the Group dropdown list [page 350]
To add a group of dimension values to another group of dimension values using the Manage Groups dialog box
[page 352]
SAP BusinessObjects Web Intelligence User's Guide
Reporting data
P U B L I C 351
4.2.21.22.7 To add a group of dimension values to another
group of dimension values using the Manage
Groups dialog box
The Manage Group dialog box allows you to add one or more groups to an existing aggregated value group in a
table column.
Procedure
1. Open a Web Intelligence document in Design mode.
2. Click a dimension column in the table and do one of the following:
○ In the Analysis tab, in the Display subtab, select Manage Groups from the Group dropdown list.
○ Right-click the dimension column in the table and from the Group contextual menu, select Manage
Groups.
○ Right-click the group variable in the Available Objects tab on the Side Panel and select Manage Groups.
3. In the Manage Groups dialog box, select the checkbox next to the grouped values of a dimension that you
want to add to another group.
4. Select a group from the Move to dropdown list.
The group name in the Groups column next to the values you selected is changed to reect the group
change.
5. Click OK to close the Manage Groups dialog box.
Related Information
To add values of a dimension to an existing group using the Group dropdown list [page 350]
To add values of a dimension to an existing group using the Manage Groups dialog box [page 351]
To ungroup values of a dimension from an existing group using the Manage Groups dialog box [page 349]
To ungroup values of a dimension from an existing group using the Group dropdown list [page 347]
352
P U B L I C
SAP BusinessObjects Web Intelligence User's Guide
Reporting data

4.2.21.22.8 To rename a dimension value group using the
Group dropdown list
The Rename Group option in the Group dropdown list allows you to rename a dimension value group.
Procedure
1. Open a Web Intelligence document in Design mode.
2. Select a dimension value group in a table column and do one of the following:
○ In the Analysis tab, in the Display subtab, from the Group dropdown list, select Rename Group.
○ Right-click the table and from the Group contextual menu, select Rename Group.
3. In the Rename Group dialog box, enter a new name and click OK.
Results
The selected dimension value group name is changed in the table column.
Tip
You can also rename the group by renaming its variable in the Available Objects tab on the Side Panel.
Related Information
To edit Group variables in the Available Objects tab in the Side Panel [page 355]
To rename a dimension group variable name using the Manage Groups dialog [page 356]
To rename a dimension value group using the Manage Groups dialog box [page 354]
SAP BusinessObjects Web Intelligence User's Guide
Reporting data
P U B L I C 353
4.2.21.22.9 To rename a dimension value group using the
Manage Groups dialog box
The Manage Group dialog box allows you to rename an existing aggregated group of dimension values.
Procedure
1. Open a Web Intelligence document in Design mode.
2. Click a dimension column in the table and do one of the following:
○ In the Analysis tab, in the Display subtab, select Manage Groups from the Group dropdown list.
○ Right-click the dimension column in the table and from the Group contextual menu, select Manage
Groups.
○ Right-click the group variable in the Available Objects tab on the Side Panel and select Manage Groups.
3. From the dropdown list at the bottom of the Manage Groups dialog box, select the value group that you
want to rename.
4. Click the Rename the selected group icon.
5. In the Rename Group dialog box, enter a new name and click OK.
6. Click OK to close the Manage Groups dialog box.
Results
The selected dimension value group name is changed in the table column.
Related Information
To rename a dimension value group using the Group dropdown list [page 353]
To rename a dimension group variable name using the Manage Groups dialog [page 356]
354
P U B L I C
SAP BusinessObjects Web Intelligence User's Guide
Reporting data

4.2.21.22.10 To edit Group variables in the Available Objects
tab in the Side Panel
You can edit dimension group variables in the Side Panel.
Procedure
1. Open a Web Intelligence document in Design mode.
2. In the Available Objects tab on the Side Panel, right-click a group variable object in the Variables folder.
3. Do one of the following:
○ To edit the values for a group, click Edit. In the Manage Group dialog box, edit the group as required.
○ To rename the group variable, click Rename. In the Rename Variable dialog box, enter a new name and
click OK.
Note
You can also rename the group variable in the Manage Group dialog box.
○ To copy the variable, click Copy.
○ To delete the variable, click Remove. The group variable is deleted from the Variables folder and the
group column is deleted from any tables in which the variable is used.
Related Information
To group values of a dimension in a table using the Manage Groups dialog box [page 348]
To add values of a dimension to an existing group using the Manage Groups dialog box [page 351]
To rename a dimension group variable name using the Manage Groups dialog [page 356]
To rename a dimension value group using the Manage Groups dialog box [page 354]
To add a group of dimension values to another group of dimension values using the Manage Groups dialog box
[page 352]
SAP BusinessObjects Web Intelligence User's Guide
Reporting data
P U B L I C 355

4.2.21.22.11 To rename a dimension group variable name
using the Manage Groups dialog
The Manage Group dialog box allows you to rename the group variable name. This name appears in the column
header of the table and in the Variables folder in the Available Objects tab on the Side Panel.
Procedure
1. Open a Web Intelligence document in Design mode.
2. Click a dimension column in the table and do one of the following:
○ In the Analysis tab, in the Display subtab, select Manage Groups from the Group dropdown list.
○ Right-click the dimension column in the table and from the Group contextual menu, select Manage
Groups.
○ Right-click the group variable in the Available Objects tab on the Side Panel and select Manage Groups.
3. From the dropdown list at the bottom of the Manage Groups dialog box, select the group that you want to
rename.
4. Click the Rename the selected group icon.
5. In the Rename Group dialog box, enter a new name and click OK.
6. Click OK to close the Manage Groups dialog box.
Results
The selected dimension group name is changed for the table column and in any other table in which it is used.
Tip
You can also change the dimension group variable name directly in the Available Objects tab on the Side
Panel.
Related Information
To edit Group variables in the Available Objects tab in the Side Panel [page 355]
To rename a dimension value group using the Group dropdown list [page 353]
To rename a dimension value group using the Manage Groups dialog box [page 354]
356
P U B L I C
SAP BusinessObjects Web Intelligence User's Guide
Reporting data
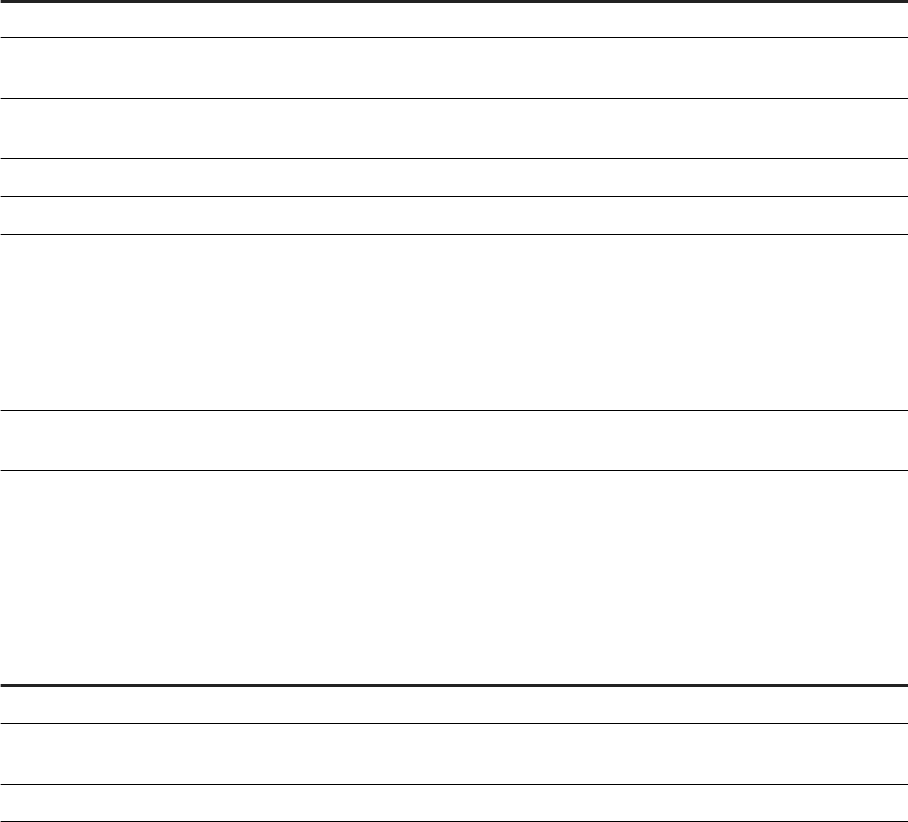
4.2.22 Displaying data in free-standing cells
Free-standing cells are single cells that stand alone in a report.
You can place any text or formula in a blank free-standing cell, or you can use pre-dened free standing cells
that display specic information.
For more information on the functions used in free-standing cells, see the Using Functions, Formulas and
Calculations in Web Intelligence guide, or see the Web Intelligence online help.
Formula and text cell functions in free-standing cells
Function
Description
Blank Cell Empty cell in which you can enter any text or formula.
Drill Filters
Uses the DrillFilters function to display details of the drill lters applied to the re
port.
Last Refresh Date
Uses the LastExecutionDate function to display the last date when the document
was refreshed.
Document Name
Uses the DocumentName function to display the document name.
Query Summary
Uses the QuerySummary function to display details of the queries in the document.
Prompt
From the Prompt dropdown list, you can select one of the following cell options:
● PromptSummary: This cell uses the PromptSummary function to display the com
plete details of the user prompt selections in the document.
● <name of query prompt>: The name of each query prompt is listed in the Prompt list.
A pre-dened cell based on a query prompt displays the user prompt selections at the
last refresh or
Run Query action.
Report Filter Summary
Uses the ReportFilterSummary function to display the report lters applied to the
report.
Page number cell functions in free-standing cells
Function
Description
Page Number
Uses the Page function to display the number of pages in the report.
Page Number/Total Pages
Uses the Page and NumberOfPages functions to display the current page number and
the total number of pages in the report.
Total Number of Pages
Uses the NumberOfPages function to display the total number of pages in the report.
SAP BusinessObjects Web Intelligence User's Guide
Reporting data
P U B L I C 357

4.2.22.1 To insert a free-standing cell in a report
You can insert a free-standing cell in a table.
Procedure
1. In a Web Intelligence document in Design mode, select the Report Element tab.
2. In the Cell subtab, do one of the following:
○ Click Blank to insert a blank cell.
○ From the Pre-Dened dropdown list, select a pre-dened cell to insert.
3. Place your mouse over the part of the report where you want to insert the cell and click the left mouse
button.
4. If you have inserted a blank cell, type the text or formula of the cell in the Formula Bar.
Note
To activate the Formula Bar, click the Formula Bar icon in the Analysis tab.
5. To delete the cell, select it and press the Delete key on your keyboard.
4.2.22.2 To hide free-standing cells
You can hide free-standing cells unconditionally, when they are empty, or based on the result of a formula.
Procedure
1. In a Web Intelligence document in Design mode, right-click the free-standing cell and select Format Cell in
the contextual menu.
2. In the Format Cell dialog box, in the General tab, select any of the following:
○ To hide the cell unconditionally, select Hide always.
○ To hide the cell when it is empty, select Hide when empty.
○ To hide the cell based on the result of a formula, click Hide when the following formula is true and type
the formula in the box.
3. Click OK to return to the document.
Related Information
To redisplay hidden tables, cells or sections [page 342]
358
P U B L I C
SAP BusinessObjects Web Intelligence User's Guide
Reporting data

4.2.22.3 To copy a free-standing cell
You can copy and paste free-standing cells within a report or into external applications such as Microsoft Word
and Excel.
Procedure
1. Open a Web Intelligence document in Design mode.
2. Right-click the free-standing cell and select Copy in the contextual menu.
3. To paste the free-standing cell to another part of the report, right-click where you want the free-standing
cell to appear and click Paste on the menu.
4. To paste the free-standing cell into another application, paste the contents of the clipboard from within the
application.
You can also copy a free-standing cell into another application by dragging and dropping the free-standing
cell directly into the open document in the target application. When you drag and drop a free-standing cell
into a Microsoft Oce application, the text in the cell is pasted into the application.
4.2.23 Formatting numbers and dates
You can change how values appear in specic cells or on chart axes using predened formats available in the
application, or by creating your own custom formats.
You can save your custom formats for reuse in more than one block and report in the same document.
4.2.23.1 Predened formats
This topic describes the predened formats available in Web Intelligence for table cells.
Format
Description
Default The format dened for the object on the universe.
Number Formats for decimal or integer values.
Currency Formats for currency values.
Date/Time Date and time formats.
Boolean Formats for true and false values.
SAP BusinessObjects Web Intelligence User's Guide
Reporting data
P U B L I C 359
Related Information
To apply a custom number format to a cell [page 365]
To dene a custom format [page 364]
Setting Decimal type for big numbers to improve calculation and rounding accuracy [page 360]
4.2.23.1.1 To apply a predened format to a cell
You can apply a predened number format to data in a cell in a table.
Procedure
1. In a Web Intelligence document in Design mode, select a cell.
2. To select a predened format:
○ In the Web Intelligence HTML interface, in the Formatting tab, select the Numbers subtab, and select a
format from the Number Format dropdown list.
○ In the Web Intelligence Rich Client, in the Format tab, in the Numbers subtab, and select a format from
the DEFAULT dropdown list.
3. Save the document.
4.2.23.1.2 Setting Decimal type for big numbers to improve
calculation and rounding accuracy
The new Decimal number type implements the IEEE 754-2008 Decimal data format for big numbers which
improves Web Intelligence calculation precision. The Decimal function ToDecimal(value) is supported
where value can be a number or a string, and transforms its input into a Decimal type.
The Decimal number type oers the following advantages:
● Web Intelligence can now compute decimal numbers for any operation where a Number type is expected,
for example, mathematical operators, conditional operators, or logical operators.
● Decimal values have a default precision of up to 40 digits with a maximum exponent value of 400 which
correctly converts Double into Decimal.
● The new Decimal function ToDecimal(value) is supported in any function where a number is expected.
For example, in the Character functions, you can use a Decimal value for num_repeats in the function
Fill(repeated_string ; num_repeats)where (value) can be a number or a string that transforms
its input into a Decimal. The string input type is particularly useful to extract large precision values from a
data source without any loss in precision. For a numeric function, if the argument for a function is Decimal,
then the function returns Decimal type to the extended precision. For example, =Sin(1.0/3.0) returns .
3271946967961520 but =Sin(ToDecimal("1")/ToDecimal("3")) returns
0.3271946967961522441733440852676206061.
360
P U B L I C
SAP BusinessObjects Web Intelligence User's Guide
Reporting data
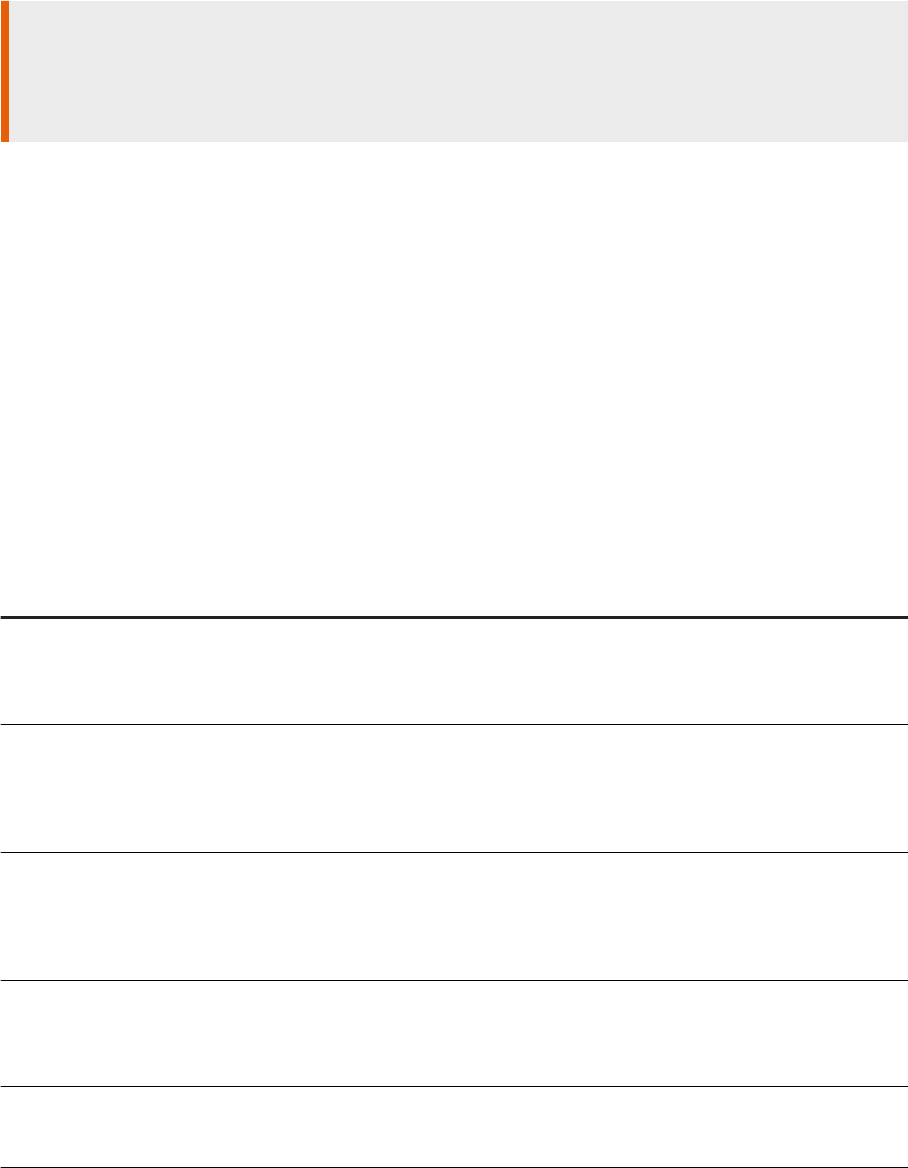
In a Web Intelligence report, you apply Decimal for a measure as follows:
● Right click a measure in the Available Objects side panel.
● Select Decimal from the Change Type menu. You can also select Number for a measure that is already
dened as Decimal.
Caution
Changing certain measures to Decimal in your report may impact the performance of Web Intelligence.
This applies particularly to documents with many measures returning high numbers of rows in the data
provider.
Related Information
Predened formats [page 359]
4.2.23.2 Custom formats
In tables, you can use the Custom format type to dene a customized format for any cell.
In Web Intelligence functions, the day/date, calendar and time of day character denitions below apply. The
following table lists the strings you can use to create custom formats:
Character(s)
Display(s) Example
#
The corresponding digit. If the number
has less digits than the number of
#
characters used to specify the format,
no leading zeros are inserted.
‘12345’ with the format #,##0 gives ‘12,345’
(if your locale denes the grouping separator
as a comma) or ‘12 345’ (if your locale de
nes the grouping separator as a space)
0
The corresponding digit. If the number
has less digits than the number of
0
characters used to specify the format,
a leading zero(s) is inserted before the
number.
‘123’ with the format #0,000 gives ‘0,123’
,
The grouping separator as dened by
your locale.
‘1234567’ with the format #,##0 gives
‘1,234,567’ (if you locale denes the grouping
separator as a comma) or ‘1 234 567’ (if your
locale denes the grouping separator as a
non-breaking space)
.
The decimal separator as dened by
your locale.
‘12.34’ with the format #.#0 gives ‘12.34’ (if
your locale denes the decimal separator as a
period) or ‘12,34’ (if your locale denes the
decimal separator as a comma)
[%]%
Displays a percentage sign (%) after
the result and multiplies the result by
100.
0.50 becomes 50%.
SAP BusinessObjects Web Intelligence User's Guide
Reporting data
P U B L I C 361
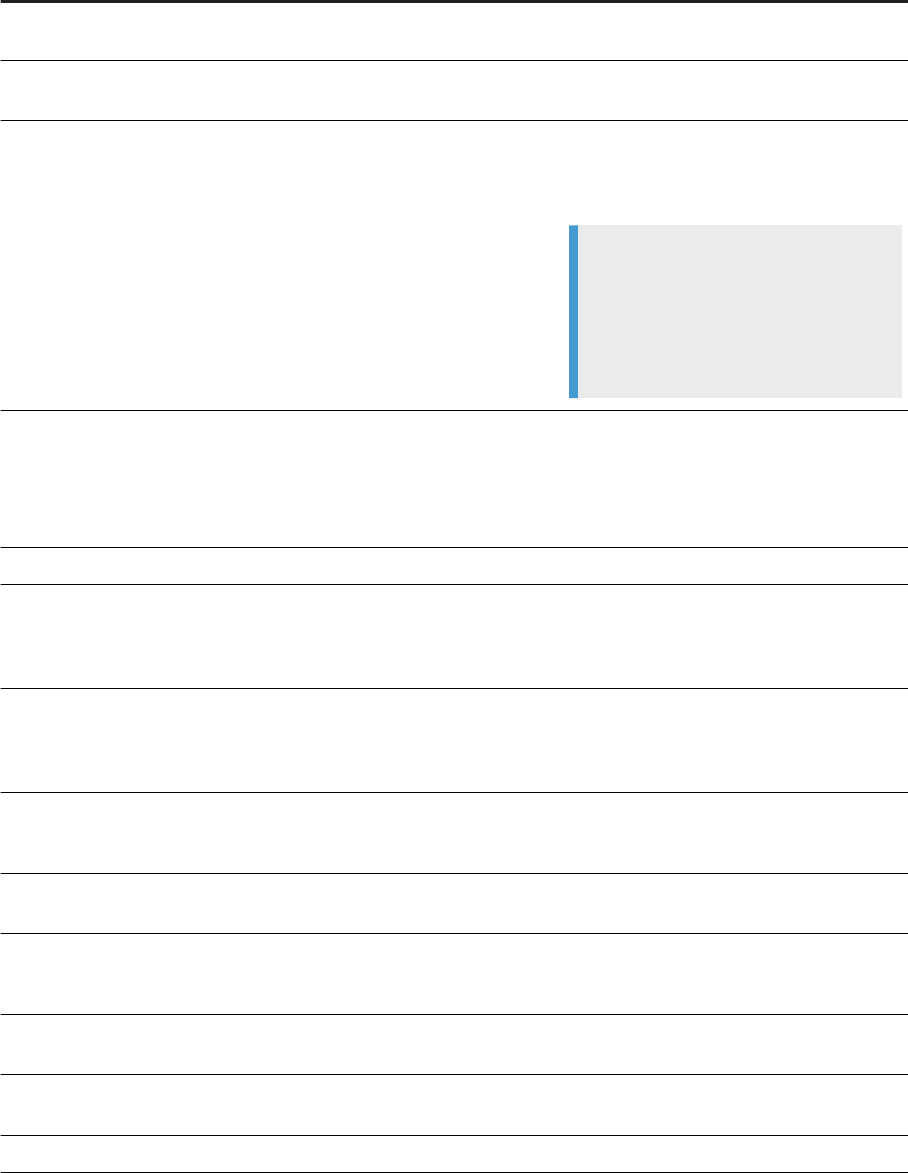
Character(s) Display(s) Example
%
The % sign after the result, but does
not multiply the result by 100.
0.50 becomes 0.50%
A non-breaking space ( )
‘1234567’ with the format # ##0 gives ‘1234
567’
1, 2, 3, a, b, c, $, £,
€ (and so on)
The alphanumeric character.
‘705.15’ with the format $#.#0 gives
‘$705.15’ or with the format #,#0 € gives
‘705,15 €’
Note
Alphanumeric characters should be de
limited by single quotes, otherwise they
can be interpreted as formatting charac
ters. For example, # # will result in '123 4'
while '#' # will result in '# 1234'
[Red], [Blue], [Green],
[Yellow], [Gray],
[White], [Dark Red],
[Dark Blue], [Dark
Green]
The value in the specied color.
‘150’ with the format #,##0[Red] gives
‘150’ in red text, #,##0[Blue] gives ’150’
in blue text.
Day/date characters
(day, date)
d
The number of the day in the month
with no leading zeros. If the date for
day is less than two characters, the
date displays without a zero before it.
The rst day of a month with the format d
gives ‘1’
dd
The number of the day with leading ze
ros. If the date for day is less than two
characters, the date displays with a
zero before it.
The rst day of a month with the format dd
gives ‘01’
ddd
The name of the day abbreviated. The
rst letter is capitalized if the selected
locale uses capitalized day names.
'Monday’ with the format ddd gives ‘Mon’ in
English, in French, lundi gives lun.
Dddd
Forced the capitalization of the day
name, for any locale.
'Monday’ with the format Dddd gives ‘Mon’ in
English, in French, lundi gives Lun.
dddd
The name of the day in full. The rst let
ter is capitalized if the selected locale
uses capitalized day names.
‘Monday’ with the format dddd gives ‘Mon
day’ in English. In French, the day is lundi.
DDDD
The name of the day in full, in upper
case.
‘Monday’ with the format DDDD gives ‘MON
DAY’ in English. In French, the day is LUNDI.
dddd dd
The day of the week followed by a
space and the number of the day.
‘Monday’ with the format dddd dd gives
‘Monday 01’
Calendar characters
(week, month, year)
362 P U B L I C
SAP BusinessObjects Web Intelligence User's Guide
Reporting data
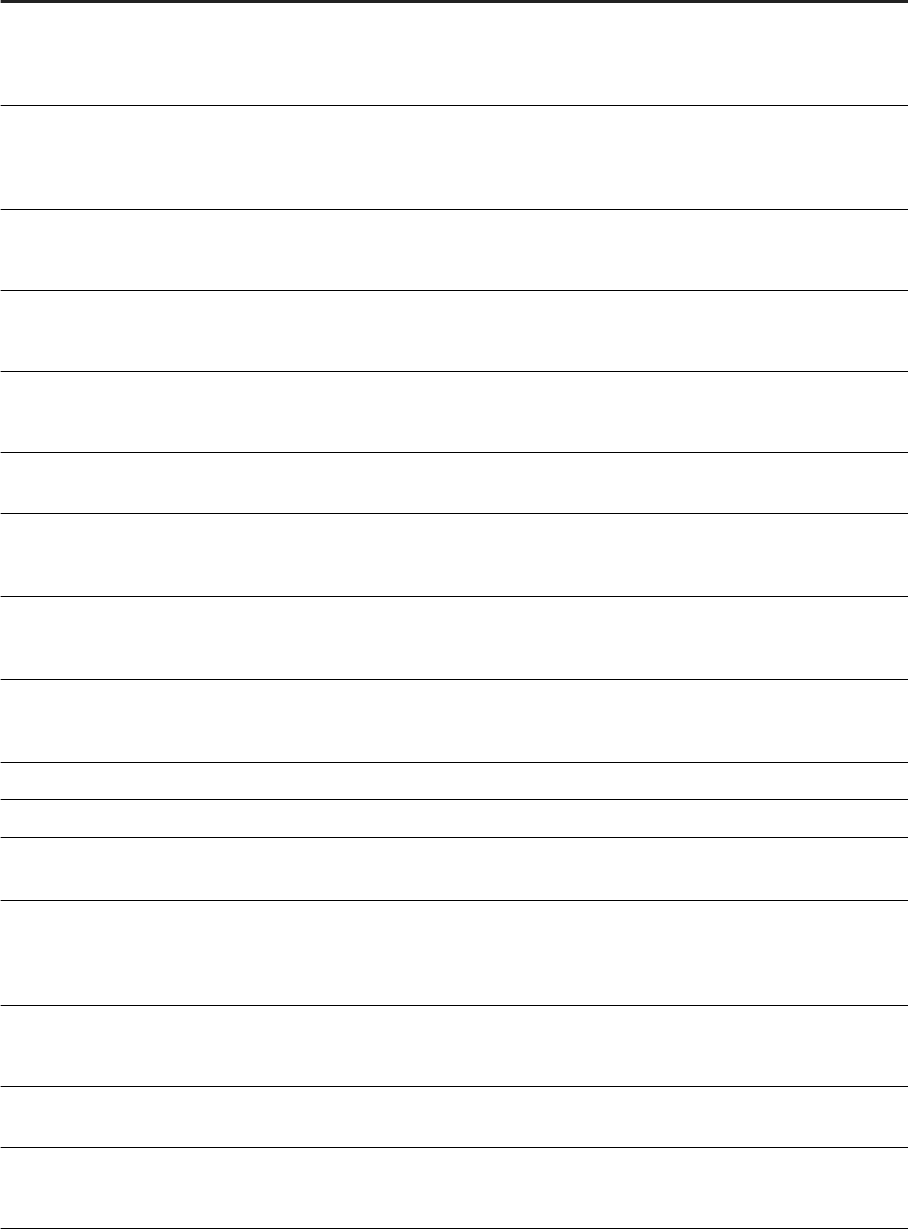
Character(s) Display(s) Example
M
The number of the month with no lead
ing zeros. If the number for month is
less than two characters, the number
displays without a zero before it.
‘January’ with the format M gives '1'
MM
The number of the month with leading
zeros. If the number for month is less
than two characters, the number dis
plays with a zero before it.
‘January’ with the format MM gives '01'
mmm
The name of the month abbreviated.
The rst letter is capitalized if the se
lected locale uses capitalization.
‘January’ with the format mmm gives Jan in
English. In French, this is 'jan'.
Mmmm
The name of the month abbreviated.
The rst letter is capitalized for all lo
cales.
‘January’ with the format mmm gives Jan in
English. In French, this is 'Jan'.
mmmm
The name of the month in full. The rst
letter is capitalized if the selected lo
cale used capitalization.
‘January’ with the format mmmm gives January
in English, janvier in French
MMMM
The name of the month in full all in up
percase.
‘January’ with the format MMMM gives JANU
ARY in English, JANVIER in French
ww
The week number of the year.
For the 9th of January 2015, the ww format
gives '02', because it is the seventh week of
the year 2015.
w
The week number of the year without
leading zero.
For the 9th of January 2015, the w format
gives '2', because it is the seventh week of the
year 2015.
W
The week number of the month.
For the 9th of January 2015, the W format
gives '2', because it is the second week of
January.
yy
The last two digits for year.
‘2003’ with the format yy gives ‘03’
yyyy
All four digits for year.
‘2003’ with the format yyyy gives ‘2003’
Time of day characters
(hours, minutes, seconds,
am/pm)
hh:mm:ss a
The hour with no leading zeros and the
minutes and seconds with leading ze
ros. The “
a" character displays AM or
PM after the time when available.
‘21:05:03’ with the format hh:mm:ss a
gives ‘9:05:03 PM’ for English locale
H
The hour according to the 24-hour
clock, starting at 0. No leading zero for
single gure hours.
‘21:00’ with the format H gives ‘21’. Possible
values are 0-23.
HH
The hour according to the 24-hour
clock, starting at 0.
‘21:00’ with the format HH gives ‘21’. Possible
values are 00-23.
k
The hour according to the 24-hour
clock, starting at 1. No leading zero for
single gure hours.
‘21:00’ with the format k gives ‘21’. Possible
values are 1-24.
SAP BusinessObjects Web Intelligence User's Guide
Reporting data
P U B L I C 363

Character(s) Display(s) Example
kk
The hour according to the 24-hour
clock, starting at 01.
‘21:00’ with the format kk gives ‘21’. Possible
values are 01-24.
hh
The hour according to the 12-hour
clock.
‘21:00’ with the format hh gives ‘09’
HH:mm
The hour and minutes with a zero in
front of a single-digit hour.
‘7:15 am’ with the format HH:mm gives ‘07:15’
HH:mm:ss
The hour, minutes, and seconds with a
zero in front of a single-digit hour.
‘7:15 am’ with the format HH:mm:ss gives
‘07:15:00’
mm:ss
The minutes, and seconds with a zero
in front of a single-digit hour.
‘07:15:03’ with the format mm:ss gives
‘15:03’
z
The time zone information on a date/
time value as follows:
GMT+/-HH:mm
4.2.23.2.1 To dene a custom format
You can dene custom number formats to use in cells in tables.
Procedure
1. In a Web Intelligence document in Design mode, select the Format tab, then the Numbers subtab.
2. Click Custom to display the Custom Format panel.
3. Select a format listed in the Samples pane, and then click Custom.
4. Edit the selected format by typing additional characters in one or more text boxes.
For example, if you want to create a custom format for a number value, type the custom format you want in
the Positive, Negative, and Equal to zero text boxes. If you want to create a custom format for Boolean
values, type the custom format you want in the True and False boxes.
5. Click Add.
You cannot delete or edit custom formats. To change a custom format, you need to create a new custom
format and apply the new format to the selected cells. Any custom formats not applied to cells in a
document are deleted automatically when you end your session.
The custom format appears in the Custom tab of the Format Number panel.
6. Click OK to return to the document.
Related Information
Custom formats [page 361]
To apply a custom number format to a cell [page 365]
364
P U B L I C
SAP BusinessObjects Web Intelligence User's Guide
Reporting data
4.2.23.2.2 To apply a custom number format to a cell
You can apply an existing custom number format to data in a cell in a table.
Procedure
1. In a Web Intelligence document in Design mode, select the cells to which you want to apply a custom
format.
2. Do one of the following:
○ In the Format tab, select the Numbers subtab. Select the custom formula from the dropdown list.
○ Right-click the selected cells, and select Format Number in the Format Number panel. In the Custom
tab, select the custom format. Click OK to return to the document.
4.2.23.3 To format a number as a currency in a table cell
You can format the currency format in a cell in a table.
Procedure
1. In a Web Intelligence document in Design mode, select a cell.
2. In the Format or Formatting tab, select the Numbers subtab.
3. From the Currency icon dropdown list, select the currency symbol.
4. To select a number format, do one of the following:
○ Select a format from the Default dropdown list.
○ If you require a format that is not in the dropdown list, click Custom. Refer to the To dene a custom
format topic for more information.
Related Information
To dene a custom format [page 364]
SAP BusinessObjects Web Intelligence User's Guide
Reporting data
P U B L I C 365
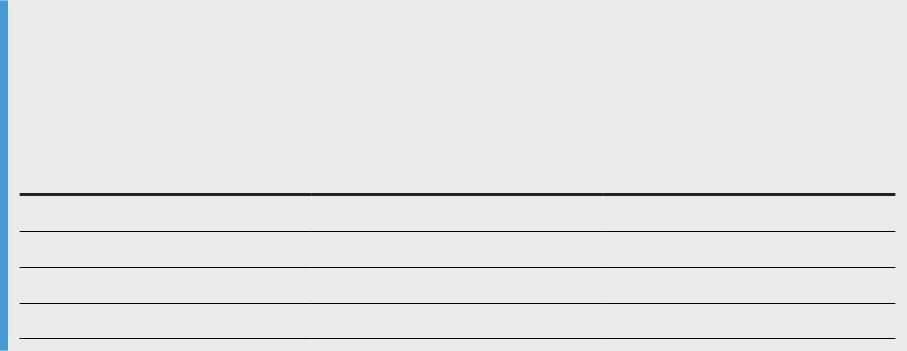
4.2.23.4 To apply a percentage format to a cell number
In a table in a Web Intelligence document, you can apply the percentage format in more than one way.
Procedure
1. Open a Web Intelligence document in Design mode.
2. Select one or more cells.
3. Do one of the following:
○ In the Format or Formatting tab:
1. Select the Numbers subtab.
2. Click the Percentage icon.
3. From the Default dropdown list, select 123,456.70%.
○ Right-click the selection and choose one of the following:
○ If you are in the Web Intelligence Rich Client or Web Intelligence Applet interface, select Format
Number. In the Format Number dialog box, select the Percentage tab, then 123,456.70%. Click OK.
○ If you are in the Web Intelligence HTML interface, select Format Cell. In the Format Cell dialog box,
select the Number tab, then 123,456.70%. Click OK.
Results
The cell or cells change to the selected number format.
4.2.24 Using sections to group data
Sections allow you to split report information into smaller, more comprehensible parts.
Example
Grouping quarterly revenue results into sections on a report
You are the regional sales manager in Texas. You receive a report showing 2003 annual revenue for stores in
your region, broken down by cities and quarters.
City
Quarter Sales revenue
Austin Q1 314430
Austin Q2 273608
Austin Q3 294798
Austin Q4 252644
366 P U B L I C
SAP BusinessObjects Web Intelligence User's Guide
Reporting data

City Quarter Sales revenue
Dallas Q1 215874
Dallas Q2 194689
Dallas Q3 204066
Dallas Q4 188791
Houston Q1 572177
Houston Q2 619924
Houston Q3 533765
Houston Q4 520332
To make a comparison of the results for each city per quarter, you set [Quarter] as a section value. The
report is broken up into four separate sections by quarter.
Q1
City
Sales revenue
Austin 314430
Dallas 215874
Houston 572177
Q2
City
Sales revenue
Austin 273608
Dallas 194689
Houston 619924
Q3
City
Sales revenue
Austin 294798
Dallas 204066
Houston 533765
Q4
City
Sales revenue
Austin 252644
Dallas 188791
Houston 520332
SAP BusinessObjects Web Intelligence User's Guide
Reporting data
P U B L I C 367

You can create a single section or include multiple sections with subsections in a report. You can also
remove and reposition sections within a report.
You can create a section from one of two sources:
● on a dimension already displayed on a table or chart: right-click the dimension and select Set as
section.
● on a dimension included in the document but not displayed on a table or chart
You cannot create a section with a measure object.
Related Information
To format the appearance of reports and their headers, footers, sections, tables, and table cells [page 255]
4.2.24.1 To create a section from a column
You can create a section based on a table column in a Web Intelligence report in Design mode.
Procedure
1. Open a Web Intelligence document in Design mode.
2. Right-click the column you want to dene as a section and click Set as Section.
4.2.24.2 To create a section from a dimension
You can create a section in a Web Intelligence document in Design mode.
Procedure
1. In a Web Intelligence document in Design mode, select the Report Elements tab.
2. In the Section subtab, click Insert Section.
3. Click in the report at the position where you want to insert the section.
4. Select the dimension in the dialog box that appears and click OK to insert the section.
368
P U B L I C
SAP BusinessObjects Web Intelligence User's Guide
Reporting data

4.2.24.3 Using report lters in report sections
You can apply report lters to sections using values in the section header or that appear within the section.
Filters on a section header
If you have a report with section [Country], you can use in the lter syntax [Country] = "US" to lter out
all sections on countries that are not "US".
Filters on section data
If you have a report with section [Region] and you use in the lter syntax [Product]="Drinks" in the
section, the report contains all sections that contain the product "Drinks".
Tthe lter is based on the data in the section, but applied indirectly to the data in the section header.
Related Information
To create, edit, and delete standard report lters [page 513]
4.2.24.4 Sections based on a hierarchy
If you create a section on a hierarchy, each member of the hierarchy becomes a section header.
You can expand sections in the same way as you expand members in a column in a table.
You have a report that displays the following data:
Customer Geography
Gender Internet Sales Amount
All Customers Male 235.243
Female 254,342
Australia Male 34,342
Female 45,464
Canada Male 12,232
Female 14,242
France Male 17,343
SAP BusinessObjects Web Intelligence User's Guide
Reporting data
P U B L I C 369

Customer Geography Gender Internet Sales Amount
Female 18,001
If you create a section on [Customer Geography], the report initially appears as follows:
All Customers
Gender Internet Sales Amount
Male 235,243
Female 254,342
If you expand the section header, the report appears as follows:
All Customers
Gender Internet Sales Amount
Male 235,243
Female 254,342
Australia
Gender Internet Sales Amount
Male 34,342
Female 45,464
Canada
Gender Internet Sales Amount
Male 12,232
Female 14,242
France
Gender Internet Sales Amount
Male 17,343
Female 18,001
370 P U BL I C
SAP BusinessObjects Web Intelligence User's Guide
Reporting data

4.2.24.5 To remove a section cell or section
You can remove a section or section cell in a Web Intelligence report in Design mode.
Procedure
1. Open a Web Intelligence document in Design mode.
2. Right-click a section cell and do one of the following:
○ Select Delete Cell Only to delete the section cell.
○ Select Delete Section and Cell to delete the section and the cell.
4.2.24.6 To set the page layout of a section
You can set the page layout of a section in a Web Intelligence report in Design mode.
Procedure
1. In a Web Intelligence document in Design mode, right-click a section and select Format Section from the
menu.
2. In the Layout tab, select any of the following:
○ Select Start on a new page to start each section on a new page.
○ Select Avoid page breaks to avoid page breaks in the section.
○ Select Repeat on every page to repeat the section header on every page.
3. Click OK to return to the document.
4.2.24.7 Hiding sections
In the Format Section dialog box, four dierent options are available to hide sections.
Depending on the option you select, you can either hide a whole section and all its instances, or only hide
specic instances. The table below details the behavior of each option available.
SAP BusinessObjects Web Intelligence User's Guide
Reporting data
P U B L I C 371
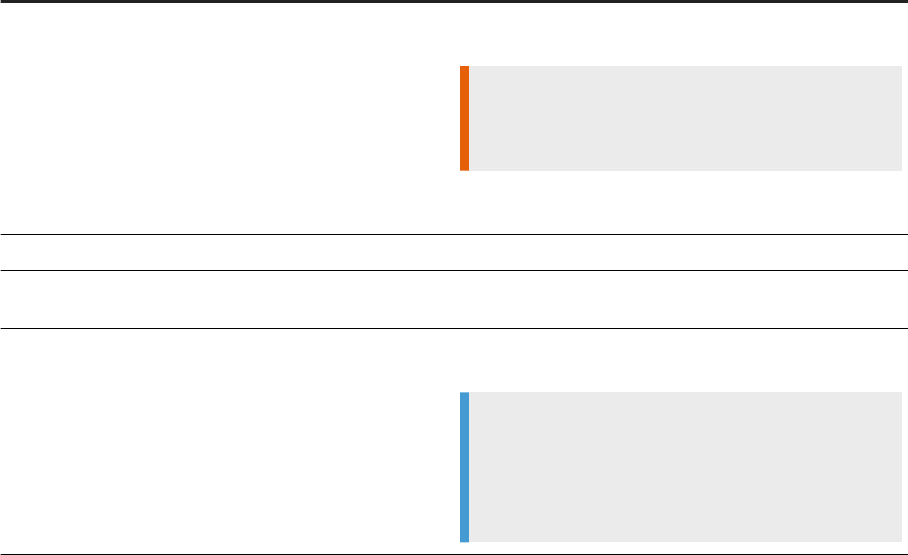
Option Description
Hide section when the following are empty Hides the instance of a section if the specied element is
empty.
Caution
This doesn't mean that the instance will be hidden if the
specied element no longer exists.
A table for instance has to be empty but still visible in a sec
tion for the condition to be true.
Hide always
Always hide a section and all its instances.
Hide when empty Hides the instance of a section if it no longer contains any el
ement.
Hide when the follwing formula is true Hides the section and all its instances depending on the boo
lean result of the formula being evaluated.
Note
This option doesn't specically hide instances of the
section where the formula is true. The formula isn't eval
uated in each instance of the section, but at the section
level.
The best way to hide an instance of a section is to use the Hide when the following formula is true option on
each element of an instance, and use the Hide when empty option on the section itself.
4.2.24.8 To hide sections
You can hide sections in a Web Intelligence report in Design mode.
Procedure
1. In a Web Intelligence document in Design mode, select a section.
2. In the Report Elements tab, in the Behaviors subtab, click the arrow next to the Hide button and select one
of the following:
○ To hide the section, select Hide.
○ To hide the section when it is empty, select Hide When Empty.
○ To hide the section when a specied formula is true, select Hide When, then select Hide when the
following formula is true, and type a formula in the box . The formula must return a Boolean value (True
or False).
372
P U B L I C
SAP BusinessObjects Web Intelligence User's Guide
Reporting data
Related Information
To redisplay hidden tables, cells or sections [page 342]
4.2.24.9 To dene colors and images in a section
You can dene section colors and images in a Web Intelligence report in Design mode.
Procedure
1. In a Web Intelligence document in Design mode, right-click the section and select Format Section.
2. In the Appearance tab, dene the colors and images.
3. Click OK to return to the document.
Related Information
To format the appearance of reports and their headers, footers, sections, tables, and table cells [page 255]
4.2.25 Using breaks
A break is a division within a block in which data is grouped according to a selected dimension, detail, or
measure into self-contained sections.
Break sections are represented as smaller tables within the same block of data.
You use breaks to display all the data for each unique value of an object in separate parts.
Breaks oer the following advantages:
● You can more eciently organize how your data is represented.
● You can display subtotals.
● You can display sub-aggregations.
4.2.25.1 Breaks compared to sections
Breaks and sections separate data dierently in Web Intelligence.
A section distributes the data into multiple free-standing cells called section headers. Each section header
contains one value for a dimension, with a block of data that corresponds to the dimension value.
SAP BusinessObjects Web Intelligence User's Guide
Reporting data
P U B L I C 373

A break divides the data up within one block. One column contains the values for a dimension, detail, or
measure, which are repeated for each other row of values in the block.
4.2.25.2 Applying breaks to hierarchies
When you apply a break to a hierarchy, the break occurs on all hierarchy members at all levels.
Example
A break applied to a hierarchy
You have a report displaying the following data:
Customer
Gender Unit Sales
ALL F 131,587
M 138,215
USA F 131,587
M 138,215
CA F 36,759
M 37,989
If you apply a break to the [Customer] hierarchy, the display appears as follows. The break is applied on
each member of [Customer].
Customer
Gender Unit Sales
ALL
F 131,587
M 138,215
Customer Gender Unit Sales
USA
F 131,587
M 138,215
Customer Gender Unit Sales
CA
F 36,759
M 37,989
374 P U B LI C
SAP BusinessObjects Web Intelligence User's Guide
Reporting data
4.2.25.3 Default sort order in breaks
When you apply a break in a report, a default sort order is applied.
When you insert a break on an object, the values for the object are automatically sorted in ascending order as
follows:
● If the values are numeric, the lowest value appears in the rst row of the table, the highest in the last row.
● If the values are alphabetical characters, then the values are sorted in alphabetical order from A to Z.
You can set multiple breaks across several dimensions details or measures and set a sort priority on each
break.
4.2.25.4 To insert a break
You can insert a break in any table in a Web Intelligence report, except for in form tables.
Procedure
1. In a Web Intelligence document in Design mode, in a table, select a column on which you want to apply a
break.
2. In the Analysis tab, in the Display subtab, select Add Break from the Break dropdown list.
The table is divided into as many mini tables as there are unique values in the column. Each mini table has
a footer.
Related Information
To manage breaks [page 376]
4.2.25.5 To remove a break
You can remove the break in a table in the Manage Breaks dialog box.
Procedure
1. In a Web Intelligence document in Design mode, select the table column on which the break is dened.
2. In the Analysis tab, in the Display subtab, select Remove Break from the Break dropdown list.
SAP BusinessObjects Web Intelligence User's Guide
Reporting data
P U B L I C 375

Note
If the column does not have a break dened, the Remove Break menu item is not available.
3. To remove all breaks, select any column in the table and select Remove All Breaks from the Break dropdown
list.
The Remove All Breaks menu item is not available if the table has no breaks dened.
4.2.25.6 To manage breaks
You can manage table column breaks in the Manage Breaks dialog box.
Procedure
1. In a Web Intelligence document in Design mode, select any column in a table.
2. In the Analysis tab, in the Display subtab, select Manage Breaks from the Break dropdown list.
The Manage Breaks dialog box shows the breaks dened in the table. If the table is a crosstab, the dialog
box shows the breaks on both the horizontal and vertical axes. Each break is represented by the dimension
on which it is dened. The order in which the dimensions appear indicates the order in which the breaks
are applied.
3. To change the priority of a break, select the dimension and click the Up or Down arrow to move the
dimension in the break priority.
4. To add a break, click Add and select the dimension on which you want to apply the break.
5. To remove a break, select the dimension and click Remove.
6. To set the properties of a break, select the dimension and select the properties in the opposite section in
the dialog box. See the link at the bottom of this topic for more information on the break properties you can
set.
7. Click OK.
Related Information
Break properties [page 376]
4.2.25.7 Break properties
A table break has several customizable properties.
You can set the following properties of a break:
376
P U B L I C
SAP BusinessObjects Web Intelligence User's Guide
Reporting data
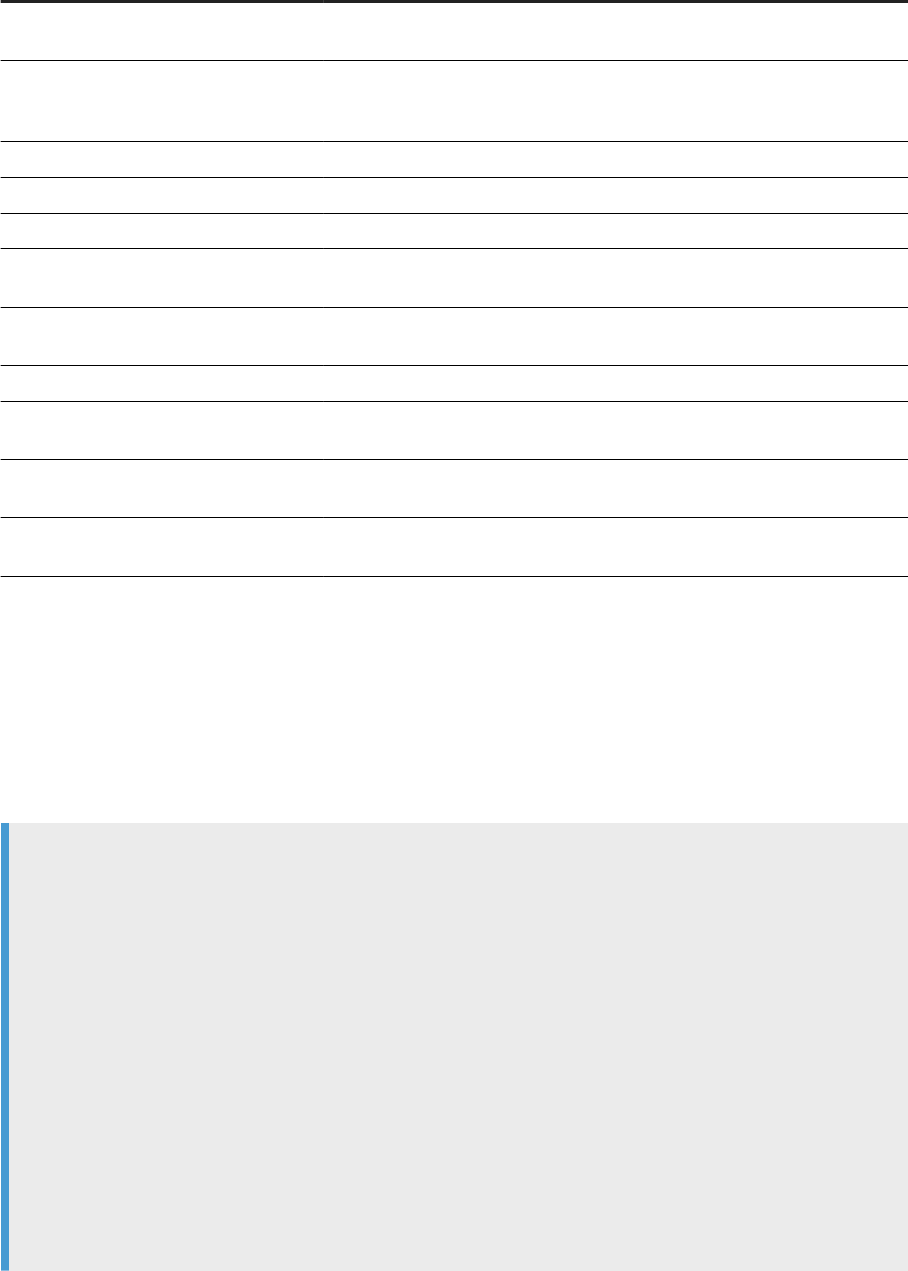
Property Description
Break header Displays a header for each part of the table, crosstab, or form when you insert
a break.
Break footer This displays a footer for each break in a section, including a footer after the
last row for a table or column for a crosstab when you insert a break. When you
apply a calculation to the data, the result is shown in the footer.
Apply Sort Applies the default sort order to the values in the break.
Duplicate values: Display all Displays all values in the break, even when they are duplicated.
Duplicate values: Display rst Displays the rst value only when values are duplicated.
Duplicate values: Merge Merges cells containing duplicate values and displays a single value over the
merged cells.
Duplicate values: Repeat rst on new page Displays the rst value in a group of duplicate values at the beginning of the
break and on each new page.
Start on a new page Displays each part of the table or form created by a break on a new page.
Avoid page breaks in block Where possible, keeps each break section on the same page. This option is not
taken into account when a block is larger than one page.
Repeat header on every page Repeats the header at the top of the table on every new page when a table
goes over onto a new page.
Repeat footer on every page Repeats the footer at the bottom of the table on every new page when a table
goes over onto a new page.
4.2.26 Using sorts to organize data in reports
You can apply sorts to the values displayed in tables, sections and charts to organize the order in which values
are displayed in a report.
By default, the sort starts from the rst column.
Note
● By default, each individual dimension is sorted ascending, in alphabetic order, when displayed in the
report. If you do not set the order explicitly, then the priority is given to the dimensions going from left
to right.
A dimension or hierarchy from an OLAP source (.unx) is ordered according to the underlying source
order, if this source provides an order.
● When the Preferred viewing locale is dierent from and incompatible with the Document locale
(dierent character sets), sorting in document tables may not work. In order to sort in documents that
use a dierent locale to your Preferred viewing locale, contact your administrator and request a change
to the registry key for Windows, or to the boconfig.cfg le for UNIX in the following way:
In Windows, on the server machines and client machines, change or create the following registry key
declaration: HKEY_LOCAL_MACHINE\SOFTWARE\SAP BusinessObjects\Suite XI 4.0\...
\WebIntelligence\Calculator : SortLocale = PVL, then close and reopen any Web
Intelligence documents that are open.
In UNIX, on the server machines, open the boconfig.cfg le (in $installdir/setup/bocong.cfg), and
add the registry key declaration:
HKEY_LOCAL_MACHINE\SOFTWARE\SAP BusinessObjects\Suite
SAP BusinessObjects Web Intelligence User's Guide
Reporting data
P U B L I C 377
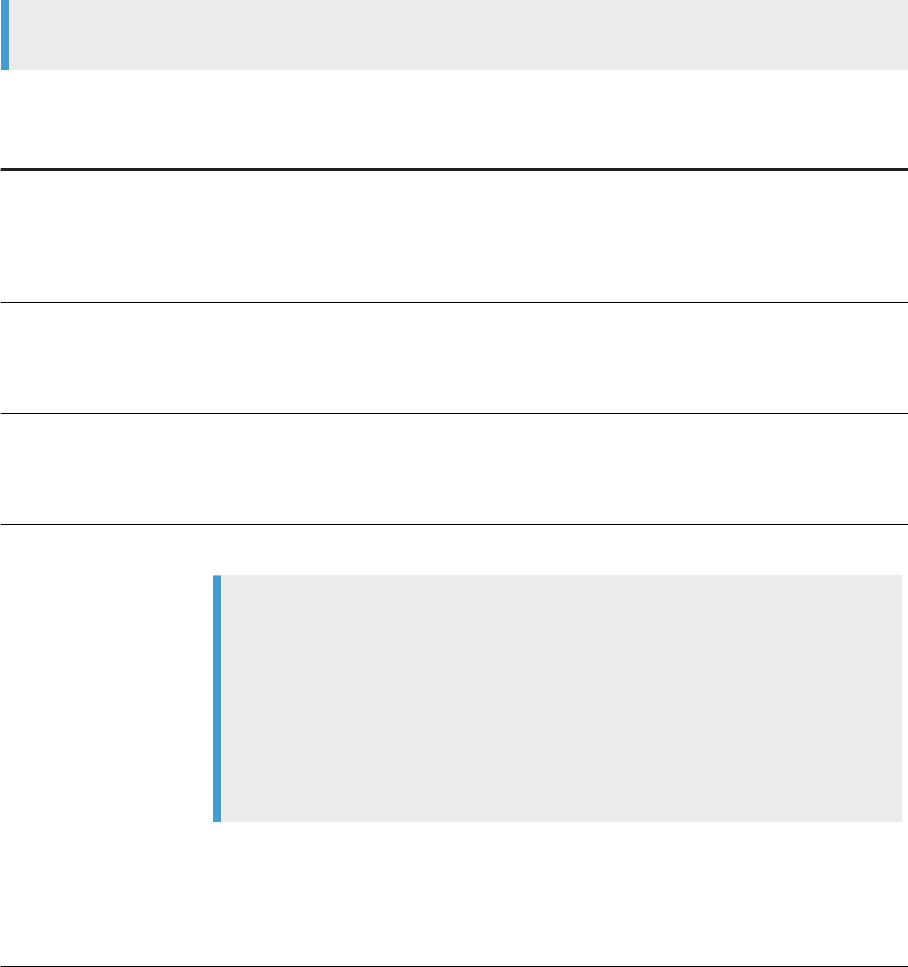
XI 4.0\...\WebIntelligence\Calculator : SortLocale = PVL, then close and reopen any
Web Intelligence documents that are open.
When you perform sorts, the following sort orders are available:
Sort order Description
Default
Depending on the type of data in the column or row, the results are sorted as follows:
● ascending numeric order for numeric data
● ascending chronological order for date
● alphabetical order for alphanumeric data
Ascending
When selected, results are arranged in ascending order, starting with the smallest value at the
top of the column.
For example: 100, 200, 300 or California, Colorado, Florida.
Descending
When selected, results are arranged in descending order, starting with the highest value at the
top of the column.
For example: 300, 200, 100 or Florida, Colorado, California.
Custom Order
You dene your own sort order. Custom Order is available on dimensions and attributes.
Note
● Custom Order is not available on hierarchies, levels, and measures. It is not possible to
manually add values to the Custom Order list if the dimension detail contains an inter
nal key (in data sources like OLAP and BEx).
● By default, the maximum number of values for dimensions are set to dierent values
on the client and server. To avoid conicts, we recommend that you set both to the
same value.
● You cannot manually add values for a Custom Order if the dimension has an internal
key.
Server default value: 100 items (MaximumCustomSortSize parameter in the
WebIntelligenceProcessingServer properties in the Central Management Console)
Client default value: 1000 items (WebiParamCustomSortMaxSize parameter in
WebIContainer_ClientDescriptor.xml)
Related Information
Interface and document locales [page 50]
378
P U B L I C
SAP BusinessObjects Web Intelligence User's Guide
Reporting data

4.2.26.1 Sorting hierarchical data
Sorts apply on hierarchical data within each parent item in the hierarchy. Sorts do not break links between
parent and child items.
Example
Sorting hierarchical data
The following table contains the [Product] hierarchy in an unsorted state:
Product
Grocery
Baking Goods
Beverages
Soft Drinks
Milk
Soda
Breads
After a descending sort is applied, the hierarchy appears as follows:
Product
Grocery
Breads
Beverages
Soft Drinks
Soda
Milk
Baking Goods
The sort places grocery types in descending order and beverages in descending order in their parent item.
The sorted beverages retain their hierarchical link with their parent item.
SAP BusinessObjects Web Intelligence User's Guide
Reporting data
P U B L I C 379
4.2.26.2 To insert a sort
You can insert a table sort in a Web Intelligence document in Design mode.
Procedure
1. Open a Web Intelligence document in Design mode.
2. Select the column you want to sort.
3. In the Analysis tab, in the Display subtab, select Ascending or Descending from the Sort list to sort the
column in ascending or descending order.
4.2.26.3 To remove a sort
You can remove a column sort in a Web Intelligence document in Design mode.
Procedure
1. In a Web Intelligence document in Design mode, select a sorted column.
2. In the Analysis tab, in the Display subtab, select None from the Sort list.
To remove all sorts from the table, select a column and select Remove All Sorts.
4.2.26.4 To manage sorts
The Manage Sorts dialog box displays the sorts applied to the table or chart.
Context
In a cross table, the sorts on both the horizontal and vertical axes are displayed. Each sort is represented by the
name of the sorted dimension, and an arrow indicates the sort direction (ascending or descending). The order
in which the sorted dimensions appear indicates the order in which the sorts are applied.
380
P U B L I C
SAP BusinessObjects Web Intelligence User's Guide
Reporting data
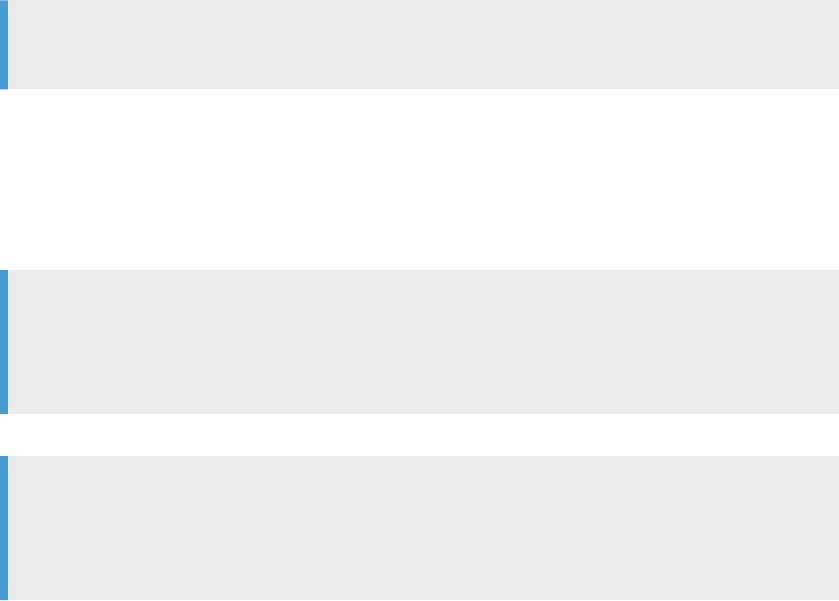
Procedure
1. In a Web Intelligence document in Design mode, select the table or chart in which you want to manage
sorts.
2. In the Analysis tab, in the Display subtab, select Advanced from the Sort dropdown list.
3. In the Manage Sorts dialog box, do any of the following:
○ To change the priority of a sort, select the dimension and click the Up or Down arrow to move the
dimension in the sort priority.
Note
You cannot change the priority of a sort if a sorted break is dened on the dimension.
○ To change the direction of a sort, double-click the dimension, or select it and select Ascending or
Descending from the Order list.
○ To add a sort, click Add and select the dimension you want to sort from the list.
○ To remove a sort, select the dimension and click Remove.
○ To customize a sort by choosing your own sort order or adding values to the list of values to sort, click
Values beneath Custom Order and dene your custom sort.
Note
○ The Values button is disabled if the custom sort is not applicable.
○ The custom order is applied to the dimension in the entire document and not just in the
selected block.
○ To reset a custom sort order to the standard sort order, select the dimension and click Reset.
Note
○ The Reset button is disabled if the sort on the selected dimension is not customized.
○ Refer to the table in the topic Sorting the results displayed on reports for the restrictions of the
Custom Order option.
4. Click OK to save your changes and close the Manage Sorts dialog box.
Related Information
Using sorts to organize data in reports [page 377]
4.3 Working with charts in reports
Charts allows you to visualize the data.
You can include one or multiple charts in a Web Intelligence report.
SAP BusinessObjects Web Intelligence User's Guide
Reporting data
P U B L I C 381
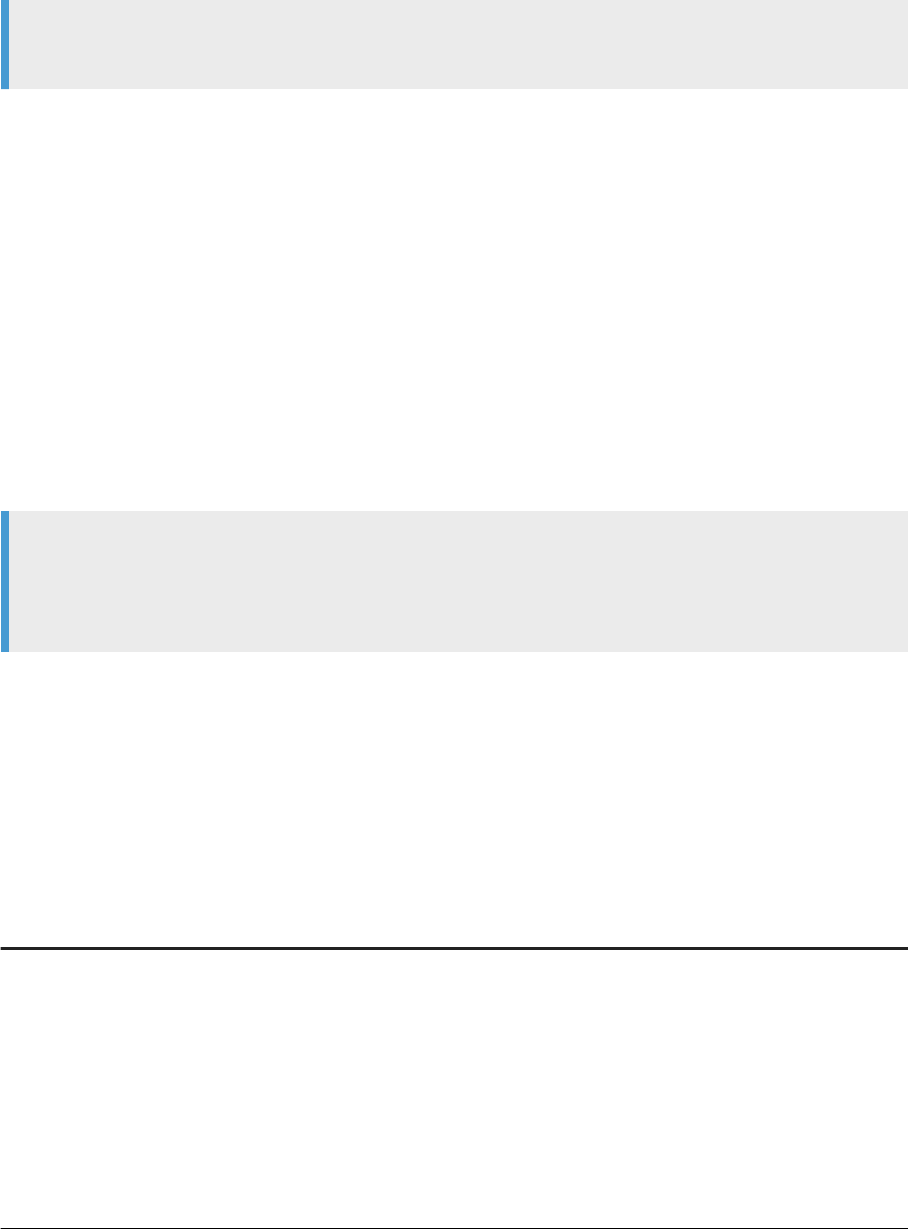
Note
When you export a document that contains a chart to Excel format, the chart is converted into an image.
Related Information
To add a chart to a report [page 396]
4.3.1 Chart types
Web Intelligence oers many types of charts that you can use to display your data.
Note
3D line, 3D area, and 3D surface charts, available in XI 3.1, are not available in BI 4.x. When Web Intelligence
documents are migrated to BI 4.x, any of these charts in the XI 3.1 version of the document are transformed
into 3D bar charts.
4.3.1.1 Choosing the correct Web Intelligence chart for
your data
Web Intelligence oers various charts for viewing and analyzing data.
Analysis type
Description Available charts
Comparison
Use to view the dierences between values.
It provides the simple comparison of categori
cal divisions of measures. It is the default anal
ysis type.
For example, you could use a bar chart to com
pare the dierences in your sales revenue be
tween dierent countries.
If you have only a few categories:
● 3D column chart
● Bar chart, vertical or horizontal
● Column chart
● Heat map
● Pie with variable slice depth chart
● Tag cloud chart
For statistical analysis:
● Box plot chart
382 P U B L I C
SAP BusinessObjects Web Intelligence User's Guide
Reporting data

Analysis type Description Available charts
Distribution Use one of these charts to show a summarized
group of unorganized data. You can also use
these charts for qualitative and quantitative
data.
For single variables:
● 3D column chart
● Area chart
● Bar chart
● Column chart
● Line chart
If you have more than one variable:
● Polar scatter chart
● Scatter chart
Correlation
Use for viewing the relationship between val
ues. It is useful for comparing multiple meas
ure values.
For example, you can view the correlation of
two measures, and understand the impact of
the rst measure on the second measure.
For two variables:
● Polar bubble chart
● Polar scatter chart
● Scatter plot chart
For three variables:
● Bubble chart (The size of bubbles within
the chart is determined by a third meas
ure)
Trend
Use to show a trend in the data values. This
analysis type is particularly useful for dimen
sions that are time based such as Year. It is
useful for seeing progression of your data and
possible patterns.
For example, you can use a line chart to view
sales revenue trends of a product throughout a
range of years.
If you have several periods to compare over
time:
● Line chart
● Radar chart
If you only have a few periods to compare over
time:
● 3D column chart
● Column chart
● Column or line chart with dual axes
● Combined column and line chart
● Combined column and line chart with dual
axes
● Waterfall chart
Composite
Use these charts to show cumulative dieren-
ces in data over time or to show the eect of a
measure on values.
For example, use a pie chart to see who had
the highest sales as part of a total sales value
directly:
Total sales = $200, Paul had 10% ($20), David
had 65% ($130), and Susan had 25% ($50).
For data changing over time:
● Area chart
● 100% stacked bar or column chart
● Stacked bar or column chart
For static data:
● Pie with variable slice depth chart
● Pie or donut chart
● Tree map
● Waterfall chart
SAP BusinessObjects Web Intelligence User's Guide
Reporting data
P U B L I C 383
Analysis type Description Available charts
Geography
Use to show a map of the country object on a
mobile device. The data for dimensions sorted
by country are shown on the map. This is use
ful to see the geographical spread of data.
Note
The Geo map is actually a data table in re
ports that is congured for use only on
mobile devices. For more information on
this chart, refer to the
Mobile BI Report
Designer's Guide.
Geo analysis
Related Information
To add a chart to a report [page 396]
To assign data to a chart [page 398]
To change the chart type by using Turn Into [page 444]
4.3.1.2 Bar charts
Bar charts display data in rectangular form horizontally.
Bar charts are useful if you want to compare similar groups of data; for example, revenue from one time period
to another.
Types of bar charts
Chart type
Description
Bar Chart
A chart constructed of horizontally-oriented rectangles. The lengths of rectangles are
proportional to the values associated to dierent category items.
Stacked Bar Chart
A chart constructed of horizontally-oriented stacked colored rectangles . The heights of
the rectangles are proportional to the values associated to dierent category items. Rec
tangles are colored according to legend entries.
384 P U B L I C
SAP BusinessObjects Web Intelligence User's Guide
Reporting data
Chart type Description
100% Stacked Bar
A chart with data displayed as parts of a whole (as percentages). A whole being a rectan
gle and a series being a subdivision of the rectangle.
4.3.1.3 Box plot charts
A Box Plot Chart (also called a stock chart) displays a ve-number summary based on the distribution of a
dataset: the maximum, the minimum, the rst quartile, the third quartile, and the median.
A Box Plot Chart can also show abnormal values called outliers.
4.3.1.4 Column charts
Column charts display a series as a set of vertical bars that are grouped by category.
Column charts are useful for showing data changes over a period of time or for illustrating comparisons among
items.
Web Intelligence oers the following column charts.
Chart type
Description
Column Chart
A chart constructed of vertically-oriented rectangles. The heights of the rectan
gles are proportional to the values associated to dierent category items.
Column Chart with Dual Value Axes
A chart with two value axes. It allows a part of a data series to be plotted against
one axis and a part of the data series to be plotted against the other axis.
SAP BusinessObjects Web Intelligence User's Guide
Reporting data
P U B L I C 385
Chart type Description
Combined Column and Line Chart
A chart displaying a combination of a column chart and a line chart. The chart
types share the same value axis.
Combined Column and Line Chart with
Dual Value Axes
A chart displaying a combination of a column chart and a line chart. The chart
types each have their own value axis.
Stacked Column Chart
A chart constructed of vertically-oriented stacked colored rectangles. The
heights of rectangles are proportional to the values associated to dierent cate
gory items. Rectangles are colored according to legend entries.
100% Stacked Column
A chart with data displayed as parts of a whole (as percentages) with a whole be
ing a column and a series being a subdivision of the column. If there is only one
series in your chart, all the column bars will t to 100% of the chart area.
3D Column Chart
A chart similar to a column chart with an added 3D dimension.
4.3.1.5 Gauge charts
Gauges are charts that indicate the location of data points across a particular range.
You can use gauge charts as value indicators in reports to display key performance indicators, progress
indicators or quantity indicators.
386
P U B L I C
SAP BusinessObjects Web Intelligence User's Guide
Reporting data
Chart Type Description
Angular Gauge
An angular gauge indicates where a specic data point, the
actual value, is located on a radial scale.
It features a primary measure that is compared to other
measures representing a mandatory maximum value and
optional target and minimum values. The colored area repre
sents the actual value, while the gray area reprensent the
gap between the actual value and the maximum value. The
optional black line, when present, corresponds to the target
value.
Linear Gauge
A linear gauge indicates where a specic data point, the ac
tual value, is located on a linear scale.
It features a primary measure that is compared to other
measures representing a mandatory maximum value and
optional target and minimum values. The colored area repre
sents the actual value, while the gray area reprensent the
gap between the actual value and the maximum value. The
optional black line, when present, corresponds to the target
value.
Speedometer
A speedometer is a gauge that uses a needle to represent
data on a radial scale between a lower and an upper limit.
4.3.1.6 Geomap charts
Geomap charts display data on a geographic map.
Geomap charts are useful if you want to compare your data geographically. They use a geographical database
embedded in Web Intelligence and a matching algorithm to automatically match values of dimensions, merged
SAP BusinessObjects Web Intelligence User's Guide
Reporting data
P U B L I C 387
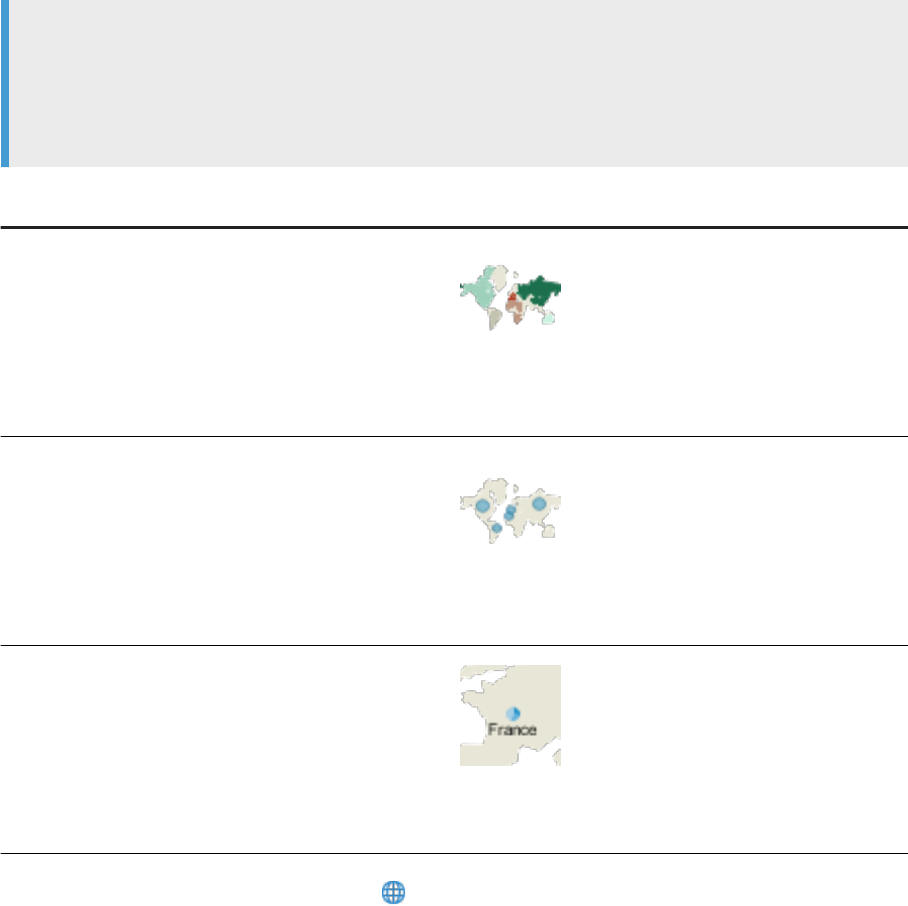
objects or a dimension variables with a location. When you match values with specic locations, you geo-
qualify the values and their parent object so they can be rendered on a map. The geo-qualication can be done
using either a location's name, or its latitude and longitude coordinates.
Note
The database contains location names in multiple languages, called exonyms. When you geo-qualify an
object, Web Intelligence selects the exonym according to your preferred viewing locale (PVL). If you decide
later on to modify your PVL, you will need to geo-qualify the object again so that the new PVL is taken into
account.
Chart Type
Description
Choropleth
Choropleth charts display values that are represented by
colors on a geographic map. The colors of the geographic
zones are determined by a measure value.
Geo Bubble
Geo Bubble charts display values that are represented by
bubbles on a geographic map. The size of the bubbles on
each geographic zone is determined by a measure value.
Geo Pie
Geo Pie charts display values that are represented by pies on
a geographic map. The size of the pies on each geographic
zone is determined by a measure value.
Once you have geo-qualied an object, an icon appears next to it. Click the + button to see the geographical
details of the location it has been matched with, such as its name, its latitude and its longitude.
Available settings
The table below lists the settings available according to each type of Geomap chart.
388
P U B L I C
SAP BusinessObjects Web Intelligence User's Guide
Reporting data
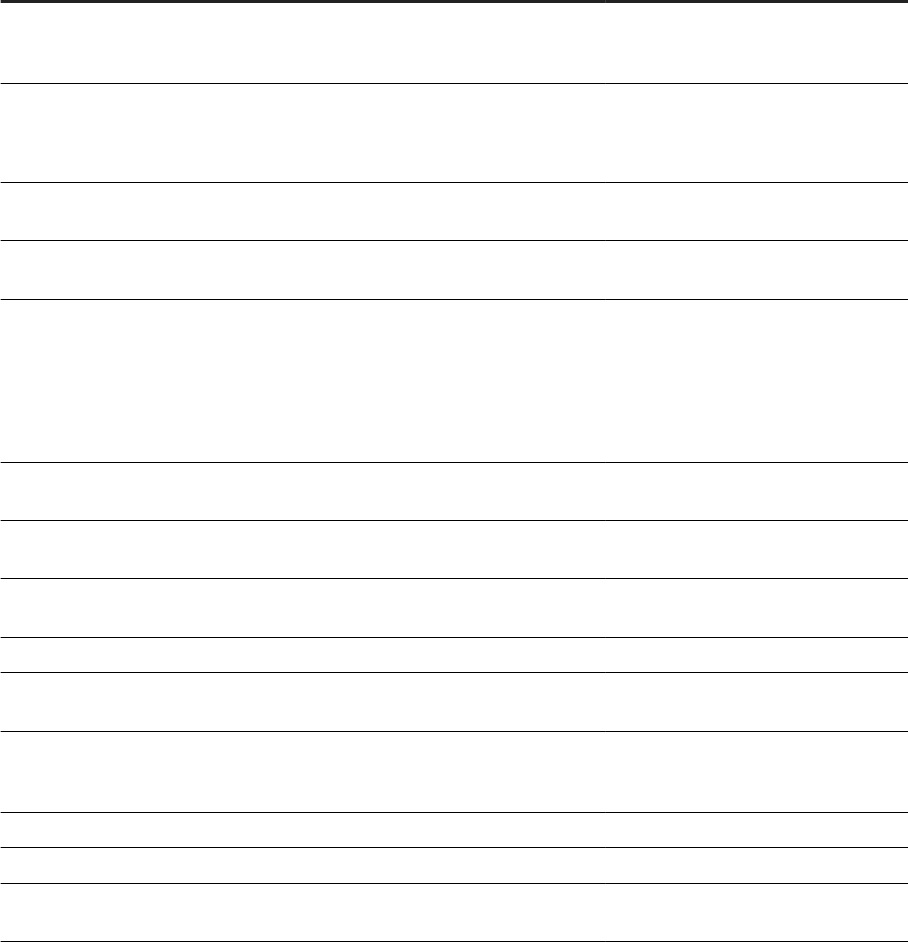
Parameter Description Available for
Display invisible area as point Display choropleth areas as points
when they are too small. This is typi
cally the case for City level areas
Choropleth
Symbol Size
Sets the choropleth symbol size when
choropleth is represented as colored
points
Choropleth
Draws unrelated geographic boundaries
as background
Draws the country borders as back
ground
All Geomaps
Geographic context color Sets the color of the background geo
graphic context
All Geomaps
Geographic context of the zones with
data
Draws the borders of the areas with
data.
Possible values are: none, neighbors
(that is, areas at the same level) or pa
rents (that is, areas at the upper level)
Choropleth
Precision Drawing precision of the borders (0 -
highest to 10 - lowest)
All Geomaps
The color of the sea in the geographic
map
Sets the color of the sea All Geomaps
Shapes with NULL or empty values Sets the color of areas with NULL or
empty values
Choropleth
Shapes with values out of range Sets the color of out-of-range areas Choropleth
Bubble scale Sets the ratio between the smallest and
the largest bubbles and pies (2 to 10)
Geo Bubble, Geo Pie
Bubble scaling mode Allows you to choose between a propor
tional and a perceptual bubbles and
pies scaling mode
Geo Bubble, Geo Pie
Edge color Sets the color of the areas borders All Geomaps
Pie title Allows you to display the Geopie titles Geo Pie
Use Manual Range Allows you to dene the latitude / longi
tude range of the map
All Geomaps
Related Information
Geo-qualifying an object for a geomap chart [page 399]
To match values of an object with a location [page 400]
To manually match values of an object with a location [page 401]
To modify the location of a value [page 404]
To reset the location of a value [page 404]
SAP BusinessObjects Web Intelligence User's Guide
Reporting data
P U B L I C 389
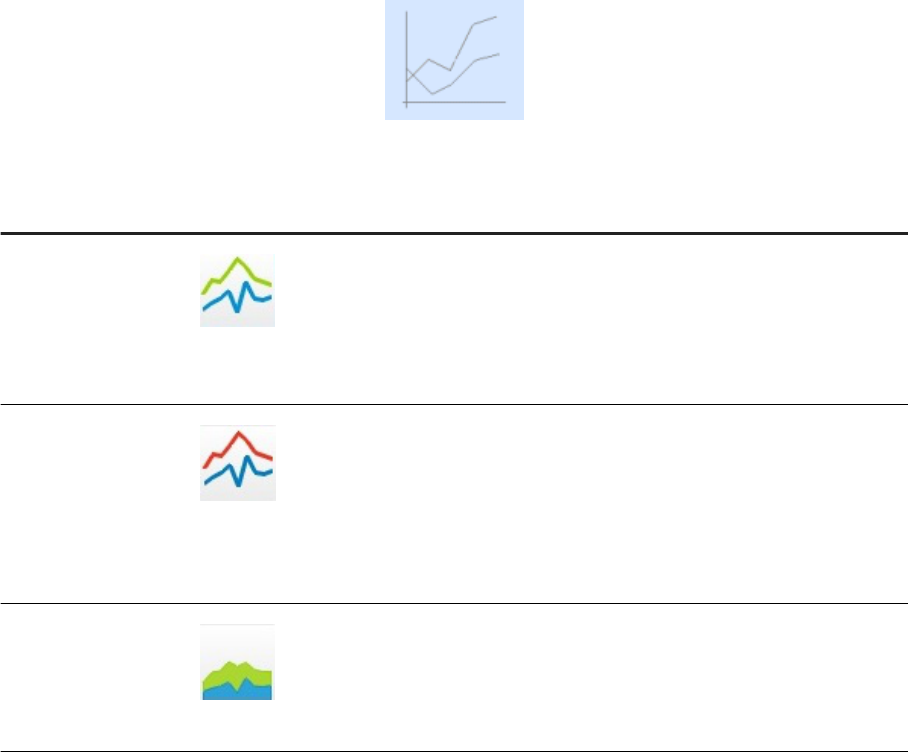
4.3.1.7 Line charts
Line charts connect specic data values with lines, either horizontally or vertically.
Line charts are useful if you want to show trends or changes in data over time.
Types of line charts
Chart type
Desciption
Line Chart
An XY chart that displays lines connecting plots. Value axis plot positions are expressed by anal
ysis category items. The secondary value axis plot positions represent the associated values.
Line Chart with Dual
Axes
An XY chart with two axes displaying lines connecting plots. Category axis plot positions signify
analysis category items. The value axis plot positions, on both axes, represent the associated
values.
Area Chart
An area chart is an XY chart that displays a surface made up of a collection of plots.
390 P U B L I C
SAP BusinessObjects Web Intelligence User's Guide
Reporting data
4.3.1.8 Map charts
Web Intelligence oers two types of Map chart.
Chart type
Description
Tree Map
Charts that display values within nested rectangles that can be colored. The levels of nesting cor
respond to the level of hierarchical breakdown. The size of the rectangles and their color both ex
press a set of values.
Heat Map
Charts that display values that are represented by colors in a map using a category axis and op
tionally a second category axis. The colors of the rectangles are determined by a measure value.
4.3.1.9 Pie charts
Pie charts display data as segments of a whole.
Pie charts are useful if you want to show how each part of your report data contributes to the total.
You can only include one measure object in a simple pie chart or two in a pie chart with depth. If you have
several measures in your report, you should choose another chart type.
Data labels on pie charts can be wrapped for a better layout. In the Data Values pane of the Format Chart tab,
the Text Policy option Wrap can be used.
SAP BusinessObjects Web Intelligence User's Guide
Reporting data
P U B L I C 391
Types of pie charts available
Chart type Description
Pie Chart
A circular chart made up of sectors. The area of the circle represents a whole,
and the sectors of the circle represent the parts of a whole.
Additionally, a Donut Chart can be displayed from a pie chart. It is similar to a pie
chart, but with an empty center; it is ring shaped.
Pie Chart with Variable Slice Depth
A circular chart made up of sectors. The area of the circle represents a whole,
and the sectors of the circle represent the parts of a whole. The sectors may have
some depth expressing a third value.
4.3.1.10 Point charts
The Point chart category includes scatter, polar and bubble charts.
Chart type
Description
Scatter Plot Chart
An XY chart displaying plots. Plots are positioned with coordinates given by a pair of
values. Each plot may have colored symbols representing the analysis category item
associated with the values.
Scatter Charts are similar to line graphs, except that the data points are plotted with
out a line connecting them. Scatter Charts are useful if you want to make a compari
son between specic data points.
Bubble Chart
A two-dimensional chart of points representing a collection of data. Extra variables are
represented by the size of the points.
392 P U B L I C
SAP BusinessObjects Web Intelligence User's Guide
Reporting data
Chart type Description
Polar Scatter Plot
An XY chart displaying plots. Plots are positioned with coordinates given by a pair of
values. Each plot may be sized according to extra values.
A chart with one radial axis and one angular axis, where each data point is represented
with a symbol. Similar to a Bubble Chart, but without the sizing of points.
Polar Bubble Chart
An XY chart displaying plots. Plots are positioned with coordinates given by a pair of
values. Each plot may be sized according to extra values.
A two-dimensional chart with one radial axis and one angular axis of points represent
ing a collection of data. Extra variables are represented by the size of the points.
4.3.1.11 Radar charts
The Radar Chart (also known as a Spider chart) displays several axes starting from a unique origin and with a
common scale.
Each axis represents an analysis category item. Plots are directly placed on an axis according to the associated
values. Plots can be linked by lines.
Radar charts are useful if you want to look at several dierent factors related to one item. For example, you
could use a radar chart to display revenue data for dierent services within a hotel. On one axis, you could
display revenue for the rooms. On another you could display revenue for the restaurant, and so on.
4.3.1.12 Tag cloud charts
A Tag Cloud Chart is a mono-dimensional visualization representing data as words where the word font size
represents its relative weight in the dataset.
SAP BusinessObjects Web Intelligence User's Guide
Reporting data
P U B L I C 393

4.3.1.13 Waterfall charts
A Waterfall Chart (also known as a Bridge chart) displays vertical bars.
Each one of these bars starts at the level where the preceding bar ends, making the bars look as if they are
oating. This type of chart is useful for showing how a measure increases or decreases, for representing
positive or negative changes or for illustrating up and down eects.
Types of waterfall charts
● A chart generated from a at dimension gives a simple waterfall chart.
● A chart generated from hierarchical data gives a complex waterfall chart.
Subtotal management
● Intermediate totals are only generated from hierarchical tree nodes. To generate intermediate totals from a
at dimension, you have to use grouping.
● Intermediate totals (tree nodes) are displayed as a waterfall.
Feeding restrictions
● The category axis is limited to one dimension (or hierarchy).
● The value axis is limited to one measure.
Color management
You can assign specic colors to initial values, totals, subtotals or positive/negative variations.
Related Information
To congure the value colors in a waterfall chart [page 423]
394
P U B L I C
SAP BusinessObjects Web Intelligence User's Guide
Reporting data

4.3.2 Custom Elements
Custom Elements are visualizations whose rendering is delegated to external rendering services outside of
Web Intelligence.
In Web Intelligence documents, Custom Elements are integrated and displayed similarly to any other report
elements like charts or tables. The feeding model is provided by the selected Custom Elements service, with a
default number of axis. You can work with Custom Elements using the contextual menu when you right-click
them. They are located at the bottom of the list of regular charts when you insert a report element.
To be able to use Custom Elements in Web Intelligence, you have to add a Custom Elements service in the CMC
rst. To know how to add a Custom Elements service, refer to the Business Intelligence Platform Administrator
Guide.
Note
You cannot drill on a custom element.
Using Custom Elements with the Rich Client
If a document that contains Custom Elements is saved locally on a computer, you can view and modify its full
content in Web Intelligence Rich Client only if Rich Client is connected to the BI Platform where the document
was created.
Related Information
To add a custom element to a report [page 396]
4.3.3 Opening charts created with XI Web Intelligence 3.x
This version of the software supports backward compatibility with Web Intelligence XI 3.x.
Existing charts are converted automatically when you open them; however if you open an existing 3D chart,
other than a 3D bar chart, it will be converted into a 3D bar chart.
SAP BusinessObjects Web Intelligence User's Guide
Reporting data
P U B L I C 395

4.3.4 To add a chart to a report
You can add a chart to a Web Intelligence report.
Procedure
1. Open a Web Intelligence document in Design mode.
Note
If you are in Structure Only Design mode, all the charts will appear grayed out.
2. Do one of the following:
○ In the Reports Elements tab, in the Chart subtab, click a chart icon, then click in your report. Drag and
drop the dimensions and measures you want into it from the Available Objects pane.
○ Right-click in the report and select Insert and do one of the following:
○ Select a column, line, pie or scatter plot chart.
○ To insert a dierent sort of chart from those listed above, click Insert a Report Element.
The chart appears empty in light gray. This is sometimes called a ghost chart.
○ Select a table you want to turn into a chart and do one of the following:
○ Select Turn Into from the Tools subtab.
○ Right-click the table and select Turn Into, then select a chart type.
Related Information
To assign data to a chart [page 398]
4.3.5 To add a custom element to a report
You can add a custom element to a Web Intelligence report.
Context
The Custom Element subtab is available only if at least one Custom Elements service has been congured and
enabled in the CMC. To know how to add a Custom Elements service, refer to Business Intelligence Platform
Administrator Guide.
396
P U B L I C
SAP BusinessObjects Web Intelligence User's Guide
Reporting data
Procedure
1. Open a Web Intelligence document in Design mode.
2. Under the Custom Element subtab in the toolbar, click Insert Custom Element.
3. Place the Custom Element anywhere on the report page.
4. Select a Custom Elements service at the bottom of the list of regular charts.
5. Select a Custom Element.
6. Assign data to the Custom Element like you assign data to regular Web Intelligence charts.
7. Click OK.
Caution
In Web Intelligence DHTML client, you will lose the mouse focus if you move a Custom Element in the
report page and the pointer hovers over a Custom Element in the process. That is because the focus is
taken away by the interactions with the Custom Element content. To avoid this issue, do not hover over
a Custom Element when you move the pointer. Also, if you want to move a Custom Element for
instance, you can drag it by the bottom if you want to move it down, or by the top if you want to move it
up.
Related Information
To assign data to a chart [page 398]
4.3.6 Assigning data to a chart
Depending on the chart, you assign objects, also called feeding, to dierent drivers.
Some dimensions and measures generate axis labels or values and some drive the series color.
The table explains the dierent elements for assigning data a chart.
Purpose
Feeds Object type
Binding object to axes Value axes Measures
Category axes Dimensions, Details or Measure Names
Dening series (*) • Region Color
• Region Shape (Radar & Point charts)
Dimensions, Details or Measure Names
SAP BusinessObjects Web Intelligence User's Guide
Reporting data
P U B L I C 397

Purpose Feeds Object type
Dening series size • Pie sector size / sector height
• TreeMap rectangle weight
• Bubble height / Bubble width
Measures
Conditional coloring (*) • Map rectangles
• TagCloud text zones
Measures
(*) Optional
4.3.6.1 To assign data to a chart
You can assign data to a chart via the Side Panel or from an option in the contextual menu.
Procedure
1. Open a Web Intelligence document in Design mode.
2. Do one of the following:
○ In the Side Panel, select Available Objects. From the Available Objects pane, drag and drop the
measures, dimensions, and/or details into the chart. They will automatically be dispatched to the
relevant area.
○ Right-click in the chart and select Assign Data from the contextual menu. The Assign Data dialog box
appears displaying the dimensions that require data. You can add, delete, reorder (move up, down, to
the top, or to the bottom), or hide the values plus edit or create a formula.
Note
If you are assigning data to a Geomap chart, make sure that every object you want to use is
matched with a location. An object that has not been matched with a location cannot be displayed
on the Geomap chart.
Related Information
Geo-qualifying an object for a geomap chart [page 399]
To match values of an object with a location [page 400]
To manually match values of an object with a location [page 401]
To modify the location of a value [page 404]
To reset the location of a value [page 404]
To format a chart [page 409]
398
P U B L I C
SAP BusinessObjects Web Intelligence User's Guide
Reporting data
4.3.7 Geo-qualifying an object for a geomap chart
Geomaps rely on a geographical database to render your data.
Before you start using geomaps in you reports, you need to set up your data and go through the geo-
qualication process so that they can be bound to the geographical database. Geo-qualifying your data means
that you match each value of an object with a specic location. Geomaps then use these locations to render
your data on a map. The geo-qualication can be done using either a location's name, or its latitude and
longitude coordinates.
Geo-qualifying an object using a location's name
Web Intelligence uses an algorithm to match each value of the object with a geographic location. The search
engine uses fuzzy logic to create three categories of values and automatically match them with locations:
● Resolved : only one location matches at 100%, and is automatically bound to the value.
● Unresolved : several locations match at 100% or higher than 85% but below 100%. There is no obvious
match, and you have to select the most appropriate one.
● Missing : no location found, or locations match at lower than 85%. Search for the location you want to
bind in the geographical database.
Note
In order to be geo-qualied by its name, every value of a dimension must belong to the same
geographical level. Hierarchical dimension objects cannot be edited as geography because they
contain several geographical levels (for example, Country, Region, Sub-Region and City).
You may select a dierent location in the dropdown list from the one selected by the automatic matching
mechanism. To select a location manually, refer to To manually match values of a dimension with a location.
Geo-qualifying an object using a location's latitude and longitude
coordinates (4.2 SP3)
Latitude and longitude coordinates are two objects that must be available as dimensions, dimensions'
attributes or variables. They can be any object that can be added to a dimension as a detail, and do not
necessarily have to be the same type of object. You can have latitude coordinates as a dimension and longitude
coordinates as a variable for instance.
Restriction
Latitude and longitude objects cannot be geo-qualied objects, measures, measures' attributes or
hierarchies.
SAP BusinessObjects Web Intelligence User's Guide
Reporting data
P U B L I C 399

Coordinates must range from:
● -90.0° (South) to 90.0° (North) for latitude coordinates, 0° being the equator
● -180.0° (West) to 180.0° (East) for longitude coordinates, 0° being the Greenwich meridian
It is possible to edit an object that has been geo-qualied using latitude and longitude coordinates, but only by
latitude and longitude, not by name.
Related Information
Geomap charts [page 387]
To match values of an object with a location [page 400]
To manually match values of an object with a location [page 401]
To match values of an object using latitude and longitude coordinates [page 403]
4.3.7.1 To match values of an object with a location
You can bind a geographic location to a value. Geomap charts for instance use locations to render data on a
map.
Context
The geo-qualication will automatically match values to a geographic database of name-latitude-longitude
data using name lookup. If there is more than one matching location, all matches will be presented, allowing
you to select the most appropriate location. It is possible to select a dierent location in the dropdown list from
the one selected by the automatic matching mechanism. To do so, refer to To manually match values of an
object with a location.
Procedure
1. Go to the Available Objects pane.
2. Right-click an object you want to geo-qualify.
3. Click Edit as a Geography By Name .
4. Select a level.
There are four possible levels: Country, Region, Sub-Region and City. In the United States for example,
California is a region, Southern California is a sub-region, and Los Angeles is a city.
5. Optional: Click the Show combo box to lter the list on matching category.
6. Click the dropdown list next to the value you want to edit.
400
P U B L I C
SAP BusinessObjects Web Intelligence User's Guide
Reporting data
7. Select one of the locations available.
8. Click Apply.
9. Click OK.
Note
An error icon is displayed on the geomap and next to the geo-qualied object if a value has not been
geo-qualied. This may occur when you refresh the document or add new locations. To x this issue,
make sure all objects values are geo-qualied by repeating the above procedure.
Related Information
To manually match values of an object with a location [page 401]
4.3.7.2 To manually match values of an object with a
location
You can manually match values of an object to a location. This is useful when the location you expect does not
appear in the dropdown list for example, or when a value is assigned to an incorrect location.
Context
Note
The geographical database might not recognize a specic location you are looking for. If this is the case, try
to select a substitute location, create a custom location or select an alternative location.
Procedure
1. Go to the Available Objects pane.
2. Right-click an object you want to geo-qualify.
3. Click Edit as a geography By Name .
4. Select a level.
There are four possible levels: Country, Region, Sub-Region and City. In the United States for example,
California is a region, Southern California is a sub-region, and Los Angeles is a city.
5. Click the dropdown list next to the value that you want to edit.
If several locations appear in the dropdown list, select the one that is closest to the location you were
originally looking for.
SAP BusinessObjects Web Intelligence User's Guide
Reporting data
P U B L I C 401
6. Optional: If you do not nd the location you are looking for, Click Select location....
7. Do one of the following:
○ Type in the name of the location, select the one you are looking for and click OK.
○ Click Add Location, enter the coordinates of the location you are looking for and click OK.
Note
The search applies to the level you have dened when you edited the dimension as geography: Country,
Region, Sub-Region or City. Make sure you are using the correct level when doing a search.
8. Click OK.
4.3.7.3 Matching values of a merged object with a location
Members of a geo-qualied merged object share a common list of values.
If you merge an object that is geo-qualied with another one that is not, it inherits the geo-qualication
method, that is by name or latitude and longitude, of the member that was originally geo-qualied.
In the Available Objects pane, the following icon is displayed next to merged objects that are geo-qualied: .
Depending on the geo-qualication scenario, you might have conicts or unresolved and missing values. In that
case, an icon is displayed next to the merged object with unresolved or missing values:
. Another icon is also
diplayed next to the member whose geo-qualication needs is incomplete: . Conicts, unresolved or missing
values can happen in the following cases:
● You are merging two geo-qualied objects to create a geo-qualied merged object
Each member object comes with in its own list of values resulting from a previous geo-qualication. If the
lists of values conict with one another or if there are unresolved and missing values, repeat the geo-
qualication process.
● You are adding a new object to a merged object that is already geo-qualied
The member you are adding to the merged object is automatically geo-qualied. However, it can bring new
and unresolved values. Repeat the geo-qualication process either for the merged object or one of its
members to solve the issue.
Restriction
You cannot merge objects that have been geo-qualied using the latitude/longitude geo-qualication
method. However, it is possible to merge an object that has been geo-qualied using the latitude/longitude
geo-qualication method with an object that is not geo-qualied.
Impact of an unmerge command on geo-qualication
Unmerging a geo-qualied object by name does not cancel the geo-qualication of its members. Unmerging a
geo-qualied object by latitude and longitude returns all of its members to their original state.
402
P U B L I C
SAP BusinessObjects Web Intelligence User's Guide
Reporting data

Caution
Resetting the geo-qualication of a merged object, a merged object member or an object that is part of a
merge will reset the geo-qualication of the merged object, its members and all its participating objects.
Related Information
To match values of an object with a location [page 400]
To manually match values of an object with a location [page 401]
To match values of an object using latitude and longitude coordinates [page 403]
4.3.7.4 To match values of an object using latitude and
longitude coordinates
Context
Restriction
You cannot use an object as latitude or longitude if it is already geo-qualied.
Procedure
1. Go to the Available Objects pane.
2. Right-click an object you want to geo-qualify.
3. Click Edit as a Geography By Latitude / Longitude .
4. Select the latitude and longitude objects.
5. Click OK.
SAP BusinessObjects Web Intelligence User's Guide
Reporting data
P U B L I C 403

4.3.7.5 To modify the location of a value
You can modify the geo-qualication of an object.
Context
After a geo-qualied object has been modied, refresh the document for the new locations to be displayed on
the map.
Procedure
1. Go to the Available Objects pane.
2. Right-click on a geo-qualied object you want to edit.
3. Click Edit as a Geography.
4. Optional: Filter the results in the Show dropdown list.
5. Click the dropdown list next to the value that you want to edit.
6. Select one of the locations available.
7. Repeat the process for every value you want to edit.
8. Click Apply.
9. Click OK.
4.3.7.6 To reset the location of a value
Context
Reset the geo-qualication to remove the geography associated with an object.
Caution
If you reset a merged object, every member is reset and loses the geo-qualication. This behavior also
applies if you reset a geo-qualied object participating to a merge.
Procedure
1. Go to the Available Objects pane.
2. Right-click on a geo-qualied object you want to reset.
404
P U B L I C
SAP BusinessObjects Web Intelligence User's Guide
Reporting data
3. Click Reset.
4.3.8 To remove a chart
The following task describes how to remove a chart from a report.
Procedure
1. Open a Web Intelligence document in Design mode.
2. Do one of the following:
○ Right-click the chart frame and click Delete.
○ Select the Document Structure and Filters tab in the Side Panel. Right-click the chart name and select
Delete.
○ Select the chart, and in the Side Panel toolbar, click the Delete icon.
Results
The chart has been deleted.
Related Information
To format a chart [page 409]
4.3.9 To copy a chart
You can copy a chart dynamically to another report or as a picture in other applications.
Procedure
1. In a Web Intelligence document in Design mode, right-click the chart frame and select Copy.
The chart is copied to the clipboard.
2. To paste the chart to another part of the report, right-click where you want the chart to appear then select
Paste.
SAP BusinessObjects Web Intelligence User's Guide
Reporting data
P U B L I C 405

3. To paste the chart into another application, paste the contents of the clipboard from within the other
application.
You can also copy a chart into another application by dragging and dropping it directly into the open
document in the target application.
Within the same application, your copied chart will be dynamic. However, if the chart is pasted into another
application, the chart appears as a picture.
Related Information
To format a chart [page 409]
4.3.10 Turning hierarchical queries into charts
You can turn a hierarchical query into a chart.
Tip
Displaying the totals may generate scale distortions, especially if the measure is an aggregate. Hierarchical
totals should not be displayed in Pie charts or a Tag Cloud. To hide hierarchical totals, use levels for feeding
or navigate within the table with the Drill Focus option or uncheck the option Show parent nodes in the
Format Chart dialog box ( Global General ).
Note
Use only one hierarchy to feed a Tree Map.
Related Information
Hierarchical queries [page 68]
To change the chart type by using Turn Into [page 444]
406
P U B L I C
SAP BusinessObjects Web Intelligence User's Guide
Reporting data

4.3.11 To set the position of a table or chart on the report
page
You can set the position of a table or chart in a report.
Procedure
1. In a Web Intelligence document in Design mode, right-click the border of the table or chart, and select
Format Table or Format Chart.
2. In the Global Layout section of the table or chart format panel, use the controls in the Relative
Position section to set the position of the table or chart in relation to other report elements.
Tip
You can also reach the Layout tab in the table or chart format panel by one of the following ways:
○ In the Report Elements tab, in the Position subtab, click Align, then an alignment option.
○ Right-click the table or chart and select Align, then an alignment option.
3. Click OK.
Related Information
To format the appearance of reports and their headers, footers, sections, tables, and table cells [page 255]
To select a background color for the table or cells [page 327]
To dene alternate row and column colors for a table [page 328]
To format table or cell borders [page 329]
To format text in table cells [page 330]
To set cell height and width [page 332]
To copy formatting using the Format Painter tool [page 334]
To layer tables and cells [page 336]
To merge table cells [page 338]
Formatting the report layout [page 253]
Formatting your reports using Cascading Style Sheets [page 298]
Creating a corporate palette for charts [page 424]
SAP BusinessObjects Web Intelligence User's Guide
Reporting data
P U B L I C 407
4.3.12 To position a chart in relation to another chart or table
If you have more than one block (table, chart, or form) in your report, you can use relative positioning.
Context
Relative positioning allows you to position a selected block (for example, a chart) in relation to other blocks in
the report.
If new data on the database modies the size of the tables or charts, relative positioning ensures that the
dierent tables and charts display correctly without overlapping each other.
Note
If you position a chart in relation to another block (that is, a chart, table, or form), the position of the chart
changes automatically, if you reposition the reference block.
Procedure
1. In a Web Intelligence document in Design mode, right-click the chart and click Format Chart.
2. Select the Global chart area, then the Layout tab.
3. In the Relative Position area, congure the left and right edge position of the chart in proximity of a report
object you specify.
For example, to align with the left edge of the report title, select Left edge, then Report title.
Results
Tip
You can also reach the Layout dialog box by doing one of the following:
● In the Report Elements tab, in the Position subtab, click Align Relative Position .
● Right-click the table or chart and selecting Align Relative Position .
4.3.13 Formulas in chart elements
You can use the Formula Editor (the fx icon) to dene and edit formulas in chart elements.
The following chart elements can use a formula:
408
P U B L I C
SAP BusinessObjects Web Intelligence User's Guide
Reporting data

Chart title
Legend title
Axis titles
Maximum and minimum values for axis scaling
For more information on the functions used in free-standing cells, see the Using Functions, Formulas and
Calculations in Web Intelligence guide or the online help.
4.3.14 Formatting charts
You can format a chart area or a selected chart area (title, legend, axes, plot area, area title) in Web Intelligence.
You can nd chart format options in the Format or Formatting toolbar in the Design mode.
4.3.14.1 To format a chart
You can format a chart in a report using options in the Format Chart dialog box.
Procedure
1. In a Web Intelligence document in Design mode, right-click the chart frame and select Format Chart.
2. In the Format Chart dialog box, select the chart area that you want to format.
Tip
If you have preselected a chart area before calling the dialog box, this area is displayed automatically
without you having to navigate.
3. Do one of the following:
○ In Web Intelligence Rich Client, select the functional tab that you want to change in the Side Panel.
○ In the Web Intelligence HTML interface, expand the tab of the chart area you want to format, then
select the functional tab.
4. When you have made your changes, click Apply if you want to see the changes before you close the dialog
box or if you want to make some other changes before you close the dialog box. Otherwise, click OK to save
the changes and close the dialog box.
Results
Another way to access the Format Chart dialog box is to select the chart. In the Formatting tab, in the Chart
Style subtab, click Format Chart.
SAP BusinessObjects Web Intelligence User's Guide
Reporting data
P U B L I C 409
4.3.14.2 Data intervals in Tree Maps, Heat Maps and Tag
Cloud charts
Data intervals are based on colors in Tree Map, Heat Map, and Tag Cloud charts that use intervals.
You can use one of the following shape coloring methods:
Coloring method
Description
Custom Range Coloring The Custom Range Coloring method uses ranges that you
set based on an increment or percentage, and you select the
color that applies to each range.
Gradient-based Palette Coloring The Gradient-based Palette Coloring method uses a 2 or 3
color gradient denition, and you select the color that ap
plies to each gradient.
Gradient-based Palette Coloring Using Measure Polarity The Gradient-based Palette Coloring Using Measure Polarity
method not only uses a 2 or 3 color gradient denition, it
also uses a 2 or 3 color neutral polarity denition.
Palette Coloring The Palette Coloring method applies a dierent color from
the selected palette to each legend interval.
Note
You should not use these charts with hierarchical nodes for aggregate measures because the color scale
can be distorted. To deactivate these nodes, deactivate the
Show Parent Node option in the Global
General section of the Format Chart dialog box.
Palette coloring methods
In all of the palette coloring methods, the data range is dened in the Range Denition setting. This range
denes the set of data that is distributed in the intervals.
You can dene the number of intervals which will be created within the data range, using the Number of
Intervals setting.
You can set the way data is distributed in chart intervals using the Data Distribution Mode setting.
Mode
Description
Distribution by Values
The range of attribute values is divided into equal-sized ranges. This method
emphasizes the amount of an attribute value relative to other values.
Note
If the data values are clustered instead of being evenly distributed, then
most of the data can exist in one or two ranges and some ranges can
have no data.
410 P UB L I C
SAP BusinessObjects Web Intelligence User's Guide
Reporting data

Distribution by Quartiles
The quartile distribution works well with linearly-distributed data. Because
data is grouped by the number in each range, the resulting chart can be mis
leading. Similar data can be placed in adjacent ranges, or data with widely
dierent values can be put in the same range. This distortion can be mini
mized by increasing the number of ranges.
Note
Data with close values may end up in dierent ranges, thus exaggerating
the dierences between them.
Shapes with values out of range
By default, coloring applies to all values, but you can restrict coloring to a range of values. This is done by
default with the Custom Range Coloring. You can specify a color to values out of range.
Shapes with null or empty values
You can specify a color for shapes with null or empty values to, for example, dene the color of states without
any point of sales.
Data Interval Syntax
In Measure-based Coloring, the chart legend displays a range of data using bracket. You select the preferred
syntax in the Data Interval Syntax.
To declare an interval, you can use the ISO31-11 syntax setting, which uses an inverse bracket to exclude a
value:
[-2..-1[
[-1..3[
[3..5]
However, in the United States, you use the US Syntax setting to replace that bracket by a parenthesis when
excluding values:
[-2..-1)
[-1..3)
[3..5]
If you prefer syntax less mathematical, then you use the Basic Syntax setting:
-2..1
SAP BusinessObjects Web Intelligence User's Guide
Reporting data
P U B L I C 411

1..3
3..5
Measure polarity
Measure-based coloring charts are driven by measure values. The Gradient-based Palette Coloring Using
Measure Polarity coloring method is based on the polarity associated to the measure driving the color and
determines if high values are good, bad or neutral.
The following palettes exist:
Palettes
Description
Ascending polarity The colors indicate that low is bad and high is good, with the rst palette from the
Start Color to the End Color, which is red to green by default.
Descending polarity The colors indicate that low is good and high is bad, with the rst palette from the
End Color to the Start Color, which is green to red by default.
Neutral polarity With this palette, neither low nor high is bad or good. The second palette is from
Start Color to End Color, which are blue to yellow by default.
The default setting, found in the Measure Properties section of the Global chart area settings, for measure
polarity is Automatic, which applies descending polarity.
Related Information
Tag cloud charts [page 393]
Waterfall charts [page 394]
4.3.14.2.1 To congure the measure polarity for Tree Map,
Heat Map, and Tag Cloud charts
You can congure the measure polarity for data interval charts in the Format Chart dialog box.
Procedure
1. In a Web Intelligence document in "Design" mode, right-click the chart and select Format Chart.
2. In the Global section, select Measure Properties.
3. Select a polarity palette for your chart type:
412
P U B L I C
SAP BusinessObjects Web Intelligence User's Guide
Reporting data

Option Description
Chart Type Measures to congure
Tree Map
Rectangle Weight
Rectangle Color
Heat Map
Rectangle Color
Tag Cloud
Tags Weight
Tags Family
4. Click OK to close the Format Chart dialog box.
Note
You can congure other aspects of the Tree Map, Tree Map or Tag Cloud chart in the Palette and Style
tab of the Global section.
Related Information
To manage measure-based coloring in Tree maps, Heat maps and Tag Cloud charts [page 440]
To congure the data interval for Tree Map, Heat Map, and Tag Cloud charts [page 413]
4.3.14.2.2 To congure the data interval for Tree Map, Heat
Map, and Tag Cloud charts
You can congure the data interval for Tree Map, Heat Map, and Tag Cloud charts in the Format Chart dialog
box.
Procedure
1. In a Web Intelligence document in "Design" mode, right-click the chart and select Format Chart.
2. In the Global section, select Palette and Style.
3. Select a Color Palette.
4. If you wish the plot area to have a color, select Use Internal Palette.
5. Select a method from the Coloring Method for Shapes dropdown list.
6. If you are using the either of the gradient-based palette coloring methods, congure the Gradient
Denition.
a. Select one of the following:
SAP BusinessObjects Web Intelligence User's Guide
Reporting data
P U B L I C 413
Gradient Description
3 Colors Allows you to have starting color, a midpoint color and
an ending color.
2 Colors Allows you to have starting color and an ending color.
b. Select the colors and their gradient.
7. To dene the number of intervals within the dened data range, specify a Number of Ranges.
Tip
The best number of ranges is typically 4 or 5. This amount can reveal data patterns without being
confusing. If you have more than 7 colors, data with similar values can be hard to distinguish, and fewer
than four ranges will not reveal much variation and therefore may reveal no clear pattern.
Note
This setting does not apply to the Custom Range Coloring method.
8. To dene a specic range of data to appear in the chart, select the Range Denition checkbox, then enter
the From and To numbers.
Note
This setting does not apply to the Custom Range Coloring method.
9. To set the way data is distributed in chart intervals, select a Data Distribution Mode.
Note
This setting does not apply to the Custom Range Coloring method.
10. To set colors for out-of range value shapes, for the Shapes with Values Out of Range option congure the
following settings:
a. Select either RGBA Color or Gradient.
b. Select a color from the color picker dropdown list and set the opacity.
11. To set colors for null and empty value shapes, for the “Shapes with NULL or Empty Value” option, congure
the following settings:
a. Select either RGBA Color or Gradient.
b. Select a color from the color picker dropdown list and set the opacity.
12. Select a Data Interval Syntax.
13. If you are using the Gradient-based Palette Coloring Using Measure Polarity method, then you need to
congure the Gradient Denitions for Measures with Neutral Polarity option.
a. Select one of the following:
Gradient
Description
3 Colors Allows you to have starting color, a midpoint color and
an ending color.
414 P U B L I C
SAP BusinessObjects Web Intelligence User's Guide
Reporting data
Gradient Description
2 Colors Allows you to have starting color and an ending color.
b. Select the colors and their gradient.
14. If you are using the Custom Range Coloring method, congure the Color zones option.
a. To have the ranges colored by percent instead of increments, select Percent.
b. Enter the minimum and maximum zone parameters.
c. Select a color from the color picker dropdown list and set the opacity.
Tip
In Heat Maps, if you are using the Emboss Eect, you should disable the Light and Shadow Eects in
the Palette and Style subsection.
Related Information
To congure the measure polarity for Tree Map, Heat Map, and Tag Cloud charts [page 412]
Map charts [page 391]
Tag cloud charts [page 393]
4.3.14.3 Warning icons in charts
Warning icons in charts can alert you when there are chart and data object errors.
The warning icons available are:
● General Warnings, icons displayed on the top left corner of the chart.
Red X in a white background: impossible to generate the chart. (This could be due to a cache problem -
try clearing temporary objects from cache.
White X in a red circle: cannot nd the image, the BI administrator should check load balancing settings
and enable service monitoring as described in the Business Intelligence Platform Administrator Guide.
Yellow warning: for example dataset too large (technical limit of the server), need to refresh the dataset,
other cube errors.
Blue alert: limit for optimal rendering
The display of the General Warning icons is controlled by the Hide warning icons in chart setting in the Web
Intelligence document properties. If this setting is activated, then no General Warning icons appear in the
charts.
● An incompatible chart data warning, small yellow warning icon displayed on the data point.
These occur if Show alert when the data is incompatible with the chart is activated in the chart format
options and the dataset is inconsistent with the chart parameters. For example, a warning can appear in a
Pie chart with negative values, negative values for a logarithmic scale, or inconsistent hierarchical values
for a Tree Map.
SAP BusinessObjects Web Intelligence User's Guide
Reporting data
P U B L I C 415

Restriction Denition Result
Technical limits of the data received
from the Visualization Service, which is
responsible for displaying data in the
chart
Max number of rows = 50,000
Restriction
This is a non-congurable
parameter. It is hard-coded into
the product and cannot be
changed by properties of the APS
server in CMC or by manually
changing an XML le.
Only part of the dataset is rendered
and a warning icon appears, as well as
an informational tooltip.
Data restricted for optimal rendering The data is restricted by the chart type
and size for optimal appearance.
An alert icon appears, as well as a
tooltip showing optimization
guidelines.
Related Information
Viewing document properties [page 228]
4.3.14.3.1 To display warning icons in charts
You can allow warning icons to appear in charts and on data points.
Procedure
1. In a Web Intelligence document in Design mode, right-click the chart frame and select Format Chart.
2. In the Global chart area, select the General tab.
3. Select Show alert when the data is incompatible with the chart.
4. Click OK to return to the document.
416
P U B L I C
SAP BusinessObjects Web Intelligence User's Guide
Reporting data
4.3.14.4 To insert and format a chart title
You can activate and set titles in charts in the Format Chart dialog box.
Procedure
1. In a Web Intelligence document in Design mode, right-click the chart frame and select Format Chart.
2. In the Format Chart dialog box, select one of the following:
○ Global Area Display to edit the chart title.
○ Title Design to edit the chart title.
3. Click OK to return to the document.
Related Information
To format a chart [page 409]
4.3.14.5 To display a chart with a 3D look
You can apply a 3D look to a chart.
Procedure
1. In a Web Intelligence document in Design mode, right-click the chart frame and select Format Chart.
2. In the Global chart area, select the Palette and Style tab.
3. Select 3D look or 3D.
Note
Some types of bar charts using bar display eects do not look very attractive if they also use the 3D
look or 3D setting.
4. Click OK to return to the document.
Related Information
To format a chart [page 409]
SAP BusinessObjects Web Intelligence User's Guide
Reporting data
P U B L I C 417

4.3.14.6 Assigning colors to charts
You can personalize the appearance of charts in Web Intelligence reports by assigning colors to dimension
objects manually or by using built-in or customized color palettes. You can retain this color assignment to keep
a color assigned to a dimension object.
When you create a chart in a Web Intelligence report, colors from the default color palette are automatically
assigned to dimension objects in a top-to-bottom order. This order remains the same across sections and
pages. However, the colors you assign using color palettes are not retained when the report is refreshed when
opened, or when you change the number of objects displayed in a chart by ltering or using drill snapshots.
If you want to consistently display a specic object, such as a [Product Line] or [Sales Region], in a specic
color, you can either assign a specic color to the object manually, or assign an in-built or custom color palette
and set the color assignment as default.
When you set the color assignment as default, colors assigned to dimension objects do not change when you
use lters or drill snapshots, or when the report is refreshed when opened. You can reset all colors by applying
a new palette to the chart or by using a dedicated option.
Note
When you turn a chart into another type of chart, the color mapping is maintained only if the following
conditions are respected:
● The legend color for the primary dimension (assigned to Region Type color or Pie color) must be the
same.
● The legend items must be the same ( no adding or removing a primary dimension for the Region
Shape).
Note
You cannot assign colors to dual value axis charts or to charts using Measured-Based Coloring (like Heat
Map, Tree Map and Tag Cloud).
Related Information
To create a custom palette style for charts [page 420]
To assign a color to an object in chart [page 422]
To assign colors to objects in charts using color palettes [page 422]
418
P U B L I C
SAP BusinessObjects Web Intelligence User's Guide
Reporting data
4.3.14.6.1 To select a palette for a chart
You can select a palette for a chart in the Format chart dialog box.
Procedure
1. Open a Web Intelligence document in Design mode.
2. Select or insert a chart.
3. Do one of the following:
○ Right-click the chart area and select Format Chart from the contextual menu. The Format chart dialog
box appears. Select the
Palette and Style tab. From the Color Palette dropdown list ( ),
select a palette style.
○ In the Format tab, in the Chart Style subtab, from the Palette Style dropdown list ( ), select
a palette style.
The chart is displayed with the colors from the selected palette. If the colors are not as you prefer, you can
either select another palette style from the dropdown list, or you can create a custom palette.
Note
In waterfall charts, settings other than Automatic in the Custom Format section of the Format chart
dialog box can override any custom Color Palette settings. To use the Color Palette settings in the
waterfall chart, change all Custom Format settings to Automatic.
Related Information
To edit a custom palette chart style [page 421]
To create a custom palette style for charts [page 420]
To congure the value colors in a waterfall chart [page 423]
SAP BusinessObjects Web Intelligence User's Guide
Reporting data
P U B L I C 419
4.3.14.6.2 To create a custom palette style for charts
You can create a custom palette style based on an existing palette style.
Procedure
1. Open a Web Intelligence document in Design mode.
2. Select or insert a chart.
3. Do one of the following:
○ Right-click the chart area and select Format Chart from the contextual menu. The Format chart dialog
box appears. Select the
Palette and Style tab. From the Color Palette dropdown list ( ),
select Custom.
○ In the Format tab, in the Chart Style subtab, from the Palette Style dropdown list ( ), select
Custom.
The Manage Palettes dialog box appears, with either the default palette or the last palette applied to the
chart selected.
4. Do one of the following:
○ If the currently selected palette is the one from which you want to create a custom palette, click New.
○ If you want to create a palette based on another built-in palette, select that palette and click New.
The Create palette dialog box appears.
5. Enter a palette name.
6. Click a cell in the Color settings area and then select a dierent color from the Color dropdown palette.
7. Set the opacity if necessary.
8. When you have customized the cells, click OK.
The custom palette appears in the Custom section of the Manage Palettes dialog box.
The custom palette you have created will appear in the following places when it is selected for a chart:
○ From the Color Palette dropdown list in the Format chart dialog box.
○ From the Palette Style dropdown list in the Chart Style subtab.
When it is not selected for a chart, you can access it in the Manage Palettes dialog box.
Note
In waterfall charts, settings other than Automatic in the Custom Format section of the Format chart
dialog box can override any custom Color Palette settings. To use the Color Palette settings in the
waterfall chart, change all Custom Format settings to Automatic.
420
P U B L I C
SAP BusinessObjects Web Intelligence User's Guide
Reporting data
Related Information
To edit a custom palette chart style [page 421]
To select a palette for a chart [page 419]
To congure the value colors in a waterfall chart [page 423]
4.3.14.6.3 To edit a custom palette chart style
You can edit custom chart styles.
Procedure
1. Open a Web Intelligence document in Design mode.
2. Select or insert a chart.
3. Do one of the following:
○ Right-click the chart area and select Format Chart from the contextual menu. The Format chart dialog
box appears. Select the
Palette and Style tab. From the Color Palette dropdown list ( ),
select Custom.
○ In the Format tab, in the Chart Style subtab, from the Palette Style dropdown list ( ), select
Custom.
The Manage Palettes dialog box appears, with either the default palette or the last palette applied to the
chart selected.
4. Select the custom palette style that you want to edit and click Edit.
Note
Built-in chart styles cannot be changed, however you can create a palette chart style from a built-in
chart style.
The Create palette dialog box appears.
5. Edit the palette settings as necessary.
6. When you have completed your changes, click OK.
Note
In waterfall charts, settings other than Automatic in the Custom Format section of the Format chart
dialog box can override any custom Color Palette settings. To use the Color Palette settings in the
waterfall chart, change all Custom Format settings to Automatic.
SAP BusinessObjects Web Intelligence User's Guide
Reporting data
P U B L I C 421
Related Information
To create a custom palette style for charts [page 420]
To select a palette for a chart [page 419]
To congure the value colors in a waterfall chart [page 423]
4.3.14.6.4 To assign a color to an object in chart
You can assign custom colors to dimension objects in charts in Web Intelligence reports.
Procedure
1. Open a Web Intelligence document in Design mode.
2. Select a dimension object or a legend item on a chart.
3. In the Formatting tab, in the Style subtab, click the arrow next to the Background Color icon.
4. From the Background Color dropdown list, do one of the following:
○ To assign a pre-dened color, select a color.
○ To assign a custom color, click More Colors, set a color and click OK.
Results
The color is assigned to the dimension object.
4.3.14.6.5 To assign colors to objects in charts using color
palettes
You can assign default or custom color palettes to dimension objects in charts in Web Intelligence reports. You
can retain this color assignment when the report is refreshed when opened, and when you use lters, input
controls, or drill snapshots.
Procedure
1. Open a Web Intelligence document in Design mode.
2. Select a chart.
422
P U B L I C
SAP BusinessObjects Web Intelligence User's Guide
Reporting data

3. In the Formatting tab, in the Chart Style subtab, from the Palette Style dropdown list, select a palette or
click Custom to create a custom palette.
Colors from the palette are assigned to the dimension objects.
4. If you want to retain this color assignment, right-click the chart.
5. Select Series Colors Set as Default Colors .
Results
If you want to clear the color assignment, right-click the chart and select Series Colors Clear Color
Assignment .
Related Information
To create a custom palette style for charts [page 420]
4.3.14.6.6 To congure the value colors in a waterfall chart
You can congure the start, total, negative and positive values in a waterfall chart.
Procedure
1. Open a Web Intelligence document in Design mode.
2. Select or insert a waterfall chart.
3. Right-click the chart area and select Format Chart from the contextual menu.
4. In the Format chart dialog box, select the Palette and Style tab.
5. In the Custom Format section, congure the Fixed Value for any of the following on the waterfall chart:
○ The Start Value Color aects the starting value bar.
○ The Total Value Color aects the nal value bar.
○ The Negative Value Color aects any bars that reect negative values.
○ The Positive Value Color aects any bars that reect positive values.
Note
Settings other than Automatic in the Custom Format section can override the Color Palette settings. To
return to the Color Palette settings, change all of the Custom Format settings to Automatic.
6. When you have completed your changes, click OK.
SAP BusinessObjects Web Intelligence User's Guide
Reporting data
P U B L I C 423
Related Information
To edit a custom palette chart style [page 421]
4.3.14.6.7 Creating a corporate palette for charts
You can dene a corporate palette for charts so that your reports have the corporate style. The palette colors
are dened in the conguration le called VisualizationConfig.xml. You can only dene one corporate
palette, and the palette ID must not be changed.
The default palette contains 32 dened colors. You can dene more colors, but you must dene at least two
colors. You dene a color by dening the strengths of red (R), green (G), blue (B), and the transparency (A).
Example
<COLOR R="200" G="0" B="0" A="255" />
Related Information
Formatting the report layout [page 253]
Formatting your reports using Cascading Style Sheets [page 298]
Formatting tables and table cells [page 327]
4.3.14.6.7.1 Corporate palette conguration le syntax
You can dene a default corporate chart palette.
The corporate chart palette conguration le VisualizationConfig.xml is by default located in the
following location:
C:\Program Files (x86)\SAP BusinessObjects\SAP BusinessObjects Enterprise XI
4.0\images
This le contains the following elements:
<?xml version="1.0" encoding="UTF-8"?>
<CONFIG>
<!-- Rename this file to VisualizationConfig.xml which will activate
a custom default palette. -->
<!-- The following section allows to define a corporate palette
which will be used by default in all new visualization. -->
<!-- TOMCAT must be restarted after each modification of this file --
>
<PALETTES>
<PALETTE ID="corporate">
424
P U B L I C
SAP BusinessObjects Web Intelligence User's Guide
Reporting data

<!-- Add a list of colors so as to define
your palette (default palettes contains 32 colors): R for Red, G for Green, B
for Blue and A for managing the transparency-->
<!-- Each attributes must take an integer
value from 0 to 255 -->
<!-- The palette ID should not be changed.
-->
<COLOR R="200" G="0" B="0" A="255" />
<COLOR R="0" G="200" B="0" A="255" />
<COLOR R="0" G="0" B="200" A="255" />
<COLOR R="0" G="0" B="0" A="255" />
<COLOR R="200" G="200" B="200" A="255" />
<COLOR R="125" G="125" B="0" A="255" />
<COLOR R="0" G="125" B="125" A="255" />
<COLOR R="125" G="0" B="125" A="255" />
</PALETTE>
</PALETTES>
</CONFIG>
Related Information
To dene a corporate palette for charts [page 426]
SAP BusinessObjects Web Intelligence User's Guide
Reporting data
P U B L I C 425

4.3.14.6.7.2 To dene a corporate palette for charts
The BI administrator can use the following steps to dene a corporate palette using the
VisualizationConfig.xml conguration le. This corporate palette will then be used as default for all new
charts.
Procedure
1. In the following directory open the template le: VisualizationConfig.template.xml:
C:\Program Files (x86)\SAP BusinessObjects\SAP BusinessObjects Enterprise XI
4.0\images
2. Dene at least two colors or edit the ones present in the template le.
3. Rename the le: VisualizationConfig.xml and save it in the same directory.
4. Restart Tomcat.
Results
This corporate palette will be used as default for all new charts. Make sure there are no errors in the
conguration le, otherwise the standard palette will be applied.
Next Steps
Tip
Restart Tomcat each time you modify this le.
4.3.14.7 To modify chart borders
You can modify the borders of a chart in the Format Chart dialog box.
Procedure
1. In a Web Intelligence document in Design mode, right-click the chart and select Format Chart.
2. In the Global chart area, select the Border tab.
426
P U B L I C
SAP BusinessObjects Web Intelligence User's Guide
Reporting data

3. Use the settings to format the borders.
4. Click OK to return to the document.
Related Information
To format a chart [page 409]
4.3.14.8 To format the chart background
You can format the background colors, grid colors, opacity, line type and transparency of charts.
Context
Note
The Tree Map, Tag Cloud, and Heat Map charts do not have background conguration options.
The options available vary depending on the type of chart.
Procedure
1. In a Web Intelligence document in Design mode, right-click the plot area and select Format Chart Plot Area
or Format Chart.
2. In the Plot Area chart area, select the Background tab.
3. In a 3D chart, you can show or hide the grid oor and edges.
4. Select a Grid and Background style:
○ Plain background
○ Background Color (refers to the background of the plot area)
○ Category Axis Grid Color (refers to the lines that are parallel to the category axis)
○ Value Axis Grid Color (refers to the lines that are parallel to the value axis)
○ Depth Grid Color (in a 3D chart, it refers to the lines parallel to the Value Axis Grid Color.
○ Striped Background (it shows alternate colors, instead a grid. The striped background option may not
be available depending on the chart type, as in the case of Pie and 3D charts.
○ If you want the plot area lines to be dashed, select Dashed Lines.
Note
Grid options slightly dier depending on the chart type.
SAP BusinessObjects Web Intelligence User's Guide
Reporting data
P U B L I C 427
5. Click OK to return to the document.
Related Information
To format a chart [page 409]
4.3.14.9 To modify plot area settings in Waterfall charts
You can activate or deactivate a reference line and set the spacing between objects in the Waterfall chart plot
area.
Procedure
1. Right-click in the Waterfall chart.
2. Select Format Chart.
3. In the Format Chart dialog box, select the Plot Area chart area.
4. In the Design tab, select Reference Line.
5. To set the spacing between plot area items, enter or select a number for the Relative Spacing between
Items.
6. Click OK or Apply.
Related Information
To format the chart background [page 427]
4.3.14.10 To show and format chart legend
You can format the chart legend in a report.
Procedure
1. In a Web Intelligence document in Design mode, right-click the chart legend and select Format Legend.
2. In the Format Chart dialog box, for the Legend chart area, select the Design tab.
428
P U B L I C
SAP BusinessObjects Web Intelligence User's Guide
Reporting data

3. You can make the legend visible or not, adjust the symbol size, position and layout, group by dimension,
adjust the text settings and border and background settings.
4. In the Title tab, you set the legend title settings, such as: Automatic Title or Custom Title. Custom Title
allows you to dene a formula to be used for the Legend title.
5. Click OK to return to the document.
Results
Tip
In the Global chart area, in the Area Display tab, you can display or hide the legend and legend title.
Related Information
To format a chart [page 409]
Formulas in chart elements [page 408]
4.3.14.11 To reverse the legend order in stacked column
charts
By default, the legend for stacked columns charts are in the reverse order of the stacks.
Context
It is possible to reverse the legend order of the chart so that the legend is in keeping with the stacks.
Note
This setting is only available for Stacked Column charts and 100% Stacked Column charts
Procedure
1. In Design mode, right-click the chart legend you want to edit.
2. Click Format Chart Legend.
3. Check Reverse legend order.
SAP BusinessObjects Web Intelligence User's Guide
Reporting data
P U B L I C 429

Results
The legend order has been reversed.
4.3.14.12 To avoid page breaks in charts
You can restrict page breaks in charts.
Procedure
1. In a Web Intelligence document in Design mode, right-click the chart frame and select Format Chart.
2. In the Global chart area, select the Layout tab.
3. Select Avoid page breaks in chart or Avoid page break. These options can be selected for both horizontal
and vertical breaks.
4. Click OK to return to the document.
Related Information
To format a chart [page 409]
4.3.14.13 To congure a stacked bar or column chart
In a stacked chart, the measure data is stacked in bars or columns. Stacking is done axis by axis and you can
choose which data to stack. In a 100% stacked chart, the data is displayed as percentage parts of a whole, or
100%, of a bar or column.
Context
Note
Only charts with value axes can be stacked.
430
P U B L I C
SAP BusinessObjects Web Intelligence User's Guide
Reporting data

Procedure
1. In a Web Intelligence document in Design mode, add a stacked bar or column chart.
2. Right-click the chart and select Format Chart from the contextual menu.
3. In the Value Axis chart area:
○ Select the Design tab. Under Stacking, select one of the following:
Option
Description
Unstacked Select this option to unstack all dimensions and meas
ures in the chart.
Stacked Chart Select this option if you only want to slice one dimen
sion by another. For example, in a chart containing reve
nue per state and year. Measures are not stacked.
Globally Stacked Chart Select this option stacks the dimensions and measures
in one stack per bar or column.
○ Select 100% Stacked Chart if you want to measure multiple series as a proportion vs. time, or if you
have three or more data series and want to compare distributions within categories, and at the same
time display the dierences between categories. Each bar represents 100% of the amounts for that
category.
4. In the Plot Area chart area, if you are conguring a 100% stacked chart, and want bars or columns with
zero values to be at against the value axis, select Flatten zero values.
5. Click OK to close the Format Chart dialog box.
Related Information
To format the category or value axis title [page 432]
To format the chart background [page 427]
To format axis grid values, numbers and text [page 435]
To show a specic range of axis values [page 432]
To display the Value Axis logarithmically [page 433]
Linear and logarithmic axis scales [page 433]
To show and format chart legend [page 428]
SAP BusinessObjects Web Intelligence User's Guide
Reporting data
P U B L I C 431

4.3.14.14 To format the category or value axis title
You can format the title of a category or value axis in a chart.
Procedure
1. In a Web Intelligence document in Design mode, right-click the chart frame and select Format Chart.
2. In the Category Axis or Value Axis chart area, select the Title tab.
3. Edit the title settings, which include:
○ Title lable and visibility
○ Layout spacing
○ Text formatting
○ Borders and the background
4. Click OK to return to the document.
Related Information
To format a chart [page 409]
4.3.14.15 To show a specic range of axis values
You can specify a range of values in a chart axis.
Procedure
1. In a Web Intelligence document in Design mode, right-click the chart frame and select Format Chart.
2. In the Value Axis chart area, select the Design tab.
3. Under Scaling, to set the Minimum Value and the Maximum Value, select Fixed Value, then enter a value.
Note
Overscaling is a specic display that indicates that a bar is incomplete. Its value is out of the axis
Max/Min values.
4. Click OK to return to the document.
432
P U B L I C
SAP BusinessObjects Web Intelligence User's Guide
Reporting data
Related Information
To format a chart [page 409]
4.3.14.16 Linear and logarithmic axis scales
Linear scales are based on addition. Logarithmic scales allow you to examine values that span many orders of
magnitude without losing information on the smaller scales.
By default, the application displays the Value axis on charts as a linear scale. In a linear scale, the axis markers
are evenly spaced.Consider, for example, the linear sequence: 1, 3, 5, 7, 9. To get the next number in the
sequence, you add 2 to the previous number.
You can set the axis to a logarithmic scale. Logarithmic scales are based on multiplication rather than addition.
In a logarithmic scale, the steps increase or decrease in size. Logarithmic scales are based on multiplication (or
division). Consider, for example, the logarithmic sequence: 2, 4, 8, 16, 32
To get the next number in the sequence, you multiply the previous number by 2. We can say that this sequence
represents ``base 2.''
Consider the following sequence: 1, 10, 100, 1000, 10000.
This sequence represents ``base 10,'' because you get the next term in the sequence by multiplying the
previous term by 10.
4.3.14.16.1 To display the Value Axis logarithmically
You can change the Value Axis to appear logarithmically in a chart.
Procedure
1. In a Web Intelligence document in Design mode, right-click the chart frame and select Format Chart.
2. In the Value Axis chart area, select the Design tab.
3. Under Scaling, select Logarithmic for Axis Scaling.
A logarithmic scale uniformly presents percent changes rather than point changes. In other words, the
distance from 1 to 2 (100% increase) is the same as the distance from 2 to 4 (another 100% increase).
4. Click OK to return to the document.
SAP BusinessObjects Web Intelligence User's Guide
Reporting data
P U B L I C 433

Results
Note
You cannot represent negative values on a logarithmic scale. If you have selected Show alert when the data
is incompatible with the chart option in the chart format options, a small yellow warning icon will appear on
the data point if there is negative data.
Related Information
To format a chart [page 409]
Linear and logarithmic axis scales [page 433]
To display warning icons in charts [page 416]
4.3.14.17 To assign axis labels to data values
You can assign labels to an axis in charts.
Procedure
1. In a Web Intelligence document in Design mode, right-click the chart frame and select Format Chart.
2. In the Global chart area, select the Data Values tab.
3. Select Data label displaying mode.
4. Select the appropriate Data Type.
5. You can also change the other data value settings on this page, like Automatic Hiding Mode and font,
border, line and background settings as necessary.
6. Click OK to return to the document.
Related Information
To format a chart [page 409]
To show or hide data values [page 442]
434
P U B L I C
SAP BusinessObjects Web Intelligence User's Guide
Reporting data
4.3.14.18 To format axis grid values, numbers and text
You can format the value and category axis settings.
Procedure
1. In a Web Intelligence document in Design mode, right-click the chart frame and select Format Chart.
2. In the Category Axis or Value Axis chart area, select the Design tab and format settings in the following
sections:
○ Under General, you can select that the axis is visible.
○ Under Layout, you can display the axis, show labels, change the orientation, adjust the legend layout,
automatically reduce the font size of labels displayed in grid, reverse order on the category axis, set the
axis label delete mode and show continuous axis layout.
Note
By default the Value axis is the Y axis and the Category axis is the X axis. If you reverse the order of
the chart, the X,Y relationship is broken. The horizontal line remains the X axis and the vertical axis
remains the Y axis.
To set the legend layout, select Adjust Layout and congure the following options for the layout width
and height:
Option
Description
Automatic Select Automatic so that the legend width or height is
automatically adjusted to the size of the legend con
tents.
Note
The width adjusts as much as possible, however if
the legend items are long, they can disappear from
the legend cell.
Fixed
Select Fixed to manually set the height or width of the
legend cell.
Proportional Select Proportional to have the legend cell height or
width appears relative to the size of the chart. You ex
press this size as a 0.x value, where 0.2 means that the
legend cell height will appear as 20% of the actual
chart.
○ Under Color Options, you can set the Axis Color (the category axis line), Grid Color (the grid around the
category axis labels) and Grid Background Color (which refers to the category axis labels).
○ Under Text, you can choose the font settings, text alignment, and the text policy (Wrap, No Wrap or
Truncate).
SAP BusinessObjects Web Intelligence User's Guide
Reporting data
P U B L I C 435

Note
○ To force the display of a long chart title when No wrap has been selected and the title is longer
than the chart width, activate Force to Display .
○ The legend size, controlled by the Adjust Layout option, can be determined manually or
automatically adjusted depending on the chart size and legend items length for optimal
readability. If you select the No Wrap option while the Layout Width is Automatic, the legend
width will be adjusted to the legend item length as much as possible when the chart size is
small; however long items will be hidden.
○ Under Number, select the pattern you want for chart numbers.
3. Click OK to return to the document.
Related Information
To format a chart [page 409]
4.3.14.19 To unlock a value axis in a dual axis chart
In a chart that uses dual axes, the chart normally has axes that are locked and synchronized to the same origin.
Context
In some data series where one axis has positive values and another data series has both negative and positive
values, the chart results can appear at. In this case, you can unlock the axes so that each has its own grid and
origin, and the minimum and maximum values share one axis, each according to its data context.
Procedure
1. In a Web Intelligence document in Design mode, right-click the chart frame and select Format Chart.
2. In the Value Axis 2 chart area, select the Design tab.
3. Under Scaling, select Unlock the Axis.
Results
When the axes are unlocked, the second value axis is freed from the grid.
436
P U B L I C
SAP BusinessObjects Web Intelligence User's Guide
Reporting data

Note
In a XI 3.1 document migrated to BI 4.1 SP 4 or greater, value axes are automatically unlocked.
Related Information
Linear and logarithmic axis scales [page 433]
To format axis grid values, numbers and text [page 435]
To assign axis labels to data values [page 434]
To show a specic range of axis values [page 432]
4.3.14.20 To hide an empty chart
Sometimes charts display no values. For example, if sales of a specic product are discontinued, a chart that
normally displays results for that product will appear empty. By default, the application displays such empty
charts on reports. If wished, you set the application to hide charts whenever they are empty.
Procedure
1. In a Web Intelligence document in Design mode, right-click the chart frame and select Format Chart.
2. In the Global chart area, select the General tab.
3. In the Display section, select one of the following:
○ Select Hide always to hide the chart.
○ Select Hide when empty to hide the chart when it is empty.
○ Select Hide when following formula is true and type a formula in the box to hide the chart when the
formula is true.
4. Click OK to return to the document.
Related Information
To format a chart [page 409]
SAP BusinessObjects Web Intelligence User's Guide
Reporting data
P U B L I C 437
4.3.14.21 To exclude zero values in charts and tables
In charts and tables, you can exclude zero values from the displayed data.
Context
If a chart or table has zero values, you can choose to remove them from the visible output. You can also have
hidden items that have zero values.
If you deactivate either of the zero value options:
● In a chart, there are no items.
● In a table, if the values in a column or row for an item equal zero, the column or row does not appear.
Procedure
1. In a Web Intelligence document in Design mode, right-click the chart or table frame and select Format
Chart or Format Table.
2. Do one of the following:
○ For a chart, in the Global chart area, select the General tab.
○ For a table, select the General tab.
3. Select the following Display options as required:
Option
Description
Show rows for which all measure values =
0
In vertical and cross tables, to suppress rows where all measure values
are equal to zero.
Show rows for which the sum of measure
values = 0
In vertical and cross tables, to suppress rows where the sum of the meas
ure values is equal to zero.
Show columns for which all measure val
ues = 0
In horizontal and cross tables, to suppress columns where all measure
values are equal to zero.
Show columns for the sum of measure
values = 0
In horizontal and cross tables, to suppress columns where the sum of the
measure values is equal to zero.
Show measure values where values = 0 In charts, to suppress a chart item if its measure values are equal to zero.
Show measure values for which the sum
of values = 0
In charts, to suppress a chart item where the sum of its measure values is
equal to zero.
Note
In charts and tables, empty values are considered the same as zero values, and therefore are also
aected by these Display options.
4. Click OK to close the dialog box.
438
P U B L I C
SAP BusinessObjects Web Intelligence User's Guide
Reporting data

4.3.14.22 To specify styles, shadow eects and data markers
for the chart data
You can specify palette and style eects in line, bar, column, line, point, and radar charts.
Context
Note
By default, dual axis charts use two color palettes.
Procedure
1. In a Web Intelligence document in Design mode, right-click the chart frame and select Format Chart.
2. In the Global chart area, select the Palette and Style tab.
3. Congure the following as necessary:
○ In Chart Series Style, select an eect.
○ Select the Color Palette and the percent of transparency.
○ Under Marker, choose symbols, symbol size, symbol palettes, border, border color.
○ Under Light and Shadow Eects, select many light and shadow eects: oset, color, shadow, and 1-
sided shadow.
4. Click OK to return to the document.
Related Information
To format a chart [page 409]
SAP BusinessObjects Web Intelligence User's Guide
Reporting data
P U B L I C 439

4.3.14.23 To manage measure-based coloring in Tree maps,
Heat maps and Tag Cloud charts
The coloring method determines the color of rectangles or tags based on the value of a reference measure.
Procedure
1. In a Web Intelligence document in Design mode, right-click the chart frame and select Format Chart.
2. In the Global chart area, select the Palette and Style tab.
3. Select a coloring method from the Coloring Method for Shapes dropdown list:
Option
Description
Palette Coloring You can dene the number of ranges and the colors are associated automatically
based on the selected palette. You can also dene range denition and the color for
null or empty values.
Gradient-based Palette Color
ing
You can dene a 2- or 3-color gradient associated to the ranges.
Gradient-based Palette Color
ing using Measure Polarity
You can dene a 2- or 3-color gradient associated to Measure with Neutral Polarity.
Custom Range Coloring You can dene the ranges manually and associate the colors by either percentage or
absolute value.
4. If needed, dene a range for the measure values and associate a color to out of range values.
5. Select a color for null or empty values.
6. Dene the gradient for gradient methods or associate a color to each range for the custom method. For
custom range coloring, dene the Maximum and Minimum values of the color ranges. (It is automatic for
other methods)
7. Click OK to return to the document.
4.3.14.24 To format a series of data in a chart
You can adjust the color, color opacity and data label position of pieces or points in Bar, Column, Line, Pie,
Scatter, Bubble, and Point charts.
Procedure
1. Right-click the piece, point, or legend item in a chart that you want to congure and select Format Data
Series from the contextual menu.
Note
This feature is not available for Box plot, Map, Tag cloud or Waterfall charts.
440
P U B L I C
SAP BusinessObjects Web Intelligence User's Guide
Reporting data
2. In the Format Data Series dialog box, select Custom.
Note
At any time you can reset the settings in this dialog box to the application default by selecting
Automatic.
3. Select a color for the data piece or point from the color picker dropdown panel and adjust the opacity
setting as necessary.
4. If you are formatting a Line chart and want to have a thicker line, select a Line Width number.
5. To have a data label appear, in the case where a data label was hidden, or to customize the data label
position, select Show Data Labels.
Note
Unselect this option if you want the data label hidden in the chart.
6. Select one of the following data position options:
For all charts:
○ Select Outside if you want the label outside of the selected chart piece.
○ Select Inside if you want the label inside the selected chart piece.
Note
Data label positioning is not available for Polar, stacked Bar or Column charts.
For all charts except the Pie chart the following options are also available:
○ Select Inside First, Outside Otherwise if you prefer the label inside the selected chart item, but can
allow it to be outside the chart piece if there is not enough room for the label in the item.
○ Select Outside First, Inside Otherwise if you prefer the label outside the selected chart piece, but can
allow it to be inside the chart piece if there is not enough room for the label in the item.
7. Depending on your chart type, you can set the data label alignment when the data position is set to
Outside:
○ If you are working with a Donut or Pie chart, select one of the following data label alignments:
○ Select Side Layout for the data label to appear at the side of the chart block.
○ Select Circular Layout for the data label to appear right next to the chart piece.
○ If you are working with a Line or Point chart, select one of the following data label alignments: Top,
Below, Left, Right.
8. Click Apply to apply your changes and continue to modify the data label changes.
9. Click OK to apply your changes and close the panel.
SAP BusinessObjects Web Intelligence User's Guide
Reporting data
P U B L I C 441
4.3.14.25 To show or hide data values
You can show and hide data values in a chart.
Procedure
1. In a Web Intelligence document in Design mode, right-click the chart frame and select Format Chart.
2. In the Global chart area, select the Data Values tab.
3. Select Data label displaying mode to show the data.
4. You can adjust the settings for various parameters, depending on the chart type. For instance for a pie
chart, select the data type, the data position, border size, background color, etc.
5. Click OK to return to the document.
Related Information
To format a chart [page 409]
4.3.14.26 To resize a chart
You can resize the chart using the mouse or in the Format Chart dialog box.
Procedure
1. In a Web Intelligence document in Design mode, right-click the chart frame and click Format Chart.
2. In the Global chart area, select the General tab.
3. Enter or set the chart width and height in the Width and Height boxes.
4. Click OK to return to the document.
Related Information
To format a chart [page 409]
442
P U B L I C
SAP BusinessObjects Web Intelligence User's Guide
Reporting data

4.3.14.27 To apply a chart style
A chart style is a group of settings stored within a source le.
Context
The chart style is used to manipulate a chart (at several levels - graphic, region, and property) before it is
rendered. Chart styles allow charts to assembled using a set of predened settings which include modern chart
styles (such as anti-alias, gloss, and emboss). Adapted chart styles oer straightforward chart output
customization with pre-settings and themes. They contain the group of settings for a chart including:
layout - the settings that determine how each chart is displayed
chart items (such as the title, the legend, the axes)
chart location (for example, where chart items are placed, if they are visible)
theme - the settings that determine how the chart looks
color palettes, etc.
textures (such as the texture of the background)
shadows
fonts
Note
You can choose among pre-dened color palettes.
When creating a chart, we recommend that you feed it with all needed dimensions; apply the style, then change
the settings to rene the chart format. If you modify a setting before applying a template, you may alter your
modications if these settings are included in the template denition. If that happens, the only way to get them
back is to do an Undo action.
Procedure
1. Open a Web Intelligence document in Design mode.
2. Select an existing chart or create one.
3. With the chart selected, in the Formatting tab, in the Chart Style subtab, select a style from the Format
Chart Style icon dropdown list:
○ Flashy Style
○ Normal Style
○ High Contrast
Related Information
To format a chart [page 409]
SAP BusinessObjects Web Intelligence User's Guide
Reporting data
P U B L I C 443

4.3.14.28 To change the chart type by using Turn Into
You can change the chart type using Turn Into in the chart contextual menu.
Procedure
1. In a Web Intelligence document in Design mode, right-click the table or chart.
2. Select Turn Into from the contextual menu, then More Transformations .
The Turn Into dialog box appears.
3. Click the chart category you want, then click a chart icon.
Edit the chart values as necessary.
4. Click OK.
The selected template is applied to the block and displays the data in the chart type you chose.
Related Information
To format a chart [page 409]
Line charts [page 390]
Bar charts [page 384]
Box plot charts [page 385]
Column charts [page 385]
Geomap charts [page 387]
Map charts [page 391]
Pie charts [page 391]
Point charts [page 392]
Radar charts [page 393]
Tag cloud charts [page 393]
Waterfall charts [page 394]
4.4 Linking to other documents
Document cells can be dened as hyperlinks.
Hyperlinks in cells are similar to the hyperlinks found on the World Wide Web that allow you to open a dierent
web page from the page you are currently viewing.
Restriction
In a Web Intelligence report, if you construct a hyperlink that refers to a web site that cannot be opened in
other websites, you can encounter browser errors.
444
P U B L I C
SAP BusinessObjects Web Intelligence User's Guide
Reporting data

When you click a cell that contains a hyperlink, the target document specied in the link opens. The target
document can be another Web Intelligence document, a site on the world wide web, a PDF, Excel or Word
document, or any resource accessible through a hyperlink.
Hyperlinks can be either static or dynamic. A static hyperlink always links to the same document in the same
way. A dynamic hyperlink can link dierently depending on the data in the document containing the hyperlink.
You can create dierent types of hyperlink:
● A cell where the cell text is the hyperlink text.
● A cell with an associated hyperlink.
● A link to another document in the CMS. Use the Web Intelligence HTML interface for this action. For target
documents that refer to BEx queries or .unx or .unv universes that contain prompts that use Index
Awareness, there are additional parameters to set.
When you create a link using the Web Intelligence HTML interface, the link is dened using the OpenDocument
syntax. If you wish, you can build links manually using OpenDocument. For detailed information on
OpenDocument syntax, see the Viewing Documents using OpenDocument guide.
As well as linking between documents, you can also link report elements in the same report by dening
elements as input controls that lter the values in other report elements.
4.4.1 Cells dened as a hyperlink
When you dene a cell as a hyperlink, the cell text becomes active hyperlink text.
For example, if you dene a free-standing cell containing the text http://www.sap.com as a hyperlink,
clicking the cell takes you to the SAP web page.
This method is best suited for static hyperlinks, where the text in the cell always remains the same and links to
the same resource in the same way.
Note
It is possible to make this type of hyperlink dynamic by using a cell formula to change the cell text based on
report data.
4.4.1.1 To dene a cell as a hyperlink
You dene a cell as a hyperlink in a document in Web Intelligence.
Procedure
1. Open a Web Intelligence document in Design mode.
2. Select or type hyperlink text in a cell.
SAP BusinessObjects Web Intelligence User's Guide
Reporting data
P U B L I C 445

3. Right-click the cell and select Linking Read Contents as Hyperlink .
4.4.2 A hyperlink associated with a cell
When you associate a hyperlink with a cell, you dene a hyperlink that links to the source document when the
cell is clicked.
The cell text itself is not the hyperlink.
This is the recommended method for creating dynamic hyperlinks, for the following reasons:
● It is specially tailored for working with the parameters in dynamic hyperlinks.
● It shields you from the complexity of hyperlink syntax. You dene your hyperlink using a graphical interface
and the hyperlink syntax is generated and managed behind the scenes.
● It allows you to dene hyperlink text that is dierent from the cell text.
4.4.2.1 To add a hyperlink to a cell
You congure a cell hyperlink in the Create Hyperlink or Hyperlinks dialog box.
Procedure
1. Open a Web Intelligence document in Design mode.
2. Right-click a cell and select Linking Add Hyperlink to display the Create Hyperlink or Hyperlinks
dialog box.
3. If you are in the Web Intelligence HTML interface, select the Link to web page tab.
4. Type or paste the hyperlink text into the box.
5. Click Parse.
Any hyperlink parameters appear in the Customize URL parameters area.
Dynamic hyperlinks contain parameters whose values can change. Parameters appear as name=value
parts at the end of the hyperlink after the question mark. For example, the following URL contains one
parameter, reportname, whose value is “products":
http://salesandproductreport/default.asp?reportname=products
Each parameter appears on a separate line with the parameter name on the left and the parameter value
on the right. The static part of the hyperlink, the part without the parameters, appears in the Main section.
6. To supply data from formulas or variables as parameter values, click the arrow next to each parameter
value and select an option.
446
P U B L I C
SAP BusinessObjects Web Intelligence User's Guide
Reporting data
Option Description
Build formula You build a formula in the Formula Editor to supply the formula output as the parameter value.
Select object You choose the object from the list in the Available Objects dialog box to supply its value as the param
eter value.
Note
When you modify a parameter, the full hyperlink syntax changes to reect the modication in the box at
the top of the screen.
7. To add or remove a parameter, modify the hyperlink syntax, then click Parse.
Note
You cannot add or remove parameters directly in the parameter list in the Customize URL parameters
area. You must modify the URL syntax directly.
8. Type the tooltip text in the Tooltip box or build a dynamic tooltip by using the Build formula or Select
variable options.
Option
Description
Build formula You build a formula in the Formula Editor to supply the formula output as the tooltip.
Select object You choose the object from the list in the Available Objects dialog box to supply its value as the tooltip.
The tooltip appears when you hover your mouse pointer over the cell containing the hyperlink.
9. Click the arrow next to Target window to dene how the target URL appears.
Option
Description
Current window The target URL replaces the document containing the hyperlink in the current window.
New window The target URL opens in a new browser window.
10. Click OK to close the Create Hyperlink or Hyperlinks dialog box.
4.4.3 Linking to another document in the CMS
In the Web Intelligence HTML interface, you can link to another document in the CMS using the Create
Hyperlink dialog box.
The link uses the OpenDocument function. The parameters passed to the function are determined by the
choices you make in the dialog box.
You can also work with the OpenDocument function directly by typing the syntax into a cell.
Document instances and values passed to prompts
Hyperlinks supply values to prompts in the target document in two ways:
SAP BusinessObjects Web Intelligence User's Guide
Reporting data
P U B L I C 447

● Passing values directly to prompts.
● Opening a document instance based on passed values.
In the rst case, the hyperlink feeds values directly to the prompts in the target document. In the second case,
the link opens the document instance whose stored prompt values correspond to the values passed by the
hyperlink. When you click on the url, the target document is automaticaly refreshed, even if the Refresh on open
option is deactivated.
It is more ecient to choose a document instance based on passed parameters if the target document is large.
Linking to large documents
When the target document contains a large amount of data, it is more ecient to link to an instance than to
open and retrieve the document with a passed parameter value. You can schedule and pre-retreive multiple
instances with dierent parameter values. This allows the document to be scheduled and pre-retrieved in
advance with dierent parameter values.
When you click the hyperlink, the link opens the appropriate pre-retrieved instance rather than using the
passed value to open the document and retrieve the data.
Example
Linking to a large sales report
In this example you link to a large sales report that retrieves sales by region. The report has a parameter
that allows the user to select the region. There are four regions - North, South, East, and West.
Your source document has a [Region] dimension. You do the following:
● Congure the hyperlink to pass the value of [Region] as a parameter.
● Create four instances of the sales report, one for each value of [Region].
● Schedule these instances for pre-retrieval.
● Congure the hyperlink to open the latest instance whose parameter value matches the value passed
by the hyperlink.
Assuming that the document has a [Region] dimension, the settings are as follows:
Link to document instance setting
Latest value match
Most recent - matching prompt values [Region]
448 P U B L I C
SAP BusinessObjects Web Intelligence User's Guide
Reporting data
4.4.3.1 To link to another document in the CMS
You can set in a document one or more links to other documents in the same CMS.
Context
Note
When the target document refers to a .unx or .unv universe containing an Index Awareness Prompt, or to
a BEx query, there are additional objects to select.
Procedure
1. Open a Web Intelligence document in Design mode.
2. Do one of the following:
Note
The Add Document Link option is only available when a report is edited in Web Intelligence HTML
interface. It is not available in Web Intelligence Applet interface or Web Intelligence Rich Client.
○ Right-click the cell where you want to create the link and select Linking Add Document Link .
○ In the Report Elements tab, in the Linking subtab, select Add Document Link from the Document
dropdown list.
3. In the Create Hyperlink dialog box, Select the Link to a document tab.
4. Click Browse and in the Choose a document dialog box, select the target document, and click Open.
If there are prompts on the document to which you are linking, the Select Prompts panel appears.
5. In the Select Prompts panel, select the prompts that you want to appear and click OK, or if you have no
selections to make, click Cancel.
6. In the Hyperlink Properties section:
○ To ensure that the link uses the full URL path rather than a relative path from the current document,
select Use complete URL path to create hyperlink .
○ To refresh the data of the target document when the hyperlink is selected, select Refresh on open.
○ To link to an instance of the selected document, select Link to document instance, then select an
option from the dropdown list.
SAP BusinessObjects Web Intelligence User's Guide
Reporting data
P U B L I C 449
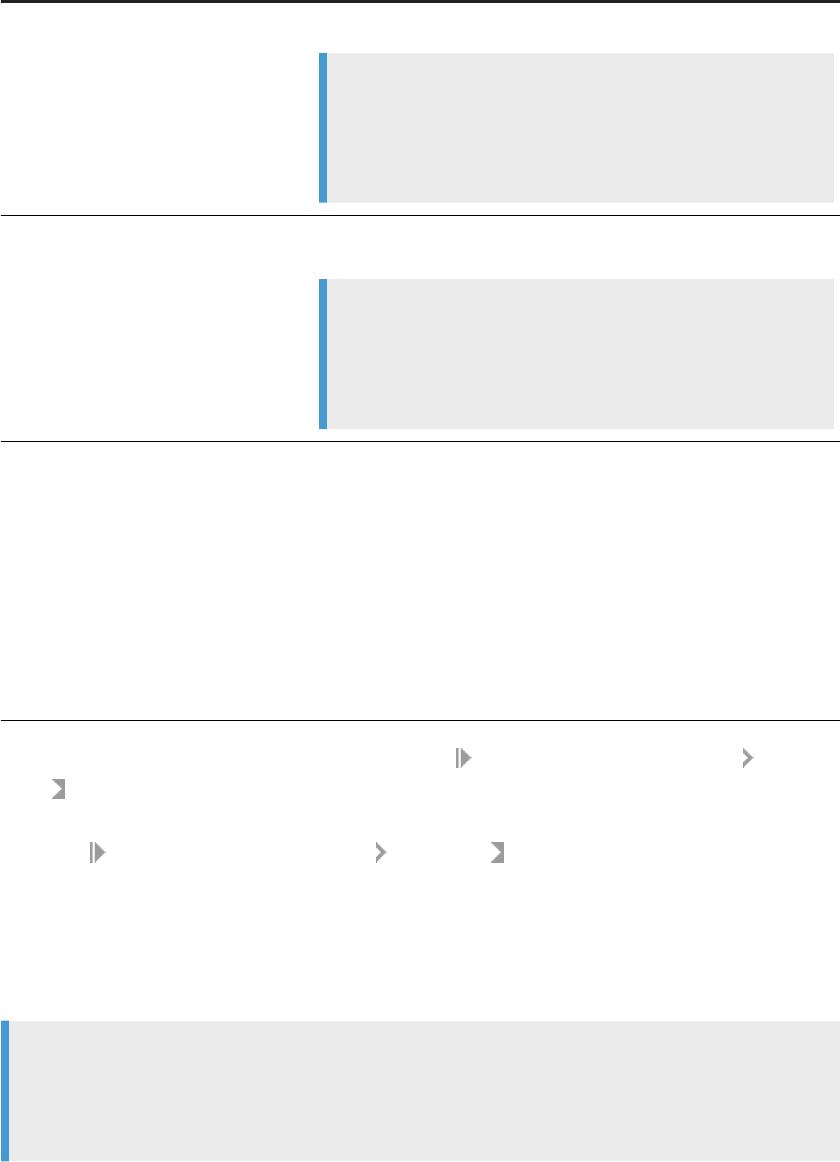
Option Description
Most recent The hyperlink opens the most recent instance.
Note
You cannot specify parameter values in the hyperlink when you
choose this option. The hyperlink does not pass parameter values.
All parameters are set to Use document default and cannot be
modied.
Most recent - current user
The hyperlink opens the most recent instance owned by the current
user.
Note
You cannot specify parameter values in the hyperlink when you
choose this option. The hyperlink does not pass parameter values.
All parameters are set to Use document default and cannot be
modied.
Most recent - matching prompt values
The hyperlink opens the most recent instance whose prompt values
correspond to the values passed by the hyperlink.
This option is useful when you want to link to a large document that
contains prompts.
You must specify at least one parameter value. Without at least one
specied value, the hyperlink returns an error when clicked. The error
occurs because the hyperlink is designed to retrieve an instance based
on parameter values, but no value is provided for comparison against
the instance.
○ If you are linking to a Web Intelligence document, select Target area within the document Report
name
and then the name of the report.
○ To link to a specic part of a report:
1. Select Target area within the document Report part .
2. Click Select.
3. Right-click the report part (for example a table) and select Select this report part.
4. To display only the report part, select Display report part only.
5. To focus on the report part but display the whole report in the target document, select Position at
report part (full document available).
Note
You can create links between report elements by dening a report element as an input control that
lters the values in other report elements. For example, if you have a report containing two tables,
you can lter the values in one table depending on the values selected in the other.
7. In the Customize the look and behavior of the hyperlink section, do one of the following:
450
P U B L I C
SAP BusinessObjects Web Intelligence User's Guide
Reporting data
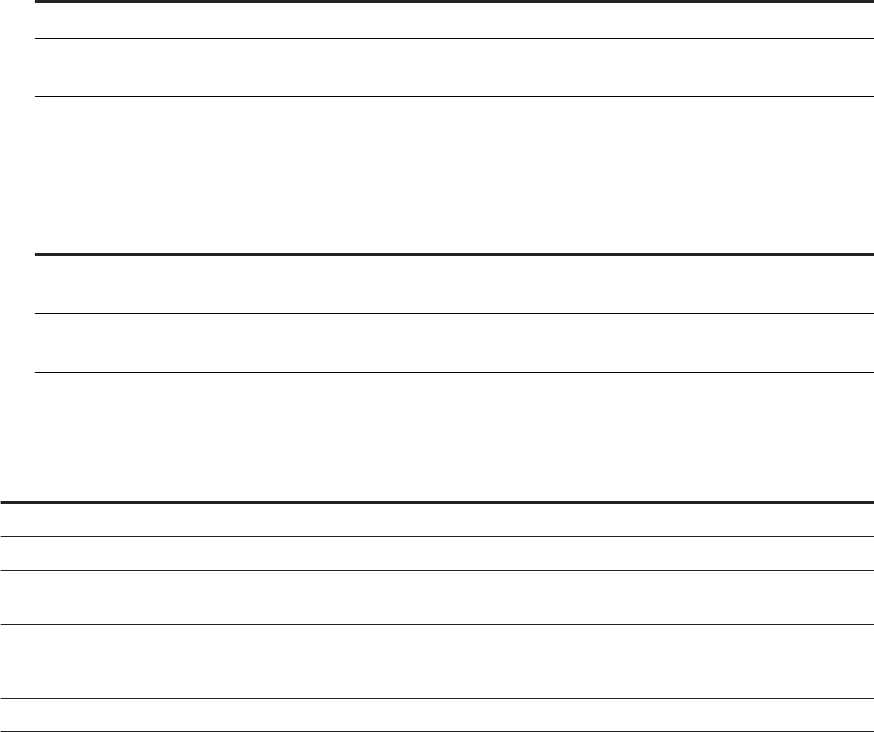
○ Select the format of the target document from the Document format dropdown list. The format of the
document determines which options are available when dening the link. For example, you cannot link
to a report part in a PDF document. For a document referring to a BEx query or a .unx or .unv
universe with a prompt that uses index awareness:
1. Select the key.
2. Click the key dropdown box and select Build formula and type =<objectname>.key(). The
object must not be a variable and the object must have a key.
3. Test that the <objectname>.key() returns the expected results. If the result does not return the
key, ask the universe designer to provide help on how to obtain the key.
○ To dene how the target document opens, select New window or Current window from the Target
window dropdown list.
Option
Description
New window The document opens in a new browser window.
Current window The document opens in the current browser window and replaces the
document containing the hyperlink.
○ Type text in the Tooltip box, or build a dynamic tooltip by using the Build formula or Select object
options. The tooltip will appear when you hover your mouse pointer over the cell containing the
hyperlink.
Option
Description
Build formula You build a formula in the Formula Editor to supply the formula output as
the tooltip.
Select object You choose the variable from the list in the Available Objects dialog box to
supply its value as the tooltip.
8. In the Document prompts section, for each prompt existing in the document, select one of the following
options from the dropdown list:
Option
Description
Build formula You use the Formula Editor to build a formula to pass a value to the prompt.
Select object You select an object whose value is passed to the prompt.
Prompt user at
runtime
The user species a value for the prompt when they click the hyperlink.
Use document default You congure the hyperlink to not pass a parameter to the target document, and the target
document opens with the default value for the prompt. The default value is either the last
value specied for the prompt, or the default specied in the document.
Enter a constant
You enter a constant alphanumeric string that is entered for the prompt.
SAP BusinessObjects Web Intelligence User's Guide
Reporting data
P U B L I C 451
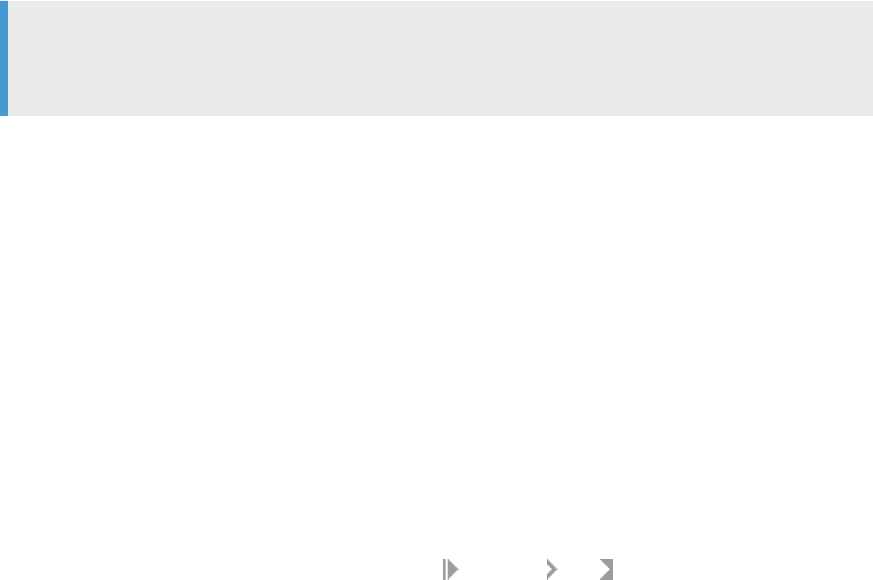
4.4.4 To open a document from a hyperlink
You can set hyperlinks between documents in the Web Intelligence HTML interface.
Procedure
1. Open a Web Intelligence document in Design mode.
2. Hover your mouse pointer over a cell with a hyperlink to display the tooltip, if a tooltip is dened.
Note
The generated syntax of the hyperlink appears in the Formula Bar. Do not modify this syntax directly.
Use the Create Hyperlink dialog box if you need to update it.
3. Click the hyperlink to open the target document.
Depending on how the hyperlink is congured, the target document opens in a new browser window, or it
replaces the current document in the current browser window.
4.4.5 To edit a hyperlink in a cell
You can set hyperlinks in table cells in the Web Intelligence HTML interface.
Procedure
1. Open a Web Intelligence document in Design mode.
2. Right-click the cell containing the hyperlink and select Hyperlink Edit .
3. In the Create Hyperlink dialog box, edit the hyperlink.
4. Click OK to close the Create Hyperlink dialog box.
4.4.6 To delete a hyperlink
You can delete hyperlinks in documents in the Web Intelligence.
Procedure
1. Open a Web Intelligence document in Design mode.
452
P U B L I C
SAP BusinessObjects Web Intelligence User's Guide
Reporting data

2. Select the cell containing the hyperlink and select Linking Remove .
4.4.7 Formatting hyperlink colors
You can dene the colors used to display hyperlinks that have already been clicked (visited hyperlinks).
You can also dene the colors for hyperlinks that have not been clicked (unvisited hyperlinks).
4.4.7.1 To set hyperlink colors
You can set the colors of hyperlinks in documents in Web Intelligence.
Procedure
1. Open a Web Intelligence document in Design mode.
2. Right-click a blank area on the report that contains hyperlinks and select Format Report.
3. In the Format Report dialog box, click the Appearance tab.
4. In the Hyperlink color section, click the arrows next to Visited and Unvisited, then either select a predened
color or click More colors to dene a custom color.
5. Click OK to close the Format Report dialog box.
4.5 Saving and exporting documents, reports and data in
Web Intelligence
Web Intelligence allows you to save or export your documents in a variety of formats.
You can perform the following save and export actions, depending on the version of Web Intelligence you are
using.
SAP BusinessObjects Web Intelligence User's Guide
Reporting data
P U B L I C 453

Application Export as Save as
Web Intelligence HTML interface
CSV
CSV archive
Excel
Excel 2007
PDF
Text
Web Intelligence
Web Intelligence Applet interface
CSV CSV archive
Excel
Excel 2007
PDF
Text
Web Intelligence
Web Intelligence Rich Client
CSV CSV archive
Excel
Excel 2007
PDF
Text
Web Intelligence
Refer to the appropriate topics in this document for instructions on how to save the dierent formats in the
interface you are using.
Related Information
Saving data in a document in a CSV archive zip le [page 460]
To save a document as a text le [page 458]
To save document data in a CSV le [page 459]
To save a document in the corporate repository [page 457]
To save a document as a PDF le [page 456]
To save a document as an Excel spreadsheet [page 455]
Exporting documents, reports or data [page 460]
454
P U B L I C
SAP BusinessObjects Web Intelligence User's Guide
Reporting data

4.5.1 To save a document as an Excel spreadsheet
You can use the Web Intelligence Applet or HTML interface to save a document as a Excel spreadsheet.
Prerequisites
You must modify the Windows registry before you can export images as background or content to an Excel
spreadsheet. See Exporting HTML Code, URLs, and Images to Excel Spreadsheets and PDF Files [page 462].
Context
Note
● When you export a report with charts to an Excel .xls format, the charts are converted to into
embedded images in the Excel le and use only 56 colors. This can have an eect on the nal color and
shading of the images. There are no restrictions on color or shading when you export to an Excel .xlsx
format.
● In the BI launch pad preferences for Web Intelligence, you can congure the appearance of data in Web
Intelligence documents exported or saved as Microsoft Excel les. For more information refer to the
Selecting an Excel format for Web Intelligence documents topic in the Business Intelligence Launch Pad
User Guide.
Restriction
● An Excel .xlsx worksheet can contain up to 1 million rows of exported data. If you save or export a report
to a version of Excel prior to Excel .xlsx, then a new worksheet is started for each 65,000 rows of
exported data.
● Web Intelligence cannot export or save to Excel report tables that exceed 2 million rows.
To save a document as an Excel spreadsheet:
Procedure
1. Open a Web Intelligence document.
2. Do one of the following:
○ If you are in Reading mode, select Save As from the Save icon dropdown list.
○ If you are in Design or Data mode, click the arrow next to Save on the toolbar in the File tab toolbar and
select Save As.
3. Select My Computer, My Desktop, or My Documents in the dialog box and navigate to the folder where you
want to save the document.
SAP BusinessObjects Web Intelligence User's Guide
Reporting data
P U B L I C 455

4. From the Files of Type list, select Excel (.xls) or Excel (.xlsx).
5. Select the reports you want to save as Excel or select Select All to save all reports.
If you save the entire document to Excel, each report within the document is saved as separate worksheet
within the Excel le.
6. To have the layout and formatting of the document matched as closely as possible in the Excel le, select
Prioritize the formatting of the documents.
Tip
This option does not exploit the data processing features of Excel to the same extent.
7. To avoid merging multiple cells into Excel cells as much as possible to exploit the data processing features
of Excel, select Prioritize easy data processing in Excel.
8. Click Save.
In Web Intelligence, all charts are automatically converted to images in Excel.
4.5.2 To save a document as a PDF le
You can use the Web Intelligence Applet interface to save a document as a PDF le.
Context
Note
The table cell formatting Read content as HTML is not supported when exporting a document or report as
PDF. Any table cells with this setting will appear blank in the generated PDF. To obtain the content in PDF,
you need to unselect this property. To do this, right-click in the table cell, select Format Cell, and in the
Display section of the General tab, change the Read contents as to some other value than HTML. The
setting is applied to the entire column.
Procedure
1. Open a Web Intelligence document.
2. Do one of the following:
○ If you are in Reading mode, select Save As from the Save icon dropdown list.
○ If you are in Design or Data mode, click the arrow next to Save on the toolbar in the File tab toolbar and
select Save As.
3. Select My Computer, My Desktop, or My Documents in the dialog box and navigate to the folder where you
want to save the document.
4. In the Files of Type eld, select PDF.
456
P U B L I C
SAP BusinessObjects Web Intelligence User's Guide
Reporting data
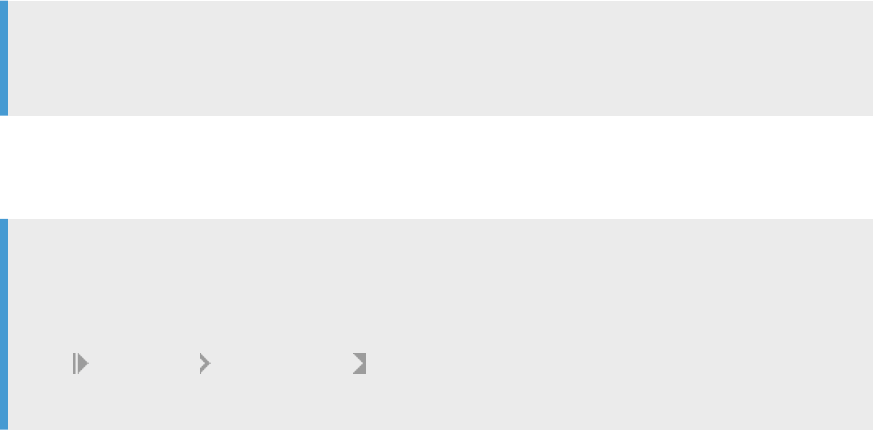
5. Do one of the following:
○ To select specic reports to save, select Select reports, then select the reports from the list.
○ To save the current report and select the pages you want to save, select Current report.
6. Click Save.
4.5.3 To save a document in the corporate repository
You can save a document in the corporate repository.
Context
Procedure
1. Do one of the following:
○ If you are in Reading mode, select Save As from the Save icon dropdown list.
In Rich Client, from the Save Menu icon dropdown list, select Save to Enterprise.
○ If you are in Design or Data mode, click the arrow next to Save on the toolbar in the File tab toolbar and
select Save As.
In Rich Client, select Save to Enterprise from the Save Menu icon dropdown list.
2. Browse the folder in which you want to save the document.
3. Enter a name, a description, and key words.
Click the Advanced button or toggle button to display the Description and Keywords entry elds.
Tip
Use keywords so that you or other users can reuse them and nd documents quicker when doing a
search.
4. If you are using the HTML interface, select the categories you want to associate with the documents in the
Assign Category box.
5. Optional: Check Refresh on open to refresh the document each time it is opened.
Note
When you enable the Refresh on open document property, the document displays the latest
information each time you open the document. The Refresh on open option is dependent on the
following settings in the CMC (congured by the BI administrator):
○ In Applications Web Intelligence , from the Manage list, select Properties. In the Automatic
Document Refresh on Open Security Right Setting section, the property Automatic Refresh security
setting is enabled.
SAP BusinessObjects Web Intelligence User's Guide
Reporting data
P U B L I C 457

○ In Applications Web Intelligence , from the Manage list, select User Security. When you select
a user prole and click View Security, check that the Document - disable automatic refresh on open
security right is disabled.
6. Optional: Check Permanent regional formatting to preserve the document regional formatting with the
document.
7. In Web Intelligence Rich Client:
○ To remove all document security and make the document available in Standalone mode, check Remove
document security.
○ To ensure that the document is not locked by the current user, select Save for all users.
8. Click Save.
Results
The document is saved in the corporate repository.
4.5.4 To save a document as a text le
You can use the Web Intelligence Applet interface to save a document as a text le.
Procedure
1. Open a Web Intelligence document.
2. Do one of the following:
○ If you are in Reading mode, select Save As from the Save icon dropdown list.
○ If you are in Design or Data mode, click the arrow next to Save on the toolbar in the File tab toolbar and
select Save As.
3. Select My Computer, My Desktop, or My Documents in the dialog box and navigate to the folder where you
want to save the document.
4. In the Files of Type eld, select TXT File.
5. Select the reports to save from the Select reports list or select Select All to export all reports.
The export of the report elements depends on the Preferred Viewing Locale you have selected in the BI
launch pad preferences. Some locales, like the English locale, use the left-to-right (LTR) interface
positioning, whereas others, like the Arabic locale, use the right-to-left (RTL) interface positioning.
In an LTR locale, report elements are exported in the following order:
1. Report element position, starting from the upper left corner
2. Left to right, then top to bottom.
In an RTL locale, report elements are exported in the following order:
458
P U B L I C
SAP BusinessObjects Web Intelligence User's Guide
Reporting data

1. Report element position, starting from the upper right corner
2. Right to left, then top to bottom.
Note
○ In page mode, report elements are exported page by page.
○ The exported le in page mode can be dierent from the result in draft mode.
○ The separator used is a tab space.
○ Charts and images are not exported.
○ Export size limit for text le is dened in the Central Management Console. The default value is 5
MB. An error message appears if the size limit is exceeded.
○ If several reports are selected, they are appended one after another in the same text le.
6. Click Save.
Related Information
Interface and document locales [page 50]
4.5.5 To save document data in a CSV le
You can use the Web Intelligence Applet interface or Web Intelligence Rich Client to save document data in a
CSV le.
Context
If you save to a CSV archive le, only the data in the current document is saved into a ZIP le, with each report
in a separate CSV le.
Procedure
1. Open a Web Intelligence document in Design or Data mode.
2. If you are in Data mode, select the query whose data you want to save as a CSV or CSV archive le.
3. In the menu above the Side Panel, select Save as from the Save dropdown list. Select the CSV archive
format.
4. Enter a le name.
5. Choose the text qualier, column delimiter and character set.
Tip
To make the options you chose the default options when saving to CSV, select Set as default values.
SAP BusinessObjects Web Intelligence User's Guide
Reporting data
P U B L I C 459

6. If you are creating a CSV archive le, select the reports you want exported.
7. Click Save.
4.5.6 Saving data in a document in a CSV archive zip le
In Web Intelligence Rich Client and the Web Intelligence Applet interface, you can save document data to the
CSV archive format which generates an archive le (.zip) that contains one CSV le per report.
Each CSV le contains the report data without any headers, footers or charts.
You can congure the following objects:
● Text qualier
● Column Delimiter
● Charset
You can also have all or only some of the reports saved in the CSV archive le.
Example
Contents of a <Document_Name>.zip archive le
<Report1_name>.csv
<Report2_name>.csv
<ReportN_name>.csv
4.5.7 Exporting documents, reports or data
You can select whether you want to export a complete document, reports or raw data in text le, a pdf, an excel
spreadsheet, a .CSV archive or a .CSV le.
Note
The following formats are only available in the HTML interface:
● .PDF
● .TXT
● .XLS
● .XLSX
If you want to export raw data, only the .CSV format is available. You can select whether you want to export all
data or only specic queries.
Except for the text le format, each le type has several settings available when you're in the Export dialog box..
They are detailed in the sections below.
460
P U B L I C
SAP BusinessObjects Web Intelligence User's Guide
Reporting data

PDF le
When exporting in a pdf le, you can decide whether you want to export all reports if you have several reports in
your document, or only the report you are currently viewing. If you decide to export only the report you are
viewing, then it is possible to select whether you want to export:
● All pages
● The current page
● Specic pages, for example pages 10 to 15 only
You can also ne-tune the DPI for images using the Images DPI dropdown list.
Excel spreadsheet
For both .XLS and .XLSX les, you can select between two options:
● Prioritize the formatting of the document
● Prioritize ease data processing in Excel
You can also ne-tune the DPI for images using the Images DPI dropdown list.
CSV le and CSV archive
Note
If you select the .CSV archive format, a .zip le is created with one .CSV le per report.
You can congure the following objects:
● Text qualier
● Column delimiter
● Charset
If you want these options to be the default options when you export to a CSV archive, select Set as default
values.
4.5.8 To export a document
You can export a document to a specic location.
Context
Depending on the interface you are using, available formats may vary.
SAP BusinessObjects Web Intelligence User's Guide
Reporting data
P U B L I C 461

Procedure
1. Click the export icon .
2. Optional: In the HTML interface, select whether you want to export specic reports or data only.
3. Select a format.
Caution
.PDF, .TXT, .XLS, and .XLSX formats are only available in the HTML interface.
4. In the HTML interface, set the dierent options available for the format you have elected and click OK.
To know more about the options available, read Exporting documents, reports or data [page 460].
5. Browse the location where you want to export the le.
6. Give a name to the le you want to export.
7. Click Save.
4.5.9 Exporting HTML Code, URLs, and Images to Excel
Spreadsheets and PDF Files
HTML code, URLs and images contained in Web Intelligence documents can be exported to Excel spreadsheets
and to PDF les.
Exporting HTML Code to Excel Spreadsheets and PDF Files
HTML code contained in Web Intelligence tables and free cells will be exported as text in Excel spreadsheets
and will not be interpreted. In PDF les, HTML code contained in Web Intelligence tables and free cells will not
be exported, if these cells have been formatted to be read as HTML. Else, they will be exported as text without
any interpretation.
Exporting URLs to Excel Spreadsheets and PDF Files
URLs contained in Web Intelligence tables and free cells will be exported as URLs in Excel spreadsheets and
PDF les, if these cells have been formatted to be read as hyperlinks. Else, they will be exported as text.
Exporting Images to Excel Spreadsheets and PDF Files
Images as background or content, that is, cells formatted to be read as image hyperlinks, of Web Intelligence
tables and free cells will be exported as images in Excel spreadsheets and PDF les.
462
P U B L I C
SAP BusinessObjects Web Intelligence User's Guide
Reporting data

However, you must dene the proxy server used by Web Intelligence to export these images.
On Windows
In the Windows registry HKEY_LOCAL_MACHINE\SOFTWARE\SAP BusinessObjects\Suite XI
4.0\default\WebIntelligence\BlobManager subkey, do the following:
1. Create or modify the ResolveHTTPUrl value to yes to have the following line:
"<ResolveHTTPUrl>"=string:"<yes>"
2. Create or modify the PROXY value to <customer-proxy>:<port>, where <customer-proxy> is your
proxy server and
<port> is the port of that server, to have the following line:
"<PROXY>"=string:"<customer-proxy>:<port>"
In the case of the Web Intelligence Rich Client, the BlobManager subkey is to be found in
HKEY_LOCAL_MACHINE\SOFTWARE\Wow6432Node\SAP BusinessObjects\Suite XI 4.0\default
\WebIntelligence.
On UNIX
You need to modify the boconfig.cfg le found in the $installdir/setup folder.
In the boconfig.cfg le, locate the Software\SAP BusinessObjects\Suite XI 4.0\default
\WebIntelligence\BlobManager section and do the following:
1. Create or modify the ResolveHTTPUrl value to yes to have the following line:
"<ResolveHTTPUrl>"=string:"<yes>".
2. Create or modify the PROXY value to <proxy>:<port>, where <proxy> is your client proxy server and
<port> is the port of that server, to have the following line:
"<PROXY>"=string:"<proxy>:<port>"
4.5.10 Autosaved documents
If autosave has been activated by the BI administrator in the Central Management Console (CMC) and if you
have the appropriate security rights, then your documents are saved automatically in the My Favorites/
~WebIntelligence folder as you work.
Autosaved document names consist of the document name prexed by the document ID and followed by the
autosaved document ID. If the document ID is -1, the document was not saved before being autosaved.
Note
Web Intelligence Rich Client does not save documents automatically.
When the autosave feature is enabled, Web Intelligence saves a version of the document you are working on in
the My Favorites/~WebIntelligence folder. This version however is partial and contains references to the
source document. It corresponds to a state of the document at a specic point in time when the document was
autosaved. Do not delete the source le, as opening an autosaved document in the
My Favorites/
SAP BusinessObjects Web Intelligence User's Guide
Reporting data
P U B L I C 463
~WebIntelligence will generate an error if the source document is missing. An autosaved version still needs
the original document in order to be opened, as it contains references to the source document.
Caution
We do not recommend migrating the My Favorites/~WebIntelligence folder as it will not be reusable
after the migration.
The interval at which documents are autosaved is also dened in the CMC. This interval is reset each time you
save a document manually, and each time a document is saved automatically. The autosaved document is also
deleted when you save a document manually.
In addition to regular autosaving, documents are saved when your session times out.
Note
If you lose a document before you can save it, check the folder immediately to see if there is an autosaved
version. The My Favorites/ folder retains autosaved documents until you end the BI launch pad session.
For more information on the settings and security rights that impact automatic saving, refer to the Business
Intelligence Platform Administrator Guide.
Related Information
Management of autosaved documents [page 465]
Recovering autosaved documents [page 464]
4.5.10.1 Recovering autosaved documents
Check the My Favorites/~WebIntelligence folder immediately after restoring the connection for your
autosaved document.
If your session times out while you are working on a document, your document is saved in the My Favorites/
~WebIntelligence
folder and displays a dialog box explaining that the session has ended.
In this dialog box:
● Select Restore to launch a new session and reopen the autosaved document. The next time you save the
document manually, it is saved in its original folder.
● Select Close to be redirected to the home page of the BI launch pad. The autosaved document is available
in the My Favorites/~WebIntelligence folder.
It is not always possible to link to the autosaved document after a server timeout or connection loss. When this
happens, you do not have the option to restore the autosaved document. Documents are regularly deleted
from this folder based on the autosave settings.
464
P U B L I C
SAP BusinessObjects Web Intelligence User's Guide
Reporting data

Related Information
Autosaved documents [page 463]
Management of autosaved documents [page 465]
4.5.10.2 Management of autosaved documents
Documents are autosaved in the My Favorites/~WebIntelligence folder.
As a general rule, autosaving is transparent and you do not access autosaved documents directly.
Note
The My Favorites/~WebIntelligence is not a permanent storage location for autosaved documents,
but it usually lists autosaved documents for a short time. All documents are also deleted from the folder at
an interval dened in the Central Management Console (CMC).
The My Favorites/~WebIntelligence folder has a maximum size limit, which is set in the CMC. When the
total size of the documents in the folder exceeds this limit, the application deletes as many of the oldest
documents in the folder as necessary to make way for the latest document.
If you navigate away from a document in the browser without saving the document, the document is lost and
the contents of the My Favorites/~WebIntelligence folder are cleared.
Related Information
Autosaved documents [page 463]
Recovering autosaved documents [page 464]
SAP BusinessObjects Web Intelligence User's Guide
Reporting data
P U B L I C 465
5 Collaborating and sharing data
5.1 Commenting on report data
You can add one or several comments to your data and manage them via the Side Panel.
There is a variety of elements you can comment on. The table below details the dierent report elements you
can comment on and provides links about how to do it.
Report element
Denition How to
Icon displayed in the top-
right hand corner of the cell
Report A general comment on a re
port or a report section
Make a global comment with
a free cell [page 469]
Section A contextual comment linked
to a specic section of the re
port
Comment on a report section
[page 470]
Table cell A comment specic to a cell
contained in a table
Comment on a cell [page
471]
Report cell A comment specic to a cell
located in the header, body
or footer of the report
Comment on a cell [page
471]
A report block A comment specic to a
chart or a table
Comment on a block [page
471]
Every comment entered for a report or report element can be seen in the Comments pane of the Side Panel. For
comments entered for a report cell, a table cell or a report block, a tooltip shows either the rst or last
comment entered according to the parameter set in the Document Properties when you hover over the icon in
the top-right hand corner of the cell. However, you can see the whole thread in the Comments pane when you
right-click on a report element and select Comments in the contextual menu.
A document that has not been saved cannot contain comments, so make sure to save it rst before you try to
add comments to it. If you save a document using the Save As method, it is possible to save the comments as
well with the Save document with comments option. It is unchecked by default and greyed out if you do not
have the necessary rights to use it.
Caution
● You cannot add comments to a document’s instance. To do so, either use the original document or save
the instance as a new document.
● The comments of a document you copy are not persisted in the instance that you paste.
● When sending a document, the comments are lost and not persisted in the recipient's version of the
document.
● When entering a comment, the text eld is limited to 600 characters (2000 UTF-8 bytes).
466
P U B L I C
SAP BusinessObjects Web Intelligence User's Guide
Collaborating and sharing data

Related Information
To make a global comment with a free cell [page 469]
To comment on a report section [page 470]
To comment on a report section [page 470]
To comment on a block [page 471]
To reply to a comment [page 472]
To delete a comment [page 472]
5.1.1 Comments restrictions and limitations
Depending on how you interact with the report, you might run into limitations regarding the commenting
possibilities.
Commenting in Design mode
The commentary service is only available in Reading mode or Design with Data mode.
Caution
To be able to create a comment cell in Design mode, you must be granted the Reporting - Enable
Formatting security right. If you don't have this right, contact your system administrator.
Commenting in a report header, body, or footer
You cannot comment on a report header, body, or footer. As a workaround, create an empty cell, comment it
and then place it in the header, body, or header of the report.
Database and report desynchronization
To make sure that you are viewing the latest comments entered in the report, refresh the document.
Changing the context on cells that contain comments
If you change the context of a table by changing a column using the Assign Data method or by editing a
measure using the formula editor, comments that were entered for a cell are still displayed in the Comments
pane even though the data have changed.
SAP BusinessObjects Web Intelligence User's Guide
Collaborating and sharing data
P U B L I C 467
As a workaround, delete the column and create a new one with the new measure.
Filters and prompts
When you add a comment to a table cell and apply lters or prompts to the table, the comment cell can
sometimes disappear. That is because the comment is not linked to the ltered result, but to the table cell
itself. If you remove the lters or prompts you have applied, then the comment cell is displayed again.
Hierarchies
If you comment on a cell within a hierarchy, the comment is displayed as long as the hierarchy is expanded. If
you collapse the hierarchy, then the comment disappears.
Drilling
If you comment on a table cell and drill down on the table, the comment disappears. Drill back up to see the
comment again.
Non-aggregated data in tables
You cannot comment on non-aggregated data.
Scheduling documents that contain comments
If you schedule a document several times and modify or delete comments between two sheduling jobs, the
previous instances will reect these modications or deletions. Note that if you add new comments between
two instances, previous instances will only contain the comments that were in the document at the time of the
scheduling job.
5.1.2 Security rights
You need to be granted specic rights by your administrator to manage comments.
You can access the security rights in the Central Management Console in the Folders section.
468
P U B L I C
SAP BusinessObjects Web Intelligence User's Guide
Collaborating and sharing data
Note
These rights are not Web Intelligence specic, they apply to the whole Business Intelligence platform. For
more information, refer the Business Intelligence Platform Administrator Guide.
The table below lists the dierents rights.
Action
Description
Create Comments Enter or reply to a comment
Read Comments Display all the comments in the Comments pane
Read Comments You Own Display only the comments you own in the Comments pane
Edit All Comments Edit comments you have not entered yourself
Edit Comments You Own Edit your comments
Delete All Comments
Delete comments you have not entered yourself.
Caution
The Delete button ( ) does not actually delete com
ments, it only hides them in the interface. The com
ments you delete aren't erased, and still exist in the da
tabase.
Delete Comments You Own
Delete your comments.
Caution
The Delete button ( ) does not actually delete com
ments, it only hides them in the interface. The com
ments you delete aren't erased, and still exist in the da
tabase.
5.1.3 To make a global comment with a free cell
You use a free cell to make a global comment on a report.
Context
A free cell is a cell that can be displayed anywhere on the report page. It is not linked to a report element.
Note
To create a comment using a free cell, you must be in Connected mode.
SAP BusinessObjects Web Intelligence User's Guide
Collaborating and sharing data
P U B L I C 469

Procedure
1. Do one of the following.
○ Right-click anywhere on the report and click Insert Comment .
○ In the Report Elements tab, click Cell Pre-dened Comment .
○ In the Report Elements tab, click Comment Insert Comment Cell .
2. Click on the report page where you want the comment to be displayed.
3. Type a comment in the Comments pane that just opened in the Side Panel.
4. Click OK.
Results
The free cell containing your comment is now displayed on the report page.
5.1.4 To comment on a report section
You can create comments that are related to a specic context of data using section comments.
Context
Sections support contextual comments, meaning that if you create a comment in a section, the comment will
only be displayed in that specic section of the report.
Procedure
1. Do one of the following:
○ Right-click anywhere in the section and click Insert Comment .
○ In the Report Elements tab, click Cell Pre-dened Comment .
○ In the Report Elements tab, click Comment Insert Comment Cell .
2. Click anywhere in the section where you want to insert the comment.
3. Type a comment.
4. Click OK.
470
P U B L I C
SAP BusinessObjects Web Intelligence User's Guide
Collaborating and sharing data

5.1.5 To comment on a cell
As opposed to the free cell that contains general comments on a report or a report section, comments on a cell
are related to a specic cell of your report.
Context
A cell can be a table cell or a report cell, that is in the header, body or footer of the report but not part of table.
Tip
You cannot comment directly on the header, body or footer of a report. As a workaround, create an empty
cell, comment it and then place it in the header, body or header of the report.
Procedure
1. Right-click a cell you want to comment on.
2. Click Comment.
The Comments pane opens up in the Side Panel.
3. Click Add.
4. Click OK.
Results
A yellow ribbon is now displayed in the top-right hand corner of the cell you have just commented on. Hover
over the ribbon to see the comment.
5.1.6 To comment on a block
As opposed to the free cell that contains general comments on a report or report section, comments on a block
are related to a specic block of your report.
Context
A block can be a chart or a table.
SAP BusinessObjects Web Intelligence User's Guide
Collaborating and sharing data
P U B L I C 471

Procedure
1. Click the block you want to comment on.
2. In the Comments pane of the Side Panel, click Add.
3. Enter your comment.
4. Click OK.
Results
An icon is now displayed in the top-right hand corner of the block you have just commented on. Hover over
the icon to see the comment.
5.1.7 To reply to a comment
Context
You can reply to a comment in both Design mode and Reading mode.
Procedure
1. In the Comments pane, click Add Comment.
2. Enter your text.
3. Click OK.
5.1.8 To delete a comment
Context
The delete action does not actually delete comments, it only hides them in the interface. The comments you
delete still exist in the database.
472
P U B L I C
SAP BusinessObjects Web Intelligence User's Guide
Collaborating and sharing data

Note
Make sure that you are granted the necessary rights to delete comments.
Procedure
1. Go the Comments pane in the Side Panel.
2. Click the bin icon ( ) next to the comment you want to delete.
Related Information
Security rights [page 468]
To clean up comments in the database [page 474]
5.1.9 To copy a comment thread
Context
Procedure
1. In the Side Panel, click the Comments pane.
2. Click Copy Comments.
3. Press Ctrl + C or Cmd + C .
Results
The comment has been copied to the clipboard.
SAP BusinessObjects Web Intelligence User's Guide
Collaborating and sharing data
P U B L I C 473

5.1.10 Cleaning up comments from the database
You can delete comments from the database using the CMC.
An option, called Delete all comments older than X days, allows you to schedule a recurrent cleaning operation
in the database. When enabled, comments older than the specic number of days you have entered are
automatically deleted from the database. By default, the option is disabled.
Caution
If you have hidden comments in the interface, a desynchronization can happen between the database and
the Web Intelligence client. In such a case, Web Intelligence displays the cache rather than the updated
content of the database. To make sure that you are viewing the latest comments entered, refresh the
document.
5.1.11 To clean up comments in the database
Context
Procedure
1. On the CMC home screen, click Applications.
2. Click BI Commentary Application.
3. Check Delete comments olders than X days.
4. Enter a number of days after which comments should be deleted.
5.1.12 Displaying a specic comment
You can add parameters to the Comment() function to display a specic comment whenever a cell contains
several comments.
The Comment() function is useful whenever you are in a validation workow and need to display comments
that have been validated. The function only works with empty cells that do not contain data, and you can use it
either with free comment cells or with empty table cells. As a best practice, we recommend creating an extra
column with empty cells in your table dedicated to comments if you intend to use the function with table cells.
After comments have been entered in a cell, all you need to do is pass parameters to the function and assign
them values that are then registered in the database to display the comment that has been validated.
474
P U B L I C
SAP BusinessObjects Web Intelligence User's Guide
Collaborating and sharing data
Here’s how it works: Web Intelligence drills down the database and retrieves every comment that matches a
given value. If several comments match a value given to a parameter, Web Intelligence displays only the rst or
last matching comment according to the preference you have dened in the Document Properties.
The comments database is managed by the administrator, and has four columns that can contain values
assigned to a comment:
● OptionKey1
● OptionKey2
● OptionKey3
● OptionKey4
Make sure that the value you give to comments in the database is in keeping with your validation workow. If
you want to display a comment that has to be reviewed, give it a “Review” or “Check” value for instance.
After you have set the function to retrieve a specic comment, an icon is displayed at the top-right hand corner
of the cell or report block. When you hover over the icon, an icon shows the comment entered for the cell. The
only time this tooltip is not displayed is when you decide to display two comments in a free comment cell and
one of these comments is called via the parameters of the Comment() formula.
Caution
There might be a desynchronization issue between the database and the user interface in cells that contain
several comments and in which you have used the Comment() function. In such cases, the tooltip is
disabled to avoid displaying comments that are not up to date or validated. As a workaround, refresh the
document to make sure that you are viewing the most up to date content.
Example
The table below is an extract of the Comments database and details the content and lifecycle of a specic
comment cell.
Comment ID
Comment Owner Comment Time Stamp OptionKey1
CommentCell 1 Administrator 07/20/2015 14:50:23
CommentCell 1 Spokesman 07/20/2015 16:00:00 Validated
CommentCell 1 Administrator 07/20/2015 16:02:23
CommentCell 1 Administrator 07/20/2015 16:05:14
The content of the cell has been modied several times with dierent comments, but only one of the
comments has been validated by the report owner.
As the document reaches its nal version, you might want to only display comments that have been
validated. Edit the function as follows:
Comment(OptionKey1;Validated)
Web Intelligence will only display the comment that matches the value declared in the function.
To know more about the Comments database and BI Commentary, refer to the Business Intelligence
Platform Administrator Guide.
SAP BusinessObjects Web Intelligence User's Guide
Collaborating and sharing data
P U B L I C 475

5.1.13 Saving a document with its comments
A document that has not been saved cannot contain comments, so make sure to save it rst before you try to
add comments to it. If you save a document using the Save As method, it is possible to save the comments as
well with the Save document with comments option, available in the Save dialog box under Advanced options.
5.2 Using shared elements to share report parts
Shared elements are report elements, for example, tables, charts, headers or footers, that you store in the CMS
repository when you save them. By doing so, you can make them available to you and other report designers so
they can be reused multiple times in other documents.
When you insert a shared element in a document, you copy an instance of the report element that you have
saved as a shared element. Therefore, the shared element inherits the properties and dependencies of the
report element it stems from.
You can manage shared elements from the Side Panel in the Shared Elements pane. Make sure you are
connected to the CMS repository and have the necessary security rights granted.
Note
Shared elements are not supported in SAP HANA Online mode.
Example
Every report of your company displays a header with the name of the company. You recreated that same
header for every new report you designed.
What if you could avoid creating the same header every time? If you save that specic report element as a
shared element, you can then insert it in on the y in every new report you design. This header is now
shared, and your colleagues can use it whenever they design their own reports.
Related Information
To create a shared element [page 478]
To insert a shared element using the toolbar [page 479]
To insert a shared element using the Side Panel [page 479]
Document and shared element synchronization [page 480]
Updating a shared element [page 480]
To update a shared element manually [page 481]
476
P U B L I C
SAP BusinessObjects Web Intelligence User's Guide
Collaborating and sharing data
5.2.1 Shared elements restrictions
To work with shared elements, you must be connected to the CMS repository. Depending on the mode you are
in, several tasks can be disabled.
Shared elements in Connected mode
In Connected mode, Web Intelligence is connected to the CMS repository. There are no restrictions.
Standalone mode
In Standalone mode, Web Intelligence is not connected to the CMS repository, and every action regarding
shared elements is disabled.
Note
You can open a document that is linked to a shared element if it has been saved without security on a local
folder.
Oine mode
In Oine mode, the content accessed in Online mode is still available via a cache. The table below details the
list of restrictions.
Action
Availability
Creating a shared element Not available
Inserting a shared element in a document Not available
Editing shared element properties Not available
Modifying inserted shared elements content in the docu
ment
Available
This does not break the link between the shared element and
the document, except if you delete the report element linked
to the shared element.
Editing shared element content in the CMS Not available
Updating a shared element in the CMS Not available
Removing/Unlinking a linked shared element Available
This breaks the link between the shared element and the
document.
SAP BusinessObjects Web Intelligence User's Guide
Collaborating and sharing data
P U B L I C 477
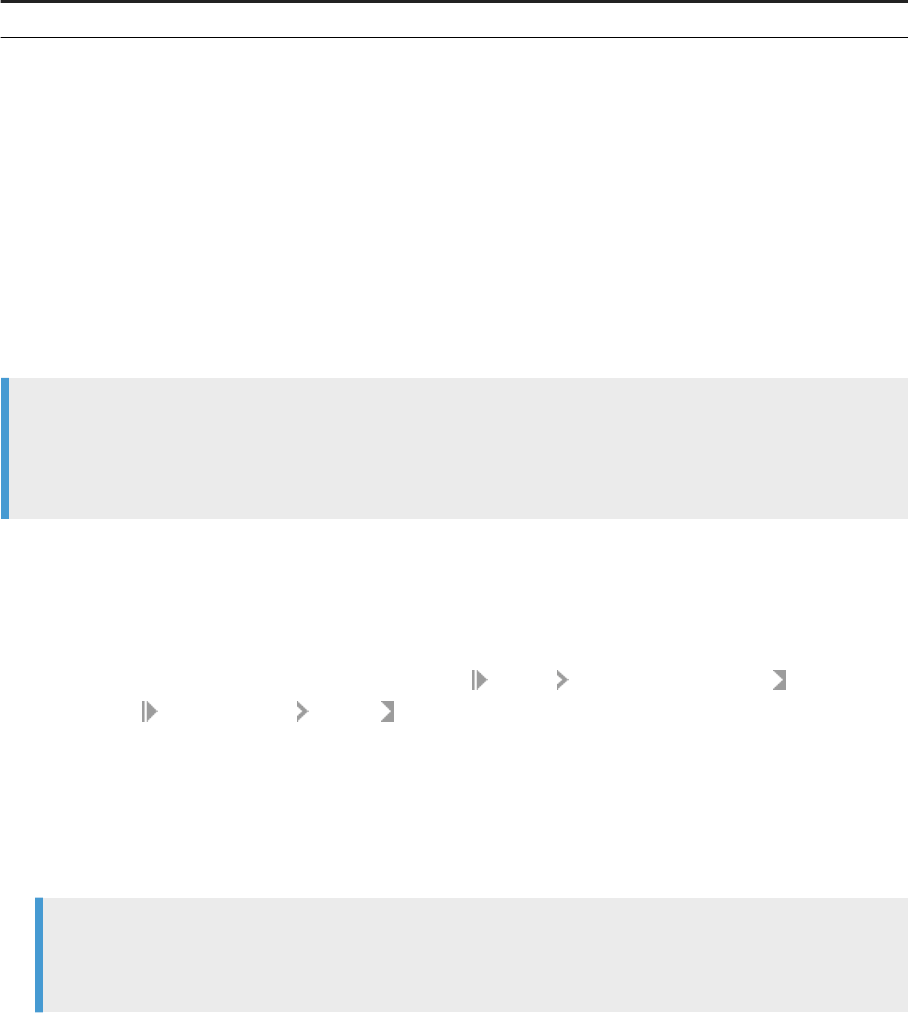
Action Availability
Searching shared elements in the CMS Not available
5.2.2 To create a shared element
Create a shared element whenever you want to share content with other users. When you save a shared
element, it is stored in the CMS repository.
Context
Note
It is not possible to create a shared element based on a custom element, a geomap chart, a comment, a
web service or a text le. Also, we do not recommend that you create a shared element from a cell
containing a comment.
Procedure
1. In Design mode, right-click a report element and click Linking Save as Shared element or in the
toolbar, click Shared Element Save as .
2. Enter a name and a description for the shared element.
3. Browse the location where you want to save the shared element.
4. Optional: If you do not want to keep the format attached to the report element, check Remove format.
5. Assign categories to the shared element.
6. Click Save.
Note
When a report element is created from a document, no link between this document and the shared
element is created. They both remain independent.
478
P U B L I C
SAP BusinessObjects Web Intelligence User's Guide
Collaborating and sharing data

5.2.3 To insert a shared element using the toolbar
Context
When you insert a shared element in a document, a link to the source shared element is created so that Web
Intelligence can check for shared element updates. Removing this link unlinks the document from the shared
element, but the shared element content remains in the document.
Procedure
1. Click Report Element Linking Shared element Insert shared element .
2. Click on the report page where you want the shared element to be displayed.
3. Browse the folder where the shared element is located.
4. Select the shared element.
5. Click Open.
6. Optional: If you are prompted to update the shared element, click OK.
5.2.4 To insert a shared element using the Side Panel
You can use the Side Panel to insert a shared element.
Context
Note
This is only possible in the Web Intelligence Applet interface or HTML interface.
Procedure
1. In the Shared Elements pane in the Side Panel, click Browse to navigate to the location of the shared
element you want to insert and select it.
You can also use the search functionality to type the name of the shared element you are looking for and
access it directly. To do so, click the magnifying glass icon and enter the name of the shared element.
SAP BusinessObjects Web Intelligence User's Guide
Collaborating and sharing data
P U B L I C 479

2. Drag it on the report page and drop it where you want it to be displayed.
In the HTML interface, if you use the search functionality to select a shared element, you cannot use the
drag and drop to place the shared element on the report page. To insert it, right-click it and click Insert.
5.2.5 Document and shared element synchronization
When you insert a shared element in a document, Web Intelligence creates a link between the shared element
and the document. The content of the shared element however is not automatically updated if a new version is
available.
Whenever the shared element is updated in the CMS repository, the document in which the shared element
has been copied is no longer up to date. To make sure that you always use the latest version of a shared
element in your document, update the shared element content in the document.
Note
Only one version of a shared element can be linked to a document.
If you do not want to keep the modications between the latest version of a shared element in the CMS
repository and its copy in a document, to track changes for instance, unlink the shared element from the
document.
Related Information
Updating a shared element [page 480]
To update a shared element manually [page 481]
To unlink a shared element from a document [page 482]
5.2.6 Updating a shared element
Shared elements can have a dierent life cycle than the documents they are linked to.
This can happen in the following cases:
● A shared element has been modied and a new version, more recent than the one used in the document,
has been published in the CMS repository.
● An older version of a shared element has been restored in the CMS repository and is available.
If an update modies the query, a new query is created to avoid the modication of the variables or report
elements that you use in the document. If you update several shared elements, the document may contain
several unused queries. Web Intelligence deletes the unused query to avoid renaming the updated query and
its possible variables if it is not used in the document.
480
P U B L I C
SAP BusinessObjects Web Intelligence User's Guide
Collaborating and sharing data
A dierent version of the shared element exists in the CMS repository
When you open a document that contains one or multiple shared elements, Web Intelligence runs a
background check to know whether the version of the shared element in the document corresponds to the one
stored in the CMS repository.
Note
Make sure that you have enabled the Check for shared element updates on open option in the Document
Properties.
The shared element has been deleted from the CMS repository
An error icon is displayed if a shared element has been removed from the CMS repository or if you do not
have the rights to see it. This icon means that the shared element can no longer be accessed. However, the
references to the shared element in the document are kept.
The version of the shared element in the CMS repository is unknown
If you are not connected to the CMS repository or if the check for new versions has not been performed, an
icon is displayed next to the shared element used in the document.
5.2.7 To update a shared element manually
You can check for new versions of the shared elements contained in your document in order to update them.
Context
Tip
In the Properties tab, enable the option Check for shared object update(s) on open to avoid checking for
updates manually.
Procedure
1. Select a shared element.
SAP BusinessObjects Web Intelligence User's Guide
Collaborating and sharing data
P U B L I C 481

2. In the Shared Elements pane, click Check New Revisions.
An icon is displayed if a new version of the shared element used in the document is available
3. In the Shared Elements pane of the Side Panel, in the Currently Used menu, check the box(es) of the shared
element(s) you want to update.
4. Click Update in the toolbar to update the shared element(s) you have selected.
Results
If an error icon appears after the update process, it means that the shared element(s) you have selected
cannot be found in the CMS repository.
5.2.8 To update a shared element automatically
You can automatically update shared elements each time you open the document by enabling the option
Update shared element(s) on open. As a result, the update icon in the Shared Elements pane is not displayed
since the document already contains the latest revisions of the shared elements.
Procedure
1. In the Properties tab, click Document.
2. Enable the option Update shared element(s) on open.
5.2.9 To unlink a shared element from a document
Unlinking a shared element from a document removes the link between the shared element and the document.
Context
You will not be notied if new version of the shared element is available in the CMS repository.
Note
Unlinking a shared element does not delete its content from the document it was linked to.
482
P U B L I C
SAP BusinessObjects Web Intelligence User's Guide
Collaborating and sharing data
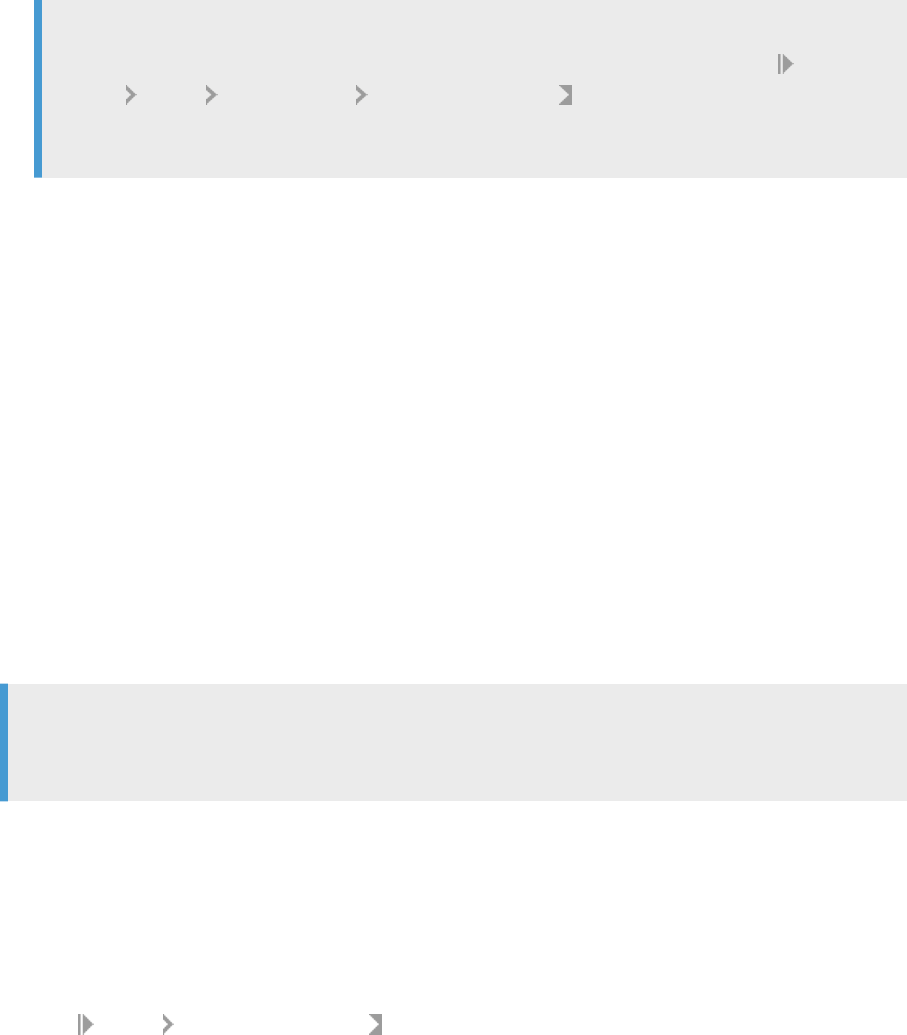
Procedure
1. In the Shared Elements pane in the Side Panel, click Currently Used to display the shared elements linked to
the document.
2. Select a shared element.
3. Click Unlink.
Note
You can also unlink a specic instance of the shared element in the document by clicking Report
Element Linking Shared element Unlink shared element in the toolbar. If there are no instances
of the shared element left in the document or if they have all been unlinked from the document, Web
Intelligence deletes the link between the document and the shared element.
5.2.10 To unlink a specic instance of a shared element from
a document
You can unlink a specic instance of a shared element in a document if has been copied several times. It does
not remove the link of other instances copied in the document.
Context
This is useful when you have inserted a shared element several times in dierent reports of a same document,
for instance.
Note
Do not use the Side Panel to unlink a specic instance of a shared element. It will unlink all the instances
that the document contains.
Procedure
1. On the report page, right-click the shared element you want to unlink.
2. Click Linking Unlink Shared Element .
SAP BusinessObjects Web Intelligence User's Guide
Collaborating and sharing data
P U B L I C 483

5.2.11 To search for shared elements
You can search for shared elements in the CMS repository.
Context
Procedure
1. In the Shared Elements pane in the Side Panel, click the Browse button.
2. Select a folder.
3. Click the magnifying glass icon.
4. Click the drop-down list and select whether you want to search by name (default), keyword or description.
5. Enter your text.
6. Click the magnifying glass to start searching.
5.2.12 To edit the properties of a shared element
You can edit the properties of a shared element in Design mode in the Side Panel.
Context
Make sure you are connected to the CMS repository.
Procedure
1. In the Shared Elements pane in the Side Panel, click Browse.
2. Select the shared element you want to edit.
3. In the toolbar, click Edit.
4. Edit the name, description or keywords of the shared element.
5. Click Save.
Note
The name and the description are saved in the document when you insert the shared element. They are
updated only when there is a shared element update in the document.
484
P U B L I C
SAP BusinessObjects Web Intelligence User's Guide
Collaborating and sharing data
5.2.13 Modifying the content of a shared element linked to a
document
You can modify the content of any linked shared element added in a document without breaking the link with
the given element in the CMS repository, even if these modications introduce dierences between the content
in the document and the shared element.
However, if you update the shared element, its content is replaced by the content of the shared element in the
CMS repository and all your modications are lost.
5.2.14 Editing the content of a shared element in the CMS
repository
To edit the content of a shared element, you must modify its content in a Web Intelligence document in which it
has been copied and then republish it under the same name . The content is then replaced if a shared element
with the same name already exists in the CMS repository. The last modication date of the shared element is
automatically updated.
The description of the shared element is not updated automatically. However, you can modify the content of
the description.
Related Information
To create a shared element [page 478]
SAP BusinessObjects Web Intelligence User's Guide
Collaborating and sharing data
P U B L I C 485
6 Analyzing data
6.1 Introduction to data analysis
Data analysis is a crucial process that consists of inspecting your data to nd useful information and take
decisions.
To analyze your data, you have to break each component apart to get an understanding of why they give such
results when put together. The underlying structure and variables of your data set provide you with an
investigation plan and valuable insights.
Depending on the insight you are trying to gain from your data, you can use several methods of analysis such
as drilling or ltering. These methods enable you to dig into your data and extract key messages that back up
the decision you are going to take and help you decide what the next step is.
The following sections provide you with information on the several methods of data analysis, as well as how to
use functions and calculations.
6.2 Drilling on report data
Drilling on reports lets you look deeper into your data to discover the details behind a good or bad summary
result displayed in tables, charts, or sections.
Restrictions
Restriction
Description
Queries on BEx queries You cannot use a Navigation path on BEx queries. Navigation path (previ
ously called the drillpath) has been replaced by the collapse/expand work
ow on the real hierarchy.
Queries on .unv and .unx universes You can only drill on a .unv or .unx universe if the drill paths are previ
ously dened in the universe.
Example
Why did sales of accessories, outwear, and overcoats rise in Q3?
You work for a US national fashion retail chain, and are in charge of sales of accessories, outerwear and
overcoat clothing lines in western states. You see that revenue is much higher for Q3 than the other
quarters. To understand why, you drill down to look at the factors behind the result and you see that jewelry
sales were much higher in July.
486
P U B L I C
SAP BusinessObjects Web Intelligence User's Guide
Analyzing data

6.2.1 Retrieving more levels of data to the report
When you are drilling a report, you may want to drill up or down to a dimension that lies outside the scope of
analysis dened for the document.
Returning the additional data requires running a new query that includes the additional dimensions you specify.
This is called extending the scope of analysis.
You can extend the scope of analysis during your drill sessions only if your security prole allows you to do so.
Your security prole is controlled by the BI administrator.
If your drill options are not set to display the Extend the Scope of Analysis prompt message during drill, you will
not be given the option to select lters if you drill beyond the data already available in the document. In this
case, the new query runs automatically and returns data for all the values on the dimensions you are drilling.
Note
If you plan on drilling out of scope on a Geomap chart, make sure that every additional dimension you
specify is matched with a location. If no location is indicated, the additional dimensions will not show on the
map.
6.2.1.1 To drill out of the scope of analysis
You can create an additional query for a document that returns additional data to the document and adds to
the table data for the dimension on which you drilled.
Procedure
1. Open a Web Intelligence document in Reading or Design mode.
2. In the Analysis tab, in the Interact subtab, select Start Drill from the Drill dropdown list.
3. Hold your mouse cursor over a dimension value that is at the end of the scope of analysis.
A ToolTip informs you that a new query is necessary to return the additional data to the document.
4. Drill on the dimension.
If your drill options are set to prompt you when a drill action requires a new query, the Extend the Scope of
Analysis dialog box appears.
The dialog box lists the dimensions in the hierarchy above and below the drilled value. The dimensions
already included in the document are checked. The dialog box also displays the lters that you can select
to lter the new query.
5. Select the check boxes next to the dimensions you want to drill.
6. Select the check boxes next to the lters you want to use to lter the query.
7. Click OK.
SAP BusinessObjects Web Intelligence User's Guide
Analyzing data
P U B L I C 487

6.2.2 Drill paths and hierarchies
When you analyze data in drill mode, you move along a drill path.
These paths are based on the dimension hierarchies set by the designer of the universe. Universe designers
organize objects in classes in a hierarchy with the summary objects at the top and the most detailed at the
bottom. So if you want to make a high-level report, you know that your query should include objects at the top
of the list. If you want to see more detailed information, you can then switch to Drill Mode and drill down on
each dimension value displayed in the reports.
For example, if the data from [Quarter] did not suciently explain a result, you could drill down to [Month] or
[Week], depending on how the universe designer set up the hierarchy. When you drill to a dierent level,
measures, such as a [Revenue] or [Margin], are recalculated accordingly.
Drill paths usually follow the same hierarchy order as the classes on a universe. For example, a class called
Time typically includes the [Year] dimension at the top of the class, followed by the [Quarter], [Month], and
[Week] dimensions. The hierarchies for drill within the Time hierarchy typically follow the same order, because
users want to drill annual results to analyze details for quarter, month, and so on. However, the universe
designer can also dene custom hierarchies.
Note
A dimension can belong to several hierarchies. When you drill a result on a dimension that belongs to more
than one hierarchy, you must answer a prompt to select the drill path.
6.2.2.1 To view drill hierarchies
You can view drill hierarchies in a data provider.
Procedure
1. Open a Web Intelligence document in Data or Design mode.
2. In the Data Access tab, in the Data Providers subtab, click Edit.
3. In the Query Panel, underneath Universe Outline, select Display by Navigation Paths from the Master
Perspective dropdown list.
6.2.3 Prompt when drill requires additional data option
When you drill the results displayed on a report, you may want to drill to higher- or lower-level information that
isn’t included in the scope of analysis for the document. A new query is required to retrieve this data.
Since queries on large selections of data may take a long time to be completed, you can choose to be
prompted with a message every time a new query is necessary. The prompt message asks you whether you
want to run the additional query or not. In addition, the prompt lets you apply lters to the extra dimensions
488
P U B L I C
SAP BusinessObjects Web Intelligence User's Guide
Analyzing data
you include in the new query. This means you can restrict the size of the query to only the data necessary for
your analysis.
You need permission from the BI administrator to drill out of the scope of analysis.
Related Information
Setting the scope of analysis [page 89]
Retrieving more levels of data to the report [page 487]
6.2.4 Setting drill options
Before you begin a drill session, you can set your drill options to specify how reports will change each time you
drill.
How you set the drill options depends on the interface you are using:
● BI launch pad, if you are using the Web Intelligence HTML or Web Intelligence Applet interface.
● Your computer, if you are using Web Intelligence Rich Client from the BI platform deployment on your
computer.
Related Information
To set drill options in the BI launch pad [page 489]
To set drill options in Web Intelligence Rich Client [page 490]
Synchronize drill on report blocks option [page 490]
Hide Drill toolbar on startup option [page 491]
Start drill session on existing report option [page 491]
Start drill session on a duplicate report option [page 491]
6.2.4.1 To set drill options in the BI launch pad
You can congure drill options for Web Intelligence in the BI launch pad preferences.
Procedure
1. In the BI launch pad, click Preferences.
SAP BusinessObjects Web Intelligence User's Guide
Analyzing data
P U B L I C 489

2. In Web Intelligence section, select the drill options under Drill options and Start drill session.
6.2.4.2 To set drill options in Web Intelligence Rich Client
You can congure drill options in a document.
Procedure
1. With a document open in the Web Intelligence Rich Client, click Properties Application .
2. If no document is open in the Web Intelligence Rich Client, click Tools, and select Options from the menu in
the top corner next to the help menu to display the Options dialog box.
3. Select the Drill tab.
4. Select the drill options.
6.2.4.3 Synchronize drill on report blocks option
When you select the Sychronize drill on report blocks option for Web Intelligence in the BI launch pad
preferences, the display of all blocks changes to correspond with your drill actions.
For example, if you drill down on a block from year to quarter, and your report also contains a chart showing
data by year, the chart display also changes to display data by quarter.
If you do not select the option, only the structure of the drilled block changes. Drill lters are applied to the
whole report.
Synchronizing drill across multiple tables and charts
A report can contain several tables or charts. The generic term used to refer to tables and charts in this guide is
a block. There are two ways to drill on a report with multiple blocks:
● Drill simultaneously on each block in the report the contains the drilled dimension
● Drill on only the current block of data
You set how drill is performed on reports with the Synchronize drill on report blocks option.
If synchronize drilling across all blocks in a report, you drill on each block in the report containing that drilled
dimension. The next dimension in the drill path replaces the previous dimension in all blocks in the report.
If you do not synchronize drilling across all blocks in a report, the next dimension in the drill path replaces the
previous dimension only in the current block in the report.
490
P U B L I C
SAP BusinessObjects Web Intelligence User's Guide
Analyzing data

6.2.4.4 Hide Drill toolbar on startup option
When you drill on a value displayed on a report, the Drill toolbar appears and displays the value on which you
drilled.
The value displayed on the toolbar lters the results displayed on the drilled report.
For example, if you drill on year 2010, the results displayed on the drilled table are Q1, Q2, Q3, and Q4 for year
2010. This means that the quarterly values you drilled to are ltered by 2001.
The Drill toolbar allows you to select alternative values on the same level, in order to lter the results dierently.
For example, if you use the Drill toolbar illustrated above to select “2002," the results displayed on the drilled
table would be Q1, Q2, Q3, and Q4 for year 2002.
In the Web Intelligence section of the BI launch pad Preferences, you can select Hide Drill toolbar on startup to
hide the Drill toolbar when you start the drill mode. The Drill toolbar is only useful if you want to select lters
during your drill session.
6.2.4.5 Start drill session on existing report option
You can activate the ability to drill in Web Intelligence documents via the BI launch pad preferences.
In the Web Intelligence section of the BI launch pad Preferences, select Start drill session On existing
report so that the current report becomes drillable when you start drill mode. When you end drill mode, the
report displays the drilled values.
6.2.4.6 Start drill session on a duplicate report option
You can activate the ability to drill in duplicate reports in Web Intelligence documents via the BI launche pad
preferences.
In the Web Intelligence section of the BI launch pad Preferences, select Start drill session On duplicate
report to drill on a duplicate of the current report when working in drill mode. This allows you to compare the
results of the original report with the results you discover during your drill analysis.
SAP BusinessObjects Web Intelligence User's Guide
Analyzing data
P U B L I C 491

6.2.5 To switch to drill mode
To start drilling on a report, you either switch to Drill mode or, if the report is saved in Drill mode, drill directly.
Procedure
1. In a Web Intelligence document in Design mode, select the report you want to drill.
2. In the Analysis tab, in the Interact subtab, select Start Drill from the Drill dropdown list.
Note
When you open a document that was saved in Drill mode, the document opens in Drill mode if you have
the right to drill on documents.
By default, a drill icon appears on the tab of the drillable report. Depending on the drill options you selected
in the BI launch pad Preferences page, either the selected report becomes drillable or a drillable duplicate
of the selected report is created.
Related Information
Start drill session on a duplicate report option [page 491]
6.2.6 To choose a drill path when more than one is available
A dimension can belong to multiple hierarchies. When you drill down on such a dimension value, it is not clear
which drill path to follow. You must dene the drill path.
Context
Note
If the dimension value you choose to drill on is the result of a previous drill, the drill path is already known.
Therefore you do not need to select a drill path.
492
P U B L I C
SAP BusinessObjects Web Intelligence User's Guide
Analyzing data

Procedure
1. Open a Web Intelligence document in Design mode.
2. In the Analysis tab, in the Interact subtab, select Start Drill from the Drill dropdown list.
3. Drill on the dimension.
The Select Drill Path dialog box appears. The dialog box lists the dimensions in the hierarchy above and
below the drilled value. A check box appears next to each dimensions below the current dimension you are
drilling, so that you can select which of these dimensions you want to retrieve from the database. The
dialog box also displays the lters that you can select to lter the new query.
4. Select the path you want to drill.
5. Click OK.
6.2.7 To take a snapshot of report drill results
You can create a report in the existing document that contains the results of a drill action.
Procedure
1. Open a Web Intelligence document in Reading or Design mode.
2. Activate the Drill mode:
○ If you are in Reading mode, select Start Drill Mode from the Drill dropdown list.
○ If you are in Design mode, go to the Analysis tab, and in the Interact subtab, select Start Drill Mode from
the Drill dropdown list.
3. Do one of the following:
○ If you are in Reading mode, select Snapshot from the Drill dropdown list.
○ If you are in Design mode, go to the Analysis tab, and in the Interact subtab, select Snapshot from the
Drill dropdown list.
6.2.8 Drilling on measures in tables and sections
When you drill on a measure value, you drill one level down for each related dimension in the block, and you see
the measure calculated for the displayed dimensions.
Example
Drill on annual sales revenue results to see the breakdown by city and quarter
For example, you drill down on the year 2003 sales revenue value for California, which is displayed on a
crosstab that shows sales revenue by year and by state.
The drilled report displays sales revenue by quarter (one level below Year) and by city (one level below
State) for California.
SAP BusinessObjects Web Intelligence User's Guide
Analyzing data
P U B L I C 493
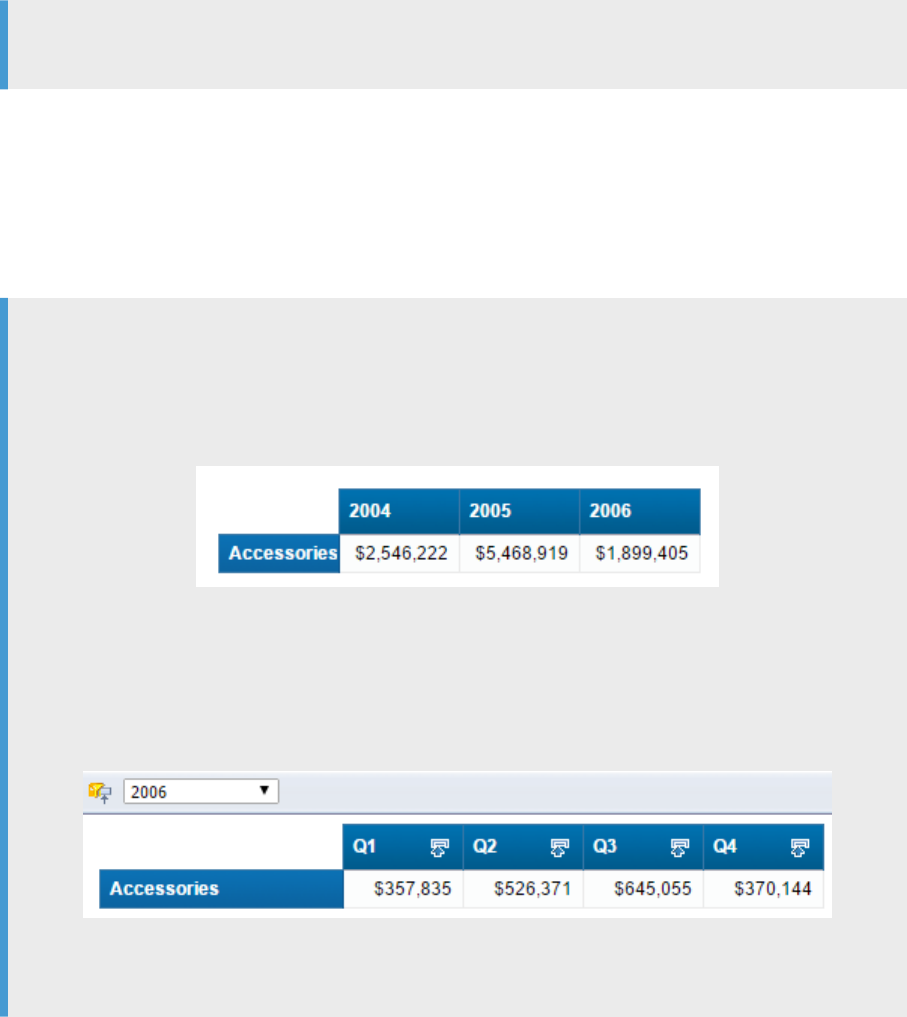
6.2.9 Drilling on dimensions in tables and sections
When you drill on a dimension to see the more data behind the displayed result, it is calculated according to the
values to which you drill.
Dimensions typically represent character data, such as customer or business names, and dates. Calculations
are based around the dimensions in a report. For example, a report calculates a region’s total sales revenue for
a given year where a Sales Revenue measure is calculated based on the State and Year dimensions.
If you drill on Year, you display sales revenue by state and quarter, because Quarter is the next dimension in the
time hierarchy below Year.
Note
Detail objects cannot be drilled on in reports.
6.2.9.1 Drilling down on report data
You can drill down to see the lower-level data that makes up the summary results displayed on reports. This
helps explain why high or low results occurred.
Example
Using drill analysis to nd out why sales decreased dramatically in 2006
In this example, you receive a report that shows sales revenue results for the accessories line at the
eFashion retail store. The following crosstab shows that the Accessories line decreased in 2006.
To analyze more precisely when the decrease occurred, you drill down on the cell value 2006, to view the
detailed data for each quarter. When you drill down on the cell value 2006, a lter appears in the Drill
toolbar to show that the quarterly values you have drilled to are ltered for the year 2006. The drilled chart
clearly shows that the problem arose in Q4 of 2006.
To nd out which of the of the categories within the Accessories line was responsible for the drop in
revenue, you drill down again on the cell value Accessories.
494
P U B L I C
SAP BusinessObjects Web Intelligence User's Guide
Analyzing data
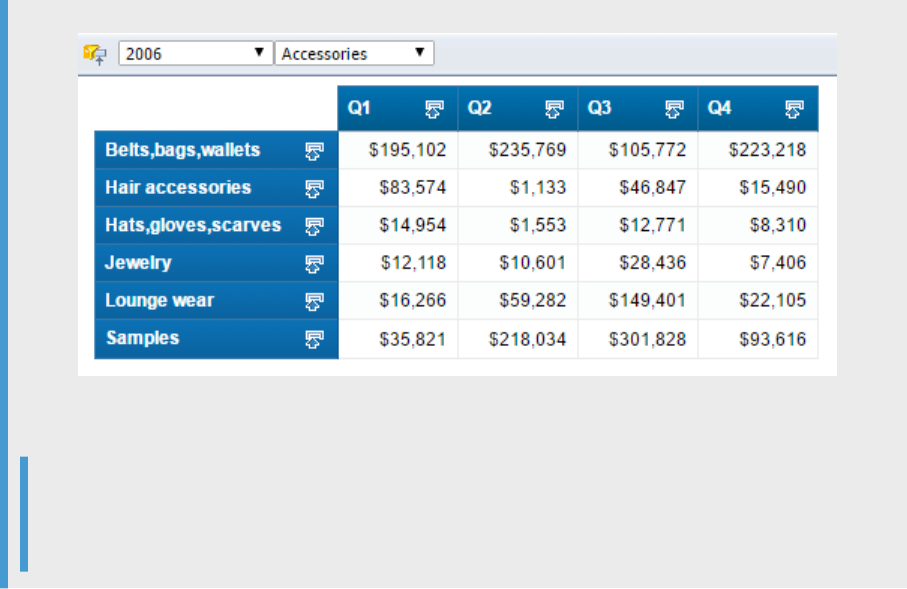
The drilled crosstab shows which categories were responsible for low revenue in Q4.
Note
If you try to drill to a dimension that is already displayed in another column or row of the same table, the
next available dimension in the drill path is displayed.
6.2.9.1.1 To drill down on a value in a table or section cell
You can drill down on a measure value in a table or section in a report.
Procedure
1. Open a Web Intelligence document in Design mode.
2. In the Analysis tab, in the Interact subtab, select Start Drill from the Drill dropdown list.
3. On a table or section cell, place your pointer over the dimension value on which you want to drill.
A ToolTip appears, showing the next dimension in the drill path. If the drilled report includes dimensions
from multiple data providers, the ToolTip displays the name of the query and the dimension for the value.
4. Right-click the cell and select Drill, then the drill direction.
The drilled table or section displays data one dimension level down. The Drill toolbar, at the top of the
report, displays the values from which you drilled. These values lter the values displayed on the drilled
table.
Related Information
To take a snapshot of report drill results [page 493]
SAP BusinessObjects Web Intelligence User's Guide
Analyzing data
P U B L I C 495

6.2.9.2 Drilling up on report data
You can drill up on a dimension value to see how the more detailed data aggregates to a higher-level result.
For example, you may have drilled down on Year to examine data for each quarter. If you want to see how this
data aggregates to yearly results, you can drill up.
When you drill up on a dimension value, you move along the drill path from lower to higher-level data. For
example, you may have drilled down on [Year] to [Quarter]. If you drill up on [Quarter], you return to [Year].
You can only drill up on a dimension value if you have previously drilled down to that dimension, or you have
dened the appropriate drill path in the scope of analysis.
Related Information
Setting the scope of analysis [page 89]
Retrieving more levels of data to the report [page 487]
6.2.9.2.1 To drill up on a dimension or measure value
You can drill up on a dimension or measure value in a table in a document.
Procedure
1. Open a Web Intelligence document in Design mode.
2. In the Analysis tab, in the Interact subtab, select Start Drill from the Drill dropdown list.
3. On a table or section cell, do one of the following:
○ Right-click the cell and select Drill Drill up .
○ Click the Drill Up icon next to the dimension value you want to drill up.
If the table is a crosstab without headers that display the names of the dimensions on the table, then the
Drill Up icon appears next to each value from which you can drill up.
Related Information
To take a snapshot of report drill results [page 493]
496
P U B L I C
SAP BusinessObjects Web Intelligence User's Guide
Analyzing data
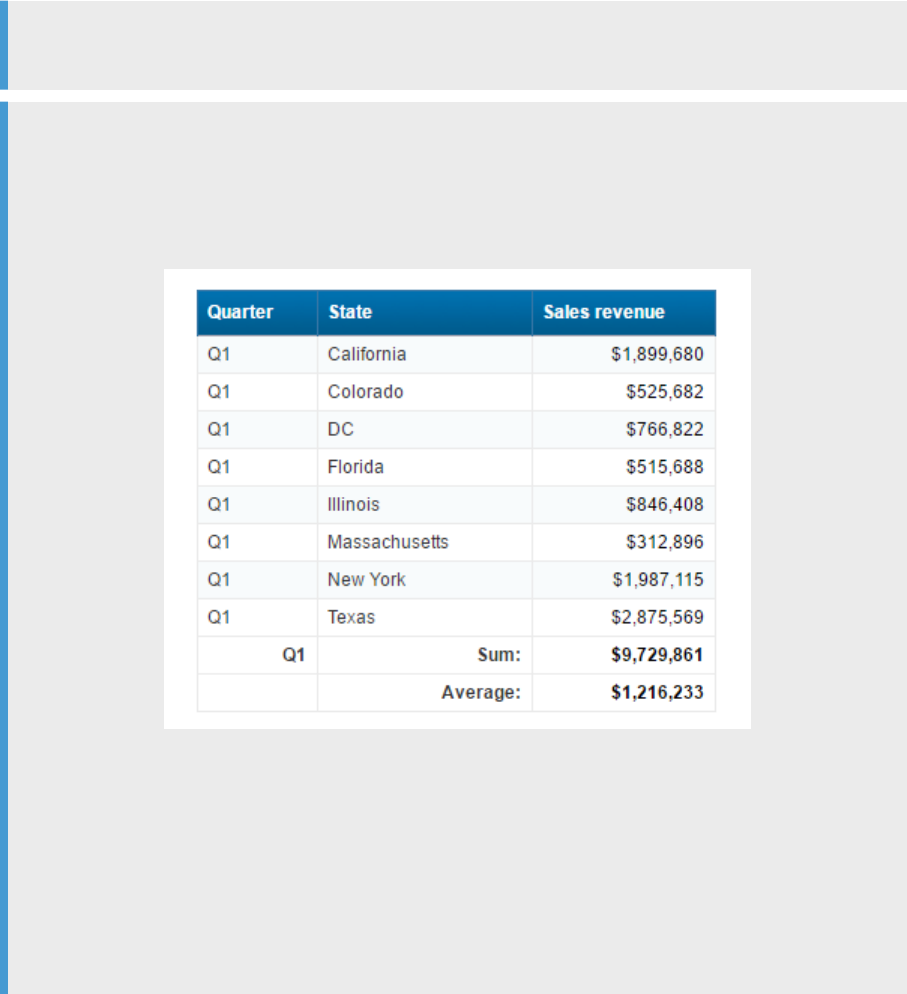
6.2.9.3 Drilling by other dimensions in a report
When you drill down or up, you move through a hierarchy one dimension at a time.
However, you can get another view of the data by slicing it in a dierent way, and then look at the data in other
hierarchies. To do this, you drill by the other dimensions that interest you.
Note
You can only use Drill by with a dimension that is included in the scope of analysis of the document.
Example
Drilling by the Products hierarchy to slice sales revenue results by product
You work as regional manager for California in a retail clothing store, and have been sent the following
report that shows quarterly sales revenue by state:
You are only interested in analyzing the results in the state of California. In addition, you want to analyze the
sales revenue broken down by each product line you sell. To drill on California data, you place your pointer
on the table cell that says California.
If you drilled down now, however, you would drill to results for each city within California, because [City] is
the dimension below [State]. Instead, you select Drill by from the drill menu and then you navigate through
the dimensions on the Products hierarchy by selecting the sub-menus until you reach the [Lines]
dimension.
SAP BusinessObjects Web Intelligence User's Guide
Analyzing data
P U B L I C 497
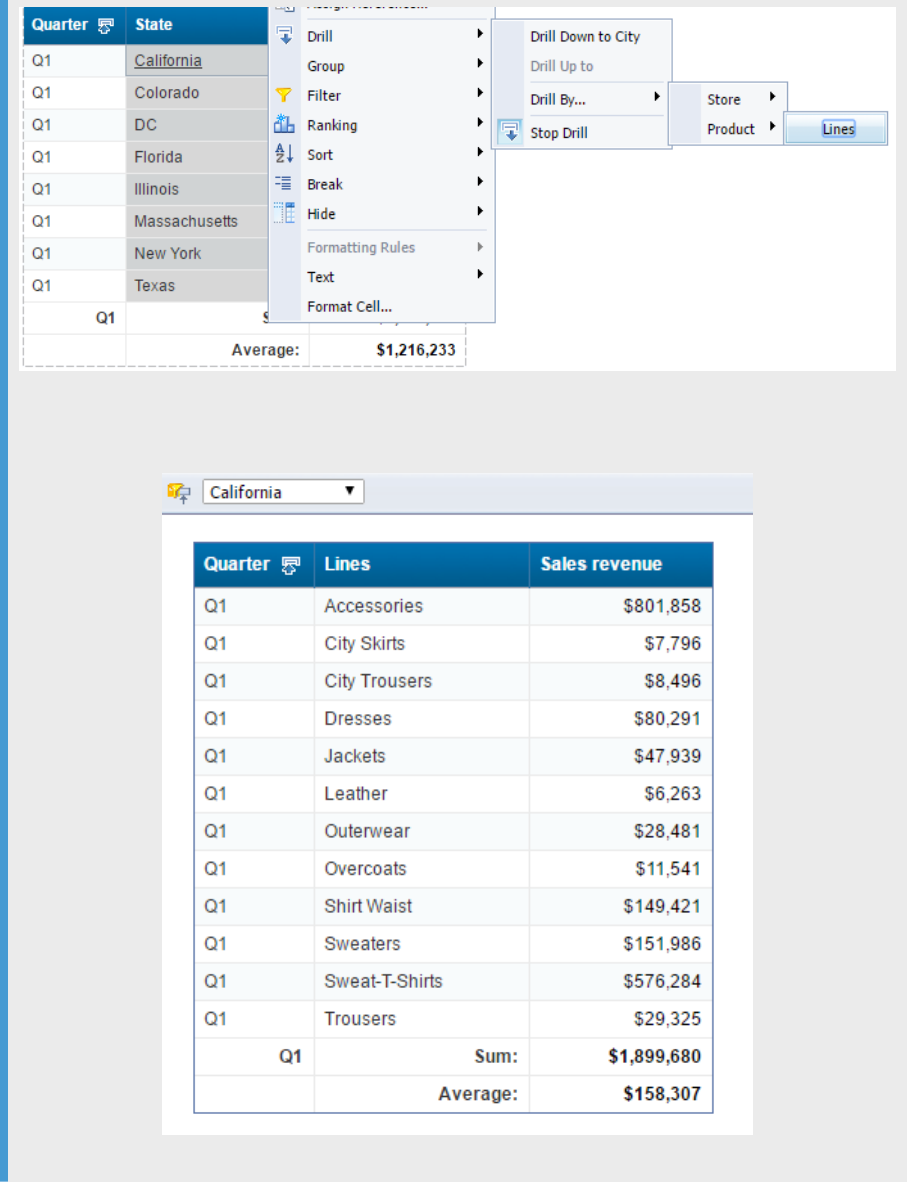
The drilled report displays the detailed sales revenue results for each product line sold in California.
498
P U B L I C
SAP BusinessObjects Web Intelligence User's Guide
Analyzing data

Related Information
Levels of scope of analysis [page 89]
Setting the scope of analysis [page 89]
6.2.9.3.1 To drill by a dimension value
You can drill by a measure value in a report table.
Procedure
1. Open a Web Intelligence document in Design mode.
2. In the Analysis tab, in the Interact subtab, select Start Drill from the Drill dropdown list.
3. Right-click a dimension value in a table or section cell.
The contextual menu appears, displaying the available drill paths.
4. Click Drill by.
Note
If this option does not appear in the contextual menu, then the cell does not have lower levels of data.
5. Select the class to which you want to drill and then the dimension to which you want to drill.
The report now displays data for the dimension to which you drilled.
Related Information
To take a snapshot of report drill results [page 493]
6.2.10 Drilling on charts
Drilling down, up, or by on a chart, provides you with a graphical explanation for why summary results are
particularly high or low.
You can drill on:
● dimensions – by drilling on chart axes or the chart legend
● measures – by drilling on the data bars or markers in the body of the chart
You cannot drill by dimensions on chart axes. However, you can drill by dimensions on chart legends.
SAP BusinessObjects Web Intelligence User's Guide
Analyzing data
P U B L I C 499

Related Information
Drilling on axis legends [page 503]
Drilling on dimensions via chart axes [page 500]
Drilling on measures in charts [page 501]
Restrictions when drilling measures on charts [page 503]
6.2.10.1 Drilling on dimensions via chart axes
On 2D charts, you can drill on dimensions via the X Axis. On 3D charts, you can drill on dimensions via the X
Axis and the Z Axis.
Charts can contain one or multiple dimensions on a single axis. When an axis contains multiple dimensions,
each possible combination of the dimension values appear on the axis (this is sometimes referred to as a
cartesian product).
When you drill on an axis value with multiple dimensions, the drilled results are ltered by both dimensions.
6.2.10.1.1 To drill on a chart axis
You can drill down or up on a dimension value in a chart axis.
Procedure
1. Open a Web Intelligence document in Design mode.
2. In the Analysis tab, in the Interact subtab, select Start Drill from the Drill dropdown list.
3. Do one of the following:
○ To drill down on the dimension value, click the value.
○ To drill up on the dimension value, right-click the value then select Drill Up.
○ To drill down on the dimension value, right-click the value then select Drill Down.
○ To drill by the dimension value, right-click the value then select Drill By.
Note
Drill By is not available if the axis has multiple dimensions.
500
P U B L I C
SAP BusinessObjects Web Intelligence User's Guide
Analyzing data
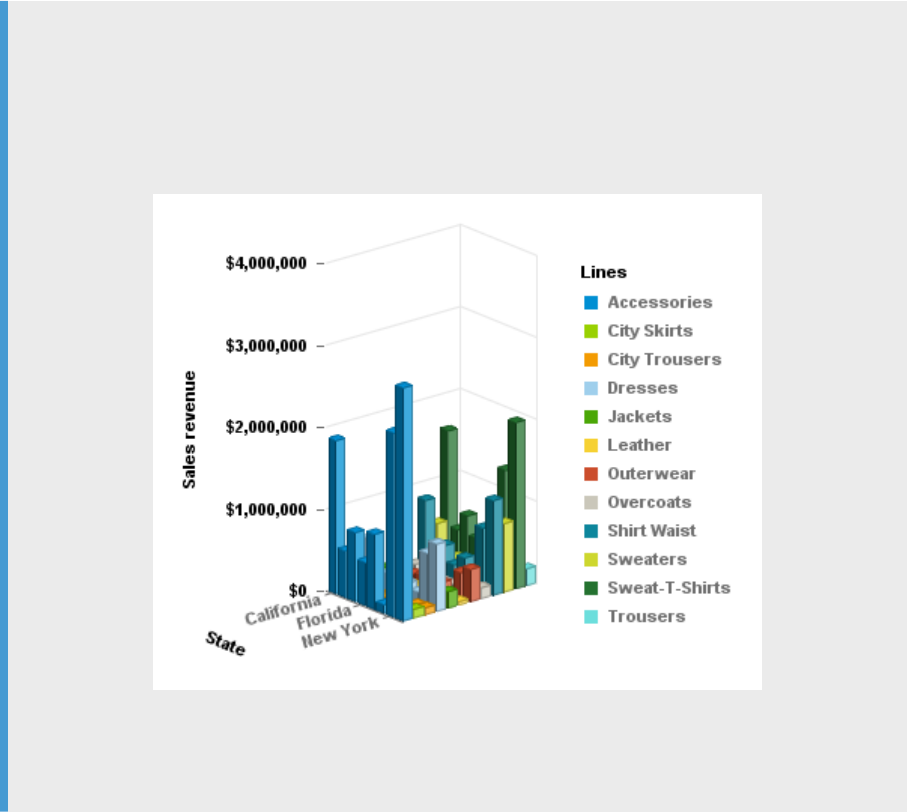
6.2.10.2 Drilling on measures in charts
When you drill on measures, the drill occurs on each dimension displayed on the chart axes.
You can drill on the measures displayed on the following types of chart:
● bar charts – by drilling on the bars
● line and radar line charts – by drilling on the data markers
● pie chart – by drilling on the segments
The new measure calculations displayed on the bars or data markers on the drilled chart, correspond to the
lower or higher-level dimensions to which you drilled. The chart axis labels display the names of the drilled
dimensions.
Example
Analyze detailed information for the sales revenue measure on a chart
For example, this 3D bar chart displays values for the [State] dimension on the X Axis and displays values
for the [Lines] dimension on the Z Axis. This means that the chart bars display values for sales revenue per
state per line.
As the example below shows, when you drill down on the bar for “Accessories" in “California", you also drill
down from [State] to [City] on the X Axis and from [Lines] to [Category] on the Y Axis.
SAP BusinessObjects Web Intelligence User's Guide
Analyzing data
P U B L I C 501
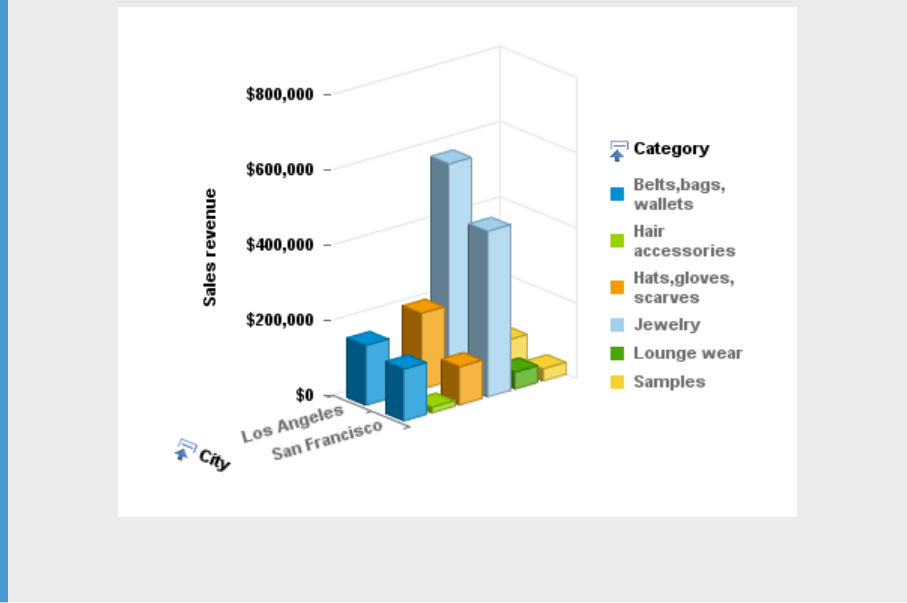
The drilled chart displays sales revenue per city per category for accessories.
6.2.10.2.1 To drill on a measure in a chart
You can drill down or up on a measure value in a chart.
Procedure
1. Open a Web Intelligence document in Design mode.
2. In the Analysis tab, in the Interact subtab, select Start Drill from the Drill dropdown list.
3. Do one of the following:
○ To drill down on the measure value, click the bar or data marker.
○ To drill up on the measure value, right-click the bar or data marker, and then click Drill up.
On charts, each measure is represented by a bar (on bar charts) or by a data marker (on a line charts and
radar line charts).
502
P U B L I C
SAP BusinessObjects Web Intelligence User's Guide
Analyzing data

6.2.10.2.2 Restrictions when drilling measures on charts
When you drill on charts that are not bar charts, the drill action might be performed only on certain dimensions
instead of on all of the dimensions on the chart axes.
When you drill on measures in the following chart types, the drill action is performed only on the values in the
axis legend:
● area charts – 2D, 3D, and stacked
● radar and scatter charts – all types
Note
You cannot drill on measures in 3D area charts.
6.2.10.3 Drilling on axis legends
You can drill on charts via the chart legend whenever the legend lists the dimensions displayed on the chart.
However, when the chart legend lists the measures displayed on the chart, drilling on the legend is not possible.
Drilling on a legend is useful if you are working with a pie chart, because the axis labels, which display the
names of the dimensions represented by each pie segment, are not often displayed.
Note
You can only use Drill By on a chart legend if there is a single dimension on the axis.
6.2.10.3.1 To drill on an axis legend
You can drill down on a dimension value, or drill up or by a dimension value.
Procedure
1. Open a Web Intelligence document in Design mode.
2. In the Analysis tab, in the Interact subtab, select Start Drill from the Drill dropdown list.
3. Do one of the following:
○ To drill down the dimension value, click the color associated with the value.
○ To drill up the dimension value, right-click the color associated with the value, then click Drill up.
○ To drill by the dimension value, right-click the color associated with the value, then click Drill by.
SAP BusinessObjects Web Intelligence User's Guide
Analyzing data
P U B L I C 503

6.2.11 Using lters when you drill
When you drill on a dimension or measure value in a table or chart, the drilled results are ltered by the
dimension or measure you drilled on.
The lter is applied to all of the results displayed on the drilled report.
Filters appear as list boxes in the Drill toolbar. Each list box contains the values associated with that lter. You
select the data displayed in a table or chart by choosing the appropriate values from the list boxes.
Tip
You can also use the Drill toolbar outside drill mode to quickly add simple report lters to reports. In this
context the toolbar is known as the Report Filter toolbar.
Example
Filtering drilled reports by dierent US states
For example, if you drill down on a table cell displaying “California" to view results for cities in California, you
lter the values in the entire report for California and display results for California only in the report.
By changing the value of each lter, you can then see data for other values on the drilled dimension. For
example, you can select Colorado in the lter on State.
Note
If the drilled report includes dimensions from multiple data providers, a ToolTip appears when you rest
your cursor on the value displayed on the lter. The ToolTip displays the name of the query and the
dimension for the value.
Related Information
To create simple report lters [page 517]
6.2.11.1 To add or remove a drill lter
You can add or remove a drill lter in a document.
Procedure
1. Open a Web Intelligence document in Design mode.
2. In the Analysis tab, in the Interact subtab, select Start Drill from the Drill dropdown list.
504
P U B L I C
SAP BusinessObjects Web Intelligence User's Guide
Analyzing data

3. From the Available Objects list, drag the dimension containing the values around which you want to lter
your report and drop it onto the Drill toolbar.
4. A list box for the new lter appears on the Drill toolbar. You can select a value from the list of values to lter
the results displayed on the drilled table, chart, or report.
5. To remove a drill lter, drag the dimension away from the Drill toolbar.
6.2.12 Saving reports with drill lters
When you save a document with reports in Drill mode, lters generated during drill are saved with the
document.
When you open a document saved in Drill mode, the Drill toolbar appears on the drilled reports and shows the
lters generated during the last drill session.
Note
Documents saved in Drill mode take longer to open.
6.2.13 Refreshing data in a drilled report with prompts
When you refresh a document, a prompt can appear that requires you to specify the values you want to retrieve
from the database and return to the reports in the document.
For example, a prompt can require you to specify a year for which you want to retrieve data. This drilled report
shows values for Year 2003, the year selected for the prompt.
If the drilled report is ltered for Year 2003, and you then refresh the document and select year 2002 to answer
the prompt, the report displays results for 2002 instead of 2003.
6.2.14 Drilling with query drill
When you activate query drill, you drill by modifying the underlying query (adding and removing dimensions
and query lters) in addition to applying drill lters.
You use query drill when your report contains aggregate measures calculated at the database level. It is
designed in particular to provide a drill mode adapted to databases such as Oracle 9i OLAP, which contain
aggregate functions which are not supported in Web Intelligence, or which cannot be accurately calculated in
the report during a drill session.
Query drill is also useful for reducing the amount of data stored locally during a drill session. Because query
drill reduces the scope of analysis when you drill up, it purges unnecessary data.
Note
In query drill mode, new objects created when drilling out of scope are deleted when they are no longer
needed. As a result, dimensions used in Geomap charts lose the location they have been matched with.
SAP BusinessObjects Web Intelligence User's Guide
Analyzing data
P U B L I C 505

Example
Drilling down from month to week
In this example, Month is the lowest dimension currently available in the query from a time hierarchy, and
Week is the dimension immediately below it in the hierarchy.
If you drill down on Month = January, three things happen:
● Week is added to the scope of analysis.
● A query lter restricts Month to "January".
● A drill lter is added to restrict Month to "January".
If you drill up from Week to Month, the process is reversed:
● Week is removed from the scope of analysis.
● The query lter is removed.
● The drill lter is removed.
Note
Drill lters are not strictly necessary in query drill mode. They are applied for consistency with standard
drill mode. For example, the
DrillFilters function returns the correct value in query drill mode
because a query drill applies drill lters to match the query lters.
Related Information
Setting the scope of analysis [page 89]
Levels of scope of analysis [page 89]
To drill out of the scope of analysis [page 487]
6.2.14.1 Drilling down with query drill
When you drill down, query drill behaves similarly to standard drill at the point where the data moves outside
the scope of analysis.
A drilled dimension is ltered in query drill mode by adding a query lter in addition to a drill lter. For example,
if you drill on Year=2001, you add a query lter to restrict the Year dimension to 2001. For this reason, the only
value that appears in the drill toolbar for the drilled dimension is the value on which you drilled (in this case
2001). This is dierent from standard drill mode, in which all values of the dimension are visible in the toolbar.
As a result, you cannot change lter values in query drill mode (for example, drill on Year=2001 then switch to
Year=2003) as you can in standard drill mode.
Because query drill automatically extends the scope of analysis, you can use it only if you have the right to drill
outside the scope. Contact the BI administrator for more details.
506
P U B L I C
SAP BusinessObjects Web Intelligence User's Guide
Analyzing data
Related Information
Setting the scope of analysis [page 89]
Retrieving more levels of data to the report [page 487]
Levels of scope of analysis [page 89]
6.2.14.2 Drilling up with query drill
When you drill up, query drill removes dimensions from the query.
For example, if you drill up from Month to Quarter, you remove Month from the query. This has two
consequences:
● Query drill is incompatible with drill snapshots.
● You cannot drill up beyond any dimension that appears as one of the report objects. For example, if your
report displays Year, Quarter and Revenue, you cannot drill up from Quarter to Year because this would
remove quarter from the list of report objects.
Related Information
Query drill and drill snapshots [page 507]
To take a snapshot of report drill results [page 493]
6.2.14.3 Query drill and drill snapshots
In query drill mode, snapshots change when you drill up beyond a dimension that you included in a snapshot.
Do not use drill snapshots when working in query drill mode, because query drill means that snapshots cannot
be guaranteed to stay the same.
Because the drill up removes the dimension from the underlying query, it also removes the dimension from the
snapshot.
Related Information
To take a snapshot of report drill results [page 493]
SAP BusinessObjects Web Intelligence User's Guide
Analyzing data
P U B L I C 507

6.2.14.4 Query drill and other reports based on the same
data provider
If your document contains other reports that contain dimensions on which you drill in query drill mode, these
reports are aected because the query drill modies the dimensions they contain.
You can avoid this (at the cost of retrieving duplicate data) by creating a new data provider and rebuilding the
other report against it. Now when you drill in query drill mode, the other report remains unaected.
Example
Drilling on a dimension that appears in another report
If you have two reports based on a query that contains Year, Quarter and Sales Revenue, and you use query
drill to drill down to Year = 2001 on the rst report, you also lter the data for Year in the second report to
include 2001 only.
6.2.14.5 To activate query drill
If your report already has a scope of analysis dened, you see an error message telling you to clear the scope of
analysis before activating query drill.
Procedure
1. Open a Web Intelligence document in Design or Data mode.
2. In the Properties tab, click Document to display the Document Properties dialog box.
3. Select Use query drill.
Note
The Use query drill option is unavailable if there is a scope of analysis activated in the Query Panel.
4. Click OK to close the Document Properties dialog box.
Related Information
To set the scope of analysis [page 90]
508
P U B L I C
SAP BusinessObjects Web Intelligence User's Guide
Analyzing data
6.3 Filtering report data
You can lter reports to limit the displayed results.
For example, you can limit the displayed results to information for a specic customer or a sales period. The
data you lter out remains in the document; it is simply not displayed in the report tables or charts. This means
you can change or remove report lters in order to view the hidden values, without modifying the query behind
the document.
You can apply dierent lters to dierent parts of a report. For example, you can limit the results in the entire
report to a specic product line and then limit results in a table or chart further to focus on results for a specic
region or customer prole.
To create a report lter, you need to specify the following elements:
● a ltered object
● an operator
● lter values
● the report element to be ltered (the whole report, sections, or blocks)
In the Side Panel, click the "Document Structure and Filters" tab, to see the structure of the document and the
report elements that are ltered by operator and value.
Related Information
Using report lters in report sections [page 369]
6.3.1 Query lters and report lters compared
You can dene the following types of lter in a document.
Type of document
lter Description
Query lter Dened on the query to limit the data retrieved from the data source and re
turned to the document.
Report lter Dened within the report to limit values displayed in tables, charts, and sec
tions within the document. Unlike the query lter, a report lter doesn’t mod
ify the data that is retrieved from the data source; it simply hides values at the
report level.
Caution
Users with document edit rights on a document have the right to modify any of your document report lter
and can also access the document data.
SAP BusinessObjects Web Intelligence User's Guide
Analyzing data
P U B L I C 509

Empty and null values in LOVs
The List of Values option [EMPTY_VALUE] for a lter appears in your lter list of values (LOV) when empty
string values are present in your query. You can use [EMPTY_VALUE] only when ltering on empty strings, not
when ltering on NULL values.
The [NULL_VALUE] option in a LOV allows you to select any null or empty string value in the list. This option
always appears in a report lter LOV, and can appear in a Combo box, Radio buttons, List box, or Check boxes
input control if the input control is set to allow selection of null values.
Related Information
To create, edit, and delete standard report lters [page 513]
Filtering data using query lters [page 188]
6.3.2 Report lter operators
You use operators to compare ltered objects.
Operators can perform mathematical operations.
6.3.2.1 Not Equal to operator
Use the Not Equal to operator to obtain data not equal to a value.
For example, to return data for all countries except the US create the lter "County Not Equal to US".
Note
This operator cannot be used for OLAP .unx universe parent-child hierarchies or for BEx queries.
6.3.2.2 Greater than operator
Use the Greater than operator to retrieve data greater than a value.
For example, to retrieve data for customers aged over 60, create the lter "[Customer Age] Greater than
60".
Note
This operator cannot be used for OLAP .unx universe parent-child hierarchies or for BEx queries.
510
P U B L I C
SAP BusinessObjects Web Intelligence User's Guide
Analyzing data
6.3.2.3 Greater than or Equal to operator
Use the Greater than or equal to operator to retrieve data greater than or equal to a value.
For example, to retrieve data for revenue starting from $1.5M, create the lter "[Revenue] Greater than or
equal to 1500000".
Note
This operator cannot be used for OLAP .unx universe parent-child hierarchies or for BEx hierarchies.
6.3.2.4 Less than operator
Use the Less than operator to retrieve data lower than a value.
For example, to retrieve data for exam grades lower than 40, create the lter "[Exam Grade] Less than 40".
Note
This operator cannot be used for OLAP .unx universes, hierarchies in lters, or for hierarchies in BEx
queries.
6.3.2.5 Less than or Equal to operator
Use the Less than or equal to operator to retrieve data less than or equal to a value.
For example, to retrieve data for customers whose age is 30 or less, create the lter "[Age] Less than or
equal to 30".
Note
This operator cannot be used for OLAP .unx universes, hierarchies in lters or for hierarchies in BEx
queries.
6.3.2.6 Between operator
Use the Between operator to retrieve data between two boundary values including the two boundary values.
The rst value declared must be lower than the second value.
For example, to retrieve data for weeks starting at week 25 and nishing at 36 (including week 25 and week 36),
create the lter "[Week] Between 25 and 36".
SAP BusinessObjects Web Intelligence User's Guide
Analyzing data
P U B L I C 511

Note
This operator cannot be used for OLAP .unx universe or BEx hierarchies in lters.
6.3.2.7 Not between operator
Use the Not between operator to retrieve data outside the range of two values.
For example, to retrieve data for all the weeks of the year, except for and not including weeks 25 through 36,
create the lter "[Week] Not between 25 and 36".
Note
This operator cannot be used for OLAP .unx universes or for BEx hierachies in lters.
6.3.2.8 In list operator
Use the In list operator to retrieve data corresponding to values in a list of values.
For example, to retrieve data only for the US, UK and Japan, create the lter [Country] In list, when you
can type values in the
Type a value eld, you enter US;UK;Japan.
When used in a query lter with a hierarchical list of values, either from a dimension associated with a
hierarchical list of values or a hierarchy object, In list allows the selection of multiple members from any
levels of the hierarchy. For example, a prompt on the [Geography] hierarchy using the In list operator allows
the selection of [Paris] at the City level and [Canada] at the Country level in the prompt.
When used in a report lter, In list produces a at list of values.
6.3.2.9 Not In List operator
Use the Not in list operator to retrieve data that does not correspond to multiple values.
For example, if you do not want to retrieve data for the US, UK and Japan, create the lter "[Country] Not in
list". In the Type a value eld, you enter US;UK;Japan.
When used with a hierarchical list of values, either from a dimension associated with a hierarchical list of
values, a hierarchy object or a level object, Not in list allows the selection of multiple members from any
levels of the hierarchy. For example, a prompt on the [Geography] hierarchy using the Not in list operator
allows selection of [Paris] at the City level and [Canada] at the Country level in the prompt.
Note
This operator can only be used in certain types of hierarchies, for example, it can be used in level-based
hierarchies.
512
P U B L I C
SAP BusinessObjects Web Intelligence User's Guide
Analyzing data
6.3.2.10 IsNull operator
Use the IsNull operator to retrieve data for which there are no values in the database.
For example, to retrieve customers without children (the children column in the database has no value), create
the lter [Children] IsNull.
6.3.2.11 Is not Null operator
Use the Is not Null operator to return data for which there is a value in the database.
For example, to return customers with children, create the lter [Children] Is not Null.
6.3.2.12 Equal to operator
Use the Equal to operator to obtain data equal to a value.
For example, to return data for the US only, create the lter "[Country] Equal to US".
6.3.3 Types of report lter
Report lters are lters that can be applied on dierent report elements: report, section, table, graph.
There are two types of report lter:
● Standard report lters.
Standard report lters are the most exible type of report lter. They can use any lter operator and can
lter on single values or lists of values.
● Simple report lters.
Simple report lters provide an easy way to create lters using the Equal to operator. They can lter on
single values only, and are applied to a whole report (not an entire document or report element).
6.3.4 To create, edit, and delete standard report lters
You can work with report lters in the Report Filter dialog box.
Procedure
1. In a Web Intelligence document in Design mode, select the report element you want to lter.
SAP BusinessObjects Web Intelligence User's Guide
Analyzing data
P U B L I C 513
2. In the Analysis tab, select the Filters subtab.
3. From the Filter dropdown list, select Add lter.
If you selected a cell in a table, by default, the Filter On box displays the object for that cell.
4. If you wish to lter on an object besides the default object, click Add lter in the Report Filter dialog box to
display the objects you can lter.
5. In the Available objects panel, select the objects you want to lter and click OK.
If you selected more than one object, the ltered objects appear in an AND relationship. Double-click the
AND operator to change it to OR.
6. For each lter object, select a lter operator from the object’s dropdown list.
By default, the In List lter operator is selected.
7. To add values for the lter to the list of ltered values, do one of the following:
○ Type values directly in the box above the list of values of the object.
○ Double-click the item to add it to the list of selected values.
○ Select values from the list and click > to add it to the list of selected values.
The values you can type or select depend on the operator. For example, if you select the Equal to operator,
you can type or select only one value.
To obtain data for rows or columns that contains no data, add [NULL_VALUE] to the object. For example, if
you want to see customers who have not paid, then if you select [NULL_VALUE] for object “Invoice Date”,
the resulting list shows only those customers without an invoice date.
If the ltered object is a hierarchy, the values are displayed hierarchically. All members of the hierarchy are
visible even if they are collapsed in the report. You must select hierarchy members from the hierarchy; you
cannot type them manually. All member values that have been selected in the Query Panel are displayed in
gray and can't be selected if they are not in the nal report because they are not linked to any measures. To
help you select the right values, you can also click the key icon to see both the text and key ID value for the
members.
If the ltered object is a level, the values are displayed in a list. It is not possible to type the values.
8. Click OK to apply the report lter to the element.
9. To edit a report lter, select the report element and select Edit Filter from the Filter dropdown list and edit
the lter using the dialog box. Click OK to return to the document.
10. To delete a report lter, select the report element and select Remove Filter from the Filter dropdown list.
You use this to remove all lters for the selected report element. To remove only one lter, click Edit Filter
and in the Report Filter dialog box, select the lter and click the Remove icon.
514
P U B L I C
SAP BusinessObjects Web Intelligence User's Guide
Analyzing data

6.3.4.1 To select values from a list of values
When selecting from a list of values in a query, items in the list can appear either as a single or multi-column list
or a hierarchy, depending on the object.
Context
In a multi-column list, additional columns provide related values to the main value. In a hierarchical list, values
appear in a hierarchical relationship.
When you refresh a document with prompts, lists of values for the prompts appear in a at list without multiple
columns.
Procedure
1. In a list of values, select items that you want to appear.
○ If the list of values does not appear when a dialog box opens, refresh the list, or search the list to
retrieve values. Some list of values require an initial search to display values because the list is too
large to be loaded in full.
○ If the list of values is divided into ranges, use the control above the list to navigate through the ranges.
Some large lists of values are divided into ranges to reduce the amount of data retrieved from the
database. When you select a range, the list displays the values in that range.
○ If the list of values depends on other lists of values, specify the dependent values in the prompt dialog
box that appears. A list of values can be dependent on other lists of values, for example when it is part
of a hierarchical list of values. For example, if the list of values contains cities, and the City object is part
of the hierarchy Country > Region > City, you need to specify values for country and region rst to lter
the list of cities.
Note
Dependent lists of values appear in queries only. They do not appear when you are selecting from a
list of values in a report.
When you rst display the list of values, you see the Prompts dialog box in which you specify the
dependent values. Once you have specied the dependent values, you can select the values from the
ltered list.
○ To display the value keys in OLAP or BEx queries, click Show/hide key values.
Key values are not indicated in the list of Selected Values, only in the list of available values. Some lists
of values contain key values, which are unique values that can be used to identify values with the same
display value. If the list of values contains multiple columns, only the key of the ltering column is
displayed.
○ To search for values in the list, type the search text in the box below the list and select one of the
following options from the Search icon dropdown list.
SAP BusinessObjects Web Intelligence User's Guide
Analyzing data
P U B L I C 515
Option Description
Match case The search is case-sensitive.
This option is not available when the Search in keys or Search on database op
tions are selected.
Search in keys
The search uses unique value keys rather than display values.
This option is available only in lists of values that support key values.
Search on database The search includes all values stored in the database rather than being re
stricted to the values loaded into the list. It improves search accuracy but re
duces search speed.
This option is available only in lists of values that support database searches.
Database searching improves search accuracy at the cost of performance. It is
useful when not all values in the list of values were retrieved. This can happen
when the total number of values in the list exceeds the Max rows retrieved
query property.
Database searching is particularly useful when the list of values is hierarchical
because values are loaded from the database only in response to their parent
value being expanded in the hierarchy. For example, in a geographical hierarchy,
the child values of the California value (cities in California) are not loaded from
the database until the value is expanded. If the option is selected, the search
includes these items even when the California value has not been expanded.
The search includes all ranges if the list of values is divided into ranges.
In search patterns, the '*' wildcard represents any string of characters and the '?' wildcard represents
any single character. For example, the value "March" can be returned by the search patterns "M*" or
"Mar?h". To include the "*" and "?" characters literally rather than as wildcards, precede them with "\"
in the search pattern.
○ Type values from the list directly if the list supports direct data entry or select values from the list.
2. Click OK or Run Query, as applicable.
Related Information
Max rows retrieved query property [page 93]
Selecting prompt values in the Prompts dialog box [page 521]
516
P U B L I C
SAP BusinessObjects Web Intelligence User's Guide
Analyzing data

6.3.5 Using simple report lters
Simple report lters lter information in an open Web Intelligence report, not in the document or in specic
objects in the report.
The Report Filter toolbar provides a quick method for adding simple report lters to reports.
You can lter on the following objects in a report:
● Dimension or detail objects
● Hierarchies, characteristics or attributes for OLAP universes or BEx queries (but not at the hierarchy level
or on measures)
Simple report lters can only use the Equal to operator and can only lter on a single value. They can use the All
values operator.
Restriction
In 4.2 SP3, available lter operators on attributes for queries based on OLAP sources are limited to “Equal
to”, “In List” and “Matches pattern”. This only applies to attributes directly associated to hierarchies.
Related Information
To create simple report lters [page 517]
6.3.5.1 To create simple report lters
You can lter a report on the object value you select. For example, if you select "US" from the list of values of
the Country object, the report is ltered to exclude all rows where Country does not have the value "US".
Procedure
1. Open a Web Intelligence document.
2. Do one of the following:
○ In the Reading mode, click Filter Bar.
○ In Design mode, in the Analysis tab, select the Interact subtab and click Filter Bar.
The Report Filter toolbar appears.
Note
When opening the lter bar, lters are automatically inserted when their report scopes are:
○ Single value (Equal to operator)
○ With the All Values operator
SAP BusinessObjects Web Intelligence User's Guide
Analyzing data
P U B L I C 517
Those lters are no longer displayed in the Filter box.
Note
When collapsing the Report Filter toolbar, all "simple lters" are put back as Equal to or All values report
lters that lter on the entire report. To avoid creating All values lters, remove the object from the lter
bar before you collapse it.
3. Click the add simple report lter icon on the toolbar and select the object on which you want to lter from
the menu.
You can add multiple objects to the toolbar to create multiple lters.
Note
Depending on the data sources and selected objects, the values or objects available in a lter may
depend on the values set in another lter object.
4. Select the value on which you want to lter from the dropdown list of values.
Note
For non-hierarchical objects, the list contains all values contained in the report for this object after
applying all other report scope lters. For example if you have an In List lter reducing this object
values, you will have this list of values for the lter bar Equal to lter.
For hierarchical objects, the list contains the at list of all member values at any level. This list is in tree
view order, not alphabetical order.
Tip
In the Web Intelligence Applet interface, or in Web Intelligence Rich Client, you can drag objects from
the tree view to the Report Filter toolbar.
Results
To remove a lter:
● In the Web Intelligence HTML interface in Reading or Design mode, from the dropdown list for the operator
in the Report Filter toolbar, select (Remove).
● In the Web Intelligence Applet interface or Web Intelligence Rich Client in Design mode, select the lter and
drag and drop it into the report.
Related Information
To create, edit, and delete standard report lters [page 513]
518
P U B L I C
SAP BusinessObjects Web Intelligence User's Guide
Analyzing data
6.3.6 To create nested lters in a report
A nested report lter contains more than one lter that use AND and OR clauses.
Procedure
1. Open a Web Intelligence document in Design mode.
2. To add a lter to the existing lter list, in the Analysis tab, select the Filters subtab.
3. From the Filter dropdown list, click Add Filter.
4. In Report Filter panel, click Add lter, select one or more object for the lter, and click OK.
5. Select an operator and values for the lter.
6. Click the operator to change the type from AND to OR and vice versa.
7. When you have nished adding lters, click OK to return to the document.
6.3.7 Filtering data with prompts
You can lter report data by supplying values for prompts.
When you refresh a document with prompts, the Prompts dialog box displays a summary of all the dened
prompts in the Prompt Summary pane. You select the prompt you want to answer, and supply values in the
Enter values for prompt pane of the dialog box.
Depending on the prompt you select, you type values directly or select values from a list. A list of values can
contain display only values, or the values and their corresponding database key values. Database key values are
unique values used to identify the display within the database.
Lists of values can be organized hierarchically if the list was dened as a hierarchy by the universe designer, or
the prompt is based on a hierarchy or level object.
Lists of values can be split into ranges to improve performance.
You can search or lter lists of values for easier access to the values you are interested in.
Prompts can be optional or mandatory. If you do not supply a value for an optional prompt, the prompt is
ignored. You must supply values for all mandatory prompts before you can lter the data by running the
prompts.
Prompts can depend on other prompts. For example, a prompt on a City object can be dependent on a prompt
on a Region object. By supplying values to the Region prompt, you restrict the number of possible values of the
City prompt.
You can supply values for dependent prompts only when you have supplied values for all the prompts on which
they depend. If you wish to supply values to dependent prompts of an optional prompt, you must supply values
for the optional prompt
SAP BusinessObjects Web Intelligence User's Guide
Analyzing data
P U B L I C 519

Related Information
To select values from a list of values [page 199]
Selecting prompt values in the Prompts dialog box [page 521]
6.3.7.1 To supply values for prompts
You can lter report data based on the prompt values you use.
Procedure
1. Open a Web Intelligence document containing a query-level prompt in Design mode.
2. Click the Refresh button.
3. Select the prompt in the Prompts Summary pane.
4. If the prompt has a list of values and the values are not displayed, click the Refresh button to display them.
In this case, the list displays the text To see the contents of the list, click Refresh.
If the prompt is dependent on other prompts, the list of values displays links to the dependent prompts.
You must supply values for the dependent prompts before you can supply a value for the current prompt.
Groups of dependent prompts appear in separate groups in the Prompt Summary pane.
The values can appear as single values, in multiple columns (where the additional columns supply further
information about the main ltering column), or hierarchically, depending on the prompt.
If the list of values is too large to display all at once, the list is split into ranges and a box above the list of
values displays the current range. You can scroll through the ranges to see all the values in the list.
5. Select values and click > to add values to the selected values list, or type values directly if the prompt
allows you to do so.
You cannot type values directly if the list of values is hierarchical.
If the prompt requires a date, you can select it from the calendar that appears in the box in which you
select the value.
Note
SAP Key Dates appear as date prompts, with other prompts in the same data provider appearing as
dependent prompts.
6. Repeat the previous step if the prompt allows you to select multiple values.
If a prompt allows you to make multiple selections from a hierarchical list of values, you can select values at
dierent levels of the hierarchy. If the prompt allows single values only, you can select values only from the
bottom level of the hierarchy.
If a prompt allows you to type values directly and allows multiple values, you can specify multiple values
separated by ";", for example California;Nevada;Iowa. After you have typed or pasted the separated
list, click the tooltip that says Click here to interpret as multiple values. If you click >, the list is interpreted
as a single value.
520
P U B L I C
SAP BusinessObjects Web Intelligence User's Guide
Analyzing data

7. Run the query:
a. In the Web Intelligence HTML interface, click Run Query to run the query.
b. In the Web Intelligence Applet interface or Web Intelligence Rich Client, click OK to run the query.
Related Information
To select values from a list of values [page 199]
To build a prompt [page 215]
6.3.7.2 Selecting prompt values in the Prompts dialog box
When you open or refresh a document with prompts, the Prompts dialog box appears.
The actions you can take in the Prompts dialog box depend on the type of data source the document is
accessing or the settings selected by the data source or document query designer.
Features of the Prompts dialog box in the Applet and Rich Client interfaces
Feature
Description Actions you can take
Available prompt variants
text box and dropdown list
This feature is available after you have created,
run, and saved to the CMS the Web Intelligence
query for the rst time. This feature lists any
prompt variants you have saved.
You enter the name of the prompt var
iant in this text box when you are creat
ing it for the rst time.
Once you have named and saved a
prompt variant, you can select it from
the dropdown list.
Delete prompt variant
but
ton
This feature is available after you have created,
run, and saved to the CMS the Web Intelligence
query for the rst time. A button that allows you to
delete an existing prompt variant.
To delete the prompt variant:
1. Select the prompt variant from the
Available prompt variants drop
down list.
2. Click Delete prompt variant.
Create prompt variant
but
ton
This feature is available after you have created,
run, and saved to the CMS the Web Intelligence
query for the rst time. A button that allows you to
create a prompt variant.
To create a prompt variant:
1. Select values from each prompt in
the prompt summary.
2. Enter a name in the Available
prompt variants
text box.
3. Click Create prompt variant.
It appears in the Available prompt
variants dropdown list.
SAP BusinessObjects Web Intelligence User's Guide
Analyzing data
P U B L I C 521
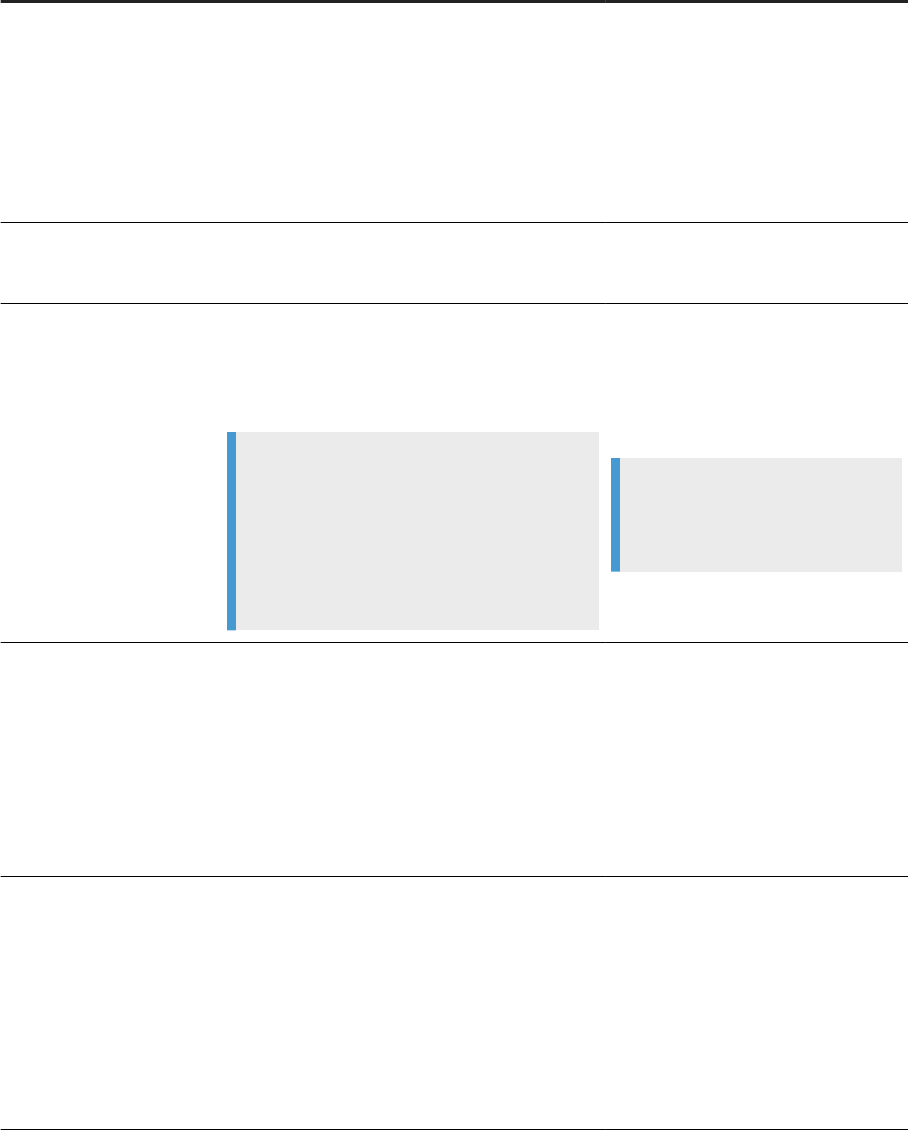
Feature Description Actions you can take
Save prompt variant button This feature is available after you have created,
run, and saved to the CMS the Web Intelligence
query for the rst time. A button that allows you to
save changes to an existing prompt variant.
To save prompt variant changes:
1. Select your prompt variant from
the Available prompt variants drop
down list.
2. Update the value selection for each
prompt in the prompt summary.
3. Click Save prompt variant.
Prompts Summary
list box A list of the prompts and your previous selections. To change the selections for a specic
prompt, you can select it from the list,
and supply dierent values.
Type a value text box
A text box in which you can manually enter values,
including wildcard text patterns (for example 9* for
all accounts starting with 9), to add to the Selected
Value(s) list box.
Note
● If the document or data source settings
do not allow manual entry of values, this
box does not appear in the Prompts dia
log box.
● Not all data sources recognize wildcard
text patterns for prompts values.
To manually add a value, or use wild
card text patterns, you enter the text
string in this box and click the right an
gle bracket (>) icon to add it to the
Selected Value(s), Start Value, or End
Value
list box.
Note
For BEx characteristic variables,
you manually enter a key value.
List of values box
The list box that shows the available data values. To add an item in this list box to a
Selected Value(s), Start Value, or End
Value
list box:
1. Select the item in the List of values
box (to select additional items,
press Control and click other
items).
2. Click the right angle bracket (>)
icon.
Refresh values
button
When you click this icon, the List of values box
shows the values that can be selected for the
prompt.
Some lists of values require an initial search to dis
play values because the list is too large to be
loaded in full.
See To select values from a list of values [page 199]
for more information on lists of values.
To refresh the list of values box, click
the
Refresh values button.
522 P U B L I C
SAP BusinessObjects Web Intelligence User's Guide
Analyzing data
Feature Description Actions you can take
Search text box
A text box in which you can enter a search pattern.
Next to this text box is a Search button that oers
three search options: Match case, Search in keys,
and Search on database. See To select values from
a list of values [page 199] for more information on
lists of values.
To search the list of values, enter text in
the search text box and press Enter or
click the Search button.
Tip
If the data being queried is very
large, list of values can be divided
into limited ranges. In this case,
your search string may not be
found. If manual entry of values in
the
Selected Value(s), Start Value,
or End Value list box is allowed, you
should add your values manually.
Selected Value(s)
list box In a prompt that allows multivalue variable selec
tion, the list box that shows the values that you
have entered for a prompt.
To delete an item from this list box, se
lect it and click the < button.
Start Value text box In a prompt that requires an interval selection, this
shows the start value you have entered.
End Value text box In a prompt that requires an interval selection, this
shows the end value you have entered.
Right angle bracket (>) icon A button that allows you to add items to the
Selected Value(s), Start Value, or End Value list box.
When you have manually entered a
value in the Type a value text box or se
lected one or more values in the list of
values box, click
> to add the values to
the Selected Value(s), Start Value, or
End Value list box.
Left angle bracket (
<) icon A button that allows you to remove items to the
Selected Value(s), Start Value, or End Value list box.
To remove an item from a Selected
Value(s) list box, select the item and
click <.
To remove an item from a Start Value or
End Value list box, click < next to the ap
plicable list box.
Related Information
Prompt variant sets in the Prompts dialog box [page 524]
To select members based on relative depth from a selected node [page 124]
To add a second BEx query data provider to a document [page 130]
To edit a document based on a BEx query [page 132]
About previewing data when a BEx query has variables [page 133]
To select values from a list of values [page 199]
Filtering data with query prompts [page 207]
To build a prompt [page 215]
SAP BusinessObjects Web Intelligence User's Guide
Analyzing data
P U B L I C 523

Dening how prompts display [page 217]
6.3.7.3 Prompt variant sets in the Prompts dialog box
You can save a group of often-used variable value sets as a prompt variant in the Prompts dialog box.
After the Web Intelligence document query is created, run, and saved for the rst time, when you refresh or
open the document, you can see the Available prompt variants options in the Prompts dialog box. Once you've
selected the values for each prompt in the Prompts Summary, you name and save the variable value set as a
prompt variant. It is subsequently available in the Prompts dialog box from the Available prompt variants
dropdown list.
For example, if you are a regional manager and prefer to have a prompt variant for each branch in you region,
then when you refresh a report and select a prompt variant for branch A, the document displays only the data
for branch A.
When Web Intelligence applies a prompt variant, each variant value is applied to prompt if, and only if, the
following match exactly:
● data type (as in string, date, and so on)
● selection type (single, multiple, or interval)
● structure (hierarchy, at)
Unmatched prompts are ignored.
Restriction
● You must create, run, and then save the document to the CMS to see the prompt variant options.
● Only the user who created the prompt variants can view them and they only apply to the document in
which they have been created on.
● When you delete a prompt variant, it is completely removed from the document. It cannot be
recovered.
● Prompt variants do not work in Web Intelligence Rich Client in oine or standalone mode.
Related Information
Selecting prompt values in the Prompts dialog box [page 521]
6.4 Filtering data using input controls
Input controls provide a convenient, easily accessible way to lter and analyze report data.
When you create an input control, it appears in the Input Controls tab on the Side Panel.
You can dene input controls using standard windows controls such as text boxes and radio buttons and
associate these input controls with one or more elements such as tables, sections, and charts in a report, or for
524
P U B L I C
SAP BusinessObjects Web Intelligence User's Guide
Analyzing data

all of the elements in a document. When you select values in the input control, you lter the values in the
associated report elements by the values you have selected.
You can use input controls to analyze dierent scenarios by changing the value of variables. For example, you
can assign a slider input control to a variable with a constant value. If the variable is part of a formula, you use
the slider control to examine dierent formula results based on the variable value.
Note
Input controls apply directly to the variables. You cannot dene dependencies on reports, report parts or
documents.
Filtering with element links
Report element links are another kind of input control, also displayed in the Input Controls tab. You can dene
tables and charts as input controls using element links. When you create an element link between a parent and
child elements, you can select values in the parent table or chart to lter the child report elements.
When you select a table or chart-based control in the Input Controls tab, the table or chart used as an input
control is highlighted.
Restriction
When a report is in drill mode, table and chart-based input controls are disabled. They are re-enabled when
drill mode is deactivated.
6.4.1 Using input controls with hierarchical data
You can use input controls on hierarchical data.
When you select a node of a hierarchy, you can select a single value and use the Equal to operator, or you can
select multiple values from a hierarchical tree list.
When you select a hierarchical tree list, right-click and select the member, its children, or its descendants in the
hierarchy. The elements of the hierarchies that you select display in the report pane.
SAP BusinessObjects Web Intelligence User's Guide
Analyzing data
P U B L I C 525
6.4.2 Available input controls
You can choose from several input controls to help users lter data in your reports.
Type
Description
Entry eld
For any type of object, you can use the entry eld input control on a report object
where you want to be able to directly type a value name into a text box. This is use
ful for objects with simple names, for example if you are using a Year universe ob
ject. In an input control based on year, you simply type the year and click OK.
To clear the input control, you delete the text box contents and click OK.
Combo box
For a dimension object, you can use the combo box to select a value from a list of
possible values. The combo box is compact and only expands when you select it,
otherwise only the current selection is displayed.
Radio buttons For a dimension object, you can use ever visible radio buttons to select one value
from a list of possible value.
List box
For a dimension object, you can use a list box that displays all available values.
For single value selections:
You can select one value from a list of possible values. The selected value is high
lighted.
For multiple value selections:
You can select several values from a list of possible values, using the Control and
click method, and then click
OK to update the display of those report elements af
fected by the input control.
Calendar
For a (dimension) date object, you can pick a value that appears in with a manual
entry text box or a calendar icon. If you click the calendar icon, you can then select
a date from a popup calendar.
Spinner For a measure object, you can have an arrow-activated, spinning list of values.
Simple slider For a measure object, you can have a slider bar to navigate to a specic value. You
must set interval bounds and a default value.
Tree list
For a dimension object, you can have a list of hierarchy values.
For single value selections:
You can select a node or node subset. By default, the control shows the currently
selected value, and can be toggled to tree selection.
For multiple value selections:
You can select more than one value from a list of possible values in a hierarchy, us
ing the Control and click method. By default, control displays the list of currently
selected values, and can be toggled to tree selection.
526 P U B L I C
SAP BusinessObjects Web Intelligence User's Guide
Analyzing data
Type Description
Check box For a dimension object, you can have a list of alternatives from which you can select
more than one value.
Note
The availability of the OK button is controlled in the input control create or edit
mode.
Double slider
For a measure object, you can have a slider list based on a measure object from
which you can select two values from an interval.
You must set interval bounds and default values.
6.4.3 To add an input control
You can add an input control to a Web Intelligence document.
Prerequisites
You must have sucient document modication rights to add input controls.
Procedure
1. In a Web Intelligence document in Design mode, do one of the following:
○ In the Input Controls tab in the Side Panel, click New.
○ In the Analysis tab, select the Filters subtab, and then from the Input Controls dropdown list, select
Dene Control.
If you selected an entire table or chart before clicking Dene Control or New, you can select Include objects
from selected block only or Filter objects to current selection to restrict the list of objects to the objects in
the table or chart you selected.
You can also select the type of input control directly from the list of controls under Analysis Filters
Controls instead of selecting Dene Control. Those controls not compatible with the data from the report
element you selected are disabled. The control is automatically associated with the report object that
supplies data to the selected report element and uses its default properties, and you move directly to
selecting the report elements you want the input control to lter.
2. In the Select Report Object panel, select the report object to supply values for the input control, then click
Next.
3. Select the input control type.
SAP BusinessObjects Web Intelligence User's Guide
Analyzing data
P U B L I C 527
The list of control types is determined by the data type of the report object. For more information on input
control types, see Available input controls [page 526].
4. Set the input control properties.
If you are in Web Intelligence Rich Client, click the empty eld next to the input control property.
The available properties are determined by the control type.
Rich Client interface
HTML or Applet In
terface Description
Label Name The name of the input control
Description The description of the input control
List of values The list of values available in the input control. You can use all values of
the report object on which the input control is based (the default) or
dene your own custom list of values.
Use restricted List of Values If you dene a custom list of values for the report object, this setting
lters the data in the report element you assign to the input control
based on this list of values. Even when no values are selected in the in
put control, any values not in the restricted list are excluded from the
report element ltered by the input control.
For example, if an input control based on the Country dimension is re
stricted to the values "US" and "France", a table ltered by the input
control shows data for US and France only, even when no value is se
lected in the input control.
If you deselect Use restricted List of Values, all values of Country appear
in the table when no value is selected in the input control.
Allow selection of all values
This property allows you to show or hide the All Values option in an in
put control. For example, you may want to hide the All values option
when the aggregation of the values makes no sense.
Operator Filter Operators The operator that the input control uses to lter the associated report
elements.
Default values The default values that the input control uses to lter the associated re
port element.
Allow selection of null values For the Combo box, Radio buttons, List box, and Check boxes input
controls, you can allow users to select null values.
When you select this option, [NULL_VALUE] is available in the input
control LOV. When a user selects [NULL_VALUE] in the list, the report
shows rows or columns without data. For example, if a user wants to
see customers who have not paid, then selecting [NULL_VALUE] for ob
ject “Invoice Date” results in a list showing only customers without an
invoice date.
For more information about how the NULL_VALUE LOV option com
pares to the [EMPTY_VALUE] LOV option, refer to Query lters and re
port lters compared [page 509].
528 P U B L IC
SAP BusinessObjects Web Intelligence User's Guide
Analyzing data
Rich Client interface
HTML or Applet In
terface Description
Number of lines The number of lines that the input control displays in the Input Control
pane. For example a list of ve radio buttons with Number of lines set to
3 displays only three radio buttons by default. You access the other two
radio buttons by using the scroll bar.
Minimum value
Min Value The minimum numerical value you can select in the input control.
Maximum value Max Value The maximum numerical value you can select in the input control.
Increment The amount by which the input control increases/decreases a numeri
cal value when you are choosing a value.
5. Click Next.
6. In the Assign Report Elements panel:
○ To assign the input control to all tables and charts in the document, select Entire document.
○ To assign the input control to all elements in a report, select Current report.
Note
Each time you save a document, any input controls that have no associated report elements are
removed.
7. Click Finish.
The input control appears on the Input Controls pane, which organizes input controls in the following
categories:
○ Document Input controls
○ Report Input controls
Related Information
To edit an input control [page 530]
6.4.4 To reuse an input control in another report within a
Web Intelligence document
You can reuse the input controls from an existing report in a new report.
Procedure
1. Open a Web Intelligence document in Design mode.
2. Go to the report with the input controls you want to reuse.
SAP BusinessObjects Web Intelligence User's Guide
Analyzing data
P U B L I C 529
3. Right-click the report tab and click Duplicate Report.
Results
The report and its input controls are duplicated.
6.4.5 To edit an input control
You can edit an input control in the Edit Input Control dialog box.
Procedure
1. In a Web Intelligence document in Design mode, select the Input Controls tab in the Side Panel.
2. Select the input control, then click the Edit icon on the input control toolbar to display the Edit Input Control
dialog box.
3. To edit the input control properties:
○ In the Web Intelligence HTML interface, edit the input control properties in the Properties tab.
○ In the Web Intelligence Applet interface or Web Intelligence Rich Client, edit the input control
properties in the Control tab.
4. Edit the report elements associated with the input control on the Dependencies tab:
○ To reassign an input control to all tables and charts in the document, select Entire document.
○ To reassign an input control to all elements in a report, select Current report.
5. Click OK to return to the document.
6.4.6 To view input control dependencies
You can view input control dependencies in a document.
Procedure
1. In a Web Intelligence document in Design mode, click the Input Controls tab in the Side Panel.
2. Do the following:
a. In the Web Intelligence HTML interface, select the input control in the list, then click the Highlight
dependencies icon on the input control toolbar.
b. In the Web Intelligence Applet interface or Web Intelligence Rich Client, click the Show dependencies
icon on the input control toolbar.
530
P U B L I C
SAP BusinessObjects Web Intelligence User's Guide
Analyzing data

c. Click Map at the top of the Input Controls tab.
This tab is sorted by:
○ Input controls and the elements they control
○ Reports, their elements, and their input controls
6.4.7 To organize input controls
You can change the order of input controls in the Input Controls pane.
Procedure
1. In a Web Intelligence document in Design mode, select the Input Controls tab in the Side Panel.
2. Drag and drop input controls to move them up or down on the Input Controls pane.
3. Select an input control, then click the Remove icon on the input control toolbar to remove it from the Input
Controls pane.
4. Click Yes to conrm the action.
6.4.8 To dene a table or chart as an input control
You can use a table or a chart as an input control in a Web Intelligence document.
Procedure
1. In a Web Intelligence document in Design mode, right-click the table or chart and select Linking Add
Element Link .
2. Do one of the following:
○ To dene all the objects in the table or chart as the ltering objects, select All objects.
○ To dene a single object in the table or chart as the ltering object, select Single object and then select
an object.
Note
You can select dimensions only as ltering objects when you dene a table or chart as an input control.
3. Click Next.
4. Type a name and a description for the input control, then click Next.
5. Select the report elements to be ltered by the input control.
SAP BusinessObjects Web Intelligence User's Guide
Analyzing data
P U B L I C 531
Note
You cannot select the table or chart that you are dening as an input control from the list of report
elements.
6. Click Finish.
The table or chart input control appears in the Input Controls pane. When you click Show Dependencies,
the table or chart dened as the input control is highlighted.
7. To modify the way a table or chart lters other report elements, right-click the table or chart and select
Linking Edit Element Link .
8. To remove a link between a table or chart and other report elements, disable the element link, then right-
click the table or chart and select
Linking Remove .
Related Information
To edit an input control [page 530]
6.4.9 To lter data using input controls
You can lter data in a document using input control.
Procedure
1. In a Web Intelligence document in Design mode, select the Input Controls tab in the Side Panel.
Note
The input control displays the following message if the report elements ltered by the input control are
no longer in the report: There are no dependent report elements in the report.
2. Select values in the input control.
The associated report elements are ltered based on the values you select. For example, if you select the
"US" value of the [Country] dimension, the lter operator is Equal To, and there is a table associated with
the input control, the table is ltered on the condition [Country] = "US".
Select [NULL_VALUE] to show rows or columns without data. For example, if you want to see customers
who have not paid, [NULL_VALUE] for object “Invoice Date” results in a list showing only customers
without an invoice date.
3. To lter using a table or chart dened as an input control, select dimension values in the table (rows,
columns or cells) or chart (clickable data areas).
532
P U B L I C
SAP BusinessObjects Web Intelligence User's Guide
Analyzing data
Note
○ Tables or charts dened as input controls can only lter using dimension values.
○ In the Web Intelligence Applet interface, a warning message appears when you delete objects used
by an input control.
○ The input control shows the following message if the table or chart is no longer in the report: The
table or chart is not in the report.
○ The input control shows the following message if the ltering dimensions are no longer in the table
or chart: Filtering dimensions not available. The input control becomes usable again if you add the
dimensions to the table or chart.
○ The input control shows the following message if the report is in drill mode: Control not usuable
while the report is in drill mode. Drill mode must be turned o to make the input control usable.
○ Table and chart-based input controls are indicated by an icon in the top corner of the table or
chart. Right-clicking the icon displays the following menu options:
Command Description
Edit Edits the input control
Highlight dependencies (Web Intelligence HTML
interface)
Show dependencies (Web Intelligence Applet
interface)
Highlights the report elements ltered by the input
control
Reset Removes the lters applied by the input control
Disable/Enable Disables or enables the input control
4. To remove all lters applied by input controls, click Reset at the top of the Input Controls pane.
6.5 Filtering data dynamically with groups of input controls
You can use a lter path to help you rene your data in a report.
A lter path is a visual representation of values you have successively selected for several input controls that
you have purposely grouped beforehand.
In Design mode only, you create a lter path by grouping several input controls together in a report, and then
select each one in the order that you would like your values to be ltered. The lter path allows you to control
the progressive renement of your data.
Caution
Restricting lists of values dependent on other input controls’ selections can decrease performance.
Example
Instead of selecting a city from a large list of values, it is easier to:
SAP BusinessObjects Web Intelligence User's Guide
Analyzing data
P U B L I C 533

1. Select a value for the Country input control to narrow down the possible regions.
2. Select a value from the restricted list of regions for the Region input control to further limit the number
of potential cities.
3. Select a value from the restricted list of cities for the City input control.
Your lter path would then look like this: Country Region Cities .
Tip
You can also group input controls to improve the layout of a report.
Related Information
To create a group of input controls [page 535]
Input controls eligible to groups and dynamic ltering [page 534]
Example: Creating a lter path [page 539]
6.5.1 Input controls eligible to groups and dynamic ltering
Depending on the input control and the properties you selected when you created it, it might not be eligible to
grouping, or eligible with restrictions regarding dynamic ltering.
Web Intelligence noties you whenever there are incompatibilities between the properties of an input control
and grouping or dynamic ltering when you create a group of input controls.
Input controls not eligible to grouping
Input controls can be ineligible for one of the reasons listed below:
● Restricted list of values
You have dened a list of values that might be incompatible with the restricted list of values resulting from
dynamic ltering.
● Default value
The default value of the input control might be incompatible with the restricted list of values resulting from
dynamic ltering.
● Excluding <All values>
The default value you have selected instead of <All values> might be incompatible with the restricted
list of values resulting from dynamic ltering.
Input controls that cannot be added to a group are grayed out and cannot be selected. An information icon and
a tooltip appear when you move the cursor over. When attempting to select them, a message is also displayed
at the bottom of the dialog box. Elements links and tree lists for example aren't eligible to grouping.
534
P U B L I C
SAP BusinessObjects Web Intelligence User's Guide
Analyzing data

Input controls eligible to grouping with restrictions regarding dynamic
ltering
Several input controls are not associated to a list of values and therefore cannot be ltered dynamically:
● Calendar
● Direct input
● Spinner
● Slider
If you select an input control from the list above to add it to a group, the incompatibility is explained in a tooltip
when you move the cursor over the warning icon. A message is also displayed at the bottom of the dialog box.
6.5.2 To create a group of input controls
Context
Before creating a lter path, you need to create a group of input controls in which you can apply a lter path.
Procedure
1. In the Side Panel, click the Input Controls pane.
2. Click Group.
3. Enter a name for the new group.
4. Click Document or Report to select from a list of either document input controls or report input controls.
A group cannot contain both report and document input controls. Make sure that the input controls you
add to a group are of the same type.
5. Select at least two input controls.
Note
You cannot have the same input control in two dierent groups. If you select an input control that
already belongs to another group, the other group will be reset without the selected input control, and
its lter path will be modied. Also, if you add an existing input control to a group, its value is reset to
"All values".
6. Click OK.
The group is now created and displayed in the Input Controls pane.
SAP BusinessObjects Web Intelligence User's Guide
Analyzing data
P U B L I C 535

Related Information
To create a lter path [page 536]
To reset a lter path [page 537]
Input controls eligible to groups and dynamic ltering [page 534]
6.5.3 To create a lter path
Context
Once you have a group of input controls, you can create a lter path. Make sure the rst input control in the
path returns the most general values, followed by input controls with increasing specicity so the lter path
narrows down your data selection in successive steps.
Procedure
1. Click the group for which you want to create a lter path.
2. Select one or more values for the rst input control of the group.
The report dynamically changes to display a restricted list of values ltered accordingly to the value of the
rst input control. The lter path is displayed on top of the rst input control of the group.
Note
You can modify the selected values at any time by clearing current values or selecting new ones. The
lter path will adapt accordingly.
3. Select a second input control and select one or more values. These are the values that have been restricted
by the previous input control.
The report adjusts to the new values.
4. Repeat the previous step for each of the following input controls.
Related Information
Filtering data dynamically with groups of input controls [page 533]
Input controls eligible to groups and dynamic ltering [page 534]
536
P U B L I C
SAP BusinessObjects Web Intelligence User's Guide
Analyzing data

6.5.4 To reset a lter path
Context
Resetting a lter path has the following eects in the group:
● Every value of each input control is reset to all values
● The order of the input controls specied in the removed lter path is reset to its original order in the group.
Procedure
1. Right-click the header of the group whose lter path you want to reset.
2. Click Reset.
Tip
You can also click the Clear lter path icon ( ) next to the name of the group.
6.5.5 To add an input control to a group
Context
Procedure
1. Right-click the input control you want to add to a group.
2. Click Add to Group.
3. Select the group to which you want to add the input control.
Results
The new input control is displayed at the bottom of the group.
SAP BusinessObjects Web Intelligence User's Guide
Analyzing data
P U B L I C 537

6.5.6 To remove an input control from a group
Context
Caution
If you remove an input control from a group that has only two input controls, the group is deleted. Also, if
the input control you remove belongs to a lter path, the lter path is modied.
Procedure
1. Right-click the input control you want to remove from the group.
2. In the contextual menu, click Ungroup.
Results
The input control you have just removed is now displayed underneath the group it belonged to.
6.5.7 To move an input control to another group
Context
Caution
If the input control you move belongs to a group that has only two input controls, the group will be deleted.
Also, if the input control is part of the lter path of its previous group, moving it to another group will
remove it from the lter path and will reset the values of its previous group.
Procedure
1. Right-click the input control you want to move to another group.
538
P U B L I C
SAP BusinessObjects Web Intelligence User's Guide
Analyzing data

2. In the context menu, select Move to group.
3. Select the new group.
6.5.8 To delete a group
Context
Procedure
1. Click the icon next to name of the group you want to delete.
2. Click Yes.
6.5.9 Example: Creating a lter path
You create a lter path by successively selecting dierent input controls, so that you can narrow down the
amount values you want to analyze in your report.
Checking the revenue generated by swimming suits in Kingston in 2014
As a regional marketing director for America, you want to check the revenue generated by the city of Kingston
in 2014, for the swimming suits product line. You have the following information:
● Two input controls, <Year 2014> and <Sales Revenue> have already been created in the report you are
working on.
● There is also a group of three input controls, named <Business>, with the following input controls inside:
<Country>, <City> and <Product>.
So, you would like to create a lter path to display the information you are interested in and lter your data.
1. Select the value of the rst input control of the group, <Country>: Jamaica.
You can see that the list of possible values for <City> decreased and displays only the value for Jamaica.
Let’s say that you want to take a closer look at Kingston, to see if the results are better than last year.
2. Select Kingston as the value for the second input control, <City>.
Again, the values of the last input controls are ltered to show only the remaining possible values.
3. Select the swimming suits in the third input control, <Product>, to get a quick view of the result you
wanted to get originally.
SAP BusinessObjects Web Intelligence User's Guide
Analyzing data
P U B L I C 539

You can now see in the table the revenue generated by swimming suits in Kingston in 2014.
Notice how the three input controls of the group now have a shape and a color associated to them in the input
control pane. They indicate that these input control belong to the lter path.
You can see the lter path as you go along in the Input Controls pane on the left. It should look like this:
Jamaica Kingston Swimming Suits .
If you want to drill up and get a look a broader results, for the whole country for instance, reset the second input
control to <all values> to see the revenue generated by the other cities of the country.
Modifying the lter path of a group
To modify the lter path, for example if you want to see the result for the country France instead of Jamaica,
expand the <Country> input control and select <France>.
Results:
● The <City> input control is expanded.
● The list of values of the input control <City> is reset to display only the cities from France, and the
selection is reset to
<All Values>.
6.6 Using functions, formulas and calculations for data
analysis
6.6.1 Document History: Web Intelligence Functions,
Formulas and Calculations
The following table provides an overview of the most important document changes.
Version Date Description
SAP BusinessObjects Web Intelligence
4.2 Support Package 4
April 2017 The following sections have been
added to the guide or updated:
● Building custom functions
Overview of calculation extensions
[page 793]
● New DatesBetween function
added DatesBetween [page 639]
● New TimeBetween function added
TimeBetween [page 651]
● New sorting_order and
show_definitive_prompts
parameters available to the
540 P U B L I C
SAP BusinessObjects Web Intelligence User's Guide
Analyzing data

Version Date Description
PromptSummary function
PromptSummary [page 680]
SAP BusinessObjects Web Intelligence
4.2 Support Package 3
August 2016 The following sections have been
added to the guide or updated:
● New MemberAtDepth function
added MemberAtDepth [page
736]
● Updated QuerySummary function
with new StatusOfData
parameter for BW data sources
QuerySummary [page 681]
SAP BusinessObjects Web Intelligence
4.2 Support Package 2
March 2016 The following section has been added
to the guide:
● Description of Comment function
Comment [page 747]
SAP BusinessObjects Web Intelligence
4.2
November 2015 The following sections have been
added to the guide:
● Description of Automatic Formula
Rewrite mechanism Automatic
rewrite formula mechanism [page
805]
● SAP HANA Online mode formulas,
functions and operators
restrictions
Function and formula
operators [page
549]
● Strings to create custom formats
for weeks Custom formats [page
361]
● Time zone can be displayed on a
date/time value Custom formats
[page 361]
● New ToDecimal function added
ToDecimal [page 717]
● Updated Concatenation function
behavior
Concatenation [page
617]
6.6.2 About this guide
The Using Functions, Formulas and Calculations in Web Intelligence guide provides detailed information on the
advanced calculation capabilities that you can use when you perform data analysis.
This guide also provides a syntax reference to the available functions and operators.
SAP BusinessObjects Web Intelligence User's Guide
Analyzing data
P U B L I C 541
6.6.3 Using standard and custom calculations
6.6.3.1 Using standard and custom calculations
You can use standard calculation functions to make quick calculations on data.
If standard calculations are not sucient for your needs, you can use the formula language to build custom
calculations.
6.6.3.1.1 Standard calculations
You can use standard calculation functions to make quick calculations on data.
The following standard calculations are available:
Calculation
Description
Sum Calculates the sum of the selected data.
Count Counts all rows for a measure object or count distinct rows for a dimension or detail object.
Average Calculates the average of the data.
Minimum Displays the minimum value of the selected data.
Maximum Displays the maximum value of the selected data.
Percentage Displays the selected data as a percentage of the total. The results of the percentage are
displayed in an additional column or row of the table.
Note
Percentages are calculated for the selected measure compared to the total results for
that measure on the table or break. To calculate the percentage of one measure com
pared to another measure, you need to build a custom calculation.
Default
Applies the default aggregation function to a standard measure, or the database aggrega
tion function to a smart measure.
When you apply standard calculations to table columns, the calculation results appear in footers. One footer is
added for each calculation.
6.6.3.1.2 Using formulas to build custom calculations
Custom calculations allow you to add additional calculations to your report beyond its base objects and
standard calculations.
You add a custom calculation by writing a formula. A formula can consist of base report variables, functions,
operators and calculation contexts.
542
P U B L I C
SAP BusinessObjects Web Intelligence User's Guide
Analyzing data

A custom calculation is a formula that can consist of report objects, functions and operators. Formulas have a
calculation context that you can specify explicitly if you choose.
Example
Showing average revenue per sale
If you have a report with Sales Revenue and Number Sold objects and you want to add revenue per sale to
the report, the calculation [Sales Revenue]/[Number Sold] gives this value by dividing the revenue by
the number of items sold in order to give the revenue per item.
6.6.3.1.2.1 Using variables to simplify formulas
Variables are useful to break down formulas into manageable parts and make them easier to read. They also
make building a formula less error-prone.
Variables are available in the Available Objects pane, under the Variables folder.
As of the 4.2 SP4 release, a new Description eld is available so that you can provide context and details about
a specic variable. The description that you enter is then displayed in the Query Panel when you hover over the
variable. You can edit this description when creating, editing or renaming a variable.
6.6.3.1.3 Working with functions
A custom calculation sometimes contains only report objects, for example [Sales Revenue]/[Number of
Sales]. Calculations can also include functions in addition to report objects.
A function receives zero or more values as input and returns output based on those values. For example, the
Sum function totals all the values in a measure and outputs the result. The formula Sum([Sales Revenue])
outputs a total of sales revenues. In this case, the function input is the Sales Revenue measure and the output
is the total of all Sales Measures.
Related Information
Function and formula operators [page 549]
Functions [page 571]
SAP BusinessObjects Web Intelligence User's Guide
Analyzing data
P U B L I C 543
6.6.3.1.3.1 Including functions in cells
The text in report cells always begins with ‘=’ .
Literal text appears in quotation marks, while formulas appear without quotation marks. For example, the
formula Average([Revenue]) appears in a cell as =Average([Revenue]). The text “Average Revenue?"
appears as
="Average Revenue?"
You can use text alone in a cell, or mix formulas and text by using the ‘+’ operator. If you want a cell to display
the average revenue preceded by the text “Average Revenue:", the cell text is as follows: ="Average
Revenue: " + Average([Revenue])
Note the space at the end of the text string so that the text and the value are not placed directly side-by-side in
the cell.
6.6.3.1.3.2 Function syntax
The Formula Editor displays the function syntax when you select the function.
To use a function you need to know its name, how many input values it requires and the data types of these
input values. You also need to know the type of data that the function outputs.
For example, the Sum function takes a numerical object as input (for example a measure showing sales
revenue) and outputs numeric data (the sum of all the values of the measure object).
Here is the syntax of the Abs function:
num Abs(number)
This syntax tells you that the Abs function takes a single number as input and returns a number as output.
6.6.3.1.3.3 Examples of functions
This topic oers examples of functions used in formulas.
Example
Showing prompt input with the UserResponse function
You have a report showing Year, Quarter and Sales revenue. The State object also appears in the report
data, although it is not displayed. When the user runs the report they are presented with a prompt and they
must choose a state. You want to show the state that they have chosen in the report title. If your data
provider is called “eFashion" and the text in the prompt is “Choose a State", the formula for the title is:
"Quarterly Revenues for " + UserResponse([Query 1];"Enter values for State:")
The report is as follows when the user has chosen Illinois as the state when refreshing the data provider:
544
P U B L I C
SAP BusinessObjects Web Intelligence User's Guide
Analyzing data
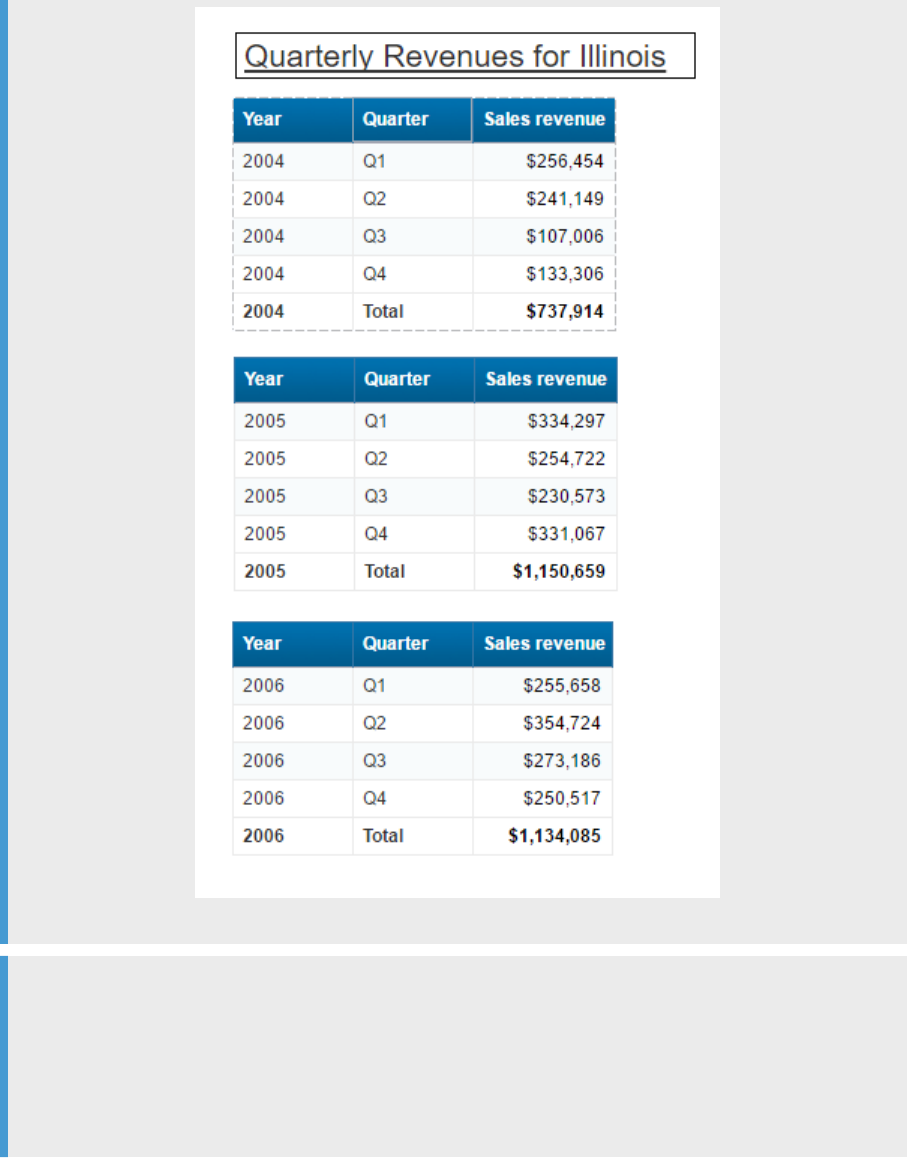
Example
Calculating a percentage using the Percentage function
The Percentage function calculates percentages. This function calculates the percentage of a number in
relation to its surrounding context. For example, the following table shows revenues by year and quarter.
The percentage column contains the formula Percentage ([Sales revenue]).
SAP BusinessObjects Web Intelligence User's Guide
Analyzing data
P U B L I C 545
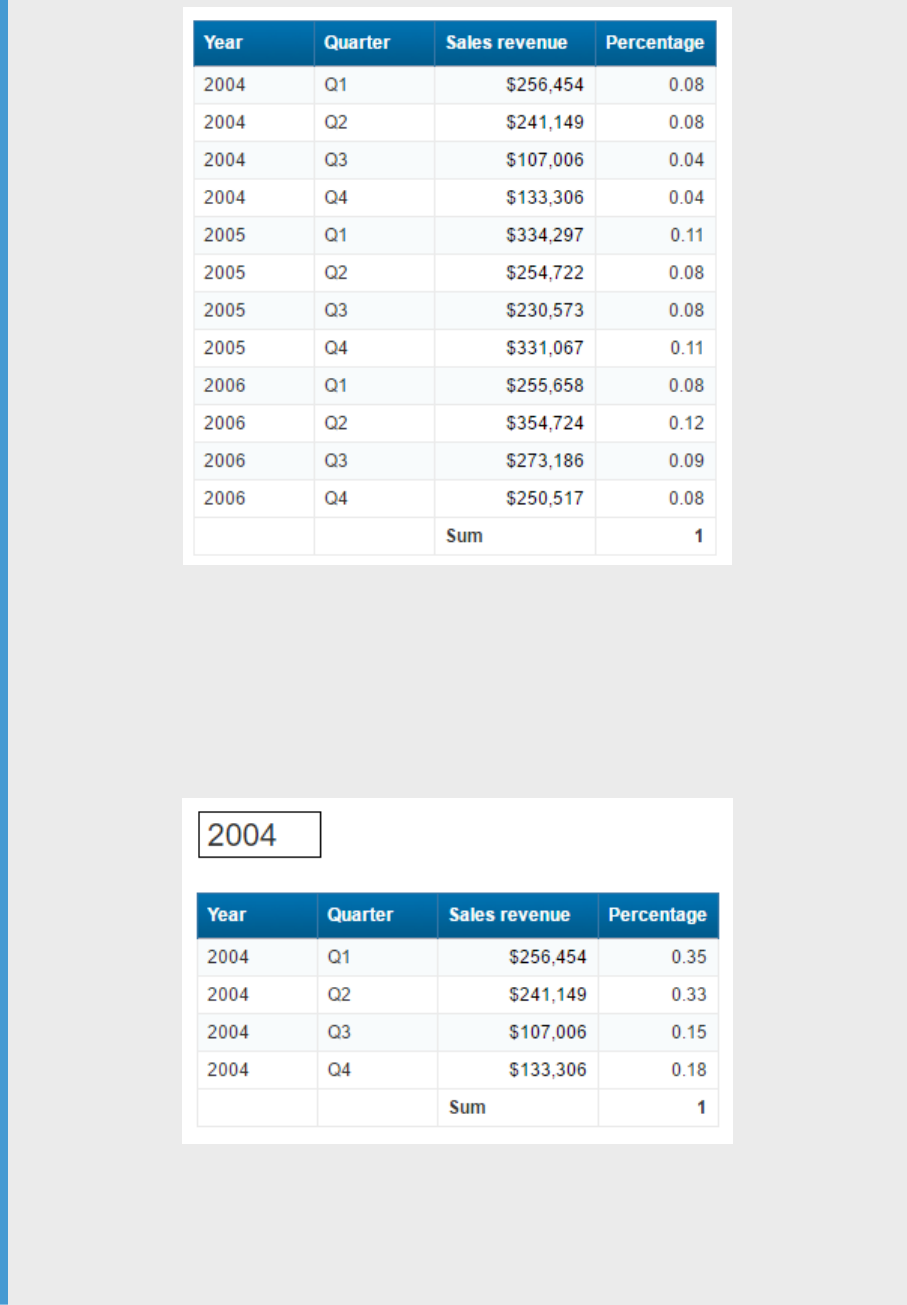
In this case the function calculates each revenue as a percentage of the total revenue. The surrounding
context is the total revenue; this is the only revenue gure that is relevant outside the breakdown by year
and quarter in the table.
If the report is split into sections by year, the surrounding context outside the table becomes the total
revenue in the section.
If the Percentage cell is placed outside the table but still inside the section, the surrounding context
becomes the total revenue. In this case the Percentage function calculates the total revenue for the section
as a percentage of the total overall revenue.
546
P U B L I C
SAP BusinessObjects Web Intelligence User's Guide
Analyzing data
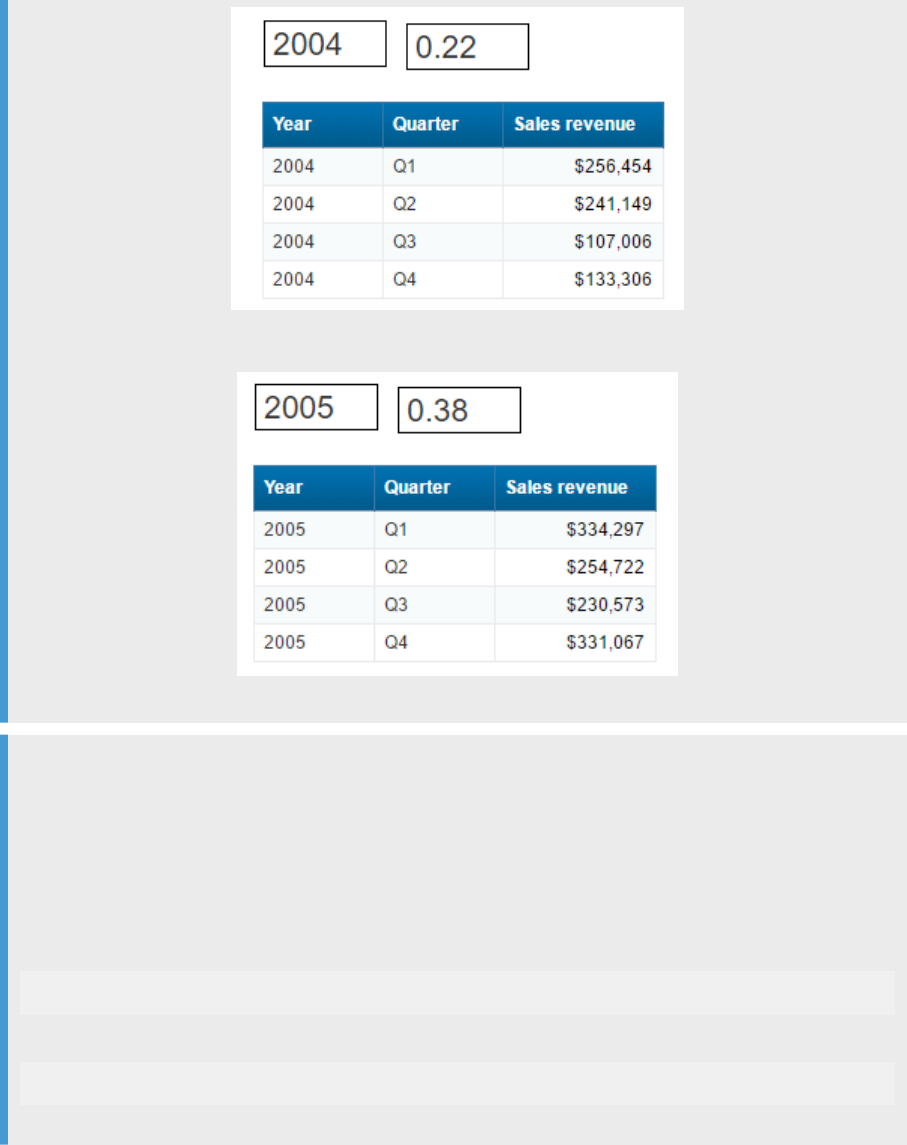
Example
Calculating a percentage using the Sum function
You can gain more control over the context in which a percentage is calculated by using the Sum function
rather than the Percentage function. If you divide one gure in a set of gures by the total of those gures,
you get its percentage of the total; for example, the formula [Sales revenue]/Sum([Sales revenue]) gives
the sales revenue as a percentage of the total revenue.
In the following table the Percentage of Total column has the formula:
[Sales revenue]/(Sum([Sales revenue] In Report))
and the Percentage of Year column has the formula:
[Sales revenue]/(Sum([Sales revenue] In Section))
SAP BusinessObjects Web Intelligence User's Guide
Analyzing data
P U B L I C 547
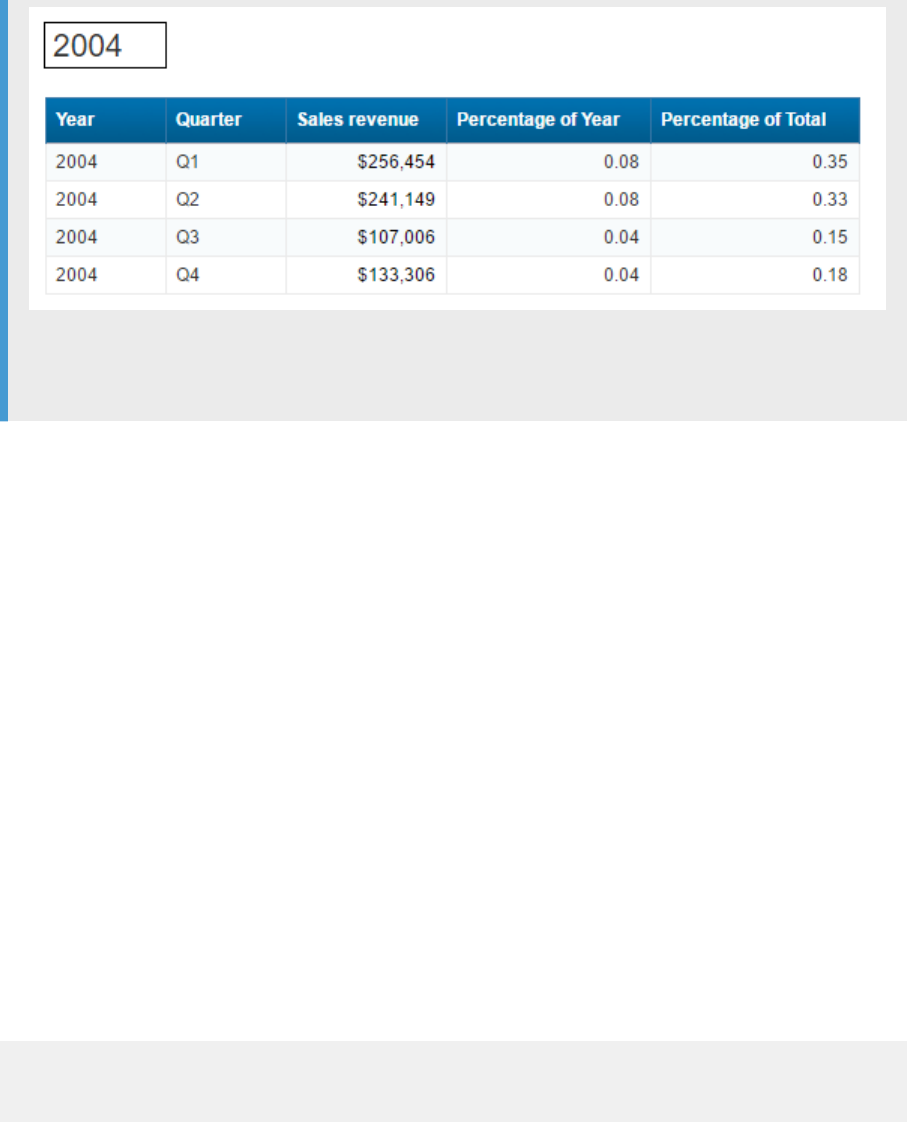
These formulas take advantage of the extended syntax keywords Report and Section to instruct the Sum
function to calculate the overall total revenue and yearly revenue respectively.
Related Information
Modifying the default calculation context with extended syntax [page 559]
6.6.3.1.3.3.1 Simplifying a variance formula with variables
Variance is a statistical term. The variance of a set of values measures the spread of those values around their
average.
The Var function calculates the variance in one step, but manual calculation of variance provides a good
example of how to simplify a complex formula using variables. To calculate the variance manually you need to:
● calculate the average number of items sold
● calculate the dierence between each number of items sold and the average, then square this value
● add up all these squared dierences
● divide this total by the number of values - 1
You have a report showing numbers of items sold by quarter and you want to include the variance. Without the
use of variables to simplify it, this complex formula is as follows:
Sum((([Quantity sold] - Average([Quantity sold] ForEach [Quarter]) In
Report)*([Quantity sold] - Average([Quantity sold] ForEach [Quarter]) In
Report)) In [Quarter])/(Count ([Quantity sold] ForEach [Quarter]) - 1)
Creating the variance formula
There are several steps involved in creating a variance formula. You encapsulate each of these steps in a
variable. The variables you create are:
548
P U B L I C
SAP BusinessObjects Web Intelligence User's Guide
Analyzing data
● average number of items sold
● number of observations (that is, the number of separate values of the number of items sold)
● dierence between an observation and the average, squared
● sum of these dierences divided by the number of observations - 1
The variable formulas are as follows:
Variable
Formula
Average Sold Average([Quantity sold] In ([Quarter])) In Report
Number of Observations Count([Quantity sold] In ([Quarter])) In Report
Dierence Squared Power(([Quantity sold] - [Average sold]);2)
Variance Sum([Dierence squared] In ([Quarter]))/([Number of Ob
servations] - 1)
The nal formula becomes the following:
Sum ([Difference Squared])/[Number of Observations] - 1)
This formula is much easier to understand. This simplied version of the formula gives you a high-level view of
what the formula is doing, rather than plunging you into the confusing details. You can then examine the
formulas of the variables referenced in the high-level formula to understand its component parts.
For example, the formula references the variable Dierence squared, which itself references the variable
Average sold. By examining the formulas of Dierence squared and Average sold, you can drill down into the
formula to understand the details of what it is doing.
6.6.3.1.3.4 Function and formula operators
Operators link the various components in a formula.
Formulas can contain mathematical, conditional, logical, function-specic or extended syntax operators.
SAP HANA Online mode operators restrictions
The table below lists the operators that are not supported in SAP HANA Online mode.
Operator Type
Operator
Function-specic operators Drill
Index
Where
Extended syntax operators In
ForEach
SAP BusinessObjects Web Intelligence User's Guide
Analyzing data
P U B L I C 549
Operator Type Operator
ForAll
6.6.3.1.3.4.1 Mathematical operators
Mathematical operators are familiar from everyday arithmetic.
There are addition (+), subtraction (-), multiplication (*), division (/) operators that allow you to perform
mathematical operations in a formula. The formula [Sales Revenue] - [Cost of Sales]contains a
mathematical operator, in this case subtraction.
Note
When used with character strings, the ‘+’ operator becomes a string concatenation operator. That is, it
joins character strings. For example, the formula “John" + “ Smith" returns "John Smith".
6.6.3.1.3.4.2 Conditional operators
Conditional operators determine the type of comparison to be made between values.
Operator
Description
= Equal to
> Greater than
< Less than
>= Greater than or equal to
<= Less than or equal to
<> Not equal to
You use conditional operators with the If function, as in:
If [Revenue]>10000 Then "High" Else "Low"
which returns “High" for all rows where the revenue is greater than or equal to 10000 and “Low" for all other
rows.
6.6.3.1.3.4.3 Logical operators
The logical operators are And, Or, Not, Between and InList.
Logical operators are used in boolean expressions, which return True or False.
550
P U B L I C
SAP BusinessObjects Web Intelligence User's Guide
Analyzing data
6.6.3.1.3.4.4 Context operators
Context operators form part of extended calculation syntax.
Extended syntax allows you to dene which dimensions a measure or formula takes into account in a
calculation.
6.6.3.1.3.4.5 Function-specic operators
Some functions can take specic operators as arguments.
For example, the Previous function can take the Self operator.
All functions use ) and ( to enclose function arguments. Functions that accept multiple parameters use ; to
separate the parameters.
6.6.4 Understanding calculation contexts
6.6.4.1 Understanding calculation contexts
The calculation context is the data that a calculation takes into account to generate a result.
This means that the value given by a measure is determined by the dimensions used to calculate the measure.
A report contains two kinds of objects:
● Dimensions represent business data that generate gures. Store outlets, years or regions are examples of
dimension data. For example, a store outlet, a year or a region can generate revenue: we can talk about
revenue by store, revenue by year or revenue by region.
● Measures are numerical data generated by dimension data. Examples of measure are revenue and number
of sales. For example, we can talk about the number of sales made in a particular store.
Measures can also be generated by combinations of dimension data. For example, we can talk about the
revenue generated by a particular store in 2005.
The calculation context of a measure has two components:
● the dimension or list of dimensions that determine the measure value
● the part of the dimension data that determines the measure value
The calculation context has two components:
● The input context
● The output context
SAP BusinessObjects Web Intelligence User's Guide
Analyzing data
P U B L I C 551
Related Information
The input context [page 552]
The output context [page 553]
6.6.4.1.1 The input context
The input context of a measure or formula is the list of dimensions that feed into the calculation.
The list of dimensions in an input context appears inside the parentheses of the function that outputs the value.
The list of dimensions must also be enclosed in parentheses (even if it contains only one dimension) and the
dimensions must be separated by semicolons.
Example
Specifying an input context
In a report with Year sections and a block in each section with Customer and Revenue columns, the input
contexts are:
Report part
Input context
Section header and block footers Year
Rows in the block Year, Customer
In other words, the section headers and block footers show aggregated revenue by Year, and each row in
the block shows revenue aggregated by Year and Customer (the revenue generated by that customer in the
year in question).
When specied explicitly in a formula, these input contexts are:
Sum ([Revenue] In ([Year]))
Sum ([Revenue] In ([Year];[Customer]))
That is, the dimensions in the input context appear inside the parentheses of the function (in this case,
Sum) whose input context is specied.
552
P U B L I C
SAP BusinessObjects Web Intelligence User's Guide
Analyzing data
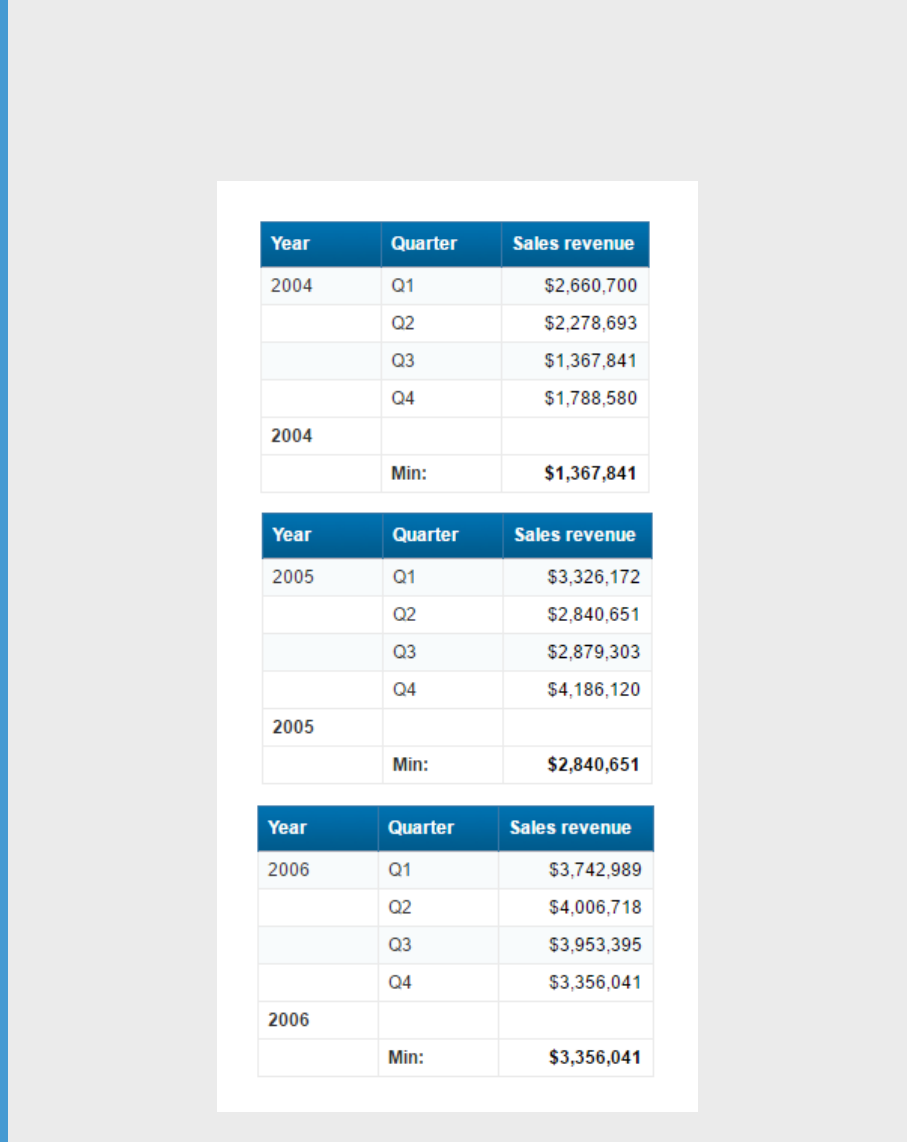
6.6.4.1.2 The output context
The output context causes the formula to output a value if it is placed in the footer of a block containing a
break.
Example
Specifying an output context
The following report shows revenue by year and quarter, with a break on year, and the minimum revenue
calculated by year:
SAP BusinessObjects Web Intelligence User's Guide
Analyzing data
P U B L I C 553
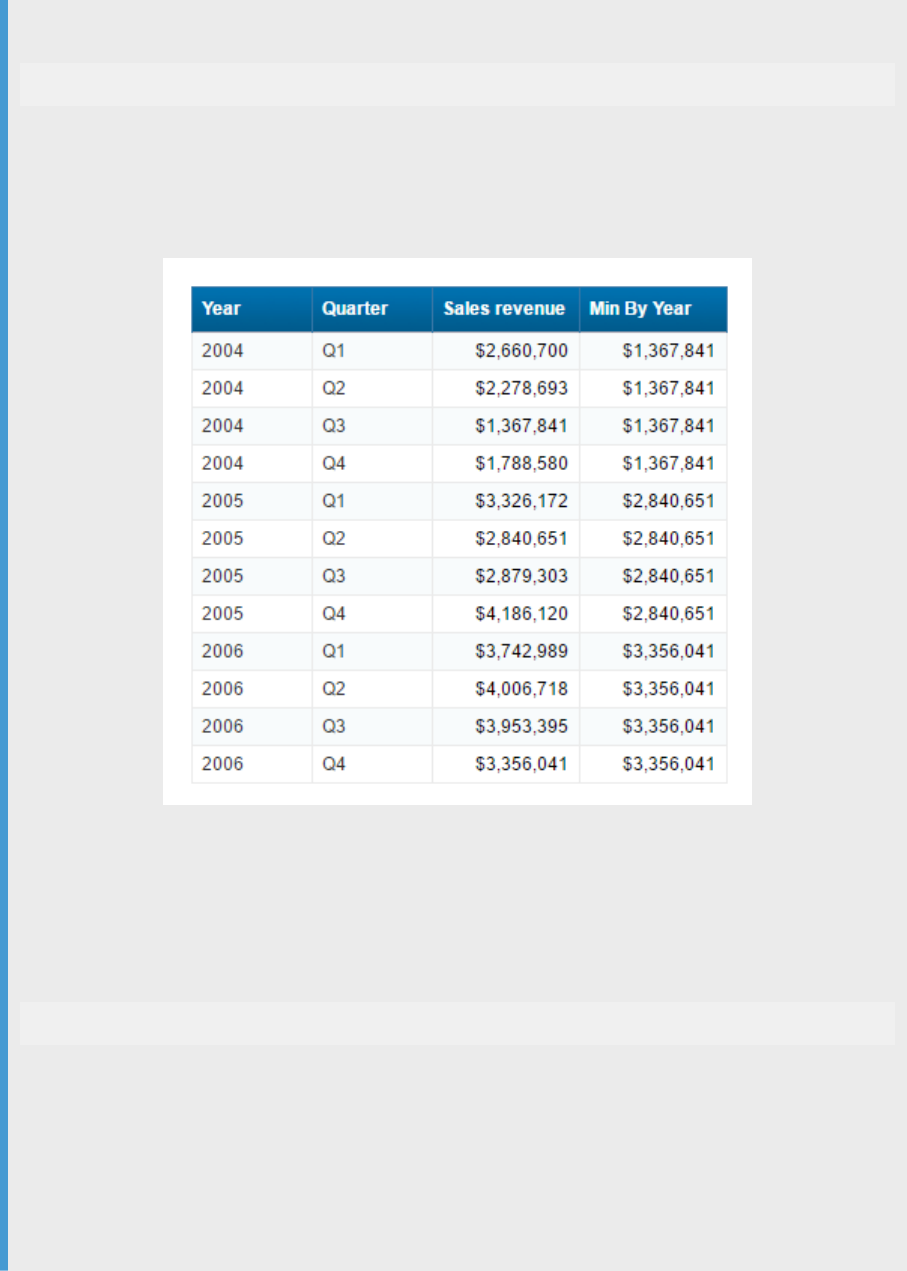
What if you want to show the minimum revenue by year in a block with no break? You can do this by
specifying the output context in a formula. In this case, the formula looks like this:
Min ([Sales revenue]) In ([Year])
That is, the output context appears after the parentheses of the function whose output context you are
specifying. In this case, the output context calculates the minimum revenue by year.
If you add an additional column containing this formula to the block, the result is as follows:
You can see that the Min By Year column contains the minimum revenues that appear in the break footers
in the previous report.
Notice that in this example, the input context is not specied because it is the default context (Year,
Quarter) for the block. In other words, the output context determines which revenue by year and quarter to
output. In full, with both input and output formulas explicitly specied, the formula looks like this:
Min ([Sales revenue] In([Year];[Quarter])) In ([Year])
This formula calculates revenues by year by quarter, then outputs the smallest of these revenues that
occurs in each year.
What would happen if you did not specify the output context in the Min by Year column? In this case, these
gures would be identical to the gures in the Sales revenue column. Why? Remember that the default
context in a block includes the dimensions in that block. The minimum revenue by year by quarter is the
same as the revenue by year by quarter simply because there is only one revenue for each year/quarter
combination.
554
P U B L I C
SAP BusinessObjects Web Intelligence User's Guide
Analyzing data
6.6.4.1.3 Default calculation contexts
A measure has a default calculation context depending on its place in the report.
The gures returned by a measure depend on the dimensions with which it is associated. This combination of
dimensions represents the calculation context.
You can change the default context with extended syntax. In other words, you can determine the set of
dimensions used to generate a measure. This is what is meant by dening the calculation context.
Example
Default contexts in a report
This example describes the default calculation context of the measures in a simple report. The report
shows revenue generated by customers and is split into sections by year.
2005
Total: 8000
Customer Revenue
Harris 1000
Jones 3000
Walsh 4000
Total: 8000
Report total: 8000
The table below lists the calculation context of the measures in this report:
Measure
Value Context
Report total 20000 Total of all revenues in the report
Section header total 8000 Year
Customer total 1000, 3000, 4000 Year;Customer
Block footer total 8000 Year
Related Information
Understanding calculation contexts [page 551]
Modifying the default calculation context with extended syntax [page 559]
SAP BusinessObjects Web Intelligence User's Guide
Analyzing data
P U B L I C 555

6.6.4.1.3.1 Default contexts in a vertical table
A vertical table is a standard report table with headers at the top, data going from top to bottom and footers at
the bottom.
The default contexts in a down table are:
When the calculation is in the...
The input context is The output context is
Header The dimensions and measures used to
generate the body of the block
All the data is aggregated then the cal
culation function returns a single value
Body of the block
The dimensions and measures used to
generate the current row
The same as the input context
Footer The dimensions and measures used to
generate the body of the block
All the data is aggregated then the cal
culation function returns a single value
6.6.4.1.3.2 Default contexts in a horizontal table
The default contexts for a horizontal table are the same as those for a vertical table.
A horizontal table is like a vertical table turned on its side.
The appearance of the horizontal table depends on the Preferred Viewing Locale you have selected in the BI
launch pad preferences. Some locales, like the English locale, use the left-to-right (LTR) interface positioning,
whereas others, like the Arabic locale, use the right-to-left (RTL) interface positioning.
In an LTR locale, headers appear at the left, data goes left to right and footers appear at the right. In an RTL
locale, headers appear at the right, data goes right to left and footers appear at the left.
6.6.4.1.3.3 Default contexts in a crosstab table
A crosstab displays data in a matrix with measures appearing at the intersections of dimensions.
The default contexts in a crosstab are:
The calculation is in the...
The input context is... The output context is...
Header The dimensions and measures used to
generate the body of the block.
All the data is aggregated, then the cal
culation function returns a single value.
Body of the block The dimensions and measures used to
generate the body of the block.
The same as the input context.
Footer The dimensions and measures used to
generate the body of the block.
All the data is aggregated, then the cal
culation function returns a single value.
556 P U B L I C
SAP BusinessObjects Web Intelligence User's Guide
Analyzing data
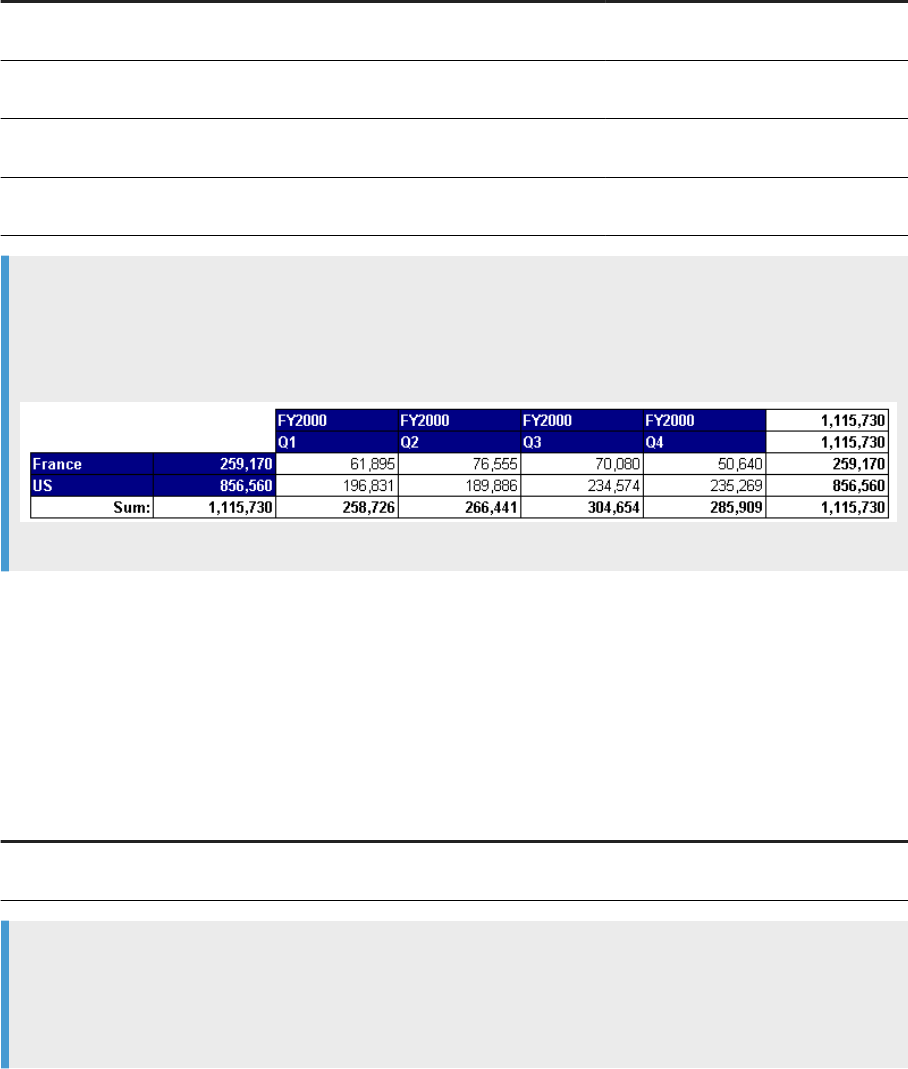
The calculation is in the... The input context is... The output context is...
VBody footer The dimensions and measures used to
generate the current column.
All the data is aggregated, then the cal
culation function returns a single value.
HBody Footer The dimensions and measures used to
generate the current row.
All the data is aggregated, then the cal
culation function returns a single value.
VFooter Same as footer. All the data is aggregated, then the cal
culation function returns a single value.
HFooter Same as footer. All the data is aggregated, then the cal
culation function returns a single value.
Example
Default contexts in a crosstab
The following report shows the default contexts in a crosstab:
6.6.4.1.3.4 Default contexts in a section
A section consists of a header, body and footer.
The default contexts in a section are:
The calculation is in the...
The input context is... The output context is...
Body The dimensions and measures in the report,
ltered to restrict the data to the section data.
All the data is aggregated, then the calcu
lation function returns a single value.
Example
Default contexts in a section
The following report shows the default contexts in a section:
SAP BusinessObjects Web Intelligence User's Guide
Analyzing data
P U B L I C 557
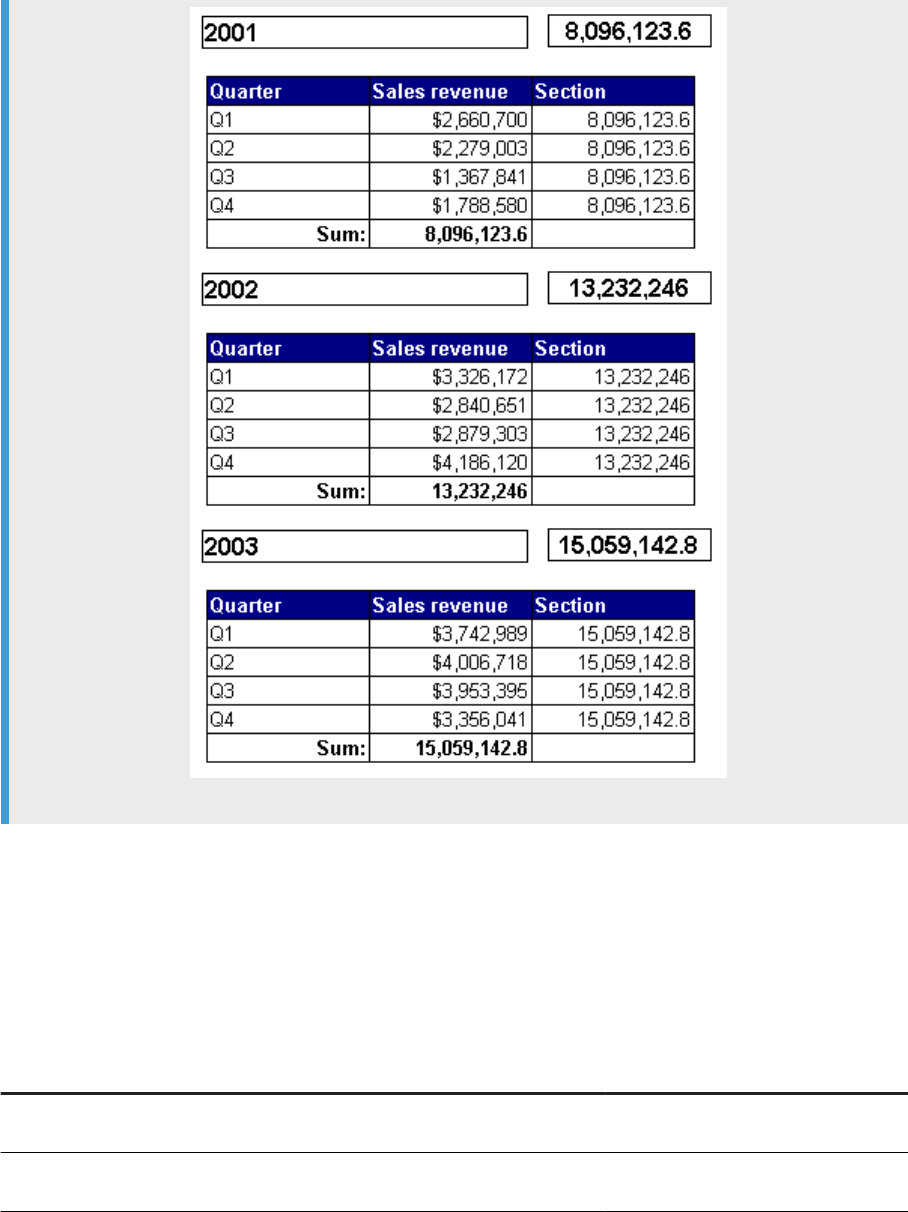
6.6.4.1.3.5 Default contexts in a break
A break consists of a header, body and footer.
The default contexts in a break are:
The calculation is in the...
The input context is... The output context is...
Header Current instance of the break. All the data is aggregated, then the cal
culation function returns a single value.
Footer Current instance of the break. All the data is aggregated, then the cal
culation function returns a single value.
558 P U B L I C
SAP BusinessObjects Web Intelligence User's Guide
Analyzing data
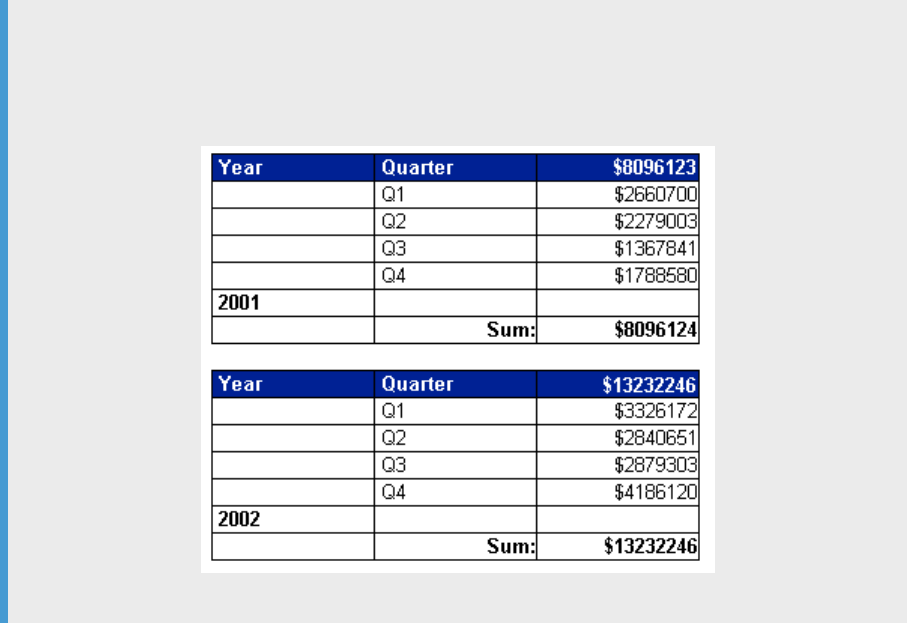
Example
Default contexts in a break
The following report shows the default contexts in a break:
6.6.4.1.4 Modifying the default calculation context with
extended syntax
Extended syntax uses context operators that you add to a formula or measure to specify its calculation
context.
A measure or formula context consists of its input context and output context.
Related Information
Extended syntax keywords [page 786]
Extended syntax operators [page 559]
6.6.4.1.4.1 Extended syntax operators
You specify input and output contexts explicitly with context operators.
The following table lists the context operators:
SAP BusinessObjects Web Intelligence User's Guide
Analyzing data
P U B L I C 559
Operator Description
In Species an explicit list of dimensions to use in the context.
ForEach Adds dimensions to the default context
ForAll Removes dimensions from the default context
The ForAll and ForEach operators are useful when you have a default context with many dimensions. It is often
easier to add or subtract from the context using ForAll and ForEach than it is to specify the list explicitly using
In.
6.6.4.1.4.1.1 In context operator
The In context operator species dimensions explicitly in a context.
Example
Using In to specify the dimensions in a context
In this example you have a report showing Year and Sales revenue. Your data provider also contains the
Quarter object but you do not include this dimension in the block. Instead, you want to include an additional
column to show the maximum revenue by quarter in each year. Your report looks like this:
Year Sales revenue Max Quarterly Revenue
2001 $8,096,123.60 $2,660,699.50
2002 $13,232,246.00 $4,186,120.00
2003 $15,059,142.80 $4,006,717.50
You can see where the values in the Max Quarterly Revenue column come from by examining this block in
conjunction with a block that includes the Quarter dimension:
Year Quarter Sales revenue
2001 Q1 $2,660,699.50
2001 Q2 $2,279,003.00
2001 Q3 $1,367,841.00
2001 Q4 $1,788,580.00
Max: $2,660,699.50
Year Quarter Sales revenue
Q1 $3,326,172.00
Q2 $2,840,651.00
Q3 $2,879,303.00
Q4 $4,186,120.00
Max: $4,186,120.00
560 P UB L I C
SAP BusinessObjects Web Intelligence User's Guide
Analyzing data
Year Quarter Sales revenue
Q1 $3,742,989.00
Q2 $4,006,717.50
Q3 $3,953,395.00
Q4 $3,356,041.00
Max: $4,006,717.50
The Max Quarterly Revenue column shows the highest quarterly revenue in each year. For example, Q4 has
the highest revenue in 2002, so the Max Quarterly Revenue shows Q4 revenue on the row showing 2002.
Using the In operator, the formula for Max Quarterly Revenue is
Max ([Sales revenue] In ([Year];[Quarter])) In ([Year])
This formula calculates the maximum sales revenue for each (Year,Quarter) combination, then outputs this
gure by year.
Note
Because the default output context of the block is Year, you do not need to specify the output context
explicitly in this formula.
6.6.4.1.4.1.2 ForEach context operator
The ForEach operator adds dimensions to a context.
Example
Using ForEach to add dimensions to a context
The following table shows the maximum revenue for each Quarter in a report which contains the Quarter
dimension but does not include it in the block:
Year Sales revenue Max Quarterly Revenue
2001 8096123.60 2660699.50
2002 13232246.00 4186120.00
2003 15059142.80 4006717.50
It is possible to create a formula for the Max Quarterly Revenue column that does not include the ForEach
operator:
Max ([Sales revenue] In ([Year];[Quarter])) In ([Year])
Using the ForEach context operator, you can achieve the same result with the following formula:
Max ([Sales revenue] ForEach ([Quarter])) In ([Year])
SAP BusinessObjects Web Intelligence User's Guide
Analyzing data
P U B L I C 561

Why? Because the Year dimension is the default input context in the block. By using the ForEach operator, you
add the Quarter dimension to the context, giving an input context of ([Year];[Quarter]).
6.6.4.1.4.1.3 ForAll context operator
The ForAll context operator removes dimensions from a context.
Example
Using ForAll to remove dimensions from a context
You have a report showing Year, Quarter and Sales revenue and you want to add a column that shows the
total revenue in each year, as shown in the following block:
To total revenues by year the input context needs to be (Year); by default it is (Year; Quarter). Therefore, you
can remove Quarter from the input context by specifying ForAll ([Quarter]) in the formula, which
looks like this:
Sum([Sales revenue] ForAll ([Quarter]))
Note that you can use the In operator to achieve the same thing; in this case the formula is:
Sum([Sales revenue] In ([Year]))
This version of the formula explicitly species Year as the context, rather than removing Quarter to leave
Year.
562
P U B L I C
SAP BusinessObjects Web Intelligence User's Guide
Analyzing data

6.6.5 Calculating values with smart measures
6.6.5.1 Calculating values with smart measures
Smart measures are measures whose values are calculated by the database (relational or OLAP) on which a
universe is based.
They dier from classic measures, which are calculated from the detailed values returned by the database. The
data returned by smart measures is aggregated in ways not supported natively by the Web Intelligence
component of the SAP BusinessObjects Business Intelligence platform.
Queries that contain smart measures calculate the measures in all the calculation contexts required in a report.
These contexts can change as the report changes. As a result, the query changes at each data refresh after the
required contexts have changed.
When you edit such a report, automatically the #TOREFRESH message is inserted in the report reminding you
that the report should be refreshed in order to reect the changes. You can choose to update the report
automatically by selecting the Auto-refresh document option in the Document properties dialog
Note
The measure delegation is static and dened based on the report denition at design time. In some cases
(formula based on “if [choice]= 1 then [dimension 1) else [dimension 2]” ) the dimensional context is
variable at run time. In this case the system cannot delegate the measure calculation and returns an empty
value.
Smart measures behave dierently from classic measures, which support a basic set of aggregation functions
(Max, Min, Count, Sum, Average) that can be calculated in all contexts without help from the database. For
example, if you build a query containing the [Country] and [Region] dimensions and the [Revenue] measure
(which calculates the sum of the revenue), the initial display shows Country, Region and Revenue in a block. If
you remove Region from the block, the total revenue for each country can still be calculated without a data
refresh by summing the revenues for all the regions in the country. A smart measure requires a data refresh in
this situation.
Calculation contexts are represented by grouping sets in the generated query.
6.6.5.1.1 Grouping sets and smart measures
A grouping set is a set of dimensions that generates a result for a measure.
The generated SQL that returns the data in a smart measure includes grouping sets for all the aggregations of
that measure that are included in the report.
Example
Grouping sets in a query
A query contains the [Country], [Region], [City] dimensions and the [Revenue] smart measure. These
objects imply the following grouping sets to calculate revenue in all possible contexts:
● Total smart measure value
SAP BusinessObjects Web Intelligence User's Guide
Analyzing data
P U B L I C 563

● smart measure value by (Country, Region, City)
● smart measure value by (Country, City)
● smart measure value by (City)
● smart measure value by (Region, City)
● smart measure value by (Region)
● smart measure value by (Country, Region)
● smart measure value by (Country)
If the database supports UNION, each grouping set is represented in a UNION clause in the generated SQL.
The grouping sets are updated according to the calculation contexts required by the report, which can
change in response to changes in the report structure.
6.6.5.1.1.1 Management of grouping sets
When you rst build and run a query including smart measures, the generated SQL includes the grouping set
necessary to calculate the smart measures at the most detailed level implied by the query objects.
For example, if you build a query containing the [Country], [Region] and [City] dimensions and the [Revenue]
smart measure, the (Country, Region, City) grouping set appears in the generated SQL. The most detailed
grouping set always appears in the SQL. Other grouping sets are added and removed in response to changes in
the report.
If you remove the [City] dimension from the block, the (Country, Region) grouping set is required to return the
revenue values. This grouping set is not yet available in the query SQL, so #TOREFRESH appears in the
[Revenue] cells. When you refresh the data, #TOREFRESH is replaced with the revenue values.
If you then replace the [City] dimension in the block, the (Country, Region) grouping set is no longer needed. It
is removed from the query SQL and its values discarded the next time you refresh the data.
Each time you refresh the report data, grouping sets are included or discarded according to the calculation
contexts required by the report.
In certain situations, it is not possible to display the value of a smart measure. In this case, #UNAVAILABLE
appears in the measure cells.
6.6.5.1.2 Smart measures and the scope of analysis
When you build a query with a scope of analysis, the initial grouping set contains the result objects, but not the
scope objects.
The query does not generate all the possible grouping sets from the combination of the result objects and the
scope objects.
564
P U B L I C
SAP BusinessObjects Web Intelligence User's Guide
Analyzing data
Example
A query with a scope of analysis and a smart measure
A query has the result objects [Country] and [Revenue]. The scope of analysis contains the [Region] and
[City] dimensions. When you run the query, its SQL contains the (Country) grouping set and it displays
[Country] and [Revenue] in a block.
6.6.5.1.3 Smart measures and SQL
6.6.5.1.3.1 Grouping sets and the UNION operator
Some databases support grouping sets explicitly with the GROUPING SETS operator.
When you build a query containing smart measures, the generated SQL uses multiple result sets and the
UNION operator to simulate the eect of GROUPING SETS.
Example
Grouping sets retrieved with the UNION operator
This example describes a query containing [Country], [Region], [City] dimensions and the [Revenue] smart
measure.
Note
For simplicity, the smart measure calculates a sum. In practice, a smart measure is not needed for this
aggregation because sums are supported natively in Web Intelligence.
When the query is rst run, the grouping set is (Country, Region, City). The entire SQL query returns this
grouping set and there is no need for the UNION operator in the SQL.
If you remove the [City] dimension from the table, the (Country, Region) grouping set is required to display
the revenue (which appears initially as #TOREFRESH). After data refresh, the SQL is as follows:
SELECT
SELECT
0 AS GID,
country.country_name,
region.region_name,
NULL,
sum(city.revenue)
FROM
country,
region,
city
WHERE
( country.country_id=region.country_id )
AND ( region.region_id=city.region_id )
GROUP BY
country.country_name,
region.region_name
UNION
SELECT
1 AS GID,
country.country_name,
SAP BusinessObjects Web Intelligence User's Guide
Analyzing data
P U B L I C 565

region.region_name,
city.city_name,
sum(city.revenue)
FROM
country,
region,
city
WHERE
( country.country_id=region.country_id )
AND ( region.region_id=city.region_id )
GROUP BY
country.country_name,
region.region_name,
city.city_name
Each grouping set is represented by a SELECT statement, and each has its own ID (the GID column).
Grouping sets that do not contain the full set of dimensions include empty columns (SELECT '') because
each SELECT statement in a query including UNION must have the same number of columns.
If you add a new block containing [Country] and [Revenue] to the report, the (Country) grouping set is
required. The generated SQL now includes three grouping sets as follows:
SELECT
0 AS GID,
country.country_name,
region.region_name,
NULL,
sum(city.revenue)
FROM
country,
region,
city
WHERE
( country.country_id=region.country_id )
AND ( region.region_id=city.region_id )
GROUP BY
country.country_name,
region.region_name
UNION
SELECT
1 AS GID,
country.country_name,
NULL,
NULL,
sum(city.revenue)
FROM
country,
city,
region
WHERE
( country.country_id=region.country_id )
AND ( region.region_id=city.region_id )
GROUP BY
country.country_name
UNION
SELECT
2 AS GID,
country.country_name,
region.region_name,
city.city_name,
sum(city.revenue)
FROM
country,
region,
city
WHERE
566
P U B L I C
SAP BusinessObjects Web Intelligence User's Guide
Analyzing data
( country.country_id=region.country_id )
AND ( region.region_id=city.region_id )
GROUP BY
country.country_name,
region.region_name,
city.city_name
6.6.5.1.4 Smart measures and formulas
6.6.5.1.4.1 Smart measures and dimensions containing
formulas
If a formula or variable appears as a dimension in the calculation context of a smart measure, and the formula
determines the grouping set required by the measure, the values of the smart measure can be displayed.
For example, smart measures and dimensions now return values for:
● A URL created with hyperlink wizard.
● Simple concatenation on a dimension (or blank removal).
● When FormatDate is used on [date]
Note
The message #UNAVAILABLE is stil returned for the following functions: ForEach, ForAll, In, Where, Rank,
Previous, RelativeValue, RelativeDate, TimeDim, and in the Aggregation function when Min, Max, Last, or
First are used in the formula: if ([selection] =1) then [dim1] else [dim2]
6.6.5.1.4.2 Smart measures in formulas
Smart measures can return values when included in formulas, even when the formula requires a dierent
calculation context from the context implied by the position of the formula.
For example, a report contains a block as follows:
Country
Region Revenue
US North 10000
US South 15000
US East 14000
US West 12000
If you include an additional column in this table with the formula
[Revenue] ForAll ([Region])
SAP BusinessObjects Web Intelligence User's Guide
Analyzing data
P U B L I C 567

the initial value of the column is #TOREFRESH because the formula, which excludes regions from the
calculation, requires the grouping set (Country). Refreshing the data adds the (Country) grouping set to the
query and displays the values of the measure.
Related Information
ForAll context operator [page 562]
6.6.5.1.5 Smart measures and lters
6.6.5.1.5.1 Restrictions concerning smart measures and
lters
A smart measure can be evaluated in the body of a table when there is no lter in the table or in the parent
context (a report lter).
The following table describes how smart measures are evaluated when lters are present.
How smart measures are evaluated when a lter is present in the report
When the
lter is on a ... The smart measure is evalueated this way
Measure The smart measure will be correctly evaluated, but some
rows will be removed from the table.
Dimension that is already part of the table axis The smart measure will be correctly evaluated, but some
rows will be removed from the table. The smart measure can
be evaluated, because there is no aggregation after the lter-
ing.
Dimension that is not part of the axis of the table, and when
the lter operand is mono-value (the lter will return one
value/row).
The smart measure will be correctly evaluated. The smart
measure can be evaluated because there is no aggregation
after the ltering.
Dimension that is not part of the axis of the table, and if the
lter operand is multivalue (the lter can return many val
ues/rows).
The smart measure can’t be evaluated (#UNAVAILABLE is
displayed) because in this case, ltering is done before ag
gregation, and for one row of the table, aggregation is re
quired.
6.6.5.1.5.2 Smart measures and lters on dimensions
If you apply a multi-valued lter to a dimension on which the value of a smart value depends, but the dimension
does not appear explicitly in the calculation context of the measure, the smart measure cannot return a value,
and the cell displays #UNAVAILABLE.
This also applies when a report lter comes from an input control.
568
P U B L I C
SAP BusinessObjects Web Intelligence User's Guide
Analyzing data
#UNAVAILABLE appears because the measure must be ltered in the report and then aggregated, but a smart
measure cannot be aggregated after a report-level lter is applied. Calculating the measure would be possible
by adding a query lter to the generated SQL, but this solution carries the risk of impacting other reports based
on the same query.
Note
A multi-valued lter lters on multiple values using operators such as Greater Than, In List or Less Than.
You can apply single-valued lters such as Equal To without generating the #UNAVAILABLE error.
Note
There is a workaround for cases which do not require aggregation: Dene the formula as variable whose
qualication is a measure and be sure that the used dimension is included in the block with the variable
(you can hide that column for a better display).
Example
A smart measure and a lter on a dimension
A query contains the Country and Product dimensions and the Revenue smart measure. Country and
Revenue are displayed in a block. If you apply a report lter restricting the values of Product to "Dresses" or
"Jackets", #UNAVAILABLE appears in the Revenue cells.
Country Revenue
France #UNAVAILABLE
US #UNAVAILABLE
Sum: #UNAVAILABLE
If you restrict Product to "Jackets" only, the values are displayed.
Country Revenue
US 971,444
Sum: 971,444
Note
A multivalue lter on Country will return results because the lter is in the table.
6.6.5.1.5.3 Filtering smart measures
The value in the table footer must be the aggregation of what the user sees in the table.
If what user sees in the table is ltered locally, then the system cannot return delegated aggregation of what is
locally ltered.
SAP BusinessObjects Web Intelligence User's Guide
Analyzing data
P U B L I C 569
Example
Filtering a smart measure
Country OrderAmountDel
Brazil 28,833.36
China 51,384.33
France 68,630.22
USA 3,529,511.14
Total: 3,678,359.05
Sum: 3,678,359.05
When the data in the following table is ltered by OrderAmountDel > 60,000
The table shows the rows for which the OrderAmountDel in the context of table ( per country) is greater
than 60,000:
Sum in footer calculates the sum of the visible rows;
Total returns #UNAVAILABLE because the calculation is pushing the aggregation to the back end, but
because Web Intelligence has performed local ltering, the aggregation cannot be delegated.
Country OrderAmountDel
France 68,630.22
USA 3,529,511.14
Total: #UNAVAILABLE
Sum: 3,598,141.36
6.6.5.1.5.4 Smart measures and drill lters
A drill lter is a single valued lter.
You can drill using the drill bar directly.
6.6.5.1.5.5 Smart measures and nested OR lters
Nested OR lters in which at least one of the ltered dimensions does not appear in a block generate the
#UNAVAILABLE error for a smart measure in the block.
This is because the smart measure has to be aggregated locally after some local processing (for example,
ltering; some specic Web Intelligence formula) and this is not delegated.
570
P U B L I C
SAP BusinessObjects Web Intelligence User's Guide
Analyzing data
6.6.6 Functions, operators and keywords
6.6.6.1 Functions
Formula functions are divided into several categories.
Note
In the following languages, the functions are not translated: Chinese, Japanese, Hungarian, Polish, Turkish,
Thai, and Russian. They appear in the interface in English.
Category
Description
Aggregate Aggregates data (for example by summing or averaging a set
of values)
Character Manipulates character strings
Date and Time Returns date or time data
Document Returns data about a document
Data Provider Returns data about a document’s data provider
Logical Returns TRUE or FALSE
Numeric Returns numeric data
Misc Functions that do not t into the above categories
Set Returns sets of members from hierarchies
SAP HANA Online Mode functions restrictions
The functions listed in the table below are not supported in SAP HANA Online mode.
Function Category
Function Name
Data Provider Connection
DataProvider
DataProviderKeyDate
DataProviderKeyDateCaption
DataProviderSQL
DataProviderType
IsPromptAnswered
LastExecutionDate
LastExecutionDuration
LastExecutionTime
SAP BusinessObjects Web Intelligence User's Guide
Analyzing data
P U B L I C 571

Function Category Function Name
NumberOfDataProviders
NumberOfRows
RefValueDate
RefValueUserResponse
ServerValue
UniverseName
UserResponse
Document DocumentPartiallyRefreshed
QuerySummary
Misc ForceMerge
Key
NoFilter
RefValue
RowIndex
Set Ancestor
Children
Depth
Descendants
IsLeaf
Lag
Parent
Siblings
6.6.6.1.1 Custom formats
In tables, you can use the Custom format type to dene a customized format for any cell.
In Web Intelligence functions, the day/date, calendar and time of day character denitions below apply. The
following table lists the strings you can use to create custom formats:
Character(s)
Display(s) Example
#
The corresponding digit. If the number
has less digits than the number of
#
characters used to specify the format,
no leading zeros are inserted.
‘12345’ with the format #,##0 gives ‘12,345’
(if your locale denes the grouping separator
as a comma) or ‘12 345’ (if your locale de
nes the grouping separator as a space)
572 P U B L I C
SAP BusinessObjects Web Intelligence User's Guide
Analyzing data
Character(s) Display(s) Example
0
The corresponding digit. If the number
has less digits than the number of
0
characters used to specify the format,
a leading zero(s) is inserted before the
number.
‘123’ with the format #0,000 gives ‘0,123’
,
The grouping separator as dened by
your locale.
‘1234567’ with the format #,##0 gives
‘1,234,567’ (if you locale denes the grouping
separator as a comma) or ‘1 234 567’ (if your
locale denes the grouping separator as a
non-breaking space)
.
The decimal separator as dened by
your locale.
‘12.34’ with the format #.#0 gives ‘12.34’ (if
your locale denes the decimal separator as a
period) or ‘12,34’ (if your locale denes the
decimal separator as a comma)
[%]%
Displays a percentage sign (%) after
the result and multiplies the result by
100.
0.50 becomes 50%.
%
The % sign after the result, but does
not multiply the result by 100.
0.50 becomes 0.50%
A non-breaking space ( )
‘1234567’ with the format # ##0 gives ‘1234
567’
1, 2, 3, a, b, c, $, £,
€ (and so on)
The alphanumeric character.
‘705.15’ with the format $#.#0 gives
‘$705.15’ or with the format #,#0 € gives
‘705,15 €’
Note
Alphanumeric characters should be de
limited by single quotes, otherwise they
can be interpreted as formatting charac
ters. For example, # # will result in '123 4'
while '#' # will result in '# 1234'
[Red], [Blue], [Green],
[Yellow], [Gray],
[White], [Dark Red],
[Dark Blue], [Dark
Green]
The value in the specied color.
‘150’ with the format #,##0[Red] gives
‘150’ in red text, #,##0[Blue] gives ’150’
in blue text.
Day/date characters
(day, date)
d
The number of the day in the month
with no leading zeros. If the date for
day is less than two characters, the
date displays without a zero before it.
The rst day of a month with the format d
gives ‘1’
dd
The number of the day with leading ze
ros. If the date for day is less than two
characters, the date displays with a
zero before it.
The rst day of a month with the format dd
gives ‘01’
SAP BusinessObjects Web Intelligence User's Guide
Analyzing data
P U B L I C 573

Character(s) Display(s) Example
ddd
The name of the day abbreviated. The
rst letter is capitalized if the selected
locale uses capitalized day names.
'Monday’ with the format ddd gives ‘Mon’ in
English, in French, lundi gives lun.
Dddd
Forced the capitalization of the day
name, for any locale.
'Monday’ with the format Dddd gives ‘Mon’ in
English, in French, lundi gives Lun.
dddd
The name of the day in full. The rst let
ter is capitalized if the selected locale
uses capitalized day names.
‘Monday’ with the format dddd gives ‘Mon
day’ in English. In French, the day is lundi.
DDDD
The name of the day in full, in upper
case.
‘Monday’ with the format DDDD gives ‘MON
DAY’ in English. In French, the day is LUNDI.
dddd dd
The day of the week followed by a
space and the number of the day.
‘Monday’ with the format dddd dd gives
‘Monday 01’
Calendar characters
(week, month, year)
M
The number of the month with no lead
ing zeros. If the number for month is
less than two characters, the number
displays without a zero before it.
‘January’ with the format M gives '1'
MM
The number of the month with leading
zeros. If the number for month is less
than two characters, the number dis
plays with a zero before it.
‘January’ with the format MM gives '01'
mmm
The name of the month abbreviated.
The rst letter is capitalized if the se
lected locale uses capitalization.
‘January’ with the format mmm gives Jan in
English. In French, this is 'jan'.
Mmmm
The name of the month abbreviated.
The rst letter is capitalized for all lo
cales.
‘January’ with the format mmm gives Jan in
English. In French, this is 'Jan'.
mmmm
The name of the month in full. The rst
letter is capitalized if the selected lo
cale used capitalization.
‘January’ with the format mmmm gives January
in English, janvier in French
MMMM
The name of the month in full all in up
percase.
‘January’ with the format MMMM gives JANU
ARY in English, JANVIER in French
ww
The week number of the year.
For the 9th of January 2015, the ww format
gives '02', because it is the seventh week of
the year 2015.
w
The week number of the year without
leading zero.
For the 9th of January 2015, the w format
gives '2', because it is the seventh week of the
year 2015.
W
The week number of the month.
For the 9th of January 2015, the W format
gives '2', because it is the second week of
January.
yy
The last two digits for year.
‘2003’ with the format yy gives ‘03’
yyyy
All four digits for year.
‘2003’ with the format yyyy gives ‘2003’
574 P U B L I C
SAP BusinessObjects Web Intelligence User's Guide
Analyzing data
Character(s) Display(s) Example
Time of day characters
(hours, minutes, seconds,
am/pm)
hh:mm:ss a
The hour with no leading zeros and the
minutes and seconds with leading ze
ros. The “
a" character displays AM or
PM after the time when available.
‘21:05:03’ with the format hh:mm:ss a
gives ‘9:05:03 PM’ for English locale
H
The hour according to the 24-hour
clock, starting at 0. No leading zero for
single gure hours.
‘21:00’ with the format H gives ‘21’. Possible
values are 0-23.
HH
The hour according to the 24-hour
clock, starting at 0.
‘21:00’ with the format HH gives ‘21’. Possible
values are 00-23.
k
The hour according to the 24-hour
clock, starting at 1. No leading zero for
single gure hours.
‘21:00’ with the format k gives ‘21’. Possible
values are 1-24.
kk
The hour according to the 24-hour
clock, starting at 01.
‘21:00’ with the format kk gives ‘21’. Possible
values are 01-24.
hh
The hour according to the 12-hour
clock.
‘21:00’ with the format hh gives ‘09’
HH:mm
The hour and minutes with a zero in
front of a single-digit hour.
‘7:15 am’ with the format HH:mm gives ‘07:15’
HH:mm:ss
The hour, minutes, and seconds with a
zero in front of a single-digit hour.
‘7:15 am’ with the format HH:mm:ss gives
‘07:15:00’
mm:ss
The minutes, and seconds with a zero
in front of a single-digit hour.
‘07:15:03’ with the format mm:ss gives
‘15:03’
z
The time zone information on a date/
time value as follows:
GMT+/-HH:mm
6.6.6.1.2 Aggregate functions
6.6.6.1.2.1 Aggregate
Description
Returns the default aggregation of a measure for a given member set
Function Group
Aggregate
SAP BusinessObjects Web Intelligence User's Guide
Analyzing data
P U B L I C 575

Syntax
num Aggregate(measure[;member_set])
Input
Parameter Description Type Required
measure Any measure Measure Yes
member_set The member set used to
calculate the aggregation
Member set
No
Notes
● You can use extended syntax context operators with Aggregate.
● If you include member_set, Aggregate returns the aggregate value of the measure for all members in the
member set.
● member_set can include multiple sets separated by semicolons (;).
● The list of member sets must be enclosed in {}.
● If the member set expression does not specify a precise member or node, the hierarchy referenced must
be present in the table, then the member set expression references the current member in the hierarchy in
the table. If the hierarchy is not in the table, the function returns the message #MULTIVALUE.
● Delegated measure aggregation returns #TOREFRESH when the required aggregation is not available in
the query. The user has to refresh the document to get the new level of aggregation. This occurs for
example when using the lter bar when the user selects a value before “all values” and vice versa when
selecting “all values” before a selected value.
Examples
If the default aggregation of the [Sales Revenue] measure is Sum, and [California] is a member in the
[Geography] hierarchy (Country > State > City), Aggregate([Sales Revenue];
{Descendants([Geography]&[US].[California];1)})
returns the total sales revenue of all cities in
California.
Related Information
Referring to members and member sets in hierarchies [page 792]
576
P U B L I C
SAP BusinessObjects Web Intelligence User's Guide
Analyzing data
6.6.6.1.2.2 Member selection in aggregate functions
Description
For certain aggregate functions you can dene a member selection to dene the aggregation context when the
block contains a hierarchy.
Function Group
Aggregate
Syntax
=AggregationFunction([my object];{memberselection})
Input
Parameter Description Type Required
AggregationFun
ction
Must be one of the following:
● Aggregate
● Average
● Coun
● Ma
● Mi
● Sum
Aggregate function
Yes
my object Dimension or a measure Dimension or Measure Yes
memberselectio
n
A dened member, or a calculated set of member using set
functions. The memberselection must be enclosed in curly
brackets. Each part of the member set is separated with
semicolon
{[member one];[member
two];CalculatedMemberSet()}
Where CalculatedMemberSet uses one of the set functions:
Member or a calculated
set of members using
Set functions.
Yes
SAP BusinessObjects Web Intelligence User's Guide
Analyzing data
P U B L I C 577
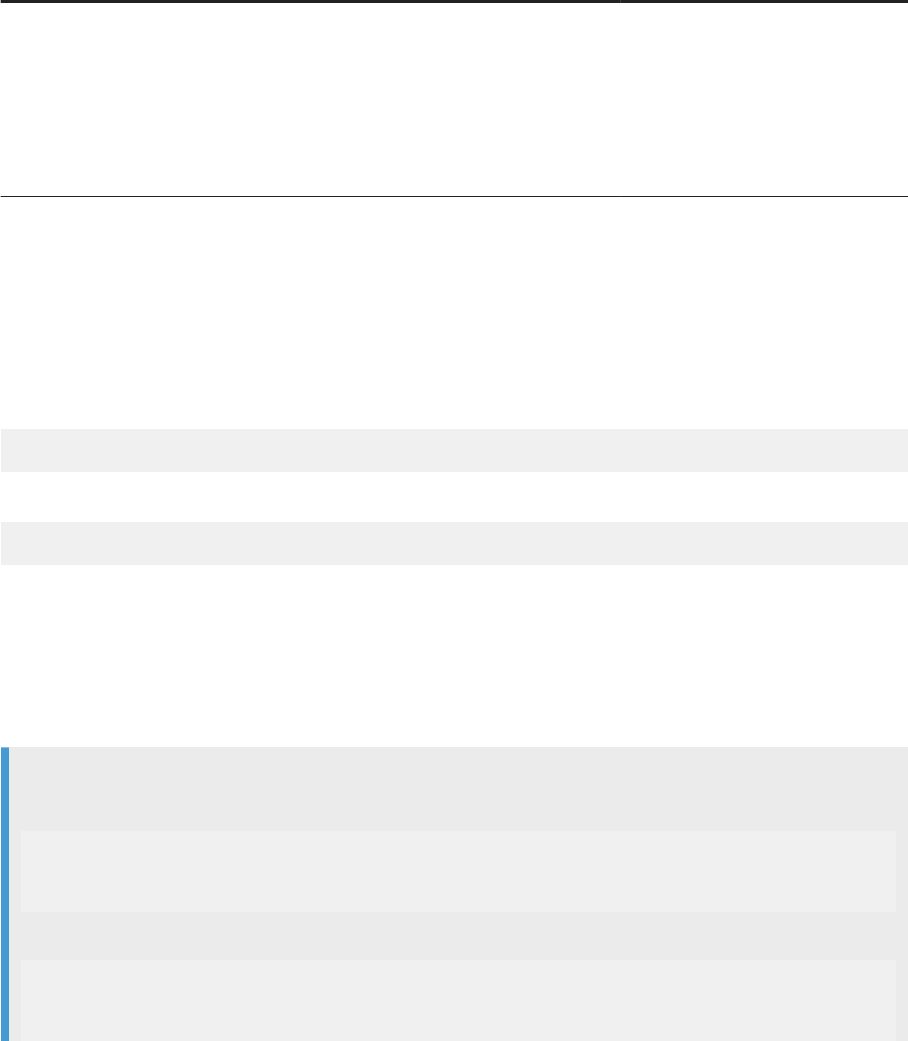
Parameter Description Type Required
● Ancestor
● Descendant
● Lag
● Children
● Parent
● Siblings
Description
The set functions use Object, Level, or Member as parameters. If you specify only Object and the object is a
hierarchical object present in the block, then it will use the current member. You can also dene a specic
member using the following syntax :
[HierarchicalOBject]&[RootMember].[ChildMember].[ChildMember]
For Microsoft and Essbase .UNX sources you can select select a Level :
[HierarchicalOBject].[LevelName]
Examples
The following examples are all taken from an English language data source.
Example
In the following sample, you want to get the internet sales dierence between Year 2002 and Year 2001:
=Sum([Internet Sales].[Internet Sales Amount];{[Calendar].
[Date.Calendar]&[All Periods].[CY 2002]}) + Sum([Internet Sales].[Internet
Sales Amount];{[Calendar].[Date.Calendar]&[All Periods].[CY 2001]})
Or either select two members in the member selection :
=Sum([Internet Sales].[Internet Sales Amount];{[Calendar].
[Date.Calendar]&[All Periods].[CY 2002]};[Calendar].[Date.Calendar]&[All
Periods].[CY 2001]})
578
P U B L I C
SAP BusinessObjects Web Intelligence User's Guide
Analyzing data
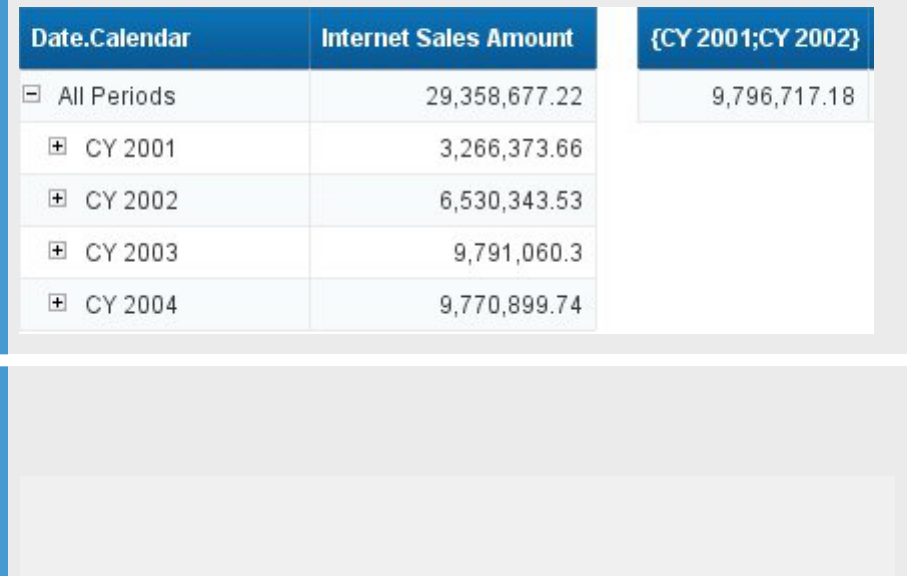
Example
In the following sample, you have a product hierarchy, and you want to know the internet sales for all
products related to bikes. But two of them are in a dierent branch:
=Sum([Query 3].[Internet Sales].[Internet Sales Amount];{[Product Model
Categories]&[All Products].[Accessories].[Bike Racks];[Product Model
Categories]&[All Products].[Accessories].[Bike Stands];[Product Model
Categories]&[All Products].[Bikes]})
SAP BusinessObjects Web Intelligence User's Guide
Analyzing data
P U B L I C 579
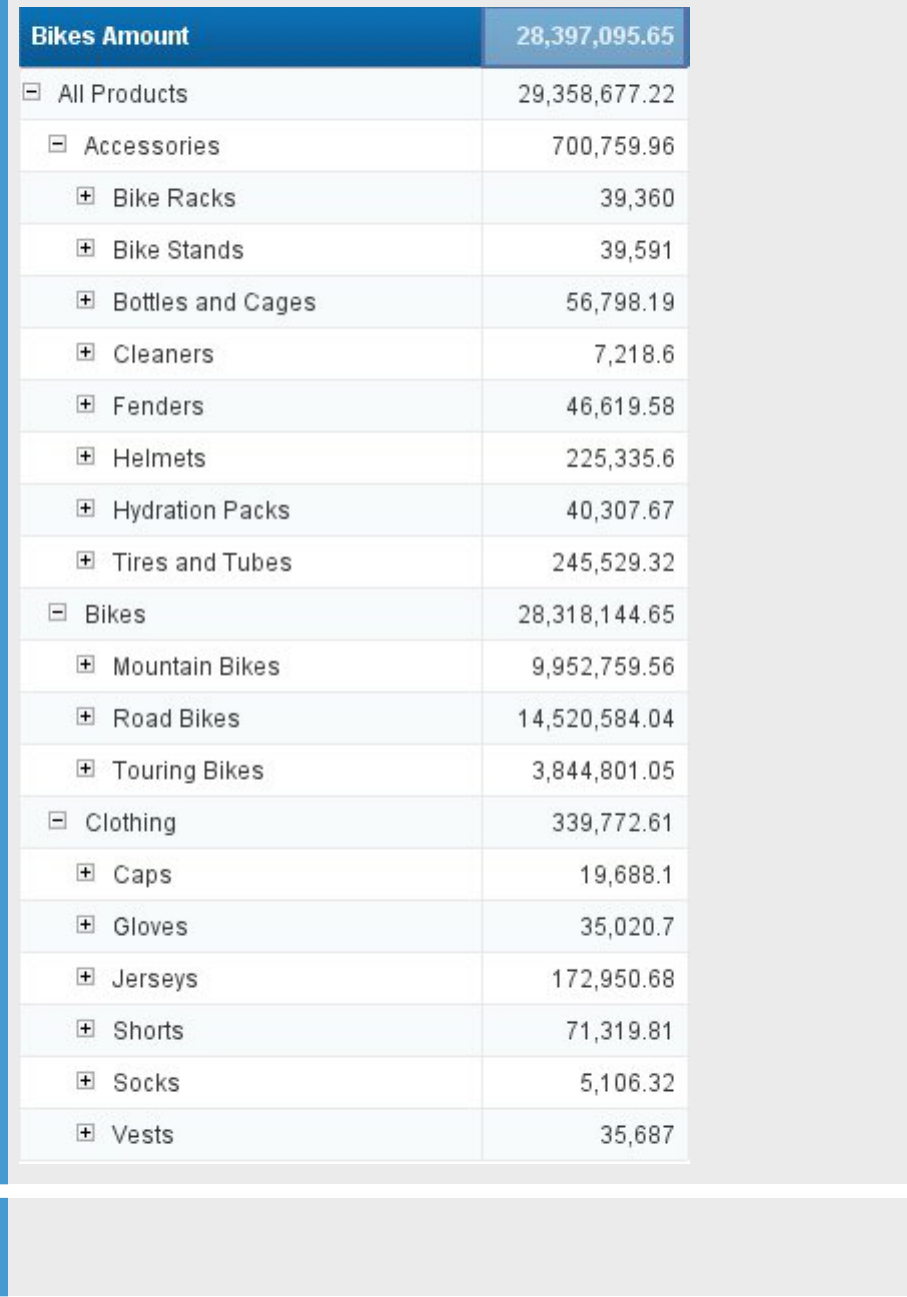
Example
In the following sample, you want to compare Internet Sales Amount between North America Area
countries, comparing rst of all Canada and USA, and then with other countrys worldwide:
580
P U B L I C
SAP BusinessObjects Web Intelligence User's Guide
Analyzing data
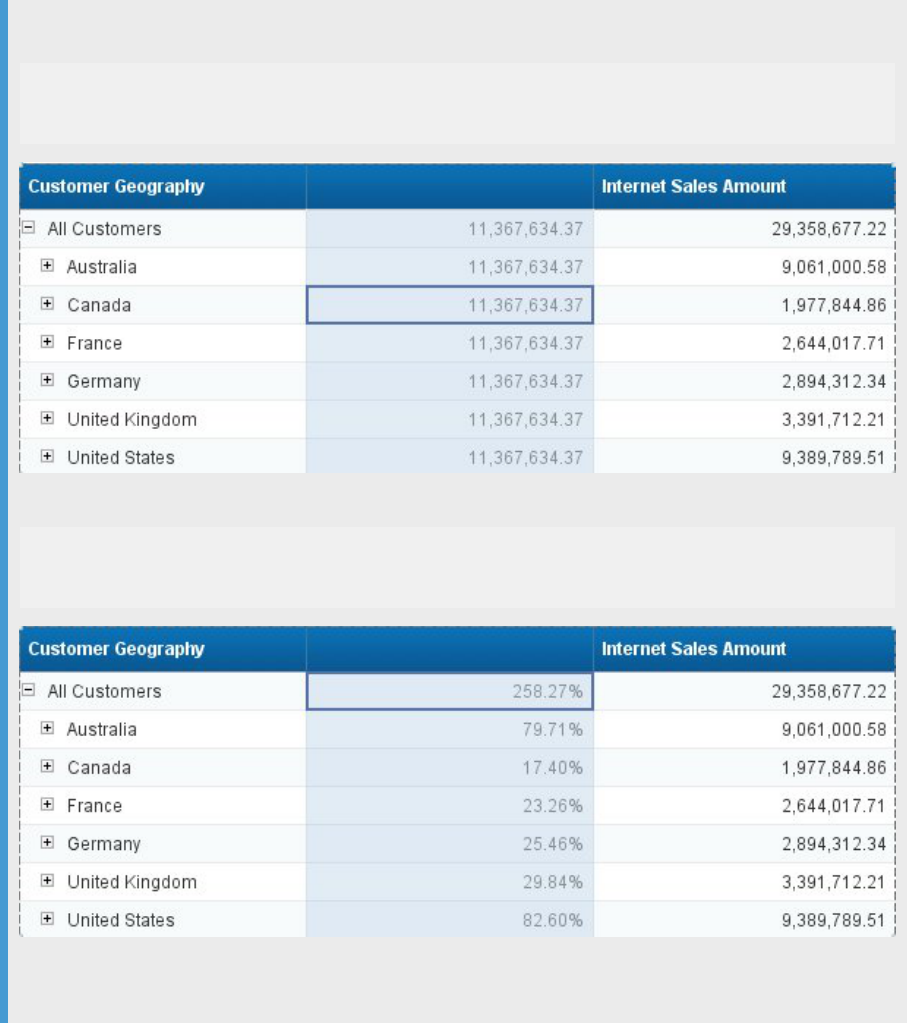
Firstly, get the total for the North American countries, for this sample, you are only interested in Canada
and USA :
=Sum([Query 2].[Internet Sales].[Internet Sales Amount];{[Customer
Geography]&[All Customers].[Canada];[Customer Geography]&[All Customers].
[United States]})
Then you want to compare all countries with North America :
=[Query 2].[Internet Sales].[Internet Sales Amount] / Sum([Query 2].[Internet
Sales].[Internet Sales Amount];{[Customer Geography]&[All Customers].[Canada];
[Customer Geography]&[All Customers].[United States]})
We can see that the global world total of customers is two and a half times that of North America, and that
Australia is 80% compared to North America.
Related Information
Aggregate [page 575]
SAP BusinessObjects Web Intelligence User's Guide
Analyzing data
P U B L I C 581
6.6.6.1.2.3 Average
Description
Returns the average value of a measure
Function Group
Aggregate
Syntax
num Average(measure[;member_set][;IncludeEmpty])
Input
Parameter Description Type Required
measure Any measure Measure Yes
member_set A set of members Member set No
IncludeEmpty Includes empty rows in the
calculation
Keyword
No
(Empty rows excluded by
default)
Notes
● You can use extended syntax context operators with Average.
● If you include member_set, Average returns the average value of the measure for all members in the
member set.
● member_set can include multiple sets separated by semicolons (;).
● The list of member sets must be enclosed in {}.
● If the member set expression does not specify a precise member or node, the hierarchy referenced must
be present in the table, then the member set expression references the current member in the hierarchy in
the table. If the hierarchy is not in the table, the function returns the message #MULTIVALUE.
● Delegated measure aggregation returns #TOREFRESH when the required aggregation is not available in
the query. The user has to refresh the document to get the new level of aggregation. This occurs for
582
P U B L I C
SAP BusinessObjects Web Intelligence User's Guide
Analyzing data

example when using the lter bar when the user selects a value before “all values” and vice versa when
selecting “all values” before a selected value.
● A delegated measure given against a group returns #UNAVAILABLE as it requires local aggregation
(aggregation of the measure value of the grouped values).
Even when you force local aggregaton on a delegated measure against an "if then else" formula or group
value it will still return the #MULTIVALUE message.
Examples
If the [Sales Revenue] measure has the values 41569, 30500, 40000 and 50138, Average([Sales
Revenue]) returns 40552.
If [California] is a member in the [Geography] hierarchy (Country > State > City), Average([Sales
Revenue];{[Geography]&[US].[California].children}) returns the average sales revenue of all
cities in California.
Related Information
Referring to members and member sets in hierarchies [page 792]
IncludeEmpty operator [page 777]
6.6.6.1.2.4 Count
Description
Returns the number of values in a set of values
Function Group
Aggregate
Syntax
integer Count(aggregated_data[;member_set][;IncludeEmpty][;Distinct|All])
SAP BusinessObjects Web Intelligence User's Guide
Analyzing data
P U B L I C 583

Input
Parameter Description Type Required
aggregated_data Any dimension, measure,
hierarchy, level or member
set
Dimension, measure,
hierarchy, member set
Yes
member_set The member set used to
calculate the count
Member set No
IncludeEmpty Includes empty values in the
calculation
Keyword No
Distinct|All Includes distinct values only
(default for dimensions) or
all values (default for
measures) in the calculation
Keyword No
Notes
● You can use extended syntax context operators with Count.
● If you specify IncludeEmpty as the second argument, the function takes empty (null) values into
consideration in the calculation.
● If you do not specify the Distinct|All parameter, the default values are Distinct for dimensions and
All for measures.
● If you include member_set, Count restricts the count to the number of values in member_set.
● member_set can include multiple sets separated by semicolons (;).
● The list of member sets must be enclosed in {}.
● If the member set expression does not specify a precise member or node, the hierarchy referenced must
be present in the table, then the member set expression references the current member in the hierarchy in
the table. If the hierarchy is not in the table, the function returns the message #MULTIVALUE.
● Delegated measure aggregation returns #TOREFRESH when the required aggregation is not available in
the query. The user has to refresh the document to get the new level of aggregation. This occurs for
example when using the lter bar when the user selects a value before All values and vice versa when
selecting All values before a selected value.
● A delegated measure given against a group returns #UNAVAILABLE as it requires local aggregation
(aggregation of the measure value of the grouped values).
Even when you force local aggregaton on a delegated measure against an "if then else" formula or group
value it will still return the #MULTIVALUE message.
Examples
Count("Test") returns 1
Count([City];Distinct) returns 5 if there are 5 dierent cities in a list of cities, even if there are more than
5 rows in the list due to duplication.
584
P U B L I C
SAP BusinessObjects Web Intelligence User's Guide
Analyzing data

Count([City];All) returns 10 if there are 10 cities in a list of cities, even though some are duplicated.
Count ([City];IncludeEmpty) returns 6 if there are 5 cities and one blank row in a list of cities.
Count([Product];{[Geography]&[State]}) returns the total number of products at the [State] level in
the [Geography] hierarchy.
Related Information
IncludeEmpty operator [page 777]
Distinct/All operators [page 776]
6.6.6.1.2.5 First
Description
Returns the rst value in a data set
Function Group
Aggregate
Syntax
input_type First(dimension|measure)
Input
Parameter
Description Type Required
dimension|measure Any dimension or measure Dimension or measure Yes
SAP BusinessObjects Web Intelligence User's Guide
Analyzing data
P U B L I C 585
Notes
● When placed in a break footer, First returns the rst value in the break.
● When placed in a table footer, First returns the rst value in the table.
● When placed in a table body, the result of First is unpredictable and depends on the order of the data set
in the data source.
Examples
When placed in a table footer, First([Revenue]) returns the rst value of [Revenue] in the table.
6.6.6.1.2.6 Interpolation
Description
Calculates empty measure values by interpolation
Function Group
Aggregate
Syntax
num Interpolation(measure[;PointToPoint|Linear]
[;NotOnBreak|(reset_dims)][;Row|Col])
Input
Parameter
Description Type Required
measure Any measure Measure Yes
PointToPoint|Linear
The interpolation method:
Keyword
No
(PointToPoint is default)
586 P U B L I C
SAP BusinessObjects Web Intelligence User's Guide
Analyzing data

Parameter Description Type Required
● PointToPoint -
point-to-point
interpolation
● Linear
- linear
regression with least
squares interpolation
NotOnBreak| reset_dims
● NotOnBreak -
prevents the function
from resetting the
calculation on block and
section breaks
● reset_dims - the list
of dimensions used to
reset the interpolation
Keyword| dimension list
No
Row|Col Sets the calculation direction Keyword
(Row is default)
Notes
● Interpolation is particularly useful when you create a line graph on a measure that contains missing
values. By using the function you ensure that the graph plots a continuous line rather than disconnected
lines and points.
● Linear regression with least squares interpolation calculates missing values by calculating a line equation in
the form f(x) = ax + b that passes as closely as possible through all the available values of the measure.
● Point-to point interpolation calculates missing values by calculating a line equation in the form f(x) = ax + b
that passes through the two adjacent values of the missing value.
● The sort order of the measure impacts the values returned by Interpolation.
● You cannot apply a sort or a ranking to a formula containing Interpolation.
● If there is only one value in the list of values, Interpolation uses this value to supply all the missing
values.
● Filters applied to an interpolated measure can change the values returned by Interpolation depending
on which values the lter impacts.
Examples
Interpolation([Value]) supplies the following missing values using the default point-to-point
interpolation method:
Day
Value Interpolation([Value])
Monday 12 12
SAP BusinessObjects Web Intelligence User's Guide
Analyzing data
P U B L I C 587
Day Value Interpolation([Value])
Tuesday 14 14
Wednesday 15
Thursday 16 16
Friday 17
Saturday 18
Sunday 19 19
Related Information
Linear operator [page 778]
PointToPoint operator [page 779]
6.6.6.1.2.7 Last
Description
Returns the last value in a data set
Function Group
Aggregate
Syntax
input_type Last(dimension|measure)
Input
Parameter
Description Type Required
dimension|measure Any dimension or measure Dimension or measure Yes
588 P U B L I C
SAP BusinessObjects Web Intelligence User's Guide
Analyzing data
Notes
● When placed in a table footer, Last returns the last value in the in the break.
● When placed in a table footer, Last returns the last value in the table.
● When placed in a table body, the result of Last is unpredictable and depends on the order of the data set
in the data source.
● For technical reasons, Last can return a null value when the input parameter is a merged object.
Examples
When placed in a table footer, Last([Revenue]) returns the last value of [Revenue] in the table.
6.6.6.1.2.8 Max
Description
Returns the largest value in a set of values
Function Group
Aggregate
Syntax
input_type Max(aggregated_data[;member_set])
Input
Parameter
Description Type Required
aggregated_data Any dimension, measure,
hierarchy, level or member
set
Dimension, measure,
hierarchy, level or member
set
Yes
member_set A set of members Member set No
SAP BusinessObjects Web Intelligence User's Guide
Analyzing data
P U B L I C 589
Notes
● You can use extended syntax context operators with Max.
● If you include member_set, Max returns the maximum value of the aggregated data for all members in the
member set.
● member_set can include multiple sets separated by semicolons (;).
● The list of member sets must be enclosed in {}.
● If the member set expression does not specify a precise member or node, the hierarchy referenced must
be present in the table, then the member set expression references the current member in the hierarchy in
the table. If the hierarchy is not in the table, the function returns the message #MULTIVALUE.
● Delegated measure aggregation returns #TOREFRESH when the required aggregation is not available in
the query. The user has to refresh the document to get the new level of aggregation. This occurs for
example when using the lter bar when the user selects a value before “all values” and vice versa when
selecting “all values” before a selected value.
● A delegated measure given against a group returns #UNAVAILABLE as it requires local aggregation
(aggregation of the measure value of the grouped values).
Even when you force local aggregaton on a delegated measure against an "if then else" formula or group
value it will still return the #MULTIVALUE message.
Examples
If the [Sales Revenue] measure has the values 3000, 60034 and 901234, Max([Sales Revenue]) returns
901234.
If the [City] dimension has the values "Aberdeen" and "London", Max ([City]) returns "London".
If [US] is a member in the [Geography] hierarchy (Country > State > City), Max([Sales Revenue];
{[Geography].[US].Children}) returns the highest sales revenue for a US state.
6.6.6.1.2.9 Median
Description
Returns the median (middle value) of a measure
Function Group
Aggregate
590
P U B L I C
SAP BusinessObjects Web Intelligence User's Guide
Analyzing data

Syntax
num Median(measure)
Input
Parameter
Description Type Required
measure Any measure Measure Yes
Notes
If the set of numbers has an even number of values, Median takes the average of the middle two values.
Examples
Median([Revenue]) returns 971,444 if [Revenue] has the values 835420, 971444, and 1479660.
6.6.6.1.2.10 Min
Description
Returns the smallest value in a set of values
Function Group
Aggregate
Syntax
input_type Min(aggregated_data[;member_set])
SAP BusinessObjects Web Intelligence User's Guide
Analyzing data
P U B L I C 591

Input
Parameter Description Type Required
aggregated_data Any dimension, measure,
hierarchy, level or member
set
Dimension, measure,
hierarchy, level or member
set
Yes
member_set A set of members Member set No
Notes
● You can use extended syntax context operators with Min.
● If you include member_set, Min returns the minimum value of the aggregated data for all members in the
member set.
● member_set can include multiple sets separated by semicolons (;).
● The list of member sets must be enclosed in {}.
● If the member set expression does not specify a precise member or node, the hierarchy referenced must
be present in the table, then the member set expression references the current member in the hierarchy in
the table. If the hierarchy is not in the table, the function returns the message #MULTIVALUE.
● Delegated measure aggregation returns #TOREFRESH when the required aggregation is not available in
the query. The user has to refresh the document to get the new level of aggregation. This occurs for
example when using the lter bar when the user selects a value before “all values” and vice versa when
selecting “all values” before a selected value.
● A delegated measure given against a group returns #UNAVAILABLE as it requires local aggregation
(aggregation of the measure value of the grouped values).
Even when you force local aggregaton on a delegated measure against an "if then else" formula or group
value it will still return the #MULTIVALUE message.
Examples
If the [Sales revenue] measure has the values 3000, 60034 and 901234, Min([Sales Revenue]) returns
3000.
If the [City] dimension has the values Aberdeen and London, Min([City])returns "Aberdeen".
Min([Sales Revenue];{[Geography]&[US].children}) returns the lowest sales revenue for a US state
if [US] is a member in the [Geography] hierarchy with levels [Country] > [State] > [City].
592
P U B L I C
SAP BusinessObjects Web Intelligence User's Guide
Analyzing data

6.6.6.1.2.11 Mode
Description
Returns the most frequently-occurring value in a data set
Function Group
Aggregate
Syntax
input_type Mode(dimension|measure)
Input
Parameter Description Type Required
dimension|measure Any dimension or measure Measure Yes
Notes
● Mode returns null if the data set does not contain one value that occurs more frequently than all the others.
Examples
Mode([Revenue]) returns 200 if [Revenue] has the values 100, 200, 300, 200.
Mode([Country]) returns the most frequently-occurring value of [Country].
SAP BusinessObjects Web Intelligence User's Guide
Analyzing data
P U B L I C 593
6.6.6.1.2.12 Percentage
Description
Expresses a measure value as a percentage of its embedding context
Function Group
Aggregate
Syntax
num Percentage(measure[;Break][;Row|Col])
Input
Parameter Description Type Required
measure Any measure Measure Yes
Break Accounts for table breaks Keyword No
Row|Col Sets the calculation direction Keyword No
Examples
In the following table, the Percentage column has the formula Percentage([Sales Revenue])
Year
Sales Revenue Percentage
2001 1000 10
2002 5000 50
2003 4000 40
Sum: 10000 100
By default the embedding context is the measure total in the table. You can make the function take account of a
break in a table by using the optional Break argument. In this case the default embedding context becomes
the table section.
In the following table, the Percentage column has the formula Percentage([Sales Revenue];Break)
594
P U B L I C
SAP BusinessObjects Web Intelligence User's Guide
Analyzing data
Year Quarter Sales Revenue Percentage
2001 Q1 1000 10
Q2 2000 20
Q3 5000 50
Q4 2000 20
2001 Sum: 10000 100
Year Quarter Sales Revenue Percentage
2002 Q1 2000 20
Q2 2000 20
Q3 5000 50
Q4 1000 10
2002 Sum: 10000 100
You can use the Percentage function across columns or rows; you can specify this explicitly using the optional
Row|Col argument. For example, in the following crosstab, the % column has the formula
Percentage([Sales Revenue];Row)
Q1
% Q2 % Q3 % Q4 %
2001 1000 10 2000 20 5000 50 2000 20
2002 2000 20 2000 20 5000 50 1000 10
6.6.6.1.2.13 Percentile
Description
Returns the nth percentile of a measure
Function Group
Numeric
Syntax
num Percentile(measure;percentile)
SAP BusinessObjects Web Intelligence User's Guide
Analyzing data
P U B L I C 595

Input
Parameter Description Type Required
measure Any measure Measure Yes
percentile A percentage expressed as a
decimal
Number Yes
Notes
The nth percentile is a number that is greater than or equal to n% of the numbers in a set. You express n% in
the form 0.n.
Examples
If [measure] has the set of numbers (10;20;30;40;50), Percentile([measure];0.3) returns 22, which is
greater than or equal to 30% of the numbers in the set.
6.6.6.1.2.14 Product
Description
Multiplies the values of a measure
Function Group
Aggregate
Syntax
num Product(measure)
596
P U B L I C
SAP BusinessObjects Web Intelligence User's Guide
Analyzing data

Input
Parameter Description Type Required
measure Any measure Measure Yes
Examples
Product([Measure]) returns 30 if [Measure] has the values 2, 3, 5.
6.6.6.1.2.15 RunningAverage
Description
Returns the running average of a measure
Function Group
Aggregate
Syntax
num RunningAverage(measure[;Row|Col][;IncludeEmpty][;(reset_dims)])
To reset at each section the RunningAverage, we recommend the following syntax:
num RunningAverage(measure;section)
Input
Parameter
Description Type Required
measure Any measure Measure Yes
Row|Col Sets the calculation direction Keyword No
SAP BusinessObjects Web Intelligence User's Guide
Analyzing data
P U B L I C 597
Parameter Description Type Required
IncludeEmpty Includes empty values in the
calculation
Keyword No
reset_dims Resets the calculation on the
specied dimensions
Dimension list No
section Dimension on which the
section is set
Keyword Yes in the case of a section
reset
Notes
● You can use extended syntax context operators with RunningAverage.
● You can set the calculation direction with the Row and Col operators.
● If you apply a sort on the measure referenced by RunningAverage, the running average is calculated after
the measure is sorted.
● You must always place dimensions in parentheses even if there is only one dimension in the list of reset
dimensions.
● When you specify a set of reset dimensions you must separate them with semi-colons.
● RunningAverage does not automatically reset the average after a block break or new section.
Examples
RunningAverage([Revenue]) returns the following results:
Country
Resort Revenue Running Average
US Hawaiian Club 1,479,660 835,420
US Bahamas Beach 971,444 1,225,552
France French Riviera 835,420 1,095,508
RunningAverage([Revenue];([Country])) returns the following results:
Country
Resort Revenue Running Average
US Hawaiian Club 1,479,660 835,420
US Bahamas Beach 971,444 1,225,552
France French Riviera 835,420 835,420
In an example where you are using RunningAverage in a section on [Quarter], using the formula
RunningAverage([Sales revenue];([Quarter])), you receive the following results:
Q1
598 P U B L I C
SAP BusinessObjects Web Intelligence User's Guide
Analyzing data

City Sales revenue Running Average
New York $1,987,114.70 $1,987,114.70
Houston $1,544,627.80 $1,765,871.25
Los Angeles $1,129,177.60 $1,553,640.03
Q2
City Sales revenue Running Average
New York $2,028,090.70 $2,028,090.70
Houston $1,380,838.20 $1,704,464.45
Los Angeles $980,405.30 $1,463,111.40
Related Information
IncludeEmpty operator [page 777]
Row/Col operators [page 780]
6.6.6.1.2.16 RunningCount
Description
Returns the running count of a number set
Function Group
Aggregate
Syntax
num RunningCount(dimension|measure[;Row|Col][;IncludeEmpty][;(reset_dims)])
To reset at each section the RunningCount, we recommend the following syntax:
num RunningCount(dimension|measure;section)
SAP BusinessObjects Web Intelligence User's Guide
Analyzing data
P U B L I C 599
Input
Parameter Description Type Required
dimension|measure Any dimension or measure Dimension or measure Yes
Row|Col Sets the calculation direction Keyword No
IncludeEmpty Includes empty values in the
calculation
Keyword No
reset_dims Resets the calculation on the
specied dimensions
Dimension list No
section Dimension on which the
section is set
Keyword Yes in the case of a section
reset
Notes
● You can use extended syntax context operators with RunningCount.
● You can set the calculation direction with the Row and Col operators.
● If you apply a sort on the measure referenced by RunningCount, the running count is calculated after the
measure is sorted.
● You must always place dimensions in parentheses even if there is only one dimension in the list of reset
dimensions.
● When you specify a set of reset dimensions you must separate them with semi-colons.
● RunningCount does not automatically reset the count after a block break or new section.
Examples
RunningCount([Sales revenue]) returns these results in the following table:
Country Resort Sales revenue Running Count
US Hawaiian Club 1,479,660 1
US Bahamas Beach 971,444 2
France French Riviera 835,420 3
RunningCount([Revenue];([Country])) returns these results in the following table:
Country
Resort Revenue Running Count
US Hawaiian Club 1,479,660 1
US Bahamas Beach 971,444 2
France French Riviera 835,420 1
600 P U B L I C
SAP BusinessObjects Web Intelligence User's Guide
Analyzing data

In an example where you are using RunningCount in a section on [Week], using the formula
RunningCount([Lines];([Week])) and with an input control on [Sales revenue] limiting the list to
revenues over $30,000, returns the following results:
Week 1
Lines Sales revenue Running Count
Sweat-T-Shirts $186,191 1
Shirt Waist $139,082 2
Dresses $70,931 3
Week 2
Lines Sales revenue Running Count
Accessories $344,617 1
Sweat-T-Shirts $196,976 2
Shirt Waist $105,597 3
Dresses $76,290 4
Sweaters $68,364 5
Notice that in Week 1 there are three lines with revenue that exceeded $30,000, while in Week 2, there are ve
product lines that exceeded $30,000.
Related Information
IncludeEmpty operator [page 777]
Row/Col operators [page 780]
IncludeEmpty operator [page 777]
IncludeEmpty operator [page 777]
6.6.6.1.2.17 RunningMax
Description
Returns the running maximum of a dimension or measure
Function Group
Aggregate
SAP BusinessObjects Web Intelligence User's Guide
Analyzing data
P U B L I C 601
Syntax
input_type RunningMax(dimension|measure[;Row|Col][;(reset_dims)])
To reset at each section the RunningMax, we recommend the following syntax:
num RunningMax(measure;section)
Input
Parameter Description Type Reqiured
dimension|measure Any dimension or measure Dimension or measure Yes
Row|Col Sets the calculation direction Keyword No
reset_dims Resets the calculation on the
specied dimensions
Dimension list No
section Dimension on which the
section is set
Keyword Yes in the case of a section
reset
Notes
● You can use extended syntax context operators with RunningMax.
● You can set the calculation direction with the Row and Col operators.
● If you apply a sort on the measure referenced by RunningMax, the running maximum is calculated after
the measure is sorted .
● You must always place dimensions in parentheses even if there is only one dimension in the list of reset
dimensions.
● When you specify a set of reset dimensions you must separate them with semi-colons.
● RunningMax does not automatically reset the max after a block break or new section.
Examples
RunningMax([Revenue]) returns these results in the following table:
Country
Resort Revenue Running Max
France French Riviera 835,420 835,420
US Bahamas Beach 971,444 971,444
US Hawaiian Club 1,479,660 1,479,660
602 P U B LI C
SAP BusinessObjects Web Intelligence User's Guide
Analyzing data
In an example where you are using RunningMax in a section on [City], using the formula RunningMax([Sales
revenue];([City])), you receive the following results:
Austin
Quarter Sales revenue Running Max
Q1 $775,482.70 $775,482.70
Q2 $667,850.30 $775,482.70
Q3 $581,470.40 $775,482.70
Q4 $674,869.80 $775,482.70
Boston
Quarter Sales revenue Running Max
Q1 $312,896.40 $312,896.40
Q2 $291,431.00 $312,896.40
Q3 $249,529.00 $312,896.40
Q4 $429,850.20 $429,850.20
Related Information
IncludeEmpty operator [page 777]
Row/Col operators [page 780]
6.6.6.1.2.18 RunningMin
Description
Returns the running minimum of a dimension or measure
Function Group
Aggregate
Syntax
input_type RunningMin(dimension|measure;[Row|Col];[(reset_dims)])
SAP BusinessObjects Web Intelligence User's Guide
Analyzing data
P U B L I C 603

To reset at each section the RunningMin, we recommend the following syntax:
num RunningMin(measure;section)
Input
Parameter Description Type Required
dimension|detail|measure Any dimension or measure Dimension or measure Yes
Row|Col Sets teh calculation direction Keyword No
reset_dims Resets the calculation on the
specied dimensions
Dimension list No
section Dimension on which the
section is set
Keyword Yes in the case of a section
reset
Notes
● You can use extended syntax context operators with RunningMin.
● You can set the calculation direction with the Row and Col operators.
● If you apply a sort on the measure referenced by RunningMin, the running minimum is calculated after the
measure is sorted.
● You must always place dimensions in parentheses even if there is only one dimension in the list of reset
dimensions.
● When you specify a set of reset dimensions you must separate them with semi-colons.
● RunningMin does not automatically reset the minimum after a block break or new section.
Examples
RunningMin([Sales revenue]) returns these results in the following table:
Country
Resort Sales revenue Running Min
France French Riviera 835,420 835,420
US Bahamas Beach 971,444 835,420
US Hawaiian Club 1,479,660 835,420
In an example where you are using RunningMin in a section on [City], using the formula RunningMin([Sales
revenue];([City])), you receive the following results:
Austin
604 P U B L I C
SAP BusinessObjects Web Intelligence User's Guide
Analyzing data

Quarter Sales revenue Running Min
Q1 $775,482.70 $775,482.70
Q2 $667,850.30 $667,850.30
Q3 $581,470.40 $581,470.40
Q4 $674,869.80 $581,470.40
Boston
Quarter Sales revenue Running Min
Q1 $312,896.40 $312,896.40
Q2 $291,431.00 $291,431.00
Q3 $249,529.00 $249,529.00
Q4 $429,850.20 $249,529.00
Related Information
IncludeEmpty operator [page 777]
Row/Col operators [page 780]
6.6.6.1.2.19 RunningProduct
Description
Returns the running product of a measure
Function Group
Aggregate
Syntax
num RunningProduct(measure[;Row|Col][;(reset_dims)])
SAP BusinessObjects Web Intelligence User's Guide
Analyzing data
P U B L I C 605
Input
Parameter Description Type Required
measure Any measure Measure Yes
Row|Col Sets the calculation direction Keyword No
reset_dims Resets the calculation on the
specied dimensions
Dimension list No
Notes
● You can use extended syntax context operators with RunningProduct.
● You can set the calculation direction with the Row and Col operators.
● If you apply a sort on the measure referenced by RunningProduct, the running product is calculated after
the measure is sorted.
● You must always place dimensions in parentheses even if there is only one dimension in the list of reset
dimensions.
● When you specify a set of reset dimensions you must separate them with semi-colons.
● RunningProduct does not automatically reset the product after a block break or new section.
Examples
RunningProduct([Number of guests]) returns these results in the following table:
Country of origin
City Number of guests Running Product
Japan Kobe 6 6
Japan Osaka 4 24
US Chicago 241 5,784
RunningProduct([Number of guests];([Country of origin])) returns these results in the following
table:
Country of origin
City Number of guests Running Product
Japan Kobe 6 6
Japan Osaka 4 24
US Chicago 241 5784
606 P U B L I C
SAP BusinessObjects Web Intelligence User's Guide
Analyzing data
Related Information
IncludeEmpty operator [page 777]
Row/Col operators [page 780]
6.6.6.1.2.20 RunningSum
Description
Returns the running sum of a measure
Function Group
Aggregate
Syntax
num RunningSum(measure[;Row|Col][;(reset_dims)])
To reset at each section the RunningSum, we recommend the following syntax:
num RunningSum(measure;section)
Input
Parameter Description Type Required
measure Any measure Measure Yes
Row|Col Sets the calculation direction Keyword No
reset_dims Resets the calculation on the
specied dimensions
Dimension list No
section Dimension on which the
section is set
Keyword Yes in the case of a section
reset
SAP BusinessObjects Web Intelligence User's Guide
Analyzing data
P U B L I C 607

Notes
● You can use extended syntax context operators with the RunningSum.
● You can set the calculation direction with the Row and Col operators.
● If you apply a sort on the measure referenced by the RunningSum function, the running sum is calculated
after the measure is sorted.
● You must always place dimensions in parentheses even if there is only one dimension in the list of reset
dimensions.
● When you specify a set of reset dimensions you must separate them with semi-colons.
● RunningSum does not automatically reset the sum after a block break or new section.
Example
RunningSum([Revenue]) returns these results in the following table:
Country
Resort Revenue Running Sum
France French Riviera 835,420 835,420
US Bahamas Beach 971,444 1,806,864
US Hawaiian Club 1,479,660 3,286,524
RunningSum([Revenue];([Country])) returns these results in the following table:
Country
Resort Revenue Running Sum
France French Riviera 835,420 835,420
US Bahamas Beach 971,444 971,444
US Hawaiian Club 1,479,660 2,451,104
In an example where you are using RunningSum in a section on [Quarter], using the formula
RunningSum([Sales revenue];([Quarter])), you receive the following results:
Q1
City Sales revenue Running Sum
New York $1,987,114.70 $1,987,114.70
Houston $1,544,627.80 $3,531,742.50
Los Angeles $1,129,177.60 $4,660,920.10
Q2
City Sales revenue Running Sum
New York $2,028,090.70 $2,028,090.70
Houston $1,380,838.20 $3,408,928.90
608 P U B L I C
SAP BusinessObjects Web Intelligence User's Guide
Analyzing data

Los Angeles $980,405.30 $4,389,334.20
Related Information
IncludeEmpty operator [page 777]
Row/Col operators [page 780]
6.6.6.1.2.21 StdDev
Description
Returns the standard deviation of a measure
Function Group
Aggregate
Syntax
num StdDev(measure)
Input
Paramter Description Type Required
measure Any measure Measure Yes
Notes
The standard deviation is a measure of the statistical dispersion in a set of numbers. It is calculated by:
● nding the average of the set of numbers
● subtracting the average from each number in the set and squaring the dierence
SAP BusinessObjects Web Intelligence User's Guide
Analyzing data
P U B L I C 609

● summing all these squared dierences
● dividing this sum by (<number of numbers in the set> - 1)
● nding the square root of the result
Examples
If measure has the set of values (2, 4, 6, 8) StdDev([measure]) returns 2.58.
Related Information
Var [page 613]
6.6.6.1.2.22 StdDevP
Description
Returns the population standard deviation of a measure
Function Group
Aggregate
Syntax
num StdDevP(measure)
Input
Paramter
Description Type Required
measure Any measure Measure Yes
610 P U B L I C
SAP BusinessObjects Web Intelligence User's Guide
Analyzing data

Notes
The population standard deviation is a measure of the statistical dispersion in a set of numbers. It is calculated
by:
● nding the average of the set of numbers;
● subtracting the average from each number in the set and squaring the dierence;
● summing all these squared dierences;
● dividing this sum by (<number of numbers in the set>);
● nding the square root of the result.
You can use extended syntax context operators with StdDevP.
Examples
If measure has the set of values (2, 4, 6, 8) StdDevP([measure]) returns 2.24.
6.6.6.1.2.23 Sum
Description
Returns the sum of a measure
Function Group
Aggregate
Syntax
num Sum(measure[;member_set])
SAP BusinessObjects Web Intelligence User's Guide
Analyzing data
P U B L I C 611

Input
Parameter Description Type Required
measure Any measure Measure Yes
member_set A set of members Member set No
Notes
● You can use extended syntax context operators with Sum.
● If you include member_set, Sum returns the sum of the measure for all members in the member set.
● member_set can include multiple sets separated by semicolons (;).
● The list of member sets must be enclosed in {}.
● If the member set expression does not specify a precise member or node, the hierarchy referenced must
be present in the table, then the member set expression references the current member in the hierarchy in
the table. If the hierarchy is not in the table, the function returns the message #MULTIVALUE.
● Delegated measure aggregation returns #TOREFRESH when the required aggregation is not available in
the query. The user has to refresh the document to get the new level of aggregation. This occurs for
example when using the lter bar when the user selects a value before “all values” and vice versa when
selecting “all values” before a selected value.
● When migrating from XIR2 to XIR3, aggregation functions containing IN and WHERE clauses in XI2 queries
should be included into Sum function denitely by using parenthesis as follows:
In XIR2, the formula: =Sum([Measure] In ([Dim 1];[Dim 2])) In ([Dim 1]) Where ([Dim
3]="Constant")
From XI3 onwards, modify the declaration: =Sum(([Measure] In ([Dim 1];[Dim 2])) In ([Dim
1]) Where ([Dim 3]="Constant"))
● A delegated measure given against a group returns #UNAVAILABLE as it requires local aggregation
(aggregation of the measure value of the grouped values).
Even when you force local aggregaton on a delegated measure against an "if then else" formula or group
value it will still return the #MULTIVALUE message.
Examples
If the Sales Revenue measure has the values 2000, 3000, 4000, and 1000, Sum([Sales Revenue]) returns
10000.
If [California] is a member in the [Geography] hierarchy (Country > State > City), Sum([Sales Revenue];
{Descendants([Geography]&[US].[California];1)}) returns the total sales revenue of all cities in
California.
612
P U B L I C
SAP BusinessObjects Web Intelligence User's Guide
Analyzing data

6.6.6.1.2.24 Var
Description
Returns the variance of a measure
Function Group
Aggregate
Syntax
num Var(measure)
Input
Paramter Description Type Required
measure Any measure Measure Yes
Notes
The variance is a measure of the statistical dispersion in a set of numbers. It is calculated by:
● nding the average of the set of numbers
● subtracting the average from each number in the set and squaring the dierence
● summing all these squared dierences
● dividing this sum by (<number of numbers in the set> - 1)
The variance is the square of the standard deviation.
You can use extended syntax context operators with Var.
Examples
If measure has the set of values (2, 4, 6, 8) Var([measure]) returns 6.67.
SAP BusinessObjects Web Intelligence User's Guide
Analyzing data
P U B L I C 613

Related Information
StdDev [page 609]
6.6.6.1.2.25 VarP
Description
Returns the population variance of a measure
Function Group
Aggregate
Syntax
num VarP(measure)
Input
Paramter Description Type Required
measure Any measure Measure Yes
Notes
The population variance is a measure of the statistical dispersion in a set of numbers. It is calculated by:
● nding the average of the set of numbers
● subtracting the average from each number in the set and squaring the dierence
● summing all these squared dierences
● dividing this sum by (<number of numbers in the set>)
The population variance is the square of the population standard deviation.
You can use extended syntax context operators with VarP.
614
P U B L I C
SAP BusinessObjects Web Intelligence User's Guide
Analyzing data

Examples
If measure has the set of values (2, 4, 6, 8) VarP([measure]) returns 5.
Related Information
StdDevP [page 610]
6.6.6.1.3 Character functions
6.6.6.1.3.1 Asc
Description
Returns the ASCII value of a character
Function Group
Character
Syntax
int Asc(string)
Input
Parameter
Description Type Required
string Any string String Yes
SAP BusinessObjects Web Intelligence User's Guide
Analyzing data
P U B L I C 615

Notes
If string contains more than one character, the function returns the ASCII value of the rst character in the
string.
Examples
Asc("A") returns 65.
Asc("ab") returns 97.
Asc([Country]) returns 85 when the value of [Country] is "US".
6.6.6.1.3.2 Char
Description
Returns the character associated with an ASCII code
Function Group
Character
Syntax
string Char(ascii_code)
Input
Parameter
Description Type Required
ascii_code An ASCII code Number Yes
616 P U B L I C
SAP BusinessObjects Web Intelligence User's Guide
Analyzing data

Notes
If number is a decimal, the function ignores the decimal part.
Example
s
Char(123) returns "{".
6.6.6.1.3.3 Concatenation
Description
Concatenates (joins) two character strings. With numbers, the function will sum up the values rather than
concatenate them.
Note
If at least one of the input parameters is a string, then all other input parameters are converted into strings.
Function Group
Character
Syntax
string Concatenation(first_string;second_string)
Input
Parameter
Description Type Required
rst_string The rst string String or number Yes
SAP BusinessObjects Web Intelligence User's Guide
Analyzing data
P U B L I C 617

Parameter Description Type Required
second_string The string added to the rst
string
String or number Yes
Notes
You can also use the '+' operator to concatenate strings.
"First " + "Second" returns "First Second".
"First " + "Second" + " Third" returns "First Second Third".
You can use concatenation to include multiple dimensions in an aggregation function. For example,
Count([Sales Person]+[Quarter]+[Resort]) is equivalent to the syntax Count(<Sales
Person>,<Quarter>,<Resort>) that is allowed by Desktop Intelligence.
Examples
Concatenation("First ";"Second") returns "First Second".
Concatenation("First ";Concatenation("Second ";"Third")) returns "First Second Third".
If [A] is a number and [A] = 1, Concatenation([A];[A]) returns "2".
If [A] is a string and [A] = 1, Concatenation([A];[A]) returns "11".
If [A] is a string, [B] is a number, [A] = 1 and [B] = 2, Concatenation([A];[B]) returns "12".
6.6.6.1.3.4 Fill
Description
Builds a string by repeating a string n times
Function Group
Character
618
P U B L I C
SAP BusinessObjects Web Intelligence User's Guide
Analyzing data

Syntax
string Fill(repeating_string;num_repeats)
Input
Parameter Description Type Required
repeating_string The repeating string String Yes
num_repeats The number of repeats Number Yes
Examples
Fill ("New York ";2) returns "New York New York ".
6.6.6.1.3.5 FormatDate
Description
Formats a date according to a specied format
Function Group
Character
Syntax
string FormatDate(date;format_string)
SAP BusinessObjects Web Intelligence User's Guide
Analyzing data
P U B L I C 619
Input
Parameter Description Type Required
date The date to format Date Yes
format_string The format to apply String Yes
Notes
● The format of the output is dependent on the date format applied to the cell.
● The color formatting strings (for example: [Red], [Blue] and so on ) cannot be applied to FormatDate.
Examples
FormatDate(CurrentDate();"dd/MM/yyyy") returns "15/12/2005" if the current date is 15 December
2005.
Related Information
Custom formats [page 361]
6.6.6.1.3.5.1 Format_string examples for the FormatDate
function
In the FormatDate syntax for format_string, you can use the examples in the following table.
Note
You can nd these samples in the Format Number dialog box in the Web Intelligence Rich Client or Applet
interfaces; however what samples appear depend on your selected Product Locale in the BI launch pad
preferences. For example, if you select English, then “September 21, 2004” will be an available sample.
Sample
Syntax
Tuesday, September 21, 2004 dddd', 'mmmm d', 'yyyy
September 21, 2004 mmmm d', 'yyyy
Sep 21, 2004 mmm d', 'yyyy
620 P U B LI C
SAP BusinessObjects Web Intelligence User's Guide
Analyzing data
Sample Syntax
9/21/04 M'/'d'/'yy
Sep 21, 2004 8:45:30 PM mmm d', 'yyyy h':'mm':'ss a
9/21/04 8:45 PM M'/'d'/'yy h':'mm a
9/21/2004 M'/'d'/'yyyy
09/21/2004 MM'/'d'/'yyyy
9/21/04 8:45:30 PM M'/'d'/'yy h':'mm a
8:45:30 PM h':'mm':'ss a
8:45 PM h':'mm a
20:45:30 HH’:’mm’:’ss
20h45 HH’h’mm
Tip
We recommend that you represent actual text in the syntax surrounded by apostrophes so that the text is
not confused as pattern symbols. For example, as in the last sample in the table above, ‘h’ in “HH’h’mm”.
Related Information
FormatDate [page 619]
Custom formats [page 361]
6.6.6.1.3.6 FormatNumber
Description
Formats a number according to a specied format
Function Group
Character
Syntax
string FormatNumber(number;format_string)
SAP BusinessObjects Web Intelligence User's Guide
Analyzing data
P U B L I C 621

Input
Parameter Description Type Required
number The number to format Number Yes
format_string The format to apply String Yes
Notes
● The format of the output is dependent on the number format applied to the cell.
● The color formatting strings (for example: [Red], [Blue] and so on ) cannot be applied to FormatNumber.
Examples
FormatNumber([Revenue];"#,##.00") returns 835,420.00 if [Revenue] is 835,420.
Related Information
Custom formats [page 361]
6.6.6.1.3.7 HTMLEncode
Description
Applies HTML encoding rules to a string
Function Group
Character
Syntax
string HTMLEncode(html)
622
P U B L I C
SAP BusinessObjects Web Intelligence User's Guide
Analyzing data

Input
Paramter Description Type Required
html An HTML string String Yes
Examples
HTMLEncode("<Hello World!>") returns "<Hello World!>", because the browser interprets the character.
Internally, it returns "<Hello World!>".
6.6.6.1.3.8 InitCap
Description
Capitalizes the rst letter of a string
Function Group
Character
Syntax
string InitCap(string)
Input
Parameter
Description Type Required
string The string to capitalize String Yes
SAP BusinessObjects Web Intelligence User's Guide
Analyzing data
P U B L I C 623

Examples
InitCap("we hold these truths to be self-evident") returns "We hold these truths to be self-
evident".
6.6.6.1.3.9 Left
Description
Returns the leftmost characters of a string.
Note
When the selected interface locale is Arabic (Right-To-Left display/reading) this function returns the rst
characters from the logical start of the string.
Function Group
Character
Syntax
string Left(string;num_chars)
Input
Parameter Description Type Required
string The input string string Yes
num_chars The number of characters to
return from the start of the
string
number Yes
Example
Left([Country];2) returns "Fr" if [Country] is "France".
624
P U B L I C
SAP BusinessObjects Web Intelligence User's Guide
Analyzing data

6.6.6.1.3.10 LeftPad
Description
Pads a string on its left with another string.
Note
When the selected interface locale is Arabic (Right-To-Left display/reading) this function pads the string
before its logical start with characters of another string.
Function Group
Character
Syntax
string LeftPad(padded_string;length;left_string)
Input
Parameter Description Type Required
padded_string The original string String Yes
length The length of the output
string
Number Yes
left_string The string to be added to the
start of
padded_string
String Yes
Notes
● If length is less than the length of left_string and padded_string combined, left_string is
truncated.
● If length is less than or equal to the length of padded_string, the function returns padded_string.
● If length is greater than the lengths of padded_string and left_string combined, left_string is
repeated or partially repeated enough times to ll out the length.
SAP BusinessObjects Web Intelligence User's Guide
Analyzing data
P U B L I C 625
Examples
LeftPad("York";8;"New ") returns "New York"
LeftPad("York";6;"New ") returns "NeYork"
LeftPad("York";11;"New ") returns "New NewYork"
LeftPad("New ";2;"York") returns "New".
6.6.6.1.3.11 LeftTrim
Description
Trims the leading spaces from a string.
Note
When the selected interface locale is Arabic (Right-To-Left display/reading) this function removes the rst
space characters from the logical start of the string.
Function Group
Character
Syntax
string LeftTrim(trimmed_string)
Input
Parameter Description Type Required
trimmed_string The string to be trimmed String Yes
Examples
LeftTrim([Country]) returns "France" if [Country] is " France".
626
P U B L I C
SAP BusinessObjects Web Intelligence User's Guide
Analyzing data

6.6.6.1.3.12 Length
Description
Returns the number of characters in a string
Function Group
Character
Syntax
int Length(string)
Input
Parameter Description Type Required
string The input string String Yes
Examples
Length([Last Name]) returns 5 if [Last Name] is "Smith".
6.6.6.1.3.13 Lower
Description
Converts a string to lower case
Function Group
Character
SAP BusinessObjects Web Intelligence User's Guide
Analyzing data
P U B L I C 627

Syntax
string Lower(string)
Input
Parameter Description Type Required
string The string to be converted to
lower case
String Yes
Examples
Lower("New York") returns "new york".
6.6.6.1.3.14 Match
Description
Determines whether a string matches a pattern
Function Group
Character
Syntax
bool Match(test_string;pattern)
628
P U B L I C
SAP BusinessObjects Web Intelligence User's Guide
Analyzing data

Input
Paramter Description Type Required
test_string The string to be tested
against the text pattern
string Yes
pattern The text pattern string Yes
Notes
● The pattern can contain the wildcards "*" (replaces any set of characters) or "?" (replaces any single
character).
Examples
Match([Country];"F*") returns True if [Country} is "France".
Match([Country];"?S?") returns True if [Country] is "USA".
Match("New York";"P*") returns False.
6.6.6.1.3.15 Pos
Description
Returns the starting position of a text pattern in a string
Function Group
Character
Syntax
int Pos(test_string;pattern)
SAP BusinessObjects Web Intelligence User's Guide
Analyzing data
P U B L I C 629

Input
Paramter Description Type Required
test_string The string to be tested for
the text pattern
string Yes
pattern The text pattern string Yes
Notes
● If the pattern occurs more than once, Pos returns the position of the rst occurrence.
Examples
Pos("New York";"Ne") returns 1.
Pos("New York, New York";"Ne") returns 1.
Pos("New York"; "York") returns 5.
6.6.6.1.3.16 Replace
Description
Replaces part of a string with another string
Function Group
Character
Syntax
string Replace(replace_in;replaced_string;replace_with)
630
P U B L I C
SAP BusinessObjects Web Intelligence User's Guide
Analyzing data
Input
Parameter Description Type Required
replace_in The string in which the text is
replaced
string Yes
replaced_string The text to be replaced string Yes
replace_with The text that replaces
replaced_string
string Yes
Examples
Replace("New YORK";"ORK";"ork") returns "New York".
6.6.6.1.3.17 Right
Description
Returns the rightmost characters of a string (the characters at the end of the string).
Note
When the selected interface locale is Arabic (Right-To-Left display/reading) this function returns the rst
characters from the logical start of the string.
Function Group
Character
Syntax
string Right(string;num_chars)
SAP BusinessObjects Web Intelligence User's Guide
Analyzing data
P U B L I C 631
Input
Parameter Description Type Required
string Any string string Yes
num_chars The number of characters to
return from the right
number Yes
Examples
Right([Country];2) returns "ce" if [Country] is "France".
6.6.6.1.3.18 RightPad
Description
Pads a string on its right with another string (adds a string to the start of the original string).
Note
When the selected interface locale is Arabic (Right-To-Left display/reading) this function adds a string to
the rst characters from the logical start of the string.
Function Group
Character
Syntax
string RightPad(padded_string;length;right_string)
632
P U B L I C
SAP BusinessObjects Web Intelligence User's Guide
Analyzing data
Input
Parameter Description Type Required
padded_string The original string String Yes
length The length of the output
string
Number Yes
right_string The string to be added to the
end of
padded_string
String Yes
Notes
● If length is less than the length of right_string and padded_string combined, right_string is
truncated.
● If length is less than or equal to the length of padded_string, the function returns padded_string.
● If length is greater than the lengths of padded_string and right_string combined, right_string
is repeated or partially repeated enough times to ll out the length.
Examples
RightPad("New ";8;"York") returns "New York"
RightPad("New ";6;"York") returns "New Yo"
RightPad("New ";11;"York") returns "New YorkYor"
RightPad("New ";2;"York") returns "New".
6.6.6.1.3.19 RightTrim
Description
Trims the trailing spaces from a string.
Note
When the selected interface locale is Arabic (Right-To-Left display/reading) this function trims the trailing
space from the logical end of the string.
SAP BusinessObjects Web Intelligence User's Guide
Analyzing data
P U B L I C 633

Function Group
Character
Syntax
string RightTrim(trimmed_string)
Input
Parameter Description Type Required
trimmed_string The string to be trimmed String Yes
Examples
RightTrim([Country]) returns "France" if [Country] is "France ".
6.6.6.1.3.20 Substr
Description
Returns part of a string
Function Group
Character
Syntax
string SubStr(string;start;length)
634
P U B L I C
SAP BusinessObjects Web Intelligence User's Guide
Analyzing data

Input
Parameter Description Type Required
string Any string String Yes
start The start position of the
extracted string
Number Yes
length The length of the extracted
string
Number Yes
Examples
SubStr("Great Britain";1;5) returns "Great".
SubStr("Great Britain";7;7) returns "Britain".
6.6.6.1.3.21 Trim
Description
Trims the leading and trailing spaces from a string
Function Group
Character
Syntax
string Trim(trimmed_string)
Input
Parameter
Description Type Required
string The string to be trimmed String Yes
SAP BusinessObjects Web Intelligence User's Guide
Analyzing data
P U B L I C 635

Examples
Trim(" Great Britain ") returns "Great Britain".
6.6.6.1.3.22 Upper
Description
Converts a string to upper case
Function Group
Character
Syntax
string Upper(string)
Input
Parameter Description Type Required
string The string to be converted String Yes
Examples
Upper("New York") returns "NEW YORK".
6.6.6.1.3.23 UrlEncode
Description
Applies URL encoding rules to a string
636
P U B L I C
SAP BusinessObjects Web Intelligence User's Guide
Analyzing data

Function Group
Character
Syntax
string UrlEncode(html)
Input
Parameter Description Type Required
html The URL to be encoded String Yes
Examples
UrlEncode("http://www.sap.com") returns "http%3A%2F%2Fwww%2Esap%2Ecom".
6.6.6.1.3.24 WordCap
Description
Capitalizes the rst letter of all the words in a string
Function Group
Character
Syntax
string WordCap(string)
SAP BusinessObjects Web Intelligence User's Guide
Analyzing data
P U B L I C 637

Input
Parameter Description Type Required
string The string to be capitalized String Yes
Examples
WordCap("Sales revenue for March") returns "Sales Revenue For March".
6.6.6.1.4 Date and Time functions
6.6.6.1.4.1 CurrentDate
Description
Returns the current date formatted according to the regional settings
Function Group
Date and Time
Syntax
date CurrentDate()
Examples
CurrentDate() returns 10 September 2002 if the date is 10 September 2002.
638
P U B L I C
SAP BusinessObjects Web Intelligence User's Guide
Analyzing data

6.6.6.1.4.2 CurrentTime
Description
Returns the current time formatted according to the regional settings
Function Group
Date and Time
Syntax
time CurrentTime()
Examples
CurrentTime returns 11:15 if the current time is 11:15.
6.6.6.1.4.3 DatesBetween
Description
Returns the number of periods between two dates, irrespective of the time.
Function Group
Date and Time
Syntax
int DatesBetween(first_date;last_date;period)
SAP BusinessObjects Web Intelligence User's Guide
Analyzing data
P U B L I C 639

Input
Parameter Description Type Required
first_date
The rst date of the time
range
Date Yes
last_date
The last date of the time
range
Date Yes
period
The type of period to be
counted in the time range
Pre-dened Yes
Note
● Possible values for the period parameter are: DayPeriod, WeekPeriod, MonthPeriod,
QuarterPeriod, SemesterPeriod, YearPeriod.
● If the return value is out of range for int, an #OVERFLOW error is returned.
Examples
● DatesBetween([Begin Date];[End Date];MonthPeriod) returns 2 when [Begin Date] is 30
June 2016 and [End Date] is 3 August 2016.
● DatesBetween([Begin Date];[End Date];DayPeriod) returns -10 when [Begin Date] is 30 June
2016 and [End Date] is 20 June 2016.
● DatesBetween([Begin Date];[End Date];QuarterPeriod) returns 6 when [Begin Date] is 30
June 2016 and [End Date] is 17 November 2017.
● DatesBetween([Begin Date];[End Date];MonthPeriod) returns 1 when [Begin Date] is 31
December 2015 and [End Date] is 1 January 2016.
● DatesBetween([Begin Date];[End Date];DayPeriod) returns 1 when [Begin Date] is 31
December 2015 and [End Date] is 1 January 2016.
● DatesBetween([Begin Date];[End Date];WeekPeriod) returns 0 when [Begin Date] is 31
December 2015 and [End Date] is 1 January 2016, because both days belong to the same week.
6.6.6.1.4.4 DayName
Description
Returns the day name in a date
640
P U B L I C
SAP BusinessObjects Web Intelligence User's Guide
Analyzing data

Function Group
Date and Time
Syntax
string DayName(date)
Input
Parameter Description Type Required
date The input date Date Yes
Examples
DayName([Reservation Date]) returns "Saturday' when the date in [Reservation Date] is 15 December
2001 (which is a Saturday).
Note
The input date must be a variable. You cannot specify the date directly, as in DayName("07/15/2001").
6.6.6.1.4.5 DayNumberOfMonth
Description
Returns the day number in a month
Function Group
Date and Time
SAP BusinessObjects Web Intelligence User's Guide
Analyzing data
P U B L I C 641

Syntax
int DayNumberOfMonth(date)
Input
Parameter Description Type Required
date The input date Date Yes
Examples
DayNumberOfMonth([Reservation Date]) returns 15 when the date in [Reservation Date] is 15 December
2001.
6.6.6.1.4.6 DayNumberOfWeek
Description
Returns the day number in a week
Function Group
Date and Time
Syntax
int DayNumberOfWeek(date)
642
P U B L I C
SAP BusinessObjects Web Intelligence User's Guide
Analyzing data

Input
Parameter Description Type Required
date The input date Date Yes
Notes
The function treats Monday as the rst day of the week.
Examples
DayNumberOfWeek([Reservation Date]) returns 1 when the date in [Reservation Date] is 2 May 2005
(which is a Monday).
6.6.6.1.4.7 DayNumberOfYear
Description
Returns the day number in a year
Function Group
Date and Time
Syntax
int DayNumberOfYear(date)
SAP BusinessObjects Web Intelligence User's Guide
Analyzing data
P U B L I C 643
Input
Parameter Description Type Required
date The input date Date Yes
Examples
DayNumberOfYear([Reservation Date]) returns 349 when the date in [Reservation Date] is 15 December
2001.
6.6.6.1.4.8 DaysBetween
Description
Returns the number of days between two dates
Function Group
Date and Time
Syntax
int DaysBetween(first_date;last_date)
Note
You must ensure that the dates given in the arguments are in the same timezone. This applies to all date
operations: comparison and calculation.
Input
Parameter
Description Type Required
rst_date The rst date Date Yes
644 P U B L I C
SAP BusinessObjects Web Intelligence User's Guide
Analyzing data

Parameter Description Type Required
last_date The last date Date Yes
Examples
DaysBetween([Sale Date];[Invoice Date]) returns 2 if [Sale Date] is 15 December 2001 and [Invoice
Date] is 17 December 2001.
6.6.6.1.4.9 LastDayOfMonth
Description
Returns the date of the last day in a month
Function Group
Date and Time
Syntax
date LastDayOfMonth(date)
Input
Parameter Description Type Required
date Any date in the month Date Yes
Examples
LastDayOfMonth([Sale Date]) returns 31 December 2005 if [Sale Date] is 11 December 2005.
SAP BusinessObjects Web Intelligence User's Guide
Analyzing data
P U B L I C 645

6.6.6.1.4.10 LastDayOfWeek
Description
Returns the date of the last day in a week
Function Group
Date and Time
Syntax
date LastDayOfWeek(date)
Input
Parameter Description Type Required
date Any date in the week Date Yes
Notes
The function treats Monday as the rst day of the week.
Examples
LastDayOfWeek([Sale Date]) returns 15 May 2005 (a Sunday) if [Sale Date] is 11 May 2005.
6.6.6.1.4.11 Month
Description
Returns the month name in a date
646
P U B L I C
SAP BusinessObjects Web Intelligence User's Guide
Analyzing data
Function Group
Date and Time
Syntax
string Month(date)
Input
Parameter Description Type Required
date The input date Date Yes
Examples
Month([Reservation Date]) returns "December" when the date in [Reservation Date] is 15 December
2005.
6.6.6.1.4.12 MonthNumberOfYear
Description
Returns the month number in a date
Function Group
Date and Time
Syntax
int MonthNumberOfYear(date)
SAP BusinessObjects Web Intelligence User's Guide
Analyzing data
P U B L I C 647

Input
Parameter Description Type Required
date Any date in the year Date Yes
Example
MonthNumberOfYear([Reservation Date]) returns 12 when the date in [Reservation Date] is 15
December 2005.
6.6.6.1.4.13 MonthsBetween
Description
Returns the number of months between two dates
Function Group
Date and Time
Syntax
int MonthsBetween(first_date;last_date)
Input
Parameter
Description Type Required
rst_date The rst date Date Yes
last_date The last date Date Yes
648 P U B L I C
SAP BusinessObjects Web Intelligence User's Guide
Analyzing data

Examples
MonthsBetween([Sale Date];[Invoice Date]) returns 1 if [Sale Date] is 2 December 2005 and [Invoice
Date] is 2 January 2006.
MonthsBetween([Sale Date];[Invoice Date]) returns 1 if [Sale Date] is 31/03/2008 and [Invoice
Date] is 30/04/2008.
MonthsBetween([Sale Date];[Invoice Date]) returns 118 if [Sale Date] is 07/01/1993 and [Invoice
Date] is 06/11/2002.
6.6.6.1.4.14 Quarter
Description
Returns the quarter number in a date
Function Group
Date and Time
Syntax
int Quarter(date)
Input
Parameter Description Type Required
date Any date in the quarter Date Yes
Examples
Quarter([Reservation Date]) returns 4 when the date in [Reservation Date] is 15 December 2005.
SAP BusinessObjects Web Intelligence User's Guide
Analyzing data
P U B L I C 649

6.6.6.1.4.15 RelativeDate
Description
Returns a date relative to another date.
Function Group
Date and Time
Syntax
date RelativeDate(start_date;num;period)
Input
Parameter Description Type Required
start_date The start date Date Yes
num The number of period units
added to the start date
Number Yes
period The type of period added to
the start date
Pre-dened Optional
Notes
● The num parameter can be a constant, the numerical result of a function, a measure value or a numerical
dimension value, and has to be an integer.
● The num parameter can be negative to return a date earlier than start_date.
● If omitted, the period parameter works with days (DayPeriod).
● When adding or subtracting months (for SemesterPeriod, QuarterPeriod and MonthPeriod), if the
day does not exist in the returned month, then the last day of the returned month must be used.
● Possible values for the period parameter are: MillisecondPeriod, SecondPeriod, MinutePeriod,
HourPeriod, DayPeriod, WeekPeriod, MonthPeriod, QuarterPeriod, SemesterPeriod,
YearPeriod.
650
P U B L I C
SAP BusinessObjects Web Intelligence User's Guide
Analyzing data
Examples
RelativeDate([Reservation Date];2) returns 17 December 2005 when [Reservation Date] is 15
December 2005.
RelativeDate([Reservation Date];-3) returns 9 January 2007 when [Reservation Date] is 12 January
2007.
RelativeDate([Reservation Date];1;MonthPeriod) returns 12 February 2007 when [Reservation
date] is 12 January 2007.
6.6.6.1.4.16 TimeBetween
Description
Returns the number of periods between two dates, taking the time into account.
Function Group
Date and Time
Syntax
int TimeBetween(first_date;last_date;period)
Note
Make sure that the dates given in the arguments are in the same time zone, since no time zone oset is
used in calculating the return value.
Input
Parameter
Description Type Required
first_date
The rst date of the time
range
Time Yes
last_date
The last date of the time
range
Time Yes
SAP BusinessObjects Web Intelligence User's Guide
Analyzing data
P U B L I C 651

Parameter Description Type Required
period
The type of period to be
counted in the time range
Pre-dened Yes
Notes
● Possible values for the period parameter are: DayPeriod, WeekPeriod, MonthPeriod,
QuarterPeriod, SemesterPeriod, YearPeriod, HourPeriod, MinutePeriod, SecondPeriod,
MillisecondPeriod.
● If the return value is out of range for int, an #OVERFLOW error is returned.
Examples
● TimeBetween([Begin Date];[End Date];HourPeriod) returns 2 when [Begin Date] is 30 June
2016, 8:45 and
[End Date] is 30 June 2016, 10:05.
● TimeBetween([Begin Date];[End Date];MinutePeriod) returns -10 when [Begin Date] is 30
June 2016 8:45 and [End Date] is 30 June 2016 8:35.
● TimeBetween([Begin Date];[End Date];SecondPeriod) returns 120 when [Begin Date] is 30
June 2016 8:45 and [End Date] is 30 June 2016 8:47.
● TimeBetween([Begin Date];[End Date];MonthPeriod) returns 1 when [Begin Date] is 31 December 2015
11:45 and [End Date] is 1 January 2016 8:47.
● TimeBetween([Begin Date];[End Date];DayPeriod) returns 1 when [Begin Date] is 31
December 2015 11:45 and [End Date] is 1 January 2016 8:47.
● TimeBetween([Begin Date];[End Date];WeekPeriod) returns 0 when [Begin Date] is 31
December 2015 11:45 and [End Date] is 1 January 2016 8:47, because both days belong to the same
week.
6.6.6.1.4.17 TimeDim
Description
The TimeDim time dimension allows you to build a time axis from a date type universe object. TimeDim returns
the data for the dates given as the rst parameter over the time periods given as the second parameter. When
there are periods that have no data, the rst day of each empty period is returned. This ensures a full axis for
the given period. This guarantees:
● That the axis retains the natural time order (oldest objects rst, the most recent objects last).
● The axis contains all the periods between the minimum and maximum dates in the current context.
652
P U B L I C
SAP BusinessObjects Web Intelligence User's Guide
Analyzing data
Note
You cannot use the TimeDim function to lter on formulas (for example in a lter, input-control, element-
link, lter/drill bar). Instead you should directly lter on the underlaying date dimension.
Function Group
Date and Time
Syntax
TimeDim([Date Type]; Period Type)
Input
Parameter Description Type Required
Date Type The date object for the
report, for example,
InvoiceDate.
Date Yes
Period Type The period for the results,
from the following values:
● DayPeriod
● MonthPeriod
● QuarterPeriod
● YearPeriod
When no value is selected,
the DayPeriod is used by
default. This object should
be a data provider object, it
must be available from
report objects, and cannot
be a variable.
Pre-dened Optional
Use the above function in conjunction with the following functions:
● DayName
● DayNumberOfMonth
● DayNumberOfWeek
● DayNumberOfYear
● Month
SAP BusinessObjects Web Intelligence User's Guide
Analyzing data
P U B L I C 653
● MonthNumberOfYear
● Quarter
● Year
● FormatDate
Example
The rst table below contains data that concerns only certain dates. The query examples that follow show how
the results are interpreted.
Invoice Date Revenue
1/3/00 31,607
1/8/00 31,244
7/3/00 38,154
The following formula DayName(TimeDim([Invoice Date] ; QuarterPeriod) returns daily values from
the above table.
Invoice Date Revenue
1/3/00 31,607
1/8/00 31,244
4/1/00
7/3/00 38,154
You should format the results of the TimeDim function with the Quarter function to return the results by
Quarter (Q1, Q2...) to give you the following result table:
Invoice Date Revenue
Q1 62,851
Q2
Q3 38,154
6.6.6.1.4.18 ToDate
Description
Turns a character string into a date. Give the date format as the parameter to indicate to Web Intelligence how
to convert the string into a date. The date format you provide must match the format of the date in the original
string. Refer to the link below for the possible date formats.
654
P U B L I C
SAP BusinessObjects Web Intelligence User's Guide
Analyzing data

Function Group
Date and Time
Syntax
date ToDate(date_string;format)
or
date ToDate(date_string;"INPUT_DATE_TIME")
Note
In scenarios where the Preferred viewing locale can be dierent depending on the user, a xed format (for a
particular locale) is not appropriate. In this case use INPUT_DATE_TIME as shown in the second example
above.
Input
Parameter Description Type Required
date_string The string to be interpreted
as a date.
string Yes
format
The date format used by the
string.
Use “INPUT_DATE_TIME”
to use the format of the
Preferred viewing locale.
string Yes*
* See the note above. Use the format or INPUT_DATE_TIME depending on your needs.
Examples
ToDate("12/15/2002";"MM/dd/yyyy") interprets “12” as a month number, “15” as a day number and
“2002” as a year.
ToDate("Dec/02";"Mmm/yy") interprets “Dec” as an abbreviated month name and “02” as the two last
digits of a year.
ToDate("15-December-02";"dd-Mmmm-yy") interprets “15” as a day number, “December” as a month and
“02” as the last two digits of a year.
SAP BusinessObjects Web Intelligence User's Guide
Analyzing data
P U B L I C 655

ToDate("12/15/02 11:00:00";"INPUT_DATE_TIME") interprets “12/15/02 11:00:00” in the format used
by the Preferred viewing locale on the user's machine.
Note
● With INPUT_DATE_TIME, both the date and time must be specied in the date_string input string.
● If date_string cannot be interpreted as a valid date with the specied format, the ToDate() formula
returns #ERROR.
● The way a date is displayed in a cell depends on the chosen date format in that cell. For instance, if the
chosen date format is "MM/dd/yyyy", then ToDate(“Dec/15/02”;”MMM/dd/yy”) will be displayed
as 12/15/2002.
Related Information
Custom formats [page 361]
6.6.6.1.4.19 Week
Description
Returns the week number in the year
Function Group
Date and Time
Syntax
int Week(date)
Input
Parameter
Description Type Required
date The input date Date Yes
656 P U B LI C
SAP BusinessObjects Web Intelligence User's Guide
Analyzing data

Examples
Week([Reservation Date]) returns 1 when the date in [Reservation Date] is 4 January 2004 (which occurs
in the rst week of the year 2004).
6.6.6.1.4.20 Year
Description
Returns the year in a date
Function Group
Date and Time
Syntax
int Year(date)
Input
Parameter Description Type Required
date The input date Date Yes
Examples
Year([Reservation Date]) returns 2005 when the date in [Reservation Date] is 15 December 2005.
SAP BusinessObjects Web Intelligence User's Guide
Analyzing data
P U B L I C 657

6.6.6.1.5 Data Provider functions
6.6.6.1.5.1 Connection
Description
Returns the parameters of the database connection used by a data provider
Function Group
Data Provider
Syntax
string Connection(dp)
Input
Parameter Description Type Required
dp The data provider Data provider Yes
Notes
● You must enclose the name of the data provider in square brackets.
● For security reasons, the output of the function does not include the database host name, user name and
user password.
6.6.6.1.5.2 DataProvider
Description
Returns the name of the data provider containing a report object
658
P U B L I C
SAP BusinessObjects Web Intelligence User's Guide
Analyzing data
Function Group
Data Provider
Syntax
string DataProvider(obj)
Input
Parameter Description Type Required
obj A report object Report object Yes
Examples
DataProvider([Total Revenue]) returns "Sales" if the [Total Revenue] measure is in a data provider
called "Sales".
Note
DataProvider requires an object name to return its data provider name. If you use another function as a
parameter of DataProvider, for example a dimension variable, that does not give an object name, the
DataProvider function will return an error.
6.6.6.1.5.3 DataProviderKeyDate
Description
Returns the keydate of a data provider
Function Group
Data Provider
SAP BusinessObjects Web Intelligence User's Guide
Analyzing data
P U B L I C 659

Syntax
date DataProviderKeyDate(dp)
Input
Parameter Description Type Required
dp The data provider Data provider Yes
Notes
● You must enclose the name of the data provider in square brackets.
● The returned keydate is formatted according to the document locale.
Examples
DataProviderKeyDate([Sales]) returns 3 August 2007 if the keydate for the Sales data provider is 3
August 2007.
6.6.6.1.5.4 DataProviderKeyDateCaption
Description
Returns the keydate caption of a data provider
Function Group
Data Provider
Syntax
string DataProviderKeyDateCaption(dp)
660
P U B L I C
SAP BusinessObjects Web Intelligence User's Guide
Analyzing data

Input
Parameter Description Type Required
dp The data provider Data provider Yes
Notes
You must enclose the name of the data provider in square brackets.
Examples
DataProviderKeyDateCaption([Sales]) returns "Current calendar date" if the keydate caption in the
Sales data provider is "Current calendar date".
6.6.6.1.5.5 DataProviderSQL
Description
Returns the SQL generated by a data provider
Function Group
Data Provider
Syntax
string DataProviderSQL(dp)
SAP BusinessObjects Web Intelligence User's Guide
Analyzing data
P U B L I C 661

Input
Parameter Description Type Required
dp The data provider Data provider Yes
Notes
You must enclose the name of the data provider in square brackets.
Examples
DataProviderSQL([Query 1]) returns SELECT country.country_name FROM country if the data
provider SQL is SELECT country.country_name FROM country.
6.6.6.1.5.6 DataProviderType
Description
Returns the type of a data provider
Function Group
Data Provider
Syntax
string DataProviderType(dp)
662
P U B L I C
SAP BusinessObjects Web Intelligence User's Guide
Analyzing data

Input
Parameter Description Type Required
dp The data provider Data provider Yes
Notes
● DataProviderType returns "Universe" for universe data providers or "Personal Data" for personal data
providers.
● You must enclose the name of the data provider in square brackets.
Examples
DataProviderType([Sales]) returns "Universe" if the "Sales" data provider is based on a universe.
6.6.6.1.5.7 IsPromptAnswered
Description
Determines whether a prompt has been answered
Function Group
Data Provider
Syntax
bool IsPromptAnswered([dp;]prompt_string)
SAP BusinessObjects Web Intelligence User's Guide
Analyzing data
P U B L I C 663

Input
Parameter Description Type Required
dp The data provider containing
the prompt
Data provider No
prompt_string The prompt text String Yes
Notes
● You must enclose the name of the data provider in square brackets.
● IsPromptAnswered returns a Boolean value that you can use with the If function.
● If you place IsPromptAnswered directly into a column, it returns an integer (1=true, 0=false). You can
format this integer using a Boolean number format.
Examples
IsPromptAnswered("Choose a city") returns true if the prompt identied by the text "Choose a city" has
been answered.
IsPromptAnswered([Sales];"Choose a city") returns true if the prompt identied by the text "Choose
a city" in the [Sales] data provider has been answered.
6.6.6.1.5.8 LastExecutionDate
Description
Returns the date on which a data provider was last refreshed
Function Group
Data Provider
Syntax
date LastExecutionDate(dp)
664
P U B L I C
SAP BusinessObjects Web Intelligence User's Guide
Analyzing data

Input
Parameter Description Type Required
dp The data provider Data provider Yes
Notes
● If your report has one data provider only you can omit the dp parameter.
● You must enclose the name of the data provider in square brackets.
● You can use the DataProvider function to provide a reference to a data provider.
Examples
LastExecutionDate([Sales Query]) returns "3/4/2002" if the Sales Query data provider was last
refreshed on 4 March 2002.
Related Information
DataProvider [page 658]
6.6.6.1.5.9 LastExecutionDuration
Description
Returns the time in seconds taken by the last refresh of a data provider
Function Group
Data Provider
SAP BusinessObjects Web Intelligence User's Guide
Analyzing data
P U B L I C 665

Syntax
num LastExecutionDuration(dp)
Input
Parameter
Description Type Required
dp The data provider Data provider Yes
Notes
You must enclose the name of the data provider in square brackets.
Examples
LastExecutionDuration([Sales]) returns 3 if the "Sales" data provider took 3 second to return its data
the last time it was run.
6.6.6.1.5.10 LastExecutionTime
Description
Returns the time at which a data provider was last refreshed
Function Group
Data Provider
Syntax
time LastExecutionTime(dp)
666
P U B L I C
SAP BusinessObjects Web Intelligence User's Guide
Analyzing data

Input
Parameter Description Type Required
dp The data provider Data provider Yes
Notes
● If your report has one data provider only you can omit the dp parameter.
● You can use the DataProvider function to provide a reference to a data provider.
● You must enclose the name of the data provider in square brackets.
Examples
LastExecutionTime([Sales Query]) returns "2:48:00 PM" if the Sales Query data provider was last
refreshed at 2:48:00 PM.
Related Information
DataProvider [page 658]
6.6.6.1.5.11 NumberOfDataProviders
Description
Returns the number of data providers in a report
Function Group
Data Provider
SAP BusinessObjects Web Intelligence User's Guide
Analyzing data
P U B L I C 667

Syntax
int NumberOfDataProviders()
Examples
NumberOfDataProviders() returns 2 if the report has two data providers.
6.6.6.1.5.12 NumberOfRows
Description
Returns the number of rows in a data provider
Function Group
Data Provider
Syntax
int NumberOfRows(dp)
Input
Parameter Description Type Required
dp The data provider Data provider Yes
Notes
● You must enclose the name of the data provider in square brackets.
● You can use the DataProvider function to provide a reference to a data provider.
668
P U B L I C
SAP BusinessObjects Web Intelligence User's Guide
Analyzing data

Examples
NumberOfRows([Query 1]) returns 10 if the "Query 1" data provider has 10 rows.
Related Information
DataProvider [page 658]
6.6.6.1.5.13 RefValueDate
Description
Returns the date of the reference data used for data tracking
Function Group
Data Provider
Syntax
date RefValueDate()
Examples
RefValueDate() returns 15 December 2008 if the reference date is 15 December 2008.
6.6.6.1.5.14 RefValueUserReponse
Description
Returns the response to a prompt when the reference data was the current data
SAP BusinessObjects Web Intelligence User's Guide
Analyzing data
P U B L I C 669
Function Group
Data Provider
Syntax
string RefValueUserResponse([dp;]prompt_string[;Index])
Input
Parameter Description Type Required
dp The data provider Data provider No
prompt_string The prompt text String Yes
Index Tells the function to return
the database primary keys of
the prompt values
Keyword No
Notes
● The function returns an empty string if data tracking is not activated.
● You must enclose the name of the data provider in square brackets.
● You can use the DataProvider function to provide a reference to a data provider.
● If you selected more than one value in answer to a prompt, the function returns a string consisting of a list
of values (or primary keys if the Index operator is specied) separated by semi-colons.
Examples
RefValueUserResponse( "Which city?" ) returns "Los Angeles" if you entered "Los Angeles" in the
"Which City?" prompt at the time when the reference data was the current data.
RefValueUserResponse([Sales Query];"Which city?") returns "Los Angeles," if you entered "Los
Angeles" in the "Which City?" prompt in the "Sales Query" data provider at the time when the reference data
was the current data.
670
P U B L I C
SAP BusinessObjects Web Intelligence User's Guide
Analyzing data

6.6.6.1.5.15 ServerValue
Description
Returns the database value of a measure
Function Group
Data Provider
Syntax
num ServerValue([measure])
Input
Parameter Description Type Required
measure Any measure Measure Yes
Notes
● ServerValue ignores all local lters applied to dimensions or hierarchies used to calculate the measure
Example
ServerValue([Internet Sales Amount] returns the database value of the measure [Internet Sales
Amount]
SAP BusinessObjects Web Intelligence User's Guide
Analyzing data
P U B L I C 671
6.6.6.1.5.16 UniverseName
Description
Returns the name of the universe on which a data provider is based
Function Group
Data Provider
Syntax
string UniverseName(dp)
Input
Parameter Description Type Required
dp The data provider Data provider Yes
Notes
● The value of dp in the formula is automatically updated if the name of the data provider changes. If the
data provider is renamed to "Q1", the formula becomes UniverseName([Q1]).
● You must enclose the name of the data provider in square brackets.
● You can use the DataProvider function to provide a reference to a data provider.
Examples
UniverseName([Query 1]) returns "eFashion" if the [Query 1] data provider is based on the eFashion
universe.
672
P U B L I C
SAP BusinessObjects Web Intelligence User's Guide
Analyzing data
Related Information
DataProvider [page 658]
6.6.6.1.5.17 UserResponse
Description
Returns the response to a prompt
Function Group
Data Provider
Syntax
string UserResponse([dp;]prompt_string[;Index])
Input
Parameter Description Type Required
dp The data provider Data provider No
prompt_string The prompt text String Yes
Index Tells the function to return
the database primary keys of
the prompt values
Keyword No
Notes
● You must enclose the name of the data provider in square brackets.
● You can use the DataProvider function to provide a reference to a data provider.
● If you select more than one value in answer to a prompt, the function returns a string consisting of a list of
values (or primary keys if the Index operator is specied) separated by semi-colons.
SAP BusinessObjects Web Intelligence User's Guide
Analyzing data
P U B L I C 673

Examples
UserResponse("Which city?") returns "Los Angeles if you entered "Los Angeles" in the "Which City?"
prompt.
UserResponse([Sales Query];"Which city?") returns "Los Angeles," if you entered "Los Angeles" in
the "Which City?" prompt in the "Sales Query" data provider.
UserResponse([Sales Query];"Which city?";Index) returns 23 if you entered "Los Angeles" in the
"Which City?" prompt in the "Sales Query" data provider, and the database primary key of Los Angeles is 23.
6.6.6.1.6 Document functions
6.6.6.1.6.1 DocumentAuthor
Description
Returns the InfoView logon of the document creator
Function Group
Document
Syntax
string DocumentAuthor()
Examples
DocumentAuthor() returns "gkn" if the document author's login is "gkn".
674
P U B L I C
SAP BusinessObjects Web Intelligence User's Guide
Analyzing data

6.6.6.1.6.2 DocumentCreationDate
Description
Returns the date on which a document was created
Function Group
Document
Syntax
date DocumentCreationDate()
Examples
DocumentCreationDate() returns 15 December 2008 if the document was created on 15 December 2008.
6.6.6.1.6.3 DocumentCreationTime
Description
Returns the time when a document was created
Function Group
Document
Syntax
time DocumentCreationTime()
SAP BusinessObjects Web Intelligence User's Guide
Analyzing data
P U B L I C 675

Examples
DocumentCreationTime() returns 11:15 if the document was created at 11:15.
6.6.6.1.6.4 DocumentDate
Description
Returns the date on which a document was last saved
Function Group
Document
Syntax
date DocumentDate()
Examples
DocumentDate() returns 8 August 2005 if the document was last saved on 8 August 2005.
6.6.6.1.6.5 DocumentName
Description
Returns the document name
Function Group
Document
676
P U B L I C
SAP BusinessObjects Web Intelligence User's Guide
Analyzing data

Syntax
string DocumentName()
Examples
DocumentName() returns "Sales Report" if the document is called "Sales Report".
6.6.6.1.6.6 DocumentOwner
Description
Returns the BI launch pad logon/user name of the owner of the document (the last person who saved the
document). (To return the original author/creator of the document, use the DocumentAuthor function.)
Function Group
Document
Syntax
string DocumentOwner()
Examples
DocumentOwner() returns "gkn" if the last person who saved the document has the user name or login "gkn".
6.6.6.1.6.7 DocumentPartiallyRefreshed
Description
Determines whether a document is partially refreshed
SAP BusinessObjects Web Intelligence User's Guide
Analyzing data
P U B L I C 677

Function Group
Document
Syntax
bool DocumentPartiallyRefreshed()
Notes
DocumentPartiallyRefreshed returns a boolean value that you can use in the If function.
Examples
DocumentPartiallyRefreshed() returns True if the document is partially refreshed.
6.6.6.1.6.8 DocumentTime
Description
Returns the time when a document was last saved
Function Group
Document
Syntax
time DocumentTime()
678
P U B L I C
SAP BusinessObjects Web Intelligence User's Guide
Analyzing data
Notes
The format of the returned time varies depending on the cell format.
Example
DocumentTime() returns 15:45 if the document was last saved at 15:45.
6.6.6.1.6.9 DrillFilters
Description
Returns the results of drill lters applied to a document or object in an declared report in drill mode. You can
declare a dierent report within the document. If you do not declare a report, the current active report is used.
Function Group
Document
Syntax
string DrillFilters([obj|separator[;report]])
Input
Parameter Description Type Required
obj A report object Report object
Either obj or separator
required
separator The drill lter separator String
Either obj or separator
required
report Optional. The name of the
report you want to use. It
must be in the document. If
String
Either obj or separator
required
SAP BusinessObjects Web Intelligence User's Guide
Analyzing data
P U B L I C 679

Parameter Description Type Required
no report is declared, then
the current report is used.
Notes
● You can insert DrillFilters directly without the need to enter the formula manually by inserting a
DrillFilters cell.
● If you do not specify an object, the function returns all drill lters applied to the document.
Examples
DrillFilters() returns "US" if the document has a drill lter restricting the [Country] object to US.
DrillFilters() returns "US - 1999" if the document has a lter restricting [Country] to "US" and [Year] to
1999.
DrillFilters("/") returns "US / 1999" if the document has lters restricting [Country] to "US" and [Year]
to 1999.
DrillFilters ([Quarter]) returns "Q3" if the document has a drill lter restricting [Quarter] to "Q3".
6.6.6.1.6.10 PromptSummary
Description
Returns the prompt text and user response of all prompts in a document
Function Group
Document
Syntax
string PromptSummary([sorting_order];[show_definitive_prompts])
680
P U B L I C
SAP BusinessObjects Web Intelligence User's Guide
Analyzing data
Input
Parameter Type Description Required
sorting_order Pre-Dened Sorting order of the function
output
No (default value = ascend
ing)
show_denitive_prompts Boolean Show BW dentive prompts
in the function output
No (default value = false)
Notes
● Possible values for the sorting_order parameter are: default, ascending or descending
● If the sorting_order is not used in the function, then the data source order is used
● If the show_definitive_prompts parameter is not used, the BW Denitive prompts are hidden in the
function output
Example
Example output of the PromptSummary function appears as follows:
Enter Quantity Sold: 5000
Enter value(s) for State (optional): California, Texas, Utah
Enter Customer (optional):
6.6.6.1.6.11 QuerySummary
Description
Returns information about the queries in a document
Function Group
Document
SAP BusinessObjects Web Intelligence User's Guide
Analyzing data
P U B L I C 681
Syntax
string QuerySummary([dp])
string QuerySummary([dp];[StatusOfData])
Input
Parameter Description Type Required
dp A data provider Data provider No
StatusOfData BW Status of data Boolean No
Notes
● You must enclose the name of the data provider in square brackets.
● The BW status of data indicates the last refresh date of the BW info provider, and appears as the last line
returned by the function.
Examples
QuerySummary() returns information about all the queries in a document.
QuerySummary([Query 1]) returns information about the queries based on the [Query 1] data provider.
Output example:
Query 1:
Universe: eFashion
Last execution time: 1s
NB of rows: 34500
Result objects: State, Year, Sales Revenue
Scope of analysis: State, City, Year, Quarter,
Month
Filters:
(State inlist{"US";"France";}
And (Sales Revenue Greater Than 1000000
Or Sales Revenue Less Than 10000))
Query 2:
Source file: D:\Data\datacar.xls
Result objects: State, Year, Sales Revenue
682
P U B L I C
SAP BusinessObjects Web Intelligence User's Guide
Analyzing data

6.6.6.1.6.12 ReportFilter
Description
Returns the report lters applied to an object
Function Group
Document
Syntax
string ReportFilter(obj)
Input
Parameter Description Type Required
obj A report object Report object Yes
Examples
ReportFilter([Country]) returns "US" if there is a report lter on the Country object that restricts it to
"US".
6.6.6.1.6.13 ReportFilterSummary
Description
Returns a summary of the report lters in a document or report
SAP BusinessObjects Web Intelligence User's Guide
Analyzing data
P U B L I C 683

Function Group
Document
Syntax
string ReportFilterSummary(report_name)
Input
Parameter Description Type Required
report_name The name of the report String No
Notes
If report_name is omitted, ReportFilterSummary returns a summary of all the report lters in all the
reports in the document.
Examples
ReportFilterSummary() returns information about all the report lters in a document.
ReportFilterSummary("Report1") returns information about the report lters in the "Report1" report.
Example output of the ReportFilterSummary function appears as follows:
Filters on Report1:
(Sales Revenue Greater Than 1000000
Or (Sales Revenue Less Than 3000))
Filters on Section on City:
(City InList{"Los Angeles";"San Diego";})
Ranking Filter:
(Top 10 & Bottom 10 [Customer] Based on [Sales
Revenue] (Count))
684
P U B L I C
SAP BusinessObjects Web Intelligence User's Guide
Analyzing data

6.6.6.1.7 Logical functions
6.6.6.1.7.1 Even
Description
Determines whether a number is even
Function Group
Logical
Syntax
bool Even(number)
Input
Parameter Description Type Required
number Any number Number Yes
Notes
● Even returns a boolean value that you can use in the If function.
● If you place Even directly into a column, it returns an integer (1=true; 0=false). You can format this integer
using a Boolean number format.
● Even returns True for every even integer, and False for every decimal number.
Examples
Even(4) returns True.
Even(3) returns False.
Even(23.2) returns False.
SAP BusinessObjects Web Intelligence User's Guide
Analyzing data
P U B L I C 685

Even(-4) returns True.
Even(-2.2) returns False.
6.6.6.1.7.2 IsDate
Description
Determines whether a value is a date
Function Group
Logical
Syntax
bool IsDate(obj)
Input
Parameter Description Type Required
obj Any report object Report object Yes
Notes
● IsDate returns a boolean value that you can use in the If function.
● If you place IsDate directly into a column, it returns an integer (1=true; 0=false). You can format this
integer using a Boolean number format.
Examples
IsDate([Reservation Date]) returns True if [Reservation Date] is a date.
Or one of the following to return "Date" if [Reservation Date] is a date:
686
P U B L I C
SAP BusinessObjects Web Intelligence User's Guide
Analyzing data

● If(IsDate([Reservation Date])) Then "Date" Else "Not a date"
● If IsDate([Reservation Date]) Then "Date" Else "Not a date"
Related Information
If...Then...Else [page 753]
6.6.6.1.7.3 IsError
Description
Determines whether an object returns an error
Function Group
Logical
Syntax
bool IsError(obj)
Input
Parameter Description Type Required
obj Any report object Report object Yes
Notes
● IsError returns a boolean value that you can use in the If function.
● If you place IsError directly into a column, it returns an integer (1=true; 0=false). You can format this
integer using a Boolean number format.
SAP BusinessObjects Web Intelligence User's Guide
Analyzing data
P U B L I C 687

Examples
IsError([Revenue]) returns False if the [Revenue] variable does not return an error.
IsError([Average Guests]) returns True if the [Average Guests] variable returns a division by zero
(#DIV/0) error.
If IsError([Average Guests]) Then "Error" Else "No error" returns "Error" if the [Average
Guests] variable returns a division by zero (#DIV/0) error.
Related Information
If...Then...Else [page 753]
6.6.6.1.7.4 IsLogical
Description
Determines whether a value is boolean
Function Group
Logical
Syntax
bool IsLogical(obj)
Input
Parameter
Description Type Required
obj Any report object Report object Yes
688 P U B L I C
SAP BusinessObjects Web Intelligence User's Guide
Analyzing data

Notes
● IsLogical returns a boolean value that you can use in the If function.
● If you place IsLogical directly into a column, it returns an integer (1=true; 0=false). You can format this
integer using a Boolean number format.
Examples
IsLogical(IsString([Country])) returns True.
IsLogical([Country]) returns False if country returns any data type other than boolean.
If IsLogical(IsDate([Country])) Then "Boolean" Else "Not boolean" returns "Boolean".
Related Information
If...Then...Else [page 753]
6.6.6.1.7.5 IsNull
Description
Determines whether a value is null
Function Group
Logical
Syntax
bool IsNull(obj)
SAP BusinessObjects Web Intelligence User's Guide
Analyzing data
P U B L I C 689

Input
Parameter Description Type Required
obj Any report object Report object Yes
Notes
● IsNull returns a boolean value that you can use in the If function.
● If you place IsNull directly into a column, it returns an integer (1=true; 0=false). You can format this
integer using a Boolean number format.
Examples
IsNull([Revenue]) returns False if the [Revenue] variable is not null.
IsNull([Average Guests]) returns True if the [Average Guests] variable is null.
Related Information
If...Then...Else [page 753]
6.6.6.1.7.6 IsNumber
Description
Determines whether a value is a number
Function Group
Logical
690
P U B L I C
SAP BusinessObjects Web Intelligence User's Guide
Analyzing data

Syntax
bool IsNumber(obj)
Input
Parameter Description Type Required
obj Any report object Report object Yes
Notes
● IsNumber returns a boolean value that you can use in the If function.
● If you place IsNumber directly into a column, it returns an integer (1=true; 0=false). You can format this
integer using a Boolean number format.
Examples
IsNumber([Revenue]) returns True if the [Revenue] variable is a number.
IsNumber([Customer Name]) returns False if the [Customer Name] variable is not a number.
If IsNumber([Customer Name]) Then "Number" Else "Not a number" returns "Not a number" if
the [Customer Name] variable is not a number.
Related Information
If...Then...Else [page 753]
6.6.6.1.7.7 IsString
Description
Determines whether a value is a string
SAP BusinessObjects Web Intelligence User's Guide
Analyzing data
P U B L I C 691

Function Group
Logical
Syntax
bool IsString(obj)
Input
Parameter Description Type Required
obj Any report object Report object Yes
Notes
● IsString returns a boolean value that you can use in the If function.
● If you place IsString directly into a column, it returns an integer (1=true; 0=false). You can format this
integer using a Boolean number format.
Examples
IsString([Revenue]) returns false if the [Revenue] variable is not a string.
IsString([Customer Name]) returns true if the [Customer Name] variable is a string.
If IsString([Customer Name]) Then "String" Else "Not a string" returns "String" if the
[Customer Name] variable is a string.
Related Information
If...Then...Else [page 753]
692
P U B L I C
SAP BusinessObjects Web Intelligence User's Guide
Analyzing data

6.6.6.1.7.8 IsTime
Description
Determines whether a variable is a time variable
Function Group
Logical
Syntax
bool IsTime(obj)
Input
Parameter Description Type Required
obj Any report object Report object Yes
Notes
● IsTime returns a boolean value that you can use in the If function.
● If you place IsTime directly into a column, it returns an integer (1=true; 0=false). You can format this
integer using a Boolean number format.
Examples
IsTime([Reservation Time]) returns true if the [Reservation Time] variable is a time variable.
IsTime([Average Guests]) returns false if the [Average Guests] variable is not a time variable.
If IsTime([Average Guests]) Then "Time" Else "Not time" returns "Not time" if the [Average
Guests] variable is not a time variable.
SAP BusinessObjects Web Intelligence User's Guide
Analyzing data
P U B L I C 693

Related Information
If...Then...Else [page 753]
6.6.6.1.7.9 Odd
Description
Determines whether a number is odd
Function Group
Logical
Syntax
bool Odd(number)
Input
Parameter Description Type Required
number Any number Number Yes
Notes
● Odd returns a boolean value that you can use in the If function.
● If you place Odd directly into a column, it returns an integer (1=true; 0=false). You can format this integer
using a Boolean number format.
● Odd returns True for every decimal number, and False for every even integer.
694
P U B L I C
SAP BusinessObjects Web Intelligence User's Guide
Analyzing data

Examples
Odd(5) returns True.
Odd(4) returns False.
Odd(23.2) returns True.
Odd(24.2) returns True.
Odd(-23.2) returns True.
Odd(-24.2) returns True.
Related Information
If...Then...Else [page 753]
6.6.6.1.8 Numeric functions
6.6.6.1.8.1 Abs
Description
Returns the absolute value of a number
Function Group
Numeric
Syntax
num Abs(number)
SAP BusinessObjects Web Intelligence User's Guide
Analyzing data
P U B L I C 695

Input
Parameter Description Type Required
number Any number Number Yes
Examples
Abs(25) returns 25.
Abs(-11) returns 11.
6.6.6.1.8.2 Ceil
Description
Returns a number rounded up to the nearest integer
Function Group
Numeric
Syntax
num Ceil(number)
Input
Parameter
Description Type Required
number Any number Number Yes
696 P UB L I C
SAP BusinessObjects Web Intelligence User's Guide
Analyzing data

Examples
Ceil(2.4) returns 3.
Ceil(3.1) returns 4.
Ceil(-3.1) returns -3.
6.6.6.1.8.3 Cos
Description
Returns the cosine of an angle
Function Group
Numeric
Syntax
num Cos(angle)
Input
Parameter Description Type Required
angle An angle in radians Number Yes
Example
Cos(180) returns -0.6.
SAP BusinessObjects Web Intelligence User's Guide
Analyzing data
P U B L I C 697
6.6.6.1.8.4 EuroConvertFrom
Description
Converts a Euro amount to another currency
Function Group
Numeric
Syntax
num EuroConvertFrom(euro_amount;curr_code;round_level)
Input
Parameter Description Type Required
euro_amount The amount in Euros Number Yes
curr_code The ISO code of the target
currency
String Yes
round_level The number of decimal
places to which the result is
rounded
Number Yes
Notes
The currency code must be the code of one of the 12 EU currencies whose values were xed in relation to the
Euro prior to their abolition in January 2002. If it is not, the function returns #ERROR. The currencies are:
BEF
Belgian franc
DEM German mark
GRD Greek drachma
ESP Spanish peseta
FRF French franc
698 P U B L I C
SAP BusinessObjects Web Intelligence User's Guide
Analyzing data

IEP Irish punt
ITL Italian lira
LUF Luxembourg franc
NLG Dutch guilder
ATS Austrian schilling
PTS Portuguese escudo
FIM Finnish mark
Examples
EuroConvertFrom(1000;"FRF";2) returns 6559.57.
EuroConvertFrom(1000;"FRF";1) returns 6559.60.
EuroConvertFrom(1000.04;"DEM";2) returns 1955.83.
EuroConvertFrom(1000.04;"DEM";1) returns 1955.80.
Related Information
Rounding and truncating numbers [page 791]
6.6.6.1.8.5 EuroConvertTo
Description
Converts an amount to Euros
Function Group
Numeric
Syntax
num EuroConvertTo(noneuro_amount;curr_code;round_level)
SAP BusinessObjects Web Intelligence User's Guide
Analyzing data
P U B L I C 699

Input
Parameter Description Type Required
euro_amount The amount in the non-euro
currency
Number Yes
curr_code The ISO code of the non-
euro currency
String Yes
round_level The number of decimal
places to which the result is
rounded
Number Yes
Example
EuroConvertTo(6559;"FRF";2) returns 999.91.
EuroConvertTo(6559;"FRF";1) returns 999.90.
EuroConvertTo(1955;"DEM";2) returns 999.58.
EuroConvertTo(1955;"DEM";1) returns 999.60.
Note
The currency code must be the code of one of the 12 EU currencies whose values were xed in relation to the
Euro prior to their abolition in January 2002. If it is not, the function returns #ERROR. The currencies are:
BEF
Belgian franc
DEM German mark
GRD Greek drachma
ESP Spanish peseta
FRF French franc
IEP Irish punt
ITL Italian lira
LUF Luxembourg franc
NLG Dutch guilder
ATS Austrian schilling
PTS Portuguese escudo
FIM Finnish mark
700 P U B L I C
SAP BusinessObjects Web Intelligence User's Guide
Analyzing data
Related Information
Rounding and truncating numbers [page 791]
6.6.6.1.8.6 EuroFromRoundError
Description
Returns the rounding error in a conversion from Euros
Function Group
Numeric
Syntax
num EuroFromRoundError(euro_amount;curr_code;round_level)
Input
Parameter Description Type Required
euro_amount The amount in Euros Number Yes
curr_code The ISO code of the target
currency
String Yes
round_level The number of decimal
places to which the result is
rounded
Number Yes
Output
The rounding error in the calculation
SAP BusinessObjects Web Intelligence User's Guide
Analyzing data
P U B L I C 701

Examples
EuroFromRoundError(1000;"FRF";2) returns 0. (There is no dierence between the unrounded
conversion and the conversion rounded to 2 decimal places.)
EuroFromRoundError(1000;"FRF";1) returns 0.03. (The unrounded conversion is 6559.57. The conversion
rounded to 1 decimal place is 6559.60. The rounding error is 0.03.)
EuroFromRoundError(1000;"DEM";2) returns 0. (There is no dierence between the unrounded
conversion and the conversion rounded to 2 decimal places.)
EuroFromRoundError(1000;"DEM";1) returns -0.01. (The unrounded conversion is 1955.83. The
conversion rounded to 1 decimal place is 1995.80. The rounding error is -0.03.)
Note
The currency code must be the code of one of the 12 EU currencies whose values were xed in relation to the
Euro prior to their abolition in January 2002. If it is not, the function returns #ERROR. The currencies are:
BEF
Belgian franc
DEM German mark
GRD Greek drachma
ESP Spanish peseta
FRF French franc
IEP Irish punt
ITL Italian lira
LUF Luxembourg franc
NLG Dutch guilder
ATS Austrian schilling
PTS Portuguese escudo
FIM Finnish mark
Related Information
Rounding and truncating numbers [page 791]
702
P U B L I C
SAP BusinessObjects Web Intelligence User's Guide
Analyzing data
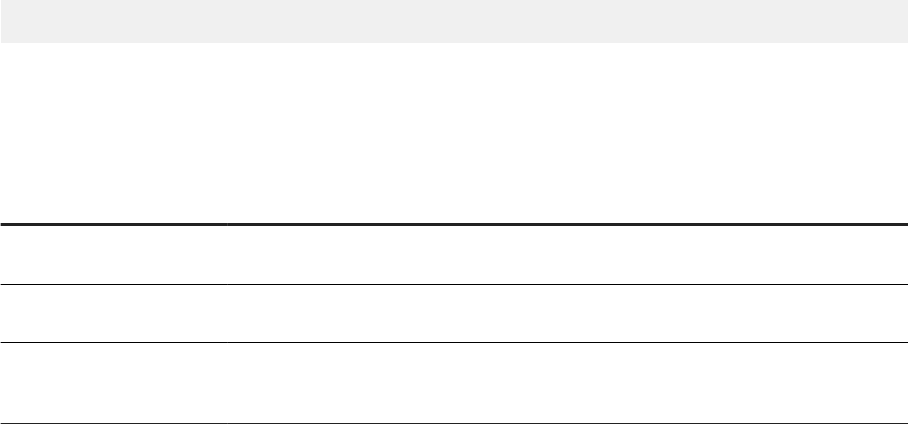
6.6.6.1.8.7 EuroToRoundError
Description
Returns the rounding error in a conversion to Euros
Function Group
Numeric
Syntax
num EuroToRoundError(noneuro_amount;curr_code;round_level)
Input
Parameter Description Type Required
euro_amount The amount in the non-euro
currency
Number Yes
curr_code The ISO code of the non-
euro currency
String Yes
round_level The number of decimal
places to which the result is
rounded
Number Yes
Examples
EuroToRoundError(6559;"FRF";2) returns 0. (There is no dierence between the unrounded conversion
and the conversion rounded to 2 decimal places.)
EuroToRoundError(6559;"FRF";1) returns -0.01. (The unrounded conversion is 999.91. The conversion
rounded to 1 decimal place is 999.90. The rounding error is -0.01.)
EuroToRoundError(1955;"DEM";2) returns 0. (There is no dierence between the unrounded conversion
and the conversion rounded to 2 decimal places.)
EuroToRoundError(1955;"DEM";1) returns 0.02. (The unrounded conversion is 999.58. The conversion
rounded to 1 decimal place is 999.60. The rounding error is 0.02.)
SAP BusinessObjects Web Intelligence User's Guide
Analyzing data
P U B L I C 703

Note
The currency code must be the code of one of the 12 EU currencies whose values were xed in relation to the
Euro prior to their abolition in January 2002. If it is not, the function returns #ERROR. The currencies are:
BEF
Belgian franc
DEM German mark
GRD Greek drachma
ESP Spanish peseta
FRF French franc
IEP Irish punt
ITL Italian lira
LUF Luxembourg franc
NLG Dutch guilder
ATS Austrian schilling
PTS Portuguese escudo
FIM Finnish mark
Related Information
Rounding and truncating numbers [page 791]
6.6.6.1.8.8 Exp
Description
Returns an exponential (e raised to a power)
Function Group
Numeric
704
P U B L I C
SAP BusinessObjects Web Intelligence User's Guide
Analyzing data

Syntax
num Exp(power)
Input
Parameter Description Type Required
power The power Number Yes
Notes
An exponential is the constant e (2.718...) raised to a power.
Examples
Exp(2.2) returns 9.03.
6.6.6.1.8.9 Fact
Description
Returns the factorial of a number
Function Group
Numeric
Syntax
int Fact(number)
SAP BusinessObjects Web Intelligence User's Guide
Analyzing data
P U B L I C 705

Input
Parameter Description Type Required
number Any number Number Yes
Notes
The factorial of number is the product of all the integers from 1 to number.
Examples
Fact(4) returns 24.
Fact(5.9) returns 120.
6.6.6.1.8.10 Floor
Description
Returns a number rounded down to the nearest integer
Function Group
Numeric
Syntax
int Floor(number)
706
P U B L I C
SAP BusinessObjects Web Intelligence User's Guide
Analyzing data

Input
Parameter Description Type Required
number Any number Number Yes
Example
Floor(24.4) returns 24.
6.6.6.1.8.11 Ln
Description
Returns the natural logarithm of a number
Function Group
Numeric
Syntax
num Ln(number)
Input
Parameter Description Type Required
number Any number Number Yes
Examples
Ln(10) returns 2.3
SAP BusinessObjects Web Intelligence User's Guide
Analyzing data
P U B L I C 707
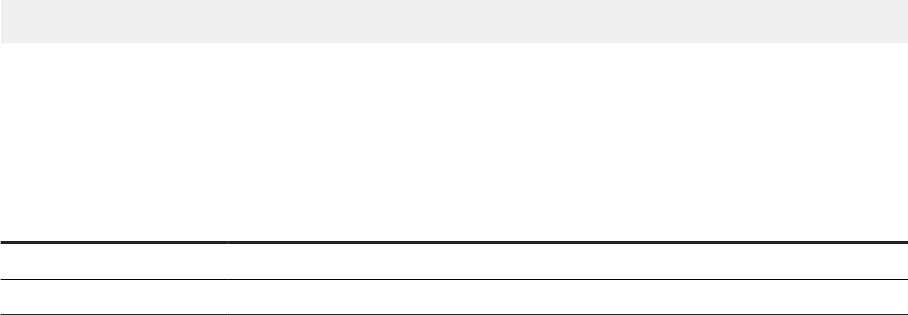
6.6.6.1.8.12 Log
Description
Returns the logarithm of a number in a specied base
Function Group
Numeric
Syntax
num Log(number;base)
Input
Parameter Description Type Required
number Any number Number Yes
base The base of the logarithm Number Yes
Examples
Log(125;5) returns 3.
6.6.6.1.8.13 Log10
Description
Returns the base 10 logarithm of a number
708
P U B L I C
SAP BusinessObjects Web Intelligence User's Guide
Analyzing data

Function Group
Numeric
Syntax
num Log10(number)
Input
Parameter Description Type Required
number Any number Number Yes
Examples
Log10(100) returns 2.
6.6.6.1.8.14 Mod
Description
Returns the remainder from the division of two numbers
Function Group
Numeric
Syntax
num Mod(dividend;divisor)
SAP BusinessObjects Web Intelligence User's Guide
Analyzing data
P U B L I C 709

Input
Parameter Description Type Required
dividend The dividend Number Yes
divisor The divisor Number Yes
Examples
Mod(10;4) returns 2.
Mod (10.2;4.2) returns 1.8.
6.6.6.1.8.15 Power
Description
Returns a number raised to a power
Function Group
Numeric
Syntax
num Power(number;power)
Input
Parameter
Description Type Required
number The number to raise to a
power
Number Yes
power The power Number Yes
710 P UB L I C
SAP BusinessObjects Web Intelligence User's Guide
Analyzing data
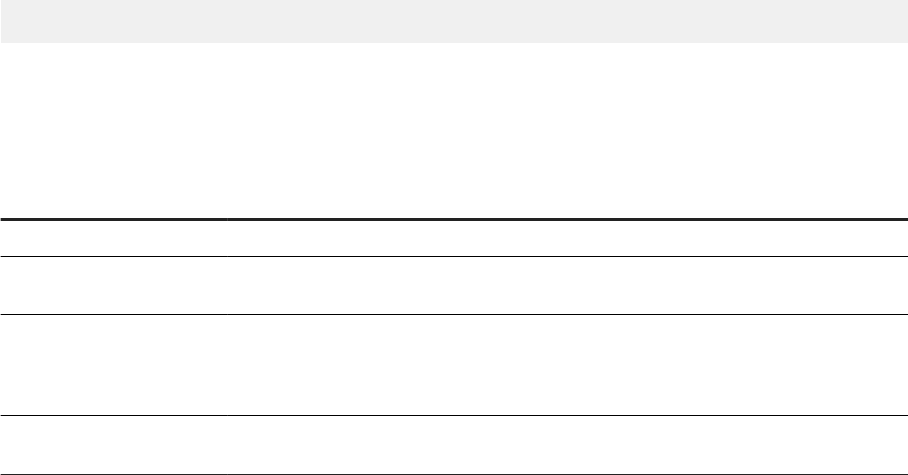
Example
Power(10;2) returns 100.
6.6.6.1.8.16 Rank
Description
Ranks a measure by dimensions
Function Group
Numeric
Syntax
int Rank(measure;[ranking_dims][;Top|Bottom][;(reset_dims)])
Input
Parameter Description Type Required
measure The measure to be ranked Measure Yes
ranking_dims The dimensions used to rank
the measure
Dimension list No
Top|Bottom Sets the ranking order:
● Top - descending
● Bottom - ascending
Keyword
No (Top is default)
reset_dims The dimensions that reset
the ranking
Dimension list No
Notes
● The function uses the default calculation context to calculate the ranking if you do not specify ranking
dimensions.
SAP BusinessObjects Web Intelligence User's Guide
Analyzing data
P U B L I C 711

● You must always place dimensions in parentheses even if there is only one dimension in the list of ranking
or reset dimensions.
● When you specify a set of ranking or reset dimensions you must separate them with semi-colons.
● By default the ranking is reset over a section or block break.
Examples
In the following table the rank is given by Rank([Revenue];([Country])):
Country
Revenue Rank
France 835,420 2
US 2,451,104 1
In the following table the rank is given by Rank([Revenue];([Country]);Bottom). The Bottom argument
means that the measures are ranked in descending order.
Country
Revenue Rank
France 835,420 1
US 2,451,104 2
In the following table the rank is given by Rank([Revenue];([Country];[Resort])):
Country
Resort Revenue Rank
France French Riviera 835,420 3
US Bahamas Beach 971,444 2
US Hawaiian Club 1,479,660 1
In the following table the rank is given by Rank([Revenue];([Country];[Year]);([Country])). The
rank is reset on the Country dimension.
Country
Year Revenue Rank
France FY1998 295,940 1
France FY1999 280,310 2
France FY2000 259,170 3
US FY1998 767,614 3
US FY1999 826,930 2
US FY2000 856,560 1
712 P U B L I C
SAP BusinessObjects Web Intelligence User's Guide
Analyzing data
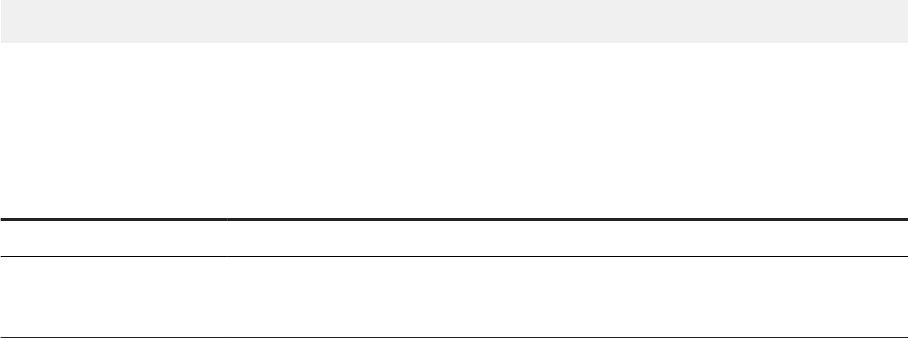
Related Information
Bottom/Top operators [page 774]
6.6.6.1.8.17 Round
Description
Rounds a number
Function Group
Numeric
Syntax
num Round (number;round_level)
Input
Parameter Description Type Required
number The number to be rounded Number Yes
round_level The number of decimal
places to which the number
is rounded
Number Yes
Examples
Round(9.44;1) returns 9.4.
Round(9.45;1) returns 9.5.
Round(9.45;0) returns 9.
Round(9.45;-1) returns 10.
Round(4.45;-1) returns 0.
SAP BusinessObjects Web Intelligence User's Guide
Analyzing data
P U B L I C 713

Related Information
Rounding and truncating numbers [page 791]
6.6.6.1.8.18 Sign
Description
Returns the sign of a number
Function Group
Numeric
Syntax
int Sign(number)
Input
Parameter Description Type Required
number Any number Number Yes
Notes
Sign returns -1 if number is negative, 0 if number is zero and 1 if number is positive.
Examples
Sign(3) returns 1.
Sign(-27.5) returns -1.
714
P U B L I C
SAP BusinessObjects Web Intelligence User's Guide
Analyzing data

6.6.6.1.8.19 Sin
Description
Returns the sine of an angle.
Function Group
Numeric
Syntax
num Sin(angle)
Input
Parameter Description Type Required
angle An angle in radians Number Yes
Example
Sin(234542) can return, depending on the decimal point setting, -0.116992 or -0.12.
6.6.6.1.8.20 Sqrt
Description
Returns the square root of a number
Function Group
Numeric
SAP BusinessObjects Web Intelligence User's Guide
Analyzing data
P U B L I C 715

Syntax
num Sqrt(number)
Input
Parameter Description Type Required
number Any number Number Yes
Example
Sqrt(25) returns 5.
6.6.6.1.8.21 Tan
Description
Returns the tangent of an angle
Function Group
Numeric
Syntax
num Tan(angle)
716
P U B L I C
SAP BusinessObjects Web Intelligence User's Guide
Analyzing data

Input
Parameter Description Type Required
angle An angle in radians Number Yes
Examples
Tan(90) returns -2.
6.6.6.1.8.22 ToDecimal
Description
Returns a decimal.
Function Group
Numeric
Syntax
num ToDecimal(number|string)
Input
Parameter
Description Type Required
number|string A number or a string that
can be interpreted as a
number
Number or string Yes
SAP BusinessObjects Web Intelligence User's Guide
Analyzing data
P U B L I C 717

Notes
If string is not a number, ToDecimal returns #ERROR.
Examples
ToDecimal("1234567890.1234567890") returns 1234567890.1234567890.
ToDecimal("1234567890.12345") returns 1234567890.12345.
ToDecimal("abcdefijkl") returns #ERROR.
6.6.6.1.8.23 ToNumber
Description
Returns a string as a number
Function Group
Numeric
Syntax
num ToNumber(string)
or
Input
Parameter
Description Type Required
string A number as a string String Yes
718 P U B L I C
SAP BusinessObjects Web Intelligence User's Guide
Analyzing data
Notes
If string is not a number or a datetime, ToNumber returns #ERROR.
Examples
ToNumber("45") returns 45.
6.6.6.1.8.24 Truncate
Description
Truncates a number
Function Group
Numeric
Syntax
num Truncate(number;truncate_level)
Input
Parameter
Description Type Required
number The number to be rounded Number Yes
truncate_level The number of decimal
places to which the number
is truncated
Number Yes
SAP BusinessObjects Web Intelligence User's Guide
Analyzing data
P U B L I C 719

Notes
Example
Truncate(3.423;2) returns 3.42.
Related Information
Rounding and truncating numbers [page 791]
6.6.6.1.9 Set functions
6.6.6.1.9.1 Ancestor
Description
Returns an ancestor member of a member
Function Group
Set
Syntax
member Ancestor(member;level|distance)
Input
Parameter
Description Type Required
member Any member member Yes
level The level of the ancestor level
Either level or distance
is required
720 P U B L I C
SAP BusinessObjects Web Intelligence User's Guide
Analyzing data
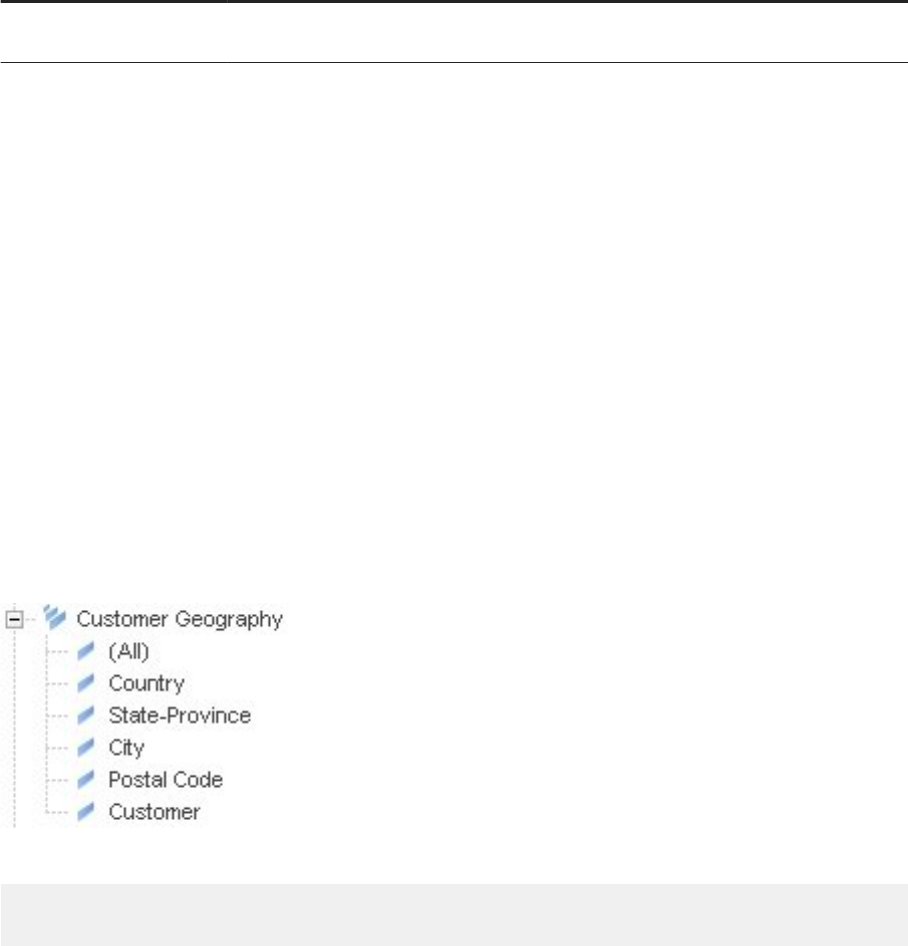
Parameter Description Type Required
distance The distance of the ancestor
level from the current level
int
Either level or distance
is required
Notes
● Ancestor is not used as a standalone function. It is used in the input parameter in aggregate functions
that species the member set for aggregation.
● member is the current member of a hierarchy. When the hierarchy is not in the context of the block, the
formula returns an empty value.
● distance must be positive.
Examples
The following examples are all taken from an English language data source.
Based on the following geography hierarchy, you want to know the Internet Sales Amount impact of each
customer independant of the customer's city.
Firstly, for each City, you want the Internet Sales Amount value for its Country:
=Sum([Query 2].[Internet Sales].[Internet Sales Amount];{Ancestor([Customer
Geography];[Customer Geography].[City])})
SAP BusinessObjects Web Intelligence User's Guide
Analyzing data
P U B L I C 721
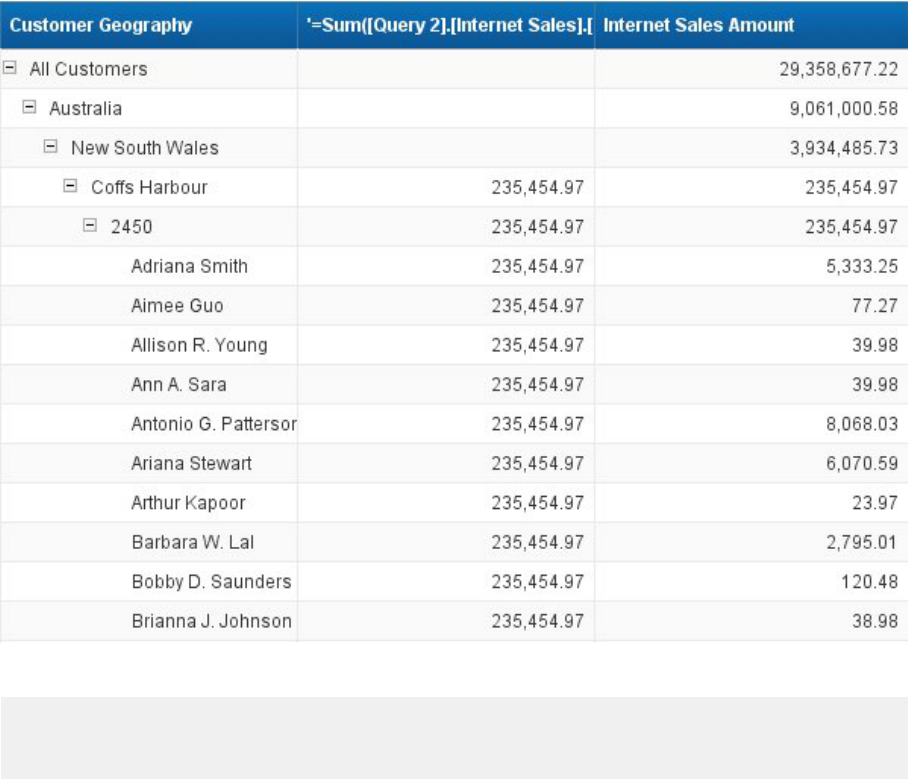
Then you calculate the contribution of each City in the country's global Internet Sales amount :
=[Query 2].[Internet Sales].[Internet Sales Amount] / Sum([Query 2].[Internet
Sales].[Internet Sales Amount];{Ancestor([Customer Geography];[Customer
Geography].[City])})
722
P U B L I C
SAP BusinessObjects Web Intelligence User's Guide
Analyzing data
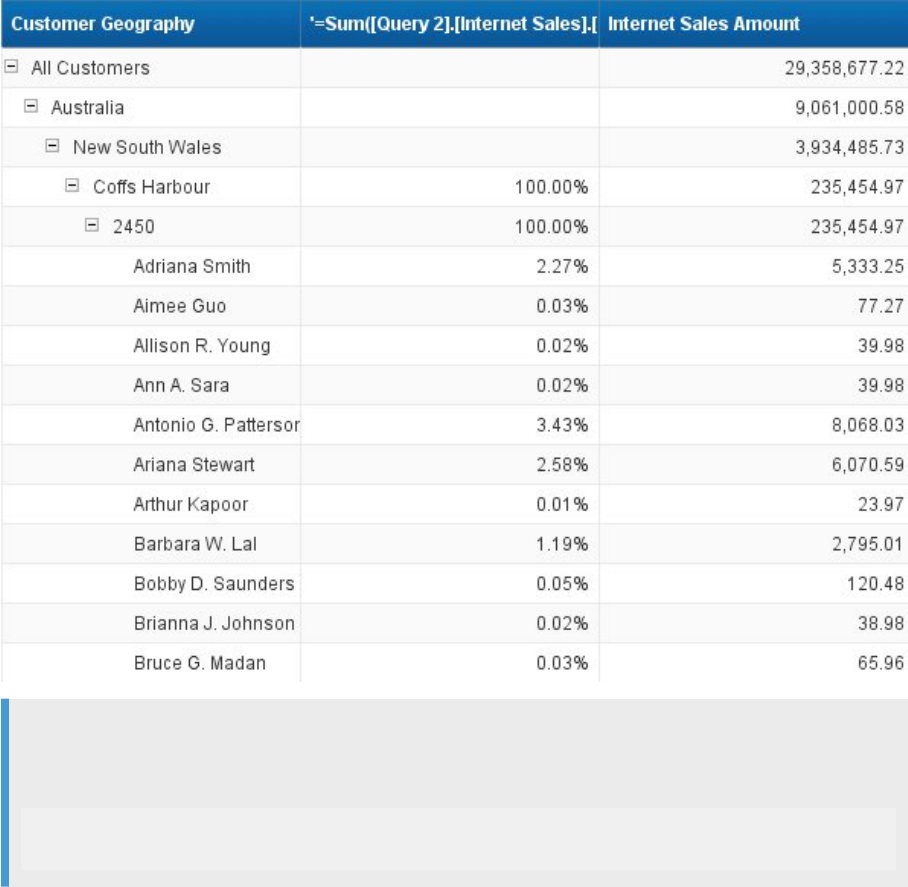
Note
When using BICS connections to SAPBW providers, you need to specify an oset level instead of naming
the level:
=[Query 2].[Internet Sales].[Internet Sales Amount] / Sum([Query 2].[Internet
Sales].[Internet Sales Amount];{Ancestor([Customer Geography];2)})
In this case you will have results also for State Province and Country.
Related Information
Aggregate [page 575]
Average [page 582]
Count [page 583]
Max [page 589]
Min [page 591]
Sum [page 611]
SAP BusinessObjects Web Intelligence User's Guide
Analyzing data
P U B L I C 723

6.6.6.1.9.2 Children
Description
Returns the child members of a hierarchy member within an aggregate function.
Function Group
Set
Syntax
member_set member.Children
Input
Parameter Description Type Required
member Any member member Yes
Notes
● Children is not used as a standalone function. It is used in the input parameter in aggregate functions
that species the member set for aggregation.
● member is the current member of a hierarchy. When the hierarchy is not in the context of the block, the
formula returns an empty value.
Examples
[Geography].[US].[California].Children returns [Los Angeles], [San Francisco], [San Diego].
[Geography].Children returns [Los Angeles], [San Francisco], [San Diego] if [California] is the current
member in the [Geography] hierarchy.
724
P U B L I C
SAP BusinessObjects Web Intelligence User's Guide
Analyzing data

Related Information
Aggregate [page 575]
Average [page 582]
Count [page 583]
Max [page 589]
Min [page 591]
Sum [page 611]
6.6.6.1.9.3 Depth
Description
Returns the depth of a member in a hierarchy
Function Group
Set
Syntax
int member.Depth
Input
Parameter Description Type Required
member Any member member Yes
Notes
● The depth is the distance of the member from top level of the hierarchy.
● The top level of the hierarchy is level 0.
● member is the current member of a hierarchy. When the hierarchy is not in the context of the block, the
formula returns an empty value.
SAP BusinessObjects Web Intelligence User's Guide
Analyzing data
P U B L I C 725
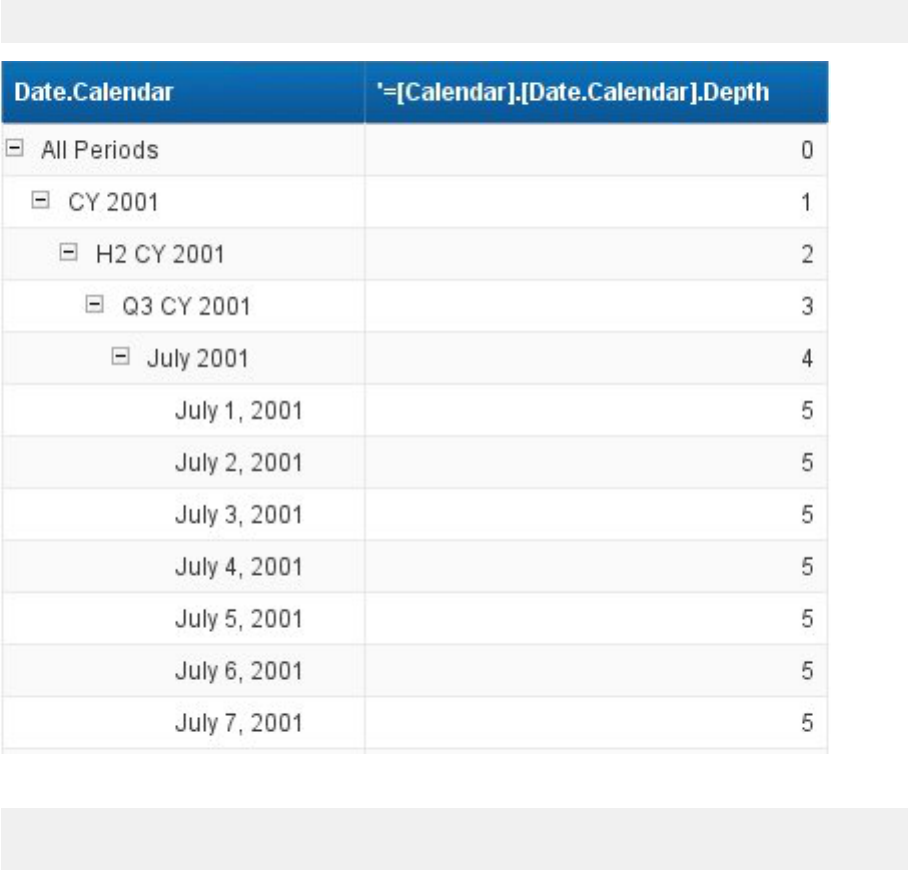
Examples
You want to know the depth of hierarchy members:
=[Calendar].[Date.Calendar].Depth
Now combine with the Children functions to check if you have all days listed every month:
=If [Calendar].[Date.Calendar].Depth = 4 Then Count([Internet Sales].[Internet
Sales Amount];{[Calendar].[Date.Calendar].Children()})
726
P U B L I C
SAP BusinessObjects Web Intelligence User's Guide
Analyzing data
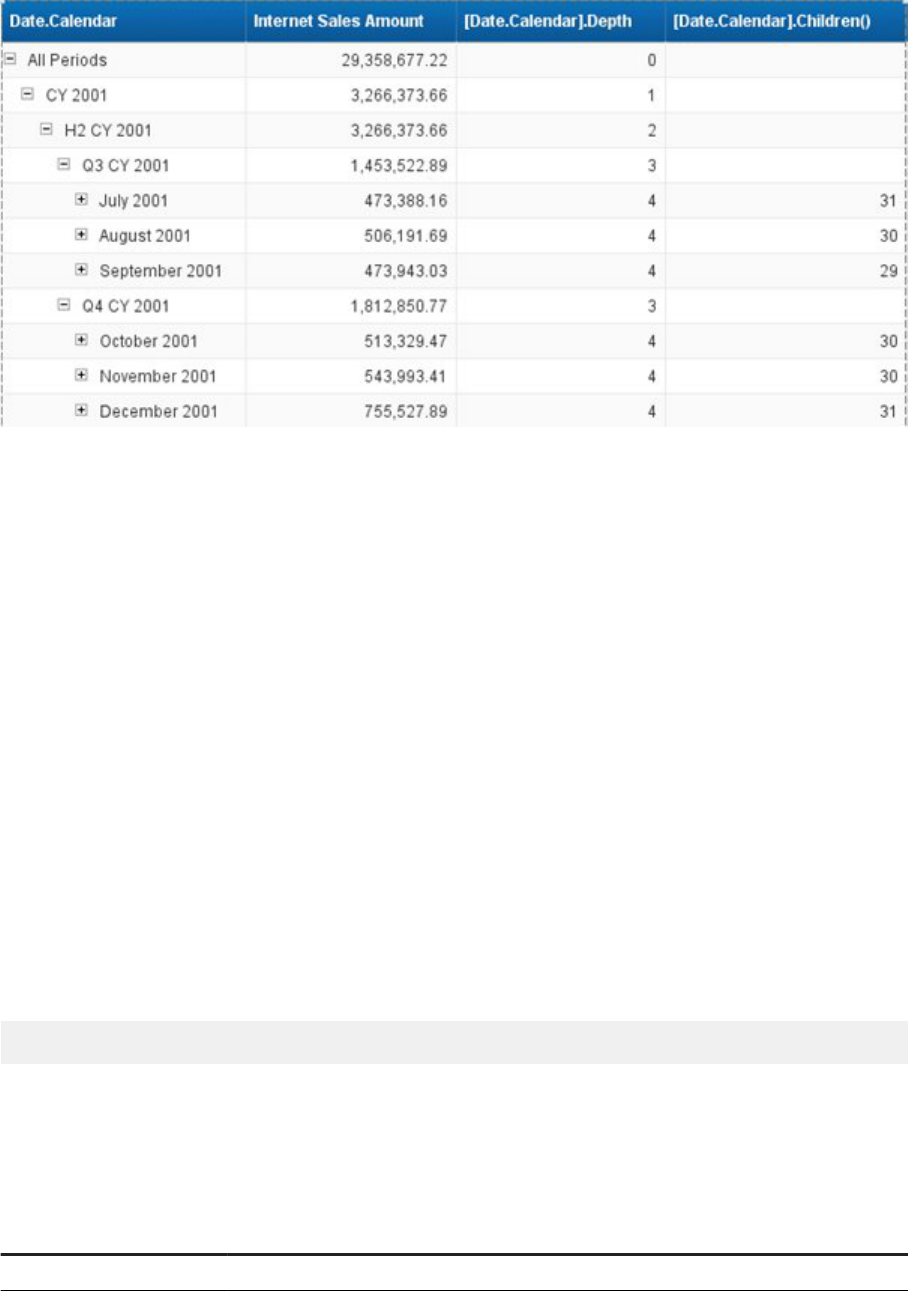
6.6.6.1.9.4 Descendants
Description
Returns descendants of a hierarchy member within an aggregation function.
Function Group
Set
Syntax
member_set Descendants(member[;level|distance][;desc_flag])
Input
Parameter
Description Type Required
member Any member member Yes
SAP BusinessObjects Web Intelligence User's Guide
Analyzing data
P U B L I C 727

Parameter Description Type Required
level The level of the descendants level
No (the level of member is
the default)
distance The distance of the
descendant level from the
current level
int
No (the level of member is
the default)
desc_ag Determines which
descendant members are
returned
keyword
No (default is Self)
Notes
● Descendants is not used as a standalone function. It is used in the input parameter in aggregate functions
that species the member set for aggregation.
● member is the current member of a hierarchy. When the hierarchy is not in the context of the block, the
formula returns an empty value.
● Self in desc_flag refers to the level specied by the level|distance parameter.
● Before in desc_flag refers to all levels above the level specied by the level|distance parameter.
● After in desc_flag refers to all levels below the level specied by the level|distance parameter.
● The values of desc_flag are as follows:
Self
Returns the descendants at the level specied by the
level|distance parameter, including the current
member if it is at this level.
Before Returns the current member and all descendants above
the level specied by the
level|distance parameter.
After Returns the descendants below the level specied by the
level|distance parameter.
Self_Before Returns the current member and all descendants above
and including the level specied by the
level|
distance parameter.
Self_After Returns the current member and all descendants at and
below the level specied by the
level|distance
parameter.
Before_After Returns the current member and all descendants except
those at the level specied by the
level|distance
parameter.
Self_Before_After Returns the current member and all descendants.
Leaves Returns all members between the current member and
the level specied by the
level|distance parameter
that do not have child members.
● distance must be positive.
728
P U B L I C
SAP BusinessObjects Web Intelligence User's Guide
Analyzing data
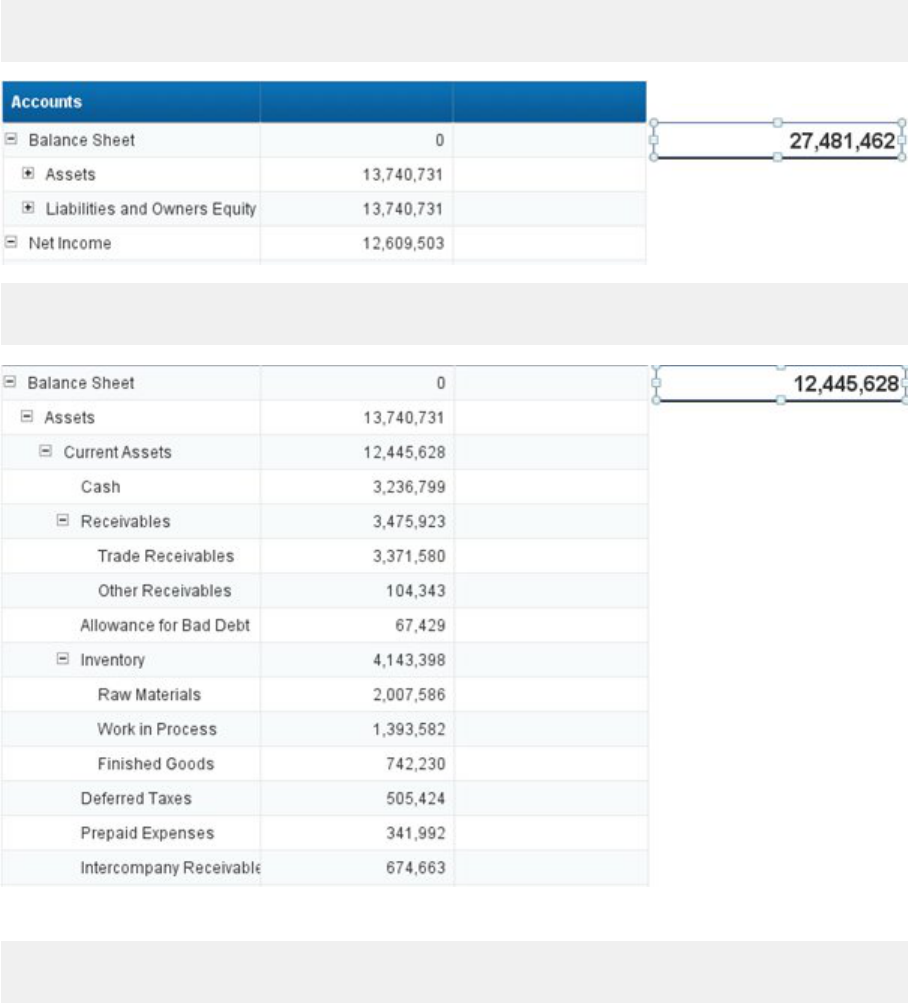
Example
You have a nancial hierarchy, some of the nodes are not always cumulative ones, but you want to sum their
descendants. In this example, you will get the sum of descendants of each Balance Sheet member, only 1 level
below:
=Sum([Query 3 (1)].[Financial Reporting].[Amount];
{Descendants([Accounts]&[Balance Sheet];1)})
=Sum([Query 3 (1)].[Financial Reporting].[Amount];
{Descendants([Accounts]&[Balance Sheet].[Assets].[Current Assets];1;Leaves)})
Now you want to sum all members below Current Assets :
=Sum([Query 3 (1)].[Financial Reporting].[Amount];
{Descendants([Accounts]&[Balance Sheet].[Assets].[Current Assets];0;After)})
SAP BusinessObjects Web Intelligence User's Guide
Analyzing data
P U B L I C 729
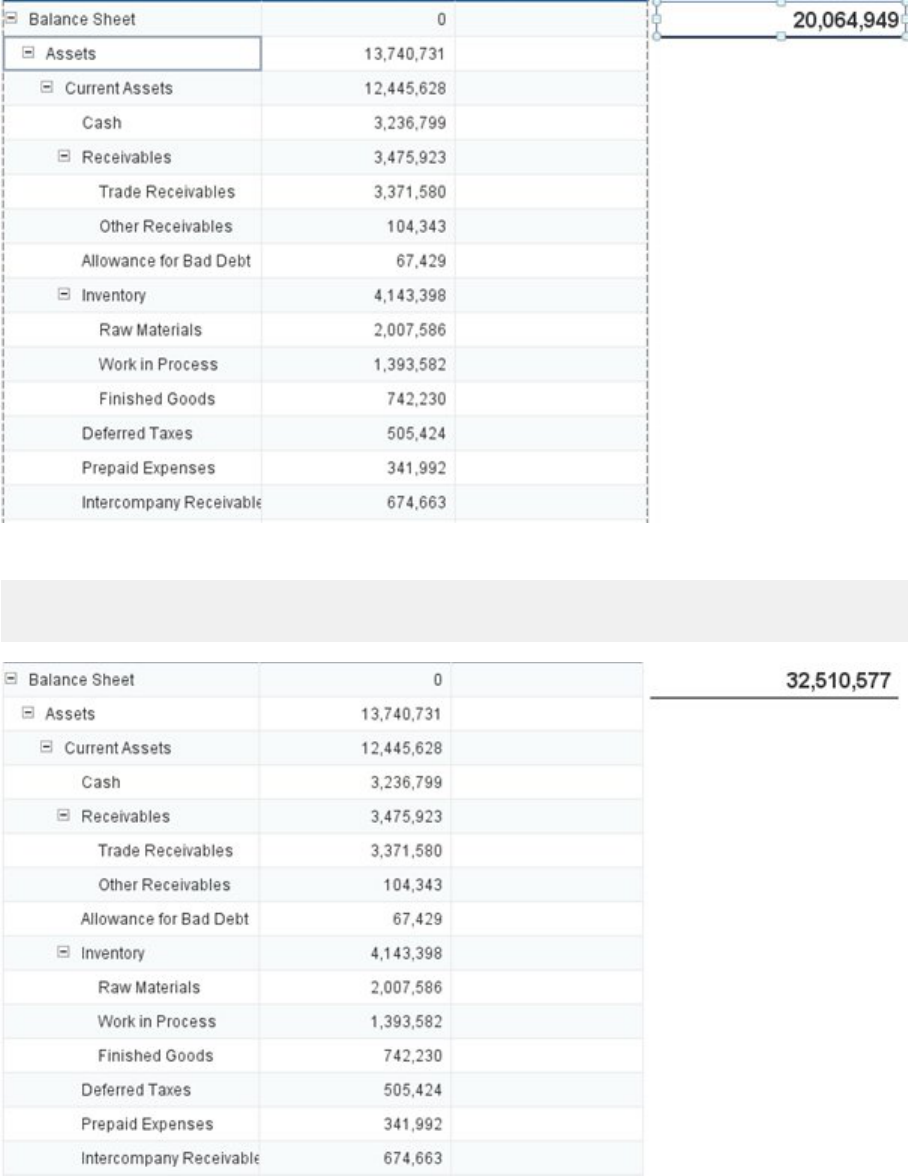
Now add Current Assets itself :
=Sum([Query 3 (1)].[Financial Reporting].[Amount];
{Descendants([Accounts]&[Balance Sheet].[Assets].[Current Assets];0;Self_After)})
730
P U B L I C
SAP BusinessObjects Web Intelligence User's Guide
Analyzing data

Related Information
Aggregate [page 575]
Average [page 582]
Count [page 583]
Max [page 589]
Min [page 591]
Sum [page 611]
6.6.6.1.9.5 IsLeaf
Description
Determines whether a member is a leaf member
Function Group
Misc
Syntax
bool member.IsLeaf
Input
Parameter Description Type Required
member Any member member Yes
Notes
● A leaf member is a member that does not have any child members.
● member is the current member of a hierarchy. When the hierarchy is not in the context of the block, the
formula returns an empty value.
SAP BusinessObjects Web Intelligence User's Guide
Analyzing data
P U B L I C 731
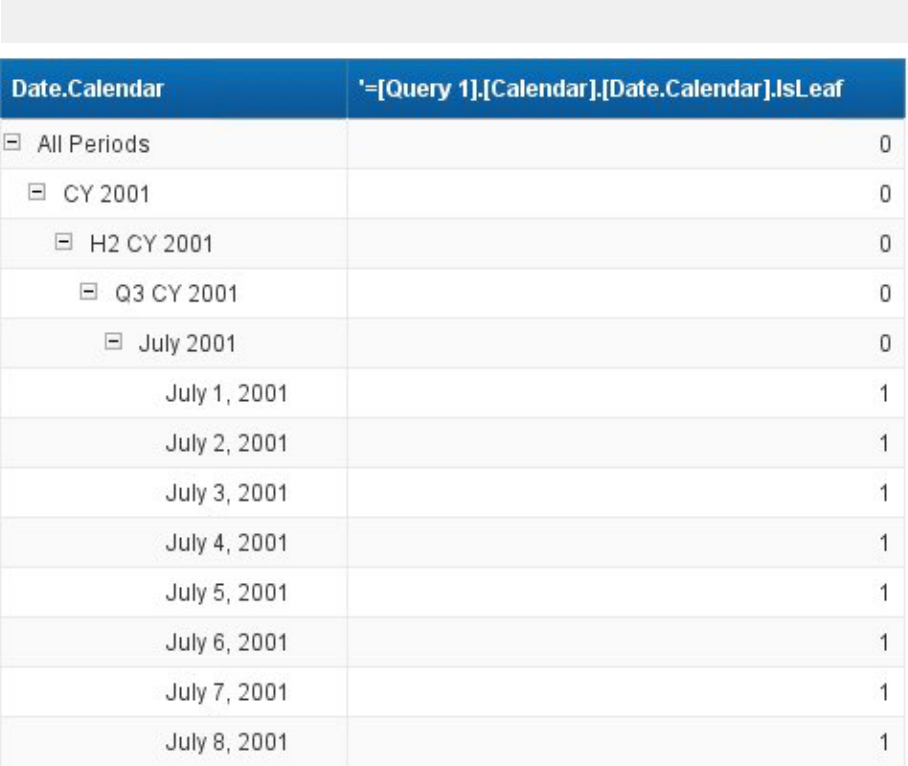
Examples
You want to know if the line is a day:
=[Calendar].[Date.Calendar].IsLeaf()
6.6.6.1.9.6 Key
Description
Returns the key of a member
Syntax
string member.Key
732
P U B L I C
SAP BusinessObjects Web Intelligence User's Guide
Analyzing data

Function Group
Set
Input
Parameter
Description Type Required
member Any member member Yes
Notes
● The key is the internal identier of a member.
● member is the current member of a hierarchy. When the hierarchy is not in the context of the block, the
formula returns an empty value.
Example
[Geography].[US].Key returns "XYZ" if the key of the [US] member is "XYZ".
6.6.6.1.9.7 Lag
Description
Returns a member at the same level as the current member and a given distance after it, within an aggregate
function.
Syntax
member member.Lag(distance)
SAP BusinessObjects Web Intelligence User's Guide
Analyzing data
P U B L I C 733
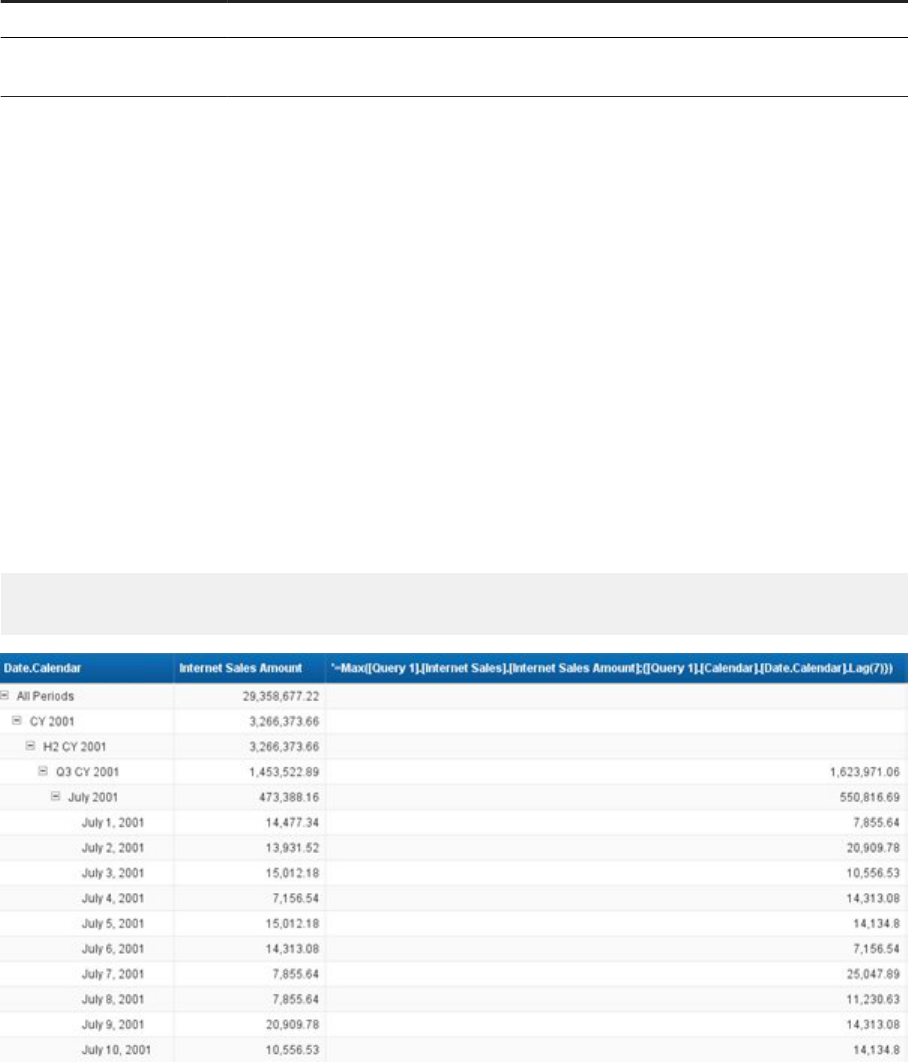
Function Group
Set
Input
Parameter Description Type Required
member Any member member Yes
distance The distance of the member
from the current member
int Yes
Notes
● Lag is not used as a standalone function. It is used in the input parameter in aggregate functions that
species the member set for aggregation.
● If distance is positive, Lag returns the member distance places after member. If distance is negative,
Lag returns the member distance places before member.
● member is the current member of a hierarchy. When the hierarchy is not in the context of the block, the
formula returns an empty value.
● Lag uses the member order in the hierarchy and query to return the related member.
Examples
You want to get the dierences in internet sales from week to week.
=Max([Internet Sales].[Internet Sales Amount];{[Calendar].
[Date.Calendar].Lag(7)})
734
P U B L I C
SAP BusinessObjects Web Intelligence User's Guide
Analyzing data
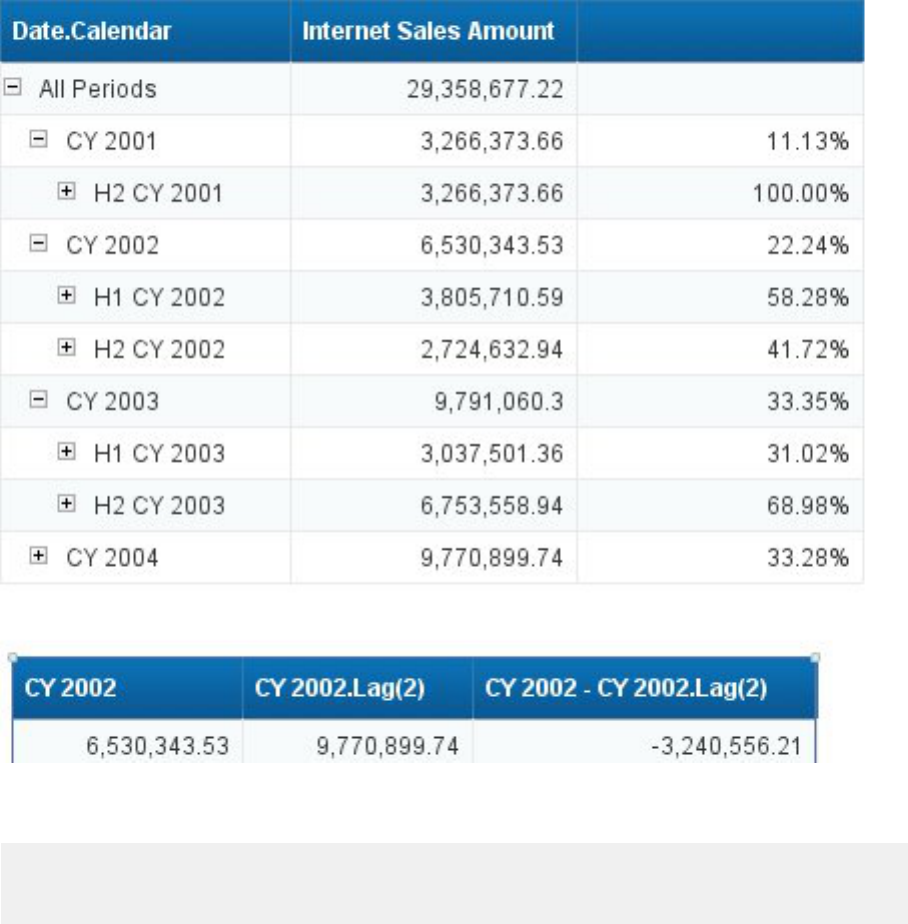
Or you want to compare a specic year to another year two years previously:
Now you want to combine Lag and IsLeaf to know over a one week period the dierence for the amount sold.
The formula set in the last column will be :
=If [Calendar].[Date.Calendar].IsLeaf() Then [Internet Sales].[Internet Sales
Amount] - Max([Internet Sales].[Internet Sales Amount];{[Calendar].
[Date.Calendar].Lag(7)})
SAP BusinessObjects Web Intelligence User's Guide
Analyzing data
P U B L I C 735
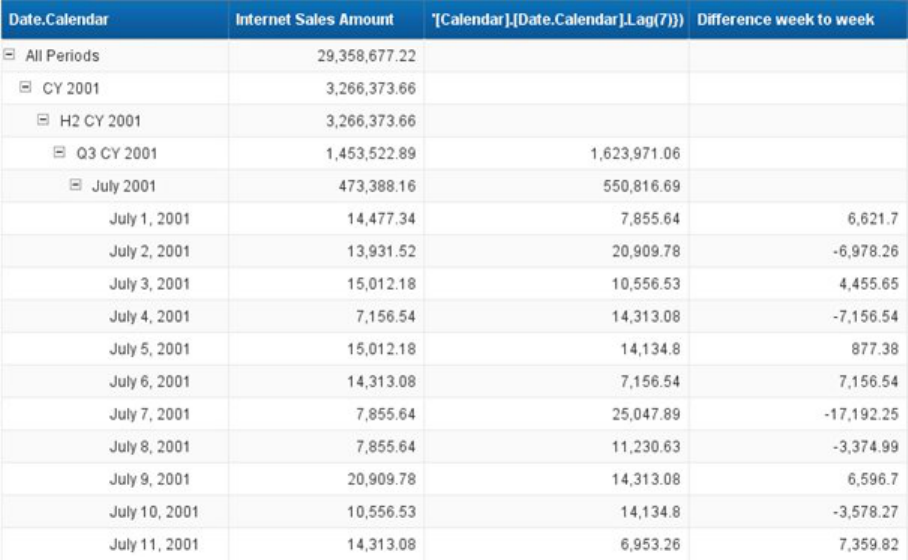
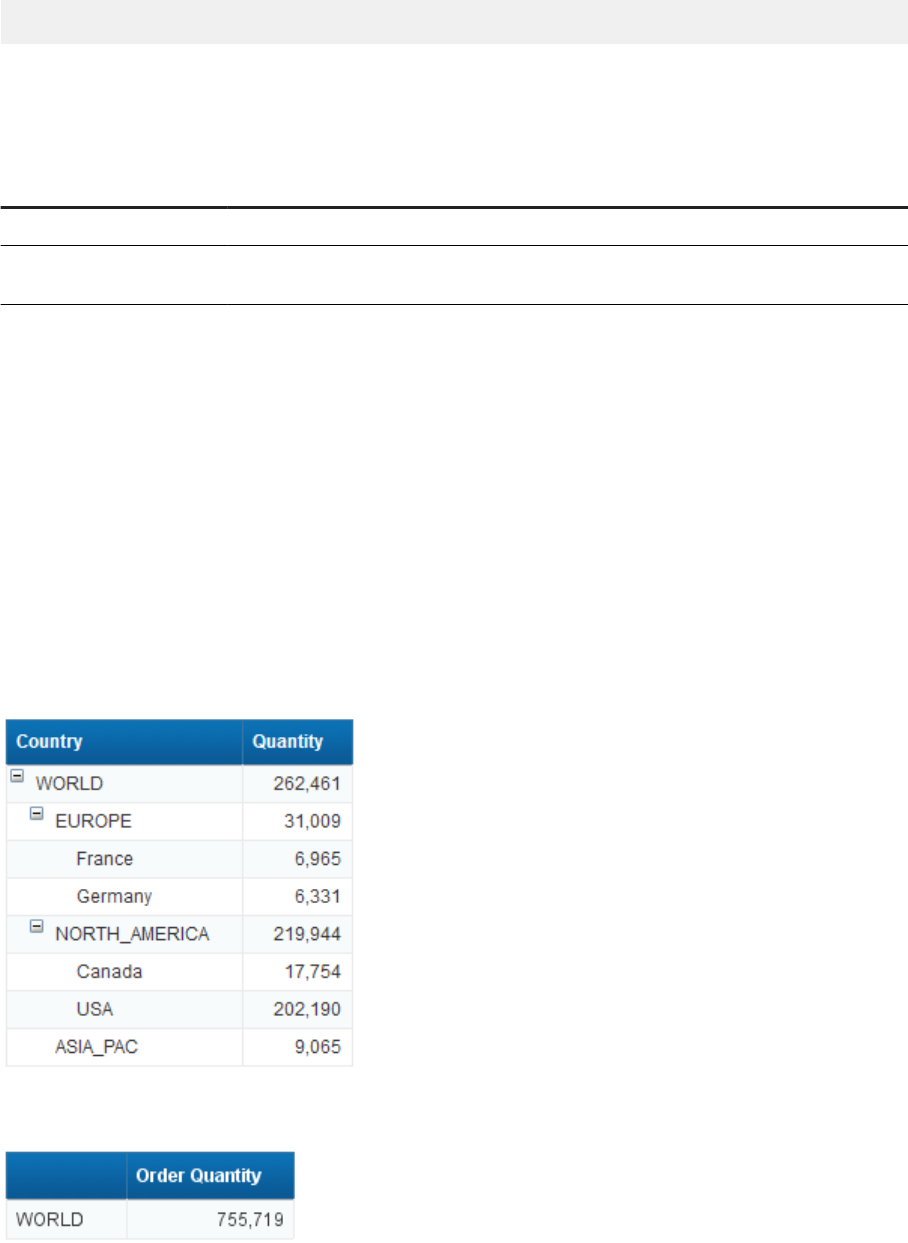
Syntax
string MemberAtDepth(hierarchy;depth)
Input
Parameter
Description Type Required
hierarchy
Hierarchical object dimension Yes
depth
The level of the member set
in the chosen hierarchy
int Yes
Notes
● depth must be positive or zero, else the function will return an error
● When there is no member at the given depth, then MemberAtDepth() returns Null
● When the input object is not a hierarchy, then MemberAtDepth() returns Null for any depth greater than
zero
Examples
The following [Country] hierarchy has been ltered to keep only two children of the EUROPE node.
MemberAtDepth([Country];0) returns:
SAP BusinessObjects Web Intelligence User's Guide
Analyzing data
P U B L I C 737
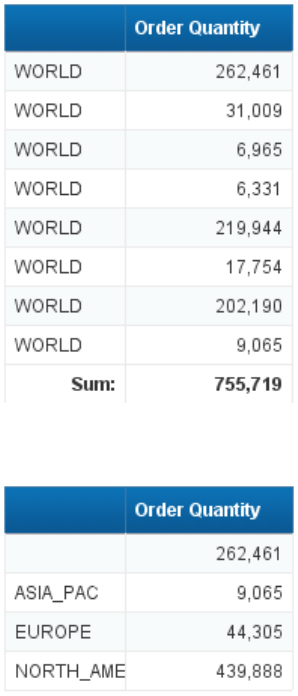
“WORLD” is the root and the only value at level 0.
If the Avoid duplicate row aggregation option is disabled, then the function aggregates all the members' values
since they all stem from the "WORLD" root. If you want to check all the aggregated values, enable the Avoid
duplicate row aggregation option. The hierarchy would then look like this:
MemberAtDepth([Country];1) returns:
The rst row contains a NULL value because the root has no values at level 1.
738
P U B L I C
SAP BusinessObjects Web Intelligence User's Guide
Analyzing data
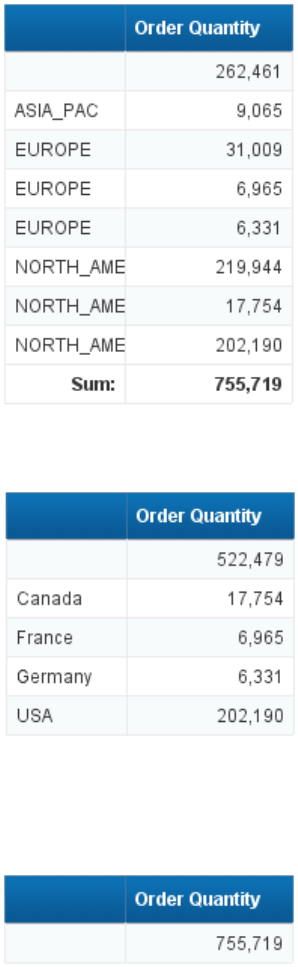
On other rows, the function aggregates all the members' values of the [Country] hierarchy at level 1:
“ASIA_PAC”, “EUROPE” and “NORTH_AMERICA”. If you want to check all the aggregated values, enable the
Avoid duplicate row aggregation option. The hierarchy would then look like this:
MemberAtDepth([Country];2) returns:
Again, the rst row aggregates all the members that have no values at level 2, that is, the root and each node.
On other rows, all the members' values of the [Country] hierarchy at level 2 are aggregated.
MemberAtDepth([Country];3) returns:
There is only one row left, with a NULL value, since the hierarchy has no third level. Therefore, all nodes and
leaves' values of the hierarchy are aggregated.
SAP BusinessObjects Web Intelligence User's Guide
Analyzing data
P U B L I C 739
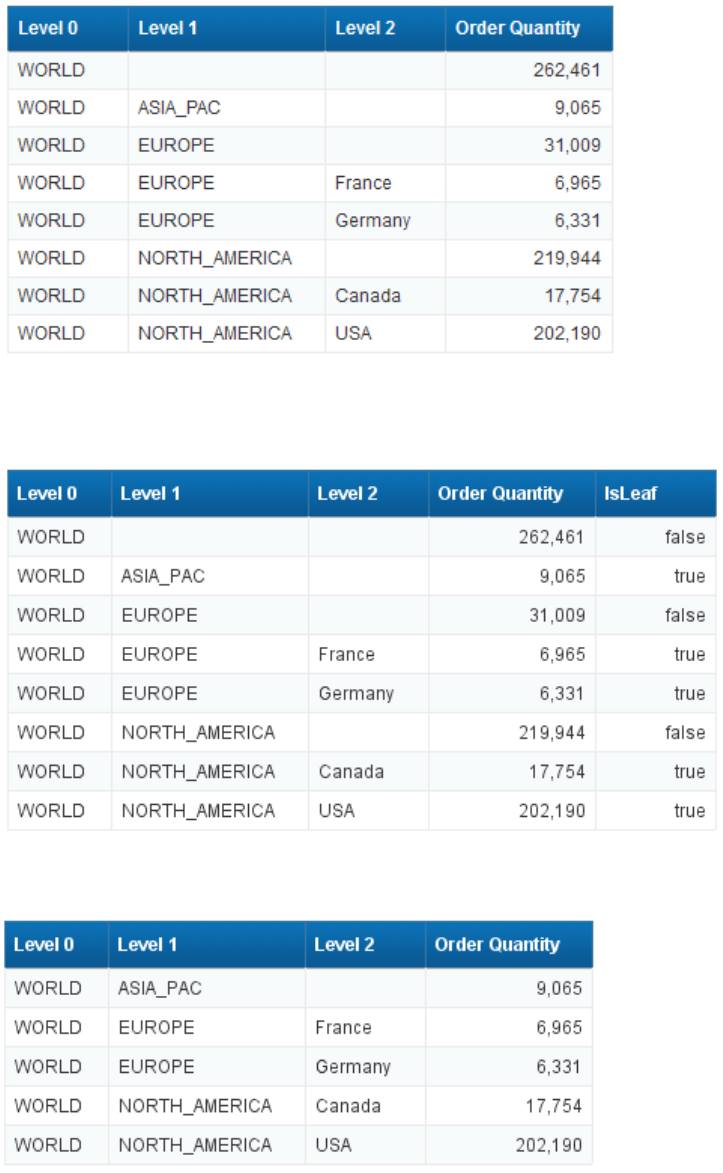
If you want to visualize the whole hierarchy, add columns containing the levels of the hierarchy in the existing
table, then use the function and give it dierent level values. It would then look like this:
You can use the IsLeaf formula to lter the hierarchy leaves in the above table: For more information on the
IsLeaf formula, see IsLeaf [page 731]
Once it's done, you can hide the IsLeaf column to get the equivalent of a attened hierarchy table:
740
P U B L I C
SAP BusinessObjects Web Intelligence User's Guide
Analyzing data

6.6.6.1.9.9 Parent
Description
Returns the parent member of a hierarchy member within an aggregate function.
Function Group
Set
Syntax
member member.Parent
Input
Parameter Description Type Required
member Any member member Yes
Notes
● Parent is not used as a standalone function. It is used in the input parameter in aggregate functions that
species the member set for aggregation.
● member is the current member of a hierarchy. When the hierarchy is not in the context of the block, the
formula returns an empty value.
Examples
The second column contains the formula that allow yous to obtain the Parent of each hierarchy member:
=Max([Customer Geography];{[Customer Geography].Parent})
SAP BusinessObjects Web Intelligence User's Guide
Analyzing data
P U B L I C 741
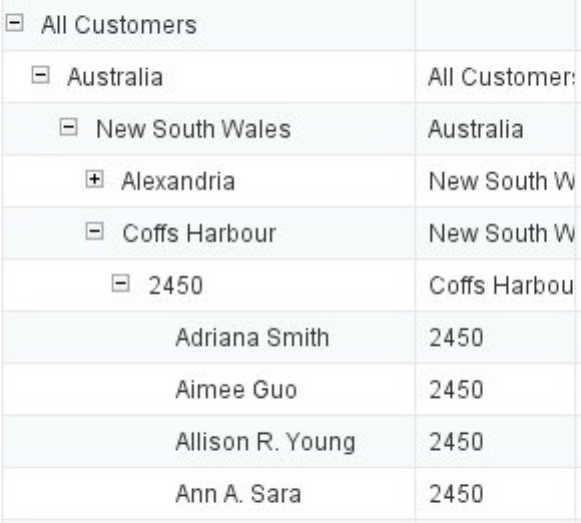
Related Information
Aggregate [page 575]
Average [page 582]
Count [page 583]
Max [page 589]
Min [page 591]
Sum [page 611]
6.6.6.1.9.10 Siblings
Description
Returns the member and sibling members of the hierarchy member within an aggregate function.
Function Group
Set
742
P U B L I C
SAP BusinessObjects Web Intelligence User's Guide
Analyzing data
Syntax
member_set member.Siblings
Input
Parameter
Description Type Required
member Any member member Yes
Notes
● Siblings is not used as a standalone function. It is used in the input parameter in aggregate functions
that species the member set for aggregation.
● member is the current member of a hierarchy. When the hierarchy is not in the context of the block, the
formula returns an empty value.
● Sibling members are members from the same level and with the same parent as member.
Examples
You have a time hierarchy and want to know the percentage of each Quarter within a year or the percentage of
each year within the period.
=[Query 1].[Internet Sales].[Internet Sales Amount] / Sum([Query 1].[Internet
Sales].[Internet Sales Amount];{[Query 1].[Calendar].[Date.Calendar].Siblings()})
SAP BusinessObjects Web Intelligence User's Guide
Analyzing data
P U B L I C 743
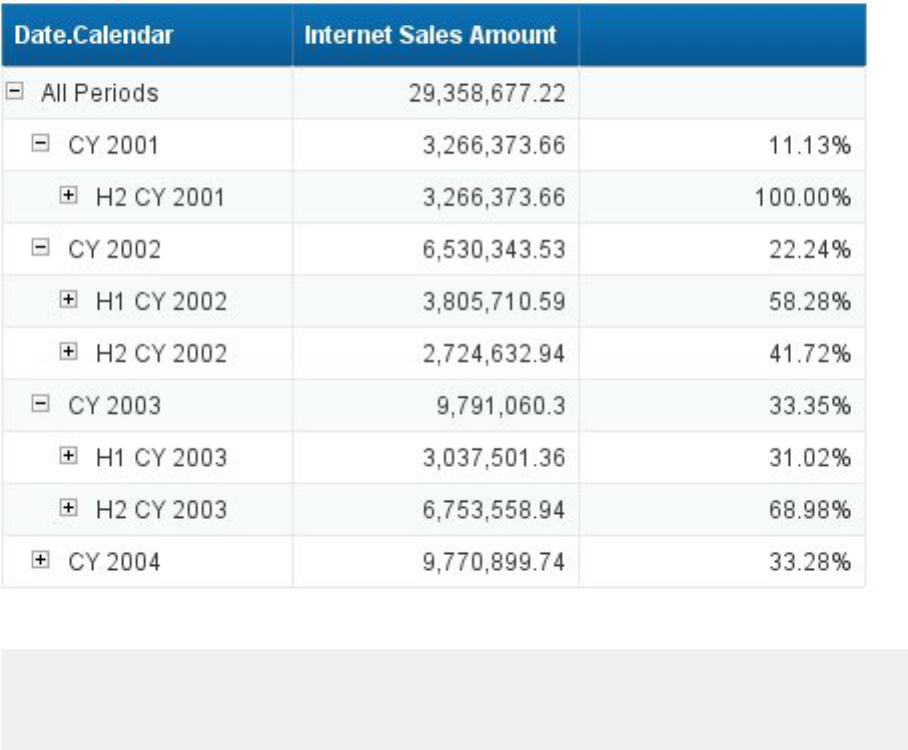
In a free form cell you want to know the contribution of Year 2004 in the overall period :
=Sum([Query 1].[Internet Sales].[Internet Sales Amount];{[Query 1].[Calendar].
[Date.Calendar]&[All Periods].[CY 2004]}) / Sum([Query 1].[Internet Sales].
[Internet Sales Amount];{[Query 1].[Calendar].[Date.Calendar]&[All Periods].[CY
2004].Siblings()})
744
P U B L I C
SAP BusinessObjects Web Intelligence User's Guide
Analyzing data
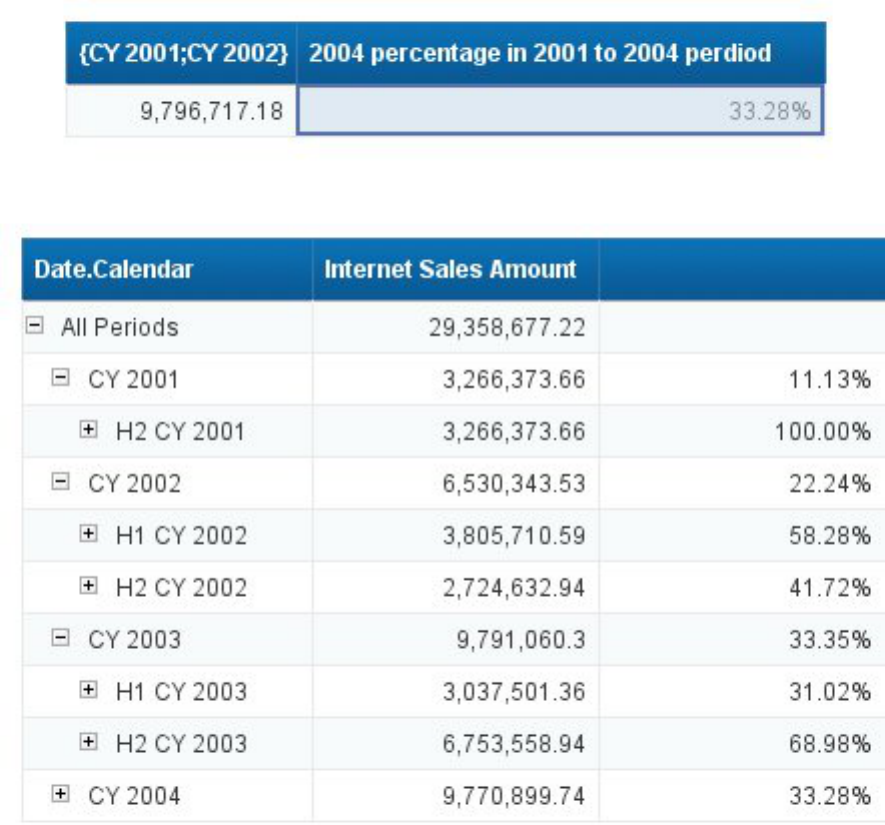

6.6.6.1.10 Misc functions
6.6.6.1.10.1 BlockName
Description
Returns the block name
Function Group
Misc
Syntax
string BlockName()
Examples
BlockName() returns "Block1" if it is placed in a block called "Block1".
6.6.6.1.10.2 ColumnNumber
Description
Returns the column number
Function Group
Misc
746
P U B L I C
SAP BusinessObjects Web Intelligence User's Guide
Analyzing data

Syntax
int ColumnNumber()
Examples
ColumnNumber() returns 2 if the formula is placed in the second column of a table.
6.6.6.1.10.3 Comment
Description
Returns the comment of a cell
Function Group
Misc
Syntax
string Comment()
Note
The comment returned by the function is either the rst or last comment entered in the cell, depending on how
you have set the parameter in the Document Properties.
Example
Comment() returns "Increase the gross margin in Q3" if the comment in the cell is "Increase the gross margin
in Q3".
SAP BusinessObjects Web Intelligence User's Guide
Analyzing data
P U B L I C 747

6.6.6.1.10.4 CurrentUser
Description
Returns the BI launch pad login of the current user
Function Group
Misc
Syntax
string CurrentUser()
Examples
CurrentUser() returns "gkn" if the current user's login is "gkn".
6.6.6.1.10.5 ForceMerge
Description
Includes synchronized dimensions in measure calculations when the dimensions are not in the measure's
calculation context
Function Group
Misc
Syntax
num ForceMerge(measure)
748
P U B L I C
SAP BusinessObjects Web Intelligence User's Guide
Analyzing data

Input
Parameter Description Type Required
measure Any measure Measure Yes
Output
The result of the calculation with the synchronized dimensions taken into account
Notes
● ForceMerge returns #MULTIVALUE if applied to a smart measure because the grouping set necessary to
calculate the smart measure does not exist.
● ForceMerge is the equivalent of the BusinessObjects/Desktop Intelligence Multicube function.
Examples
ForceMerge([Revenue]) returns the value of [Revenue], taking into account any synchronized dimensions
that do not appear in the same block as the [Revenue] measure.
6.6.6.1.10.6 GetContentLocale
Description
Returns the locale of the data contained in the document (the Document Locale)
Function Group
Misc
Syntax
string GetContentLocale()
SAP BusinessObjects Web Intelligence User's Guide
Analyzing data
P U B L I C 749

Notes
The Document Locale is used to format the data in a document.
Examples
GetContentLocale() returns "fr_FR" if the Document Locale is "French (France)".
6.6.6.1.10.7 GetDominantPreferredViewingLocale
Description
Returns the dominant locale in the user's Preferred Viewing Locale group
Function Group
Misc
Syntax
string GetDominantPreferredViewingLocale()
Notes
● Each group of related locales has a dominant locale, used as a base for all the other locales in the group.
For example, US English ("en_US") is the dominant locale in the English locales group. New Zealand English
("en_NZ") is also a member of this group.
● The Translation Manager Guide lists all the Dominant Preferred Viewing Locales.
Examples
GetDominantPreferredViewingLocale returns "en_US" when the Preferred Viewing Locale is "English
(New Zealand)".
750
P U B L I C
SAP BusinessObjects Web Intelligence User's Guide
Analyzing data

Related Information
GetPreferredViewingLocale [page 753]
6.6.6.1.10.8 GetLocale
Description
Returns the user's locale used to format the user interface (the Product Locale)
Function Group
Misc
Syntax
string GetLocale()
Notes
The Product Locale is the locale of the user interface (for example, menu items and button text).
Examples
GetLocale() returns "en_US" if the user's Product Locale is "English (US)".
6.6.6.1.10.9 GetLocalized
Description
Returns a string localized according to the user's Preferred Viewing Locale
SAP BusinessObjects Web Intelligence User's Guide
Analyzing data
P U B L I C 751
Syntax
string GetLocalized(string[;comment])
Input
Parameter
Description Type Required
string The string to be translated string Yes
comment A comment to aid
translators
string No
Notes
● The string parameter can be a string in any formula (for example, in a cell, an alerter message or a
variable denition).
● When designing a report, you can use the comment parameter to provide further information to help
translators translate the string. The comment appears with the string in the Translation Manager tool
which translators use to translate reports.
● Each string + comment pair generates a separate string to be translated in the Translation Manager tool.
As a result, GetLocalized("Product Total";"Max 20 characters") and
GetLocalized("Product Total";"Use no more than 20 characters") might return dierent
translations.
Examples
GetLocalized("Total for all products") returns the French translation of "Total for all products" if
the Preferred Viewing Locale is "fr_FR".
GetLocalized("Total for all products";"Try not to use more than 20 characters")
returns the German translation of "Total for all products" if the Preferred Viewing Locale is "de_DE". The
function also tells the translator of the report not to use more than 20 characters if possible when translating
the string.
Related Information
GetPreferredViewingLocale [page 753]
752
P U B L I C
SAP BusinessObjects Web Intelligence User's Guide
Analyzing data

6.6.6.1.10.10 GetPreferredViewingLocale
Description
Returns the user's preferred locale for viewing document data (the Preferred Viewing Locale)
Function Group
Misc
Syntax
string GetPreferredViewingLocale()
Examples
GetPreferredViewingLocale returns "en_US" if the Preferred Viewing Locale is "English (US)".
Related Information
GetLocalized [page 751]
GetDominantPreferredViewingLocale [page 750]
6.6.6.1.10.11 If...Then...Else
Description
Returns a value based on whether an expression is true or false
Function Group
Misc
SAP BusinessObjects Web Intelligence User's Guide
Analyzing data
P U B L I C 753
Syntax
If bool_value Then true_value [Else false_value]
Input
Parameter
Description Type Required
bool_value A boolean value Boolean Yes
true_value The value to return if
bool_value is true
Any Yes
false_value The value to return if
bool_value is false
Any
Yes if Else is included
Notes
● true_value and false_value can mix datatypes.
● You can use the boolean operators And, Between, InList, Or and Not with If.
● You can nest If conditions by replacing any Else clause with an ElseIf clause. The following syntax
describes one level of nesting:
If bool_value Then true_value [ElseIf bool_value Then true_value Else
false_value…]
● The original syntax of the If function, If(bool_value;true_value;false_value), is also supported.
Examples
If [Sales Revenue] > 1000000 Then "High Revenue" returns "High Revenue" for all rows whose
revenue is larger than 1,000,000 and nothing for all other rows.
If [Sales Revenue] > 1000000 Then "High Revenue" Else [Revenue] returns "High Revenue" for
all rows whose revenue is larger than 1,000,000 and the revenue value for all other rows.
If [Sales Revenue] > 1000000 Then "High Revenue" Else "Low Revenue" returns "High
Revenue" for all rows whose revenue is larger than 1,000,000 and "Low Revenue" for all rows whose revenue is
less than 1,000,000.
If [Sales Revenue] > 1000000 Then "High Revenue" ElseIf [Sales Revenue] > 800000
Then "Medium Revenue" Else "Low Revenue" returns "High Revenue" for all rows whose revenue is
larger than 1000000, "Medium Revenue" for all rows whose revenue is between 800000 and 1000000, and
"Low Revenue" for all other rows.
754
P U B L I C
SAP BusinessObjects Web Intelligence User's Guide
Analyzing data
Related Information
If [page 755]
And operator [page 770]
Between operator [page 771]
InList operator [page 772]
Or operator [page 770]
Not operator [page 771]
6.6.6.1.10.12 If
Description
Returns a value based on whether an expression is true or false
Function Group
Misc
Syntax
If(bool_value;true_value;false_value)
Input
Parameter
Description Type Required
bool_value A boolean value Boolean Yes
true_value The value to return if
bool_value is true
Any Yes
false_value The value to return if
bool_value is false
Any Yes
SAP BusinessObjects Web Intelligence User's Guide
Analyzing data
P U B L I C 755

Notes
● true_value and false_value can mix datatypes.
● You can nest If conditions by replacing false_value with additional If conditions. This syntax shows
one level of nesting:
If(bool_value;true_value;If(bool_value;true_value;false_value);false_value)
● The If...Then...Else syntax is also supported.
Examples
If([Sales Revenue]>1000000;"High Revenue";"Low Revenue") returns "High Revenue" for all rows
whose revenue is larger than 1,000,000 and "Low Revenue" for all rows whose revenue is less than 1,000,000.
If([Sales Revenue]>1000000;"High Revenue";[Revenue]) returns "High Revenue" for all rows whose
revenue is larger than 1,000,000 and the revenue value for all other rows.
Related Information
If...Then...Else [page 753]
6.6.6.1.10.13 LineNumber
Description
Returns the line number in a table
Function Group
Misc
Syntax
int LineNumber()
756
P U B L I C
SAP BusinessObjects Web Intelligence User's Guide
Analyzing data

Notes
Numbering of the lines in a table starts with the header, which is line 1.
Examples
LineNumber() returns 2 when the function appears at the second line in a table.
6.6.6.1.10.14 NameOf
Description
Returns the name of an object
Function Group
Misc
Syntax
string NameOf(obj)
Input
Parameter Description Type Required
obj Any report object Report object Yes
Notes
The NameOf function appears in column and row headers in reports.
SAP BusinessObjects Web Intelligence User's Guide
Analyzing data
P U B L I C 757
Examples
NameOf([Reservation Date]) returns "Reservation Date".
6.6.6.1.10.15 NoFilter
Description
Ignores lters when calculating a value. NoFilter is used with measure objects. It does not apply to dimensions.
Function Group
Misc
Syntax
input_type NoFilter(obj[;All|Drill])
Input
Parameter Description Type Required
obj Any report object Report object Yes
All|Drill
● No keyword specied -
ignore report and block
lters
● All - ignore all lters
● Drill - ignore report
and drill lters
Keyword No
Notes
● NoFilter(obj;Drill) does not work in query drill mode because the drill lters are added to the query
rather than applied to the report data.
● If you end drill mode with drill lters applied, the drill lters become report lters and can change the value
of any objects to which NoFilter(obj;Drill) is applied.
758
P U B L I C
SAP BusinessObjects Web Intelligence User's Guide
Analyzing data

Examples
When placed in a block footer, NoFilter(Sum([Sales Revenue])) returns the total sales revenue of all
possible rows in the block, even when rows are ltered out of the block.
NoFilter(Sum([Sales Revenue]);All) returns the sum of the sales revenue for all countries including
France, even though there is a lter that excludes France from the report.
NoFilter(Sum([Sales Revenue]);Drill) returns the sum of the sales revenue for all countries, even
when there is a drill lter on the [Country] dimension.
6.6.6.1.10.16 NumberOfPages
Description
Returns the number of pages in a report
Function Group
Misc
Syntax
integer NumberOfPages()
Examples
NumberOfDataPages() returns 2 if the report has two pages.
6.6.6.1.10.17 Page
Description
Returns the current page number in a report
SAP BusinessObjects Web Intelligence User's Guide
Analyzing data
P U B L I C 759

Function Group
Misc
Syntax
integer Page()
Example
Page() returns 2 if it appears in the second page of the report.
6.6.6.1.10.18 Previous
Description
Returns a previous value of an object
Function Group
Misc
Syntax
input_type Previous(dimension|measure|Self [;Row|col][;(reset_dims)][;offset]
[;NoNull])
760
P U B L I C
SAP BusinessObjects Web Intelligence User's Guide
Analyzing data

Input
Parameter Description Type Required
dimension|measure|Self The dimension or measure
whose previous value the
function returns, or the Self
keyword
Dimension, measure or
keyword
Yes
Row/Col Sets the calculation direction Keyword No
reset_dims The list of dimensions used
to reset the calculation
Dimension list No
oset Species the value of
dimension or measure
that is offset rows
previous to the current row
Integer No (default is 1)
NoNull Tells the function to return
the rst non-null value
starting from the oset
Keyword No
Notes
● The default value of offset is 1. Previous([Revenue];1) and Previous([Revenue]) are functionally
the same.
● When you include the NoNull argument, the function returns the rst non-null value of the object
beginning from the cell offset rows before the current row and counting backwards.
● You can use extended syntax context operators with Previous.
● The Self operator allows you to refer to the previous value of a cell when it contains content other than
one report object.
● You must always place dimensions in parentheses even if there is only one dimension in the list of reset
dimensions.
● When you specify a set of reset dimensions you must separate them with semi-colons.
● Previous is applied after all report, section and block lters, and all sorts, are applied.
● You cannot apply sorts or lters on formulas that use Previous.
● If Previous is applied on a measure and the measure returns an undened value, Previous returns an
undened value even if the previous line returned a value.
● Previous ignores breaks when placed outside a break header or footer.
● Previous returns the value in the previous instance of the footer when placed in a break footer.
● Previous is reset in each report section.
● When used in a crosstab, Previous does not treat the last value in a row as the previous value of the rst
value of the next row.
SAP BusinessObjects Web Intelligence User's Guide
Analyzing data
P U B L I C 761

Examples
Previous([Country];1) returns the following values in the following table:
Country
Revenue Previous
US 5,000,000
UK 2,000,000 US
France 2,100,000 UK
Previous([Revenue]) returns the following values in the following table:
Country
Revenue Previous
US 5,000,000
UK 2,000,000 5,000,000
France 2,100,000 2,000,000
Previous([Revenue];([Country]) returns the following values in the following table:
Country
Region Revenue Previous
US North 5,000,000
South 7,000,000 5,000,000
UK North 3,000,000
South 4,000,000 3,000,000
Previous([Revenue]) returns the following values in the following crosstab:
2004 Previous 2005 Previous
US 5,000,000 6,000,000 5,000,000
UK 2,000,000 2,500,000 2,000,000
France 3,000,000 2,000,000 3,000,000
Previous([Revenue]) returns the following values in the following table with a break on [Country]:
Country
Region Revenue Previous
US North 5,000,000
South 7,000,000 5,000,000
US 12,000,000
Country Region Revenue Previous
UK North 3,000,000 7,000,000
South 4,000,000 3,000,000
762 P U BL I C
SAP BusinessObjects Web Intelligence User's Guide
Analyzing data

UK 7,000,000 12,000,000
Previous([Revenue]);2;NoNull) returns the following values in the following table:
Year Quarter Revenue Previous
2008 Q1 500
2008 Q2
2008 Q3 400 500
2008 Q4 700 500
2008 Q1 300 400
2008 Q2 700
2008 Q3 300
2008 Q4 200 300
2*Previous(Self) returns the sequence 2, 4, 6, 8, 10...
Related Information
Comparing values using the Previous function [page 812]
Self operator [page 781]
6.6.6.1.10.19 RefValue
Description
Returns the reference value of a report object when data tracking is activated
Function Group
Misc
Syntax
input_type RefValue(obj)
SAP BusinessObjects Web Intelligence User's Guide
Analyzing data
P U B L I C 763

Examples
RefValue([Top Performing Region]) returns "South West" if the value of the [Top Performing Region]
variable is "South West" in the reference data.
RefValue([Revenue]) returns 1000 if the value of the [Revenue] measure is 1000 in the reference data.
Notes
● The RefValue() function can be used with either a measure or a dimension object. However, when used in a
variable qualied as a dimension or a detail, the RefValue() function will return the current values of that
object, rather than its reference values. In order to get the reference values, the variable must be qualied
as a measure.
● When created directly in a section, table, form, or chart, a formula will always be qualied as a measure, so
if the formula uses the RefValue() function, it will return the expected reference values.
Example of RefValue function with a variable
We have the list of values for the [State] dimension: California, Florida, Texas and New York. After a data
refresh, this list becomes: Arizona, California, Florida, Texas and New York. A variable such as
Variable=RefValue([State]) will either return:
Variable is quali
ed as List of values returned is
Dimension or de
tail
Arizona, California, Florida, Texas and New York
Measure (null value), California, Florida, Texas and New York
6.6.6.1.10.20 RelativeValue
Description
Returns previous or subsequent values of an object
Function Group
Misc
764
P U B L I C
SAP BusinessObjects Web Intelligence User's Guide
Analyzing data

Syntax
input_type RelativeValue(measure|detail;slicing_dims;offset)
Input
Parameter Description Type Required
measure|detail Any measure or a detail of a
dimension in the block
Measure or detail Yes
slicing_dims The dimensions that provide
the calculation context
Dimension list Yes
oset Species the value of
measure or detail that is
offset rows removed from
the current row
Integer Yes
Notes
● The object must be a measure or a detail of a dimension available in the block.
● The sort order of the list of values of the slicing dimensions is used to determine the output of the function.
The sort order is determined by two factors: sorts applied to the slicing dimensions, and the order in which
the slicing dimensions are listed in the function.
● A dimension used as a section master can be specied as a slicing dimension.
● All the slicing dimensions must be present in the block or section header of the block in which the function
is placed. If a slicing dimension is later removed from the block, the function returns the #COMPUTATION
error.
● If the oset exceeds the number of rows in the list of values of the slicing dimension, the function returns
null.
● RelativeValue cannot be used recursively.
● You must always place dimensions in parentheses even if there is only one dimension in the list of slicing
dimensions.
Examples
The RelativeValue column in the table below contains the following formula:
RelativeValue([Revenue];([Year]);-1)
SAP BusinessObjects Web Intelligence User's Guide
Analyzing data
P U B L I C 765

Year Quarter Sales Person Revenue RelativeValue
2007 Q1 Smith 1000
2007 Q2 Jones 2000
2007 Q3 Wilson 1500
2007 Q4 Harris 3000
2008 Q1 Smith 4000 1000
2008 Q2 Jones 3400 2000
2008 Q3 Wilson 2000 1500
2008 Q4 Harris 1700 3000
Related Information
#COMPUTATION [page 807]
Comparing values using the RelativeValue function [page 812]
6.6.6.1.10.21 ReportName
Description
Returns the name of a report
Function Group
Misc
Syntax
string ReportName()
Examples
ReportName() returns "Sales Report" if it is placed in a report called "Sales Report".
766
P U B L I C
SAP BusinessObjects Web Intelligence User's Guide
Analyzing data

6.6.6.1.10.22 RowIndex
Description
Returns the number of a row
Function Group
Misc
Syntax
integer RowIndex()
Notes
● Row numbering starts at 0.
● RowIndex returns #MULTIVALUE when placed in a table header or footer.
Examples
RowIndex returns 0 when it appears on the rst row of a table.
6.6.6.1.10.23 UniqueNameOf
Description
Returns the unique name of an object
Function Group
Misc
SAP BusinessObjects Web Intelligence User's Guide
Analyzing data
P U B L I C 767

Syntax
string UniqueNameOf(obj)
Input
Parameter Description Type Required
obj Any report object Report object Yes
Examples
UniqueNameOf([Reservation Date]) returns "Reservation Date".
6.6.6.2 Function and formula operators
Operators link the various components in a formula.
Formulas can contain mathematical, conditional, logical, function-specic or extended syntax operators.
SAP HANA Online mode operators restrictions
The table below lists the operators that are not supported in SAP HANA Online mode.
Operator Type
Operator
Function-specic operators Drill
Index
Where
Extended syntax operators In
ForEach
ForAll
768 P UB L I C
SAP BusinessObjects Web Intelligence User's Guide
Analyzing data

6.6.6.2.1 Mathematical operators
Mathematical operators are familiar from everyday arithmetic.
There are addition (+), subtraction (-), multiplication (*), division (/) operators that allow you to perform
mathematical operations in a formula. The formula [Sales Revenue] - [Cost of Sales]contains a
mathematical operator, in this case subtraction.
Note
When used with character strings, the ‘+’ operator becomes a string concatenation operator. That is, it
joins character strings. For example, the formula “John" + “ Smith" returns "John Smith".
6.6.6.2.2 Conditional operators
Conditional operators determine the type of comparison to be made between values.
Operator
Description
= Equal to
> Greater than
< Less than
>= Greater than or equal to
<= Less than or equal to
<> Not equal to
You use conditional operators with the If function, as in:
If [Revenue]>10000 Then "High" Else "Low"
which returns “High" for all rows where the revenue is greater than or equal to 10000 and “Low" for all other
rows.
6.6.6.2.3 Logical operators
The logical operators are And, Or, Not, Between and InList.
Logical operators are used in boolean expressions, which return True or False.
SAP BusinessObjects Web Intelligence User's Guide
Analyzing data
P U B L I C 769

6.6.6.2.3.1 And operator
The And operator links boolean values.
Description
If all the boolean values linked by And return true, the combination of all the values also returns true.
Syntax
bool_value And bool_value [And bool_value...]
Examples
If [Resort] = "Bahamas Beach" And [Revenue]>100000 Then "High Bahamas Revenue" returns
"High Bahamas Revenue" if [Resort] = "Bahamas Beach" And [Revenue]>100000.
6.6.6.2.3.2 Or operator
The Or operator links boolean values.
Description
If any one boolean value linked by Or returns true, the combination of all the values also returns true.
Syntax
bool_value Or bool_value [Or bool_value...]
770
P U B L I C
SAP BusinessObjects Web Intelligence User's Guide
Analyzing data

Examples
If [Resort] = "Bahamas Beach" Or [Resort]="Hawaiian Club" Then "US" Else "France"
returns "US" if [Resort]="Bahamas Beach" or "Hawaiian Club", or "France" otherwise.
6.6.6.2.3.3 Not operator
Description
The Not operator returns the opposite of a boolean value.
Syntax
bool Not(bool_value)
Examples
If Not([Country] = "US") Then "Not US" returns "Not US" if [Country] has any value other than "US".
6.6.6.2.3.4 Between operator
Description
The Between operator determines if a variable is between two values.
Syntax
bool Between(first_value;second_value)
SAP BusinessObjects Web Intelligence User's Guide
Analyzing data
P U B L I C 771

Notes
● You use Between with the If function and the Where operator.
● Changing the document locale can impact the result returned by the Between operator.
Examples
If [Sales revenue] Between(800000;900000) Then "Medium revenue" returns "Medium revenue"
if [Sales revenue] is between 800000 and 900000.
[Sales revenue] Between (10000;20000) returns true if the Sales revenue is between 10000 and
20000.
If ([Sales revenue] Between (200000;500000);"Medium revenue";"Low/High revenue")
returns "Medium revenue" if [Sales revenue] is 300000.
Related Information
If...Then...Else [page 753]
Where operator [page 782]
6.6.6.2.3.5 InList operator
Description
The InList operator determines if a value is in a list of values.
Syntax
bool test_value InList(value_list)
Notes
It is the combination of test_value + InList that returns a boolean value, not InList alone.
772
P U B L I C
SAP BusinessObjects Web Intelligence User's Guide
Analyzing data
Examples
If Not ([Country] InList("England";"Scotland";"Wales")) Then "Not Britain" Else
"Britain" returns "Not Britain" if [Country] is not equal to "England", "Scotland" or "Wales", or "Britain"
otherwise.
If [Resort] InList("Bahamas Beach";"Hawaiian Club") Then "US Resort" returns "US Resort"
if [Resort] is equal to "Bahamas Beach" or "Hawaiian Club".
Related Information
If...Then...Else [page 753]
Where operator [page 782]
6.6.6.2.4 Function-specic operators
Some functions can take specic operators as arguments.
For example, the Previous function can take the Self operator.
All functions use ) and ( to enclose function arguments. Functions that accept multiple parameters use ; to
separate the parameters.
6.6.6.2.4.1 All operator
The All operator tells the NoFilter function to ignore all lters.
The All operator can also tell the Count function to count all values, including duplicates.
Related Information
Count [page 583]
Distinct/All operators [page 776]
NoFilter [page 758]
All/Drill operators [page 774]
SAP BusinessObjects Web Intelligence User's Guide
Analyzing data
P U B L I C 773
6.6.6.2.4.2 All/Drill operators
The All/Drill operators work with the NoFilter function.
Description
The All/Drill operators determine which lters the NoFilter function ignores.
● Not specied - NoFilter ignores report and block lters
● All - NoFilter ignores all lters
● Drill - NoFilter ignores report lters and drill lters
6.6.6.2.4.3 Ascending
The Ascending operator is an argument of the PromptSummary function.
Description
When set, the PromptSummary function sorts the prompts in the ascending order.
Related Information
PromptSummary [page 680]
6.6.6.2.4.4 Bottom/Top operators
The Bottom/Top operators work with the Rank function.
Description
The Bottom/Top operators tell the Rank function to rank in descending or ascending order.
● Top - ranks in descending order
● Bottom - ranks in ascending order
774
P U B L I C
SAP BusinessObjects Web Intelligence User's Guide
Analyzing data

Examples
Rank([Revenue];([Country]);Top) ranks countries by revenue from highest to lowest.
Related Information
Rank [page 711]
6.6.6.2.4.5 Break operator
The Break operator works with the Percentage function.
Description
The Break operator tells Percentage function to account for table breaks.
Examples
The formula Percentage([Revenue]) gives the following result in the following table (percentages are
calculated on the total revenue in the block):
Year
Quarter Revenue Percentage
2005 Q1 10000 10%
2005 Q2 20000 20%
2006 Q1 30000 30%
2006 Q2 40000 40%
The formula Percentage([Revenue];Break) gives the following result in the following table (percentages
are calculated on the total revenue in each part of the block):
Year
Quarter Revenue Percentage
2005 Q1 10000 33.3%
2005 Q2 20000 66.6%
SAP BusinessObjects Web Intelligence User's Guide
Analyzing data
P U B L I C 775

2006 Q1 30000 42.9%
2006 Q2 40000 57.1%
Related Information
Percentage [page 594]
6.6.6.2.4.6 Descending
The Descending operator is an argument of the PromptSummary function.
Description
When set, the PromptSummary function sorts the prompts in the descending order.
Related Information
PromptSummary [page 680]
6.6.6.2.4.7 Distinct/All operators
The Distinct/All operators work with the Count function.
The Distinct/All operators tell the Count function to count distinct values only, or all values.
Examples
Count([Revenue];Distinct) returns 3 if [Revenue] has the values (5;5;6;4).
Count([Revenue];All) returns 4 if [Revenue] has the values (5;5;6;4).
776
P U B L I C
SAP BusinessObjects Web Intelligence User's Guide
Analyzing data
Related Information
Count [page 583]
6.6.6.2.4.8 IncludeEmpty operator
The IncludeEmpty operator works with aggregate functions.
Description
The IncludeEmpty operator tells some aggregate functions (Average, Count, RunningAverage,
RunningCount) to include empty values in calculations.
Examples
Average([Revenue];IncludeEmpty) returns 3 if [Revenue] has the values (5;3;<empty>;4).
Related Information
Average [page 582]
Count [page 583]
RunningAverage [page 597]
RunningCount [page 599]
6.6.6.2.4.9 Index operator
The Index operator works with the UserResponse and RefValueUserResponse functions.
Description
The Index operator tells the UserResponse and RefValueUserResponse functions to return the database
primary key of the prompt response.
SAP BusinessObjects Web Intelligence User's Guide
Analyzing data
P U B L I C 777
Related Information
UserResponse [page 673]
RefValueUserReponse [page 669]
6.6.6.2.4.10 Linear operator
The Linear operator works with the Interpolation function.
Description
The Linear operator tells the Interpolation function to use linear regression with least squares
interpolation to supply missing measure values.
Linear regression with least squares interpolation calculates missing values by calculating a line equation in the
form f(x) = ax + b that passes as closely as possible through all the available values of the measure.
Related Information
Interpolation [page 586]
6.6.6.2.4.11 NoNull operator
The NoNull operator works with the Previous function.
Description
The NoNull operator tells the Previous function to ignore null values.
When used with NoNull, Previous returns the rst non-null value of the object, beginning from the cell
offset rows before the current row and counting backwards.
Related Information
Previous [page 760]
778
P U B L I C
SAP BusinessObjects Web Intelligence User's Guide
Analyzing data
6.6.6.2.4.12 NotOnBreak operator
The NotOnBreak operator works with the Interpolation function.
Description
The NotOnBreak operator tells the Interpolation function to ignore section and block breaks.
Related Information
Interpolation [page 586]
6.6.6.2.4.13 PointToPoint operator
The PointToPoint operator tells the Interpolation function to use point-to-point interpolation to supply
missing measure values.
Description
Point-to point interpolation calculates missing values by calculating a line equation in the form f(x) = ax + b that
passes through the two adjacent values of the missing value.
Related Information
Interpolation [page 586]
SAP BusinessObjects Web Intelligence User's Guide
Analyzing data
P U B L I C 779

6.6.6.2.4.14 Row/Col operators
The Row operator calculates each value in the row as a percentage of the total value of all the rows in the
embedding context. The Col operator calculates each value in the column as a percentage of the total value of
all the columns in the embedding context.
Description
The Row/Col operators set the calculation direction of the following functions: Percentage, Previous,
RunningAverage, RunningCount, RunningMax, RunningMin, RunningProduct, RunningSum.
Notes
In a crosstab, the value in each cell is calculated by default as a percentage of the total value in the crosstab.
The Row operator calculates the values in the rows as percentages of the total value for the row. The Col
operator calculates the values in the columns as percentages of the total value in the column.
Examples
In a crosstab, Percentage([Measure]) gives the following result:
Measure
Percentage Measure Percentage
100 10% 500 50%
200 20% 200 20%
Percentage([Measure];Row) gives the following result:
Measure
Percentage Measure Percentage
100 16.7% 500 83.3%
200 50% 200 50%
Percentage([Measure];Col) gives the following result:
Measure
Percentage Measure Percentage
100 33.3% 500 83.3%
200 66.6% 200 16.7%
780 P U B L I C
SAP BusinessObjects Web Intelligence User's Guide
Analyzing data

The Row operator calculates the running aggregate by row. The Col operator calculates the running aggregate
by column.
In a crosstab, RunningSum([Measure]) or RunningSum([Measure];Row) gives the following result:
Measure RunningSum Measure RunningSum
100 100 200 300
400 700 250 950
In a crosstab, RunningSum([Measure];Col) gives the following result:
Measure
RunningSum Measure RunningSum
100 100 200 700
400 500 250 950
Related Information
Percentage [page 594]
RunningAverage [page 597]
RunningCount [page 599]
RunningMax [page 601]
RunningMin [page 603]
RunningProduct [page 605]
RunningSum [page 607]
6.6.6.2.4.15 Self operator
The Self operator works with the Previous function.
Description
Refers the Previous function to the previous cell when it does not contain a report object.
Examples
5 + Previous(Self) returns the sequence 5, 10, 15, 20, 25, 30...
1 + 0.5 * Previous(Self) returns the sequence 1, 1.5, 1.75, 1.88...
SAP BusinessObjects Web Intelligence User's Guide
Analyzing data
P U B L I C 781
Related Information
Previous [page 760]
6.6.6.2.4.16 Where operator
Description
The Where operator restricts the data used to calculate a measure.
Examples
The formula Average ([Sales Revenue]) Where ([Country] = "US") calculates the average sales
where the country is "US".
The formula Average ([Sales Revenue]) Where ([Country] = "US" Or [Country] = "France")
calculates the average sales where the country is "US" or "France".
The formula [Revenue] Where (Not ([Country] Inlist ("US"; "France"))) calculates the
revenue for the countries other than US and France.
The variable [High Revenue] has the formula [Revenue] Where [Revenue > 500000]. When placed in a
block, [High Revenue] displays either the revenue when its value is greater than 500000, or nothing. When
placed in a footer at the bottom of the [High Revenue] column, the formula Average ([High Revenue])
returns the average of all the revenues greater than 500000.
Related Information
And operator [page 770]
Between operator [page 771]
InList operator [page 772]
Or operator [page 770]
Not operator [page 771]
6.6.6.2.5 Extended syntax operators
You specify input and output contexts explicitly with context operators.
The following table lists the context operators:
782
P U B L I C
SAP BusinessObjects Web Intelligence User's Guide
Analyzing data

Operator Description
In Species an explicit list of dimensions to use in the context.
ForEach Adds dimensions to the default context
ForAll Removes dimensions from the default context
The ForAll and ForEach operators are useful when you have a default context with many dimensions. It is often
easier to add or subtract from the context using ForAll and ForEach than it is to specify the list explicitly using
In.
6.6.6.2.5.1 In context operator
The In context operator species dimensions explicitly in a context.
Example
Using In to specify the dimensions in a context
In this example you have a report showing Year and Sales revenue. Your data provider also contains the
Quarter object but you do not include this dimension in the block. Instead, you want to include an additional
column to show the maximum revenue by quarter in each year. Your report looks like this:
Year Sales revenue Max Quarterly Revenue
2001 $8,096,123.60 $2,660,699.50
2002 $13,232,246.00 $4,186,120.00
2003 $15,059,142.80 $4,006,717.50
You can see where the values in the Max Quarterly Revenue column come from by examining this block in
conjunction with a block that includes the Quarter dimension:
Year Quarter Sales revenue
2001 Q1 $2,660,699.50
2001 Q2 $2,279,003.00
2001 Q3 $1,367,841.00
2001 Q4 $1,788,580.00
Max: $2,660,699.50
Year Quarter Sales revenue
Q1 $3,326,172.00
Q2 $2,840,651.00
Q3 $2,879,303.00
Q4 $4,186,120.00
Max: $4,186,120.00
SAP BusinessObjects Web Intelligence User's Guide
Analyzing data
P U B L I C 783

Year Quarter Sales revenue
Q1 $3,742,989.00
Q2 $4,006,717.50
Q3 $3,953,395.00
Q4 $3,356,041.00
Max: $4,006,717.50
The Max Quarterly Revenue column shows the highest quarterly revenue in each year. For example, Q4 has
the highest revenue in 2002, so the Max Quarterly Revenue shows Q4 revenue on the row showing 2002.
Using the In operator, the formula for Max Quarterly Revenue is
Max ([Sales revenue] In ([Year];[Quarter])) In ([Year])
This formula calculates the maximum sales revenue for each (Year,Quarter) combination, then outputs this
gure by year.
Note
Because the default output context of the block is Year, you do not need to specify the output context
explicitly in this formula.
6.6.6.2.5.2 ForEach context operator
The ForEach operator adds dimensions to a context.
Example
Using ForEach to add dimensions to a context
The following table shows the maximum revenue for each Quarter in a report which contains the Quarter
dimension but does not include it in the block:
Year Sales revenue Max Quarterly Revenue
2001 8096123.60 2660699.50
2002 13232246.00 4186120.00
2003 15059142.80 4006717.50
It is possible to create a formula for the Max Quarterly Revenue column that does not include the ForEach
operator:
Max ([Sales revenue] In ([Year];[Quarter])) In ([Year])
Using the ForEach context operator, you can achieve the same result with the following formula:
Max ([Sales revenue] ForEach ([Quarter])) In ([Year])
784
P U B L I C
SAP BusinessObjects Web Intelligence User's Guide
Analyzing data
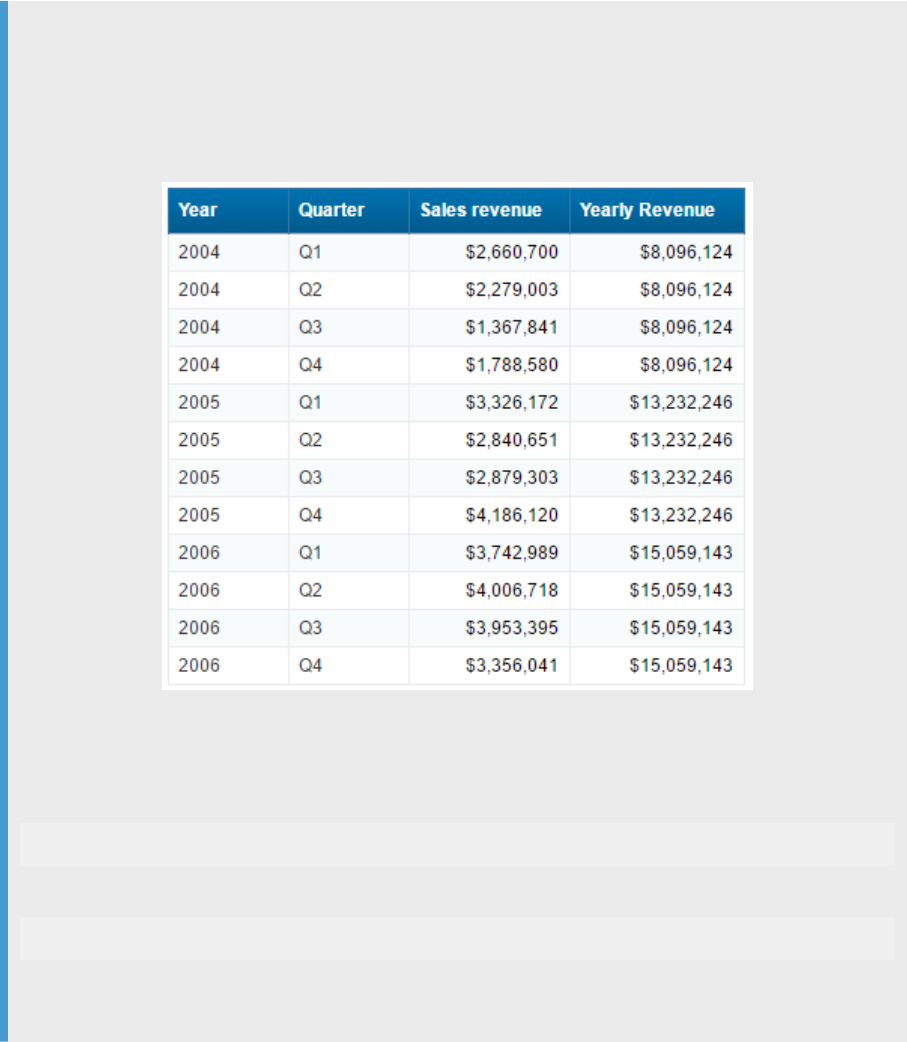
Why? Because the Year dimension is the default input context in the block. By using the ForEach operator, you
add the Quarter dimension to the context, giving an input context of ([Year];[Quarter]).
6.6.6.2.5.3 ForAll context operator
The ForAll context operator removes dimensions from a context.
Example
Using ForAll to remove dimensions from a context
You have a report showing Year, Quarter and Sales revenue and you want to add a column that shows the
total revenue in each year, as shown in the following block:
To total revenues by year the input context needs to be (Year); by default it is (Year; Quarter). Therefore, you
can remove Quarter from the input context by specifying ForAll ([Quarter]) in the formula, which
looks like this:
Sum([Sales revenue] ForAll ([Quarter]))
Note that you can use the In operator to achieve the same thing; in this case the formula is:
Sum([Sales revenue] In ([Year]))
This version of the formula explicitly species Year as the context, rather than removing Quarter to leave
Year.
SAP BusinessObjects Web Intelligence User's Guide
Analyzing data
P U B L I C 785

6.6.6.2.6 Set operators
Set operators work on members in hierarchical data.
6.6.6.2.6.1 Range operator
Description
The range operator (:) returns a set of members between and including two members at the same level
Syntax
first_member:last_member
Examples
[Geography]&[US].[California].[Los Angeles]:[Geography]&[US].[California].[San
Francisco]
returns [Los Angeles], [San Diego], [San Francisco] if the members at the level are in the order ...
[Los Angeles], [San Diego], San Francisco]...
Sum([Revenue];{[Geography]&[US].[California].[Los Angeles]:[Geography]&[US].
[California].[San Francisco]}) returns the total revenue for Los Angeles, San Diego and San
Francisco.
6.6.6.3 Extended syntax keywords
Extended syntax keywords are a form of shorthand that allows you to refer to dimensions in extended syntax
without specifying those dimensions explicitly.
These keywords help future-proof reports. If formulas do not contain hard-coded references to dimensions,
they will continue to work even if dimensions are added to or removed from a report.
There are ve extended syntax keywords: Report, Section, Break, Block and Body.
Note
Extended syntax keywords are not supported in SAP HANA Online mode.
786
P U B L I C
SAP BusinessObjects Web Intelligence User's Guide
Analyzing data
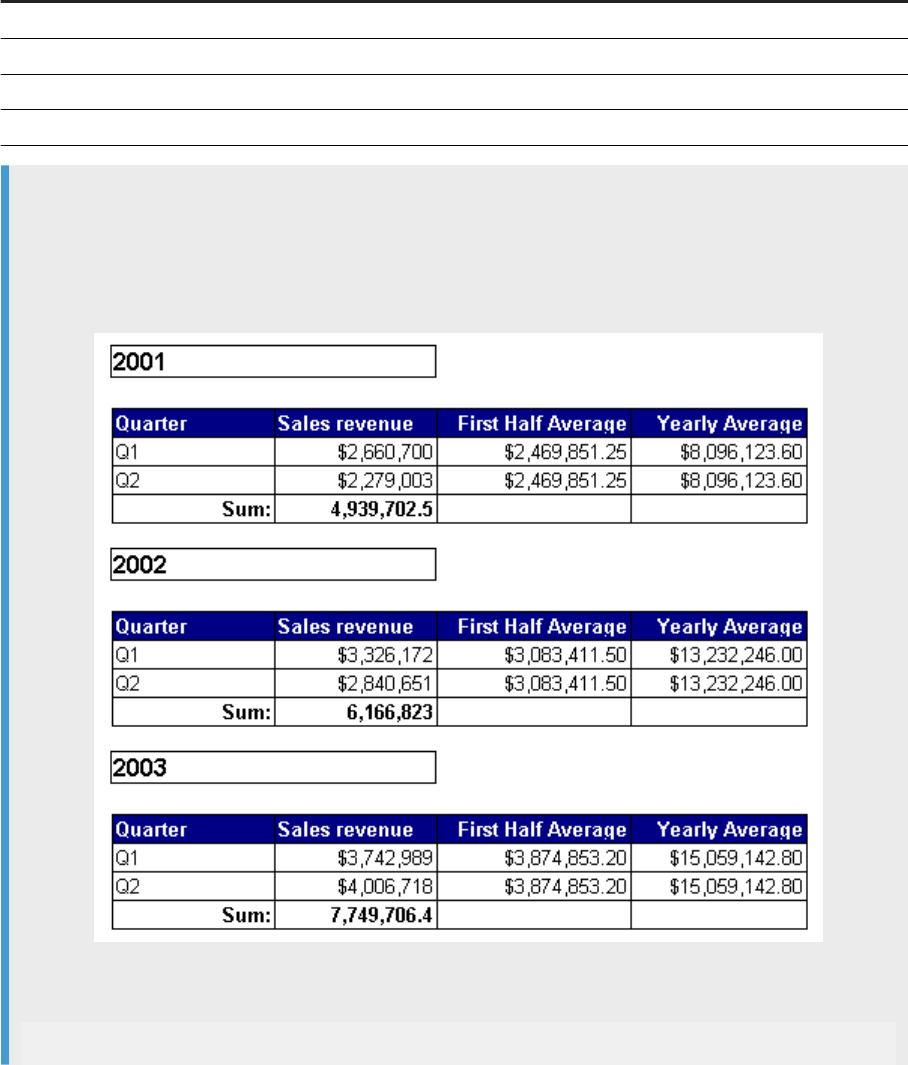
6.6.6.3.1 The Block keyword
This topic describes the dimensions referenced by the Block keyword, depending on where it is placed in a
report. The Block keyword often encompasses the same data as the Section keyword.
The dierence is that Block accounts for lters on a block whereas Section ignores them.
When placed in...
References this data...
A block Data in the whole block, ignoring breaks, respecting lters
A block break (header or footer) Data in the whole block, ignoring breaks, respecting lters
A section (header, footer, or outside a block) Not applicable
Outside any blocks or sections Not applicable
Example
The Block keyword
You have a report showing Year, Quarter and Sales revenue. The report has a section based on Year. The
block is ltered to exclude the third and fourth quarters.
The Yearly Average column uses the following formula:
Average([Sales revenue] In Section)
SAP BusinessObjects Web Intelligence User's Guide
Analyzing data
P U B L I C 787
The First Half Average column uses the following formula:
Average ([Sales revenue]) In Block
You can see how the Block keyword takes account of the lter on the block.
6.6.6.3.2 The Body keyword
This topic describes the dimensions referenced by the keyword in a block Body, depending on where it is
placed in a report.
When placed in...
References this data...
A block Data in the block
A block break (header or footer) Data in the block
A section (header, footer, or outside a block) Data in the section
Outside any blocks or sections Data in the report
Example
The Body keyword
You have a report showing Year, Quarter and Sales revenue, with a break on Year. The report has a section
based on Year and a break on Quarter.
Year Quarter Sales revenue Body
2001 Q1 2,660,700 2,660,699.5
Q2 2,279,003 2,279,003
Q3 1,367,841 1,367,840.7
Q4 1,788,580 1,788,580.4
2001 8,096,123.6
The Body column has the formula
Sum ([Sales revenue]) In Body
The totals in the Body column are the same as those in the Sales revenue column because the Body
keyword refers to the data in the block. If you were to remove the Month object, the gures in the Block
column would change to correspond with the changed gures in the Sales revenue column. If you were to
place the formula in the report footer it would return the total revenue for the body.
788
P U B L I C
SAP BusinessObjects Web Intelligence User's Guide
Analyzing data
6.6.6.3.3 The Break keyword
The following table describes the dimensions referenced by the Break keyword depending on where it is placed
in a report.
When placed in...
References this data...
A block Data in the part of a block delimited by a break
A block break (header or footer) Data in the part of a block delimited by a break
A section (header, footer, or outside a block) Not applicable
Outside any blocks or sections Not applicable
Example
The Break keyword
You have a report showing Year, Quarter and Sales revenue:
Year Quarter Sales revenue Break Total
2001 Q1 $2,660,700 $8,096,124
Q2 $2,279,003 $8,096,124
Q3 $1,367,841 $8,096,124
Q4 $1,788,580 $8,096,124
The report has break on Year. The Break Total column has the formula:
Sum ([Sales revenue]) In Break
Without the Break keyword this column would duplicate the gures in the Sales revenue column, because it
would use the default output context ([Year];[Quarter]).
6.6.6.3.4 The Report keyword
This topic describes the data referenced by the Report keyword, depending on where it is placed in a report:
When placed in...
References this data...
A block All data in the report
A block break (header or footer) All data in the report
A section (header, footer, or outside a block) All data in the report
Outside any blocks or sections All data in the report
SAP BusinessObjects Web Intelligence User's Guide
Analyzing data
P U B L I C 789
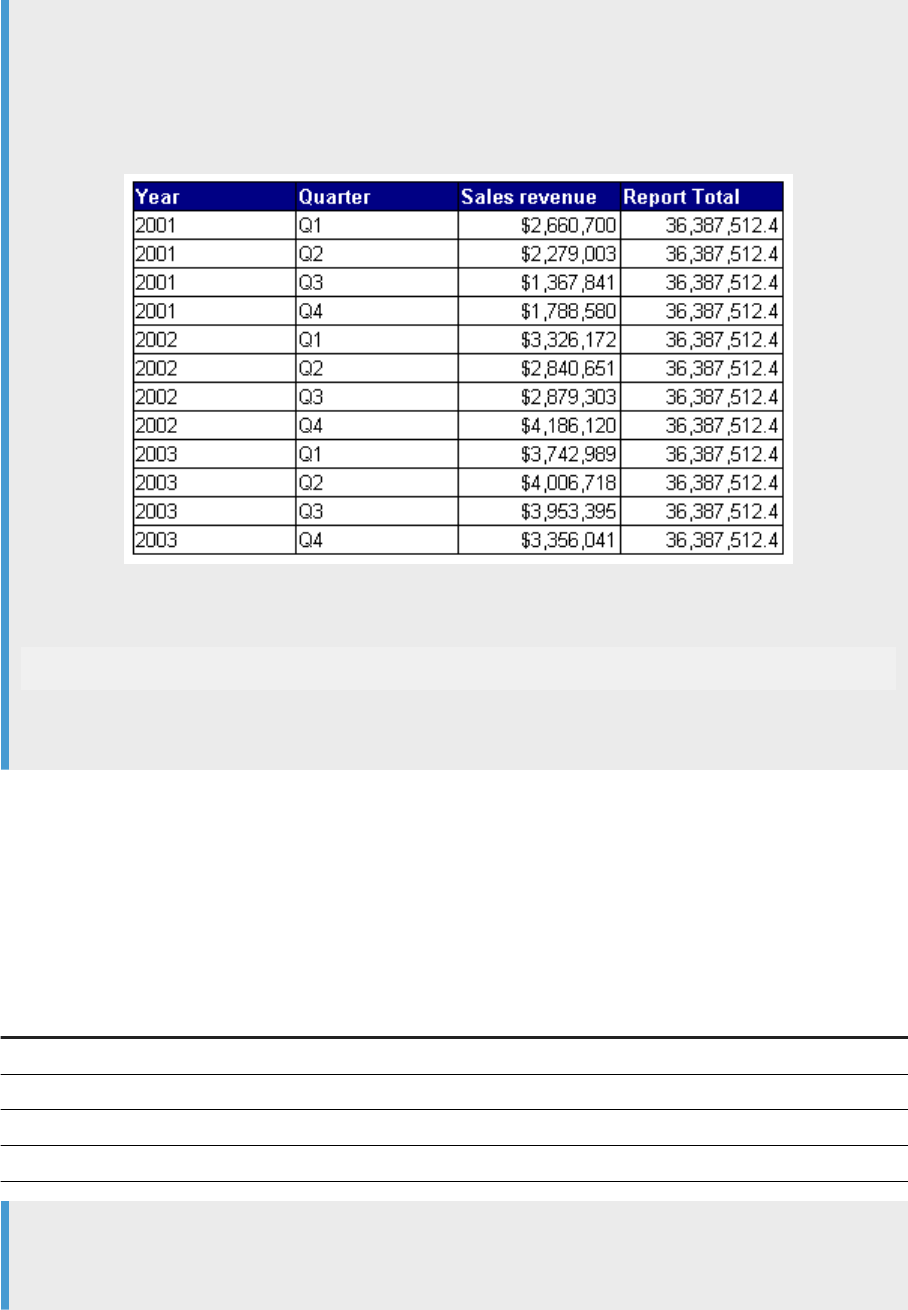
Example
The Report keyword
You have a report showing Year, Quarter and Sales revenue. The report has a column, Report Total, that
shows the total of all revenue in the report.
The formula for the Report Total column is as follows:
Sum([Sales revenue]) In Report
Without the Report keyword, this column would duplicate the gures in the Sales Revenue column because
it would use the default output context ([Year];[Quarter]).
6.6.6.3.5 The Section keyword
This topic describes the data referenced by the keyword for a Section, depending on where it is placed in a
report.
When placed in...
References this data...
A block All data in the section
A block break (header or footer) All data in the section
A section (header, footer, or outside a block) All data in the section
Outside any blocks or sections Not applicable
Example
The Section keyword
You have a report showing Year, Quarter, and Sales revenue.
790
P U B L I C
SAP BusinessObjects Web Intelligence User's Guide
Analyzing data
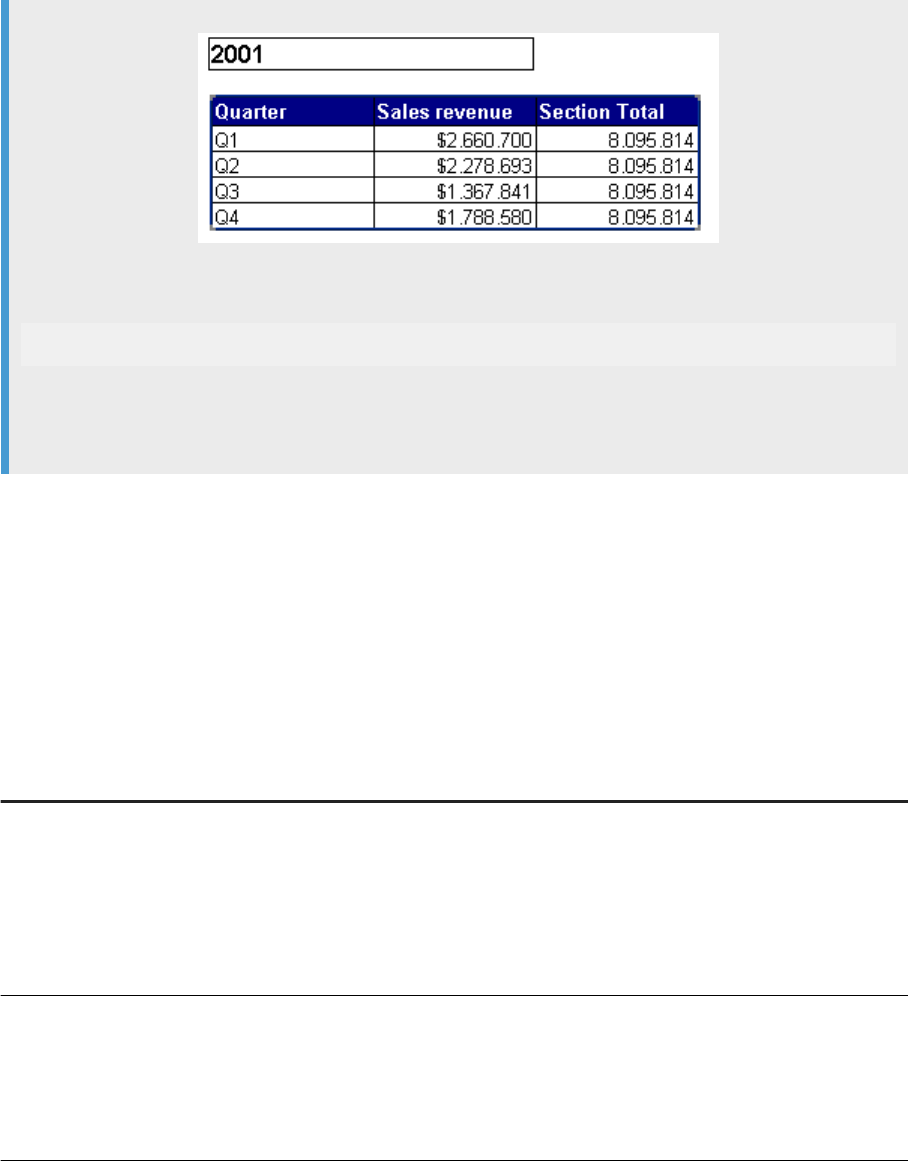
The report has a section based on Year. The Section Total column has the formula:
Sum ([Sales revenue]) In Section
The gure in the Section Total column is the total revenue for 2001, because the section break occurs on
the Year object. Without the Section keyword this column would duplicate the gures in the Sales revenue
column, because it would use the default output context ([Year];[Quarter]).
6.6.6.4 Rounding and truncating numbers
Several functions contain a parameter that determines to what level the function rounds or truncates the value
it returns.
This parameter accepts an integer that is either greater than 0, 0, or less than 0. The following table explains
how numbers are rounded and truncated in these cases:
Parameter Description
> 0
The function rounds/truncates to <parameter> decimal
places.
Examples:
Round(3.13;1) returns 3.1
Round(3.157;2) returns 3.16
0
The function rounds/truncates to the nearest integer.
Examples:
Truncate(3.7;0) returns 3
Truncate(4.164;0) returns 4
< 0
The function rounds/truncates to the nearest 10
(parameter = -1), 100 (parameter = -2), 1000 (parameter =
-3) and so on.
Examples:
SAP BusinessObjects Web Intelligence User's Guide
Analyzing data
P U B L I C 791
Parameter Description
Round(123.76;-1) returns 120
Round(459.9;-2) returns 500
Truncate(1600;-3) returns 1000
Note
Numbers are represented internally using double-precision oating-point formats and have 15 to 17 digits
of precision.
Related Information
Round [page 713]
Truncate [page 719]
EuroConvertTo [page 699]
EuroConvertFrom [page 698]
EuroFromRoundError [page 701]
EuroToRoundError [page 703]
6.6.6.5 Referring to members and member sets in
hierarchies
You refer to members and member sets in functions using the syntax [hierarchy]&path.function.
The path and function parts are optional. In path, you refer to each member in square brackets, with
members separated by full stops. The names of members and levels are case-sensitive.
Note
You use member sets to override the default calculation context for a hierarchy. In functions that accept
member sets, you enclose the member set in {}.
You refer to ranges of members using a colon (:) between the start and end member, and with the full path
specied for each member. A range includes all members at the same level as the specied members.
An example of range syntax is: [Sales Hierarchy]&[Customer_Type].[ENTERPRISE];[Large].
[Nancy Davolio]: [Sales Hierarchy]&[Customer_Type].[ENTERPRISE];[Large].[Andrew
Smith].
Example
Referring to members and member sets
You have the following hierarchy:
792
P U B L I C
SAP BusinessObjects Web Intelligence User's Guide
Analyzing data
Sales Hierarchy Order Amount
Customer_Type 277,290,434
ENTERPRISE 180,063,361
Large 113.905,997
Nancy Davolio 44,855,689
Janet Leverling 44,050,308
Andrew Smith 30,000,000
GLOBAL 91,157,363
● [Sales Hierarchy]&[Customer_Type].[ENTERPRISE].[Large].Children refers to the
[Nancy Davolio], [Janet Leverling] and [Andrew Smith] members.
● Sum([Order Amount];{[Sales Hierarchy]&[Customer_Type].[ENTERPRISE].
[Large].children}) returns 113,905,997 (the sum of the measure for the three child members).
● [Sales Hierarchy]&[Customer_Type].[ENTERPRISE].[Large].[Janet Leverling] refers
to the [Janet Leverling] member.
● Sum([Order Amount];{[Sales Hierarchy]&[Customer_Type].[ENTERPRISE].[Large].
[Janet Leverling];[Sales Hierarchy]&[Customer_Type].[ENTERPRISE].[Large].
[Nancy Davolio]})
returns 88,905,997 (the sum of the measure for the two members).
● [Sales Hierarchy]&[Customer_Type].[ENTERPRISE].[Large].[Nancy Davolio]:[Sales
Hierarchy]&[Customer_Type].[ENTERPRISE].[Large].[Andrew Smith] refers to the [Nancy
Davolio], [Janet Leverling] and [Andrew Smith] members.
● Sum([Order Amount];{[Sales Hierarchy]&[Customer_Type].[ENTERPRISE].[Large].
[Nancy Davolio]:[Sales Hierarchy]&[Customer_Type].[ENTERPRISE].[Large].
[Andrew Smith]}) returns 113,905,997 (the sum of the measure for the three members in the
range).
● [Sales Hierarchy].children refers to all members in the [Sales Hierarchy] hierarchy.
● Sum([Order Amount];{Sales Hierarchy].children}) returns 277,290.434.
6.6.7 Building custom functions
6.6.7.1 Overview of calculation extensions
Calculation extensions are custom Web Intelligence reporting calculations that enhance the list of existing Web
Intelligence functions.
To use the Calculation Extension Library, create a C++ external library following a specic API.
SAP BusinessObjects Web Intelligence User's Guide
Analyzing data
P U B L I C 793

6.6.7.1.1 External functions
External functions are visible and usable like the other Web Intelligence standard functions. You can build a
formula with functions that implement your own logic.
Note
You can dene as many functions as you need. Only functions that use single value parameters are
supported. You can have a maximum of ve single value parameters.
To dene a function:
1. Declare in an XML le the description of the external function using a given XML structure.
2. Implement the function in a C++ library using a given API.
3. Copy the XML le and library to the appropriate folder in your Business Objects Enterprise installation
directory folder for the server and the desktop client.
4. Restart the system to automatically add the external function to the list of the functions available for
creating formulas.
The external function is based on a unique identier so that when it is used in a report, it cannot be
misinterpreted in case of using a dierent external library.
If the system cannot load a library or is missing information for an external function, has an inconsistent XML
declaration, missing library, or duplicated function, an error message appears. The system also writes errors in
the trace log.
Related Information
#EXTERNAL error message [page 804]
6.6.7.1.2 Deploying the custom functions
Deployment of custom functions requires a few manual steps. The BusinessObjects administrator must place
the XML le and related library DLL le in the library folder for the server, as well as on every machine where
desktop rich-client is installed.
Caution
Replacing or adding a library in the custom library folder can represent a threat to the system. Since the
library is automatically loaded, an external library can access internal critical data or processes, putting the
system in danger.
Make sure that the site administrator implements the appropriate security access to the related folder, so
that only authorized people access the custom library folder.
794
P U B L I C
SAP BusinessObjects Web Intelligence User's Guide
Analyzing data
6.6.7.1.3 The library declaration
The library le extensions are dierent depending on the operating system:
● DLL for Windows
● SO for Linux or UNIX
The le types are:
Type
Description
XML catalogs declaration There is only one le of this type, and it should be named
externalcatalogs.xml. This le contains the list of all XML function denition
les.
XML functions declaration This le denes a list of functions and their associated library and is listed in the XML
catalogs declaration le.
Note
The catalogs le can either contain or reference the function declaration libraries.
library le This le contains the code in C++ for the user functions.
The library le contains the user function implementation as dened in the XML func
tion declaration.
6.6.7.1.4 Using the Web Intelligence sample les
Prerequisites
Make sure to have the following applications installed:
● Visual Studio C++ VS2015 or higher
● Web Intelligence 4.1 or higher
Context
The examples in this document use the sample les in the Samples.zip le located in [Install
directory]\userlibs\WebI\Samples\.
SAP BusinessObjects Web Intelligence User's Guide
Analyzing data
P U B L I C 795
Procedure
1. Unzip Samples.zip.
2. To open the samples, launch OpenSolution.bat.
The OpenSolution.bat sets the temporary <WEBICALCPLUGINAPI> variable environment that is used
by the solution to nd Web Intelligence specic headers les.
Caution
If the required version of Web Intelligence is not installed, you cannot use the OpenSolution.bat. If
that is the case, manually set the <WEBICALCPLUGINAPI> variable environment to the path of the
folder that contains the Web Intelligence header les and open Samples\WebICalcPlugIn.
Related Information
Examples [page 803]
6.6.7.2 Dening a custom calculation
To customize a function within Web Intelligence:
1. Dene the XML function declaration
2. Dene the XML catalog declaration.
3. Implement the library in C++ using the specic API for external function.
4. Compile the source le.
5. Copy the XML denition and the library into the dedicated WebiCalcPlugin folder (server side and any
rich client).
6. Restart the Web Intelligence server.
Note
The chapter's examples use the sample les delivered with Web Intelligence.
The system automatically adds the function to the function list in the formula editor and formula bar contextual
help.
If a formula is using a function for which no external library is available, the #EXTERNAL error message appears.
Note
Only functions that use single value parameters are supported. Table parameters for instance aren't
supported.
796
P U B L I C
SAP BusinessObjects Web Intelligence User's Guide
Analyzing data
6.6.7.2.1 XML function objects
The XML denition contains objects which dene the custom function. XML custom functions extend the
function list of the formula language so that a formula using this function can be parsed according its XML
signature and turn into a tokenized form. You assign the external function a global unique ID (GUID) so that it
cannot be reused or confused with other custom libraries.
The XML denition contains the following objects:
Tag
XML attribute XML denition object
<CATALOG>
The XML root
<LIBRARY>
le The name of the library le that contains the C++ implementation
code
The library le can contain several functions. The library extension
should not be specied.
<FUNCTION>
guid The unique function GUID
Tip
Dene all GUIDs in advance and make sure that all GUIDs are
unique from a global point of view.
For Windows you can use the GUID tool provided with Visual Studio or
download it from the Microsoft website. For Linux, the tool
usr/bin/uuidgen can be found in the libuuid1 (Debian) pack
age.
name The function name that appears in the formula editor
The function name must:
● be a simple, unique name for the function
● start with a letter
● use lower and upper case letters, number characters, or the _
character
● not already exist in the Web Intelligence library
Note
The name will not be translated to another language.
<ARGLIST>
The list of parameters
The number of parameters should be lower than or equal to ve.
SAP BusinessObjects Web Intelligence User's Guide
Analyzing data
P U B L I C 797
Tag XML attribute XML denition object
<ARG>
type The parameter types
The possible parameter types are as follows:
● Numeric
● Boolean
● Date
● String
name The name of each parameter as it should appear in the Formula Editor
The name shows the prototype of the method to the user. Use only al
phanumeric characters.
<RETURN>
type The return values type
Return values can be:
● Numeric
● Boolean
● Date
● String
<CATEGORY>
type The category in which the function will appear in the Formula Editor
Be consistent; place strings in the Character category and Numbers
in the Numeric category. The available categories are:
● Character
● Date
● Document
● DP
● Misc
● Logical
● Num
<HINT>
value A hint to appear in the Formula Editor
The hint explains the use of the function.
6.6.7.2.2 Dening the XML function declaration
Context
The XML for the signature uses the following structure:
Function_list
798
P U B L I C
SAP BusinessObjects Web Intelligence User's Guide
Analyzing data
The XML for the signature uses the following structure:
Function_list := [Function*]
Function := [name, GUID, data_type = Numeric|Boolean|Date|
String, category = character|Date|Document|DP|Misc|Logical|Num,
parameter_list, (online_help_signature?),
(online_help_description?),library_name)]
parameter_list := [parameter*]
parameter := [name, data_type =Numeric|Boolean|Date|String]
Procedure
1. Set the XML root tag to CATALOG.
2. To the CATALOG add LIBRARY tags.
3. To the LIBRARY add the name of the library le without the DLL or SO le extension. This is the le
attribute.
4. To the LIBRARY add FUNCTION tags.
A FUNCTION tag should have a unique GUID and an additional, unique attribute name which denes the
name of the function.
The FUNCTION tag should contain:
○ a ARGLIST tag with ARG tags. The ARG tags should have a rst attribute type that denes the type of
this parameter, and a second attribute that denes the name of this parameter.
The ARG type can be Boolean, Numeric, Date, or String. The ARG name contains only alphanumeric
characters.
Note
You are limited to ve parameters.
○ a RETURN tag which denes a type attribute.
The RETURN type can be Boolean, Numeric, Date, or String.
○ a CATEGORY tag which denes a type attribute.
The CATEGORY type can be Character, Date, Document, DP, Misc, Logical, or Num.
○ a HINT tag which denes a value attribute.
5. Place the XML denition into the dedicated folder (server side and any rich client).
Example
SampleMath.xml
<CATALOG>
<LIBRARY file="SampleMath">
<FUNCTION guid="CC3E9742-67A7-4844-9DBF-2CCD4F6ECABE" name="MySquareFct">
<ARGLIST>
<ARG type="Numeric" name="input_number"/>
</ARGLIST>
<RETURN type="Numeric"/>
<CATEGORY type="Num"/>
<HINT value="My square function."/>
</FUNCTION>
</LIBRARY>
SAP BusinessObjects Web Intelligence User's Guide
Analyzing data
P U B L I C 799

</CATALOG>
Related Information
Using the Web Intelligence sample les [page 795]
6.6.7.2.3 Dening the XML catalog declaration
Context
You can create the XML catalog declaration or add it to an existing catalogs declaration.
<CATALOG> references an XML function declaration le or directly dene the <CATALOG> as is shown in the
section which denes an XML functions declaration format.
To create a catalog declaration:
Procedure
1. Name the declaration externalcatalogs.xml.
2. Set the XML root tag to CATALOGS.
3. To the CATALOGS add CATALOG tags.
This action denes the le name value of the XML functions declarations.
4. Place the XML library into the dedicated folder (server side and any rich client).
Example
externalcatalogs.xml
<CATALOGS>
<CATALOG file="SampleMath.xml"/>
</CATALOGS>
Related Information
Using the Web Intelligence sample les [page 795]
800
P U B L I C
SAP BusinessObjects Web Intelligence User's Guide
Analyzing data

6.6.7.2.4 Implementing the C++ le
Procedure
1. In the le, add the ibovariant.h header.
2. For each method, start the declaration with the BO_DECLARE_USER_FCT macro.
The macro includes:
○ the function name as it appears in the XML functions declaration le.
○ the return value object name
○ the parameter object name
Note
The function returns a BONOERROR if everything is okay, otherwise the #EXTERNAL error message
appears into the report.
Example
Square.cpp
// Headers file include of the WebI hearders
#include <ibovariant.h>
// To not repeat BOExtFunct::
using namespace BOExtFunct;
BO_DECLARE_USER_FCT (// Name of function as it was defined in the XML.
MySquareFct,
// Name of the return value object.
retVal,
// Name of the parameters object.
parameters
)
{
try // Always used a try{}catch(…) to be sure no
// exception was thrown outside this Web
// Intelligence user function.
{
// Get the first parameter.
const iBOValue¶m0 = parameters[0];
// Transform the parameter to the correct type.
double valPar0(param0);
// Assign value to the return value.
retVal = valPar0 * valPar0;
}
catch(...)
{
return BOERROR; // Unkonwn exception so notify WebI
}
return BONOERROR; // It's OK
}
Related Information
Using the Web Intelligence sample les [page 795]
SAP BusinessObjects Web Intelligence User's Guide
Analyzing data
P U B L I C 801
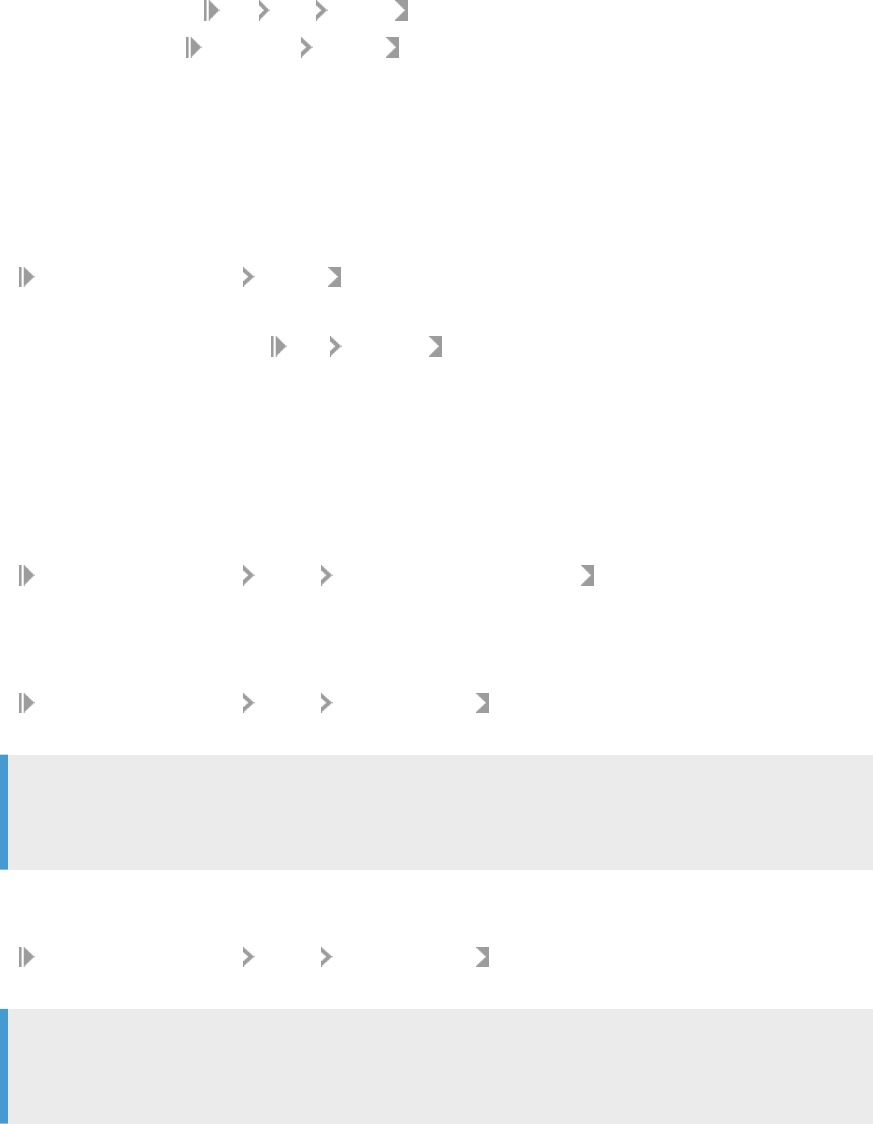
6.6.7.2.5 Compiling the source le in Microsoft Visual
Studio 2015
Procedure
1. To create a project, go to File New Project .
2. In Project types, select Visual C++ General .
3. In Templates, select Empty Project.
4. Specify the name of the project.
5. Specify the destination folder for the project.
6. Click OK.
7. Right-click the project and select Properties.
8. In Conguration, select All congurations.
9. In Conguration Properties General set Conguration Type to Dynamic Library (.dll).
10. Click OK.
11. Right-click the project and select Add New Item .
12. In Category, select Code.
13. In Template, select C++ File (.CPP) .
14. Specify the name of the CPP le.
15. Click Add.
16. Right-click the project and select Properties.
17. In Conguration, select All congurations.
18. In Conguration Properties C/C++ Additional Include Directories , add the folder which contains
the Business Objects le headers.
19. Click Apply.
20.In Conguration, select Debug.
21. In Conguration Properties C/C++ Code generation , set Runtime Library to Multi-threaded DLL (/
MD).
Note
If you are running a machine where Microsoft Visual Studio is installed, you can use Multi-threaded
Debug DLL (/MDd)
instead of Multi-threaded DLL (/MD) to benet from its debug environment.
22.Click Apply.
23. In Conguration, select Release.
24. In Conguration Properties C/C++ Code generation set Runtime Library to Multi-threaded DLL (/
MD) .
Note
If you are running a machine where Microsoft Visual Studio is installed, you can use Multi-threaded
Debug DLL (/MDd) instead of Multi-threaded DLL (/MD) to benet from its debug environment.
802
P U B L I C
SAP BusinessObjects Web Intelligence User's Guide
Analyzing data

25.Click OK.
26.Add the code to the CPP le.
27. Compile.
6.6.7.2.6 Copying les into WebiCalcPlugin
Procedure
Copy the XML functions declaration, the XML catalogs declaration, and the DLL/SO le into the
WebiCalcPlugIn folder.
The folder is available in:
[installation directory]\[BusinessObjects Version]\[OS]_[PLATFORM]\WebiCalcPlugIn
Where: [BusinessObjects Version] is the version of the product, for example BusinessObjects Enterprise XI 4.0,
and [OS] is the operating system, for example win32 for Windows Operating System or linux for Linux
Operating System, and [PLATEFORM] is the platform, for example x86 on an Intel 32-bit CPU.
6.6.7.3 Examples
The examples use the sample les in the Samples.zip le, which is located in [Install directory]
\userlibs\WebI\Samples\
.
Example
XML catalog declaration for the externalcatalogs.xml
<CATALOGS>
<CATALOG file="SampleString.xml"/>
</CATALOGS>
Example
XML function declaration in SampleString.xml
<CATALOG>
<LIBRARY file="SampleString">
<FUNCTION guid="A91BD526-B8EB-4b09-90F2-FFCD350776A8" name="MyHelloWorld">
<RETURN type="String"/>
<CATEGORY type="Num"/>
<HINT value="My simple hello world function."/>
</FUNCTION>
</LIBRARY>
</CATALOG>
SAP BusinessObjects Web Intelligence User's Guide
Analyzing data
P U B L I C 803

Example
C++ le declaration in HelloWorld.cpp
// Headers file include of the Web Intelligence hearders
#include <ibovariant.h>
// To not repeat BOExtFunct::
using namespace BOExtFunct;
BO_DECLARE_USER_FCT(
// Name of function as it was defined in the XML.
MyHelloWorld,
// Name of the return value object.
retVal
// Don't use parameter.
/*parameters*/
)
{
try // Always used a try{}catch(…) to be sure no
// exception was thrown outside this
// Web Intelligence user function.
{
// Create an std::wstring with wide char Hello world.
std::wstring helloWorldStr = L"Hello world!!!";
// Initialyse the return value.
retVal = helloWorldStr;
}
catch(...)
{
// Unkonwn exception so notify Web Intelligence
return BOERROR;
}
return BONOERROR; // It’s OK
}
Related Information
Using the Web Intelligence sample les [page 795]
6.6.7.4 #EXTERNAL error message
The #EXTERNAL error message is caused by the following problems:
● A formula refers to an external function that is not in the external library folder.
● A document contains an external method and the system cannot load it. The library le is not found, or
there is an inconsistent declaration.
● An external method does not initialize the return value.
● An external method initialized the return type with bad type. For example, a double was set to a string.
● An external method returns an error code.
Ask the BusinessObjects administrator to deploy the correct library that implements this function.
804
P U B L I C
SAP BusinessObjects Web Intelligence User's Guide
Analyzing data

6.6.7.5 Trace log message errors
If an error appears during XML parsing/validation, a message appears to the user and errors are created in the
trace logs.
Log type
Error messages
XML logs File cannot be read or is missing.
Bad XML structure due to:
● Parent/Children relation invalid.
● Missing eld (ID function, name function).
● Invalid eld value.
DLL logs File is missing.
DLL cannot be loaded.
Function is not found in the DLL.
Function logs Function name is already in use.
Function ID is already used.
Function name is missing.
Return type is invalid.
ID is invalid.
Number of parameters is invalid.
Parameters logs Parameter name is missing.
Parameter type is invalid.
Runtime logs The user function does not initialize the return value.
The user function initializes the return value with a bad type.
The user function returns the BOERROR error code.
6.6.8 Troubleshooting formulas
6.6.8.1 Automatic rewrite formula mechanism
The succession of corrective maintenance releases for Web Intelligence can sometimes lead to calculation
result dierences between versions.
Since version 4.1 SP3, Web Intelligence provides an Automatic Formula Rewrite mechanism that automatically
modies a selection of formulas (see list below) in a document migrated from a previous version. These
formulas follow a certain pattern. After modication, the formulas return the same result than before the
SAP BusinessObjects Web Intelligence User's Guide
Analyzing data
P U B L I C 805
calculation change. Therefore, it is recommended to save the document so that the modications are stored in
the document, thus completing the formula rewrite mechanism.
The Automatic Formula Rewrite mechanism is available by default for documents migrated to BI 4.1 SP3 and
later, for the following formula patterns:
1. Where() operator with a dimension as parameter in a condition,
2. Running calculations with reset in sections,
3. Running calculations with reset in cross-tables.
This list of rules could be extended in future releases with more formula patterns.
Rule(1)
In previous versions, the data was calculated in a specic way if you had a Where() operator with a dimension
as a parameter in a condition. Indeed, the dimension was added to the measure context. Rule(1) reproduces
the former behavior.
This rules applies to every document migrated from XI 3.1 FP3.6, XI 3.1 FP4.1, XI 3.1 FP5.1 and. 4.0 SP5.
Rule(2)
In previous versions, running calculations in sections was not properly executed, as calculations would reset at
each section instance. Rule(2) reproduces the former behavior.
This rules applies to every document migrated from XI R2 SP4.
Rule(3)
In previous versions, running calculations with reset cross-tables meant that calculations were executed in an
“N” pattern (column after column) instead of a “Z” pattern (row after row).
Rule(3) introduced a FORCE_COL keyword that forces Web Intelligence to run calculations in a “N” pattern.
For example, with Rule(3), the RunningSum([Sales revenue];([State])) formula will be forced to execute
column after column when modied as RunningSum([Sales revenue];FORCE_COL;([State])).
This rule applies to every document migrated from every version of XI 3.x, 4.0 Patch 2.20, 4.0 SP5, 4.0 SP6, 4.0
SP7, 4.1 and 4.1 SP1.
806
P U B L I C
SAP BusinessObjects Web Intelligence User's Guide
Analyzing data

6.6.8.2 Formula error and information messages
You can format report data that returns error messages using conditional formatting.
In some cases a formula cannot return a value and returns an error or information message beginning with '#".
The message appears in the cell in which the formula is placed.
6.6.8.2.1 #COMPUTATION
#COMPUTATION occurs when a slicing dimension specied in the RelativeValue function is no longer
available in the calculation context of the block where the function is placed.
#COMPUTATION also occurs when a merged object containing a hierarchy is included in a report.
#COMPUTATION is also related to the misuse of context operators in a formula.
Related Information
RelativeValue [page 764]
6.6.8.2.2 #CONTEXT
#CONTEXT appears in a measure when the measure has a non-existent calculation context.
#CONTEXT is related to the #INCOMPATIBLE and #DATASYNC error messages, which appear in dimensions
when a block contains a non-existent calculation context.
In the case of #INCOMPATIBLE the context is non-existent because the dimensions are incompatible; in the
case of #DATASYNC the context is non-existent because the dimensions are from multiple unsynchronized
data providers.
Example
Non-existent calculation context in a query
If a block based on the Island Resorts Marketing universe contains the Reservation Year and Revenue
objects, the #CONTEXT error message appears because it is not possible to aggregate revenue by
reservation year. (Reservations have not yet generated any revenue.)
SAP BusinessObjects Web Intelligence User's Guide
Analyzing data
P U B L I C 807

6.6.8.2.3 #DATASYNC
#DATASYNC occurs when you place a dimension from a dierent data provider in a block containing
dimensions from another data provider, and the two data providers are not synchronized through a merged
dimension.
#DATASYNC appears in all dimensions in the block and #CONTEXT in the measures.
Example
Dimensions from dierent data providers in a block
If a report based on the Island Resorts Marketing universe contains data providers with the objects (Year,
Revenue) and (Quarter), a block containing Year, Quarter and Revenue displays #DATASYNC in the Year and
Quarter columns because the two data providers are not synchronized through a merged dimension.
6.6.8.2.4 #DIV/0
#DIV/0 occurs when a formula tries to divide a number by zero, which is mathematically impossible.
Zero can never appear as a divisor.
Example
Determining revenue per item
You have a report showing sales revenues, numbers of items sold and the revenue per item (which is
calculated by dividing the sales revenue by the number of items sold).
You had a very bad quarter in which you didn’t create any revenue; the Revenue per Item column returns
#DIV/0 for this quarter, because the formula is attempting to divide by zero; that is, divide the revenue by
zero number of items sold.
6.6.8.2.5 #ERROR
#ERROR is the default error message that covers all errors not covered by other error messages.
6.6.8.2.6 #EXTERNAL
#EXTERNAL occurs when a formula references an external function that is not available to use in Web
Intelligence.
808
P U B L I C
SAP BusinessObjects Web Intelligence User's Guide
Analyzing data
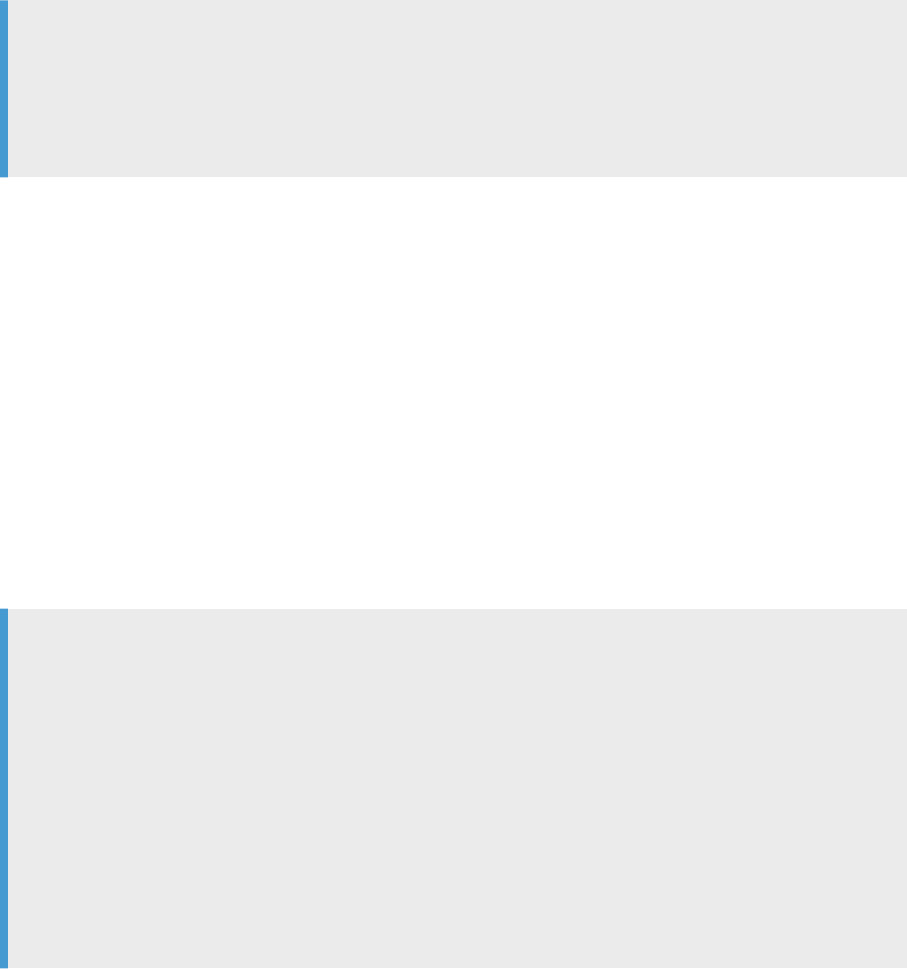
6.6.8.2.7 #INCOMPATIBLE
#INCOMPATIBLE occurs when a block contains incompatible objects.
Example
Incompatible objects in a query
If a block based on the Island Resorts Marketing universe contains the Year and Reservation Year
dimensions, the columns containing these dimensions show #INCOMPATIBLE because these objects are
incompatible.
6.6.8.2.8 #MIX
#MIX occurs when an aggregated measure has dierent units.
For example, a cell shows #MIX if it aggregates currency values denominated in dierent currencies.
6.6.8.2.9 #MULTIVALUE
#MULTIVALUE occurs when you place a formula that returns more than one value in a cell that outputs one
value only.
Example
Multivalue in a cell
You have a report showing Country, Resort and Revenue and you add a cell to the report containing the
formula [Revenue] ForEach ([Country]). This cell returns #MULTIVALUE because Country has two values in
the report: ‘US’ and ‘France’.
One cell cannot display the revenues for both the US and France. Placed outside the table, a cell containing
revenue can only aggregate the revenues in the table in some way (for example by summing or averaging
them).
If the report is broken into sections on Country, the formula is correct when placed in a section because
there is only one value of Country per section. Outside a section, however, the formula still returns
#MULTIVALUE
6.6.8.2.10 #N/A
When there is a value for a cell in report that is based on a value from a report that is not available on the
underlying data base (for example, a BW error in a BEx Cell), the cell displays #N/A (not available), meaning
that the cell is empty because the data cannot be retrieved.
SAP BusinessObjects Web Intelligence User's Guide
Analyzing data
P U B L I C 809

6.6.8.2.11 #OVERFLOW
#OVERFLOW occurs when a calculation returns a value that is too large for the software to handle.
This value, in exponential form, is 1.7E308 (1.7 followed by 307 zeros).
6.6.8.2.12 #PARTIALRESULT
#PARTIALRESULT occurs when all rows associated with a report object were not retrieved.
If #PARTIALRESULT occurs often in your reports and you have the appropriate security rights, modify the
MaxRowsRetrieved query property to allow the retrieval of more data. If you do not have the right to modify
the query, contact the BI administrator.
If your report contains smart measures it is more likely to display #PARTIALRESULT because smart measures
require the retrieval of larger amounts of data than classic measures.
6.6.8.2.13 #RANK
#RANK occurs when you try to rank data based on an object that depends on the order of values.
Objects that use the Previous function or any running aggregate function depend on the order of values.
Ranking causes these objects to recalculate their values, which then changes the ranking, resulting in a circular
dependency. Such a dependency can occur either when you use the Rank dialog box to create a ranking, or
when you use the Rank function.
Example
Ranking on running average or previous values
If you attempt to rank a block on a column that contains the Previous function or any running aggregate
function, the entire block returns #RANK.
6.6.8.2.14 #RECURSIVE
#RECURSIVE occurs when it is not possible to perform a calculation due to a circular dependency.
Example
Using the NumberOfPages() function
If you place the NumberOfPages function in a cell whose Autot Height or Autot Width properties are set,
the cell returns #RECURSIVE because the placing of this formula in an Autot cell creates a circular
dependency. The function needs the exact size of the report to return a value, but the size of the cell, which
aects the size of the report, is determined by the cell content.
810
P U B L I C
SAP BusinessObjects Web Intelligence User's Guide
Analyzing data

6.6.8.2.15 #REFRESH
#REFRESH appears in report cells whose values are derived from objects that were stripped from a query and
then re-added to the query.
Objects are stripped from a query when the Enable query stripping query property is selected and the objects
do not contribute to any reports based on the query.
The cells are re-populated with values from the objects when the query is refreshed.
6.6.8.2.16 #SECURITY
#SECURITY occurs when you attempt to use a function for which you do not have security rights.
Example
Using the DataProviderSQL() function
If a user who does not have the right to view data provider SQL places the DataProviderSQL() function in a
cell, the #SECURITY message appears in the cell.
6.6.8.2.17 #SYNTAX
#SYNTAX occurs when a formula references an object that no longer exists in the report.
Example
Referencing a non-existent object
You have a report that originally showed Year, Quarter and Sales revenue, with an additional column
showing dierence between the revenue and the average yearly revenue. This gure is given by the variable
Dierence from Yearly Average.
If the Dierence from Yearly Average variable is deleted from the report, the column containing it returns
#SYNTAX.
6.6.8.2.18 #TOREFRESH
#TOREFRESH appears in cells based on smart measures when the value returned by the smart measure is not
available.
This situation occurs when the grouping set containing the value is not available in the data provider.
You remove the #TOREFRESH error by refreshing the data.
Some of the measures are “delegated” (for BW, this refers to a measure which is not aggregating with SUM);
when you dene a table or calculation on a measure, this measure is queried in specic context of aggregation
SAP BusinessObjects Web Intelligence User's Guide
Analyzing data
P U B L I C 811
(the measure is given for a set of dimensions). If this set of dimensions is a subset of the query dimension set,
the measure has to be aggregated along the given dimension set (or grouping set that is referring to a group by
clause in SQL).
For normal measures the system is carrying out the aggregation, for delegated measures this aggregation is
delegated to the underlying database. For this the system needs to query again this database. Since this is not
automatic, it displays #TOREFRESH and waits for the user to proceed with a refresh. Once the user refreshes,
the system will run the additional query to get the requested aggregation and then replace #TOREFRESH by
the appropriate value.
6.6.8.2.19 #UNAVAILABLE
#UNAVAILABLE appears when it is not possible to calculate the value of a smart measure.
This occurs when it is not possible to display the values in a ltered smart measure without applying a lter to
the query. Because this carries a risk of impacting other reports based on the same query, no lter is applied.
6.6.9 Comparing values using functions
6.6.9.1 Comparing values using the Previous function
The Previous function returns a comparative previous value of an expression.
The value returned depends on the layout of the report.
For more powerful comparison capabilities, use the RelativeValue function. RelativeValue returns a
previous or subsequent comparative value of an expression. The value returned does not depend on the layout
of the report.
Related Information
Previous [page 760]
RelativeValue [page 764]
Comparing values using the RelativeValue function [page 812]
6.6.9.2 Comparing values using the RelativeValue function
The RelativeValue function returns comparative values of an expression. The function returns these values
independently of the layout of a report.
When using RelativeValue, you specify the following:
812
P U B L I C
SAP BusinessObjects Web Intelligence User's Guide
Analyzing data
● The expression whose comparative value you want to nd (the expression must be a measure or a detail of
a dimension available in the block)
● The list of slicing dimensions
● The oset.
The function uses the slicing dimensions, the oset, and the sub-axis dimensions (which are implied by the
slicing dimensions) to return a comparative value. The sub-axis dimensions are all the other dimensions in the
calculation context apart from the slicing dimensions.
Expressed in general terms, RelativeValue returns the value of the expression in the row which, in the list of
values of the slicing dimensions, is offset rows removed from the current row, and where the values of the
sub-axis dimensions are the same as in the current row.
Note
All slicing dimensions must always be in the calculation context of the block in which the function is placed.
If a slicing dimension is subsequently removed, the function returns #COMPUTATION.
Example
In this example, the RelativeValue column contains the following formula:
RelativeValue([Revenue];([Year]);-1)
● The expression is [Revenue];
● The slicing dimension is [Year];
● The oset is -1 (the function returns the immediately previous value in the list).
Year Quarter Sales Person Revenue RelativeValue
2007 Q1 Smith 1000
2007 Q2 Jones 2000
2007 Q3 Wilson 1500
2007 Q4 Harris 3000
2008 Q1 Smith 4000 1000
2008 Q2 Jones 3400 2000
2008 Q3 Wilson 2000 1500
2008 Q4 Harris 1700 3000
Expressed as a business question, the formula returns the revenue generated by the same sales person in
the same quarter in the previous year.
Expressed as a calculation in words, the formula returns the value of [Revenue] (the expression) in the row
where the value of [Year] (the slicing dimension) is the previous value from the list of values of the [Year]
object, and where the values of [Quarter] and [Sales Person] (the sub-axis dimensions) are the same as in
the current row.
SAP BusinessObjects Web Intelligence User's Guide
Analyzing data
P U B L I C 813

Related Information
RelativeValue [page 764]
6.6.9.2.1 Slicing dimensions and the RelativeValue function
The RelativeValue function uses the list of values of the slicing dimensions to nd the comparative row.
The function returns the comparative value of the expression specied in the function that is offset number
of rows away in the list of slicing dimensions.
As a result, the sort order of the slicing dimensions is crucial in determining the function output.
Example
Multiple slicing dimensions
In the table below, the RelativeValue column has the following formula:
RelativeValue([Revenue];([Year];[Quarter]);-1)
● The expression is [Revenue];
● The slicing dimensions are ([Year];[Quarter]);
● The oset is -1 (the function returns the immediately previous value in the list).
Year Quarter Sales Person Revenue RelativeValue
2007 Q1 Smith 1000
2007 Q2 Smith 2000
2007 Q3 Smith 1500
2007 Q4 Smith 3000*
2007 Q1 Jones 4000
2007 Q2 Jones 3400
2007 Q3 Jones 2000
2007 Q4 Jones 1700
2008 Q1 Smith 5000** 3000*
2008 Q2 Smith 3000*** 5000**
2008 Q3 Smith 2700**** 3000***
2008 Q4 Smith 6800 2700****
Expressed as a business question, the formula returns the revenue generated by the same sales person in
the previous quarter.
Expressed as a calculation in words, the formula returns the value of [Revenue] in the row where the values
of [Year] and [Quarter] represent the previous value in the ([Year];[Quarter]) list of values, and where the
value of [Sales Person] is the same as in the current row.
The function uses the list of values of the slicing dimensions to nd the comparative revenue:
814
P U B L I C
SAP BusinessObjects Web Intelligence User's Guide
Analyzing data
Year Quarter
2007 Q1
2007 Q2
2007 Q3
2007 Q4 *
2008 Q1 **
2008 Q2 ***
2008 Q3 ****
2008 Q4
The sort order of the slicing dimensions determines the output of the function. The * in the tables show the
sort order.
Related Information
RelativeValue [page 764]
6.6.9.2.2 Slicing dimensions and sections
A slicing dimension can be in the section master cell of a report.
Example
Slicing dimension in a section header
In the table below, the RelativeValue column has the following formula:
RelativeValue([Revenue];([Year];[Quarter]);-1)
2007
Quarter Sales Person Revenue RelativeValue
Q1 Smith 1000
Q2 Smith 2000
Q3 Smith 1500
Q4 Smith 3000*
Q1 Jones 4000
Q2 Jones 3400
Q3 Jones 2000
SAP BusinessObjects Web Intelligence User's Guide
Analyzing data
P U B L I C 815
Quarter Sales Person Revenue RelativeValue
Q4 Jones 1700
2008
Quarter Sales Person Revenue RelativeValue
Q1 Smith 5000** 3000*
Q2 Smith 3000*** 5000**
Q3 Smith 2700 **** 3000***
Q4 Smith 6800 2700****
The function uses the list of values of the slicing dimensions to nd the comparative revenue:
Year Quarter
2007 Q1
2007 Q2
2007 Q3
2007 Q4 *
2008 Q1 **
2008 Q2 ***
2008 Q3 ****
2008 Q4
The sort order of the slicing dimensions determines the output of the function. The * in the tables show the
sort order.
Related Information
RelativeValue [page 764]
6.6.9.2.3 Order of slicing dimensions
Because the sort order of the list of values of the slicing dimensions determines the output of
RelativeValue, the order in which the slicing dimensions are specied impacts the output of the function.
Example
Order of slicing dimensions
In the table below, the RelativeValue column has the following formula:
RelativeValue([Revenue];([Year];[Quarter]);-1)
816
P U B L I C
SAP BusinessObjects Web Intelligence User's Guide
Analyzing data
Year Quarter Sales Person Revenue RelativeValue
2007 Q1 Smith 1000
2007 Q2 Smith 2000
2007 Q3 Smith 1500
2007 Q4 Smith 3000*
2007 Q1 Jones 4000
2007 Q2 Jones 3400
2007 Q3 Jones 2000
2007 Q4 Jones 1700
2008 Q1 Smith 5000** 3000*
2008 Q2 Smith 3000*** 5000**
2008 Q3 Smith 2700**** 3000***
2008 Q4 Smith 6800 2700****
Expressed as a business question, the formula returns the revenue generated by the same sales person in
the previous quarter.
The sort order of the slicing dimensions is as follows:
Year Quarter
2007 Q1
2007 Q2
2007 Q3
2007 Q4 *
2008 Q1 **
2008 Q2 ***
2008 Q3 ****
2008 Q4
The function is changed to:
RelativeValue([Revenue];([Quarter];[Year]);-1)
The sort order of the slicing dimensions becomes:
Quarter Year
Q1 2007 *
Q1 2008 **
Q2 2007 ***
Q2 2008 ****
Q3 2007 *****
SAP BusinessObjects Web Intelligence User's Guide
Analyzing data
P U B L I C 817
Quarter Year
Q3 2008 ******
Q4 2007 *******
Q4 2008 ********
The sort order has the following impact on the function result:
Year Quarter Sales Person Revenue RelativeValue
2007 Q1 Smith 1000*
2007 Q2 Smith 2000***
2007 Q3 Smith 1500*****
2007 Q4 Smith 3000*******
2007 Q1 Jones 4000
2007 Q2 Jones 3400
2007 Q3 Jones 2000
2007 Q4 Jones 1700
2008 Q1 Smith 5000** 1000*
2008 Q2 Smith 3000**** 2000***
2008 Q3 Smith 2700****** 1500*****
2008 Q4 Smith 6800******** 3000*******
Expressed as a business question, the formula now returns the revenue generated by the same sales
person in the same quarter of the previous year.
The change in the sort order of the slicing dimension changes the meaning of the formula. The * in the
tables indicate the sort order.
Related Information
RelativeValue [page 764]
818
P U B L I C
SAP BusinessObjects Web Intelligence User's Guide
Analyzing data

6.6.9.2.4 Slicing dimensions and sorts
Because the sort order of the list of values of the slicing dimensions determines the function output, a sort
applied to any dimension in the slicing dimensions impacts the function output.
Example
A custom sort applied to a slicing dimension
In the table below, the RelativeValue column has the following formula:
RelativeValue([Revenue];([Year];[Quarter]);-1)
A custom sort (Q1, Q2, Q4, Q3) is applied to [Quarter], giving the following result for the function:
Year Quarter Sales Person Revenue RelativeValue
2007 Q1 Smith 1000
2007 Q2 Smith 2000
2007 Q4 Smith 3000
2007 Q3 Smith 1500*
2007 Q1 Jones 4000
2007 Q2 Jones 3400
2007 Q4 Jones 1700
2007 Q3 Jones 2000
2008 Q1 Smith 5000** 1500*
2008 Q2 Smith 3000*** 5000**
2008 Q4 Smith 6800**** 3000***
2008 Q3 Smith 2700 6800****
The sorted list of slicing dimensions is as follows:
Year Quarter
2007 Q1
2007 Q2
2007 Q4
2007 Q3 *
2008 Q1 **
2008 Q2 ***
2008 Q4 ****
2008 Q3
The * in the tables show the sort order.
SAP BusinessObjects Web Intelligence User's Guide
Analyzing data
P U B L I C 819
Related Information
RelativeValue [page 764]
6.6.9.2.5 Using RelativeValue in crosstabs
The RelativeValue function works in crosstabs in exactly the same way as in vertical tables.
The layout of the data in a crosstab has no impact on the function output.
Related Information
RelativeValue [page 764]
820
P U B L I C
SAP BusinessObjects Web Intelligence User's Guide
Analyzing data
7 Scheduling and publishing documents
7.1 Introduction to scheduling and publishing
The following sections introduce you to the basic concepts and main functionalities of the scheduling and
publishing services oered by the Business Intelligence Platform.
With scheduling and publishing operations, you can send publications with the latest information and data.
Both services are about managing assets of your Central Management Server (CMS) such as Web Intelligence
documents. At the end of this guide, you will be able to schedule documents, publish them, and ne-tune both
processes along the way.
This guide focuses mainly on the scheduling and publishing possibilities oered by the Business Intelligence
Launch Pad. However, the Central Management Console (CMC) lets you schedule and publish documents as
well.
To know more about the scheduling and publishing abilities of the CMC, read the corresponding sections in the
Business Intelligence Platform CMC Help guide.
7.1.1 Scheduling and publishing concepts
7.1.1.1 Instances
An instance is a single version of a document. For each scheduled document that runs, the BI Platform saves a
history of instances to the default Enterprise server.
For each document, the list of instances is available in the History dialog box in the contextual menu when you
right-click it. The follwoing information are available:
● Instance time
● Title
● Status
● Created by
● Type
● Parameters
You can view discussions for an instance in the History dialog box or in the Collaboration drawer of the feed
panel, if the BI launch pad is integrated with SAP Jam or SAP StreamWork.
SAP BusinessObjects Web Intelligence User's Guide
Scheduling and publishing documents
P U B L I C 821
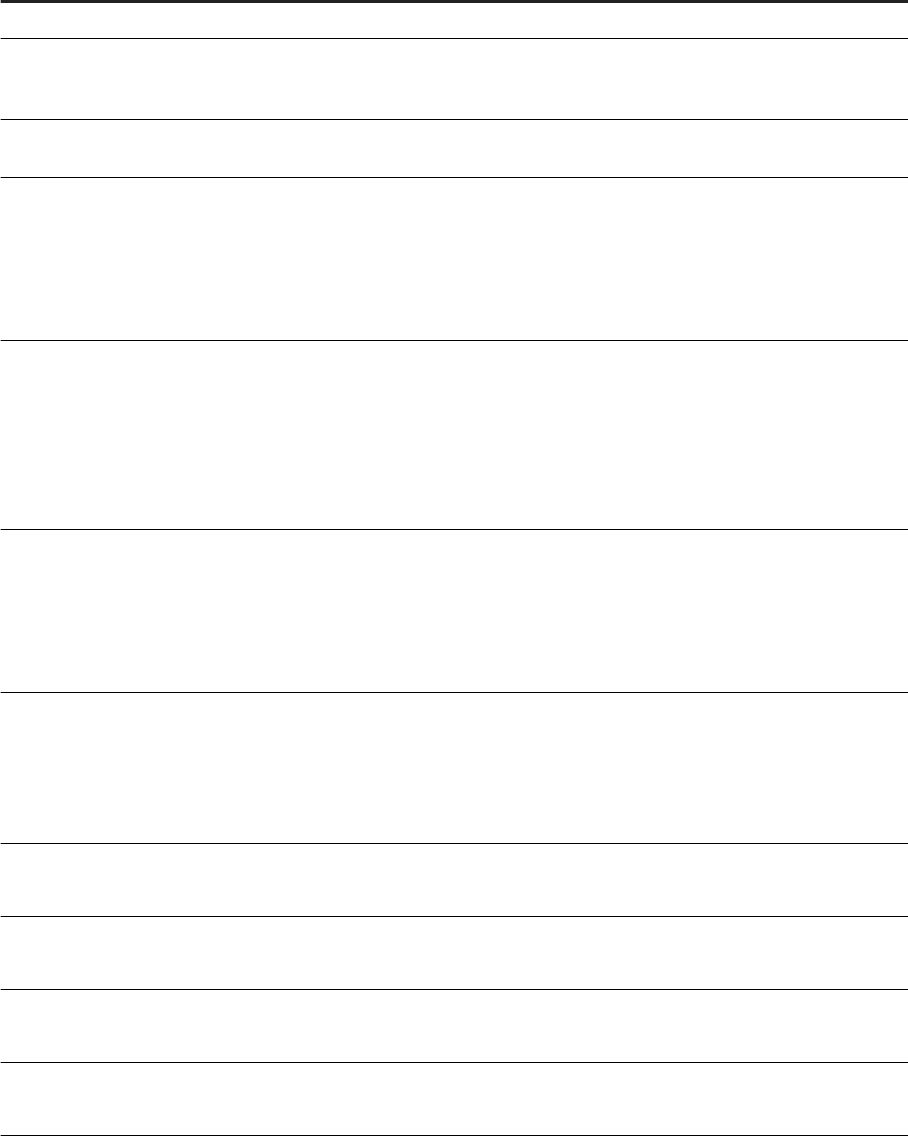
7.1.1.2 Recurrence
The recurrence pattern denes how often you want the BI Platform to run a document.
Option
Description
Now Runs the document once, immediately.
Once Runs the document once at a specied time. If you schedule
a document with events, it will run once if the event is trig
gered between the start and end times.
Hourly Creates an instance every N hours and X minutes between
the interval of dates you specify.
Daily
Runs the document once every N days between the interval
of dates you specify.
The rst instance will be created at the specied start time,
and instances will be created every N days at that time until
the document stops running at the specied end time.
Weekly
Runs the document each week on selected days between
the interval of dates you specify.
The rst instance will be created at the specied start time,
and instances will be created each week on those days at
that time until the document stops running at the specied
end time.
Monthly
Runs the document once every N months between the inter
val of dates you specify.
The rst instance will be created at the specied start time,
and instances will be created every N months at that time
until the document stops running at the specied end time.
Nth Day of Month
Creates an instance each month on the specied day, at the
specied start time. The rst instance will be created at the
specied start time, and instances will be created on the
specied day of each month at that time until the document
stops running at the specied end time.
1st Monday of Month
Creates an instance on the rst Monday of each month be
tween an interval of dates.
Last Day of Month
Creates an instance on the last day of each month between
an interval of dates.
X Day of Nth Week of the Month
Creates an instance each month on a specied day and week
at a specied start time between an interval of dates.
Calendar
Creates an instance on each calendar date you specify at a
specied start time.
822 P U B L I C
SAP BusinessObjects Web Intelligence User's Guide
Scheduling and publishing documents
7.1.1.3 Prompts
A prompt is a lter in the form of a question displayed by Web Intelligence that you answer by selecting specic
values.
When you answer a prompt, it determines the data displayed in a report. If you are working in sales for
example, and a prompt asks you to select a region, the document will only display data related to the region
you selected.
When a document is scheduled, prompts can have static values and are specied when creating the scheduling
job. For SAP Business Explorer (SAP BEx) queries, you can ll prompts dynamically using BW variables default
values. This mechanism supports any type of SAP Business Warehouse (SAP BW) default values including SAP
exit variables.
Note
To have dynamic prompt values in a scheduled document, make sure that:
● You select the Use BEx query dened default values at runtime option in the Variable Manager wizard.
● You purge document data using the Purge Last Selected Prompt Values option.
● You purge the prompt(s) value(s) when creating the scheduling job.
The way that options appear in the tab might dier from a document to another, depending on how you system
administrator has congured the prompts.
Note
If you cannot see the Prompts tab, that is beacause the document you are scheduling does not contain
prompts.
For BEx queries, you can modiy a prompt's value by clicking either Modify to edit a prompt value, Dynamic
Value to set a prompt value as dynamic value or Constant Value to set a prompt value as a constant value.
When setting a prompt value as a dynamic value, you delegate its processing to the SAP BW data source. As a
result, the SAP BW data source must be able to process the value provided for a prompt, otherwise the
document execution fails. SAP BW exit or customer exit variables for example are often used as dynamic
variables in prompts.
7.1.1.4 Formats
You can save an instance in dierent formats after the BI Platform generates it.
You can save an instance in the following formats:
● Web Intelligence: .WID
● Microsoft Excel: .XLSX
● Adobe Acrobat: .PDF
● Comma Separated Values (CSV): .CSV
● Plain text: .TXT
SAP BusinessObjects Web Intelligence User's Guide
Scheduling and publishing documents
P U B L I C 823

7.1.1.5 Caching
Each time the BI Platform runs a scheduled document, an instance is generated ans saved in the Output File
Repository System. You can select the format used to cache the document.
Before selecting a cache format, make sure that:
● A context is set in the Web Intelligence document. If there are multiple contexts, refresh the document with
the correct context before scheduling it
● Web Intelligence is selected as the output format for the document. If a dierent output format is selected,
cache options will have no eect.
Caution
If you do not select a cache format, the platform will not cache the document.
7.1.1.6 Events
Event-based scheduling and publishing provides you with additional control over scheduled documents and
publications. You can set up events so that documents are processed only after a specied event occurs.
To successfully schedule a document with an event, you need to create the event rst and then schedule the
document. After you have created the event, you can select it as a mandatory condition to trigger the
scheduling job. If and only if the event occurs, the BI Platform triggers the scheduling job.
You create events in the Central Management Console (CMC), and then select them in the BI launch pad when
you schedule documents. For more information on how to create event, refer to the dedicated sections of the
SAP BusinessObjects Business Intelligence Platform User Guide.
7.1.1.7 Scheduling server group
You can set the default server to run the scheduled document.
There are three available options regarding the server group:
● Use the rst available server: runs the document on the server with the most resources free at the time of
scheduling. This is the default selection.
● Give preference to servers belonging to the selected group: runs the document on servers in a particular
server group. If no servers in the selected server group are available, the document runs on the next
available server.
● Only use servers belonging to the selected group: runs the document only on servers in a particular server
group. If no servers in the selected server group are available, the document runs on the next available
server.
As a best practice, if your deployment of the BI Platform uses federation and you want to run the document at
the site where it is located, check the Run at origin site option.
824
P U B L I C
SAP BusinessObjects Web Intelligence User's Guide
Scheduling and publishing documents

7.1.1.8 Destinations
You can schedule a document instance to be sent to a specic destination.
The destinations available depend on which destinations your system administrator enabled and on your
access rights. If your administrator specied a destination for an object, that destination option is listed in the
Schedule dialog box. You may be able to set options for the destination or to select a dierent destination. For
most destinations, you must provide additional information.
Note
You can change options for the default Adaptive Job Server in the Servers area of the Central Management
Console (CMC). For more information, refer to SAP BusinessObjects Business Intelligence Platform
Administrator Guide.
Default Enterprise Location options
Option Description
Destination Default Enterprise Location
The scheduled job will run on the Output File Repository
Server (FRS). You do not need to set additional options for
this destination. Historical instances are saved to the default
Enterprise server but not to any other destination.
BI Inbox options
Option Description
Destination BI Inbox
Keep an instance in the
history
Saves a copy of this instance in the document's history. This option in enabled by default.
If you want the BI platform to automatically delete the instance from the Output FRS to minimize
the number of instances on the server, uncheck the option.
Use default settings Uses the default Adaptive Job Server values for BI Inboxes.
If you do not want to use the default Adaptive Job Server values, disable the option, and set the
destination recipient options that appear.
Available Recipients and
Selected Recipients
In the Available Recipients list, select users or user groups to send the instance to, and click > to
add the users or groups to the Selected Recipients list.
SAP BusinessObjects Web Intelligence User's Guide
Scheduling and publishing documents
P U B L I C 825
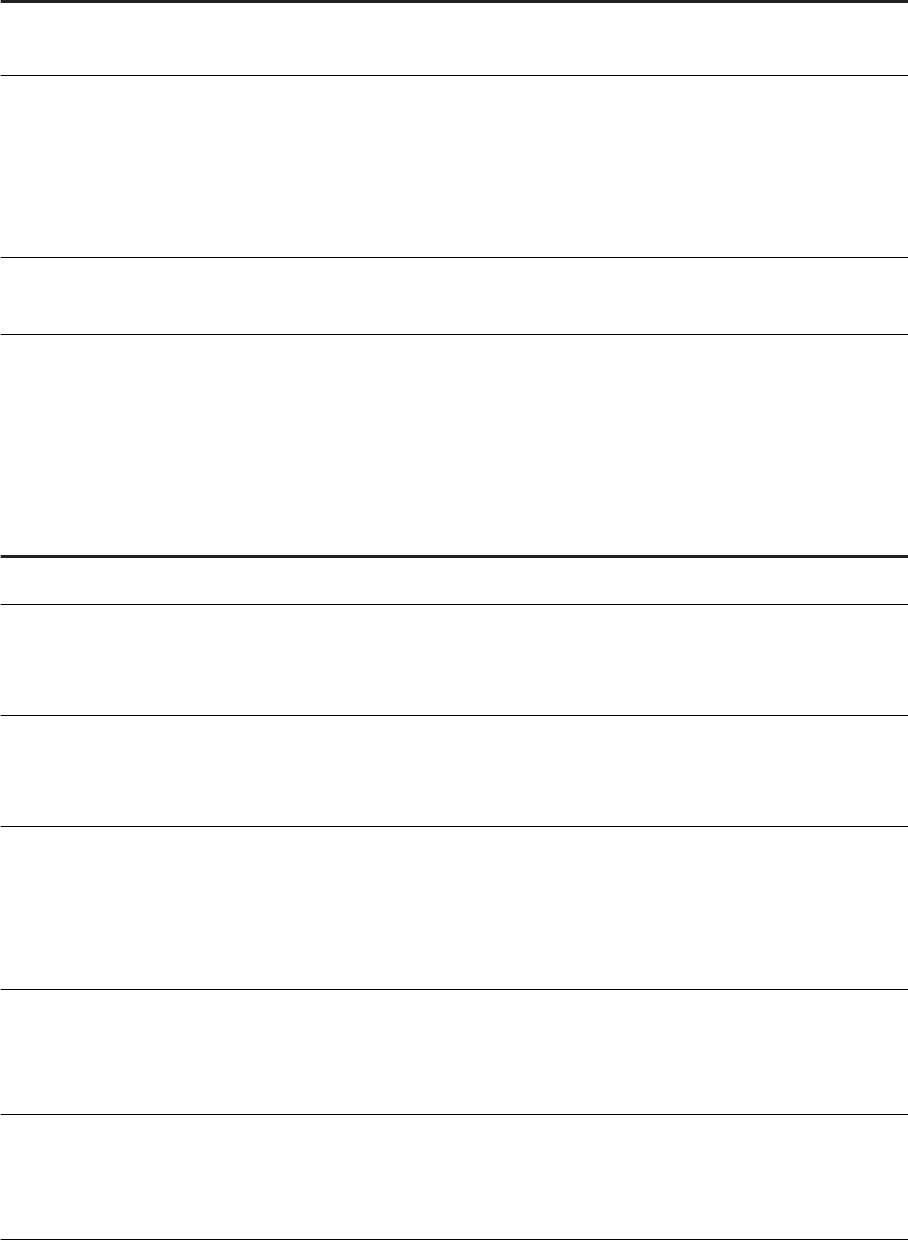
Option Description
Find title (if available) Enter a recipient's user name, full name, or email address in the Find title box to quickly locate the
user in the Available Recipients list.
Target Name ● To use a system-generated le name for the instance, select Use Automatically Generated
Name.
● To choose a le name for the instance, select Use Specic Name, and enter a name or select
variables for the le name from the Add placeholder list. You can select from several types of
variables: Title, ID, Owner, DateTime, (your) Email Address, and (your) User Full Name, and
File Extension.
Send As ● To send a shortcut to the instance to recipients, select Shortcut.
● To send a copy of the instance to recipients, select Copy.
Email options
Option Description
Destination Email
Keep an instance in the
history
Saves a copy of this instance in the document's history. This option in enabled by default.
If you want the BI platform to automatically delete the instance from the Output FRS to mini
mize the number of instances on the server, uncheck the option.
Use default settings Uses the default Adaptive Job Server values for emails.
If you do not want to use the default Adaptive Job Server values, disable the option, and set
the destination recipient options that appear.
From Enter a return email address, or select variables for the email address from the Add
placeholder list. You can select from several types of variables: Title, ID, Owner, DateTime,
(your) Email Address, and (your) User Full Name. Click a variable to add it. Separate email ad
dresses with a semicolon (;).
This option might be unavailable depending on your system conguration.
To Enter each email address that you want to send the instance to, or select variables for the
email address from the Add placeholder list. You can select from several types of variables:
Title, ID, Owner, DateTime, (your) Email Address, and (your) User Full Name. Click a variable
to add it. Separate email addresses with a semicolon (;).
Cc Enter each email address that you want to send a copy of the email and instance to, or select
variables for the email address from the Add placeholder list. You can select from several
types of variables: Title, ID, Owner, DateTime, (your) Email Address, and (your) User Full
Name. Click a variable to add it. Separate email addresses with a semicolon (;).
826 P U B L IC
SAP BusinessObjects Web Intelligence User's Guide
Scheduling and publishing documents
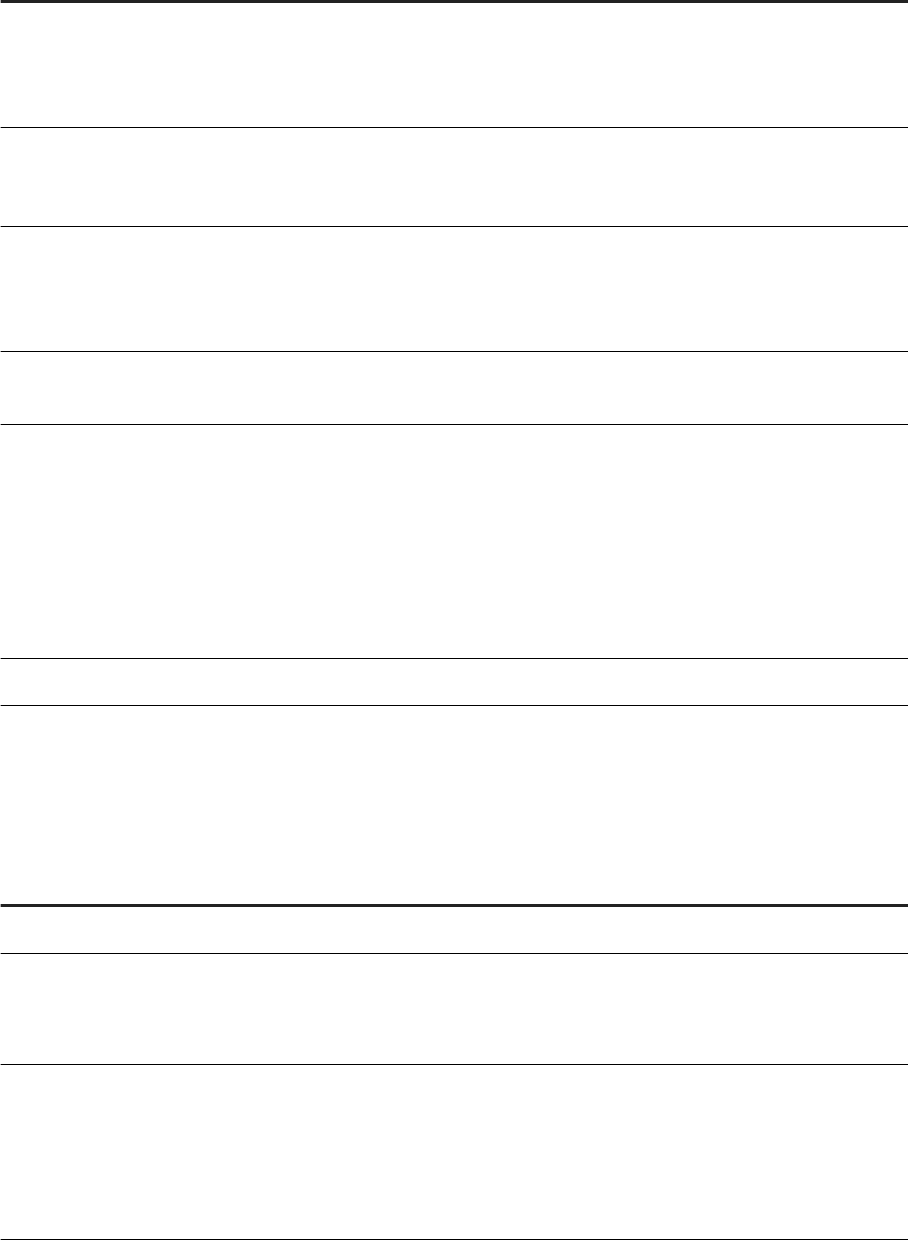
Option Description
Bcc Enter the email address of each undisclosed recipient, or select variables for the email ad
dress from the Add placeholder list.You can select from several types of variables: Title, ID,
Owner, DateTime, (your) Email Address, and (your) User Full Name. Click a variable to add it.
Separate email addresses with a semicolon (;).
Subject Enter the subject of the email, or select variables for the subject from the Add placeholder
list. You can select from several types of variables: Title, ID, Owner, DateTime, (your) Email
Address, and (your) User Full Name. Click a variable to add it.
Message Enter the message for the body of the email, or select variables for the message from the Add
placeholder list.You can select from several types of variables: Title, ID, Owner, DateTime,
(your) Email Address, (your) User Full Name, Viewer, and Document Name. Click a variable to
add it.
Add Attachment Select this check box if you want to add an attachment to the email message containing the
instance.
File Name ● To use a system-generated le name for the instance, check Use Automatically
Generated Name.
● To select the le name for the instance, check Use Specic Name, and enter a name or
select variables for the le name from the Add placeholder list. You can select from sev
eral types of variables: Title, ID, Owner, DateTime, (your) Email Address, (your) User Full
Name, and File Extension.
Check Add File Extension to automatically add the le extension to the instance le
name. If you do not add a le extension, you might be unable to open the document.
Enable SSL
FTP Server options
Option Description
Destination FTP Server
Keep an instance in the
history
Saves a copy of this instance in the document's history. This option in enabled by default.
If you want the BI platform to automatically delete the instance from the Output FRS to minimize
the number of instances on the server, uncheck the option.
Use default settings Uses the default Adaptive Job Server values for FTP Servers.
If you do not want to use the default Adaptive Job Server values, disable the option, and set the
destination recipient options that appear.
You can change the values in the Servers area of the CMC. For more information, refer to SAP
BusinessObjects Business Intelligence Platform Administrator Guide.
SAP BusinessObjects Web Intelligence User's Guide
Scheduling and publishing documents
P U B L I C 827
Option Description
Host Enter the IP address of the FTP server host computer where you want to send the instance.
Port
Enter the port of the FTP server where you want to send the instance. The default is 21.
User Name Enter a user name with access rights to upload the object to the FTP server.
Password Enter the password required to access the FTP server.
Account Enter the account required to access the FTP server.
The account is part of the standard FTP protocol but is rarely implemented. Enter an account only
if your FTP server requires it.
Directory Enter the path to the FTP directory where you want to send the instance.
File Name ● To use a system-generated le name for the instance, check Use Automatically Generated
Name.
● To select the le name for the instance, check Use Specic Name, and enter a name or select
variables for the le name from the Add placeholder list. You can select from several types of
variables: Title, ID, Owner, DateTime, (your) Email Address, (your) User Full Name, and File
Extension.
Check Add File Extension to automatically add the le extension to the instance le name. If
you do not add a le extension, you might be unable to open the document.
File System options
Option Description
Destination File System
Keep an instance in the
history
Saves a copy of this instance in the document's history. This option in enabled by default.
If you want the BI platform to automatically delete the instance from the Output FRS to minimize
the number of instances on the server, uncheck the option.
Instances are required for auditing events. This check box is overruled if auditing is enabled for a
scheduled object.
Use default settings Uses the default Adaptive Job Server values for the le system.
If you do not want to use the default Adaptive Job Server values, disable the option, and set the
destination recipient options that appear.
User Name Enter a user name with access rights to save les to the destination directory.
You can specify a user name and password only for servers on Windows.
828 P U B L I C
SAP BusinessObjects Web Intelligence User's Guide
Scheduling and publishing documents

Option Description
Password Enter the user password that is required to access the destination directory.
You can specify a user name and password only for servers on Windows.
Directory Enter the path to a local hard disk location or mapped location or a UNC path to the directory
where you want to send the instance.
If you are scheduling a Web Intelligence document and want to create folders based on variables
(such as the title of the instance, owner, date and time, or user names), use a placeholder. The
placeholder is inserted after the text in the box.
File Name ● To use a system-generated le name for the instance, check Use Automatically Generated
Name.
● To select the le name for the instance, check Use Specic Name, and enter a name or select
variables for the le name from the Add placeholder list. You can select from several types of
variables: Title, ID, Owner, DateTime, (your) Email Address, (your) User Full Name, and File
Extension.
Check Add File Extension to automatically add the le extension to the instance le name. If
you do not add a le extension, you might be unable to open the document.
7.1.1.9 Publications
A publication is a collection of documents that you send to a mass audience. Before distributing the
documents, you, as the publisher, dene the publication using a collection of metadata. The metadata include
the publication source, its recipients, and the personalization applied.
Using publications, you send information to your organization eciently. You can:
● Distribute information to users or groups of users and personalize the information each user or group
receives.
● Deliver targeted business information to users or groups of users through a password-protected portal or
across an intranet, an extranet, or the Internet.
● Minimize database access by eliminating the need for users to send process requests.
You can create publications using either the BI Launch Pad or the CMC.
Rights appendix
As a publisher, you own the publication and are responsible for scheduling it. You can view all publication
instances for all recipients. Recipients can view only their own personalized publication instances.
These viewing rights ensure maximum security for publication data as only you, as a publisher, have rights to
schedule publications and view all publication instances.
SAP BusinessObjects Web Intelligence User's Guide
Scheduling and publishing documents
P U B L I C 829
If you want to add yourself to a publication as a recipient, create two user accounts for yourself: a publisher
account and a recipient account. The publisher account grants you access rights to design and to schedule
publications, and the Recipient account grants you the access rights of a typical recipient.
The table below details the dierent rights necessary to each role to complete specic tasks.
Publishing rights
Role Task Rights required
Document designer Create a document to base a publica
tion on
None
Document designer Add a document to the BI platform View right and Add right on the folder or
category that the document will be
added to
Document designer Create a document to use as a dynamic
recipient source
View right and Add right on the folder or
category that the document will be
added to
Publisher Create a publication ● Add right on the folder where the
publication is saved
● View right on the users and the
user groups intended as recipients
● View right on the prole that will be
used for personalization
● View right on documents in the
publication
● Schedule right on documents in
the publication
● Schedule right on Enterprise recip
ients
830 P U B L I C
SAP BusinessObjects Web Intelligence User's Guide
Scheduling and publishing documents

Role Task Rights required
Publisher Schedule a publication Only the publisher should have the
Schedule a publication right.
● View right, Schedule right, Add
right, and Modify Security right on
the publication
● Delete Instance right on the publi
cation
● View right on the users and the
user groups intended as recipients
● View right on the prole that will be
used for personalization
● View right and Schedule right on
documents in the publication
● View right and Refresh right on the
dynamic recipient source
● View right and Refresh right on the
document that the delivery rule is
set for
● Data Access right on universes
used by publication objects
● Data Access right on universe con
nections used
● When scheduling to a BI Inbox, Add
right and View right on each recipi
ent's BI Inbox
● Modify the right users have to ob
jects right on the folder containing
the publication
● Subscribe right on recipients
● When a publisher wants to print
publication instances, Print right
on Crystal report source docu
ments
● If you selected One database fetch
per recipient, Schedule on behalf of
other users right on Enterprise re
cipients
SAP BusinessObjects Web Intelligence User's Guide
Scheduling and publishing documents
P U B L I C 831

Role Task Rights required
Publisher Retry a failed publication instance ● Edit right on the publication in
stance
● View right, Subscribe right, Add
right, and Modify Security right on
the publication
● Delete Instance right on the publi
cation
● View right on the users and the
user groups intended as recipients
● View right on the prole that will be
used for personalization
● View right and Schedule right on
documents in the publication
● View right and Refresh right on the
dynamic recipient source
● View right and Refresh right on the
document for which the delivery
rule is set
● Data Access right on universes
used by publication objects
● Data Access right on universe con
nections used
● When scheduling to a BI Inbox, Add
right and View right on each recipi
ent's BI Inbox
● Modify the right users have to ob
jects right on the folder containing
the publication
● Subscribe right on recipients
● When a publisher wants to print
publication instances, Print right
on Crystal report source docu
ments
● If you selected One database fetch
per recipient, Schedule on behalf of
other users right on Enterprise re
cipients
832
P U B L I C
SAP BusinessObjects Web Intelligence User's Guide
Scheduling and publishing documents

Role Task Rights required
Publisher Redistribute a publication instance ● View right, Schedule right, Add
right, and Modify Security right on
the publication
● When scheduling to a BI Inbox, Add
right and View right on each recipi
ent's BI Inbox
● View Instance right and Edit right
on the publication instance
Recipient View a publication Rights that enable you to see a publica
tion object in the BI platform:
● View right on the publication
● View Instance right on the publica
tion
You do not need these rights to see con
tent sent to a BI Inbox..
Recipient Subscribe to or unsubscribe from a
publication
● View right on the publication
● Subscribe right on Enterprise re
cipients
7.1.1.10 Report Bursting
During publishing, data in documents is refreshed against data sources and personalized before a publication is
delivered to recipients. This process is known as report bursting.
Depending on the size of a publication and how many recipients it is intended for, you can use the following
report bursting methods:
● One database fetch for all recipients: All documents in a publication are refreshed once, personalized, and
delivered to each recipient. This report bursting method uses the data source logon credentials of the
publisher to refresh data.
This is the default option for Web Intelligence document publications and the recommended option to
minimize the impact of publishing on your database. The performance of this option depends on the
number of recipients. This option is secure only when source documents are delivered as static
documents. For example, a recipient who receives a Web Intelligence document in its original format can
modify the document and view data associated with other recipients. However, if the document is delivered
as a PDF le, data is secure.
● One database fetch per recipient: Data in a document is refreshed for every recipient. This report bursting
method uses the data source logon credentials of the recipient to refresh data. For example, if there are ve
recipients for a publication, the publication is refreshed ve times. This option is recommended for
maximum security for delivered publications.
SAP BusinessObjects Web Intelligence User's Guide
Scheduling and publishing documents
P U B L I C 833
7.1.1.10.1 To select a report bursting method in the CMC
You select a report bursting method to determine how source documents are personalized, processed, and
delivered in a publication.
Prerequisites
Before selecting a report bursting method, ensure that the publication contains Web Intelligence documents
intended for Enterprise recipients and that proles used for personalization have lter expressions.
Context
Report bursting methods use dierent lter types to personalize and process documents. For example, the One
database fetch for all recipients option uses a report lter and the One database fetch per recipient option uses
a query lter. Each lter type supports a dierent set of operators. If a lter expression uses an operator that
the report bursting method does not support, the publication can fail.
You can select a report bursting method only in the Central Management Console (CMC).
Procedure
1. In the CMC, click Folders, and locate the publication to select a report bursting method for.
2. Right-click the publication job and select Schedule.
3. In the Schedule dialog box, expand Additional Options, and click Advanced.
4. Under Report Bursting Method, select a report bursting method.
5. Click Schedule.
7.1.1.11 Enterprise and dynamic recipients
You can send publications to enterprise recipients via a BI Inbox, email, FTP, the le system, and collaboration
or to dynamic recipients via email.
Enterprise recipients are users who are part of the BI platform system.
Dynamic recipients are non-enterprise users, either outside of your network or not congured with users,
groups, proles, security, and so on. For example, dynamic recipients might be suppliers of your company’s
monthly oce supplies and inventory. A BI Inbox is not a valid destination for dynamic recipients because they
do not have a BusinessObjects Enterprise user account.
Dynamic recipients are dierent from enterprise recipients in the following ways:
834
P U B L I C
SAP BusinessObjects Web Intelligence User's Guide
Scheduling and publishing documents
● Publications can be sent to dynamic recipients only via email.
● Dynamic recipients can be used only with local proles.
To create publications, you create a source le and a recipient le rst, then set up the publication in the BI
launch pad, and nally schedule the publication.
The source le contains raw data for the publication; a publication can include more than one source le. For
example, for a monthly document report on suppliers, the source le might list inventory SKU numbers and
categories and include a unique ID/supplier dened in a “Supplier ID” eld. The recipient le must contain the
same unique ID/supplier as the source le as well as recipients email addresses to map to the source le. In
this example, the recipient le should include the same ID in a “Supplier ID” eld, supplier names, and supplier
email addresses.
7.1.1.12 Personalization
Personalization is the process of ltering data in source documents so that only relevant data appears to
publication recipients.
With personalization, you alter the view of data but don't change the data being queried from the data source.
The following illustration explains how personalization works. You have created a document that contains
dierent types of data, all included in the document: 1, 2, and 3. You have to send the document to three
diferent recipients, each one them receiving a single type of data. The rst recipient receives data of type 1, the
second recipient receives data of type 2, and the third recipient receives data of type 3.
SAP BusinessObjects Web Intelligence User's Guide
Scheduling and publishing documents
P U B L I C 835
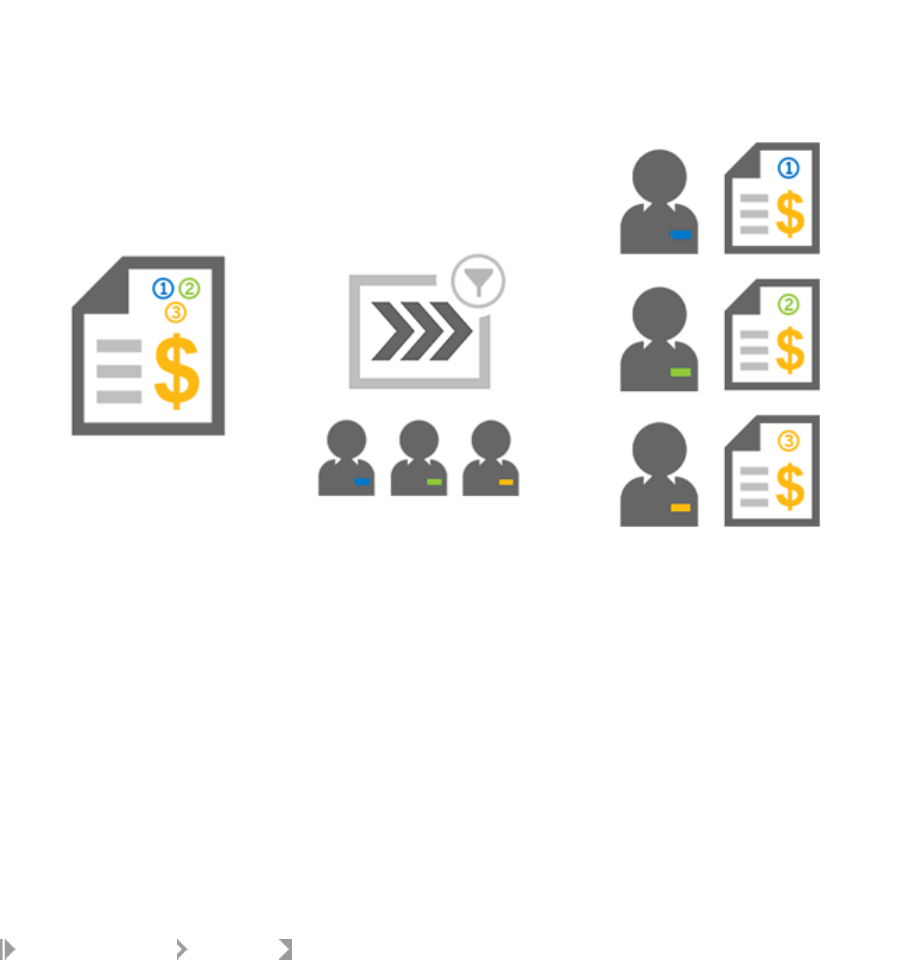
To personalize source documents:
● For Enterprise recipients, make sure to apply a prole when you design a publication. Before you can use
proles to personalize data for Enterprise recipients, the proles must be congured in the BI Platform. If
you need to add proles to the BI Platform, contact your system administrator.
● For dynamic recipients, you can map a data eld or column in the source document to data in the dynamic
recipient source. For example, you can map a Customer ID eld in a source document to the Recipient ID
eld in the dynamic recipient source.
To view a list of recipients who will receive unpersonalized publication instances after personalization, select
Additional Options Advanced in the New Publication dialog box, and select the Display users who have no
personalization applied check box.
Related Information
Personalized placeholders for source document names [page 837]
Personalized placeholders for email elds [page 837]
To select personalized placeholders for source documents [page 847]
To select personalized placeholders for email elds [page 847]
To personalize a document with a global prole target [page 849]
To personlize a document by ltering elds [page 849]
836
P U B L I C
SAP BusinessObjects Web Intelligence User's Guide
Scheduling and publishing documents
7.1.1.12.1 Personalized placeholders for source document
names
A placeholder is a container for variable data. Adding personalized placeholders to source le names helps
recipients identify ltered data.
Recipients who belong to multiple user groups with dierent personalization values can distinguish between
multiple versions of the same source document, without viewing its contents. If a publication contains more
than one source document, the Add placeholder list for Use Specic Name contains personalized placeholders
only if all source documents were ltered on the same eld.
The following personalized placeholders are available for reports:
● %eldname_VALUE%
For example, when selecting the Email Address placeholder, %SI_EMAIL_ADDRESS% appears in the Use
Specic Name box. At run-time, the placeholder is replaced by the value of the eld used to lter the
document. This placeholder is unique for each recipient.
● %eldname_NAME%
For example, when selecting the Title placeholder, %SI_Name% appears in the Use Specic Name box. At
run-time, the placeholder is replaced by the actual name of the eld. This placeholder is the same for all
recipients.
Related Information
To select personalized placeholders for source documents [page 847]
7.1.1.12.2 Personalized placeholders for email elds
A placeholder is a container for variable data. You can use personalized placeholders in the Subject box and the
Message box when sending a publication via email.
For each lter used in a document during personalization, the following placeholders appear in the Add
placeholder list:
● %Field - Query 1-VALUE%
At run-time, the placeholder is replaced by the personalized value used to lter the document. This
placeholder is unique for each recipient.
● %Field - Query 1-NAME%
At run-time, the placeholder is replaced by the name of the eld. This placeholder is the same for all
recipients.
Before being able to use personalized placeholders in the Subject or Message box, make sure to personalize all
source documents for the publication on the same eld. If a publication contains several source documents,
the Add placeholder list for the Subject and Message boxes displays personalization parameters only when all
source documents are ltered on the same eld(s).
SAP BusinessObjects Web Intelligence User's Guide
Scheduling and publishing documents
P U B L I C 837
Related Information
To select personalized placeholders for email elds [page 847]
7.1.1.13 Delivery rules
You can set delivery rules to ne-tune the processing and distribution of publications.
When you set delivery rules to a documents, the publication is delivered to recipients only if it meets certain
conditions. The BI platform supports several types of delivery rules. For Web Intelligence documents however,
you can only set recipient delivery rules. There are two recipient delivery rules available:
● Deliver individual document when condition is met
● Deliver all documents only when all conditions are met
For each document of the publication, a delivery rule is always coupled with a condition. As a publisher, this is a
way to ne-tune the publication process according to the recipients you want to deliver the publication to.
There are four conditions you can choose from:
● Always deliver
● Never deliver
● If scheduled content contains data
● If scheduled content has been fully refreshed
If a document fails to meet the condition you have purposely selected, you can either cancel the delivery of that
specic document or cancel the whole publication.
7.1.1.14 Publication extensions
A publication extension is a library of code that applies business logic to publications.
Use a publication extension to automatically customize publications after processing or delivery. You can use
publication extensions to perform the following tasks:
● Merge documents of the same type (for example, merge multiple Excel spreadsheets into a single Excel
workbook)
● Add password protection to or encrypt a document
● Convert a document to a dierent format
● Create custom log les for a publication job
You add publication extensions to publications in the Central Management Console (CMC) of the BI platform.
(You cannot use publication extensions when designing a publication in the BI launch pad.) However, before
you can add a publication extension, the extension must be deployed on machines that run the Adaptive
Processing Server. The location of the server varies, depending on the operating system:
● On Windows, the location is <InstallDir>\SAP BusinessObjects\SAP BusinessObjects
Enterprise XI 4.0\java\lib\.
● On Unix, the location is <InstallDir>/sap_bobj/enterprise_xi40/java/lib/.
838
P U B L I C
SAP BusinessObjects Web Intelligence User's Guide
Scheduling and publishing documents

Once an extension is deployed, you must restart the Adaptive Processing Server and any other servers that
host a Publishing Service. For more information about publication extensions, see the SAP BusinessObjects
Business Intelligence Platform Java SDK Developer Guide.
7.1.1.14.1 To add a publication extension in the CMC
Context
Procedure
1. In the CMC, click Folders, and locate the publication to add a publication extension to.
2. Right-click the publication and select Properties
3. Click Additional Options Publication Extension .
4. Give a name for the extension.
5. In the Class Name box, enter the fully qualied class name for the extension.
6. Optional: In the Parameter box, enter a parameter name.
7. To use the extension after processing before or after delivery, above the Before Publication Delivery or After
Publication Delivery list, click Add.
8. Click Save.
7.1.1.15 Publications for SAP recipients
A publication intended for SAP recipients works the same way as a publication intended for Enterprise or
dynamic recipients.
However, there are dierences in the publishing workow for SAP recipients:
● You do not use personalization to design source documents for SAP recipients. Each SAP recipient has a
prole value mapped to a user account outside of the BI platform, and the prole value serves as built-in
personalization. You do not need to create proles and prole values for SAP recipients in the platform or
to map proles to source document elds.
● The only report bursting method that works for a publication intended for SAP recipients is One database
fetch per recipient. It maximizes security and individually processes the database logon credentials of each
publication recipient.
For information about single sign-on conguration and authentication, see the SAP BusinessObjects Business
Intelligence Platform Administrator Guide.
SAP BusinessObjects Web Intelligence User's Guide
Scheduling and publishing documents
P U B L I C 839
7.1.1.16 Publications for Live Oce
When you design publications for use with SAP BusinessObjects Live Oce, consider this information.
● Dynamic content documents can consist only of Web Intelligence documents in the original format.
● Dynamic recipients are not supported.
● The only destination option available is Default Enterprise Location.
● If recipients receive multiple publication instances after personalization, they can view only the rst
publication instance in the Live Oce Client. Recipients who inherit multiple prole values from group
membership may receive multiple instances. To avoid sending multiple instances, assign only necessary
prole values to recipients.
7.1.1.17 Subscriptions
A subscription enables users who are not publication recipients to view the latest instance.
Enterprise recipients can unsubscribe from a publication at any time. Dynamic recipients can neither subscribe
to or unsubscribe from a publication.
Users with the appropriate access rights can subscribe and unsubscribe other users. To subscribe to or
unsubscribe from a publication, the following items are required:
● A BI Platform account
● Access to the BI Launch Pad or to the Central Management Console (CMC) in the platform
● View rights to see the publication
● Subscriber rights for the user account (Enterprise recipients)
Related Information
To subscribe to or unsubscribe from a publication [page 852]
To subscribe to or unsubscribe from a publication instance [page 853]
840
P U B L I C
SAP BusinessObjects Web Intelligence User's Guide
Scheduling and publishing documents
7.1.1.18 Viewing publications results
Results of a publications can be viewed by the publisher or recipients. A log le is also available for the
publication job.
Viewing results as a publisher
After a publication runs, the publication history appears, listing publication instances, the times when the
publication ran, and whether the publication succeeded or failed. In the Instance Time column, you can click a
link to a publication instance to view instances generated for all recipients when the publication ran.
Viewing results as a recipient
The following table summarizes the ways you can view a publication.
Destination
To view the publication result
Default Enterprise Location Dynamic recipients cannot log on to the BI platform to view
publication results.
As a recipient, you can view only your own personalized pub
lication instances in the platform. You cannot view publica
tion instances that are personalized for other recipients.
BI inbox
Dynamic recipients cannot log on to the BI launch pad to
view publication results.
Email Log on to your email to view embedded publication content
or to download the attachment or attachments.
FTP Server Log on to your FTP host.
SFTP Server Log on to your SFTP host.
Local disk Go to the location specied when the publication was de
signed.
Viewing log les for publications jobs
Log les are useful for troubleshooting a publication and for identifying which recipients did not receive a
publication instance. The BI Platform logs publication job information as each batch of personalized
publication instances is processed and then consolidates the details into one or more log les. The maximum
log le size is 10 MB and is non-editable. If you run a high-volume publication with many details, expect the
publication instance to have several log les.
You can view log les for a publication instance in the following ways in the History dialog box:
SAP BusinessObjects Web Intelligence User's Guide
Scheduling and publishing documents
P U B L I C 841
● To view the last log le in a series, in the Status column, click the status (Success, Failed, or Running), and
click View Log File at the bottom of the Instance Details dialog box. You can view the last log le while a
publication is running.
● To view all log les, in the Instance Time column, click the link for a publication instance. Log les are listed
after the personalized instances.
Log les are updated with new information every two minutes. If a publication job has been running less than
two minutes, the log le may have a status of Pending.
7.1.2 Scheduling documents
You can schedule documents to automatically run at specied times. Each time a scheduled document runs
successfully, an instance of that document is created.
An instance is a version of the document containing data from the time the document ran. You can access the
list of instances in the document's history. If you have access rights to view documents on demand, you can
view and refresh any instance to retrieve the latest data from the data source. By scheduling and viewing
instances, you ensure that documents have the most up-to-date information available for viewing, printing, and
distributing.
The default time zone is local to the web server that runs the BI platform, not to the Central Management
Server (CMS) that your machine connects to. Before scheduling documents, conrm that your local time zone
is selected in the BI launch pad preferences. If you do not have access rights to view or to set your preferences,
contact your system administrator.
7.1.2.1 To schedule a document
When scheduling a document, options are sometimes set up with specic settings by default. Feel free to
modify these settings according to your needs.
Prerequisites
Before scheduling a Web Intelligence document, conrm that a context is set in the document. If there are
multiple contexts in the Web Intelligence document, refresh the document with the correct context before
scheduling it.
Procedure
1. In the Documents tab of the BI Launch Pad, right-click a document and click Schedule.
2. In the Schedule dialog box, in the Instance Title tab, give a name to the instance you want to schedule.
3. Click a tab in the navigation list, and set the options in that tab depending on your needs.
842
P U B L I C
SAP BusinessObjects Web Intelligence User's Guide
Scheduling and publishing documents

Repeat this step for each tab in which you want to set options.
4. Click Schedule.
The History dialog box appears and displays an instance of the document you have scheduled.
7.1.2.2 To view the latest instance of a document
You can view the latest instance of adocument.
Procedure
1. Right-click a document.
2. Click History.
The latest instance of the object appears in a viewer.
3. Optional: If you have refresh rights on the document, click on the viewer toolbar to refresh the report
or document with the latest information from the data source.
The latest instance of the document displays in the viewer.
7.1.2.3 To view a specic instance of a document
Procedure
1. Right-click a document.
2. Click History.
3. In the History dialog box, double-click a link in the Instance Time column to view a specic instance.
You can lter the instances by hovering a column heading and clicking the icon.
SAP BusinessObjects Web Intelligence User's Guide
Scheduling and publishing documents
P U B L I C 843

7.1.2.4 To pause or resume an instance
You can pause and resume instances of scheduled documents with a Pending or Recurring status.
Context
For example, if a job server is down for maintenance, you can pause a scheduled instance to prevent the BI
Platform from running the document. Scheduled jobs fail when the job server is not running. When the job
server is running again, you can resume the scheduled instance.
Procedure
1. Right-click a document.
2. Click History.
3. Right-click the instance you want to pause or resume.
4. Click Pause or Resume.
7.1.2.5 To delete instances from your BI Inbox
You can delete all instances from your BI Inbox.
Procedure
1. On the Documents tab, expand the My Documents drawer, and click Inbox.
The contents of your BI Inbox appear.
2. Click Organize Delete All Messages .
3. When prompted, click OK to conrm the deletion.
7.1.3 Publishing documents
Publishing documents means that you make them available to an audience by sending them via email or an
FTP sever and saving them to a disk. You can view, archive, retrieve or schedule published documents via the BI
Platform.
Using the BI launch pad or the Central Management Console (CMC), you can tailor documents according to
users and recipients you wan to send documents to, schedule them to run at a specic time, and send
documents to multiple destinations, including BI Inboxes and email addresses.
844
P U B L I C
SAP BusinessObjects Web Intelligence User's Guide
Scheduling and publishing documents

7.1.3.1 To create a publication
Context
Procedure
1. On the Documents tab, expand the Folders drawer, and locate the folder to create a publication in.
2. Right-click the folder and select New Publication .
The New Publication dialog box appears, with general property options displayed.
3. Give a name to the publication.
You can also enter a description and keywords in the corresponding text elds.
4. Click Source Documents in the navigation list, and click Add.
5. In the Select Source Documents dialog box, select one or more source documents to add to the
publication, and click OK.
Refresh At Runtime is enabled by default for each source document. This option refreshes the document
against its data source when the publication runs. If you don't want to refresh source documents at
runtime, uncheck the box.
6. Select the enterprise recipients and/or dynamic recipients you want to send the publication to.
7. Set up the available options by clicking each tab in the category tree list to ne tune your publication.
The Recurrence, Prompts, Formats, Events, Scheduling Server Group, and Destinations categories have the
exact same content as that of the Schedule dialog box when you schedule document. For more information
about options available in these categories, use the links at the end of this topic to access the dedicated
documentation.
8. Click Save & Close.
Related Information
Recurrence [page 822]
Prompts [page 823]
Formats [page 823]
Events [page 824]
Scheduling server group [page 824]
Destinations [page 825]
SAP BusinessObjects Web Intelligence User's Guide
Scheduling and publishing documents
P U B L I C 845
7.1.3.2 To open a publication
Context
Procedure
1. Do one of the following:
○ In the BI Launch Pad, on the Documents tab, expand the Folders tab.
○ In the Central Management Console (CMC) in the BI platform, click Folders.
2. Right-click a publication and click View.
7.1.3.3 To select an event to trigger a publication
Event-based scheduling gives you additional control over when a publication runs. Use events to trigger a
publication to run or use a publication job to trigger an event.
Context
For more information about events, refer to SAP BusinessObjects Business Intelligence Platform User Guide.
Procedure
1. Right-click the publication to select events for and select Schedule.
2. Click Events in the list of categories.
3. Do one of the following:
○ To specify le-based and custom events for a publication, click the > button to move events from the
Available Events list to the Events to wait for list.
The events trigger the publication job to run.
○ To specify schedule events for a publication, click the > button to move events from the Available
Schedule Events list to the Events to trigger on completion list.
The events occur after the publication job runs.
4. Click Schedule.
846
P U B L I C
SAP BusinessObjects Web Intelligence User's Guide
Scheduling and publishing documents
7.1.3.4 To select personalized placeholders for source
documents
You select personalized placeholders for a publication in the Schedule dialog box.
Prerequisites
Before being able to use personalized placeholders in publication instance names, the publication’s source
documents must use personalization to lter data.
Context
When scheduling a publication instance, you can use placeholders in the Use Specic Name eld for source
documents, and combine text and multiple placeholders in a publication name.
Procedure
1. Right-click the publication to select placeholders for and select Schedule.
2. Click Destinations in the list of categories.
3. Under Show options for selected destinations, select Use Specic Name and choose a placeholder for the
publication name from the Add placeholder list.
4. Optional: To add individual documents:
○ Under Target Name, select Specic Name per Document.
○ For each document title, select a placeholder from the Add placeholder list.
5. Click OK.
7.1.3.5 To select personalized placeholders for email elds
You select personalized placeholders for a publication in the Schedule dialog box.
Context
You can combine text and multiple placeholders in any email eld. When scheduling a publication to an email
destination, you can use placeholders in the From, To, Cc, Bcc, Subject, Message, and Use Specic Name elds.
SAP BusinessObjects Web Intelligence User's Guide
Scheduling and publishing documents
P U B L I C 847
Procedure
1. Right-click the publication to select placeholders for and select Schedule.
2. Click Destinations in the list of categories.
3. Select Email.
4. Set the destination options, including placeholders, as needed.
5. Click OK.
7.1.3.6 To embed content from a dynamic source document
in an email
You embed content from a source document for a publication in the Schedule dialog box.
Context
You can embed content from dynamic content documents in the body of an email. You can embed an entire
document or a single report tab.
Procedure
1. Right-click the publication to take the content from and select Schedule.
2. Click Formats in the list of categories.
3. Choose whether to publish the entire document or one report tab:
○ Under Output Format, select mHTML.
○ Under Output Format Details, select All reports or Select one report and choose a report tab in the list.
4. Click Destinations in the list of categories.
5. Under Select Destinations, select Email.
6. Fill in the entry eld or select placeholders from the Add placeholder list.
In the From entry eld, you can enter Robert, Publisher, or publisher@sap.com. If you enter a name, the
name is appended to your email server—for example, Publisher@<EmailServer>.
7. To embed dynamic content in the Message entry eld, position the cursor where you want to embed
content, and select Report HTML Content in the Add placeholder list.
%SI_DOCUMENT_HTML_CONTENT% appears in the Message entry eld. When the publication runs, the
placeholder is replaced by personalized content from the dynamic content document.
8. Optional: If the publication contains other source documents, select the Add Attachment.
Other source documents in the publication will be added to the email as attachments when the publication
runs.
9. Click OK.
848
P U B L I C
SAP BusinessObjects Web Intelligence User's Guide
Scheduling and publishing documents
7.1.3.7 To personalize a document with a global prole
target
You can personalize a document for Enterprise recipients by ltering with a global prole target.
Prerequisites
● Before being able to use a prole to personalize data for Enterprise recipients, the prole must be
congured in the BI Platform. If a prole is not congured in the platform, personalization will fail.
● Before personalizing a document, make sure that the prole has a global prole target.
Context
When dening personalization under Global Proles, you don't need to set personalization options under
Filters. If you need proles added to the BI Platform, contact your system administrator.
Procedure
1. Right-click the document to personalize and select Schedule.
2. Click Personalization in the list of categories.
3. Under Global Proles, in the Enterprise Recipient Mapping column, select a prole in the list.
This prole maps the document to the universe eld (global prole target) that is ltered for Enterprise
recipients.
4. Click OK.
7.1.3.8 To personlize a document by ltering elds
Prerequisites
Before being able to use a prole to personalize data for Enterprise recipients, the prole must be congured in
the BI Platform. If a prole is not congured in the platform, personalization will fail.
SAP BusinessObjects Web Intelligence User's Guide
Scheduling and publishing documents
P U B L I C 849
Context
Static-value proles can lter only string elds in source documents. To lter other types of elds, use
expression prole values. If you map an incorrect type of eld to the prole, personalization will fail. If you need
proles added to the platform, contact your system administrator.
Scheduling and publishing a document to .WID format generates a .WID le. Filters in .WID les can be removed
by any recipient with appropriate security rights. When sending the .WID le to recipients or destinations, use
lters carefully. For example, if you lter a document to limit the information that recipients can see and then
send the published .wid le to recipients, any recipient with security rights to edit the document can remove or
update the lter and access data that should not be visible.
Procedure
1. Right-click the document to personalize and select Schedule.
2. Click Personalization in the list of categories.
3. Under Local Proles, for each prole listed in the Title column, select a prole from the list in the Report
Field column.
This prole maps the report eld to prole values for Enterprise recipients.
4. Under Local Proles, in the Enterprise Recipient Mapping column, select a prole.
This prole maps the document to the universe eld (global prole target) that is ltered for Enterprise
recipients.
5. In the Dynamic Recipient Mapping column, select a prole.
The eld in the source document is mapped to the column that contains corresponding values in the
dynamic recipient source.
6. Repeat steps 3 to 5 for each eld to lter.
7. Click OK.
7.1.4 Managing publications and instances
At any point during or after publication design, you can view a publication's properties in the Summary dialog
box—including the publication's title, location, description, source documents, the number of recipients who
will receive the publication (sorted by recipient type, Enterprise or dynamic), how the publication is
personalized, the distribution format, and the destination.
Click Summary to open the dialog box. You can use other options on the navigation panel to change the
properties of and to save or schedule a publication.
850
P U B L I C
SAP BusinessObjects Web Intelligence User's Guide
Scheduling and publishing documents
7.1.4.1 To test a publication
Use the test mode in the BI Launch Pad to send a publication to yourself before sending it to recipients.
Context
When testing a publication, you receive the exact same contact your recipients will receive. Destinations are
automatically updated so that your BI Inbox or your email address is used instead of publication recipients' BI
Inbox or email address. If necessary, you can exclude selected recipients from the original group of recipients in
test mode.
Procedure
1. Right-click the publication to test and select Test Mode.
2. Optional: In the Test Mode dialog box, modify the list of Enterprise recipients:
a. Click Enteprise recipients.
b. Under Available, select users or groups, and click > to move the users or groups to the Selected list or
the Excluded list.
3. Optional: Modify the list of dynamic recipients:
a. Click Dynamic recipients.
b. Under Choose the source for the dynamic recipients, select Web Intelligence Report Dynamic Recipient
Provider in the list.
4. Click Test.
Results
The publication runs in test mode and, once done, is sent to intended "test" recipients.
7.1.4.2 To view the progress or history of a publication
Context
SAP BusinessObjects Web Intelligence User's Guide
Scheduling and publishing documents
P U B L I C 851

Procedure
1. Right-click the publication job and select History.
The History dialog box appears and shows the status (Success, Failed, or Running) of the job in the Status
column.
2. To view the log le for the job, click View Log File at the bottom of the dialog box.
7.1.4.3 To subscribe to or unsubscribe from a publication
To subscribe to a publication after it is scheduled, subscribe to its recurring instance or reschedule the
publication.
Prerequisites
You must have appropriate access rights to a publication before you can subscribe to it.
Context
Only Enterprise recipients can subscribe to or unsubscribe from a publication. Dynamic recipients cannot
subscribe to or from publications.
Procedure
1. In the Folders drawer on the Documents tab, locate and select the publication to subscribe to or
unsubscribe from.
2. Do one of the following:
○ In the BI Launch Pad, right-click the publication and select Subscribe or Unsubscribe.
○ In the Central Management Console (CMC), select Actions Subscribe or Unsubscribe.
852
P U B L I C
SAP BusinessObjects Web Intelligence User's Guide
Scheduling and publishing documents

7.1.4.4 To subscribe to or unsubscribe from a publication
instance
After a recurring publication has been scheduled, Enterprise recipients can subscribe to its rst recurring
instance. For example, when a publication is scheduled to run twice a week, you can subscribe to the rst
publication instance but not the second one.
Prerequisites
You must have appropriate access rights to a publication before you can subscribe to its instances.
Context
Procedure
1. Do one of the following:
○ In the BI Launch Pad, right-click the instance and select History.
○ In the Central Management Console (CMC), select Actions History .
2. Do one of the following:
○ In the BI Launch Pad, right-click the instance and select Subscribe or Unsubscribe.
○ In the Central Management Console (CMC), select Actions Subscribe or Unsubscribe.
7.1.4.5 To view publications sent to the Default Enterprise
Location
As a recipient, you can view only your own personalized publication instances in the BI platform.
Context
SAP BusinessObjects Web Intelligence User's Guide
Scheduling and publishing documents
P U B L I C 853
Procedure
1. In the CMC, go to the Folders area, right-click a publication, and select History.
2. Click the link in the Instance Time column.
3. Double-click the instance to view.
7.1.4.6 To view publications sent to a BI Inbox
Dynamic recipients can view publications sent to a BI Inbox. They cannot log on to the BI launch pad to view
publication results.
Context
Procedure
1. In the BI launch pad home screen, click My Inbox.
2. Double-click the instance to view.
7.1.4.7 To redistribute a publication instance
When you want to resend an instance to a recipient but do not want to rerun an entire publication, you can
redistribute successful publication instances to all or some of the original recipients.
Context
Only recipients specied when the publication was originally run can receive redistributed instances.
Procedure
1. Do one of the following:
○ In the BI launch pad, right-click a publication and select History.
854
P U B L I C
SAP BusinessObjects Web Intelligence User's Guide
Scheduling and publishing documents

○ In the Central Management Console (CMC), right-click a publication and select Actions History .
2. Select a successful publication instance.
3. Do one of the following:
○ In the BI launch pad, right-click a publication and select More Actions Reschedule .
○ In the Central Management Console (CMC), right-click a publication and select Actions
Reschedule .
4. Choose which recipients will receive redistributed instances:
○ To redistribute an instance to Enterprise recipients, click Enterprise Recipients, and click > to move
recipients from the Available list to the Selected list.
○ To redistribute an instance to dynamic recipients:
1. Click Dynamic Recipients, and conrm that columns mapped to recipient IDs, full names, and
email addresses are correct.
2. Select Use entire list to redistribute the publication to all dynamic recipients or click > to move
recipients from the Available list to the Selected list to select from a restricted list of dynamic
recipients.
5. Click Redistribute.
Results
The publication history appears, and the redistributed instance has a status of Running. The date in the
Instance Time column is updated to reect the redistribution time.
7.1.4.8 To retry a failed publication
Prerequisites
Before retrying a failed publication, view the log le for the publication instance, address any errors, and
reschedule the publication.
Context
Using the option to “Retry” failed instances of a publication, you can:
● overwrite the failed instance (Run Now and Reschedule create new instances whereas Retry uses the failed
instance).
● process only the failed recipients, in case of a partial failure.
SAP BusinessObjects Web Intelligence User's Guide
Scheduling and publishing documents
P U B L I C 855
● run the full job without creating a new instance, in case of a complete failure.
Note
You can also perform auto-retry by setting the Number of retries allowed and the Retry interval in seconds
options under the Recurrence property of the publication. In case of a failure, it attempts to run the
publication again.
Procedure
1. Select the failed publication instance.
2. Do one of the following:
○ In the BI launch pad, select More Actions History .
○ In the CMC, select Actions History .
3. Right-click on the failed instance and click Retry.
The instance status changes to Running. Wait until the status changes to Success.
7.1.5 Publication performance
You can improve publication performance by modifying the Adaptive Processing Server, the Publishing Service,
and the Publishing Post Processing Service.
Adaptive Processing Server
Area
Consideration
CPU and memory Move the Adaptive Processing Server to a faster machine
that has more available CPUs and BI platform Feature Pack 3
or later installed. The server will automatically scale to use
more CPUs.
Isolate the Publishing Service and the Publication Post Proc
essing Service on dedicated Adaptive Processing Servers
and remove unused services hosted on those servers. Each
service will consume more shared resources (requests to
thread pool, memory, and CPU consumption) on an Adap
tive Processing Server, and publishing performance may im
prove.
856 P U B L I C
SAP BusinessObjects Web Intelligence User's Guide
Scheduling and publishing documents
Publishing Service
Because publishing is a hard-drive-intensive process, the Publishing Service should be installed on a machine
with fast I/O or SAN disks for the FRS.
Area
Consideration
Many publication instances that execute concurrently
If the underlying CMS, FRS, Adaptive Job Server, and report
processing servers have been scaled appropriately, horizon
tally scale out the Publishing Service across multiple Adap
tive Processing Servers, on one or more machines, to con
currently process more publication instances.
A single publication job (for example, with one million recipi
ents) is not shared across Publishing Services hosted on dif
ferent Adaptive Processing Servers. Horizontally scaling out
the Publishing Service will not improve processing time for a
single publication, regardless of the number of recipients.
Publications with many recipients
Vertically scale the Adaptive Processing Server on machines
with more CPUs and RAM to concurrently process more re
cipients and to generate more jobs on the Adaptive Process
ing Server.
You may need to scale the Adaptive Job Server and report
processing servers accordingly to increase throughput.
You may need to increase the Adaptive Processing Server's
heap size (that is, set -Xmx to 2 GB or more) when the server
runs on a machine with more than eight CPU cores. The
larger number of CPU cores enables the Adaptive Processing
Server to spawn more threads and increase throughput.
Note that more threads require more RAM.
Publishing cleanup option
For a large publication that does not need redistribution or to
view artifacts in the report, do not select the default destina
tion.
Web Intelligence publications
Select One database fetch for all recipients or One database
fetch per recipient.
When you select One database fetch for all recipients for a
large publication, to break the database query into multiple,
smaller queries, add the following command line option to
speed disk delivery to all Adaptive Processing Servers that
host the Publishing Service:
-
Dcom.businessobjects.publisher.scopeba
tch.max.recipients=<integer>
SAP BusinessObjects Web Intelligence User's Guide
Scheduling and publishing documents
P U B L I C 857
Area Consideration
Large publications with slow disk delivery to a single folder
on Windows
Search for "disable short le name generation" (article ID
210638) or for "NtfsDisable8dot3NameCreation" on Micro
soft TechNet at
http://technet.microsoft.com and follow
the instructions.
Large publications with slow disk delivery to a single folder
that contains more than 300,000 les on Windows
Search for "how NTFS works" at http://technet.micro
soft.com
and follow the instructions.
Publishing Post Processing Service
The Publishing Post Processing Service is called when the Package as ZIP File checkbox (in the Schedule dialog
box) and/or the Merge Exported PDF checkbox (in the Destinations dialog box) is selected or when custom
post-processing plugins are enabled on a publication.
Area
Consideration
Publications with both Package as ZIP File and Merge
Exported PDF selected
Horizontally scale out the Publishing Post Processing Serv
ice to spread the ZIP and PDF merging workloads across
multiple Publishing Post Processing Services hosted on dif
ferent Adaptive Processing Servers.
7.1.5.1 Best practices for adding source documents
Below are best practices to help you add dynamic content documents to publications.
Use publication log les to troubleshoot errors in failed publications
When you schedule publications to run, log les are generated to record errors that may occur when the
publications are processed. To view all log les for a publication instance, select
More Actions History . In
the History dialog box, click the link for the instance in the Instance Time column. The instance details appear in
a new window.
View and schedule individual dynamic content documents before adding
them to a publication
If you can view and schedule dynamic content documents successfully, the data source connection is working
properly and the source document data can be refreshed when the publication is scheduled. If you cannot view
858
P U B L I C
SAP BusinessObjects Web Intelligence User's Guide
Scheduling and publishing documents

and schedule dynamic content documents, conrm that the data source connection settings are correct. To do
so:
1. In the CMC, select a document and click Manage Default Settings .
2. In the Default Settings dialog box, click Report universes on the navigation panel.
In some cases, you may have to open a dynamic content document in the designer to congure the data
source connection and to re-export the le to the CMS repository and overwrite the previous copy. For more
information about conguring data source connections for dynamic content documents, see the designer
documentation.
Avoid unnecessary data refreshes
If a data refresh is unnecessary for a dynamic content document, in the Source Documents section, uncheck
Refresh At Runtime for that document to improve overall publication performance.
7.1.5.2 Best practices for using dynamic recipient sources
Make sure to sort your dynamic recipients according to the Recipient ID column
In general, you should sort dynamic recipient sources by the Recipient ID column. This is especially important
when you are running a high-volume publication because it can reduce the number of deliveries to recipients
with multiple personalization values.
7.1.5.3 Best practices for sending and receiving email
publication instances
If possible, view embedded-content email-publication instances in Outlook
2003
View embedded content in email publication instances in Outlook 2003 whenever possible. Embedded content
in email publication instances may have formatting issues when viewed in Outlook 2007 or in web email
accounts, such as Hotmail or Gmail.
SAP BusinessObjects Web Intelligence User's Guide
Scheduling and publishing documents
P U B L I C 859
Contact your administrator to conrm that the email settings are congured
properly for the Destination Job Server
Make sure that email settings are properly congured for the Destination Job Server. Publications intended for
email destinations may fail because email has not been congured properly as a destination for the Adaptive
Job Server. For more information, refer to the SAP BusinessObjects Business Intelligence Platform
Administrator Guide.
860 P U B L I C
SAP BusinessObjects Web Intelligence User's Guide
Scheduling and publishing documents

8 Sharing content with other applications
8.1 Sharing content with other applications
You can make Web Intelligence content available outside Web Intelligence documents by publishing report
blocks (tables, charts or forms) as web services known as BI Services.
Note
You can only publish content as a web service in the Web Intelligence Applet interface and Web Intelligence
Rich Client. This feature is not available for the Web Intelligence HTML interface.
Web services provide a standardized mechanism for sharing data between applications. You publish content to
a server where other applications can access the web services that supply the content.
Each web service can publish multiple blocks which are made available to web applications through functions
that correspond to the blocks. For example, a table published as a web service can be included in a dashboard
which can perform ltering and drilling operations on the table through the web service functions.
The structure of a BI service is dened using WSDL (Web Service Denition Language), a standard format for
describing web services. Web applications interact with BI services (by passing parameters to them and
receiving data in return) using Simple Object Access Protocol (SOAP), a standard protocol for exchanging
structured information.
Related Information
BI service structure [page 867]
8.1.1 Making data available for ltering in a web service
When you publish a report block as a web service, you can make report objects available that web applications
can use to lter the data returned by the web service.
For example, if you publish a table containing [Country], [Region] and [Revenue], you can make the [Country]
dimension available as a lter. Web applications accessing the web service can then lter on the [Country]
dimension.
Filtering objects appear as FilterCondition parameters in the GetReportBlock_<blockname> function
in the web service.
You make objects available for ltering in the Dene published content screen of the Publish Content wizard.
The screen lists all the objects in the report and selects the objects in the block you are publishing by default.
You can deselect these objects and select any object in the report to make it available as a lter. For example,
SAP BusinessObjects Web Intelligence User's Guide
Sharing content with other applications
P U B L I C 861

you can make the [Country] dimension available as a lter when you publish a table containing the [Region]
and [Revenue] objects if the [Country] dimension appears in the report. You can also choose not to make the
[Region] and [Revenue] objects available as lters.
You do not have to include any report objects as lters except for objects that appear in section headers. These
appear selected and you cannot unselect them.
If you publish a block in a section, by default the web service lters on the value of the section object
corresponding to the block you selected. For example, if you have a report containing [Country], [Region] and
[Revenue] with [Country] as the section header, and you publish the block in the section where
[Country]="France", the web service uses "France" as the default value of [Country]. A web application
accessing the web service can supply a dierent value for [Country] and the data returned by the web service
changes to correspond with the lter.
If you publish a block in a report containing report lters, the objects on which report lters are dened are
selected by default in the screen. You can unselect these objects. If you publish the block without making the
objects available as lters, the web service lters data according to the values of the report lters. If you make
the objects available, web applications can apply the report lters using dierent values.
Related Information
GetReportBlock_<blockname> [page 867]
8.1.2 To publish a chart or table as a web service
You use the Publish Content wizard to publish a chart or table as a web service.
Context
Restriction
This feature is only available in the Web Intelligence Rich Client and Applet interfaces. It is not available in
the Web Intelligence HTML interface.
Procedure
1. Open a Web Intelligence document in Design mode.
2. Select the table or chart that you want to publish, right-click and select Publish as Web Service to display
the Publish Content wizard.
3. Click Next to move to the rst publishing step.
862
P U B L I C
SAP BusinessObjects Web Intelligence User's Guide
Sharing content with other applications
If the table or chart that you are publishing as a web service has already been published, the Identify
Duplicate Content screen highlights the duplicated table or chart. The duplicate table or chart appears in
bold beneath the web services that publish it.
4. Click Next to move to the next step.
Note
If your query has prompts, the Choose prompt screen appears. In this case, continue to the next step. If
your query has no prompts, the Dened Published Content screen appears. In this case, skip the next
step.
5. In the Choose Prompt screen:
a. Select or unselect the prompts you want to include or exclude in the list of prompts.
Click Select all to select all prompts or Clear all to clear all prompts.
b. Click Next to move to the next step.
Note
For web services, to use multiple values in prompts, you must reproduce the prompt as many times as
dierent responses are expected, and the user will be prompted for each response.
If you do not publish a prompt, the web service uses the prompt value supplied when the document was
last refreshed and saved. For example, if a user answers "US" to a prompt on [Country], then saves the
document, the web service lters data on [Country]="US" the next time it is called with the refresh=true
parameter.
If a web service publishes prompts, web applications must supply values for the prompts in the custom
data provider web service window if they call the web service with the refresh=true parameter. If the
user does not enter values for the prompts, the last values entered are used.
6. In the Dene Published Content screen:
a. Type the name and description under which you want to publish the table.
b. Select Share report content for all consumers when you want all web service consumers (sessions) get
the table or chart content from the same (and single) instance of document.
The Share report content for all consumers option below all web service consumers (sessions) to get
the table or chart content from the same (and single) instance of document. This option reduces
memory load on the processing server, and should be enabled when content is to be consumed by
many concurrent users.
Technically, the document is opened by the rst consumer who sends a request for it, and is then
consumed by any other consumer sending same request after ‘on behalf’ of rst user (for example,
using his authorization). Document security cannot therefore be applied with web service calls
designed with this option. To avoid any conicts, all consumers should be granted the permission to
open the corresponding document. Users should also be granted permission to view/access data from
the underlying data sources.
Note
Filtering and drilling from a web service are not compatible with the Share report content for all
consumers option. The only way to lter Web Intelligence document data from web services is to
use report sections exposed as lters in the corresponding web service.
SAP BusinessObjects Web Intelligence User's Guide
Sharing content with other applications
P U B L I C 863

c. Click Set Filters and select the objects you want to make available for ltering in the web service.
When Share report content for all consumers is selected, the Set Filters option is disabled because
consumers will not be able to use report lters, section lters being the only available way to lter
content through mandatory input parameters.
d. Select the server where you want to publish the content beneath Host server.
e. To add, remove or edit servers in the list of host servers, click Manage servers, then click Add, Edit or
Remove and update the list of servers.
f. Click Next to move to the next step.
7. In the Publish new content or re-publish existing content as Web Service screen:
a. To re-publish an existing web service, select the web service, click Publish.
b. To publish a new web service, select the folder where you want to publish the content and click Create
to display the Publish Web Service dialog box.
Note
Folders are optional, you publish to an existing web service or a new web service, and you can
create folders in order to organize your work. Click New Folder to add a folder.
c. Type the name of the web service in the Web service name box and the service description in the
Description box.
d. Select the authentication method for the web service from the Authentication list.
e. Click OK to close the dialog box and save and publish the web service.
f. Choose the web service where you want to publish to and click Finish.
8.1.3 Viewing and managing published content
You can browse the content published on dierent Web servers by using the Web Service Publisher pane.
The Web Service Publisher pane also allows you to edit published Web services and import QaaWS (Query as a
Web Service) queries, which you can then republish as Web Intelligence content.
8.1.3.1 To view and manage published content
You can view and manage published Web Service content in the Web Service Publisher pane of the Side Panel.
Procedure
1. Open a Web Intelligence document in Design mode.
2. Click the Web Service Publisher icon of the Side Panel.
3. In the Web Service Publisher pane, select the server from the Host server list.
4. Do one of the following:
864
P U B L I C
SAP BusinessObjects Web Intelligence User's Guide
Sharing content with other applications
○ To add, remove or edit servers in the list of host servers, click Manage servers, then click Add, Edit or
Remove and update the list of servers.
○ From the Views dropdown list, select the way you want the content to be organized from the menu.
Option Description
View by web service Published content is organized as web service > block
View by document and web service Published content is organized as a document > web service >
block
View by document and block Published content is organized as a document > block > web
service
Show Web Services queries QaaWS (Query as a Web Service) queries appear below the pub
lished content. (QaaWS queries are stored in the same reposi
tory folder as BI services.
○ To edit a published block, right-click the block and select Edit to launch the Publish Content wizard.
○ To delete published content, right-click the published block or the web service and select Delete.
○ To rename a web service, right-click the web service, select Rename and type the new name.
○ To refresh the list of published content, click the Refresh icon, or right-click on a folder or web service
and select Refresh list.
○ To search the list of web services, type the text you want to search for in the search box and select your
search options from the search box dropdown list.
Option
Description
Case sensitive Match case when searching
Case insensitive Ignore case when searching
Match from start Return only those web services or blocks whose name starts with the search text
Match anywhere Return only those web services or blocks whose name contains the search text
Related Information
Importing and using QaaWS queries as a BI service [page 866]
To publish a chart or table as a web service [page 862]
SAP BusinessObjects Web Intelligence User's Guide
Sharing content with other applications
P U B L I C 865

8.1.3.2 To test published content
You can test published content and examine the structure of the web service that publishes it.
Procedure
1. Open a Web Intelligence document in Design mode.
2. Click the Web Service Publisher icon of the Side Panel.
3. Select the web service you want to test and click the Test icon.
4. Select the web service function you want to test from the Operation dropdown list.
5. Select the parameters and operators for which you want to specify values in the Input pane and type their
values beneath Value.
6. Click Send to call the web service with the values you specied.
The data returned by the web service appears in the Server Response pane.
7. Click Change to tree view or Change to table view to toggle the web service data between a tree view and
table format.
8.1.4 Importing and using QaaWS queries as a BI service
You can import QaaWS (Query as a Web Service) queries and run them to produce a block that is inserted in a
new report.
When you import a QaaWS query, the application builds a query based on the structure of the QaaWS query,
then runs this query and inserts the resulting block in a new report. The original QaaWS query is not modied.
Because Web Intelligence does not support the publication of QaaWS queries directly, you can publish QaaWS
queries as BI services by publishing the resulting block as a BI service.
Note
There is no support for sorts dened on QaaWS queries. When you run the QaaWS query, any sorts it
contains are lost.
866
P U B L I C
SAP BusinessObjects Web Intelligence User's Guide
Sharing content with other applications

8.1.4.1 To publish a QaaWS query
You can publish a QaaWS query in the Publish Content wizard.
Procedure
1. Open a Web Intelligence document in Design mode.
2. Click the Web Service Publisher icon of the Side Panel.
3. Select View Display QaaWS queries to display QaaWS queries.
4. Select the QaaWS query you want to import and click Import Web Service query.
The QaaWS query is added to the document as a Web Intelligence query. A report tab is added with the
same name as the QaaWS query. The report tab contains a table corresponding to the query objects.
5. Refresh the added query to display the web service query data.
6. Right-click the added table and select Publish as Web Service to publish the table as a web service.
Related Information
To publish a chart or table as a web service [page 862]
8.1.5 BI service structure
Applications use the Simple Object Access Protocol (SOAP) protocol to call the functions and receive the
function output which they can then parse.
External web applications access Web Intelligence content published as web services by calling two functions:
● GetReportBlock_<blockname>
● Drill_<blockname>
In both these function calls, <blockname> is the name of the block as dened in the web service.
8.1.5.1 GetReportBlock_<blockname>
Function name
GetReportBlock_<blockname>
SAP BusinessObjects Web Intelligence User's Guide
Sharing content with other applications
P U B L I C 867
Input parameters
Name Description Mandatory?
login
CMS login
Yes, unless sessionID or
serializedSession is specied.
password
CMS password
Yes, unless sessionID or
serializedSession is specied.
reportfilter
One or more report lters. See the
reportfilter table below for more
information.
Yes when the report block contains
section entries; no otherwise. Blocks
with sections therefore have a mix of
mandatory and optional
reportfilter parameters.
prompt
Prompt values. See below for more
information on
LovIndexValue
parameters
Yes when refresh = true and the
prompt is mandatory. No otherwise
(
refresh = false ). If you don't enter a
prompt value, then the prompt takes
the values previously dened values.
The consumption of web services
having prompts in Web Intelligence
does not mean that you will be
prompted, you must enter prompt
values in the
Custom Data Provider -
Web Service window.
closeDocument
Forces the document to be closed once
the web service has replied with the
requested content. This behavior helps
to optimize memory consumption on
the server, as consumers can control
how long documents are stored.
Boolean, default value : false (by
default document is kept open, when
web service is replied). Values:
false
or true.
endRow
Denes the last row number retrieved
from the source. This parameter is
used with the startRow parameter to
dene the chunk size to retrieve in
table output parameter. For example,
startRow = 10 / endRow= 55, will
retrieve 46 rows between row 10 and
row 55 included. The last row of a table
has rank set equal to table size; any
greater value is internally corrected to
that number.
Optional. If not declared, the entire
table contents are retrieved. By default,
the entire table contents are retrieved.
startRow
Denes the rst row number retrieved
from the source. This parameter is
used with the endRow parameter to
dene the chunk size to retrieve in
table output parameter. For example,
startRow = 10 / endRow= 55, will
retrieve 46 rows between row 10 and
row 55 included. If the rst row of a
Optional. If not declared, the entire
table contents are retrieved. By default,
the entire table contents are retrieved.
868 P U B L I C
SAP BusinessObjects Web Intelligence User's Guide
Sharing content with other applications
Name Description Mandatory?
table is 1, any lower value is internally
corrected to 1.
resetState
Re-opens the document when the web
service is called, resetting drills and
lters.
No. The default value is false.
refresh
Forces a document refresh.
No. The default value is false.
getFromLatestDocumentInsta
nce
Retrieves data from the latest
document instance.
No. The default value is true.
getFromUserInstance
Retrieves data from the user inbox if
the document has been published.
No. The default value is false.
turnOutputToVTable
Turns the output to a vertical table.
Note
If the block is a chart, it is always
turned into a vertical table, even if
this parameter is set to false.
No. The default value is false.
sessionID
Session token to avoid submitting the
login or password. Increases the
session count when submitted.
No.
serializedSession
Serialized session to avoid submitting
the login or password. Does not
increase the session count when
submitted.
No.
The reportlter parameter
The reportlter parameters contain two elements:
Name Description Values
ltering_value The value used to lter the data Any
ltering_operator The lter operator EQUAL (default)¦ GREATER ¦
GREATER_OR_EQUAL ¦ LESS ¦
LESS_OR_EQUAL ¦ NOT_EQUAL ¦
INLIST ¦ NOT_INLIST
Example of reportFilter parameter
The lter [Country]="US" is specied as follows:
<Country>
<value>US</value>
SAP BusinessObjects Web Intelligence User's Guide
Sharing content with other applications
P U B L I C 869
<operator>EQUAL</operator>
</Country>
Output parameters
Name Type Description
table TTable Table cells
headers THeader Table headers
footers TFooter Table footers
user string Login used by the web service call
documentation string The web service description supplied
by the service designer
documentname string The document name
lastrefreshdate dateTime The date of the last document refresh
creationdate dateTime The date the web service was created
creator string User name of the web service creator
isScheduled boolean Species if document is scheduled
scheduleStartTime dateTime The schedule start time if the
document is scheduled
scheduleEndTime dateTime The schedule end time if the document
is scheduled
tableType string The table type
nbColumns int The number of columns in the output
table
nbLines int The number of rows in the output table
Related Information
Drill_<blockname> [page 870]
Sample BI service return data [page 874]
8.1.5.2 Drill_<blockname>
Function name
Drill_<blockname>
870
P U B L I C
SAP BusinessObjects Web Intelligence User's Guide
Sharing content with other applications
Note
This web service call cannot be used when the document sharing option (Share report content for all
consumers in the Publish Content wizard) is enabled because such methods will not be specied in web
service WSDL le. An error will be returned to the consumer if the document is called when this option is
enabled.
Input parameters
The syntax of the Drill_<blockname> function is similar to GetReportBlock_<blockname>, with the
following dierences:
● there are no reportfilter parameters
● there are additional drillpath parameters
● there are additional drillfilter parameters
Name Description Mandatory?
drillpath
Species a drill instruction Yes
drillfilter
Species a lter to apply when drilling No
The drillpath parameter
The drillpath parameters are of DrillPath type. They contain three elements:
Name Description Values
from
The dimension to drill Any
value
The value to drill on Any
drilloperation
The type of drill operation UP ¦ DOWN
Note
● As well as single values (for example "Los Angeles"), value can pass denitions such as "All Cities".
● If the drill instruction is invalid, the web service returns the original table data.
● At the end of the drill hierarchy, the web services returns the last available values in the drill hierarchy.
● You can supply more than one drillpath parameter, providing that the parameters do not refer to
dierent levels in the same drill hierarchy.
The drilllter parameter
The drillpath parameters allow you to apply drill lters at the same time as drilling:
SAP BusinessObjects Web Intelligence User's Guide
Sharing content with other applications
P U B L I C 871
Name Description Values
dimension
The dimension to lter Any.
value
The value to lter on Any
operator
The lter operator EQUAL ¦ GREATER ¦
GREATER_OR_EQUAL ¦ LESS ¦
LESS_OR_EQUAL ¦ NOT_EQUAL ¦
INLIST ¦ NOT_INLIST
Note
● As well as single values (for example "Los Angeles"), value can pass denitions such as "All Cities"
● If the drill instruction is invalid, the web service returns the original table data
● At the end of the drill hierarchy, the web services returns the last available values in the drill hierarchy
● You can supply more than one drillpath parameter, providing that the parameters do not refer to
dierent levels in the same drill hierarchy.
Related Information
GetReportBlock_<blockname> [page 867]
8.1.5.3 BI Services output parameters
There are several output parameters that can be returned by a BI service.
Name Type Description
table
TTable Table cells
headers
THeader Table headers cells
footers
TFooter Table footers cells
user
string Login used by the web service call
documentation
string The web service description supplied
by the service designer
documentname
string The document name
lastrefreshdate
dateTime The date of the last document refresh
creationdate
dateTime The date the web service was created
creator
string User name of the web service creator
isScheduled
boolean Species if document is scheduled
scheduleStartTime
dateTime The schedule start time if the
document is scheduled
872 P U B L I C
SAP BusinessObjects Web Intelligence User's Guide
Sharing content with other applications
Name Type Description
scheduleEndTime
dateTime The schedule end time if the document
is scheduled
tableType
string The table type
nbColumns
int The number of columns in the output
table
nbLines
int The number of rows in the output table
Example of table parameter
<table>
<row>
<cell xsi:type="xsd:string">Australia</cell>
<cell xsi:type="xsd:string">Accommodation</cell>
<cell xsi:type="xsd:string">Bungalow</cell>
<cell xsi:type="xsd:double">172980</cell>
</row>
<row>
<cell xsi:type="xsd:string">Australia</cell>
<cell xsi:type="xsd:string">Accommodation</cell>
<cell xsi:type="xsd:string">Hotel Room</cell>
<cell xsi:type="xsd:double">345510</cell>
</row>
...
</table>
Example of headers parameter
<headers>
<row>
<cell xsi:type="xsd:string">Country</cell>
<cell xsi:type="xsd:string">Service Line</cell>
<cell xsi:type="xsd:string">Service</cell>
<cell xsi:type="xsd:string">Revenue</cell>
</row>
</headers>
Related Information
Sample BI service return data [page 874]
SAP BusinessObjects Web Intelligence User's Guide
Sharing content with other applications
P U B L I C 873

8.1.5.4 Sample BI service return data
Web services return data using Simple Object Access Protocol (SOAP). The following is a sample SOAP le
returned by a web service.
<soap:Envelope xmlns:xsi="http://www.w3.org/2001/XMLSchema-instance...>
<soap:Body>
<GetReportBlock_Block1BeachResponse xmlns="multidocmultiuniversesmultime">
<table>
<row>
<cell xsi:type="xsd:string">Australia</cell>
<cell xsi:type="xsd:string">Accommodation</cell>
<cell xsi:type="xsd:string">Bungalow</cell>
<cell xsi:type="xsd:double">172980</cell>
</row>
<row>
<cell xsi:type="xsd:string">Australia</cell>
<cell xsi:type="xsd:string">Accommodation</cell>
<cell xsi:type="xsd:string">Hotel Room</cell>
<cell xsi:type="xsd:double">345510</cell>
</row>
<row>
<cell xsi:type="xsd:string">Australia</cell>
<cell xsi:type="xsd:string">Accommodation</cell>
<cell xsi:type="xsd:string">Hotel Suite</cell>
<cell xsi:type="xsd:double">464850</cell>
</row>
<row>
<cell xsi:type="xsd:string">Australia</cell>
<cell xsi:type="xsd:string">Food & Drinks</cell>
<cell xsi:type="xsd:string">Fast Food</cell>
<cell xsi:type="xsd:double">19530</cell>
</row>
<row>
<cell xsi:type="xsd:string">Australia</cell>
<cell xsi:type="xsd:string">Food & Drinks</cell>
<cell xsi:type="xsd:string">Poolside Bar</cell>
<cell xsi:type="xsd:double">27073</cell>
</row>
<row>
<cell xsi:type="xsd:string">Australia</cell>
<cell xsi:type="xsd:string">Food & Drinks</cell>
<cell xsi:type="xsd:string">Restaurant</cell>
<cell xsi:type="xsd:double">41160</cell>
</row>
<row>
<cell xsi:type="xsd:string">Australia</cell>
<cell xsi:type="xsd:string">Recreation</cell>
<cell xsi:type="xsd:string">Activities</cell>
<cell xsi:type="xsd:double">59820</cell>
</row>
<row>
<cell xsi:type="xsd:string">Australia</cell>
<cell xsi:type="xsd:string">Recreation</cell>
<cell xsi:type="xsd:string">Excursion</cell>
<cell xsi:type="xsd:double">113170</cell>
</row>
<row>
<cell xsi:type="xsd:string">Australia</cell>
<cell xsi:type="xsd:string">Recreation</cell>
<cell xsi:type="xsd:string">Sports</cell>
<cell xsi:type="xsd:double">69575</cell>
</row>
<row>
<cell xsi:type="xsd:string">Australia</cell>
<cell xsi:type="xsd:string">Travels</cell>
874
P U B L I C
SAP BusinessObjects Web Intelligence User's Guide
Sharing content with other applications

<cell xsi:type="xsd:string">Car Rent</cell>
<cell xsi:type="xsd:double">49160</cell>
</row>
<row>
<cell xsi:type="xsd:string">Australia</cell>
<cell xsi:type="xsd:string">Travels</cell>
<cell xsi:type="xsd:string">Travel Reservation</cell>
<cell xsi:type="xsd:double">63300</cell>
</row>
<row>
<cell xsi:type="xsd:string">France</cell>
<cell xsi:type="xsd:string">Accommodation</cell>
<cell xsi:type="xsd:string">Bungalow</cell>
<cell xsi:type="xsd:double">126240</cell>
</row>
<row>
<cell xsi:type="xsd:string">France</cell>
<cell xsi:type="xsd:string">Accommodation</cell>
<cell xsi:type="xsd:string">Hotel Room</cell>
<cell xsi:type="xsd:double">116790</cell>
</row>
<row>
<cell xsi:type="xsd:string">France</cell>
<cell xsi:type="xsd:string">Accommodation</cell>
<cell xsi:type="xsd:string">Hotel Suite</cell>
<cell xsi:type="xsd:double">320220</cell>
</row>
<row>
<cell xsi:type="xsd:string">France</cell>
<cell xsi:type="xsd:string">Food & Drinks</cell>
<cell xsi:type="xsd:string">Fast Food</cell>
<cell xsi:type="xsd:double">28440</cell>
</row>
<row>
<cell xsi:type="xsd:string">France</cell>
<cell xsi:type="xsd:string">Food & Drinks</cell>
<cell xsi:type="xsd:string">Poolside Bar</cell>
<cell xsi:type="xsd:double">46320</cell>
</row>
<row>
<cell xsi:type="xsd:string">France</cell>
<cell xsi:type="xsd:string">Food & Drinks</cell>
<cell xsi:type="xsd:string">Restaurant</cell>
<cell xsi:type="xsd:double">32640</cell>
</row>
<row>
<cell xsi:type="xsd:string">France</cell>
<cell xsi:type="xsd:string">Recreation</cell>
<cell xsi:type="xsd:string">Activities</cell>
<cell xsi:type="xsd:double">9000</cell>
</row>
<row>
<cell xsi:type="xsd:string">France</cell>
<cell xsi:type="xsd:string">Recreation</cell>
<cell xsi:type="xsd:string">Excursion</cell>
<cell xsi:type="xsd:double">120050</cell>
</row>
<row>
<cell xsi:type="xsd:string">France</cell>
<cell xsi:type="xsd:string">Recreation</cell>
<cell xsi:type="xsd:string">Sports</cell>
<cell xsi:type="xsd:double">35720</cell>
</row>
<row>
<cell xsi:type="xsd:string">Nepal</cell>
<cell xsi:type="xsd:string">Accommodation</cell>
<cell xsi:type="xsd:string">Bungalow</cell>
<cell xsi:type="xsd:double">323231</cell>
SAP BusinessObjects Web Intelligence User's Guide
Sharing content with other applications
P U B L I C 875

</row>
<row>
<cell xsi:type="xsd:string">Nepal</cell>
<cell xsi:type="xsd:string">Accommodation</cell>
<cell xsi:type="xsd:string">Hotel Room</cell>
<cell xsi:type="xsd:double">330240</cell>
</row>
<row>
<cell xsi:type="xsd:string">Nepal</cell>
<cell xsi:type="xsd:string">Accommodation</cell>
<cell xsi:type="xsd:string">Hotel Suite</cell>
<cell xsi:type="xsd:double">320754</cell>
</row>
<row>
<cell xsi:type="xsd:string">Nepal</cell>
<cell xsi:type="xsd:string">Food & Drinks</cell>
<cell xsi:type="xsd:string">Fast Food</cell>
<cell xsi:type="xsd:double">32960</cell>
</row>
<row>
<cell xsi:type="xsd:string">Nepal</cell>
<cell xsi:type="xsd:string">Food & Drinks</cell>
<cell xsi:type="xsd:string">Poolside Bar</cell>
<cell xsi:type="xsd:double">37915</cell>
</row>
<row>
<cell xsi:type="xsd:string">Nepal</cell>
<cell xsi:type="xsd:string">Food & Drinks</cell>
<cell xsi:type="xsd:string">Restaurant</cell>
<cell xsi:type="xsd:double">32980</cell>
</row>
<row>
<cell xsi:type="xsd:string">Nepal</cell>
<cell xsi:type="xsd:string">Recreation</cell>
<cell xsi:type="xsd:string">Activities</cell>
<cell xsi:type="xsd:double">78200</cell>
</row>
<row>
<cell xsi:type="xsd:string">Nepal</cell>
<cell xsi:type="xsd:string">Recreation</cell>
<cell xsi:type="xsd:string">Excursion</cell>
<cell xsi:type="xsd:double">96440</cell>
</row>
<row>
<cell xsi:type="xsd:string">Nepal</cell>
<cell xsi:type="xsd:string">Recreation</cell>
<cell xsi:type="xsd:string">Sports</cell>
<cell xsi:type="xsd:double">102720</cell>
</row>
<row>
<cell xsi:type="xsd:string">Nepal</cell>
<cell xsi:type="xsd:string">Travels</cell>
<cell xsi:type="xsd:string">Car Rent</cell>
<cell xsi:type="xsd:double">56370</cell>
</row>
<row>
<cell xsi:type="xsd:string">Nepal</cell>
<cell xsi:type="xsd:string">Travels</cell>
<cell xsi:type="xsd:string">Travel Reservation</cell>
<cell xsi:type="xsd:double">74495</cell>
</row>
<row>
<cell xsi:type="xsd:string">US</cell>
<cell xsi:type="xsd:string">Accommodation</cell>
<cell xsi:type="xsd:string">Bungalow</cell>
<cell xsi:type="xsd:double">368870</cell>
</row>
<row>
876
P U B L I C
SAP BusinessObjects Web Intelligence User's Guide
Sharing content with other applications

<cell xsi:type="xsd:string">US</cell>
<cell xsi:type="xsd:string">Accommodation</cell>
<cell xsi:type="xsd:string">Hotel Room</cell>
<cell xsi:type="xsd:double">746828</cell>
</row>
<row>
<cell xsi:type="xsd:string">US</cell>
<cell xsi:type="xsd:string">Accommodation</cell>
<cell xsi:type="xsd:string">Hotel Suite</cell>
<cell xsi:type="xsd:double">842046</cell>
</row>
<row>
<cell xsi:type="xsd:string">US</cell>
<cell xsi:type="xsd:string">Food & Drinks</cell>
<cell xsi:type="xsd:string">Fast Food</cell>
<cell xsi:type="xsd:double">66330</cell>
</row>
<row>
<cell xsi:type="xsd:string">US</cell>
<cell xsi:type="xsd:string">Food & Drinks</cell>
<cell xsi:type="xsd:string">Poolside Bar</cell>
<cell xsi:type="xsd:double">88508</cell>
</row>
<row>
<cell xsi:type="xsd:string">US</cell>
<cell xsi:type="xsd:string">Food & Drinks</cell>
<cell xsi:type="xsd:string">Restaurant</cell>
<cell xsi:type="xsd:double">331860</cell>
</row>
<row>
<cell xsi:type="xsd:string">US</cell>
<cell xsi:type="xsd:string">Recreation</cell>
<cell xsi:type="xsd:string">Activities</cell>
<cell xsi:type="xsd:double">207950</cell>
</row>
<row>
<cell xsi:type="xsd:string">US</cell>
<cell xsi:type="xsd:string">Recreation</cell>
<cell xsi:type="xsd:string">Excursion</cell>
<cell xsi:type="xsd:double">170305</cell>
</row>
<row>
<cell xsi:type="xsd:string">US</cell>
<cell xsi:type="xsd:string">Recreation</cell>
<cell xsi:type="xsd:string">Sports</cell>
<cell xsi:type="xsd:double">74060</cell>
</row>
<row>
<cell xsi:type="xsd:string">US</cell>
<cell xsi:type="xsd:string">Travels</cell>
<cell xsi:type="xsd:string">Car Rent</cell>
<cell xsi:type="xsd:double">34580</cell>
</row>
<row>
<cell xsi:type="xsd:string">US</cell>
<cell xsi:type="xsd:string">Travels</cell>
<cell xsi:type="xsd:string">Travel Reservation</cell>
<cell xsi:type="xsd:double">43200</cell>
</row>
</table>
<headers>
<row>
<cell xsi:type="xsd:string">Country</cell>
<cell xsi:type="xsd:string">Service Line</cell>
<cell xsi:type="xsd:string">Service</cell>
<cell xsi:type="xsd:string">Revenue</cell>
</row>
</headers>
SAP BusinessObjects Web Intelligence User's Guide
Sharing content with other applications
P U B L I C 877

<footers />
<user>Administrator</user>
<documentation></documentation>
<documentname>_DaaWSDivers1</documentname>
<lastrefreshdate>2009-02-20T14:19:01.0</lastrefreshdate>
<creationdate>2009-02-20T14:43:21.109</creationdate>
<creator>Administrator</creator>
<isScheduled>false</isScheduled>
<tableType>Vertical Table</tableType>
<nbColumns>4</nbColumns>
<nbLines>42</nbLines>
</GetReportBlock_Block1BeachResponse>
</soap:Body></soap:Envelope>
8.1.5.5 BI service WSDL denition
<?xml version="1.0" encoding="utf-16"?>
<definitions xmlns:http="http://schemas.xmlsoap.org/wsdl/http/"
xmlns:soap="http://schemas.xmlsoap.org/wsdl/soap/" xmlns:s="http://www.w3.org/
2001/XMLSchema" xmlns:s0="zozo2" xmlns:tns1="dsws.businessobjects.com"
targetNamespace="zozo2" xmlns="http://schemas.xmlsoap.org/wsdl/"
name="BIServices">
<types>
<s:schema elementFormDefault="qualified" targetNamespace="zozo2">
<s:simpleType name="Operator">
<s:restriction base="s:string">
<s:enumeration value="EQUAL" />
<s:enumeration value="GREATER" />
<s:enumeration value="GREATER_OR_EQUAL" />
<s:enumeration value="LESS" />
<s:enumeration value="LESS_OR_EQUAL" />
<s:enumeration value="NOT_EQUAL" />
<s:enumeration value="INLIST" />
<s:enumeration value="NOT_INLIST" />
</s:restriction>
</s:simpleType>
<s:complexType name="FilterCondition">
<s:sequence>
<s:element name="value" type="s:string" />
<s:element name="operator" type="s0:Operator" />
</s:sequence>
</s:complexType>
<s:complexType name="LovValueIndex">
<s:sequence>
<s:element name="valueofPrompt" type="s:string" />
<s:element name="index" type="s:string" />
</s:sequence>
</s:complexType>
<s:complexType name="DrillFilter">
<s:sequence>
<s:element name="dimension" type="s:string" />
<s:element name="value" type="s:string" />
<s:element name="operator" type="s0:Operator" />
</s:sequence>
</s:complexType>
<s:element name="GetReportBlock_Block1">
<s:complexType>
<s:sequence>
<s:element name="login" type="s:string" minOccurs="0"
nillable="true" />
<s:element name="password" type="s:string" minOccurs="0"
nillable="true" />
<s:element name="Country" type="s0:FilterCondition" />
878
P U B L I C
SAP BusinessObjects Web Intelligence User's Guide
Sharing content with other applications

<s:element name="Resort" type="s0:FilterCondition"
minOccurs="0" maxOccurs="unbounded" nillable="true" />
<s:element name="Service_Line" type="s0:FilterCondition"
minOccurs="0" maxOccurs="unbounded" nillable="true" />
<s:element name="Revenue" type="s0:FilterCondition"
minOccurs="0" maxOccurs="unbounded" nillable="true" />
<s:element name="Enter_value_s__for_Country_"
type="s0:LovValueIndex" minOccurs="0" maxOccurs="unbounded" nillable="true" />
<s:element name="resetState" type="s:boolean" minOccurs="0"
nillable="true" />
<s:element name="refresh" type="s:boolean" minOccurs="0"
nillable="true" />
<s:element name="getFromLatestDocumentInstance"
type="s:boolean" minOccurs="0" nillable="true" />
<s:element name="getFromUserInstance" type="s:boolean"
minOccurs="0" nillable="true" />
<s:element name="turnOutputToVTable" type="s:boolean"
minOccurs="0" nillable="true" />
</s:sequence>
</s:complexType>
</s:element>
<s:element name="GetReportBlock_Block1ff">
<s:complexType>
<s:sequence>
<s:element name="login" type="s:string" minOccurs="0"
nillable="true" />
<s:element name="password" type="s:string" minOccurs="0"
nillable="true" />
<s:element name="Country" type="s0:FilterCondition"
minOccurs="0" maxOccurs="unbounded" nillable="true" />
<s:element name="Resort" type="s0:FilterCondition"
minOccurs="0" maxOccurs="unbounded" nillable="true" />
<s:element name="Service_Line" type="s0:FilterCondition"
minOccurs="0" maxOccurs="unbounded" nillable="true" />
<s:element name="Revenue" type="s0:FilterCondition"
minOccurs="0" maxOccurs="unbounded" nillable="true" />
<s:element name="Enter_value_s__for_Country_"
type="s0:LovValueIndex" minOccurs="0" maxOccurs="unbounded" nillable="true" />
<s:element name="resetState" type="s:boolean" minOccurs="0"
nillable="true" />
<s:element name="refresh" type="s:boolean" minOccurs="0"
nillable="true" />
<s:element name="getFromLatestDocumentInstance"
type="s:boolean" minOccurs="0" nillable="true" />
<s:element name="getFromUserInstance" type="s:boolean"
minOccurs="0" nillable="true" />
<s:element name="turnOutputToVTable" type="s:boolean"
minOccurs="0" nillable="true" />
</s:sequence>
</s:complexType>
</s:element>
<s:element name="GetReportBlock_Bloc1">
<s:complexType>
<s:sequence>
<s:element name="login" type="s:string" minOccurs="0"
nillable="true" />
<s:element name="password" type="s:string" minOccurs="0"
nillable="true" />
<s:element name="State" type="s0:FilterCondition"
minOccurs="0" maxOccurs="unbounded" nillable="true" />
<s:element name="City" type="s0:FilterCondition" minOccurs="0"
maxOccurs="unbounded" nillable="true" />
<s:element name="Sales_revenue" type="s0:FilterCondition"
minOccurs="0" maxOccurs="unbounded" nillable="true" />
<s:element name="resetState" type="s:boolean" minOccurs="0"
nillable="true" />
<s:element name="refresh" type="s:boolean" minOccurs="0"
nillable="true" />
SAP BusinessObjects Web Intelligence User's Guide
Sharing content with other applications
P U B L I C 879

<s:element name="getFromLatestDocumentInstance"
type="s:boolean" minOccurs="0" nillable="true" />
<s:element name="getFromUserInstance" type="s:boolean"
minOccurs="0" nillable="true" />
<s:element name="turnOutputToVTable" type="s:boolean"
minOccurs="0" nillable="true" />
</s:sequence>
</s:complexType>
</s:element>
<s:simpleType name="DrillOperation">
<s:restriction base="s:string">
<s:enumeration value="UP" />
<s:enumeration value="DOWN" />
</s:restriction>
</s:simpleType>
<s:complexType name="DrillPath">
<s:sequence>
<s:element name="from" type="s:string" />
<s:element name="value" type="s:string" />
<s:element name="drillOperation" type="s0:DrillOperation" />
</s:sequence>
</s:complexType>
<s:element name="Drill_Block1">
<s:complexType>
<s:sequence>
<s:element name="login" type="s:string" minOccurs="0"
nillable="true" />
<s:element name="password" type="s:string" minOccurs="0"
nillable="true" />
<s:element name="drillPath" type="s0:DrillPath" minOccurs="0"
maxOccurs="unbounded" nillable="true" />
<s:element name="filter" type="s0:DrillFilter" minOccurs="0"
maxOccurs="unbounded" nillable="true" />
<s:element name="Enter_value_s__for_Country_"
type="s0:LovValueIndex" minOccurs="0" maxOccurs="unbounded" nillable="true" />
<s:element name="resetState" type="s:boolean" minOccurs="0"
nillable="true" />
<s:element name="refresh" type="s:boolean" minOccurs="0"
nillable="true" />
<s:element name="getFromLatestDocumentInstance"
type="s:boolean" minOccurs="0" nillable="true" />
<s:element name="getFromUserInstance" type="s:boolean"
minOccurs="0" nillable="true" />
<s:element name="turnOutputToVTable" type="s:boolean"
minOccurs="0" nillable="true" />
</s:sequence>
</s:complexType>
</s:element>
<s:element name="Drill_Block1ff">
<s:complexType>
<s:sequence>
<s:element name="login" type="s:string" minOccurs="0"
nillable="true" />
<s:element name="password" type="s:string" minOccurs="0"
nillable="true" />
<s:element name="drillPath" type="s0:DrillPath" minOccurs="0"
maxOccurs="unbounded" nillable="true" />
<s:element name="filter" type="s0:DrillFilter" minOccurs="0"
maxOccurs="unbounded" nillable="true" />
<s:element name="Enter_value_s__for_Country_"
type="s0:LovValueIndex" minOccurs="0" maxOccurs="unbounded" nillable="true" />
<s:element name="resetState" type="s:boolean" minOccurs="0"
nillable="true" />
<s:element name="refresh" type="s:boolean" minOccurs="0"
nillable="true" />
<s:element name="getFromLatestDocumentInstance"
type="s:boolean" minOccurs="0" nillable="true" />
880
P U B L I C
SAP BusinessObjects Web Intelligence User's Guide
Sharing content with other applications

<s:element name="getFromUserInstance" type="s:boolean"
minOccurs="0" nillable="true" />
<s:element name="turnOutputToVTable" type="s:boolean"
minOccurs="0" nillable="true" />
</s:sequence>
</s:complexType>
</s:element>
<s:element name="Drill_Bloc1">
<s:complexType>
<s:sequence>
<s:element name="login" type="s:string" minOccurs="0"
nillable="true" />
<s:element name="password" type="s:string" minOccurs="0"
nillable="true" />
<s:element name="drillPath" type="s0:DrillPath" minOccurs="0"
maxOccurs="unbounded" nillable="true" />
<s:element name="filter" type="s0:DrillFilter" minOccurs="0"
maxOccurs="unbounded" nillable="true" />
<s:element name="resetState" type="s:boolean" minOccurs="0"
nillable="true" />
<s:element name="refresh" type="s:boolean" minOccurs="0"
nillable="true" />
<s:element name="getFromLatestDocumentInstance"
type="s:boolean" minOccurs="0" nillable="true" />
<s:element name="getFromUserInstance" type="s:boolean"
minOccurs="0" nillable="true" />
<s:element name="turnOutputToVTable" type="s:boolean"
minOccurs="0" nillable="true" />
</s:sequence>
</s:complexType>
</s:element>
<s:complexType name="TRow">
<s:sequence>
<s:element name="cell" type="s:anyType" maxOccurs="unbounded"
nillable="true" />
</s:sequence>
</s:complexType>
<s:complexType name="TTable">
<s:sequence>
<s:element name="row" maxOccurs="unbounded" type="s0:TRow" />
</s:sequence>
</s:complexType>
<s:complexType name="THeader">
<s:sequence>
<s:element name="row" maxOccurs="unbounded" type="s0:TRow" />
</s:sequence>
</s:complexType>
<s:complexType name="TFooter">
<s:sequence>
<s:element name="row" maxOccurs="unbounded" type="s0:TRow" />
</s:sequence>
</s:complexType>
<s:element name="GetReportBlock_Block1Response">
<s:complexType>
<s:sequence>
<s:element name="table" type="s0:TTable" />
<s:element name="headers" type="s0:THeader" />
<s:element name="footers" type="s0:TFooter" />
<s:element name="user" type="s:string" />
<s:element name="documentation" type="s:string" />
<s:element name="documentname" type="s:string" />
<s:element name="lastrefreshdate" type="s:dateTime" />
<s:element name="creationdate" type="s:dateTime" />
<s:element name="creator" type="s:string" />
<s:element name="isScheduled" type="s:boolean" />
<s:element name="scheduleStartTime" type="s:dateTime" />
<s:element name="scheduleEndTime" type="s:dateTime" />
<s:element name="tableType" type="s:string" />
SAP BusinessObjects Web Intelligence User's Guide
Sharing content with other applications
P U B L I C 881

<s:element name="nbColumns" type="s:int" />
<s:element name="nbLines" type="s:int" />
</s:sequence>
</s:complexType>
</s:element>
<s:element name="Drill_Block1Response">
<s:complexType>
<s:sequence>
<s:element name="table" type="s0:TTable" />
<s:element name="headers" type="s0:THeader" />
<s:element name="footers" type="s0:TFooter" />
<s:element name="user" type="s:string" />
<s:element name="documentation" type="s:string" />
<s:element name="documentname" type="s:string" />
<s:element name="lastrefreshdate" type="s:dateTime" />
<s:element name="creationdate" type="s:dateTime" />
<s:element name="creator" type="s:string" />
<s:element name="isScheduled" type="s:boolean" />
<s:element name="scheduleStartTime" type="s:dateTime" />
<s:element name="scheduleEndTime" type="s:dateTime" />
<s:element name="tableType" type="s:string" />
<s:element name="nbColumns" type="s:int" />
<s:element name="nbLines" type="s:int" />
</s:sequence>
</s:complexType>
</s:element>
<s:element name="GetReportBlock_Block1ffResponse">
<s:complexType>
<s:sequence>
<s:element name="table" type="s0:TTable" />
<s:element name="headers" type="s0:THeader" />
<s:element name="footers" type="s0:TFooter" />
<s:element name="user" type="s:string" />
<s:element name="documentation" type="s:string" />
<s:element name="documentname" type="s:string" />
<s:element name="lastrefreshdate" type="s:dateTime" />
<s:element name="creationdate" type="s:dateTime" />
<s:element name="creator" type="s:string" />
<s:element name="isScheduled" type="s:boolean" />
<s:element name="scheduleStartTime" type="s:dateTime" />
<s:element name="scheduleEndTime" type="s:dateTime" />
<s:element name="tableType" type="s:string" />
<s:element name="nbColumns" type="s:int" />
<s:element name="nbLines" type="s:int" />
</s:sequence>
</s:complexType>
</s:element>
<s:element name="Drill_Block1ffResponse">
<s:complexType>
<s:sequence>
<s:element name="table" type="s0:TTable" />
<s:element name="headers" type="s0:THeader" />
<s:element name="footers" type="s0:TFooter" />
<s:element name="user" type="s:string" />
<s:element name="documentation" type="s:string" />
<s:element name="documentname" type="s:string" />
<s:element name="lastrefreshdate" type="s:dateTime" />
<s:element name="creationdate" type="s:dateTime" />
<s:element name="creator" type="s:string" />
<s:element name="isScheduled" type="s:boolean" />
<s:element name="scheduleStartTime" type="s:dateTime" />
<s:element name="scheduleEndTime" type="s:dateTime" />
<s:element name="tableType" type="s:string" />
<s:element name="nbColumns" type="s:int" />
<s:element name="nbLines" type="s:int" />
</s:sequence>
</s:complexType>
</s:element>
882
P U B L I C
SAP BusinessObjects Web Intelligence User's Guide
Sharing content with other applications

<s:element name="GetReportBlock_Bloc1Response">
<s:complexType>
<s:sequence>
<s:element name="table" type="s0:TTable" />
<s:element name="headers" type="s0:THeader" />
<s:element name="footers" type="s0:TFooter" />
<s:element name="user" type="s:string" />
<s:element name="documentation" type="s:string" />
<s:element name="documentname" type="s:string" />
<s:element name="lastrefreshdate" type="s:dateTime" />
<s:element name="creationdate" type="s:dateTime" />
<s:element name="creator" type="s:string" />
<s:element name="isScheduled" type="s:boolean" />
<s:element name="scheduleStartTime" type="s:dateTime" />
<s:element name="scheduleEndTime" type="s:dateTime" />
<s:element name="tableType" type="s:string" />
<s:element name="nbColumns" type="s:int" />
<s:element name="nbLines" type="s:int" />
</s:sequence>
</s:complexType>
</s:element>
<s:element name="Drill_Bloc1Response">
<s:complexType>
<s:sequence>
<s:element name="table" type="s0:TTable" />
<s:element name="headers" type="s0:THeader" />
<s:element name="footers" type="s0:TFooter" />
<s:element name="user" type="s:string" />
<s:element name="documentation" type="s:string" />
<s:element name="documentname" type="s:string" />
<s:element name="lastrefreshdate" type="s:dateTime" />
<s:element name="creationdate" type="s:dateTime" />
<s:element name="creator" type="s:string" />
<s:element name="isScheduled" type="s:boolean" />
<s:element name="scheduleStartTime" type="s:dateTime" />
<s:element name="scheduleEndTime" type="s:dateTime" />
<s:element name="tableType" type="s:string" />
<s:element name="nbColumns" type="s:int" />
<s:element name="nbLines" type="s:int" />
</s:sequence>
</s:complexType>
</s:element>
<s:element name="QaaWSHeader">
<s:complexType>
<s:sequence>
<s:element name="sessionID" type="s:string" minOccurs="0"
maxOccurs="1" nillable="true" />
<s:element name="serializedSession" type="s:string"
minOccurs="0" maxOccurs="1" nillable="true" />
</s:sequence>
</s:complexType>
</s:element>
</s:schema>
</types>
<message name="GetReportBlock_Block1SoapIn">
<part name="parameters" element="s0:GetReportBlock_Block1" />
<part name="request_header" element="s0:QaaWSHeader" />
</message>
<message name="GetReportBlock_Block1SoapOut">
<part name="parameters" element="s0:GetReportBlock_Block1Response" />
</message>
<message name="Drill_Block1SoapIn">
<part name="parameters" element="s0:Drill_Block1" />
<part name="request_header" element="s0:QaaWSHeader" />
</message>
<message name="Drill_Block1SoapOut">
<part name="parameters" element="s0:Drill_Block1Response" />
</message>
SAP BusinessObjects Web Intelligence User's Guide
Sharing content with other applications
P U B L I C 883

<message name="GetReportBlock_Block1ffSoapIn">
<part name="parameters" element="s0:GetReportBlock_Block1ff" />
<part name="request_header" element="s0:QaaWSHeader" />
</message>
<message name="GetReportBlock_Block1ffSoapOut">
<part name="parameters" element="s0:GetReportBlock_Block1ffResponse" />
</message>
<message name="Drill_Block1ffSoapIn">
<part name="parameters" element="s0:Drill_Block1ff" />
<part name="request_header" element="s0:QaaWSHeader" />
</message>
<message name="Drill_Block1ffSoapOut">
<part name="parameters" element="s0:Drill_Block1ffResponse" />
</message>
<message name="GetReportBlock_Bloc1SoapIn">
<part name="parameters" element="s0:GetReportBlock_Bloc1" />
<part name="request_header" element="s0:QaaWSHeader" />
</message>
<message name="GetReportBlock_Bloc1SoapOut">
<part name="parameters" element="s0:GetReportBlock_Bloc1Response" />
</message>
<message name="Drill_Bloc1SoapIn">
<part name="parameters" element="s0:Drill_Bloc1" />
<part name="request_header" element="s0:QaaWSHeader" />
</message>
<message name="Drill_Bloc1SoapOut">
<part name="parameters" element="s0:Drill_Bloc1Response" />
</message>
<portType name="BIServicesSoap">
<operation name="GetReportBlock_Block1">
<documentation />
<input message="s0:GetReportBlock_Block1SoapIn" />
<output message="s0:GetReportBlock_Block1SoapOut" />
</operation>
<operation name="Drill_Block1">
<documentation />
<input message="s0:Drill_Block1SoapIn" />
<output message="s0:Drill_Block1SoapOut" />
</operation>
<operation name="GetReportBlock_Block1ff">
<documentation />
<input message="s0:GetReportBlock_Block1ffSoapIn" />
<output message="s0:GetReportBlock_Block1ffSoapOut" />
</operation>
<operation name="Drill_Block1ff">
<documentation />
<input message="s0:Drill_Block1ffSoapIn" />
<output message="s0:Drill_Block1ffSoapOut" />
</operation>
<operation name="GetReportBlock_Bloc1">
<documentation />
<input message="s0:GetReportBlock_Bloc1SoapIn" />
<output message="s0:GetReportBlock_Bloc1SoapOut" />
</operation>
<operation name="Drill_Bloc1">
<documentation />
<input message="s0:Drill_Bloc1SoapIn" />
<output message="s0:Drill_Bloc1SoapOut" />
</operation>
</portType>
<binding name="BIServicesSoap" type="s0:BIServicesSoap">
<soap:binding transport="http://schemas.xmlsoap.org/soap/http"
style="document" />
<operation name="GetReportBlock_Block1">
<documentation />
<soap:operation soapAction="zozo2/GetReportBlock_Block1"
style="document" />
<input>
884
P U B L I C
SAP BusinessObjects Web Intelligence User's Guide
Sharing content with other applications

<soap:header message="s0:GetReportBlock_Block1SoapIn"
part="request_header" use="literal">
<soap:headerfault message="s0:GetReportBlock_Block1SoapIn"
part="request_header" use="literal" />
</soap:header>
<soap:body use="literal" parts="parameters" />
</input>
<output>
<soap:body use="literal" />
</output>
</operation>
<operation name="Drill_Block1">
<documentation />
<soap:operation soapAction="zozo2/Drill_Block1" style="document" />
<input>
<soap:header message="s0:Drill_Block1SoapIn" part="request_header"
use="literal">
<soap:headerfault message="s0:Drill_Block1SoapIn"
part="request_header" use="literal" />
</soap:header>
<soap:body use="literal" parts="parameters" />
</input>
<output>
<soap:body use="literal" />
</output>
</operation>
<operation name="GetReportBlock_Block1ff">
<documentation />
<soap:operation soapAction="zozo2/GetReportBlock_Block1ff"
style="document" />
<input>
<soap:header message="s0:GetReportBlock_Block1ffSoapIn"
part="request_header" use="literal">
<soap:headerfault message="s0:GetReportBlock_Block1ffSoapIn"
part="request_header" use="literal" />
</soap:header>
<soap:body use="literal" parts="parameters" />
</input>
<output>
<soap:body use="literal" />
</output>
</operation>
<operation name="Drill_Block1ff">
<documentation />
<soap:operation soapAction="zozo2/Drill_Block1ff" style="document" />
<input>
<soap:header message="s0:Drill_Block1ffSoapIn" part="request_header"
use="literal">
<soap:headerfault message="s0:Drill_Block1ffSoapIn"
part="request_header" use="literal" />
</soap:header>
<soap:body use="literal" parts="parameters" />
</input>
<output>
<soap:body use="literal" />
</output>
</operation>
<operation name="GetReportBlock_Bloc1">
<documentation />
<soap:operation soapAction="zozo2/GetReportBlock_Bloc1"
style="document" />
<input>
<soap:header message="s0:GetReportBlock_Bloc1SoapIn"
part="request_header" use="literal">
<soap:headerfault message="s0:GetReportBlock_Bloc1SoapIn"
part="request_header" use="literal" />
</soap:header>
<soap:body use="literal" parts="parameters" />
SAP BusinessObjects Web Intelligence User's Guide
Sharing content with other applications
P U B L I C 885

</input>
<output>
<soap:body use="literal" />
</output>
</operation>
<operation name="Drill_Bloc1">
<documentation />
<soap:operation soapAction="zozo2/Drill_Bloc1" style="document" />
<input>
<soap:header message="s0:Drill_Bloc1SoapIn" part="request_header"
use="literal">
<soap:headerfault message="s0:Drill_Bloc1SoapIn"
part="request_header" use="literal" />
</soap:header>
<soap:body use="literal" parts="parameters" />
</input>
<output>
<soap:body use="literal" />
</output>
</operation>
</binding>
<service name="zozo2">
<documentation />
<port name="BIServicesSoap" binding="s0:BIServicesSoap">
<soap:address location="http://noux:8080/dswsbobje/qaawsservices/
queryasaservice?
&cuid=AduDhWyVezRPnnJM_FDS4S0&authType=secEnterprise&locale=en_US&timeout=60" />
</port>
</service>
</definitions>
886
P U B L I C
SAP BusinessObjects Web Intelligence User's Guide
Sharing content with other applications

9 Working with documents in Reading
mode
9.1 Interacting with Web Intelligence documents in Reading
mode
Web Intelligence shows complex and varied data in reports that you can understand quickly and easily.
Web Intelligence documents, based on queries created in one of several available applications, for example BEx
or OLAP, are designed in Design mode to be viewed in Reading mode by any number of general or specic
groups or individuals. This section explains or directs you to information on the functions you can perform
while in the Reading mode.
Depending on the user security and access rights set for you by the BI administrator, when you open a Web
Intelligence
document in Reading mode, there are several actions you can perform on reports in the document.
Actions you can perform in a Web Intelligence document include:
● Create, open, save, print, refresh export, send documents.
● Search for a document in the Corporate or Personal documents or on your computer.
● View the history of a scheduled document or the document outline.
● Track changes in a document.
● Rene the data displayed through lters and drilling.
Note
If you plan to open Web Intelligence Rich Client from your computer to view documents, you need to
complete certain processes. For more information, consult the Setting up and using Web Intelligence Rich
Client section in this document or online help.
Related Information
Features available in Web Intelligence Reading mode [page 888]
To start Web Intelligence in the BI launch pad [page 30]
About Web Intelligence [page 19]
Side Panel tabs in Web Intelligence [page 27]
About setting Web Intelligence preferences [page 46]
Choosing the viewing and design interfaces [page 47]
Saving and exporting documents in Reading mode [page 889]
Viewing modes [page 249]
Tracking changes in data [page 259]
SAP BusinessObjects Web Intelligence User's Guide
Working with documents in Reading mode
P U B L I C 887
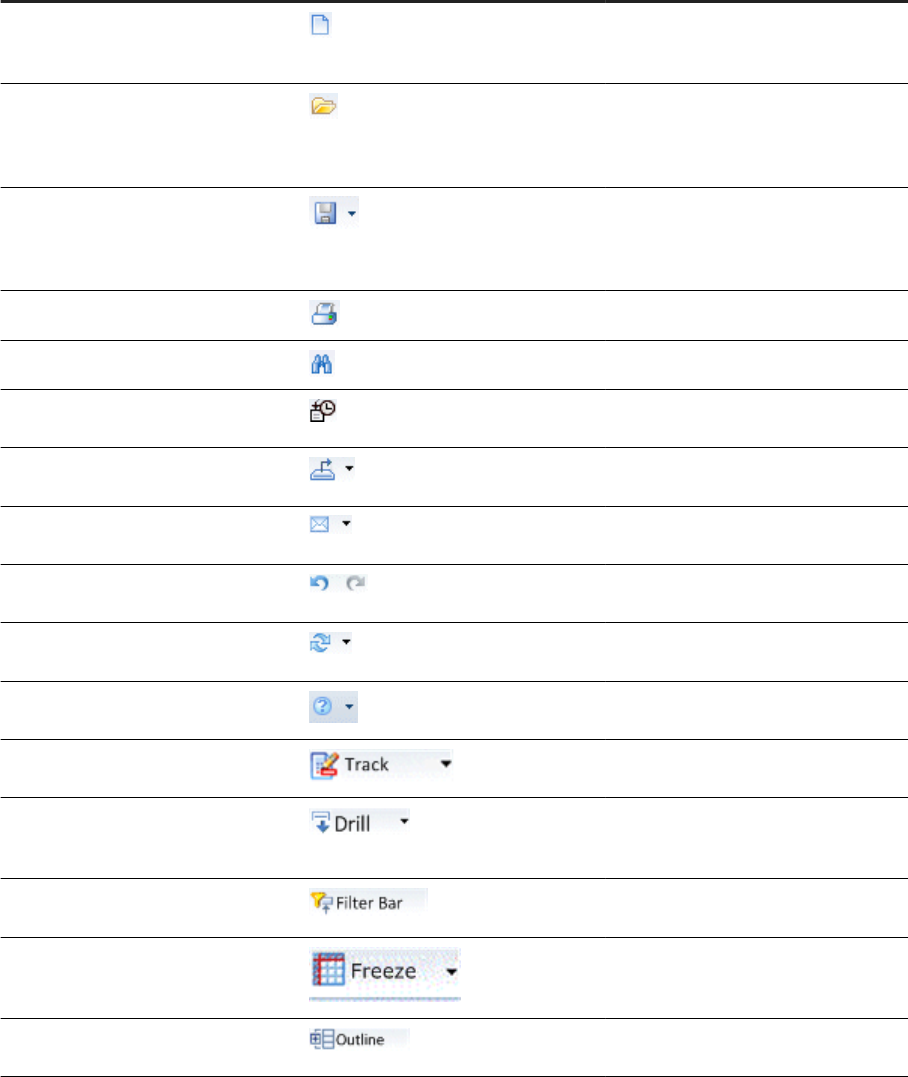
9.1.1 Features available in Web Intelligence Reading mode
When you view Web Intelligence documents in the Reading mode, there are several buttons, icons and other
features that you can use, depending on the user security and access rights set for you by the BI administrator.
Reading mode features
Task
Icon Description
Create documents Click to create a document based on a
universe or that does not require access
to a data source.
Open documents Click to open documents in the per
sonal folder or from corporate folders
to which access has been granted by
the BI administrator.
Save documents
Click to save a document to the per
sonal folder or to a corporate folder to
which access has been granted by the
BI administrator.
Print documents
Click to print a document.
Search for a document Click to nd text on a report page.
View the document history Click to view the history of the docu
ment.
Export documents or one of its reports Click to export a document or one of its
reports in a variety of formats.
Send a document Click to send a document or one of its
reports in a variety of formats.
Undo or redo an action Click to control an action performed on
a report in a document.
Refresh a document Click to refresh a document so that the
latest data appears.
Access help Click to access the user help for Web In
telligence.
Track changes in a document Click to activate the change tracking for
a document.
Drill on data Click to activate drilling in the docu
ment on any objects with more than
one level.
Filter document data Click to create a simple lter that limits
the data shown.
Freeze table headers , rows and col
umns
Choose to freeze headers, rows and col
umns in tables so that they remain dis
played you are scrolling through a table.
Show document outline Click to show the outline of a document
and its reports, if one exists.
888 P UB L I C
SAP BusinessObjects Web Intelligence User's Guide
Working with documents in Reading mode
Task Icon Description
Toggle between pages You can move forward or backwards
one page, enter a specic page number,
or toggle to the beginning or end of a
report in a document.
Toggle between page displays
You can toggle easily and quickly be
tween Quick Display and Page mode.
Zoom in a report You can zoom in and out on a displayed
report.
Related Information
Choosing the viewing and design interfaces [page 47]
9.1.2 Saving and exporting documents in Reading mode
You use Web Intelligence to save and export the current document or active report in one or more locations or
formats.
Note
You cannot use the Save As feature to save the document or report as a text, Excel or PDF le in the Web
Intelligence HTML interface, however you can export documents or reports in those formats to your
computer or another location.
Related Information
To save a document as a text le [page 458]
To save a document in the corporate repository [page 457]
To save a document as a PDF le [page 456]
To save a document as an Excel spreadsheet [page 455]
Exporting documents, reports or data [page 460]
SAP BusinessObjects Web Intelligence User's Guide
Working with documents in Reading mode
P U B L I C 889

9.1.3 Printing reports
You can print one or multiple reports from a Web Intelligence document.
You print documents directly from Web Intelligence Applet interface and Web Intelligence Rich Client. However,
when you print from the Web Intelligence HTML interface, you export the document to a PDF le that you can
then print.
Note
If a report is wider than the width of the paper size dened in the Report Page Layout, page breaks are
inserted. The paper size and page orientation for printing can be dierent from the paper size and page
orientation set for the reports when you view them in Web Intelligence Applet interface or Web Intelligence
Rich Client.
9.1.3.1 To print reports in Web Intelligence
A variety of methods are available for printing reports in Web Intelligence.
Procedure
1. Open a Web Intelligence document.
2. Do one of the following:
○ In the Web Intelligence HTML interface:
○ If you are in Reading mode, click the arrow next to the Print icon on the toolbar.
○ If you are in Design or Data mode, click the arrow next to the Print icon in the File tab toolbar.
○ In the Web Intelligence Applet interface or Web Intelligence Rich Client interface:
○ If you are in Reading mode, click the Print icon on the toolbar.
○ If you are in Design or Data mode, click the Print icon in the File tab toolbar.
The Print dialog box appears.
3. Do one of the following:
○ In the Web Intelligence HTML interface: choose your printing options and click Print.
○ In the Web Intelligence Applet interface or Web Intelligence Rich Client interface: choose your printing
options and click OK.
○ In the Web Intelligence HTML interface: the File Download dialog box appears. Open the PDF le and
print the report.
○ In the Web Intelligence Applet interface or Web Intelligence Rich Client interface: the report is sent to
the printer.
Note
In the Web Intelligence HTML interface, click the Print icon to print the report with current settings.
890
P U B L I C
SAP BusinessObjects Web Intelligence User's Guide
Working with documents in Reading mode
9.1.4 Finding text in a report page
You can search for text in a report in a Web Intelligence document in Reading or Design mode.
Procedure
1. Open a Web Intelligence document.
2. Do one of the following:
○ If you are in Reading mode, click the Find icon on the toolbar.
○ If you are in Design mode, click the Find icon on the toolbar in the File tab toolbar.
The Find or Search Bar appears at the bottom of the report panel.
3. Type text in the Find or Search Bar box and press Enter or click the Find icon.
Note
To perform a case-sensitive search, click the arrow next to the box and select Match case.
4. If the text occurs more than once, click the Next or Previous icon to highlight other occurrences of the text.
Note
If you are creating a report using the Web Intelligence Applet interface or Web Intelligence Rich Client,
you can click Highlight all to highlight all occurrences of the text on the page. This option is not available
once you have saved or closed the document.
Results
To close the Find or Search Bar box, click the X located at the far end of the Find or Search Bar.
9.1.5 To send a document by email
You can send a Web Intelligence document as an email attachment.
Procedure
1. Open a Web Intelligence document.
2. Depending on the Web Intelligence interface you are using, do the following tasks:
○ In the Web Intelligence HTML interface:
SAP BusinessObjects Web Intelligence User's Guide
Working with documents in Reading mode
P U B L I C 891

○ In Reading mode, select Send to Mail from the Send to icon dropdown list.
○ In the Design mode, in the File tab, select Send to Mail from the Send to icon dropdown list.
○ In the Web Intelligence Applet interface:
○ In Reading mode, select Send to email from the Send document icon dropdown list.
○ In the Design or Data mode, in the File tab, select Send to email from the Send document icon
dropdown list.
○ In Web Intelligence Rich Client:
○ In Reading mode, select a document format from the Send by E-mail attachment icon dropdown
list.
○ In the Design or Data mode, in the File tab, select a document format from the Send by E-mail
attachment icon dropdown list.
Note
If your user prole does not allow you to send les by email, then the options for sending a document
by email do not appear, or you can encounter an error message if you try to use any of the options.
3. In the send by email dialog box, you can select the people to whom you wish to send an email, and enter a
subject and message.
4. Deactivate Add Attachment if you do not want to send the document as an attachment.
5. If you do wish to send the document as an attachment and wish to use a dierent name from the
document's name, select Use Specic Name and enter a dierent name.
6. Enter the addressees, any email text required, and send the email.
9.1.6 To send a document to another user or group in the
CMS
You can send a Web Intelligence document to another user in the CMS from the Web Intelligence HTML or Web
Intelligence Applet interface.
Procedure
1. Open a Web Intelligence document in the Web Intelligence HTML or Web Intelligence Applet interface.
2. Do one of the following:
○ If you are in Reading mode, select Send to User from the Send to or Send document icon dropdown list.
○ If you are in Design or Data mode, in the File tab toolbar, select Send to User from the Send to or Send
document icon dropdown list.
Note
This option is not available in the Web Intelligence Rich Client.
3. Select the users or groups to which you want to send the document from the list of users and groups.
4. Click Use Automatically Generated Name to send the document with an automatically-generated name.
892
P U B L I C
SAP BusinessObjects Web Intelligence User's Guide
Working with documents in Reading mode
5. Click Use Specic Name and type the name in the box to send if you want to name the document.
6. Click Shortcut to send a shortcut to the document or Copy to send a copy of the document.
7. Click Send.
9.1.7 To send a document by FTP
You can send a Web Intelligence document by FTP in the Web Intelligence HTML or Web Intelligence Applet
interface.
Procedure
1. Open a Web Intelligence document in the Web Intelligence HTML or Web Intelligence Applet interface.
Note
This option is not available in Web Intelligence Rich Client.
Note
Save any document changes before sending it.
2. Do one of the following:
○ If you are in Reading mode, from the Send to or Send document icon dropdown list, select Send to Ftp.
○ If you are in Design or Data mode, from the Send to or Send document icon dropdown list, select Send
to Ftp.
Note
You must have the required permissions to send les via FTP. If you do not have the permissions, the
Send to FTP dialog box does not appear, or appears with an error message.
3. Type the host name in the Host box.
4. Type the port in the Port box.
5. Type the username and password in the User Name and Password boxes.
6. Type the account in the Account box.
7. Type the directory in the Directory box.
8. Click Use Automatically Generated Name to send the document with an automatically-generated name.
9. Click Use Specic Name and type the name in the box to send if you want to name the document.
10. Click Send.
SAP BusinessObjects Web Intelligence User's Guide
Working with documents in Reading mode
P U B L I C 893

9.1.8 Viewing modes
In the Reading and Design document modes, you can view reports in dierent modes depending on how you
want to work with data and how you want the data to appear.
The viewing modes are controlled by buttons at the bottom of the Web Intelligence screen, on the status bar.
9.1.8.1 Page view mode
In the Reading and Design document modes, the Page view mode displays the page layout of reports, including
page margins, headers, and footers.
Use Page view mode when you want to ne-tune the formatting of tables and charts and the layout of report
pages.
9.1.8.2 Quick Display view mode
In the Reading and Design document modes, the Quick Display view mode is the default display mode.
It is a pagination mode that is based on the data, rather than the physical size of report pages. The Quick
Display view mode displays just the tables, reports, and free standing cells in reports and displays a maximum
number of records vertically and horizontally, depending on the Quick Display settings. The Quick Display view
mode also species the minimum page width and height and the amount of padding around the edges of the
report.
Because the Quick Display view mode restricts the number of horizontal and vertical rows, a report might not
contain all possible data.
Use the Quick Display view mode when you want to focus on analyzing results, add calculations or formulas, or
add breaks or sorts to tables to organize results.
The Quick Display view mode properties are congurable either by the BI administrator, or directly in the
interface.
Conguration Property
BI administrator
● Maximum vertical records
● Maximum horizontal records
● Minimum page width
● Minimum page height
● Right padding
●
Bottom padding
Interface
● Vertical records per page
894 P U B L I C
SAP BusinessObjects Web Intelligence User's Guide
Working with documents in Reading mode

Conguration Property
Note
○ This property impacts only horizontal tables
and cross tables.
○ Horizontal tables are never cut vertically.
○ The number of rows in a horizontal table is
ignored in vertical records calculations.
● Horizontal records per page
Note
○ This property impacts only vertical tables,
forms and cross tables.
○ The number of rows in a vertical table is
ignored in horizontal records calculations.
Other notes:
● Table headers and footers do not count as rows.
● Free standing cells and charts do not count as rows.
● Section cells do not count as rows when the section is not empty.
● Sections cells count as vertical rows when the section is empty.
● The Avoid Page Break in Block option has no eect in Quick Display view mode.
9.1.8.3 To switch between viewing modes
You can switch between Quick Display and Page view modes.
Procedure
1. Open a Web Intelligence document, in the Reading or Design document mode.
2. In the status bar at the bottom of the document, select one of the following icons:
○ To display a report in Quick Display view mode, click the Quick Display icon.
○ To display a report in Page view mode, click the Page icon.
9.1.9 Tracking changes in data
To make informed and eective business intelligence decisions, you need to understand how the data on which
you base those decisions changes over time.
You can track and display data changes to help you focus your analysis on key areas and avoid wasting time
exploring irrelevant data.
SAP BusinessObjects Web Intelligence User's Guide
Working with documents in Reading mode
P U B L I C 895

When you track data changes, you select a particular data refresh as a reference point. This data is known as
the reference data. When you activate data tracking, you see your data in relation to the reference data.
Here are some examples of data tracking:
● If an outlet no longer appears in a list of the top outlets by sales, it would be interpreted as deleted from the
list. You can use this information to investigate why the outlet is no longer a top performer.
● If sales have decreased in a region, data tracking displays the decrease. You can then drill down into the
data for the region to understand why revenue is falling.
In both these cases, data tracking makes the current data more meaningful by placing it in context with older
data. Without this context it is much more dicult to identify trends.
Note
● The information in the Status Bar at the bottom of the report indicates the document level status. An
asterisk on a report tab indicates that change tracking is activated on the report.
● Status “changes” of tracking data changes is only for a detail value when displayed with its associated
dimension in the table. When the detail is given without it is associated dimension it is considered as a
dimension and does not show the status changes (but only shows when the detail is inserted/deleted).
Related Information
Types of data change [page 260]
Automatic update tracking mode [page 260]
Absolute reference data tracking mode [page 260]
To activate data tracking [page 261]
To display changed data [page 262]
Conguring the appearance of changed data [page 261]
To congure the appearance of changed data [page 262]
How changed data is displayed in blocks [page 263]
How changed data is displayed in blocks with breaks [page 266]
How changed data is displayed in sections [page 265]
How changed data is displayed in reports with merged dimensions [page 264]
How changed data is displayed in charts [page 267]
9.1.10 Drilling on report data in Reading mode
Drilling on reports lets you look deeper into your data to discover the details behind a good or bad summary
result displayed in tables, charts, or sections.
Example
Why did sales of accessories, outwear, and overcoats rise in Q3?
You work for a US national fashion retail chain, and are in charge of sales of accessories, outerwear and
overcoat clothing lines in western states. You see that revenue is much higher for Q3 than the other
896
P U B L I C
SAP BusinessObjects Web Intelligence User's Guide
Working with documents in Reading mode

quarters. To understand why, you drill down to look at the factors behind the result and you see that jewelry
sales were much higher in July.
9.1.10.1 Setting drill options
Before you begin a drill session, you can set your drill options to specify how reports will change each time you
drill.
How you set the drill options depends on the interface you are using:
● BI launch pad, if you are using the Web Intelligence HTML or Web Intelligence Applet interface.
● Your computer, if you are using Web Intelligence Rich Client from the BI platform deployment on your
computer.
Related Information
To set drill options in the BI launch pad [page 489]
To set drill options in Web Intelligence Rich Client [page 490]
Synchronize drill on report blocks option [page 490]
Hide Drill toolbar on startup option [page 491]
Start drill session on existing report option [page 491]
Start drill session on a duplicate report option [page 491]
9.1.10.2 Drilling on measures in tables and sections
When you drill on a measure value, you drill one level down for each related dimension in the block, and you see
the measure calculated for the displayed dimensions.
Example
Drill on annual sales revenue results to see the breakdown by city and quarter
For example, you drill down on the year 2003 sales revenue value for California, which is displayed on a
crosstab that shows sales revenue by year and by state.
The drilled report displays sales revenue by quarter (one level below Year) and by city (one level below
State) for California.
SAP BusinessObjects Web Intelligence User's Guide
Working with documents in Reading mode
P U B L I C 897
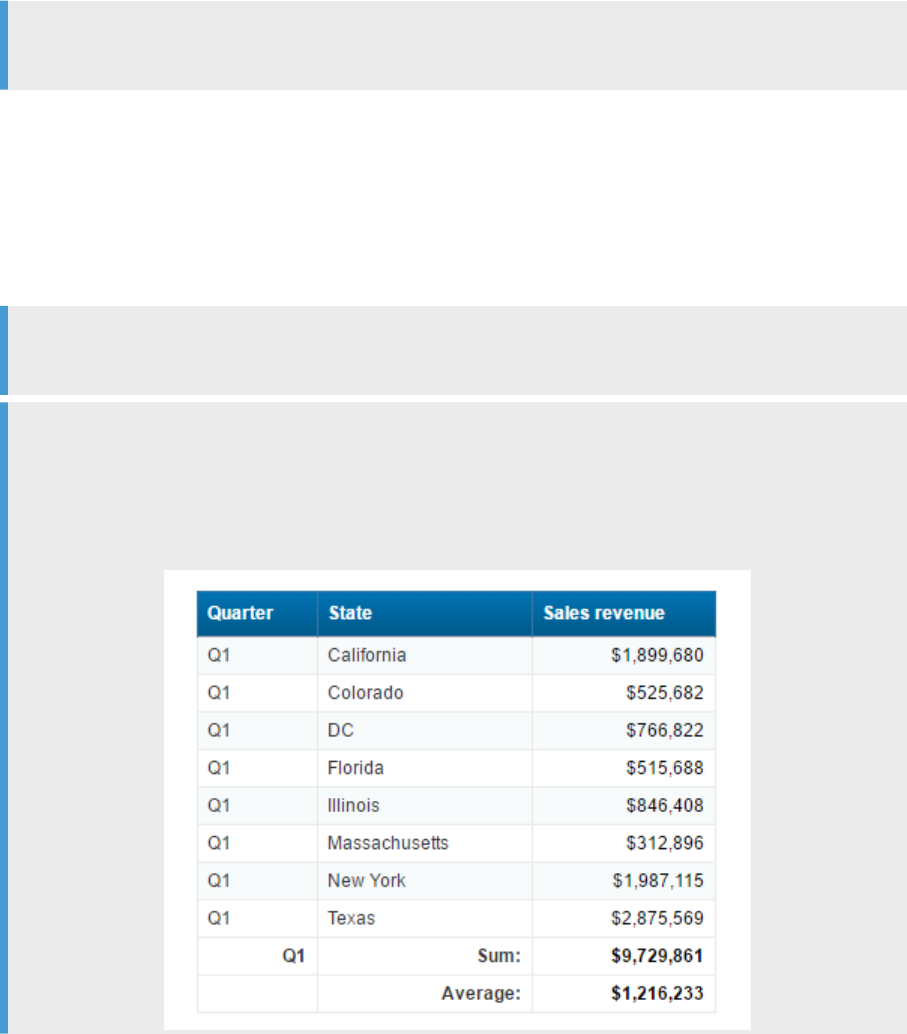
9.1.10.3 Drilling on dimensions in tables and sections
When you drill on a dimension to see the more data behind the displayed result, it is calculated according to the
values to which you drill.
Dimensions typically represent character data, such as customer or business names, and dates. Calculations
are based around the dimensions in a report. For example, a report calculates a region’s total sales revenue for
a given year where a Sales Revenue measure is calculated based on the State and Year dimensions.
If you drill on Year, you display sales revenue by state and quarter, because Quarter is the next dimension in the
time hierarchy below Year.
Note
Detail objects cannot be drilled on in reports.
9.1.10.4 Drilling by other dimensions in a report
When you drill down or up, you move through a hierarchy one dimension at a time.
However, you can get another view of the data by slicing it in a dierent way, and then look at the data in other
hierarchies. To do this, you drill by the other dimensions that interest you.
Note
You can only use Drill by with a dimension that is included in the scope of analysis of the document.
Example
Drilling by the Products hierarchy to slice sales revenue results by product
You work as regional manager for California in a retail clothing store, and have been sent the following
report that shows quarterly sales revenue by state:
898
P U B L I C
SAP BusinessObjects Web Intelligence User's Guide
Working with documents in Reading mode
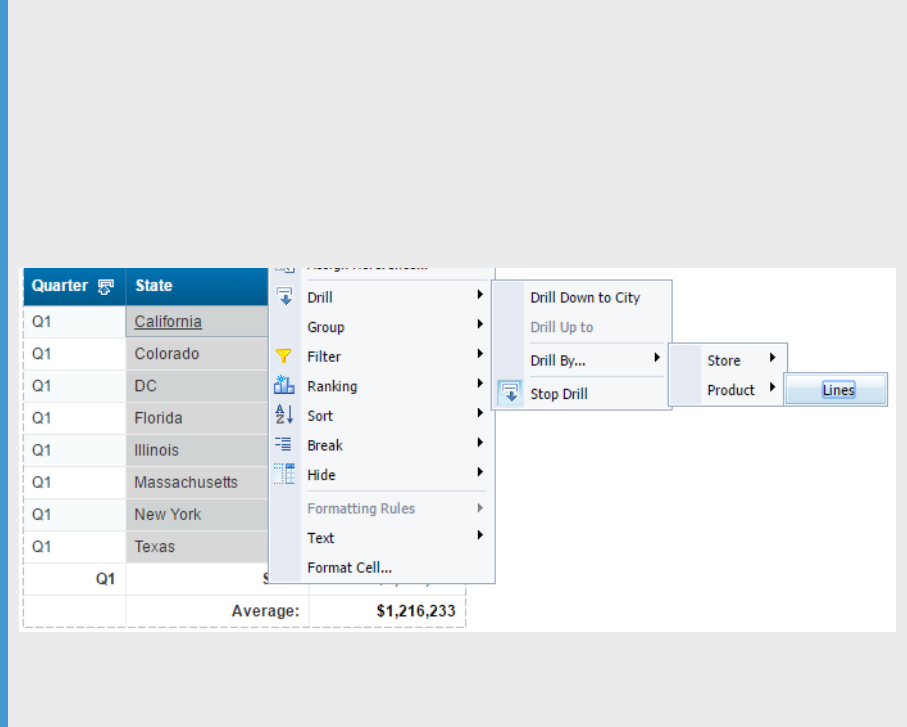
You are only interested in analyzing the results in the state of California. In addition, you want to analyze the
sales revenue broken down by each product line you sell. To drill on California data, you place your pointer
on the table cell that says California.
If you drilled down now, however, you would drill to results for each city within California, because [City] is
the dimension below [State]. Instead, you select Drill by from the drill menu and then you navigate through
the dimensions on the Products hierarchy by selecting the sub-menus until you reach the [Lines]
dimension.
The drilled report displays the detailed sales revenue results for each product line sold in California.
SAP BusinessObjects Web Intelligence User's Guide
Working with documents in Reading mode
P U B L I C 899
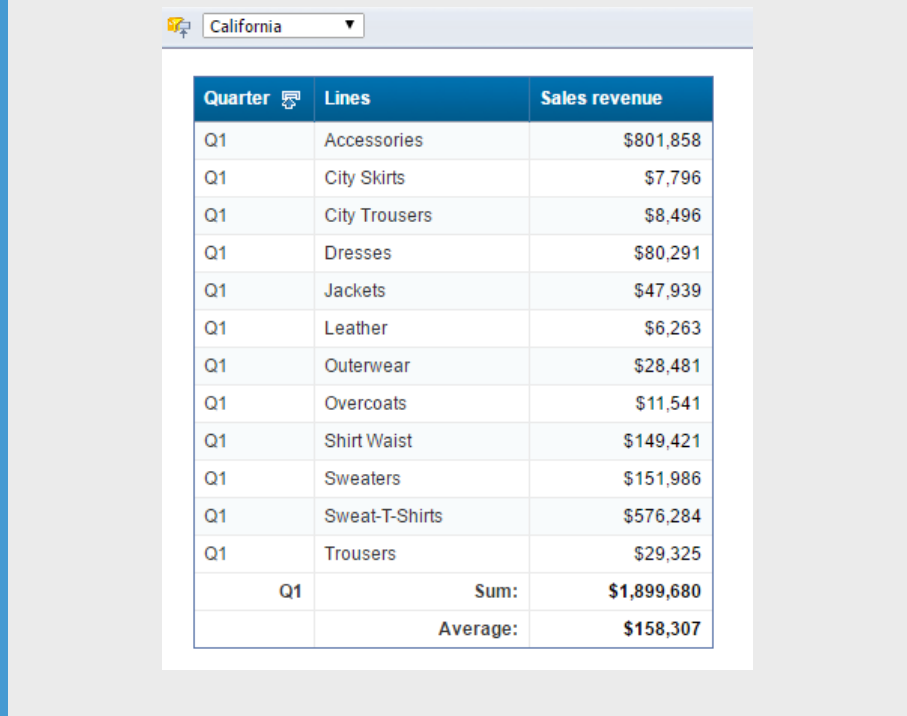
Related Information
Levels of scope of analysis [page 89]
Setting the scope of analysis [page 89]
9.1.10.5 Drilling on charts
Drilling down, up, or by on a chart, provides you with a graphical explanation for why summary results are
particularly high or low.
You can drill on:
● dimensions – by drilling on chart axes or the chart legend
● measures – by drilling on the data bars or markers in the body of the chart
You cannot drill by dimensions on chart axes. However, you can drill by dimensions on chart legends.
900
P U B L I C
SAP BusinessObjects Web Intelligence User's Guide
Working with documents in Reading mode

Related Information
Drilling on axis legends [page 503]
Drilling on dimensions via chart axes [page 500]
Drilling on measures in charts [page 501]
Restrictions when drilling measures on charts [page 503]
9.1.10.6 To take a snapshot of report drill results
You can create a report in the existing document that contains the results of a drill action.
Procedure
1. Open a Web Intelligence document in Reading or Design mode.
2. Activate the Drill mode:
○ If you are in Reading mode, select Start Drill Mode from the Drill dropdown list.
○ If you are in Design mode, go to the Analysis tab, and in the Interact subtab, select Start Drill Mode from
the Drill dropdown list.
3. Do one of the following:
○ If you are in Reading mode, select Snapshot from the Drill dropdown list.
○ If you are in Design mode, go to the Analysis tab, and in the Interact subtab, select Snapshot from the
Drill dropdown list.
9.1.11 Freezing table headers, columns and rows
When you view a Web Intelligence report in Reading mode, you can freeze headers, and rows or columns in
tables to keep them displayed as you scroll through data.
You can freeze one or several zones of your table, depending on the type of table. The following table lists zones
you can freeze according to the type of table:
Type of table
Zones you can freeze
Vertical table Header or data columns or both.
Horizontal table Header or data rows or both.
Cross table Vertical header or horizontal header or both.
You can freeze up to 5 data rows or columns.
SAP BusinessObjects Web Intelligence User's Guide
Working with documents in Reading mode
P U B L I C 901
Related Information
Unfreezing table headers, columns and rows [page 903]
9.1.11.1 To freeze table headers
You can freeze table headers in a Web Intelligence document in Reading mode.
Procedure
1. Open a Web Intelligence document in Reading mode.
2. In the Status Bar of the Report Panel, click the Quick Display mode button.
3. Select a cell in a table.
4. In the main toolbar, do one of the following:
○ Click the Freeze icon to freeze headers directly.
○ Click the arrow next to the Freeze icon and select Freeze Header Rows in vertical or cross tables, or
Freeze Header Columns in horizontal or cross tables.
Results
Headers are frozen.
9.1.11.2 To freeze top rows in a horizontal table
You can freeze the top rows in a table in a Web Intelligence document in Reading mode.
Procedure
1. Open a Web Intelligence document in Reading mode.
2. In the Status Bar of the Report Panel, click the Quick Display mode button.
3. Select a cell in a horizontal table.
4. In the main toolbar, click the arrow next to the Freeze icon.
5. Under Freeze Top Rows, select the number of rows you want to freeze.
902
P U B L I C
SAP BusinessObjects Web Intelligence User's Guide
Working with documents in Reading mode
Results
For example, if you select 2, the two rst top rows remain displayed while you scroll down in the table.
9.1.11.3 To freeze left columns in a vertical table
You can freeze columns in a table in a Web Intelligence document in Reading mode.
Procedure
1. Open a Web Intelligence document in Reading mode.
2. In the Status Bar of the Report Panel, click the Quick Display mode button.
3. Select a cell in a vertical table.
4. In the main toolbar, click the arrow next to the Freeze icon.
5. Under Freeze Left Columns, select the number of columns you want to freeze.
Results
For example, if you select 2, the two rst left columns remain displayed while you scroll sideways in the table.
9.1.12 Unfreezing table headers, columns and rows
To know which zones are frozen in a table, click the arrow next to the Freeze icon in the main toolbar.
If an element is selected, this element is frozen in the table.
Related Information
Freezing table headers, columns and rows [page 901]
SAP BusinessObjects Web Intelligence User's Guide
Working with documents in Reading mode
P U B L I C 903
9.1.12.1 To unfreeze table headers
You can unfreeze table headers in a Web Intelligence document in Reading mode.
Procedure
1. Open a Web Intelligence document in Reading mode.
2. In the Status Bar of the Report Panel, click the Quick Display Mode button.
3. Select a cell in a table that contains frozen headers.
4. In the main toolbar, click the arrow next to the Freeze icon.
5. Select any of the following:
○ Freeze Header Rows
○ Freeze Header Columns
Results
Headers are no longer frozen.
9.1.12.2 To unfreeze table rows and columns in vertical and
horizontal tables
You can unfreeze rows and columns in a table in a Web Intelligence document in Reading mode.
Procedure
1. Open a Web Intelligence document in Reading mode.
2. In the Status Bar of the Report Panel, click the Quick Display mode button.
3. Select a cell in a table that contains frozen rows or columns.
4. In the main toolbar, click the arrow next to the Freeze icon.
5. Select 0.
Results
Rows or columns are no longer frozen.
904
P U B L I C
SAP BusinessObjects Web Intelligence User's Guide
Working with documents in Reading mode

9.1.13 Using simple report lters
Simple report lters lter information in an open Web Intelligence report, not in the document or in specic
objects in the report.
The Report Filter toolbar provides a quick method for adding simple report lters to reports.
You can lter on the following objects in a report:
● Dimension or detail objects
● Hierarchies, characteristics or attributes for OLAP universes or BEx queries (but not at the hierarchy level
or on measures)
Simple report lters can only use the Equal to operator and can only lter on a single value. They can use the All
values operator.
Restriction
In 4.2 SP3, available lter operators on attributes for queries based on OLAP sources are limited to “Equal
to”, “In List” and “Matches pattern”. This only applies to attributes directly associated to hierarchies.
Related Information
To create simple report lters [page 517]
9.1.13.1 To create simple report lters
You can lter a report on the object value you select. For example, if you select "US" from the list of values of
the Country object, the report is ltered to exclude all rows where Country does not have the value "US".
Procedure
1. Open a Web Intelligence document.
2. Do one of the following:
○ In the Reading mode, click Filter Bar.
○ In Design mode, in the Analysis tab, select the Interact subtab and click Filter Bar.
The Report Filter toolbar appears.
Note
When opening the lter bar, lters are automatically inserted when their report scopes are:
○ Single value (Equal to operator)
○ With the All Values operator
SAP BusinessObjects Web Intelligence User's Guide
Working with documents in Reading mode
P U B L I C 905

Those lters are no longer displayed in the Filter box.
Note
When collapsing the Report Filter toolbar, all "simple lters" are put back as Equal to or All values report
lters that lter on the entire report. To avoid creating All values lters, remove the object from the lter
bar before you collapse it.
3. Click the add simple report lter icon on the toolbar and select the object on which you want to lter from
the menu.
You can add multiple objects to the toolbar to create multiple lters.
Note
Depending on the data sources and selected objects, the values or objects available in a lter may
depend on the values set in another lter object.
4. Select the value on which you want to lter from the dropdown list of values.
Note
For non-hierarchical objects, the list contains all values contained in the report for this object after
applying all other report scope lters. For example if you have an In List lter reducing this object
values, you will have this list of values for the lter bar Equal to lter.
For hierarchical objects, the list contains the at list of all member values at any level. This list is in tree
view order, not alphabetical order.
Tip
In the Web Intelligence Applet interface, or in Web Intelligence Rich Client, you can drag objects from
the tree view to the Report Filter toolbar.
Results
To remove a lter:
● In the Web Intelligence HTML interface in Reading or Design mode, from the dropdown list for the operator
in the Report Filter toolbar, select (Remove).
● In the Web Intelligence Applet interface or Web Intelligence Rich Client in Design mode, select the lter and
drag and drop it into the report.
Related Information
To create, edit, and delete standard report lters [page 513]
906
P U B L I C
SAP BusinessObjects Web Intelligence User's Guide
Working with documents in Reading mode

9.1.14 Folding and unfolding report data
You can hide and display report data by folding and unfolding the display of dierent report elements.
You can fold and unfold sections, breaks and tables. Data is concealed and displayed in dierent ways
depending on the report element.
Report element Result
Section
When a section is folded, section details are hidden and free
cells only are displayed. In Reading mode, you can fold and
unfold sections.
Table or break
When a table or break is folded, the rows are concealed, and
only headers and footers are displayed. Tables must have
headers and footers to be folded and unfolded.
Vertical tables, horizontal tables and cross tables can be
folded and unfolded.
In Reading mode, you can fold and unfold sections.
9.1.14.1 To fold and unfold report data
You can fold and unfold data in Reading and Design mode by activating the outline.
Procedure
1. Open a Web Intelligence document.
2. Select a cell in the table.
3. Do one of the following:
○ In the Reading mode, click Outline.
○ In the Design mode, in the Analysis tab, select the Interact subtab and click Outline.
The fold and unfold bars appear to the side of and above the report panel, depending on the report
structure.
4. Use the +/- or arrow icons on the bars, which correspond to and are aligned with individual report
elements, to fold and unfold them.
5. Use the icons at the side or upper part of the bar to fold and unfold all instances of a type of report element.
SAP BusinessObjects Web Intelligence User's Guide
Working with documents in Reading mode
P U B L I C 907

9.1.15 Warning icons in charts
Warning icons in charts can alert you when there are chart and data object errors.
The warning icons available are:
● General Warnings, icons displayed on the top left corner of the chart.
Red X in a white background: impossible to generate the chart. (This could be due to a cache problem -
try clearing temporary objects from cache.
White X in a red circle: cannot nd the image, the BI administrator should check load balancing settings
and enable service monitoring as described in the Business Intelligence Platform Administrator Guide.
Yellow warning: for example dataset too large (technical limit of the server), need to refresh the dataset,
other cube errors.
Blue alert: limit for optimal rendering
The display of the General Warning icons is controlled by the Hide warning icons in chart setting in the Web
Intelligence document properties. If this setting is activated, then no General Warning icons appear in the
charts.
● An incompatible chart data warning, small yellow warning icon displayed on the data point.
These occur if Show alert when the data is incompatible with the chart is activated in the chart format
options and the dataset is inconsistent with the chart parameters. For example, a warning can appear in a
Pie chart with negative values, negative values for a logarithmic scale, or inconsistent hierarchical values
for a Tree Map.
Restriction
Denition Result
Technical limits of the data received
from the Visualization Service, which is
responsible for displaying data in the
chart
Max number of rows = 50,000
Restriction
This is a non-congurable
parameter. It is hard-coded into
the product and cannot be
changed by properties of the APS
server in CMC or by manually
changing an XML le.
Only part of the dataset is rendered
and a warning icon appears, as well as
an informational tooltip.
Data restricted for optimal rendering The data is restricted by the chart type
and size for optimal appearance.
An alert icon appears, as well as a
tooltip showing optimization
guidelines.
Related Information
Viewing document properties [page 228]
908
P U B L I C
SAP BusinessObjects Web Intelligence User's Guide
Working with documents in Reading mode
10 Rights appendix
10.1 General rights
In this topic, nd all the general rights relevant to Web Intelligence.
Right Description
Use Lists of Values
Lets you use lists of values.
Export the report's data
Lets you export document data to Excel, PDF, and CSV
formats. If you do not have this right, you require the Save
as CSV, Save as Excel, or Save as PDF right; these rights let
you export documents in the specied format only.
Query script - enable viewing (SQL , MDX…)
Lets you view query scripts (SQL and MDX).
Query script - enable editing (SQL , MDX…)
Lets you edit query scripts (SQL and MDX). You can also
edit Free-hand SQL (FHSQL) data sources.
Refresh the report's data
Lets you refresh document data.
Edit Query
Lets you edit queries in the document.
Refresh List of Values
Lets you refresh lists of values for prompts when you create
the prompt or when you view the document. To do this, you
also require the Use Lists of Values right on the document.
Save as CSV
Lets you export documents as CSV les only. If you have the
Export the report's data right on a document already, you do
not require this right.
Save as Excel
Lets you export documents as Excel les only. If you have
the Export the report's data right on a document already,
you do not require this right.
Save as PDF
Lets you export documents as PDF les only. If you have the
Export the report's data right on a document already, you do
not require this right.
Send to
Lets you send documents to the Scheduler, to a BI platform
Inbox, or to send as hyperlinks in email. This right also lets
Web Intelligence Rich Client users send documents as email
attachments.
SAP BusinessObjects Web Intelligence User's Guide
Rights appendix
P U B L I C 909

10.2 Document rights
In this section, nd all the rights relevant to Web Intelligence documents.
Right Description
Data - enable data tracking Enables a user to track changed data
Data - enable formatting of changed data Enables a user to select formatting for changed data
Desktop interface - enable Web Intelligence Desktop Enables a user to use the Web Intelligence Desktop
interface
Desktop interface - export documents Enables a user to export documents to the CMS in the Web
Intelligence Desktop interface
Desktop interface - import documents Enables a user to import documents from the CMS in the
Web Intelligence Desktop interface
Desktop interface - install from BI launch pad Enables a user to download the Web Intelligence Desktop
interface from the BI launch pad
Desktop interface - print documents Enables a user to print documents from the Web
Intelligence Desktop interface
Desktop interface - remove document security Enables a user to remove document security from the Web
Intelligence Desktop interface
Desktop interface - save document for all users Enables a user to save documents for all users from the
Web Intelligence Desktop interface
Desktop interface - save documents locally Enables a user to save documents to a local disk in the Web
Intelligence Desktop interface
Desktop interface - send by mail Enables a user to send document in an email message from
the Web Intelligence Desktop interface
Desktop Interface - enable local data providers Enables a user to use personal data providers in the Web
Intelligence Desktop interface
Documents - disable automatic refresh on open Prevents documents from automatically refreshing when
they are opened
Documents - enable autosave Enables documents to be automatically saved, if autosaving
is activated in the CMC by the administrator
Documents - enable creation Enables a user to create new documents
Documents - enable publishing and content management Enables a user to publish document in the CMS
910 P U B L I C
SAP BusinessObjects Web Intelligence User's Guide
Rights appendix
Right Description
Interactive: Reporting - Create and edit alerter Enables a user to create and to edit alerts in the interactive
viewer
Interfaces - enable Rich Internet Application Enables a user to use the viewing and editing interface in
the Rich Internet Application
The Rich Internet Application was called Java Report panel
in earlier releases.
Interfaces - enable web viewing interface Enables a user to use the Web viewing interface
The Web viewing interface was called the DHTML viewer in
earlier releases.
Interfaces - enable web query panel Enables a user to use of the web query panel
The web query panel was called Query - HTML in earlier
releases.
General - edit 'My Preferences' Enables a user to edit preferences in the BI launch pad
General - enable right-click menus Enables a user to use context menus
Left pane - enable document summary Enables a user to display the document summary in the left
pane
Left pane - enable document structure and lter Enables a user to display the document structure and lters
in the left pane
Query script - enable editing (SQL, MDX... Enables a user to edit SQL and MDX query scripts
Query script - enable viewing (SQL, MDX... Enables a user to view SQL and MDX query scripts
Reporting - create and edit breaks Enables a user to create and to edit breaks
Reporting - create and edit conditional formatting rules Enables a user to create and to edit conditional formatting
rules
Reporting - create and edit predened calculations Enables a user to create and to edit predened calculations
Reporting - create and edit input controls Enables a user to create and to edit input controls
Reporting - create and edit report lters and consume input
controls
Enables a user to creation and editing of report lters and
input controls(Input Controls pane in the Left Pane are not
displayed when disabled)
Reporting - create and edit sorts Enables a user to create and to edit sorts
Reporting - create formulas and variables Enables a user to create formulas and variables
Reporting - enable formatting Enables a user to edit report formatting
SAP BusinessObjects Web Intelligence User's Guide
Rights appendix
P U B L I C 911
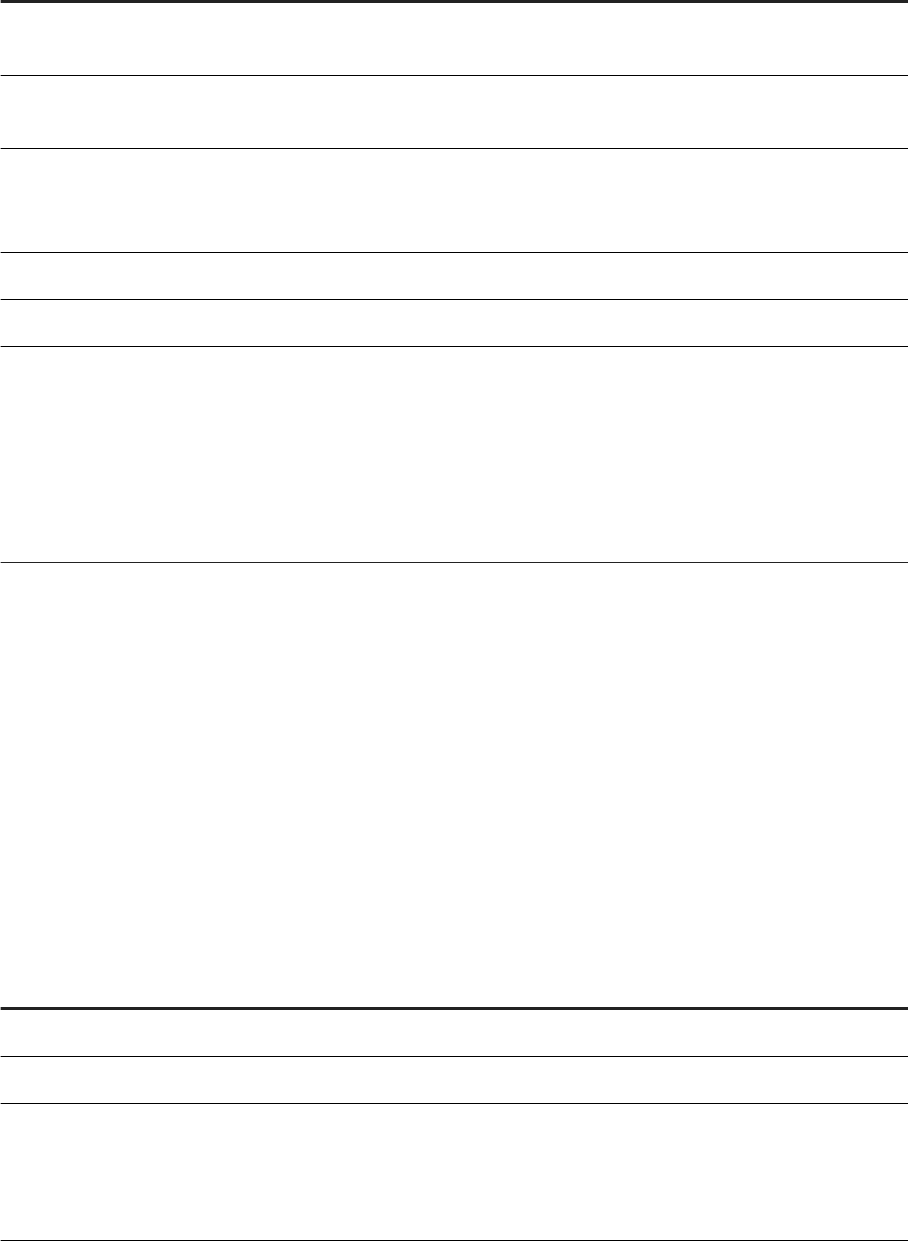
Right Description
Without this access right, the Design and Data mode is not
available.
Reporting - enable merged dimensions Enables a user to synchronize data using merged
dimensions in reports and in the data manager
Reporting - insert and remove reports, tables, charts and
cells
● Enables a user to insert and to remove reports, tables,
charts, and cells
● Enables the duplicates workow (copy/paste)
Sharing - publish shared elements Enables a user to create shared elements in a document
Sharing - insert shared elements Enables a user to add shared elements in a document
Change preferences for objects that the user owns Displays the Preferences menu in an application object
Without this access right, a user cannot set personal
preferences in any application and no Preferences menu will
appear in applications. For example, without this right,
users cannot select the unit of measurement (inches or
millimeters) to use in reports in the Web Intelligence or BI
launch pad application.
10.3
Connection rights
The rights in this section are type-specic rights that apply to universe connections or general rights that have
a specic meaning in the context of universe connections. These rights apply to connections published in the
repository.
Relational connection rights
Right Description
View objects
Lets you view the connection.
Edit objects
Lets you edit the connection parameters.
Download connection locally
Lets you use universes created on the connection in Web
Intelligence Rich Client in oine mode.
Lets you use the local middleware driver in the information
design tool. To do so, select the local middleware option in
912 P U B L I C
SAP BusinessObjects Web Intelligence User's Guide
Rights appendix
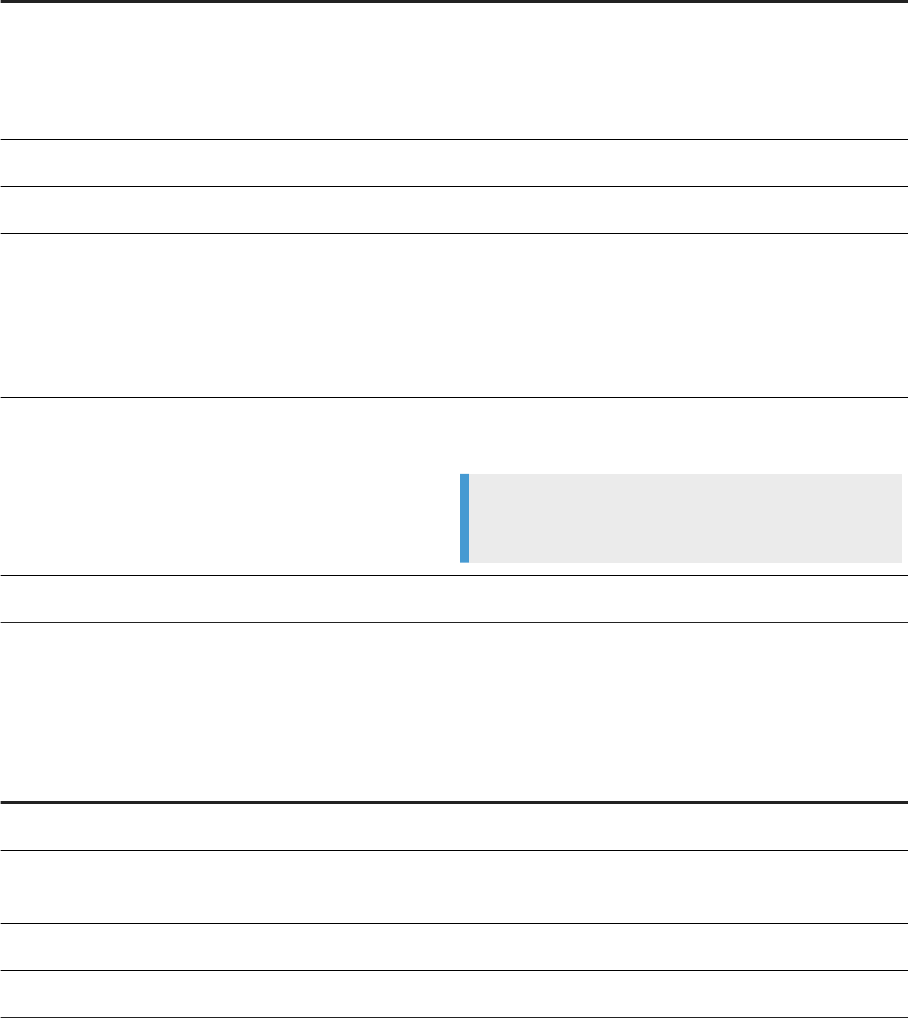
Right Description
the information design tool preferences, otherwise queries
to the database will use the server middleware.
This right is also needed to edit a secured connection in the
information design tool.
Delete objects
Lets you delete the connection.
Copy objects to another folder
Lets you copy the connection from one folder to another.
Data Access
Lets you retrieve content from the database specied in the
connection.
In the information design tool, this right lets you browse
table data from the connection and data foundation editors.
It also lets you preview the result set in the query panel.
Use connection for Stored Procedures
Lets you use the stored procedures in the database
specied for the universe connection.
Note
This right applies to .unv universes only.
Use connection for Free-Hand SQL scripts Lets you run SQL scripts on the connection.
OLAP connection rights
Right Description
View objects
Lets you view the connection.
Edit objects
Lets you edit the connection parameters in the information
design tool connection editor.
Delete objects
Lets you delete the connection.
Copy objects to another folder
Lets you copy the connection from one folder to another.
SAP BusinessObjects Web Intelligence User's Guide
Rights appendix
P U B L I C 913

11 Web Intelligence error messages
Error messages may appear while you are using Web Intelligence.
This section lists the messages and their descriptions grouped by the dierent components that make up Web
Intelligence.
11.1 Web Intelligence (WIJ) Error Messages
Web Intelligence Java interface error messages include the following:
Range Category
WIJ 10000 - WIJ 77778 Web Intelligence Java interface
11.1.1 You need to use the Formula Editor to create a formula. (Error: WIJ 10000)
Cause
You typed a formula into a cell using the Cell Properties panel instead of the Formula Editor.
Action
Launch the Formula Editor and dene the formula in the Formula Denition pane.
914
P U B L I C
SAP BusinessObjects Web Intelligence User's Guide
Web Intelligence error messages

11.1.2 You cannot position this report component in relation to a block, cell, or
section that is positioned relative to this report component. Select a
different block, cell or section in the dropdown list or unselect the
Relative To option. (WIJ 10500)
Cause
When you position a report component in relation to another report component that references the selected
one, you create a circular attachment.
Action
Remove relative positioning, or select a dierent block, cell, or section for relative positioning.
11.1.3 Web Intelligence requires the Java Runtime Environment (JRE) 1.4.2_01. The
currently installed JRE is {0}. Contact your administrator to upgrade to
1.4.2_01 or select the [default VM] entry in the [Java Plug-in Control
Panel], if you already have the required version installed. (WIJ 11111)
Cause
When you use the Java interface, a Java applet is installed on your local PC. The Java Runtime Environment
1.4.2_01 (or later version) needs to be installed and selected in order for the report panel to function.
Action
If Java Runtime Environment 1.4.2_01 (or later version) is already installed on your PC, then launch the Java
Plugin Control panel. To do this:
● Select the Windows menu: Start Settings Control Panel .
● Double-click Java Plug-in.
● On the Advanced tab, select Use Java Plug-in Default, then click Apply.
Or
Contact your administrator, and request help with installing Java Runtime Environment 1.4.2_01 (or later
version).
SAP BusinessObjects Web Intelligence User's Guide
Web Intelligence error messages
P U B L I C 915
11.1.4 An error occurred while the document was being decoded. Try to open the
document in the BI Launch Pad, or contact your administrator for further
information. ( WIJ 20000)
Cause
Web Intelligence cannot decode and open the document in the Java Report Panel.
Action
Open the document in InfoView by clicking the document title where the document is listed on the InfoView
Corporate Documents or Personal Documents page.
If this does not work, see your administrator.
11.1.5 An unexpected problem occurred when during document refresh and open. The
data source has been modified or deleted, or a prompt on the document has
no value selected. (WIJ 20001)
Cause
The document has the Refresh on open option selected. One or more of the following explanations can account
for this error:
● The data source has been modied since the document was created.
● The data source has been deleted since the document was created.
● One or more prompts have no values selected.
Action
See your administrator.
916
P U B L I C
SAP BusinessObjects Web Intelligence User's Guide
Web Intelligence error messages
11.1.6 Unexpected error. If you cannot reconnect to the server, close your session
and start again. (WIJ 20002)
Cause
The server may be down or your user session may be closed.
Action
See your administrator.
11.1.7 Unable to get the first page of the current report.\nCheck the validity of
your report. (ERR WIJ 20003).
Cause
The report cannot be displayed because it contains structural errors.
Action
Do one of the following:
● View the report in Structure View and verify the report structure. For example, errors can be caused if
report blocks overlap or if the structure of a table contains cells that create an asymmetrical table format.
Modify the report structure appropriately.
● Contact your administrator and request them to search for structural anomalies in the report.
11.1.8 The current query contains unresolvable objects. The query will be updated
(WIJ 20004).
Cause
There are objects that cannot be resolved in the query.
SAP BusinessObjects Web Intelligence User's Guide
Web Intelligence error messages
P U B L I C 917
Action
Check that the related objects have not been deleted from the data source.
11.1.9 The current request has returned corrupted data. Contact your administrator
for further information ( WIJ 20005).
Cause
The returned data is corrupted. This could be due to data source or network issues.
Action
Contact your administrator.
11.1.10 Unable to contact the application server. Contact your administrator for
further information (WIJ 20010).
Cause
The application server could be down, or address dierent to the one expected.
Action
Contact your administrator.
11.1.11 The {0,number} MB report element you want to copy is too large to be
exported to an external application.\nThe maximum allowed size is
{1,number} MB. (Error: WIJ 30004)
Cause
The report element you want to copy is too large to be copied.
918
P U B L I C
SAP BusinessObjects Web Intelligence User's Guide
Web Intelligence error messages
Action
Do not attempt to copy the report element.
11.1.12 Your user profile does not give you access to a document domain to save
corporate documents. Save this document as a personal document or contact
your administrator (ERR WIJ 40000).
Cause
You do not have the rights to save the document to the corporate repository.
Action
Save the document as a personal document or ask your administrator for the rights to save the document to
the repository.
11.1.13 The query in this document is empty. Check that the Result Objects pane on
the query tab includes objects before running the query (ERR WIJ 30000).
Cause
The query does not contain any result objects.
Action
Edit the query and add result objects..
SAP BusinessObjects Web Intelligence User's Guide
Web Intelligence error messages
P U B L I C 919
11.1.14 At least one query in this document is empty. Check that the Result
Objects pane on each query tab includes objects before running the
queries (ERR WIJ 30001).
Cause
A query does not contain any result objects.
Action
Add the result objects to the empty query.
11.1.15 Out of memory. Reduce the browser window size or re-launch the report
panel. (WIJ 30003).
Cause
Your computer has run out of the memory. This may be because your browser window size is too large.
Action
Do one of the following:
● Reduce the size of the browser window.
● Relaunch the Java interface.
11.1.16 Your user profile does not allow you to save personal or corporate
documents. Contact your administrator for further details. (WIJ 40001)
Cause
Your user prole, dened by your administrator, does not allow you to save personal or corporate documents.
920
P U B L I C
SAP BusinessObjects Web Intelligence User's Guide
Web Intelligence error messages
Action
If you think you need to be allowed to save personal documents and/or corporate documents to InfoView,
contact your administrator to request they modify your security prole.
11.1.17 An unexpected error occurred. (WIJ 44444)
Cause
An unexpected error was encountered.
Action
Please contact your administrator with details of the actions you performed before the error occurred.
11.1.18 Your version of Web Intelligence Rich Client is not up-to-date to connect
to this system (ERR WIJ 50003).You must upgrade your Web Intelligence
Rich Client by clicking <a href="{0}">here</a>.
Cause
Your version of Web Intelligence Rich Client is not recent enough to connect to the repository.
Action
Upgrade your version of Web Intelligence Rich Client by following the link.
11.1.19 The information sent to the server contains invalid character(s). Use the
Undo button to cancel the latest changes to the document and then retry.
(Error: WIJ 55555)
Cause
There is an error in the XML sent to the server by the application.
SAP BusinessObjects Web Intelligence User's Guide
Web Intelligence error messages
P U B L I C 921
Action
Use the Undo feature to remove the erroneous modication made to the document, and then run the query or
refresh the document again.
11.1.20 The session timed out. The document {document_name}.wid has been
autosaved in the Favorites\~InteractiveAnalysis folder. Click Restore to
retrieve it. (WIJ 60001)
Cause
Due to a server timeout, the current document was autosaved in the Favorites\~InteractiveAnalysis folder.
Action
Click Restore to retrieve the autosaved document.
If you cannot restore the document automatically, retrieve it manually from the folder. The name of the
autosaved document is the original document name with an automatically-generated prex and postx.
Retrieve the document from the autosave folder as quickly as possible. This folder is not a permanent storage
location for autosaved documents.
11.1.21 The session timed out, but the document could not be autosaved because
the following security rights are not assigned (WIJ 60002):
{list_of_rights}
Cause
The document could not be autosaved because you do not have some or all of the following security rights:
● Edit object
● Delete object
● Add object
Action
Ask your administrator to assign you the appropriate security rights.
922
P U B L I C
SAP BusinessObjects Web Intelligence User's Guide
Web Intelligence error messages
11.1.22 The document cannot be retrieved due to a server problem (WIJ 77777).
Cause
The document cannot be retrieved because the server is down.
Action
See your administrator.
11.1.23 Your session timed out. Please close the Java interface and log on again.
(WIJ 77778)
Cause
You have remained logged in to the Bi launch pad without using the Java interface for longer than the maximum
time allowed by the system.
Action
Log out and then log back into the BI launch pad to continue using the Java interface (you will lose any unsaved
modications you made previous to timeout).
To increase the length of time you are allowed to remain logged in to the BI launch pad ask your administrator
to increase your session timeout parameter.
11.1.24 The Central Management System is not functioning. Contact your
administrator for further information. (WIJ 77779)
Cause
The Central Management System (CMS) is not running.
SAP BusinessObjects Web Intelligence User's Guide
Web Intelligence error messages
P U B L I C 923

Action
Contact your administrator.
11.1.25 Your user profile does not allow you to edit or create documents based on
Free-hand SQL. Please contact your BI administrator to be granted this
right. (WIJ 77780)
Cause
The rights that you were assigned for Web Intelligence do not include the right to edit SQL/MDX query scripts
in Web Intelligence , which you need to be able to create documents based on Free-hand SQL.
Action
If you need to create Web Intelligence documents based on a Free-hand SQL statement, contact your BI
administrator to request the right to edit SQL/MDX query scripts in Web Intelligence.
11.2 Web Intelligence Desktop HTML Interface (WIH) Error
Messages
Web Intelligence Desktop HTML interface error messages include the following:
Range Category
WIH 00000 - WIH 00020 Web Intelligence Desktop HTML interface
11.2.1 Invalid session. Please close your browser and log on again. (WIH 00013)
Cause
This error message occurs when more than one document is open in the BI launch pad and you try to work with
a document that has been inactive longer than session expiration time.
924
P U B L I C
SAP BusinessObjects Web Intelligence User's Guide
Web Intelligence error messages
Action
Log out of the BI launch pad and close the browser, and then log into the BI launch pad again.
11.2.2 The document could not be saved. (WIH 00014)
Cause
The document could not be saved to the repository. This error can occur for a number of reasons. For example:
you do not have the security rights to the folder where you tried to save the document.
Action
See your administrator to determine why you could not save the document.
11.2.3 The session timed out. The document {document_name}.wid has been autosaved
in the Favorites\~WebIntelligence folder. Click Restore to retrieve it.
(WIH 00015)
Cause
Due to a server timeout, the current document was autosaved in the Favorites\~WebIntelligence folder.
Action
Click Restore to retrieve the autosaved document.
If you cannot restore the document automatically, retrieve it manually from the folder. The name of the
autosaved document is the original document name with an automatically-generated prex and postx.
Retrieve the document from the autosave folder as quickly as possible. This folder is not a permanent storage
location for autosaved documents.
SAP BusinessObjects Web Intelligence User's Guide
Web Intelligence error messages
P U B L I C 925
11.2.4 The session timed out, but the document could not be autosaved because the
following security rights are not assigned (WIH 00016): {list_of_rights}
Cause
The document could not be autosaved because you do not have some or all of the following security rights:
● Edit object
● Delete object
● Add object
Action
Ask your administrator to assign you the appropriate security rights.
11.2.5 An unexpected error occurred. For information about this error, please
refer to SAP Knowledge Base Article 2054722 on the SAP Support Portal.
(WIH 44444)
Cause
The server has failed without able to identify the root cause of the error.
Action
Close the document and reopen it again.
If this does not resolve the issue, contact your BI administrator.
If you are a BI administrator and need more information about this error, please refer to the SAP Knowledge
Base Article 2054722 on the SAP Support Portal.
11.3 Web Intelligence Desktop (WIO) Error Messages
Web Intelligence Desktop (Rich Client) error messages include the following:
926
P U B L I C
SAP BusinessObjects Web Intelligence User's Guide
Web Intelligence error messages

Range Category
WIO 00001 - WIS 30284 Web Intelligence Desktop
11.3.1 Web Intelligence Desktop cannot log in. (WIO 00001)
Cause
The browser cache might be full – under certain circumstances this can prevent Web Intelligence Desktop from
logging in.
Action
Empty the browser cache if it is full. If Web Intelligence Desktop still cannot log in, see your administrator.
11.3.2 Cannot open the hyperlink (WIO 00002).
Cause
● The URL in the hyperlink is incorrectly constructed.
● The hyperlink references a document in the Central Management Console (CMC). Documents in the CMC
are not always accessible from Web Intelligence Rich Client for two reasons:
○ The hyperlink does not specify the name of the server hosting the document because the Use
complete URL path to build document hyperlink setting is not selected. Incomplete URLs are invalid
when used outside the BI launch pad.
○ The hyperlink builds the complete URL, but the server specied in the URL is not accessible from the
computer running Web Intelligence Rich Client.
Action
Correct the hyperlink or see your IT administrator for help.
SAP BusinessObjects Web Intelligence User's Guide
Web Intelligence error messages
P U B L I C 927

11.3.3 There is no more memory available. (WIS 30280) (WIO 30280)
Cause
Your system is out of memory.
Action
Close open documents to free memory.
11.3.4 Cannot continue because memory is low. Please close documents to free
memory. (WIO 30284)
Cause
Your system memory is low.
Action
Close open documents to free memory.
11.4 Web Intelligence Server (WIS) Error Messages
Web Intelligence Server error messages include the following:
Range Category
WIS 30000 - WIS 40000 Web Intelligence Server
928 P U B L IC
SAP BusinessObjects Web Intelligence User's Guide
Web Intelligence error messages
11.4.1 The query in this document is empty. (WIS 30000)
Cause
No data is dened for this document.
Action
Add result objects to the query.
11.4.2 At least one query in the document is empty. (WIS 30001)
Cause
No data is dened for at least one of the queries in this document.
Action
Add result objects to the query.
11.4.3 Your security profile does not include permission to edit queries. (WIS
30251)
Cause
You do not have the right to edit queries.
Action
Contact your administrator to request the ability to edit the queries in documents.
SAP BusinessObjects Web Intelligence User's Guide
Web Intelligence error messages
P U B L I C 929
11.4.4 Your security profile does not include permission to edit documents. (WIS
30252)
Cause
You do not have the right to edit documents.
Action
Contact your administrator and request the ability to edit documents.
11.4.5 Your security profile does not include permission to refresh documents.
(WIS 30253)
Cause
You do not have the right to refresh documents.
Action
Contact your administrator to request the ability to refresh documents.
11.4.6 Your security profile does not include permission to refresh lists of
values. (WIS 30254)
Cause
You do not have permission to refresh lists of values.
Action
Contact your administrator to request the ability to refresh lists of values in documents.
930
P U B L I C
SAP BusinessObjects Web Intelligence User's Guide
Web Intelligence error messages
11.4.7 Your security profile does not include permission to use lists of values.
(WIS 30255)
Cause
You do not have permission to use lists of values.
Action
Contact your administrator to request the ability to use lists of values in documents.
11.4.8 Your security profile does not include permission to view the script
generated by the query. (WIS 30256)
Cause
You do not have the permission to view the script generated by the query.
Action
Contact your administrator to request the ability to view the script in queries.
11.4.9 Your security profile does not include permission to use the formula
language. (WIS 30257)
Cause
You do not have permission to use the formula language or create variables.
Action
Contact your administrator to request the ability to use the formula language and create variables in
documents.
SAP BusinessObjects Web Intelligence User's Guide
Web Intelligence error messages
P U B L I C 931
11.4.10 Your security profile does not include permission to perform drill
analysis. (WIS 30258)
Cause
You do not have permission to perform drill analysis.
Action
Contact your administrator to request the ability to drill on reports.
11.4.11 Your security profile does not include permission to extend the scope of
analysis. (WIS 30259)
Cause
You attempted to perform a drill operation outside the dened scope of analysis, and you do not have
permission to drill outside the scope of analysis.
Action
Contact your administrator.
11.4.12 An internal error occurred while calling the {api_name} API. (WIS 30270)
Cause
Information about the document or the data source is invalid or not available.
Action
Your administrator can trace the problem that caused the error by activating the tracking and verifying the
trace associated with the API.
932
P U B L I C
SAP BusinessObjects Web Intelligence User's Guide
Web Intelligence error messages
11.4.13 The document is too large to be processed by the server. (WIS 30271)
Cause
When you view a document in Portable Document Format (PDF) or Microsoft Excel format, the server
generates binary based output, which is then interpreted by your web browser. This error occurs if the size of
the binary output is greater than the maximum size specied by your administrator for the server.
Action
Contact your administrator and ask them to increase the maximum size.
11.4.14 The document is too large to be processed by the server. (WIS 30272)
Cause
When you view a document in HTML format, the server generates character-based output, which is then
interpreted by your web browser. This error occurs if the size of the character output is greater than the
maximum size specied by your administrator for the server.
Action
Ask your administrator to increase the maximum document size.
11.4.15 The query or report could not be generated.(WIS 30351)
Cause
It was not possible to complete one or more of the steps required to dene a query and generate a report. This
is due to one of the following reasons:
● the document was not initialized
● the data source is not valid
● the query was not dened
● the query context was not dened at the universe level
● no values were specied for prompts at the universe level
SAP BusinessObjects Web Intelligence User's Guide
Web Intelligence error messages
P U B L I C 933
Action
Contact your administrator and ask them to check the connection to the data source, and that the universe
does not contain unspecied contexts and prompt values.
11.4.16 A query with this name already exists. (WIS 30371)
Cause
Another query used in this document already has this name.
Action
Enter a dierent name for this query.
11.4.17 The Web Intelligence server memory is full. Log off and try to connect
later. If the problem persists, contact your administrator. (Error:
ERR_WIS_30280) (WIS 30280)
Cause
The server memory is full.
Action
Try again later. If the problem persists, see your administrator.
11.4.18 The Web Intelligence server is busy. Save any pending change and try
again later. If the problem persists, contact your administrator. (Error:
ERR_WIS_30284) (WIS 30284)
Cause
The server is busy.
934
P U B L I C
SAP BusinessObjects Web Intelligence User's Guide
Web Intelligence error messages
Action
Save any changes and try again later. If the problem persists, see your administrator.
11.4.19 The Web Intelligence server is running out of memory, your document has
been closed. If the problem persists, contact your administrator. (Error:
ERR_WIS_30285) (WIS 30285)
Cause
The server memory is full.
Action
Try again later. If the problem persists, see your administrator.
11.4.20 You cannot edit this document because the query property option "Allow
other users to edit the query" was not enabled when the document was
created. (WIS 30381)
Cause
The creator of the document did not select the query property option: "Allow other users to edit the query".
Action
Do one of the following:
● Ask the document creator to enable the option and re-save the document.
● Save a copy of the document as a personal document and then edit the query in the copy.
SAP BusinessObjects Web Intelligence User's Guide
Web Intelligence error messages
P U B L I C 935
11.4.21 An internal error has been generated by the WIQT. (WIS 30551)
Cause
An unexpected error occurred on the WIQT.
Action
Contact your administrator.
11.4.22 Your WIQT session has reached timeout. Log out and log in again to the
BI launch pad. (WIS 30553)
Cause
You have remained logged into the BI launch pad without using Web Intelligence for longer than the maximum
time allowed by the system.
Action
Log out and then log back into the BI launch pad (you will lose any unsaved modications you made previous to
timeout).
To increase the length of time you are allowed to remain logged in to the BI launch pad, ask your administrator
to increase your session timeout parameter.
11.4.23 No more WIQT servers are available. The maximum number of concurrent
users is already logged in. (WIS 30554)
Cause
The maximum number users are already logged in.
936
P U B L I C
SAP BusinessObjects Web Intelligence User's Guide
Web Intelligence error messages
Action
Try again later, or ask your administrator to increase the maximum number of concurrent users.
11.4.24 Your security profile does not include permission to save documents as
corporate documents or to send documents using the BI launch pad. (WIS
30555)
Cause
Your security prole does not allow you to save documents as personal or corporate documents, or to schedule
documents.
Action
Contact your administrator to request the ability to do the following:
● Save corporate documents
● Send documents to users in own groups
● Send documents to users in other groups
11.4.25 A corporate document with this name already exists. Your security
profile does not include permission to delete corporate documents created
by other users. (WIS 30556)
Cause
Your security prole does not allow you to overwrite existing corporate documents.
Action
Contact your administrator to request the ability to delete corporate documents saved by other users.
SAP BusinessObjects Web Intelligence User's Guide
Web Intelligence error messages
P U B L I C 937

11.4.26 There is no document with this name in the repository. Specify a
different document name. (WIS 30557)
Cause
There is no document with this name in the repository for one of the following reasons:
● You have typed the document name incorrectly
● The document with this name has been deleted from the repository
Action
Check that you have entered the document correctly.
Note
Deleted documents cannot be retrieved.
11.4.27 Cannot perform the intended action on this document. (WIS 30650)
Cause
The server is unable to complete the current task because of lack of resources or access problems.
Action
Do one of the following:
● Close your session, log out of the BI launch pad then log in again.
● Ask your administrator to verify that your security prole allows you access to the corporate repository.
11.4.28 The server failed to load the XML document. (WIS 30751)
Cause
When you migrate a BusinessObjects document to Web Intelligence 6.x, an XML le is created that can be
opened by the Web Intelligence Report Server. (The related module on the Administration Console is called the
938
P U B L I C
SAP BusinessObjects Web Intelligence User's Guide
Web Intelligence error messages
WIReportServer). In this case an unexpected error occurred on the Web Intelligence Report Server while
migrating a document to Web Intelligence 6.x.
Action
Your administrator can trace the problem that caused this error by activating the tracking and verifying the
trace associated with the WIReportServer. Contact your administrator with this information.
11.4.29 The XML file for this document cannot be opened. Contact your
administrator. (WIS 30752)
Cause
When you migrate a Desktop Intelligence document to Web Intelligence 6.x, an XML le is created that can be
opened by the server. This error occurs when the XML le cannot be opened by the server, and so migration
cannot be completed. There are two common causes:
● The XML is Read Only.
● The le path to the XML le is incorrect.
Action
Contact your administrator with this information.
11.4.30 An error occurred while parsing the XML document. Contact your
administrator. (WIS 30753)
Cause
When you migrate a Desktop Intelligence document to Web Intelligence 6.x, an XML le is created that can be
opened by the server. This error occurs when the XML le contains structural anomalies that the server cannot
interpret, and so migration cannot be completed.
Action
There are two possible actions that an administrator can take to solve this problem:
SAP BusinessObjects Web Intelligence User's Guide
Web Intelligence error messages
P U B L I C 939
● Open the XML le with an XML editing tool and verify the structure of the document.
● Activate the tracking and verify the trace associated with the WIReportServer.
11.4.31 The Web Intelligence 2.x document could not be migrated. (WIS 30761)
Cause
An unexpected error occurred when trying to migrate a Web Intelligence 2.x document to the current
document format.
Action
An administrator may be able to identify the cause of this error by activating the tracking and verifying the
trace associated with the server. Contact your administrator with this information.
11.4.32 This document cannot be migrated. The query and report of the original
Web Intelligence 2.x document are not synchronized. Try to refresh and
save the original document; then attempt migration again. (WIS 30762)
Cause
In the original Web Intelligence 2.x document, there is a discrepancy between the objects included in the query
and the objects included in the report. This means that the server is unable to interpret the document correctly
to migrate it to the current document format.
Action
To synchronize the data denition in the query and report of the original Web Intelligence 2.x document:
1. Use Web Intelligence 2.x to open the original document again.
2. Either run the query or refresh the document data.
3. Save the refreshed document.
4. Try to migrate the document again using the Migration Tool.
If you do not have access to Web Intelligence 2.x or the Migration Tool, contact your administrator with this
information.
940
P U B L I C
SAP BusinessObjects Web Intelligence User's Guide
Web Intelligence error messages
11.4.33 The Web Intelligence 2.x document could not be migrated, because the
WIQT module returned an error. Contact your administrator. (WIS 30763)
Cause
The original Web Intelligence 2.x document could not be migrated to the current document format, due to an
error generated by the WIQT process.
Action
Your administrator can trace the problem that caused this error by activating the tracking and verifying the
trace associated with the WIQT. Contact your administrator with this information.
11.4.34 Your user profile does not provide you with access to a document domain
to save corporate documents. Save this document as a personal document or
contact your administrator. (WIS 40000)
Cause
Your user prole does not include permission to save documents to a corporate document domain in the
repository.
Action
Do one of the following:
● Save the document as a personal document.
● Contact your administrator and request access to a corporate document domain.
11.5 Information Engine Services (IES) Error Messages
Information Engine Services error messages include the following:
SAP BusinessObjects Web Intelligence User's Guide
Web Intelligence error messages
P U B L I C 941

Range Category
IES 00001 - IES 01031 Query execution errors
IES 01501 - IES 01513 Graph execution errors
IES 10001 - IES 10903 Query execution errors (specic to Web Intelligence)
11.5.1 IES 00001 -IES 01031 Query execution errors
11.5.1.1 Some objects are no longer available in the universe. (IES 00001)
Cause
One or more objects in a universe are no longer available to a document.
Action
Delete the missing objects from the query by comparing the objects in the query with the available objects.
11.5.1.2 Query can’t be refreshed. You don’t have sufficient rights or some
objects are not available to your user profile. Contact your
administrator to request the necessary rights. (IES 00002)
Cause
You do not have the correct user rights to access the data for one or more objects included in a query or the
object is not available in your prole. Therefore, you cannot refresh the report.
Action
Ask your administrator to change your user prole to make these objects accessible.
942
P U B L I C
SAP BusinessObjects Web Intelligence User's Guide
Web Intelligence error messages
11.5.1.3 Some pre-defined filters are no longer available in the universe. (IES
00003)
Cause
Compare the available universe objects with query objects. Perhaps the objects are no longer available or you
don't have the rights.
Action
Compare universe objects with query objects. If you don't have rights, contact your universe designer or
administrator.
11.5.1.4 Some database tables are no longer available in the universe. (IES
00004)
Cause
One or more database tables referenced by objects in the universe are no longer available. The tables may have
been renamed, or removed from the database.
Action
Ask your universe designer to refresh the universe to remove non-existent tables or update table names.
11.5.1.5 Invalid prompt definition. (IES 00005)
Cause
The syntax in a prompt is not valid, or the prompt makes reference to an object that no longer exists in the
universe
SAP BusinessObjects Web Intelligence User's Guide
Web Intelligence error messages
P U B L I C 943
Action
Ask your universe designer to verify the prompt.
11.5.1.6 Invalid aggregate aware definition. (IES 00006)
Cause
One or more objects in the query use aggregate awareness, and the aggregate awareness syntax in the
universe is not valid.
Action
Ask your universe designer to verify the aggregate awareness syntax.
11.5.1.7 A filter contains a wrong value. You cannot run this query. (IES 00007)
Cause
A lter has a incorrect operand. For example, a lter has an empty constant, or a lter that expects a numeric
value is dened with an alphanumeric value.
Action
Correct the lter.
11.5.1.8 The query cannot run because it contains objects that reference
incompatible tables. (IES 00008)
Cause
The query contains objects that return data sets that cannot be combined or synchronized, possibly because
the universe does not allow multiple SQL statements for each context or measure.
944
P U B L I C
SAP BusinessObjects Web Intelligence User's Guide
Web Intelligence error messages

Action
Ask your universe designer to do the following:
● Allow multiple SQL statements for each context and measure.
● Create a new context that includes the incompatible objects.
11.5.1.9 You cannot run the query because an advanced filter contains an
incompatible object. Try simplifying the filter set and run your query
again. (IES 00009)
Cause
An advanced lter uses incompatible objects.
Action
Change the advanced lter to use compatible objects only.
11.5.1.10 The universe does not allow using a complex expression in a GROUP BY
statement. You cannot run this query. (IES 00010)
Cause
A query contains a GROUP BY clause that uses formulas or aliases. The universe does not allow these
expressions in GROUP BY clauses. The behavior is determined by the parameter
<Parameter Name="GROUPBY_EXCLUDE_COMPLEX">Y</Parameter>
in the PRM le for the target RDBMS.
Action
● Modify the query so that objects using formulas or aliases are not included in the query.
● If your RDBMS supports complex GROUP BY expressions, ask your universe designer to change the value
of the GROUPBY_EXCLUDE_COMPLEX parameter to N.
SAP BusinessObjects Web Intelligence User's Guide
Web Intelligence error messages
P U B L I C 945

11.5.1.11 The expression "{0}" contains multiple attributes. This syntax is not
supported in this version. (IES 00011)
Cause
One or more objects in the query use a comma (",") instead of a concatenation operator in their denition. This
syntax is no longer supported.
Action
Ask your universe designer to perform one of the following actions:
● Redene the objects that use the comma to concatenate the data for two objects using the standard
concatenation operator for the RDBMS.
● Add the following line to the PRM le for the target RDBMS:
<Parameter Name = "REPLACE_COMMA_BY_SEPARATOR"=Y>
This will enable the comma to be accepted syntax for concatenation in object denitions.
● Set the value of REPLACE_COMMA_BY_CONCAT to "Yes" in the universe.
11.5.1.12 You cannot run this query because it will produce a Cartesian product.
(IES 00012)
Cause
The query will produce a Cartesian product. A Cartesian product returns all possible combinations of rows
from the tables referenced by objects in the query and is rarely correct.
Action
Ask your universe designer to perform one of the following actions:
● Prevent Cartesian products by modifying the universe table schema to include appropriate joins and
restrictions.
● Allow the universe to return Cartesian products if they are acceptable.
946
P U B L I C
SAP BusinessObjects Web Intelligence User's Guide
Web Intelligence error messages
11.5.1.13 Query script generation failed. See your administrator. {0} (IES 00013)
Cause
Errors occurred during generation of the query SQL.
Action
Ask your universe designer to verify the SQL.
11.5.1.14 Aggregate aware resolution failed. (IES 00014)
Cause
The query objects exclude all possible SQL choices for an aggregate aware function.
Action
Ask your universe designer to remove the incompatibility between the objects.
11.5.1.15 Multiple Query Filters contain a prompt with the same text, but
different operand type or operator count of values. (IES 00015)
Cause
The query has multiple prompts that display the same message. Prompts with the same message are usually
combined, but this is not possible if some require you to enter one value and others require multiple values.
Action
Modify the prompts so they all require one or multiple values.
SAP BusinessObjects Web Intelligence User's Guide
Web Intelligence error messages
P U B L I C 947
11.5.1.16 The query contains a @script() function, which is not supported. (IES
00016)
Cause
The SQL generated by the query for this document includes a @script() function, which is not supported.
Action
Ask your universe designer to remove the @script() function.
11.5.1.17 The following objects cannot be used as Result Objects: {0}. See your
administrator. (IES 00017)
Cause
The query includes objects that cannot be used as result objects in queries.
Action
Remove the objects, or ask your universe designer to allow the objects to be included in as result objects in
queries.
11.5.1.18 The following objects cannot be used as query filters: {0}. Contact
your administrator. (IES 00018)
Cause
The query contains objects used as query lters that are not valid as query lters.
Action
Remove the objects, or ask your universe designer to allow them as query lters.
948
P U B L I C
SAP BusinessObjects Web Intelligence User's Guide
Web Intelligence error messages
11.5.1.19 A query filter object contains too many values for the object to be
used in a query filter. (IES 00019)
Cause
A query lter contains too many values.
Action
Select fewer values.
11.5.1.20 The only authorized SQL statement is SELECT. {0} (IES 00020)
Cause
The SQL generated by the query is invalid.
Action
Ask your universe designer to verify the SQL.
11.5.1.21 The combined query cannot run because one of the queries contains
incompatible objects. (IES 00021)
Cause
A query in a combined query contains incompatible objects.
Action
Remove the incompatible objects.
SAP BusinessObjects Web Intelligence User's Guide
Web Intelligence error messages
P U B L I C 949
11.5.1.22 The query does not reference any table when attempting to build the
WHERE clause. (IES 00022)
Cause
The WHERE clause of the generated SQL does not reference a table.
Action
Modify the query to reference a table.
11.5.1.23 Invalid sub-query filter. Either data cannot be retrieved (null) or no
result objects are defined. (IES 00023)
Cause
The query contains an invalid sub-query. Either data cannot be retrieved or no result objects are dened.
Action
Modify the sub-query.
11.5.1.24 Incompatible object types in the sub-query filter. (IES 00024)
Cause
The subquery contains incompatible object types.
Action
Remove the incompatible object types.
950
P U B L I C
SAP BusinessObjects Web Intelligence User's Guide
Web Intelligence error messages
11.5.1.25 The query is too complex to apply a sampling function. When the
function is applied, no SQL is generated so query aborts. Try to
simplify your query (such as, combined query, or query with JOIN or
SYNCHRO operators). (IES 00025)
Cause
The query is too complex to apply a sampling function.
Action
Try to simplify the query.
11.5.1.26 Failed to regenerate SQL for optional prompts, the following required
prompts were skipped: {0}.(IES 00026)
Cause
The SQL relating to optional prompts could not be regenerated.
Action
See your universe designer.
11.5.1.27 Removing optional prompts from the query will introduce new prompts.
This introduces complexities that cannot be supported. (IES 00027)
Cause
The query cannot be processed due to optional prompts.
SAP BusinessObjects Web Intelligence User's Guide
Web Intelligence error messages
P U B L I C 951
Action
Remove the optional prompts from the query.
11.5.1.28 No value specified for the Keydate parameter. (IES 00028)
Cause
No value was specied for the Keydate parameter.
Action
Specify a value for the Keydate.
11.5.1.29 The universe is already open with write permission by another user.
(IES 00029)
Cause
The universe could not be opened because it is already opened with write permission by another user.
Action
See your administrator.
11.5.1.30 Queries that do not contain a measure are not allowed to run on this
universe. (IES 00030)
Cause
The query does not contain a measure, and therefore cannot be used with the universe.
952
P U B L I C
SAP BusinessObjects Web Intelligence User's Guide
Web Intelligence error messages
Action
Check that the query denition is correct, add the relevant measure if necessary.
11.5.1.31 The Free-hand SQL query does not contain a valid executable statement:
{detail_message} (IES 00031)
Cause
Either the SQL contains forbidden SQL keys, or the SQL statement or the call to a stored procedure is invalid.
Action
Remove the forbidden SQL keys from the SQL and verify the SQL statement.
If the issue is still not resolved, contact your IT administrator for assistance.
11.5.1.32 Universe not found. Either the universe was deleted from the repository
or you do not have sufficient rights to see the universe in the
repository. (IES 00501)
Cause
Cannot nd the universe.
Action
Check with your administrator or universe designer to nd out why the universe is not available.
SAP BusinessObjects Web Intelligence User's Guide
Web Intelligence error messages
P U B L I C 953
11.5.1.33 The appropriate user rights were not found. Contact your administrator.
(IES 00502)
Cause
You cannot perform this action because your user rights cannot be found.
Action
Ensure that you have used the correct logon credentials. If the are correct, verify with your IT administrator that
your user rights have not been deleted.
11.5.1.34 You are not authorized to access the universe {0}. Contact your
administrator to request the appropriate rights. (IES 00503)
Cause
Your user rights do not permit this action.
Action
Ask your IT administrator to check that your user credentials are correctly dened.
11.5.1.35 You do not have the right to access data for this universe. Contact
your administrator to request the appropriate rights. (IES 00504)
Cause
Your current user rights do not allow you to access the data.
Action
Ask your IT administrator to check that your user credentials are correctly dened.
954
P U B L I C
SAP BusinessObjects Web Intelligence User's Guide
Web Intelligence error messages
11.5.1.36 You do not have the right to access data for this universe connection.
Contact your administrator to request the appropriate rights. (IES
00505)
Cause
Your current user rights do not allow you to access the connection.
Action
Ask your IT administrator to check that your user credentials are correctly dened.
11.5.1.37 Failed to download universe {0} from repository {1}. Check that there
is enough memory available and try again. (IES 00506)
Cause
Cannot download the universe.
Action
Contact your administrator to report the problem.
11.5.1.38 You do not have the right to access data for this core universe.
Contact your administrator to request the appropriate rights. (IES
00507)
Cause
Your current user rights do not allow you to access the data.
SAP BusinessObjects Web Intelligence User's Guide
Web Intelligence error messages
P U B L I C 955
Action
Ask your IT administrator to check that your user credentials are correctly dened.
11.5.1.39 Universe data connection could not be found. The connection has been
deleted or you do not have the right to use it. (IES 00509)
Cause
The connection has been lost.
Action
Contact your administrator to report the problem.
11.5.1.40 Cannot generate the SQL for this query because one of its objects is
based on a derived table (table_name) that contains a loop in its
definition. (IES 00510)
Cause
When a derived table contains a loop, it is not possible to generate the SQL.
Action
Redene your query, or try to avoid having a loop in the derived table.
11.5.1.41 Cannot generate the SQL for this query because one of its objects is
based on a derived table (table_name) that is unknown. (IES 00511)
Cause
The SQL cannot be generated.
956
P U B L I C
SAP BusinessObjects Web Intelligence User's Guide
Web Intelligence error messages
Action
Check that the derived table is correctly dened and can be used. Check that your query is correct.
11.5.1.42 Cannot generate the SQL for this query because one of its objects is
based on a derived table (table_name) with an incorrect definition.
(IES 00512)
Cause
The dervied table is not correctly dened.
Action
Check the denition of the derived table and correct it if necessary.
11.5.1.43 The query statement cannot be generated because of a syntax error.
Check the syntax of the statement that uses the @Variable function.
(IES 00513)
Cause
Your query contains one or more syntax errors.
Action
Check the syntax of the SQL statement that uses the @Variable function. Refer to the @Functions section of
the Universe Designer user documentation (pdf document or online help)
SAP BusinessObjects Web Intelligence User's Guide
Web Intelligence error messages
P U B L I C 957
11.5.1.44 The database SQL generation parameters file could not be loaded
({database_name}, {network_layer}) . (IES 00514)
Cause
Cannot nd the relevant SQL parameter le.
Action
Contact your administrator.
11.5.1.45 Unexpected enumerated type {0}. (IES 01001)
Cause
A new enumerated type has been declared but is not supported.
Action
Contact your administrator.
11.5.1.46 Nested @aggregate_aware functions are not supported. (IES 01002)
Cause
The expression contains nested @aggregate_aware functions.
Action
The designer can edit the business layer and remove nested @agreggate_aware functions.
958
P U B L I C
SAP BusinessObjects Web Intelligence User's Guide
Web Intelligence error messages
11.5.1.47 Circular references: check the references to other business layer
objects in the expression. (IES 01003)
Cause
The expression contains circular references.
Action
The designer can edit the business layer and check for circular references between business layer objects.
11.5.1.48 Invalid @Select reference. Check the definition of the @Select
declaration. (IES 01004)
Cause
The expression contains and invalid reference to the @Select function.
Action
The designer can edit the business layer and validate the use of the @Select function in the object expression.
11.5.1.49 Invalid @Where reference. Check the definition of the @Where
declaration. (IES 01005)
Cause
The expression contains and invalid reference to the @Where function.
Action
The designer can edit the business layer and validate the use of the @Where function in the object expression.
SAP BusinessObjects Web Intelligence User's Guide
Web Intelligence error messages
P U B L I C 959
11.5.1.50 Some prompt parameters are no longer available in the universe. (IES
01006)
Cause
The expression contains and invalid reference to the @Prompt function.
Action
The designer can edit the query or the business layer and validate the use of the @Prompt function in the
object expression.
11.5.1.51 Bad hierarchy reference. (IES 01007)
Cause
The hierarchy declared in the query contains an error.
Action
Check the query expression for errors.
11.5.1.52 Catalog for source "{0}" cannot be retrieved. Check Data Foundation
connection. (IES 01008)
Cause
Catalog for source "{0}" cannot be retrieved.
Action
Check the connection to the data source in the data foundation.
960
P U B L I C
SAP BusinessObjects Web Intelligence User's Guide
Web Intelligence error messages
11.5.1.53 The prompt cannot be validated but it may be correct. Associate a list
of values or at least one default value to the prompt. (IES 01010)
Cause
The prompt cannot be validated but it may be correct.
Action
Associate a list of values or at least one default value to the prompt.
11.5.1.54 More than 100 levels of nested derived tables is not supported. (IES
01015)
Cause
There are more than 100 levels of nested derived tables.
Action
Edit the @DerivedTable expression to reduce the number of nested levels.
11.5.1.55 The definiton of the list of values {0} is invalid. The list or the
current column is hidden. (IES 01025)
Cause
The list of values is hidden, or the current column is hidden.
Action
Check for hidden objects in the universe or business layer. Either make the objects active or redene the list of
values expression.
SAP BusinessObjects Web Intelligence User's Guide
Web Intelligence error messages
P U B L I C 961
11.5.2 IES 01501 - IES 01513 Graph execution errors
11.5.2.1 Detection cannot take place because the data foundation contains cycles.
Use the Visualize Loops command to visualize the cycles. Modify the
cardinality of the joins involved in the cycles before detecting
aliases or contexts. (IES 01501)
Cause
The data foundation contains loops.
Action
In the information design tool, edit the data foundation and use the Visualize Loops command to nd loops in
the data foundation. Modify the cardinality of the joins involved in the loops before detecting aliases or
contexts.
11.5.2.2 Detection cannot take place because some tables have at least two joins
with opposite cardinalities: {0}. Modify the joins between these
tables. (IES 01502)
Cause
Some tables in the data foundation have at least two joins with opposite cardinalities.
Action
In the information design tool, edit the data foundation and modify the joins between these tables.
11.5.2.3 Detection cannot take place because all join cardinalities have not been
set. Set all the join cardinalities. (IES 01504)
Cause
All join cardinalities have not been set in the data foundation.
962
P U B L I C
SAP BusinessObjects Web Intelligence User's Guide
Web Intelligence error messages
Action
In the information design tool, edit the data foundation and detect or set the cardinalities for all joins.
11.5.2.4 Automatic detections will fail as long as some cardinalities are many-
to-many. (IES 01505)
Cause
Some joins in the data foundation have cardinality many-to-many.
Action
In the information design tool, edit the data foundation modify the cardinality for these joins.
11.5.2.5 Detection cannot take place because no fact table was detected. A fact
table is always joined to other tables with a 'many to one' join, with
the 'many' side of the join connected to the fact table. The problem
could be the cardinalities that are currently set on the data
foundation joins, or the way the database schema is built. (IES 01510)
Cause
No fact table was detected. A fact table relates other tables only with many-to-one cardinality joins, with many
being on the side of the join connected to the fact table.
Action
In the information design tool, edit the data foundation check the cardinality of the joins. There might be a
problem with the cardinalities that are currently set on the data foundation joins or with the way the database
schema is built.
SAP BusinessObjects Web Intelligence User's Guide
Web Intelligence error messages
P U B L I C 963
11.5.2.6 Detection cannot take place because there are loops in the schema. Use
the Detect Aliases command to detect the alias tables that will
resolve the loops. (IES 01512)
Cause
The data foundation contains loops.
Action
In the information design tool, edit the data foundation and use the Detect Aliases command to detect the alias
tables that will resolve the loops.
11.5.3 IES 10001 - IES 10903 Query execution errors (Web
Intelligence only)
11.5.3.1 Syntax error in formula '%1%' at position %2%. (IES 10001)
Cause
There is a syntax error in your formula at the position indicated.
Action
Correct the formula.
11.5.3.2 Problem initializing the dictionary of functions. (IES 10002)
Cause
The dictionary of functions could not be initialized.
964
P U B L I C
SAP BusinessObjects Web Intelligence User's Guide
Web Intelligence error messages
Action
See your administrator.
11.5.3.3 The object '%1%' at position '%2%' is not unique in the report. (IES
10005)
Cause
An object has a name that conicts with the name of another object in the report
Action
Use the fully-qualied name for the object.
11.5.3.4 The object '%1%' at position '%2%' does not exist in the report. (IES
10006)
Cause
The formula refers to an object that no longer exists in the report.
Action
Remove the reference to the object from the formula.
11.5.3.5 Unexpected empty expression after '='. (IES 10009)
Cause
The expression appears to be incomplete.
SAP BusinessObjects Web Intelligence User's Guide
Web Intelligence error messages
P U B L I C 965
Action
Check the syntax of your expression and correct it.
11.5.3.6 The integer '%1%' at position '%2%' is too long. (IES 10013)
Cause
An integer in a formula exceeds the maximum limit.
Action
Edit the formula.
11.5.3.7 The number '%1%' at position '%2%' has a format that is incompatible
with your regional settings. (IES 10014)
Cause
The format of the real number {number} is not compatible with your regional settings.
Action
Change the number format to conform with the format permitted by your regional settings.
11.5.3.8 Missing quotation mark after '%1%' at position '%2%'. (IES 10016)
Cause
There is a missing closing quotation mark in the formula.
966
P U B L I C
SAP BusinessObjects Web Intelligence User's Guide
Web Intelligence error messages
Action
Add the closing quotation mark.
11.5.3.9 The list of dimensions in the input or output context is empty. (IES
10032)
Cause
The list of dimensions in the input or output context is empty.
Action
Specify a list of dimensions.
11.5.3.10 The variable '%1%' cannot be deleted because it has dependant formulas
or variables linked to: '%2%'. (IES 10033)
Cause
The variable cannot be deleted because it is referenced by other variables or formulas.
Action
Delete the dependent formulas/variables before deleting the variable.
11.5.3.11 You attempted to create a variable or update a variable name using a
variable name that already exists. (IES 10034)
Cause
You attempted to create a variable or update a variable name using a variable name that already exists.
SAP BusinessObjects Web Intelligence User's Guide
Web Intelligence error messages
P U B L I C 967
Action
Choose a variable name that does not already exist.
11.5.3.12 The date or time format '%1%' at position '%2%' is not valid. (IES
10035)
Cause
The formula contains an invalid date/time format (for example, "bb/MM/yyyy").
Action
Specify a valid date/time format in the formula.
11.5.3.13 The expression or sub-expression at position '%2%' is not valid. (IES
10036)
Cause
The formula contains an invalid expression/sub-expression.
Action
Specify a valid expression/sub-expression.
11.5.3.14 The expression or sub-expression at position '%2%' in the '%1%'
function uses an invalid data type. (IES 10037)
Cause
An expression contains an invalid data type. (For example, you have attempted to pass a string to a function
that requires a date.)
968
P U B L I C
SAP BusinessObjects Web Intelligence User's Guide
Web Intelligence error messages
Action
Use a valid data type in the expression.
11.5.3.15 Invalid character '%1%' in variable name at position '%2%'. (IES 10038)
Cause
The character {character} is not valid in the variable name.
Action
Remove {character} from the variable name.
11.5.3.16 The formula for variable '%1%' contains a reference to a variable with
the same short name. (IES 10040)
Cause
The formula of a variable references another variable with the same short name.
Action
To resolve this issue, remove the reference to the variable with the same short name from the formula.
11.5.3.17 Incorrect use of multiple comparison operators (<,>,<>,<=,>=,=) at
position '%2%'. (IES 10041)
Cause
The formula uses multiple comparison operators incorrectly (for example: if(1<2=3;0;-1)).
SAP BusinessObjects Web Intelligence User's Guide
Web Intelligence error messages
P U B L I C 969
Action
Re-structure the formula to avoid using comparison operators incorrectly.
11.5.3.18 There is a circular reference because the formula for variable '%1%'
references a variable whose formula references '%1%' .(IES 10042)
Cause
A formula contains a circular reference.
Action
Remove the circular reference.
11.5.3.19 There is no opening parenthesis after function '%1%' at position %2%.
(IES 10060)
Cause
There is no opening parenthesis in the location indicated by the error message.
Action
Add an opening parenthesis in the location indicated.
11.5.3.20 The function '%1%' has missing arguments or closing parenthesis at
position %2%. (IES 10061)
Cause
Arguments or a closing parenthesis are missing from the formula.
970
P U B L I C
SAP BusinessObjects Web Intelligence User's Guide
Web Intelligence error messages
Action
Supply the arguments or closing parenthesis.
11.5.3.21 Missing ';' before argument in function '%1%' at position %2%.(IES
10062)
Cause
The syntax of your expression is incorrect
Action
Check the syntax and correct the expression.
11.5.3.22 Missing ';' or closing parenthesis in function '%1%' at position %2%.
(IES 10063)
Cause
The syntax is incorrect.
Action
Check the syntax and correct your expression.
11.5.3.23 Missing ';' or closing parenthesis in list '%1%' at position %2%. (IES
10064)
Cause
A semicolon or closing parenthesis is missing from the formula.
SAP BusinessObjects Web Intelligence User's Guide
Web Intelligence error messages
P U B L I C 971
Action
Supply the semicolon or closing parenthesis.
11.5.3.24 Missing closing parenthesis in function '%1%' at position %2%. (IES
10065)
Cause
The syntax is incorrect.
Action
Check the expression and correct the syntax.
11.5.3.25 Missing aggregate operator or closing parenthesis in function '%1%' at
position %2%. (IES 10066)
Cause
The syntax is incorrect.
Action
Check the expression and correct the syntax.
11.5.3.26 Missing operator or closing parenthesis in '%1%' at position %2%. (IES
10067)
Cause
The syntax is incorrect.
972
P U B L I C
SAP BusinessObjects Web Intelligence User's Guide
Web Intelligence error messages
Action
Check the expression and correct the syntax.
11.5.3.27 Missing list element in '%1%' at position %2%. (IES 10068)
Cause
The syntax is incorrect. An element is missing.
Action
Check the expression and correct the issue.
11.5.3.28 Missing object identifier in '%1%' at position %2%. (IES 10069)
Cause
An object identier is missing from the formula.
Action
Correct the formula.
11.5.3.29 Missing or bad operand in '%1%' expression at position %2%. (IES
10070)
Cause
EIther the operand is not compatible, or the operand is missing.
SAP BusinessObjects Web Intelligence User's Guide
Web Intelligence error messages
P U B L I C 973
Action
Check the syntax and correct the expression.
11.5.3.30 Incorrect calculation context %1%' at position %2%. (IES 10071)
Cause
The calculation context is incorrect.
Action
Check the syntax of your expression and correct it.
11.5.3.31 Incorrect reset context at position %2%. (IES 10072)
Cause
The formula contains an incorrect reset context.
Action
Correct the reset context.
11.5.3.32 Invalid Where clause in function '%1%': a dimension is missing at
position %2%. (IES 10073)
Cause
The expression is missing an expression.
974
P U B L I C
SAP BusinessObjects Web Intelligence User's Guide
Web Intelligence error messages
Action
Check the syntax of the expression and ensure that there is the expected dimension.
11.5.3.33 Incompatible object '%1%' at position %2%. (IES 10076)
Cause
You cannot use this type of object.
Action
Ensure that the correct object has been declared.
11.5.3.34 The object '%1%' at position %2% is incompatible. (IES 10077)
Cause
The formula contains an incompatible object.
Action
Correct the formula.
11.5.3.35 Invalid character '%1%' at position %2%. (IES 10080)
Cause
There is an invalid character in the expression.
Action
Check the syntax of the expression.
SAP BusinessObjects Web Intelligence User's Guide
Web Intelligence error messages
P U B L I C 975
11.5.3.36 Invalid string '%1%' at position %2%. (IES 10082)
Cause
The formula contains an invalid string.
Action
Correct the string.
11.5.3.37 The qualification of the variable '%1%' cannot be changed. (IES 10083)
Cause
You cannot change the qualication of the variable. (For example, you cannot change a measure to a dimension
if its denition includes an aggregate.)
Action
Create a new variable with the appropriate qualication.
11.5.3.38 Expecting object member in '%1%' at position %2%. (IES 10084)
Cause
There is no object member.
Action
Check the syntax of teh expression and correct it as necessary.
976
P U B L I C
SAP BusinessObjects Web Intelligence User's Guide
Web Intelligence error messages
11.5.3.39 Invalid member '%1%' at position %2%. (IES 10085)
Cause
You cannot use this type of member in this context.
Action
Correct the expression.
11.5.3.40 Invalid set definition. (IES 10086)
Cause
A query contains an invalid set denition.
Action
Verify the query.
11.5.3.41 Custom functions could not be loaded. (IES 10100)
Cause
The custom function library could not be loaded because it is not correctly dened. This could be due to invalid
XML, a duplicate function name or duplicate function ID.
Action
See the trace log for more details and provide these details to your administrator.
SAP BusinessObjects Web Intelligence User's Guide
Web Intelligence error messages
P U B L I C 977
11.5.3.42 Your database server does not support the Both and Except operators.
(IES 10701)
Cause
The database on which this document is based does not support the Both and Except operators. This means
that you cannot use the Both operator or the Except operator when you dene lters on the query.
Action
Remove the operators from the query lters.
11.5.3.43 A filter is defined on an object that is incompatible with the result
objects. (IES 10702)
Cause
One of the query lters is dened on an object which is incompatible with all the result objects returned by the
query.
Action
Remove the query lter or the result objects.
11.5.3.44 The numeric value for the query filter based on '{object}' is invalid.
(IES 10703)
Cause
You specied an invalid numeric value for a query lter.
Action
Edit the query lter and specify a valid numeric value.
978
P U B L I C
SAP BusinessObjects Web Intelligence User's Guide
Web Intelligence error messages
11.5.3.45 The date for the prompt '{prompt}' is invalid. (IES 1070) (IES 10704)
Cause
You specied an invalid date for a query lter.
Action
Edit the query lter and specify a valid date.
11.5.3.46 The prompt '{prompt}' contains an invalid numeric value. (IES 10705)
Cause
You specied an invalid numeric value for a prompt.
Action
Specify a valid numeric value.
11.5.3.47 The date for the prompt '{prompt}' is invalid. (IES 10706)
Cause
You specied an invalid date for a prompt.
Action
Edit the prompt and specify a valid date.
SAP BusinessObjects Web Intelligence User's Guide
Web Intelligence error messages
P U B L I C 979
11.5.3.48 The server cannot build the SQL for the query. (IES 10707)
Cause
Your query cannot be converted to SQL to run against the database.
Action
Reformulate the query or see your administrator.
11.5.3.49 The object '{ObjName}' in the prompt '{PromptName}' can no longer
display a list of values. Remove the prompt from the query or contact
your administrator to clear the "Select only from list" option of the
object properties tab. (IES 10708)
Cause
The object in the prompt can no longer display a list of values.
Action
Remove the prompt, or ask your administrator to allow the prompt to accept values not selected from a list.
11.5.3.50 A class already exists with this name : '{ClassName}' . (IES 10709)
Cause
You cannot have two classes with the same name.
Action
Use a dierent name for the class.
980
P U B L I C
SAP BusinessObjects Web Intelligence User's Guide
Web Intelligence error messages
11.5.3.51 You do not have the right to refresh this document. (IES 10801)
Cause
Your user prole does not permit you to view data for one of the objects included in the query for this
document.
Action
Cancel the refresh, or ask your administrator for the security rights necessary to refresh the document.
11.5.3.52 The query SQL has {nbHaving} instead of {nbWanted} columns. (IES
10810)
Cause
The SQL generated by the query has an invalid number of columns.
Action
See your administrator.
11.5.3.53 The data type of a column in the query is not valid. (IES 10811)
Cause
The data type of a column in the query is not valid.
Action
See your administrator.
SAP BusinessObjects Web Intelligence User's Guide
Web Intelligence error messages
P U B L I C 981
11.5.3.54 Custom SQL cannot contain optional prompts. (IES 10812)
Cause
Optional prompts are not supported in custom SQL.
Action
Remove the optional prompts.
11.5.3.55 Incompatible objects cannot be used in combined queries. (IES 10820)
Cause
A combined query contains incompatible objects.
Action
Edit the combined query and remove the incompatible objects.
11.5.3.56 A subquery in the '{dp_name}' data provider has missing objects. (IES
10830)
Cause
Objects necessary to generate query SQL are missing from a subquery in the {dp_name} data provider.
Action
Edit the subquery and add the missing objects.
982
P U B L I C
SAP BusinessObjects Web Intelligence User's Guide
Web Intelligence error messages
11.5.3.57 The filtered object is missing in a ranking in the '{dp_name}' data
provider. (IES 10831)
Cause
The ltered object is missing in a ranking.
Action
Edit the ranking and add the ltered object.
11.5.3.58 The rank-based object is missing in a ranking in the '{dp_name}' data
provider. (IES 10832)
Cause
The rank-based object is missing in a ranking.
Action
Edit the ranking and add the rank-based object.
11.5.3.59 The document cannot be loaded. (IES 10833)
Cause
The interactive analysis document could not be loaded.
Action
See your administrator.
SAP BusinessObjects Web Intelligence User's Guide
Web Intelligence error messages
P U B L I C 983
11.5.3.60 Additional context resolution is not supported with optional prompts.
(IES 10834)
Cause
The optional prompts in a query generate additional query context resolution that is not supported.
Action
Remove the optional prompts or make them obligatory.
11.5.3.61 Invalid data in column "{col_name}". (IES 10840)
Cause
A database column referenced by the query contains invalid data.
Action
See your administrator.
11.5.3.62 Invalid UTF-8 string in column "{col_name}". (IES 10841)
Cause
A database column referenced by the query contains invalid data.
Action
See your administrator.
984
P U B L I C
SAP BusinessObjects Web Intelligence User's Guide
Web Intelligence error messages
11.5.3.63 Sorry, your Data Refresh action cannot be completed because the
maximum amount of concurrent Data Refresh actions is currently being
processed by the server {nb_thread} / {nb_max_thread}. Please, try
again later. (IES 10845)
Cause
You have used the data refresh option more than the maximum refresh actions allowed.
Action
Please wait and retry the refresh action later.
11.5.3.64 The file that is required to create or update the query cannot be
found on the file system. File not found: "{filename}". (IES 10850)
Cause
The le {lename} cannot be found on the le system.
Action
Check the location of {lename} or see your administrator.
11.5.3.65 The file that is required to refresh the query cannot be found on the
file system. File not found: "{filename}" (IES 10851)
Cause
The le seems to be missing, deleted, or renamed.
SAP BusinessObjects Web Intelligence User's Guide
Web Intelligence error messages
P U B L I C 985
Action
Check with your administrator.
11.5.3.66 Unable to refresh the query on this file: the structure of file
"{filename}" does not match. (IES 10852)
Cause
The le might have been modied since the query was last run.
Action
Check with the administrator or universe designer that the le has not been modied.
11.5.3.67 Error originates from the Personal Data Provider: {message}. (IES
10853)
Cause
The le that supplies data to a personal data provider might be corrupt or missing.
Action
Check that the le is present, and that it does not contain errors.
11.5.3.68 The query cannot be refreshed; the structure of "{dpName}" does not
match. (IES 10854)
Cause
The columns returned by the database do not match with those of data provider objects.
986
P U B L I C
SAP BusinessObjects Web Intelligence User's Guide
Web Intelligence error messages
Action
In the Web Intelligence document, open the Query Panel and check that you have the right objects in your
query compared to the database.
11.5.3.69 Unable to create or update the Excel personal data provider: the file
path is invalid. (IES 10870)
Cause
The Excel le could not be found on the le system.
Action
See your administrator.
11.5.3.70 Unable to create or update the Excel personal data provider: cannot
retrieve the named ranges. (IES 10872) (IES 10871)
Cause
The Excel personal data provider could not be created or updated because the workbook is protected.
Action
Remove the protection from the Excel workbook or see your administrator if you do not have access to the
Excel le.
11.5.3.71 Unable to create or update the Excel personal data provider: cannot
open the workbook. (IES 10872)
Cause
The Excel le could not be opened.
SAP BusinessObjects Web Intelligence User's Guide
Web Intelligence error messages
P U B L I C 987
Action
Verify the Excel le or see your administrator.
11.5.3.72 Unable to create or update the Excel personal data provider: cannot
retrieve the named ranges. (IES 10873)
Cause
Data could not be retrieved from a named range of cells.
Action
Check the Excel le or see your administrator.
11.5.3.73 Unable to create or update the Excel personal data provider: cannot
retrieve data from the file. (IES 10874)
Cause
Data could not be retirieved from the Excel le.
Action
Verify the le or see your administrator.
11.5.3.74 Unable to create or update the Excel personal data provider: cannot
retrieve data from the file. (IES 10875)
Cause
No data could be retrieved from the Excel le.
988
P U B L I C
SAP BusinessObjects Web Intelligence User's Guide
Web Intelligence error messages
Action
Verify the le or see your administrator.
11.5.3.75 Unable to create or update the Excel personal data provider: cannot
build the iterator on the data set. (IES 10876)
Cause
An error occurred when retrieving data from the Excel le.
Action
Verify the le or see your administrator.
11.5.3.76 Unable to create or update the Excel personal data provider: no
worksheet available. (IES 10877)
Cause
No worksheet could be found in the Excel le.
Action
Verify the le or see your administrator.
11.5.3.77 Unable to create or update the Excel personal data provider: unable to
retrieve the list of worksheets. (IES 10878)
Cause
The list of worksheets could not be retrieved from the Excel le.
SAP BusinessObjects Web Intelligence User's Guide
Web Intelligence error messages
P U B L I C 989
Action
Verify the le or see your administrator.
11.5.3.78 Unable to create or update the Excel personal data provider: invalid
data retrieved from the selected range. (IES 10879)
Cause
The data retrieved from a range in the Excel le is invalid.
Action
Verify the le or see your administrator.
11.5.3.79 Unable to create or update the Excel personal data provider: the
selected worksheet is invalid. (IES 10880)
Cause
The Excel worksheet is invalid.
Action
Verify the Excel le or see your administrator.
11.5.3.80 Unable to create or update the Excel personal data provider: an error
occurred while retrieving the data sampling. (IES 10881)
Cause
An error occurred during data retrieval from the Excel le.
990
P U B L I C
SAP BusinessObjects Web Intelligence User's Guide
Web Intelligence error messages
Action
Verify the le or see your administrator.
11.5.3.81 Unable to create or update the Excel personal data provider: an error
occurred while creating the data iterator. (IES 10882)
Cause
An error occurred during data retrieval from the Excel le.
Action
See your administrator.
11.5.3.82 Unable to create or update the Excel personal data provider: an error
occurred during data retrieval. (IES 10883)
Cause
An error occurred during data retrieval from the Excel le.
Action
See your administrator.
11.5.3.83 Unable to create or update the Excel personal data provider: an
internal error occurred. (IES 10884)
Cause
An error occurred during data retrieval from the Excel le.
SAP BusinessObjects Web Intelligence User's Guide
Web Intelligence error messages
P U B L I C 991
Action
See your administrator.
11.5.3.84 Unable to create or update the Excel personal data provider: the range
selection is invalid. (IES 10885)
Cause
An error occurred during data retrieval from the Excel le because the range selected was not valid.
Action
Verify the le or see your administrator.
11.5.3.85 Unable to create or update the Excel personal data provider: the range
selection does not match the worksheet. (IES 10886)
Cause
An error occurred during data retrieval from the Excel le because the range selection does not match the
worksheet.
Action
Verify the le or see your administrator.
11.5.3.86 A condition on an object refers to an object from another query that
has a different type. (IES 10887)
Cause
The object in the other query has a dierent data type from the object in the condition.
992
P U B L I C
SAP BusinessObjects Web Intelligence User's Guide
Web Intelligence error messages
Action
Correct the condition.
11.5.3.87 A condition on an object refers to an object in another query that does
not exist. (IES 10888)
Cause
Either the object or query referred to by the condition does not exist.
Action
Correct the condition.
11.5.3.88 There is a circular dependency in the query. (IES 10889)
Cause
The query has a circular dependency.
Action
Edit the query to remove the circular dependency.
11.5.3.89 Database error: {error_db}. (IES 10901)
Cause
The database returned the error given in the message.
SAP BusinessObjects Web Intelligence User's Guide
Web Intelligence error messages
P U B L I C 993

Action
See your administrator with the details of the error that occurred.
11.5.3.90 Query exceeded fixed time limit: {error_db}. (IES 10902)
Cause
The query could not return data because it took too long to run.
Action
Run the query again. If the problem persists see your administrator.
11.5.3.91 Invalid Database Field Type : {db_fieldname}. (IES 10903)
Cause
The database eld given in the message contains an invalid data type.
Action
See your administrator.
11.6 ReportEngine Web Intelligence (RWI) Error Messages
ReportEngine Web Intelligence error messages include the following:
Range
Category
RWI 00000 - RWI 00850 ReportEngine Web Intelligence
994 P U B L I C
SAP BusinessObjects Web Intelligence User's Guide
Web Intelligence error messages
11.6.1 RWI 00000 - RWI 00314
11.6.1.1 User input is required for the prompt in the query. (RWI 00000)
Cause
The server requires prompt values in order to fulll the request.
Action
Enter values for all mandatory prompts.
11.6.1.2 User input is required to select an universe context for the query. (RWI
00001)
Cause
The server requires context(s) selection in order to fulll the request.
Action
Supply context(s) choice.
11.6.1.3 The argument cannot be null. (RWI 00010)
Cause
The specied argument is "null".
Action
Enter a non-null value for the argument.
SAP BusinessObjects Web Intelligence User's Guide
Web Intelligence error messages
P U B L I C 995
11.6.1.4 Invalid value: {0}. (RWI 00011)
Cause
The specied argument value is invalid.
Action
Enter a valid value for the argument.
11.6.1.5 The argument is out of range. (RWI 00012)
Cause
The specied argument value is not within the allowed range.
Action
Specify a value within the allowed range.
11.6.1.6 Unable to retrieve the requested report part(s). Either the report part
references are invalid, or the corresponding data does not exist
anymore. (RWI 00013)
Cause
One or more report part references are invalid, or the corresponding data is not available.
Action
Ensure that you are using valid report part references. Subsequently, ensure that the requested data is
available after refreshing the document's data providers.
996
P U B L I C
SAP BusinessObjects Web Intelligence User's Guide
Web Intelligence error messages
11.6.1.7 Cannot retrieve more than one report part simultaneously in DHTML output
format. (RWI 00014)
Cause
You cannot retrieve more than one report part in DHTML output format simultaneously.
Action
Enter a single report part reference.
11.6.1.8 Cannot turn off search mode for delegated search. (RWI 00015)
Cause
A list of values dened as "delegated" search cannot have search mode disabled.
Action
Before disabling the search mode, check if the list of values is dened as "delegated search".
11.6.1.9 One of the supplied OutputCacheEntry instances is invalid or not
supported by the Web Intelligence server. (RWI 00016)
Cause
While preloading the server output cache, one or more output formats specied are invalid or unsupported.
Action
Ensure that the requested output formats are valid and supported.
SAP BusinessObjects Web Intelligence User's Guide
Web Intelligence error messages
P U B L I C 997
11.6.1.10 Could not read {0}bytes from the specified stream. (RWI 00017)
Cause
Upon upload of the resource into a document, the supplied data could not be read.
Action
Ensure that the specied parameters are correct and consistent.
11.6.1.11 The Web Intelligence server returned an invalid XML output. Contact your
administrator. (RWI 00200)
Cause
The server returned an invalid or incorrect XML output.
Action
Contact your technical support.
11.6.1.12 Could not get page number. (RWI 00223)
Cause
The requested page could not be retrieved because of an invalid page number.
Action
Ensure that the requested page number is valid.
998
P U B L I C
SAP BusinessObjects Web Intelligence User's Guide
Web Intelligence error messages
11.6.1.13 Cannot initialize Report Engine server. (RWI 00226)
Cause
Communication with the server could not be established. This may occur when attempting to create or open a
document.
Action
Ensure that the server is installed correctly. Also, check if the server is started and enabled.
11.6.1.14 Your Web Intelligence session is no longer valid because of a timeout.
(RWI 00235)
Cause
The server session allocated to a particular document has been closed, either explicitly or because of a
timeout.
Action
Ensure that the document has not been explicitly closed. Alternatively, increase the <server session
ttmeout> value.
To modify the server session timeout value:
1. Log on to the Business Intelligence platform Central Management Console (CMC).
2. Click Servers.
3. Expand Server Categories, and click Web Intelligence Services.
4. Under Server name, double-click WebIntelligenceProcessingServer. The Properties window appears.
5. In Properties window, under Web Intelligence Core Service, enter the value for Idle Connection Timeout.
SAP BusinessObjects Web Intelligence User's Guide
Web Intelligence error messages
P U B L I C 999
11.6.1.15 The Web Intelligence server cannot be reached. Contact your
administrator. (RWI 00236)
Cause
An error occurred while attempting to communicate with the server.
Action
Contact the administrator to ensure that the server is enabled and running. Also, check for network problems.
11.6.1.16 Cannot write output stream. Contact your administrator. (RWI 00237)
Cause
An I/O error occurred when writing data in response to a view request.
Action
Contact the administrator to ensure that the specied destination parameter is valid.
11.6.1.17 Connection failed. The server has reached the maximum number of
simultaneous connections. (RWI 00239)
Cause
The maximum number of server connections allowed has been reached.
Action
Either raise the value of the <maximum connections> server parameter, or add another server instance.
To modify the maximum connections value:
1000
P U B L I C
SAP BusinessObjects Web Intelligence User's Guide
Web Intelligence error messages
1. Log on to the Business Intelligence platform Central Management Console (CMC).
2. Click Servers.
3. Expand Server Categories, and click Web Intelligence.
4. Under Server name, double-click WebIntelligenceProcessingServer. The Properties window appears.
5. In Properties window, under Web Intelligence Core Service, enter the value for Maximum Connections.
11.6.1.18 Your server version is incompatible with this client version. Contact
your administrator. (RWI 00240)
Cause
The server does not support this SDK version.
Action
Contact the administrator to ensure that the server version is compatible with the client version.
11.6.1.19 Cannot find an XML transformer. (RWI 00301)
Cause
Unable to instantiate the XSLT transformer used for XML to HTML transformation.
Action
Try again later.
11.6.1.20 Cannot create translet. (RWI 00309)
Cause
Unable to compile the XSLT stylesheet used for XML to HTML transformation.
SAP BusinessObjects Web Intelligence User's Guide
Web Intelligence error messages
P U B L I C 1001
Action
Try again later.
11.6.1.21 Cannot get an output file for the document. (RWI 00314)
Cause
While serializing a document state, an error occurred. This might be due to insucient memory or an I/O error.
Action
Ensure that there is sucient memory available. Also, check for any <webi.properties> customization.
11.6.2 RWI 00315 - RWI 00605
11.6.2.1 Cannot retrieve an XML parser ID. (RWI 00316)
Cause
An error occurred during XSLT transformation. This might be because you are requesting output in XML
format using a client supplied stylesheet.
Action
Ensure that the specied XSLT stylesheet is correct.
11.6.2.2 Cannot transform XML to HTML. (RWI 00317)
Cause
During XSLT transformation, an error occurred while requesting output in HTML.
1002
P U B L I C
SAP BusinessObjects Web Intelligence User's Guide
Web Intelligence error messages
Action
Try again later.
11.6.2.3 The Java Runtime Environment does not support UTF-8 encoding. (RWI
00321)
Cause
The JRE does not support UTF-8 encoding.
Action
Switch to a JRE that supports UTF-8 encoding.
11.6.2.4 An error occurred while retrieving the document from the storage token.
(RWI 00322)
Cause
An error occurred during document state deserialization. This might be due to insucient memory or an I/O
error.
Action
Ensure that there is sucient memory available. Also check for any <webi.properties> customization.
11.6.2.5 Cannot retrieve the document with the passed obsolete token. (RWI 00323)
Cause
An error occurred during document state deserialization. This might be caused by a storage token that
identies a document state, which is no longer available in the storage tokens stack.
SAP BusinessObjects Web Intelligence User's Guide
Web Intelligence error messages
P U B L I C 1003
Action
In the <webi.properties> le, increase the value of < storage tokens stack size>. Also, ensure that
the storage token is valid before using it.
11.6.2.6 Cannot retrieve the document with the passed malformed token. (RWI
00324)
Cause
An error occurred during document state deserialization. This might be due to an invalid storage token.
Action
Specify a valid storage token.
11.6.2.7 There are too many operands for the current operator. (RWI 00501)
Cause
For the current operator, the condition or lter has too many operands to be able to add a new one.
Action
Remove existing operands before attempting to add a new one.
11.6.2.8 There are not enough operands for the current operator. (RWI 00502)
Cause
The condition or lter does not have enough operands with respect to the current operator.
1004
P U B L I C
SAP BusinessObjects Web Intelligence User's Guide
Web Intelligence error messages
Action
Add operand(s) to the condition or lter.
11.6.2.9 Prompts are not supported on filters created at the report level. (RWI
00503)
Cause
Report lters do not support prompts. Only query conditions support prompts.
Action
Do not use prompts in report lters.
11.6.2.10 You cannot modify operators and operands in predefined filters. (RWI
00504)
Cause
While using a pre-dened condition, you cannot specify an operator for a condition or lter.
Action
Ensure that the operator in the pre-dened condition does not have any lters or conditions.
11.6.2.11 LIKE and NOT_LIKE operators are allowed only on ObjectType.TEXT
objects. (RWI 00506)
Cause
You attempted to use "LIKE" or "NOT_LIKE" operators for objects that are not of character type.
SAP BusinessObjects Web Intelligence User's Guide
Web Intelligence error messages
P U B L I C 1005
Action
When the object used in a lter is not of <character> type, ensure that you do not use the "LIKE" and
"NOT_LIKE" operators.
11.6.2.12 The specified operator cannot be applied to a document filter. (RWI
00507)
Cause
The specied operator cannot be used with report lters. It can be used only with query conditions.
Action
Do not use this operator when working with report lters.
11.6.2.13 Web Intelligence is unable to attach a LOV (List of Values) to the
prompt because the associated source object does not have a LOV. (RWI
00508)
Cause
Cannot use a list of values with the prompt being dened. This is because the object used in this condition does
not contain a LOV.
Action
Before requesting the prompt to use the list of values, ensure that the object used within the condition has a
dened list of values.
1006
P U B L I C
SAP BusinessObjects Web Intelligence User's Guide
Web Intelligence error messages
11.6.2.14 There are incompatible data source objects in the filter condition
comparison. (RWI 00509)
Cause
You have attempted to compare two objects of dierent types within a condition.
Action
Use objects of the same type.
11.6.2.15 Cannot create a report filter on a formula. (RWI 00511)
Cause
Formulas cannot be used as report lters. Only data providers and variable expressions can be used.
Action
Use a data provider or variable expression when dening a report lter.
11.6.2.16 A percentage rank cannot have values greater than 100. (RWI 00512)
Cause
When you dened the percentage ranking, you chose a rank size that was greater than 100.
Action
Ensure that the rank size is less than 100.
SAP BusinessObjects Web Intelligence User's Guide
Web Intelligence error messages
P U B L I C 1007
11.6.2.17 The expression is not available in the axis. (RWI 00602)
Cause
You have attempted to create a break, calculation, or sort using an expression that is not in the axis.
Action
Use an expression that is available in the axis.
11.6.2.18 Only measure objects can be included on the y-axis. (RWI 00603)
Cause
You have attempted to add an expression to the axis, where the expression is not of <measure> type.
Action
Specify an expression of <measure> type.
11.6.2.19 You cannot base a section on a measure. (RWI 00604)
Cause
A section cannot be based on an expression of <measure> type.
Action
Do not use an expression of <measure> type as the basis for a section.
1008
P U B L I C
SAP BusinessObjects Web Intelligence User's Guide
Web Intelligence error messages
11.6.2.20 You cannot add more than one expression to a section axis. (RWI 00605)
Cause
A section axis does not support more than one expression.
Action
Do not use several expressions in a section axis.
11.6.3 RWI 00606 - RWI 00850
11.6.3.1 You cannot include a circular attachment in a document. (RWI 00606)
Cause
You have attempted to dene a report attachment that causes a circular attachment.
Action
Dene a report that does not generate a circular attachment.
11.6.3.2 The expression is different from the table cell expression. (RWI 00607)
Cause
You have attempted to create a calculation on a table cell, specifying an expression dierent from the one
contained in the table cell.
Action
Create a calculation table with the expression that is already dened in the table cell.
SAP BusinessObjects Web Intelligence User's Guide
Web Intelligence error messages
P U B L I C 1009
11.6.3.3 You cannot copy a ReportElement object to an element in a different
ReportElementContainer. (RWI 00608)
Cause
Report attachments can only be dened between report elements belonging to the same container.
Action
Ensure that you are creating report attachments between report elements that belong to the same container.
11.6.3.4 You cannot create a horizontal attachment on a section. (RWI 00609)
Cause
You have attempted to create a horizontal attachment in a section.
Action
Do not create horizontal attachments in a section, as sections cannot exceed the maximum allowed width.
11.6.3.5 You cannot remove all rows and columns from the table body. The table
must contain at least one row and column. (RWI 00610)
Cause
You have attempted to remove the last row or column in a table body.
Action
Ensure that the table contains at least one row and column.
1010
P U B L I C
SAP BusinessObjects Web Intelligence User's Guide
Web Intelligence error messages
11.6.3.6 Dimension and detail objects only are allowed on this axis. (RWI 00611)
Cause
You have attempted to add an expression of incompatible type on an axis where only dimension and detail
expression types are allowed.
Action
Specify an expression of compatible type.
11.6.3.7 Additional objects cannot be added to the block axis based on the block
shape. (RWI 00612)
Cause
Cannot add more expressions to the specied block axis.
Action
Do not add more expressions.
11.6.3.8 This report element cannot have a double side attachment. (RWI 00613)
Cause
A report element cannot be horizontally and vertically attached to two distinct report elements.
Action
Ensure that the report element is attached (horizontally and vertically) to the same report element.
SAP BusinessObjects Web Intelligence User's Guide
Web Intelligence error messages
P U B L I C 1011
11.6.3.9 The table cell has been removed from its table. (RWI 00614)
Cause
You have attempted to use a table cell that has been removed from its containing table.
Action
You cannot use a table cell after it has been removed from its containing table.
11.6.3.10 Alerter isn't defined in current document. (RWI 00619)
Cause
Alerter referenced in report doesn't belong to alerter dictionary of document.
Action
Add alerter in dictionary.
11.6.3.11 Track data change mode should be active to perform a track data change
action. (RWI 00620)
Cause
Unable to perform track data change action because track data was not activated.
Action
Enable track data changes mode in the Web Intelligence document.
1012
P U B L I C
SAP BusinessObjects Web Intelligence User's Guide
Web Intelligence error messages
11.6.3.12 An exception occured in the visualization framework. (RWI 00621)
Cause
An exception occured in the visualization framework.
Action
Check the inner exception.
11.6.3.13 Drill mode should be active to perform drill actions (RWI 00624)
Cause
Unable to perform drill action due to drill state.
Action
Activate the drill mode in the Web Intelligence document.
11.6.3.14 You cannot run an empty query. (RWI 00701)
Cause
You have attempted to run an empty query.
Action
Before running a query, add result objects to it.
SAP BusinessObjects Web Intelligence User's Guide
Web Intelligence error messages
P U B L I C 1013
11.6.3.15 Cannot delete the last data provider. (RWI 00702)
Cause
You have attempted to delete the last data provider in a document.
Action
A document must contain at least one data provider.
11.6.3.16 A data provider with this name already exists. (RWI 00703)
Cause
You have attempted to give a data provider a name that already exists in the document.
Action
Every data provider within a document must have a unique name.
11.6.3.17 Combined queries are incompatible with sampling mode activated. (RWI
00706)
Cause
Sampling cannot be used with combined queries.
Action
Do not use sampling with combined queries.
1014
P U B L I C
SAP BusinessObjects Web Intelligence User's Guide
Web Intelligence error messages
11.6.3.18 Processing remove data source objects while there are only two data
source expressions. (RWI 00800)
Cause
You have attempted to remove an expression from a synchronized dimension that contains only two
expressions.
Action
Ensure that a synchronized dimension always contains at least two expressions.
11.6.3.19 Cannot create a Link with a name that already exists ({0}). (RWI 00801)
Cause
You have attempted to create a synchronized dimension with a name that already exists.
Action
Provide a unique name for each synchronized dimension.
11.6.3.20 Cannot update CustomSortLov with a new list of values more than the
size supported by CustomSortLov. (RWI 00825)
Cause
You have attempted to update the list of values of a custom sort denition with more values than allowed.
Action
Ensure that the number of values in the list is within the specied custom sort range.
SAP BusinessObjects Web Intelligence User's Guide
Web Intelligence error messages
P U B L I C 1015
11.6.3.21 Cannot create CustomSortLov while Report Expression's Lov size is
greater than the size supported by CustomSortLov . (RWI 00826)
Cause
You have attempted to create the list of values of a custom sort denition with more values than allowed.
Action
Ensure that the number of values in the list is within the specied custom sort range.
11.6.3.22 The provided expression violates one of the feed restrictions. (RWI
00830)
Cause
The provided expression violates one of the feed restrictions.
Action
There is an error in the formula. Check the feed restrictions before adding a formula.
11.6.3.23 {0} feature is not supported. (RWI 00850)
Cause
You have attempted to use a particular feature that is not supported in the current context.
Action
Before using this feature, ensure that it is supported.
1016
P U B L I C
SAP BusinessObjects Web Intelligence User's Guide
Web Intelligence error messages

11.7 Custom Data Source (CDS) Framework Error Messages
Custom Data Source (CDS) Framework error messages include the following categories:
Range Category
CDS 00001 - CDS 00013 Custom Data Source User Interface Framework error
messages
CDS 10100 - CDS 10400 Web Services Custom Data Source Plugin error messages
CDS 15102 - CDS 15122 Custom Data Source Framework error messages
11.7.1 Custom Data Source User Interface Framework error
messages
11.7.1.1 The selected file extension is not correct. (CDS 00001)
Cause
The extension of the le is not as expected or is dierent from the previously selected le.
Action
Check whether the correct le is selected.
11.7.1.2 Cannot access the file. (CDS 00002)
Cause
You have entered an incorrect le path.
Action
Check whether the correct path is entered.
SAP BusinessObjects Web Intelligence User's Guide
Web Intelligence error messages
P U B L I C 1017
11.7.1.3 The file does not exist. (CDS 00003)
Cause
The le does not exist at the path specied.
Action
Check whether you have specied valid path and lename.
11.7.1.4 The selected file is a directory. (CDS 00004)
Cause
The path entered points to a directory instead of a le.
Action
Enter the correct lename.
11.7.1.5 Error in processing data source - There was an invalid operation for the
plug-in. (CDS 00005)
Cause
The plugin is not able to retrieve all the data source parameters.
Action
Check the logs and verify that the plug-in code is working properly.
1018
P U B L I C
SAP BusinessObjects Web Intelligence User's Guide
Web Intelligence error messages
11.7.1.6 An error occurred in the user interface of the plug-in. (CDS 00006)
Cause
An error has occurred in the plug-in user interface.
Action
Check the logs and verify that the plug-in code is working properly.
11.7.1.7 An error occurred while accessing the updated inputs. (CDS 00007)
Cause
An error occurred while accessing the data source parameters retrieved from the plug-in.
Action
Check the logs and verify that the plug-in code is working properly.
11.7.1.8 An object with this name already exists. (CDS 00008)
Cause
Another object with this name exists.
Action
Change the name of the object to a unique value.
SAP BusinessObjects Web Intelligence User's Guide
Web Intelligence error messages
P U B L I C 1019
11.7.1.9 The query with this name already exists. (CDS 00009)
Cause
Another query with this name exists.
Action
Change the name of the query to a unique value.
11.7.1.10 A problem was detected with the install. Please check and try again.
(CDS 00010)
Cause
A problem was detected with the install.
Action
Check the installation setup. Refer to the documentation for more details.
11.7.1.11 Error in processing data source. (CDS 00011)
Cause
A problem was detected while identifying the data source.
Action
Check the logs to get the detailed error message.
1020
P U B L I C
SAP BusinessObjects Web Intelligence User's Guide
Web Intelligence error messages
11.7.1.12 The requested action could not be completed. (CDS 00012)
Cause
An error was detected.
Action
Check the logs to get the detailed error message.
11.7.1.13 Could not retrieve plug-in display component. (CDS 00013)
Cause
A error occurred while retrieving the plug-in component.
Action
Check the logs to get the detailed error message. Verify that the plugin-in code is correct.
11.7.2 Web Services Custom Data Source Plugin error
messages
11.7.2.1 An error occurred while processing the requested action. (CDS 10100)
Cause
An unexpected error occurred while processing the requested action.
Action
Contact your enterprise administrator.
SAP BusinessObjects Web Intelligence User's Guide
Web Intelligence error messages
P U B L I C 1021
11.7.2.2 No selection made in Output Message panel. (CDS 10101)
Cause
User has not selected the eld(s) for the query from the Output Message panel.
Action
Select the eld(s) that need to be displayed in the report from the Output Message panel.
11.7.2.3 An error occurred while invoking Web Service. {0}(CDS 10200)
Cause
An error occurred while invoking a web service.
Action
Contact your enterprise administrator.
11.7.2.4 Error executing web service: "{0}" (CDS 10201)
Cause
The Web Service Endpoint could not be invoked because of incorrect input parameters.
Action
Enter the correct values while invoking the Web Service.
1022
P U B L I C
SAP BusinessObjects Web Intelligence User's Guide
Web Intelligence error messages
11.7.2.5 An error occurred while instantiating the Web Service plugin. (CDS 10202)
Cause
The extension descriptor of the web service plug-in did not return the correct dstype.
Action
Contact your administrator to x the problem.
11.7.2.6 Parsing Exception: The input WSDL type or structure is not supported.
(CDS 10203)
Cause
The structure of the WSDL is not supported by Web Services Custom Data Source plug-in.
Action
Refer the documentation for supported WSDLs.
11.7.2.7 WSDLs that refer to Microsoft's types namespace are not supported. (CDS
10204)
Cause
WSDLs that refer to http://microsoft.com/wsdl/types/ namespace are not supported.
Action
Modify the WSDL or select the supported WSDL.
SAP BusinessObjects Web Intelligence User's Guide
Web Intelligence error messages
P U B L I C 1023
11.7.2.8 WSDLs that have cyclical references are not supported. (CDS 10205)
Cause
WSDL type denitions contain cyclical references.
Action
Modify the WSDL or select the supported WSDL.
11.7.2.9 WSDLs that do not have type definitions are not supported. (CDS 10206)
Cause
WSDL does not contain any type denitions in <types> tags.
Action
Modify the WSDL or select the supported WSDL.
11.7.2.10 Unable to send SOAP request as the target URL is malformed. (CDS 10207)
Cause
The SOAP action target URL mentioned for this service in the WSDL is malformed.
Action
Modify the WSDL or select another WSDL that is supported.
1024
P U B L I C
SAP BusinessObjects Web Intelligence User's Guide
Web Intelligence error messages
11.7.2.11 WSDLs that use encoded messages are not supported. (CDS 10208)
Cause
The WSDL has operations that expect encoded messages.
Action
Modify the WSDL or select another WSDL that is supported.
11.7.2.12 An error was detected while parsing the response. (CDS 10400 )
Cause
An error was detected while parsing the response from server.
Action
Check the product logs to get the actual cause of error.
11.7.3 Custom Data Source Framework error messages
11.7.3.1 Unable to create or update the Custom Data Provider : unable to retrieve
information from the provided source. (CDS 15102)
Cause
An unexpected error occurred while trying to retrieve information from the provided source.
Action
Contact your administrator to resolve the error.
SAP BusinessObjects Web Intelligence User's Guide
Web Intelligence error messages
P U B L I C 1025
11.7.3.2 Unable to create or update the Custom Data Provider : unable to retrieve
structure information from the provided source. (CDS 15103)
Cause
An unexpected error occurred while trying to retrieve the structure information from the provided source.
Action
Contact the plug-in support to verify that the plug-in is working properly. If the error is not resolved contact
SAP support to resolve the error.
11.7.3.3 Unable to create or update the Custom Data Provider : unable to build the
iterator on the data set. (CDS 15104)
Cause
An unexpected error occurred while trying to build the iterator on the dataset.
Action
Contact the plug-in support to verify that the plug-in is working properly. If the error is not resolved contac
support to resolve the error.
11.7.3.4 Unable to create or update the Custom Data Provider : a problem was
encountered in Data Source plug-in management and the requested action
cannot be completed. (CDS 15106)
Cause
An unexpected error has occurred.
1026
P U B L I C
SAP BusinessObjects Web Intelligence User's Guide
Web Intelligence error messages
Action
Contact support to resolve the error.
11.7.3.5 Unable to create or update the query on this file : the file "{filename}"
does not exist in the file system. (CDS 15107)
Cause
The le does not exist at the specied location.
Action
Check whether the le path specied for source le is correct.
11.7.3.6 Unable to create or update the Custom Data Provider : the path is
invalid. (CDS 15108)
Cause
The le path mentioned is incorrect.
Action
Check that the path specied for the source is correct.
11.7.3.7 Unable to create or update the Custom Data Provider : invalid information
retrieved while trying to get the structure. (CDS 15109)
Cause
An error occurred while trying to retrieve the structure information from the data provider.
SAP BusinessObjects Web Intelligence User's Guide
Web Intelligence error messages
P U B L I C 1027
Action
Contact the plug-in support to verify that the plug-in is working properly. If the error is not resolved, contact
support to resolve the error.
11.7.3.8 Unable to create or update the Custom Data Provider : could not find
matching Data Source plug-in for this request. (CDS 15110)
Cause
An error occurred while trying to retrieve the plug-in information.
Action
Check that plug-in implementation returns required plug-in information correctly. Refer to documentation for
information on conguring the plug-in.
11.7.3.9 Unable to create or update the Custom Data Provider : could not
instantiate matching Data Source plug-in for this request. (CDS 15111)
Cause
An error occurred while trying to instantiate the plug-in.
Action
Check that the plug-in details and MODULE-PATH in the plug-in MANIFEST le is correct. Refer to the
documentation for information on conguring the plug-in.
1028
P U B L I C
SAP BusinessObjects Web Intelligence User's Guide
Web Intelligence error messages
11.7.3.10 Unable to create or update the Custom Data Provider : could not
instantiate Data Source plug-in's Data Provider for this request. (CDS
15112)
Cause
An error occurred while trying to instantiate the Data Provider component of the plug-in extension.
Action
Contact the plug-in support to verify if the plug-in is working properly.
11.7.3.11 Unable to create or update the Custom Data Provider : an error occurred
while retrieving the data sampling. (CDS 15113)
Cause
An error occurred in the plug-in while trying to retrieve sample data from the data provider.
Action
Contact the plug-in support to verify if the plug-in is working properly.
11.7.3.12 Unable to retrieve data from the Custom Data Provider : an error
occurred while creating the data iterator. (CDS 15114)
Cause
An error occurred in the plug-in while trying to retrieve the data iterator.
Action
Contact the plug-in support to verify if the plug-in is working properly.
SAP BusinessObjects Web Intelligence User's Guide
Web Intelligence error messages
P U B L I C 1029
11.7.3.13 Unable to retrieve data from the Custom Data Provider : an error
occurred while fetching data through the iterator. (CDS 15115)
Cause
An error occurred in the plug-in while trying to fetch the data through the iterator.
Action
Contact the plug-in support to verify if the plug-in is working properly.
11.7.3.14 Unable to create or update the Custom Data Provider : unsupported
object type was provided by the Data Source plug-in while trying to
get the structure. (CDS 15116)
Cause
The plug-in has data types that are not supported.
Action
Refer to the documentation for the list of supported data types.
11.7.3.15 Unable to create or update the Custom Data Provider : an internal error
occurred while trying to open the session. (CDS 15117)
Cause
An error occurred in the plug-in while trying to open a session.
Action
Contact the plug-in support to verify if the plug-in is working properly.
1030
P U B L I C
SAP BusinessObjects Web Intelligence User's Guide
Web Intelligence error messages
11.7.3.16 Unable to create or update the Custom Data Provider : the source in the
provided path is protected. (CDS 15118)
Cause
The plug-in could not proceed as the source le provided is a password-protected le.
Action
Refer to the plug-in documentation.
11.7.3.17 Unable to create or update the Custom Data Provider : the provided URL
is invalid. (CDS 15119)
Cause
The plug-in could not proceed as the URL is invalid.
Action
Refer to the plug-in documentation.
11.7.3.18 Unable to create or update the Custom Data Provider : the provided URL
cannot be found. (CDS 15120)
Cause
The plug-in could not proceed as the provided URL could not be found.
Action
Refer to the plug-in documentation.
SAP BusinessObjects Web Intelligence User's Guide
Web Intelligence error messages
P U B L I C 1031
11.7.3.19 Unable to interact with the Custom Data Provider on the provided
source. (CDS 15121)
Cause
An unexpected error has occurred.
Action
Contact support to resolve the error.
11.7.3.20 A problem was encountered. The requested action cannot be completed.
(CDS 15122)
Cause
An unexpected error has occurred.
Action
Contact support to resolve the error.
1032
P U B L I C
SAP BusinessObjects Web Intelligence User's Guide
Web Intelligence error messages

Important Disclaimers and Legal Information
Hyperlinks
Some links are classied by an icon and/or a mouseover text. These links provide additional information.
About the icons:
● Links with the icon : You are entering a Web site that is not hosted by SAP. By using such links, you agree (unless expressly stated otherwise in your
agreements with SAP) to this:
● The content of the linked-to site is not SAP documentation. You may not infer any product claims against SAP based on this information.
● SAP does not agree or disagree with the content on the linked-to site, nor does SAP warrant the availability and correctness. SAP shall not be liable for any
damages caused by the use of such content unless damages have been caused by SAP's gross negligence or willful misconduct.
● Links with the icon : You are leaving the documentation for that particular SAP product or service and are entering a SAP-hosted Web site. By using such
links, you agree that (unless expressly stated otherwise in your agreements with SAP) you may not infer any product claims against SAP based on this
information.
Beta and Other Experimental Features
Experimental features are not part of the ocially delivered scope that SAP guarantees for future releases. This means that experimental features may be changed by
SAP at any time for any reason without notice. Experimental features are not for productive use. You may not demonstrate, test, examine, evaluate or otherwise use
the experimental features in a live operating environment or with data that has not been suciently backed up.
The purpose of experimental features is to get feedback early on, allowing customers and partners to inuence the future product accordingly. By providing your
feedback (e.g. in the SAP Community), you accept that intellectual property rights of the contributions or derivative works shall remain the exclusive property of SAP.
Example Code
Any software coding and/or code snippets are examples. They are not for productive use. The example code is only intended to better explain and visualize the syntax
and phrasing rules. SAP does not warrant the correctness and completeness of the example code. SAP shall not be liable for errors or damages caused by the use of
example code unless damages have been caused by SAP's gross negligence or willful misconduct.
Gender-Related Language
We try not to use gender-specic word forms and formulations. As appropriate for context and readability, SAP may use masculine word forms to refer to all genders.
SAP BusinessObjects Web Intelligence User's Guide
Important Disclaimers and Legal Information
P U B L I C 1033

www.sap.com/contactsap
© 2018 SAP SE or an SAP aliate company. All rights reserved.
No part of this publication may be reproduced or transmitted in any form
or for any purpose without the express permission of SAP SE or an SAP
aliate company. The information contained herein may be changed
without prior notice.
Some software products marketed by SAP SE and its distributors
contain proprietary software components of other software vendors.
National product specications may vary.
These materials are provided by SAP SE or an SAP aliate company for
informational purposes only, without representation or warranty of any
kind, and SAP or its aliated companies shall not be liable for errors or
omissions with respect to the materials. The only warranties for SAP or
SAP aliate company products and services are those that are set forth
in the express warranty statements accompanying such products and
services, if any. Nothing herein should be construed as constituting an
additional warranty.
SAP and other SAP products and services mentioned herein as well as
their respective logos are trademarks or registered trademarks of SAP
SE (or an SAP aliate company) in Germany and other countries. All
other product and service names mentioned are the trademarks of their
respective companies.
Please see https://www.sap.com/about/legal/trademark.html for
additional trademark information and notices.
THE BEST RUN
