
1
China Residential
When will the party end?
Alpha Watch
January 2014

China Residential
When will the party end? January 2014
_________________________________________________________________________________________
2
Executive summary
Many have raised concerns that China’s housing market is in a
bubble, given the strong sales transactions, price increases and
large vacant and pipeline inventory. However, we do not expect a
national or devastating bubble burst in the China property market
although some smaller markets may correct due to oversupply and
weak demand. China is a large country with a wide degree of
variance among different geographic areas. In the Tier 1 and 2 cities,
prices are high due to strong demand and constraint in supply.
Home ownership rate is lower than in the rural areas and there is
upgrading desire with many households in poor and cramped
conditions. In many Tier 3 and 4 cities, oversupply is the main
problem as local governments have been selling land to developers
to fund new projects and infrastructure to drive their economies.
Long-term housing demand drivers remain intact, but the momentum
of growth is expected to ease after coming up from a low base in the
past few decades. China’s economic growth rate is slowing down as
it undergoes restructuring, the population will be peaking in a few
years’ time with less moving into the marriageable age group and
the rate of urbanisation will be more moderate after hitting over 52%
in 2012. Capital controls will be slowly eased under the financial
reforms, which are likely to divert more funds to overseas properties.
Tier 1 and 2 cities will however continue to see strong housing
demand from the continuous influx of migrants, and upgrading and
investment demand. Nevertheless price increases are expected to
be more moderate from 2013 rates, given the slower economic
growth, housing curbs, high price levels and increasing supply of
affordable housing. For smaller cities with oversupply, some could
see a fall in prices with weak demand but most are likely to see flat
prices. Coastal Tier 3 and 4 cities are in a better position to resolve
their oversupply over time, as they have stronger economic drivers
to attract migrants from inland areas, aided by the recent relaxation
to make it easier for migrants to obtain hukou registration.
With the property sector contributing a significant proportion to GDP
growth, it is in the interest of the government to see a stabilised
market. The new government has shifted focus to increasing social
welfare supply instead of curbing housing demand and price
increase nationwide. The major risk for the housing market is a
significant economic slowdown as a result of drastic reforms or
another global crisis. However, it is likely that the Chinese
government will step in with some stimulus as it had done during the
global financial crisis and last year’s slowdown. As the housing
market in China is a diverse mix and coming to a new era of slower
growth momentum, investors/developers will have to carefully
consider each city’s economic growth drivers and housing demand
and supply situation.
Contents
Executive summary 2
Introduction 3
Is there a price bubble? 4
Is there oversupply? 7
Will demand slow down? 11
Impact of tightening credit 14
Impact of government
policies 16
Outlook 18
Author
Chua Chor Hoon
Director, Research
China Residential
When will the party end? January 2014
_________________________________________________________________________________________
3
Introduction
Housing prices in China have risen for more than a decade, driven by strong
growth in disposable income and urbanisation. 470 million people have moved
from rural to urban areas over the past three decades. The share of the urban
population has increased from about 17.8% in 1978 to about 52.6% in 2012.
The increased demand for urban housing has helped to push home prices
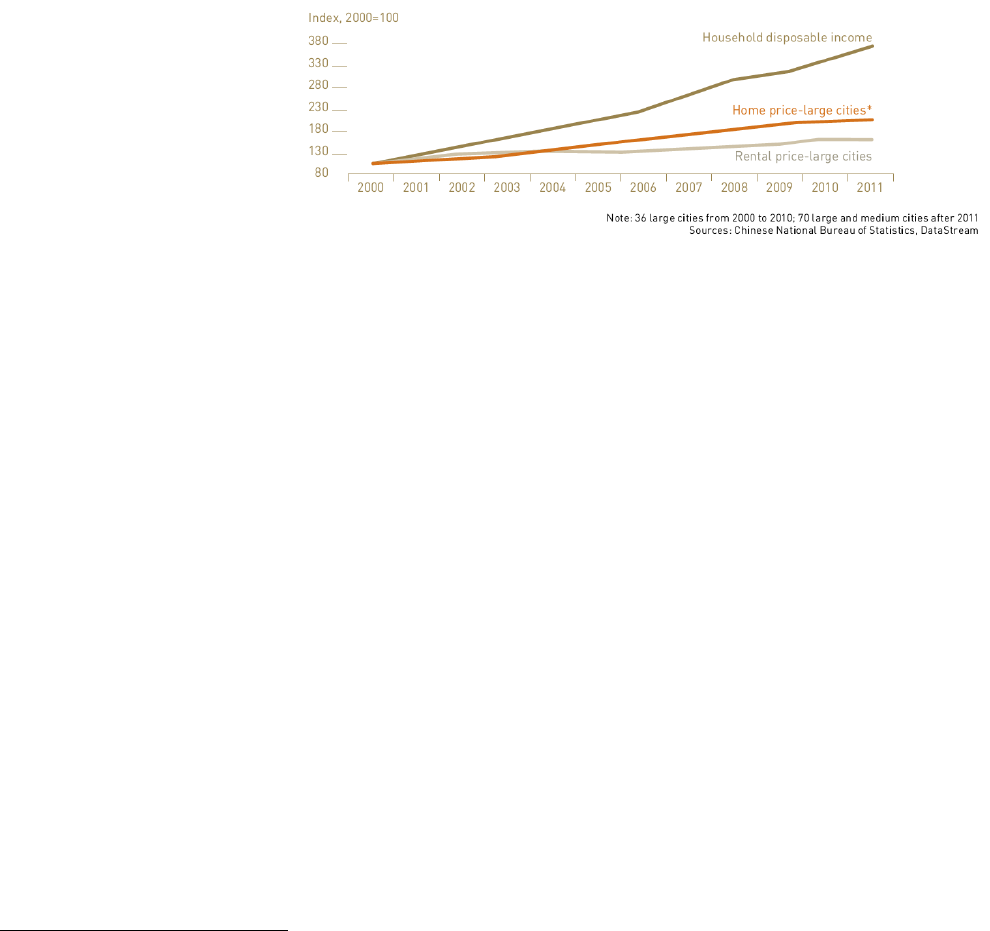
higher in these areas. Income has grown faster than home prices, providing
fundamental support to prices (Fig 1).
Figure 1: Disposable income grows faster than home prices
Despite three years of government measures to curb demand and price
growth, new home sales volume and prices in 2013 continued to rise. Sales
volume rose 18% to 1.2 billion sqm. New home prices among 70 large and
medium-sized cities rose an average of 9.7%, led by Tier 1 cities which saw
increases exceeding 20%
1
. The total value of new home sales in 2013 rose
27% to RMB 6.8 trillion, exceeding USD 1 trillion for the first time. This is
comparable to the total value of new and existing home sales in the US,
estimated to be around USD 1.1 trillion, including USD149 billion of new
homes
2
.
Many have raised concerns that China’s housing market is in a bubble, given
the strong sales transactions, price increases and large vacant and pipeline
inventory. The purpose of this paper is to examine the following points of
inquiry:
Is there a price bubble?
Is there oversupply?
Will demand slow down?
Will credit tightening kill the market or trigger a financial crisis similar
to what happened in the US?
What is the government policy intention?
What is the outlook and investment strategy to be taken?
1
National Bureau of Statistics
2
Cushman & Wakefield

China Residential
When will the party end? January 2014
_________________________________________________________________________________________
4
Is there a price bubble?
The price-to-income and affordability ratios, commonly used indicators
to analyse housing market exuberance, showed that China’s nationwide
average ratios are much higher than most other countries.
However there is a degree of variance among different areas. The ratios
are much higher in the Tier 1 and 2 cities where price increases have
taken on a faster pace. Tier 3 cities have ratios that are comparable to
other countries.
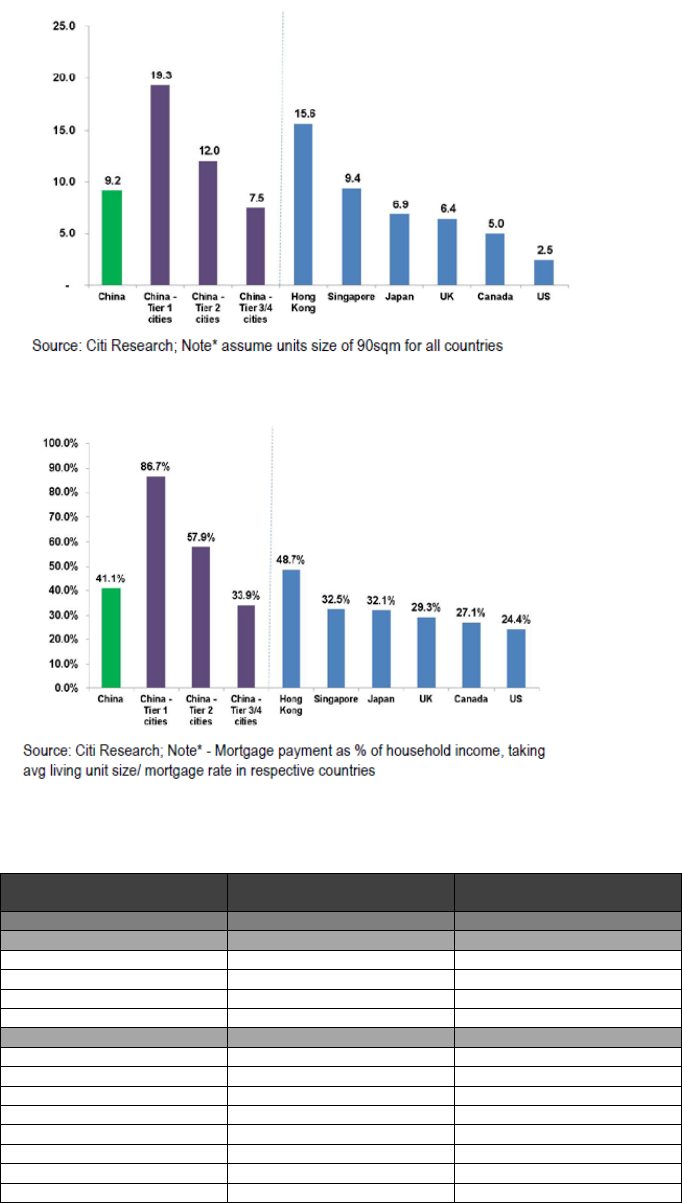
According to Citi Research
3
, the price-to-income ratio in China is 9.2, higher
than in most other countries with the exception of Hong Kong (15.6) and just
below Singapore (9.4) (Fig 2). Similarly, the affordability ratio (monthly
mortgage payment for mainstream unit size versus average household
income) in China at 41.1% is higher than in most other countries except for
Hong Kong (48.7%) (Fig 3). This is due to the higher mortgage rates in China,
besides the high property prices.
However, these do not reflect a nationwide bubble. The ratios are higher in
Tier 1 and 2 cities, while Tier 3 cities exhibit ratios comparable to other
countries. The ratios in Beijing and Shanghai are among the highest in the
world, given their fast rates of price growth which have outpaced growth in
disposable income. Price-to-income ratio and affordability ratio have reached
22.4x/95% for Beijing and 17x/78% for Shanghai (Table 1).
The root causes for the high ratios in the Tier 1 and 2 cities are ample liquidity
and supply shortage. Property has become a popular vehicle to park the
wealth of the rapidly growing affluent group and preserve value against
inflation amidst a lack of other investment channels. The better job prospects
attract a continuous growing population, including new graduates,
businessmen and migrant workers. However, land resources are getting
limited as these cities grow, exerting pressure on housing prices.
3
Citi Research: China Property, Ghost Towns and Property Bubbles, December 2013
China Residential
When will the party end? January 2014
_________________________________________________________________________________________
5
Figure 2: Price-to-income Ratio
Figure 3: Affordability Ratio
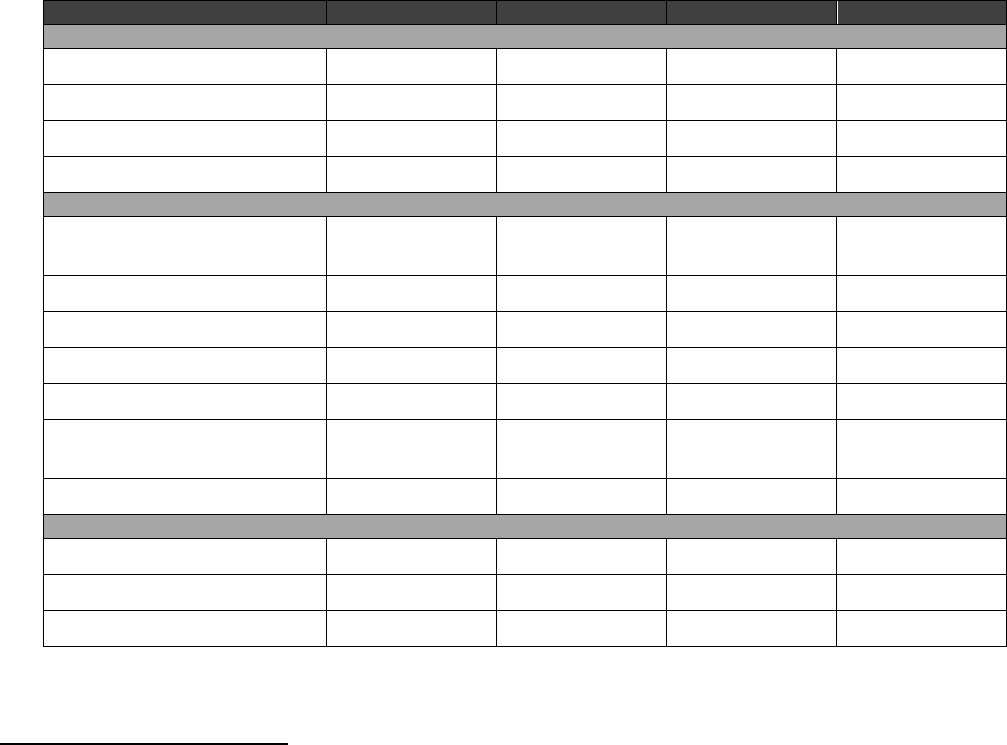
Table 1: Price-to-income and affordability ratios of Tier 1 and selected
Tier 2 cities
Price-to-Income Ratio
Affordability
(Mortgage as % of Income)
National
9.2
41.1
Tier 1 Cities
19.3
86.7
Beijing
22.4
95.4
Shenzhen
23.0
92.7
Shanghai
17.0
91.2
Guangzhou
15.6
69.4
Tier 2 Cities
12.0
57.9
Hangzhou
18.4
84.9
Tianjin
13.3
65.8
Xiamen
17.0
62.3
Chengdu
12.4
60.3
Nanjing
13.1
58.9
Chongqing
10.3
48.2
Shenyang
11.2
47.8
Wuhan
12.6
41.9
Source: Soufun, CEIC, Citi Research
China Residential
When will the party end? January 2014
_________________________________________________________________________________________
6
While the high prices in Tier 1 and 2 cities have a part to play in the high
price-to-income ratio and affordability ratio, the huge wealth gap and
under-reporting of income have also caused these ratios to be
disproportionately higher.
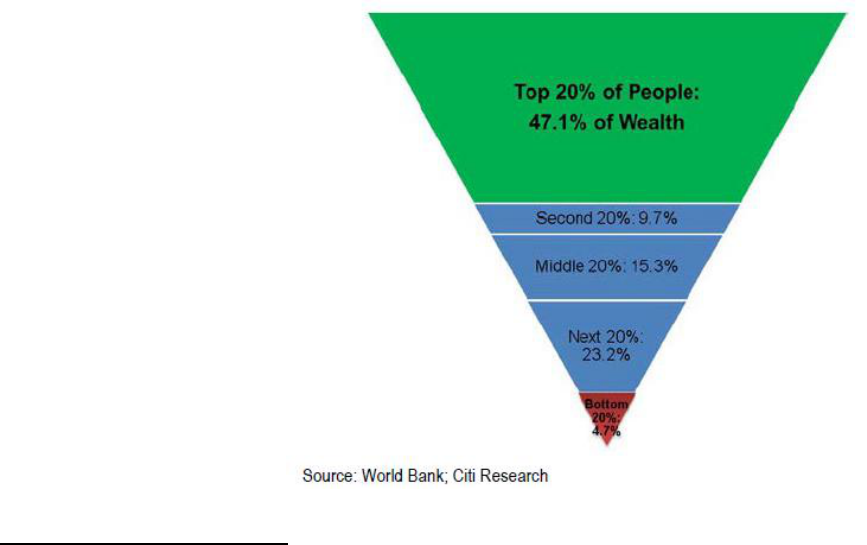
The effective home buyers come from the affluent group which controls the
majority of assets and wealth. According to a 2009 World Bank report, the top
20% of wealthy people in China controlled around 47% of assets, while the
bottom 20% owned only 4.7% (Fig 4). Based on National Statistics Bureau
(NBS) 2012 figures, the disposable income of the top 10% urban population is
about 7.8x that of the bottom 10%
4
. Unofficial estimates said that the top 20% of
earners potentially under-report incomes by 60-70%
5
. Furthermore, “grey
income” is sizeable and concentrated in top-earner groups while the low-income
population usually do not have “grey income”. Factoring these in, the disposable
income at the high end could be above10x more than the lowest income level.
Hence affordability is less of an issue for the higher income groups. The
greater constraints for them are the credit tightening for second
properties and ban on third property purchases.
Notwithstanding the flaws in the computation of the ratios, the rising
prices in the Tier 1 and 2 cities have made housing less affordable for the
lower income worker, resulting in pent-up demand in the lower end
segment. In Beijing where a new type of affordable housing product for self-use
with sale price 30% below surrounding properties was introduced in Oct 2013,
the first project of 2,000 units attracted 148,000 applicant households.
Figure 4: China Distribution of Wealth, 2009
4
NBS: Basic Conditions of Urban Households by Income Percentile (2012)
5
Savills China: Residential Chart Book 2013
China Residential
When will the party end? January 2014
_________________________________________________________________________________________
7
Is there oversupply?
The amount of new land supplied for residential property development hit
a record high of 138,200 hectares in 2013, up 25% from the previous year.
Looking at the amount of pipeline residential space nationwide, there
appears to be more than sufficient supply to accommodate housing
demand.
Simply by looking at the incremental supply from residential land under
construction and social welfare supply for the next four years, the number is
already higher than our projections of incremental demand based on migration
and marriage needs (Table 2). We have not added in estimates of supply from
land held by developers and the possibility of some vacant units held by
multiple-home owners being put back into the market due to lack of transparent
information. These would make the supply figures look even larger.
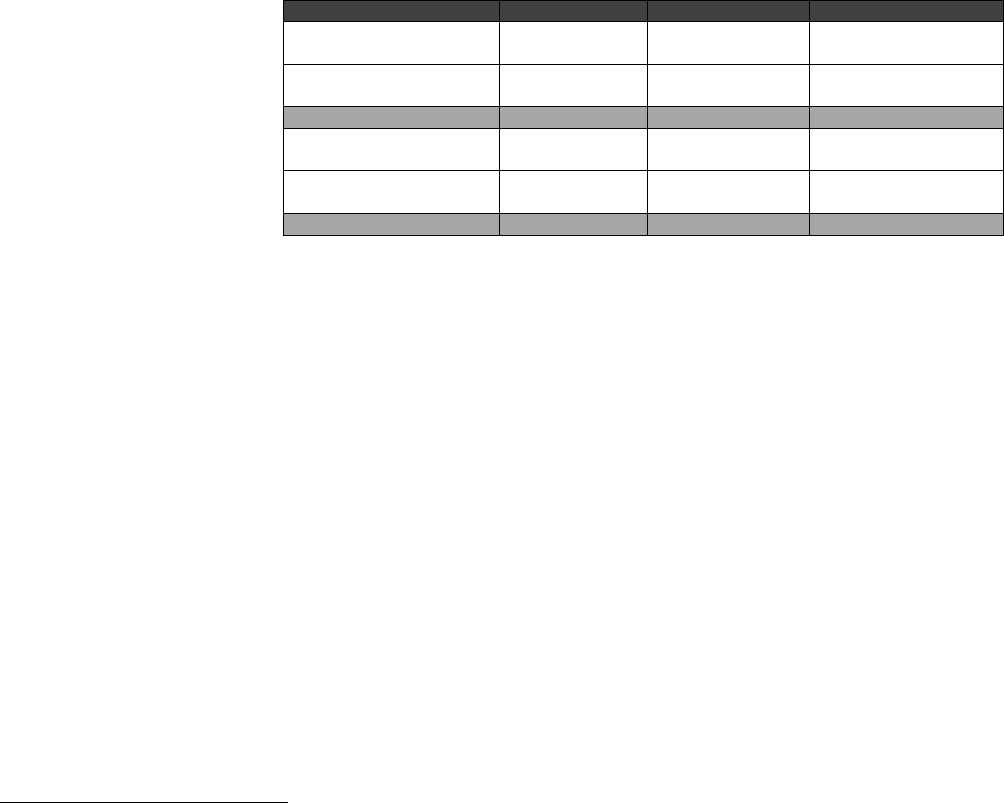
Table 2: China’s incremental residential supply and demand
GFA (sqm)
Units
No. of people
1
Under construction by
developers
4.863 billion
2
51 million
147 million
Planned social welfare
units (2014 -2017)
28 million
3
80 million
Supply
227 million
Migration (2014 to
2017)
4
72 million
Marriages (2014 to
2017)
5
104 million
Demand
176 million
Source: National Bureau of Statistics
1 Assumes urban building space per capita of 32.9sqm and average household size of 2.86
based on NBS Population Census 2010
2 Source: NBS 2013
3 36 million or 7.2 million p.a. social welfare housing units were planned under the 12
th
Five-Year
Plan (2011-2015). We assume a similar rate of 7 million to be built p.a. thereafter.
4 Migration 18 million p.a based on average of historical and future urbanisation growth rate
6
5 Marriages 13 million p.a.
7
based on 2013 actual (Source: NBS)
6
UNDP China and Institute for Urban and Environmental Studies, Chinese Academy of Social Sciences: China National Human
Development Report 2013
7
NBS

China Residential
When will the party end? January 2014
_________________________________________________________________________________________
8
However, we caution against jumping to the conclusion that there is an
oversupply because:
1) Supply is inflated
Some construction may stop due to weak developers’ financial
difficulties.
The land held by developers may not be built on anytime soon.
Old stock that will be demolished or abandoned is not accounted for
due to lack of data. Many old homes are self-built and of poor living
standards. In the bigger cities, many old buildings have to be
demolished to make way for new developments. Pre-reform welfare
housing transferred to individuals in 1998 accounted for over 40% of
residential stock in China
8
. Out of the 36 million social welfare housing
units to be built the 12
th
Five-Year Plan (2011-2015), 41% will be for
recently displaced individuals from demolished shanty towns rather
than development for new migrants
9
.
It is hard to define and measure vacant units. A wide range of
estimates have been reported but it is hard to verify their basis. Du
Meng, chairman of the China Enterprise Capital Alliance, claimed that
there were 68 million vacant houses but many think it is too high.
David Li, Professor of Freeman Chair in Economics, the School of
Economics and Management, Tsinghua University, has estimated 50
million. Yang Hongxu, an analyst at Shanghai E-House Real Estate
Research Institute, estimated that the nation's vacancy rate is around
5% out of the total house stock of 22 billion sqm, equivalent to about
11 million vacant houses.
We cannot assume that all vacant units can be put back into the
market as some will be genuinely kept as second homes in other cities
for self-use. In addition, there will always be some vacancy due to
time needed to find new tenants (although the rental market is small in
China) and to be fitted out for habitation as many units are delivered
bare.
2) Demand is under-estimated
Many homes comprise more than one household and more than one
generation. 11.67% of households in China comprised three- or more
generations
10
. As they become wealthier, these households can split
and occupy more than one unit. This is on top of what we have
accounted for in marriages.
8
Savills China: Residential Chart Book 2013
9
Ministry of Housing and Urban-Rural Development, Samsun Securities
10
NBS

China Residential
When will the party end? January 2014
_________________________________________________________________________________________
9
As the older stock of homes are small and of poor quality, there is
desire to upgrade if wealth permits. Although upgrading means letting
go of the original unit to someone else and therefore there is no net
increase in demand, in reality there is at least a few years of overlap if
one buys an uncompleted unit.
We cannot simply assume that each household requires only one unit
of accommodation with China being so big geographically. Although
we have assumed migrants would require additional accommodation
on top of what they have before migration, there are others who need
second homes in other cities for business, education, leisure and
other purposes.
There is a constant flow of new rich who will want to buy a second
property.
Foreigners working in China require housing too.
What is clear is that the oversupply situation is not evenly distributed. In
the developed Tier 1 cities, land is more scarce and old buildings
especially in the prime city centres are torn down to make way for new
developments. Table 3 below shows that Tier 3 and 4 cities have a higher rate
of increase in residential GFA being commenced, constructed and completed
between 2008-2012, resulting in a higher inventory digestion period.
The smaller cities bear the brunt due to the large supply of land sold by
local governments vis-à-vis take-up. Massive advance town planning which
over-forecasted demand, and local governments’ strategies of building
infrastructure and selling land for housing construction to achieve their GDP-
driven KPIs have resulted in excess supply in many cities. Oversupply exists
not only in the units that have been completed or are under construction; it also
lies in the massive landbank held by developers following the local governments’
aggressive selling in the past. To make matters worse, many smaller cities do
not enjoy high sustainable housing demand. As a result, a number of cities have
been labeled as “ghost towns” by the media given the low occupancy of the
newly completed homes.
However, not all “ghost towns” deserve the label. According to Citi
Research
11
, Ordos, Yingkou and Tangshan deserve the label given the
massive cumulative oversupply that has been built up, virtually no rental
market, resources-driven economies which have been hit by overcapacity,
wide income disparity which means many locals cannot afford to buy
these new homes, and declining or slow population growth.
11
Citi Research: China Property, Ghost Towns and Property Bubbles, December 2013
China Residential
When will the party end? January 2014
_________________________________________________________________________________________
10
Public perception of ghost towns usually comes from the impression of
low occupancy such as no lights at night or little activity in the town.
However there are some peculiarities in the China housing market that
takes a newly completed building a longer time to reach high occupancy.
The primary market is still dominant with bare-shell units and young couples
tend to buy first and move in upon marriage. The physical key handover can
come after 18 months or more from purchase day while often taking another
two years for decoration
12
. Hence in general, it can take 3-4 years for
homebuyers from buying to moving in. From Citi Research’s ground checks,
they noticed many projects can indeed record around 50% occupancy in around
two years’ time, and over 70% after 3-4 years.
Hence for the other “ghost towns”, Citi Research felt that they do not
deserve such labels as their oversupply is less, have more diversified
economic bases and higher proportion of transient population. Their
oversupply can be cleared, although it will be slow and take a number of
years.
Table 3: China Property – Key Statistics by City Tier
5-year CAGR (2008 – 2012)
Tier 1
Tier 2
Tier 3/4
National
Demographic and Economic
Population
3.4%
1.9%
0.1%
0.5%
Disposable income
9.2%
12.0%
11.5%
11.0%
Real GDP growth
10.3%
13.3%
11.7%
9.3%
GDP per capita
7.7%
11.8%
13.6%
11.7%
Property Market
Residential property sales
value
6.2%
15.4%
18.7%
16.1%
Average selling price
12.4%
10.7%
7.9%
8.8%
Residential GFA started
1.3%
10.1%
15.8%
13.1%
GFA starts/GFA sold
110.8%
119.6%
160.1%
132.0%
Residential GFA completed
-0.4%
11.9%
16.5%
13.4%
Residential GFA under
construction
6.2%
15.6%
22.6%
18.6%
Inventory digestion (months)
10.4
14.9
20.7
17.8
Land Market
Land sales value
0.9%
12.5%
23.2%
17.6%
Land price
16.9%
12.3%
7.5%
14.9%
Land sold in GFA/GFA sold
77.6%
135.2%
175.2%
151.0%
Source: CEIC, Soufun, Citi Research (November 2013)
12
Citi Research: China Property, Ghost Towns and Property Bubbles, December 2013

China Residential
When will the party end? January 2014
_________________________________________________________________________________________
11
Will demand slow down?
China’s housing market in the last two decades has been driven by various
factors – high GDP growth resulting in greater wealth, urbanisation which
created new demand in the cities and lack of investment alternatives which
have driven many to park their money in homes. It has been estimated that
about 15% - 20% own more than one housing unit in China.
While the long-term drivers of housing remain intact, going forward we
expect a slower rate of growth in housing demand given that the market
has come up from a low base in the last 20 years and as the government
rolls out more reforms:
1) Slowdown in economic growth: The economy has slowed down to
7.7% last year. With more reforms being implemented to restructure the
economy, there will continue to be some pain and impact on growth. Many
authorities have been reported to have lowered their GDP projections for 2014,
ahead of the central government’s announcement in March of its 2014 target.
Bloomberg consensus forecast
13
is a slower growth rate of 7.5% for 2014 and
7.2% for 2015.
2) Slowdown in urbanisation rate: It grew at an annual average of 1.37
percentage points between 2005 (43.0%) and 2012 (52.6%) with an annual
increase of about 21 million
14
in urban population. The urbanisation rate is
predicted to increase to 70% by 2030, at a slower annual average of 0.97
percentage point. Between 2010 and 2030, the urban population is expected to
rise by another 310 million, an annual average increase of 15.5 million
15
. Some
of the urbanisation may also not lead to a direct increase in housing demand, as
some areas may simply be re-designated from rural to urban, and people who
have already been living there already owned houses. Urbanisation does not
simply involve people from rural areas to the cities. China’s urbanisation is
focusing on the development of big city-clusters – each cluster with bigger cities
(like Tier-2 and Tier-3 cities) linking with smaller cities and towns (like Tier-4
cities and institutionalised towns) via modern infrastructure (including
transportation and information networks).
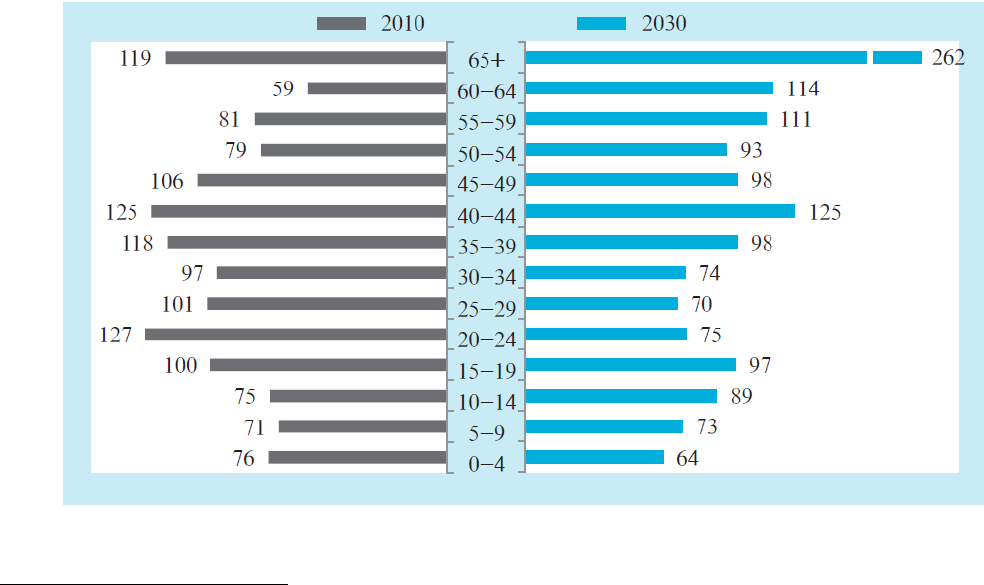
3) Slowdown in marriages: New demand from newly/soon-to-be married
couples could slow down as the population ages. The main homebuyers in
China tend to be in their late 20s, when couples are getting married. While in
the next five years we might expect this age range to grow, after that point there
is expected to be a protracted decline in new demand. The number of Chinese
in the marriageable ages of 20-34 years will fall from 325 million in 2010 to 219
million in 2030 (Fig 5). It will be another 20 years before the recent easing of the
one-child policy can boost the number of marriages. At the same time, lifestyle
is changing. Young people are marrying at an older age as more take up higher
education, and they prefer spending on entertainment and travel, or other
personal interests/projects.
13
Median of several economists’ forecast
14
UNDP China and Institute for Urban and Environmental Studies, Chinese Academy of Social Sciences: China National Human
Development Report 2013
15
Based on projection by UNDP for China’s population in 2026
China Residential
When will the party end? January 2014
_________________________________________________________________________________________
12
4) Increase in overseas and alternative investments: More Chinese
are expected to divert funds to purchase properties overseas as they become
more familiar with the external environment and as capital controls are gradually
relaxed under the government’s financial reforms. There could also be a loss of
capital in the physical real estate market if more alternative investments are
introduced.
5) Increase in government supplied affordable housing: The
government is addressing social inequality issues by supplying more affordable
housing which will have some effect on the lower end segment of the private
market eventually. In Beijing, 70,000 self-use units with prices capped at 30%
below market price are being put on the market (20,000 in 2013 and 50,000 in
2014) which is similar to the total number of units sold in Beijing in 11M2013
16
.
6) Increase in holding costs: There is currently little holding cost in
keeping a unit empty. Should holding costs increase significantly as a result of
property taxation or other taxes, investors will be more inclined to rent out units
or change investment class.
7) Government regulations: It has been reported that the government’s
anti-corruption campaign has caused officials to be more discreet in purchasing
multiple homes and some have been divesting. It is uncertain how long and
deep this campaign will last. A nationwide property database that has been
proposed will increase transparency in ownership and further deter multiple
home buyers.
Figure 5: Age structure of China in 2010 and 2030 (Unit: millions of people)
Source: UNDP China and Institute for Urban and Environmental Studies, Chinese Academy of Social Sciences
16
CBRE Marketview November 2013
China Residential
When will the party end? January 2014
_________________________________________________________________________________________
13
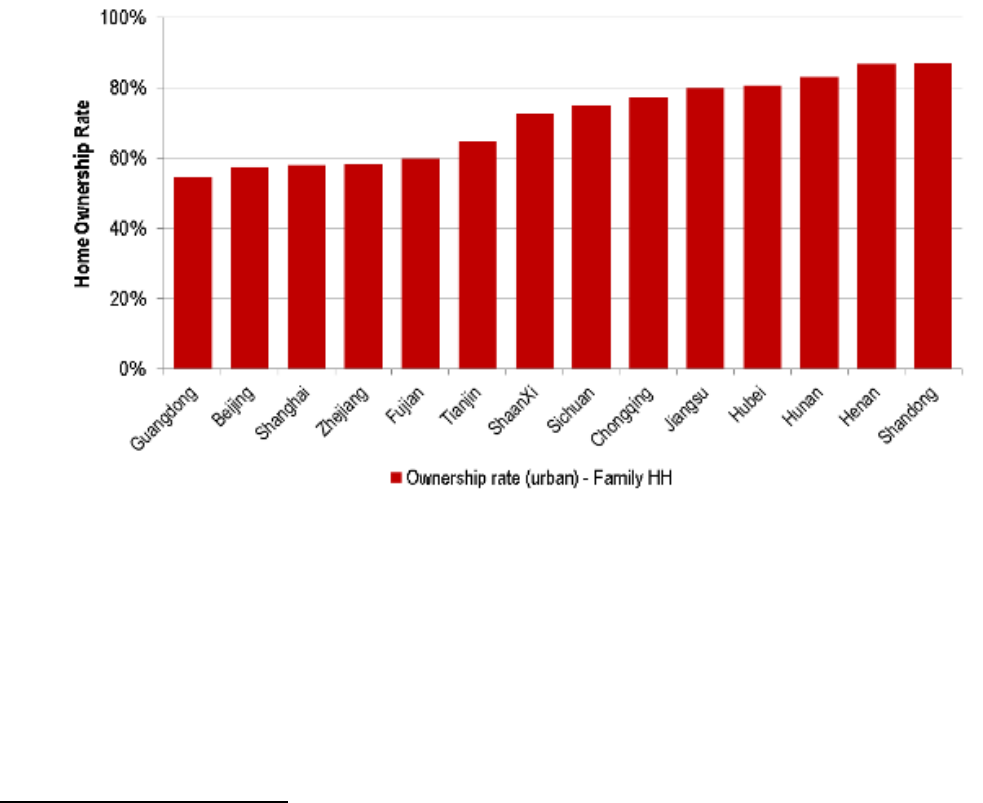
The demand is assessed to be higher in the Tier 1 cities where
homeownership rate is estimated to be below 60% given their higher
number of migrants (Fig 6). This is below the nationwide homeownership rate
of 85%
17
, as close to 50% of the households surveyed lived in the rural area,
whose close-to-100% home ownership (95% of which are self-built housing)
skewed the overall number significantly
18
.
Figure 6: Home Ownership Rate (Urban), Select Provinces, 2010
Source: NBS 2010 Population Census, JLL
17
Based on National Bureau of Statistics, Census Population 2010. Peking University's Institute of Social Sciences survey in mid-2013
showed that 87.4% of Chinese families either fully or partially own their homes. In another survey by PBOC, China Household Finance
Survey, the national homeownership rate was found to be 89.68%; cities have a lower rate of 85.39%. In a December 2013 report by Citi
Research, it estimated homeownership rate to be around 65% after adjusting for multiple home ownership as it believed that the national
statistics were based on the number of homes that are owned rather than number of households which owned homes. Milken Institute, a
non-profit, non-partisan think tank based in the US, also noted the same view on the definition. However, we have not been able to verify it
from the NBS website.
18
Jones Lang LaSalle
China Residential
When will the party end? January 2014
_________________________________________________________________________________________
14
Impact of tightening credit
China experienced two credit crunches last year, a strong sign that the
central bank is keen to wean banks off cheap credit. JP Morgan
19
calls it
credit tapering, and not tightening. Credit growth still outpaced nominal GDP
growth as the government does not want to trigger a forced deleveraging. Credit
slowing is accompanied by an effort to shift credit components – credit that
supports real activity (medium and long term loans) continues to grow at a
stable pace, but parts of shadow banking activities more likely to be involved in
speculative financial activities are contained. The aim is to mitigate the negative
impact on the real economy. The continued credit tapering has nevertheless
caused liquidity tightening – interbank rates and long-term bond yields have
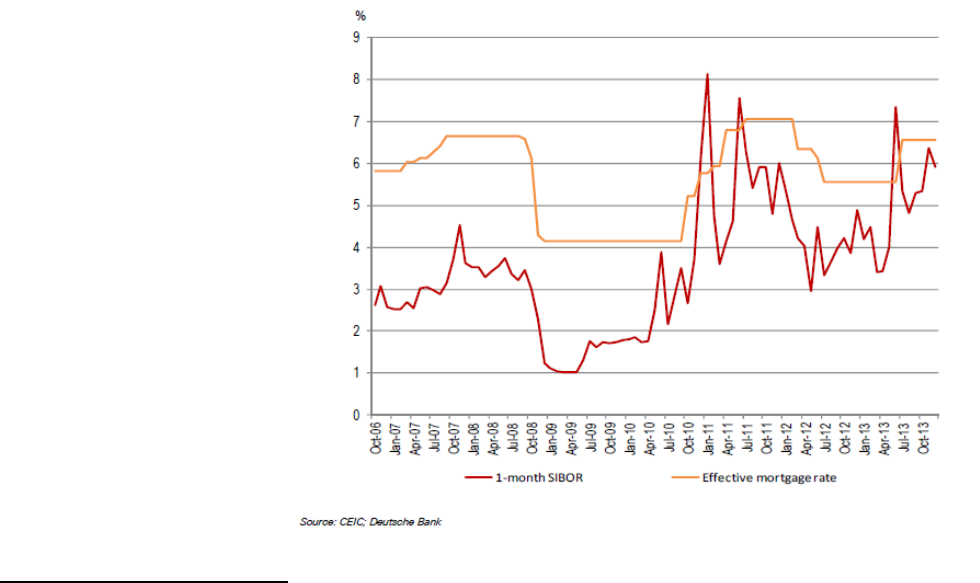
risen. Interest rates on home mortgages have increased by over two
percentage points from 2009 to 2013 (Fig 7).
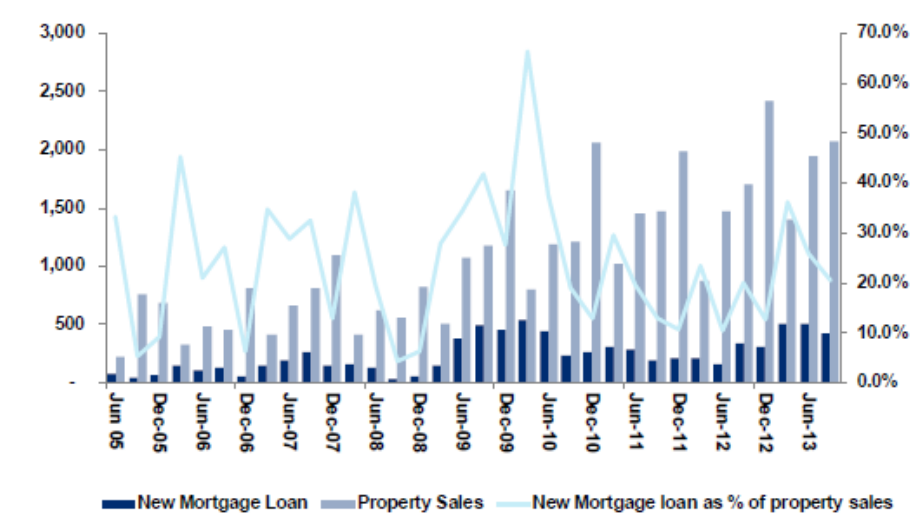
However, mortgage rate adjustments in China have less of an impact on
the housing market than restricting credit availability and prohibiting
purchases. The property market has very low levels of leverage (Fig 8); down-
payment rates are high for second properties and no mortgage is allowed for
third properties. Many buyers pay in cash or do not leverage the full amount,
especially in the smaller cities. In the larger cities where prices are higher and
there is a greater need to borrow, it is the credit availability rather than
mortgage rates that is hindering purchases. In addition to banks, employees
can apply for loans from Housing Provident Funds (HPF) at significantly lower
rates and better terms.
Figure 7: 1-month SIBOR
20
versus effective mortgage rate in China
19
JP Morgan, Ten Questions about China, December 2013
20
SIBOR refers to Shanghai Interbank Offered Rate
China Residential
When will the party end? January 2014
_________________________________________________________________________________________
15
Figure 8: China new mortgage loans versus transaction value
Source: CEIC, Citi Research
Due to the extent of informal or shadow banking for which no reliable
statistics are available, another concern is the impact on the property
market and banking sector should some developers become insolvent.
We think the impact will be limited and not spread nationwide. China has
accumulated a large cushion against the possibility of a housing crash. The
government debt level, although rising in recent years, is still fairly low at
approximately 40% of GDP compared with 92% in the United States, 80% in
Germany and 220% in Japan. Furthermore, China has $3 trillion in foreign
exchange reserves, and the People’s Bank of China holds nearly $700 billion in
required reserves. Chinese banks depend on deposits as a major source of
funding. Consequently, they are less vulnerable to a liquidity crunch than U.S.
banks, which are more reliant on short-term borrowed funds.
Demand and supply conditions in each city and segment are still the main
drivers.

China Residential
When will the party end? January 2014
_________________________________________________________________________________________
16
Implications of government policies
The new government’s speech in the Third Plenum last year underscored
that its policy is for stabilization in the property market, given the
significant contribution of the sector to the economy and the impact to
domestic consumption (which the government is encouraging as an
engine of growth) if asset wealth is eroded. In the past five years, the real
estate sector’s direct and indirect contribution to China’s total GDP is estimated
to be about 20-25%
21
.
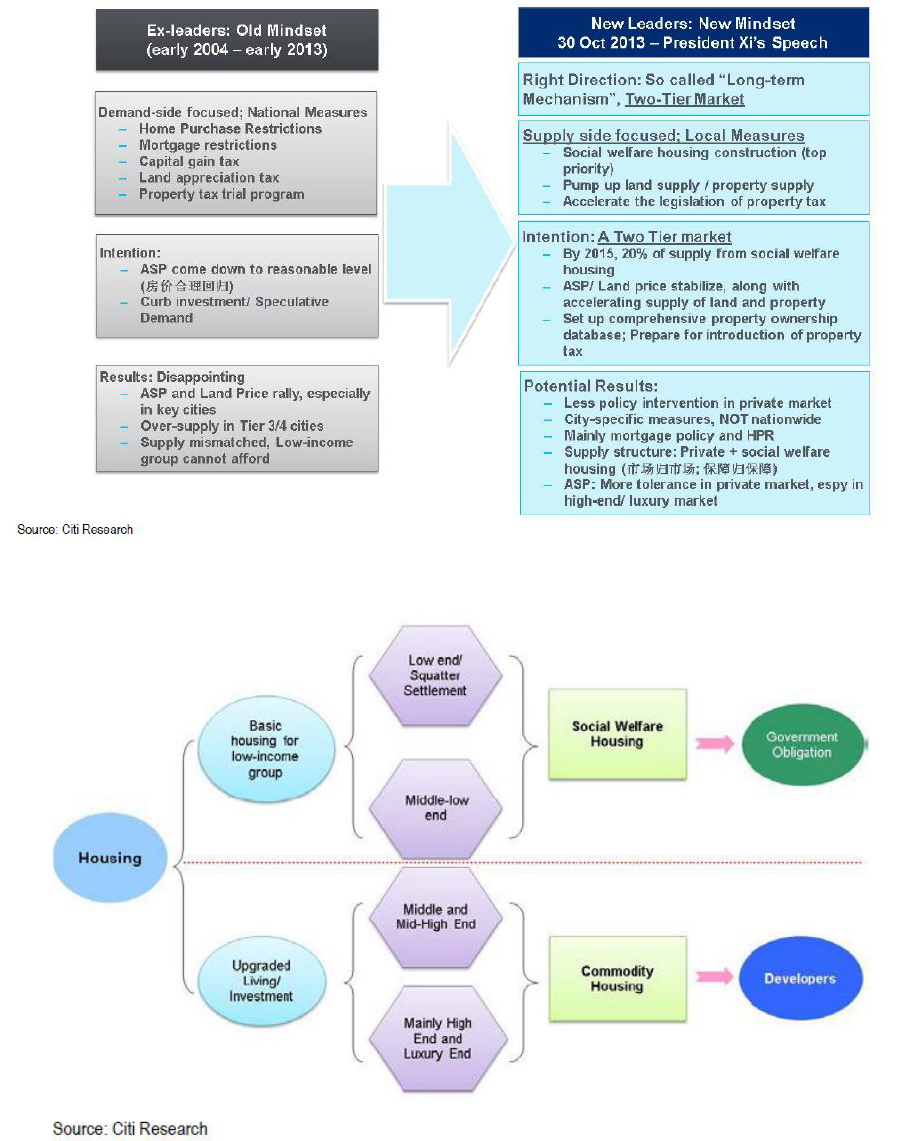
Instead of focusing on curbing demand and price increase, it has shifted
focus to increasing the supply of land and social welfare housing to 20%
by 2015 (Figs 9 & 10). This may imply more tolerance for the upper-end
segment in future but for now, existing policies such as the Home
Purchase Restriction (HPR) are likely to continue. China's housing minister
said in December that the government would maintain controls on the property
market in 2014 while increasing land and housing supply in cities facing big
home-price increases. At least 17 major cities have introduced further cooling
measures in the last quarter of 2013, mainly focusing on further tightening HPR
for non-locals, raising down-payment ratio for second-home buyers and
increasing land supply in the coming year
22
.
For the lower mid-end private segment, there will be competition from the
new self-use commodity housing that will be priced 30% below market
price. There could be more land supply constraint in the higher end
segment in future as more land will be used for social welfare housing.
This would squeeze profit margins with purchase restrictions still in place
or tightened.
Property tax trials may be extended into several new cities and a
nationwide property registry database is proposed to be set up. With the
registry, the government can grasp and understand better the current
state of the market and adopt more effective measures if necessary. This
may lead to multiple homeowners reducing their property holdings if the
tax rates are high enough to make it painful to keep vacant units, or if they
do not wish to show up too often in the registry database. Progress is
however uncertain given strong objections.
21
Citi Research: China Property, Ghost Towns and Property Bubbles, December 2013. Direct contribution 8-10% and indirect contribution
is 13-18%.
22
CBRE China Residential Monthly Index November 2013
China Residential
When will the party end? January 2014
_________________________________________________________________________________________
17
Figure 9: Property Policy – New Leaders, New Mindset
Figure 10: “Two-Tier”Market – Private + Social Welfare Housing
China Residential
When will the party end? January 2014
_________________________________________________________________________________________
18
Outlook
We do not expect a national or devastating bubble burst in the China property
market although some smaller markets may correct due to oversupply and
weak demand. Among 70 large and medium-sized cities tracked by the National
Bureau of Statistics, Wenzhou registered a fall in prices last year.
The pace of price increase in Tier 1 and 2 cities is forecast to moderate from the
2013 levels, given the slower economic growth, high price levels, and curbs on
property purchase. The strong land sales in 2013 and increased supply of
affordable housing could also translate into a surge in home supply this year
and slow down home price gains.
For the Tier 3 and 4 cities with oversupply, some could see a fall in prices with
weak demand. However, prices could generally remain flattish as developers
hold back on construction and sale. Those at the eastern coast will fare better
than inland cities as they have stronger economic drivers to draw migrants from
the western and central regions. The relaxation of hukou registration for
migrants as announced in the Third Plenum, which will start with smaller cities,
will help to draw more migrants to the coastal Tier 3 and 4 cities. Coupled with
less housing purchase curbs than in the Tier 1 and 2 cities, the non-local
population can bring significant incremental demand for housing and help to
resolve the oversupply gradually.
A major risk for the entire Chinese housing market is a significant slowdown in
the economy as a result of drastic reforms or another global crisis. This could
lead to a loss of confidence in the property market. However, the Chinese
government had stepped in with a major stimulus in the aftermath of the global
financial crisis and a mini one in 2013 when economic growth waned. History is
likely to repeat itself.
As the housing market in China is a diverse mix and China is coming to a new
era of slower growth momentum, investors/developers would have to consider
each city’s economic growth drivers, and housing demand and supply situation.

China Residential
When will the party end? January 2014
_________________________________________________________________________________________
19
Alpha
Investment
Partners
Alpha Investment Partners (AIP) is a real estate investment
advisory firm managed by a team of established
professionals with proven fiduciary experience.
We aim to achieve superior performance by capitalizing on
our uniqueness and pertinent insights into the region’s
property markets, offering investors the competitive
advantage akin to a local player.
Disclaimer:
This report is published solely for informational purposes. No representation or warranty, either express or implied, is
provided in relation to the accuracy, completeness or reliability of the information contained herein, nor is it intended to be a
complete statement or summary of the securities, markets or developments referred to in the report. The report should not
be regarded by recipients as a substitute for the exercise of their own judgement. Any opinions expressed in this report are
subject to change without notice and may differ or be contrary to opinions expressed by other business areas as a result of
using different assumptions and criteria. Alpha Investment Partners Limited (“AIP”) is under no obligation to update or keep
current the information contained herein.
www.alphaipartners.com
