

CBO
A
S T U D Y
The Economics of Climate Change:
A Primer
April 2003
The Congress of the United States
# Congressional Budget Office

Note
Cover photo courtesy of the National Aeronautics and Space Administration.

Preface
A scientific consensus is emerging that rising atmospheric concentrations of greenhouse
gases are gradually changing the Earth’s climate, although the magnitude, timing, and effects
of the alteration remain very uncertain. The prospect of longterm climate change raises a variety
of domestic and international economic policy issues on which there is little accord. Considerable
disagreement exists about whether to control greenhouse gas emissions, and if so, how and by
how much; and whether to coordinate climaterelated polices at the international level, and if
so, through what mechanisms.
This Congressional Budget Office (CBO) study—prepared at the request of the Ranking Member
of the House Committee on Science—presents an overview of issues related to climate change,
focusing primarily on its economic aspects. The study draws from numerous published sources
to summarize the current state of climate science and provide a conceptual framework for
addressing climate change as an economic problem. It also examines public policy options and
discusses the potential complications and benefits of international coordination. In keeping with
CBO’s mandate to provide impartial analysis, the study makes no recommendations.
Robert Shackleton of CBO’s Macroeconomic Analysis Division wrote the study. CBO staff
members Robert Dennis, Terry Dinan, Douglas Hamilton, Roger Hitchner, Arlene Holen, Kim
Kowalewski, Mark Lasky, Deborah Lucas, David Moore, John Sturrock, Natalie Tawil, and
Thomas Woodward provided valuable comments and assistance, as did Henry Jacoby of the
Massachusetts Institute of Technology and Thomas Schelling of the University of Maryland at
College Park. The comments of Chris Webster and John Reilly of the Massachusetts Institute
of Technology and Mort Webster of the University of North Carolina at Chapel Hill were
particularly helpful in developing the discussion of uncertainty.
Leah Mazade edited the study, and Christine Bogusz proofread it. Kathryn Winstead prepared
the study for publication, and Annette Kalicki produced the electronic versions for CBO’s Web
site.
Douglas HoltzEakin
Director
April 2003
This study and other CBO publications
are available at CBO's Web site:
www.cbo.gov

1
2
3
4
CONTENTS
Summary and Introduction 1
Common Resources: Addressing a Market Failure 1
Balancing Competing Uses 2
Policy Options 3
International Coordination 3
The Scientific and Historical Context 5
The Greenhouse Effect, the Carbon Cycle,
and the Global Climate 5
Historical Emissions and Climate Change 9
What the Future May Hold 15
Potential Responses 19
Types of Uncertainty 20
The Economics of Climate Change 23
Common Resources and Property Rights 23
Economic TradeOffs 25
Distributional Issues 33
Trade-Offs Among Policy Options 35
Taxes and Permits: Similarities and Differences 36
The Distributional Effects of Regulation 37
Alternative Uses of Revenues 39
Regulation and Innovation 41
Ancillary Benefits of Greenhouse Gas Restrictions 42
vi THE ECONOMICS OF CLIMATE CHANGE: A PRIMER
5
International Coordination of Climate Policy 43
International Policy Considerations 43
International Institutions to Address Climate Change 46
Actions by the United States 49
Alternative Approaches 49
Appendix
Economic Models and Climate Policy 53
References 57
CONTENTS vii
Figures
1. The Atmospheric Energy Budget and the Greenhouse Effect 6
2. Carbon Dioxide and Temperature 8
3. The Carbon Cycle 10
4. Uncertainty in Projections of Regional Population
and Economic Growth 13
5. Uncertainty in Projections of Regional Carbon Dioxide
Emissions and Emissions Intensity 14
6. Range of Uncertainty in Economic and Carbon Dioxide
Emissions Projections 16
7. Historical and Projected Climate Change 17
Boxes
1. Discounting and the Distant Future 28
2. An Example of Integrated Assessment 30


1
Summary and Introduction
Human activities—mainly deforestation and the
burning of fossil fuels—are releasing large quantities of
what are commonly known as greenhouse gases. The
accumulation of those gases is changing the composition
of the atmosphere and is probably contributing to a grad
ual warming of the Earth’s climate—the characteristic
weather conditions that prevail in various regions of the
world. Scientists generally agree that continued population
growth and economic development over the next century
will result in substantially more greenhouse gas emissions
and further warming unless measures are taken to con
strain those emissions.
Despite the general consensus that some amount of warm
ing is highly likely, extensive scientific and economic un
certainty makes predicting and evaluating its effects ex
tremely difficult. Because climate is generally a regional
phenomenon, the effects of warming would vary by re
gion. Moreover, some effects could be positive and some
negative. Some could be relatively minor and some severe
in their impact: warming could raise sea levels; expand
the potential range of tropical diseases; disrupt agriculture,
forestry, and natural ecosystems; and increase the vari
ability and extremes of regional weather. There is also
some possibility of unexpected, abrupt shifts in climate.
Actual outcomes will probably be somewhere in the mid
dle of the range of possibilities, but the longer that
emissions grow unchecked, the larger the effects are likely
to be.
A variety of technological options are available to restrain
the growth of emissions, including improvements in the
efficiency of people’s use of fossil energy, alternative energy
technologies such as nuclear or renewable power, methods
for removing greenhouse gases from smokestacks, and
approaches to sequestering gases in forests, soils, and
oceans. But those alternatives are likely to be costly, and
they are unlikely to be widely implemented unless mea
sures are taken to lower their price or to raise the price of
greenhouse gas emissions.
This Congressional Budget Office (CBO) study presents
an overview of the issue of climate change, focusing
primarily on its economic aspects. The study draws from
many published sources to summarize the current state
of climate science. It also provides a conceptual framework
for considering climate change as an economic problem,
examines public policies and the tradeoffs among them,
and discusses the potential complications and benefits of
international coordination.
Common Resources: Addressing
a Market Failure
The Earth’s atmosphere is a global, openaccess resource
that no one owns, that everyone depends on, and that
absorbs emissions from an enormous variety of natural
and human activities. As such, it is vulnerable to overuse,
and the climate is vulnerable to degradation—a problem
known as the tragedy of the commons. The atmosphere’s
global nature makes it very difficult for communities and
nations to agree on and enforce individual rights to and
responsibilities for its use.
With rights and responsibilities difficult to delineate and
agreements a challenge to reach, markets may not develop
to allocate atmospheric resources effectively. It may there
fore fall to governments to develop alternative policies for
CHAPTER
2 THE ECONOMICS OF CLIMATE CHANGE: A PRIMER
addressing the risks from climate change. And because
the causes and consequences of such change are global,
effective policies will probably require extensive coopera
tion among countries with very different circumstances
and interests.
However, governments may also fail to allocate resources
effectively, and international cooperation will be extremely
hard to achieve as well. Developed countries, which are
responsible for the overwhelming bulk of emissions, will
be reluctant to take on increasingly expensive unilateral
commitments while there are inexpensive opportunities
to constrain emissions in developing countries. But devel
oping nations, which are expected to be the chief source
of emissions growth in the future, will also be reluctant
to adopt policies that constrain emissions and thereby
limit their potential for economic growth—particularly
when they have contributed so little to the historical rise
in atmospheric greenhouse gas concentrations and may
suffer disproportionately more of the negative effects if
nothing is done.
Balancing Competing Uses
The atmosphere and climate are part of the stock of
natural resources available to people to satisfy their needs
and wants over time. From an economic point of view,
climate policy involves measuring and comparing the
values that people place on resources, across alternative
uses and at different points in time, and applying the
results to choose a course of action. An effective policy
would balance the benefits and costs of using the atmos
phere and distribute those benefits and costs among people
in an acceptable way.
Uncertainty about the scientific aspects of climate change
and about its potential effects complicates the challenge
of developing policy by making it difficult to estimate or
balance the costs of restricting greenhouse gas emissions
and the benefits of averting climate change. (Some of the
risks involved, moreover, may be effectively impossible
to evaluate or balance in pecuniary terms.) Nevertheless,
assessments of the potential costs and benefits of a warm
ing climate typically conclude that the continued growth
of emissions could ultimately cause extensive physical and
economic damage. Many studies indicate significant bene
fits from undertaking research to better understand the
processes and economic effects of climate change and to
discover and develop new and better technologies to re
duce or eliminate greenhouse gas emissions.
At the same time, such studies typically find relatively
small net benefits from acting to reduce greenhouse gas
emissions in the near term. In balancing alternative invest
ments, they conclude that if modest restrictions on emis
sions were implemented today, they would yield net bene
fits in the future; however, moreextensive restrictions
would crowd out other types of investment, reducing the
rate of economic growth and affecting current and future
generations’ material prosperity even more than the
averted change would. As income and wealth grow and
technology improves, the studies say, future generations
are likely to find it easier to adapt to the effects of a chang
ing climate and to gradually impose increasingly strict
restraints on emissions to avoid further alteration.
Those conclusions greatly depend, among other things,
on how one balances the welfare of current generations
against that of future generations. In assessments of costs
and benefits occurring at different points in time, that
process of weighting is typically achieved by using an
interest, or discount, rate to convert future values to pres
ent ones. But there is little agreement about how to dis
count costs and benefits over the long time horizons
involved in analyzing climate change.
Whatever weighting scheme is chosen, consistency calls
for applying it to all longterm investment alternatives.
For example, applying a lower discount rate to give more
weight to the welfare of future generations implies that
society should reduce its current consumption and increase
its overall rate of investment in productive physical and
human capital of all kinds—not only those involved in
ensuring a beneficial future climate.
Government polici es that deal w ith us e of the atm osphere
inevitably affect the distribution of resources. Inaction
benefits people who are alive today while potentially harm
ing future generations. Reducing emissions now may
benefit future generations while imposing costs on the
current population and may benefit countries at relatively
higher risk of adverse effects from warming while hurting
those that stand to gain from it. Restraints on emissions
would impose costs on nearly everyone in the global
CHAPTER ONE SUMMARY AND INTRODUCTION 3
economy, but they would affect energyproducing and
energyintensive industries, regions, and countries much
more than they would others. However, many studies of
the costs and benefits of climate change fail to highlight
the extent to which differences in geographic and eco
nomic circumstances complicate the balancing of interests.
Policy Options
Governments may respond to climate change by adopting
a “waitandsee” approach, by pursuing research programs
to improve scientific knowledge and develop technological
options, by regulating greenhouse gas emissions, or by
engaging in a combination of research and regulation. The
United States has invested in research and subsidized the
development of carbonremoval and alternative energy
technologies. Furthermore, some programs that were in
tended to achieve other goals, such as pollution reduction,
energy independence, and the limitation of soil erosion,
also discourage emissions or encourage the removal of
greenhouse gases from the atmosphere. However, other
programs have opposing effects.
Should a government decide to control emissions, it may
choose from a broad menu of regulatory approaches. One
option is direct controls, which set emissions standards
for equipment and processes, require households and busi
nesses to use specific types of equipment, or prohibit them
from using others. A government could also adopt more
indirect, incentivebased approaches, either singly or in
combination—for example, by restricting overall quanti
ties of emissions through a system of permits or by raising
the price of emissions through fees or taxes. Incentive
based approaches are generally more costeffective than
direct controls as a means of regulating greenhouse gas
emissions.
Uncertainty about the costs and benefits of regulation
affects the relative advantages of different incentivebased
approaches. Some research indicates that such uncertainty
gives a system of emissions pricing economic advantages
over a quota system that fixes the quantity of emissions.
Those advantages stem from two facts: both the costs and
benefits of reducing greenhouse gas emissions are uncer
tain; and the incremental costs—the additional costs of
reducing an additional ton of emissions—can be expected
to rise much faster than the incremental benefits fall.
Under those circumstances, the cost of guessing wrong
about the appropriate level of taxes—and, perhaps, of fail
ing to reduce emissions enough in any given year—is likely
to be fairly low. But the cost of miscalculating the appro
priate level of emissions—and perhaps imposing an overly
restrictive and hence expensive limit—could be quite high.
A system of emissions pricing has several other advantages
over one of emissions quotas. Pricing could raise signifi
cant revenues that could be used to finance cuts in distor
tionary taxes—such as those on income—that discourage
work and investment. Moreover, emissions pricing more
effectively encourages the development of technologies
that reduce or eliminate emissions than direct controls
or strict limits on emissions do.
Restricting greenhouse gas emissions would tend to reduce
emissions of some conventional pollutants as well, yielding
a variety of ancillary benefits, such as improvements in
health from betterquality air and water. Those additional
benefits would partly offset the costs of greenhouse gas
regulations, particularly in developing countries that have
significant problems with local pollution.
The distributional effects of emissions regulations would
depend on the type and stringency of the regulations and
could be very large relative to how much the policy im
proved people’s wellbeing. Those potential effects might
spur the affected parties to engage in rentseeking—vying
for regulatory provisions that would provide them with
tax exemptions, access to permits, and so on. An emissions
pricing system (based either on taxes or on auctioned per
mits) would benefit different groups in different ways,
depending on how the government returned the receipts
to the economy. Certain ways of using the revenues could
offset some—but probably not all—of the costs of regula
tion. (For example, if the government issued permits free
of charge, even permit recipients who were heavily regu
lated could benefit from the regulation.)
International Coordination
Because the causes and consequences of climate change
are global in nature, effective policies to deal with it will
probably require extensive international coordination
among countries with very different circumstances and
interests. Coordination may involve formal treaties or
4 THE ECONOMICS OF CLIMATE CHANGE: A PRIMER
nonbinding agreements and could range from modest
commitments to engage in research to moreextensive
programs to restrict emissions, monitor compliance, and
enforce penalties.
Effective international agreements typically involve
straightforward commitments and distribute costs in a
way that is acceptable to participating countries. Binding
commitments with explicit penalties may be more likely
than nonbinding ones to ensure compliance, but nonbind
ing agreements may also significantly affect a nation’s ac
tions. Many factors will influence the effectiveness of inter
national cooperation, particularly the size and distribution
of the costs and benefits of mitigating climate change and
the strength of conflicting interests. Successful cooperation
would entail frequent interaction among national repre
sentatives and link discussion of climate issues with that
of related problems.
An international system of emissions controls could draw
on the same set of options that domestic regulation em
ploys—direct controls, emissions taxes or permits, or a
hybrid system—or it could allow each country to choose
its own independent system. Much of the international
debate in recent years has focused on strictly limiting
emissions through national quotas, with or without the
international trading of emissions rights. However, quan
titative limits are likely to prove more costly than ap
proaches that affect emissions indirectly by raising their
price. And because there are lowcost opportunities to
reduce emissions throughout the world and because fossil
fuels can be transported relatively easily, a system that
raised the price of emissions everywhere would probably
be more costeffective than one that applied only to a
limited set of countries.
International cooperation on the issue of climate change
has been developing since the Intergovernmental Panel
on Climate Change was created in 1988. And nearly all
nations, including the United States, are signatories to the
United Nations Framework Convention on Climate
Change, which commits them to undertake research and
prevent dangerous changes in the Earth’s climate. In 1997,
negotiators signed the Kyoto Protocol (a draft treaty) to
the convention, under which developed countries agreed
to limit emissions while developing countries remained
exempt from restrictions. However, subsequent negotia
tions collapsed in 2000 over details of implementation,
and the United States withdrew from the talks in 2001.
Ironically, that withdrawal made some of the positions
that the United States had advocated much more attractive
to the remaining parties and helped them reach agreement
on nearly all outstanding implementation issues. The
European Union and Japan ratified the protocol in mid
2002; it will go into force if Russia follows suit.
The protocol’s implementation would establish a complex
set of emissions rights for a limited set of developed coun
tries for the period 2008 through 2012. It would also put
into place institutions to oversee international financial
transfers amounting to several billion dollars per year for
the purchase of emissions allowances, mainly among the
developed countries. However, the protocol would limit
participating countries’ overall emissions by only a small
amount and would have essentially no effect on the growth
of emissions in the United States and in developing coun
tries.
Analysts have proposed a variety of alternatives to the pro
visions of the Kyoto Protocol to try to improve the poten
tial effectiveness of international cooperation and broaden
its appeal. Each alternative simultaneously addresses the
problems of limiting emissions and distributing the bur
den of regulation, which remain the crucial sources of dis
agreement. Each option reflects a distinct interpretation
of the available evidence about the net benefits of averting
climate change in different regions and for different gen
erations, as well as practical concerns about how climate
policy would affect the global economy.
Some analysts argue for a laissezfaire approach because
they believe that the amount of warming is likely to be
small and its effects largely benign, or that nearterm
action is unwarranted in the light of scientific uncertainty.
Other researchers have proposed systems of emissions taxes
or tradable emissions permits that would be auctioned at
fixed prices. In general, the permits would apply to devel
oped countries and exempt developing nations on the
grounds of equity. Still other analysts have proposed com
plex systems that are intended to impose roughly uniform
emissions prices throughout the world yet ensure that
developed countries bear most of the cost.

2
The Scientific and Historical Context
Scientists have gradually realized that a variety of
human activities are changing the composition of the at
mosphere and may significantly affect the global climate.
1
During the past decade, scientific research has greatly im
proved the state of knowledge about climate change, but
substantial uncertainty about critical aspects of climate
science remains and will persist in spite of continued prog
ress. That uncertainty contributes to differences of opinion
within the scientific community about the potential for
significant climate change and about its possible effects.
The Greenhouse Effect, the Carbon
Cycle, and the Global Climate
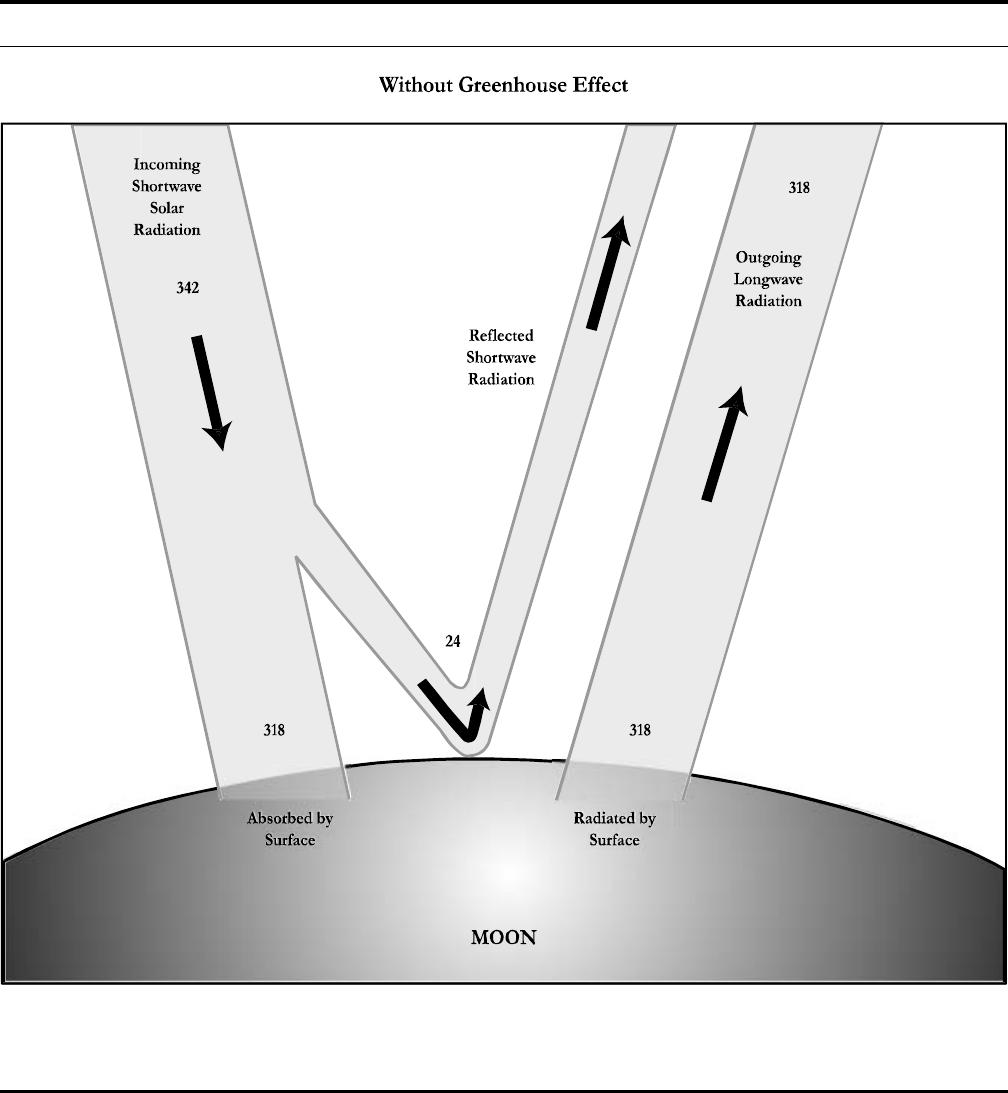
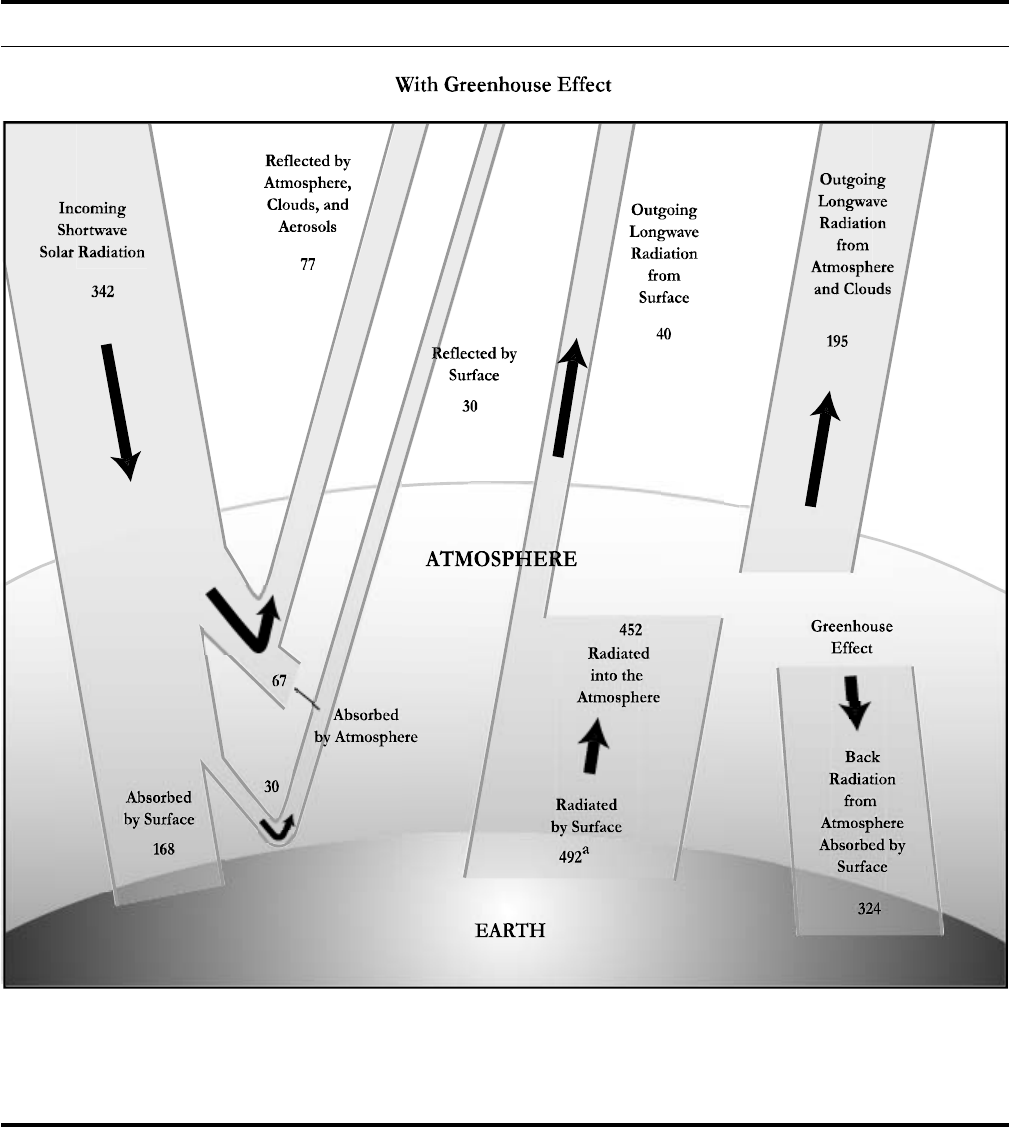
As the Earth absorbs shortwave radiation from the Sun
and sends it back into space as longwave radiation, natur
ally occurring gases in the atmosphere absorb some of the
outgoing energy and radiate it back toward the surface
(see Figure 1). That phenomenon, which is called the
“greenhouse” effect, currently warms the surface by an
average of about 60º Fahrenheit (F), or 33º Celsius (C),
creating the conditions for life as it exists on Earth. Water
vapor is by far the most abundant greenhouse gas and
accounts for most of the warming effect. However, several
other trace gases also play a pivotal role in maintaining
the current climate because they not only act as greenhouse
gases themselves but also enhance the amount of water
vapor in the atmosphere and thus amplify the effect. Those
trace gases include carbon dioxide, methane (which also
contains carbon), and nitrous oxide, as well as the man
made halocarbons, which contribute to the breakdown
of stratospheric ozone and which, molecule for molecule,
are very powerful greenhouse gases.
2
The geologic record reveals dramatic fluctuations in green
house gas concentrations and in the Earth’s climate, on
scales as long as millions of years and as short as just a few
years. The record suggests a complicated relationship
between greenhouse gas concentrations and the Earth’s
climate. Warmer climates have usually been associated
with higher atmospheric concentrations of greenhouse
gases and cooler climates with lower concentrations.
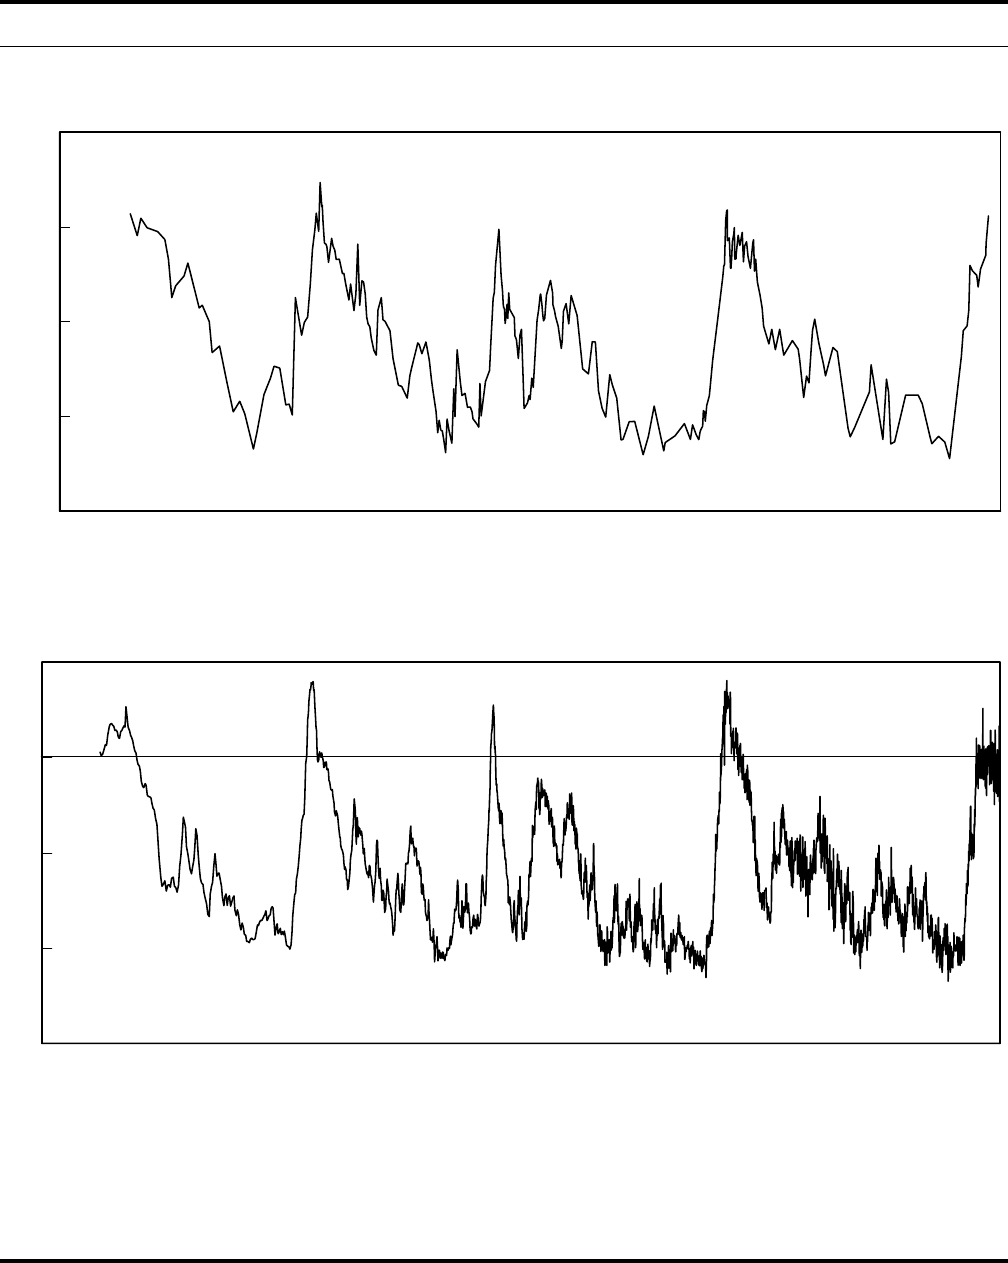
(Figure 2 illustrates how carbon dioxide concentrations
and the antarctic climate have varied together over roughly
the past halfmillion years.) However, the climate has oc
1. The discussion in this chapter is drawn mainly from a series of
reports prepared by the Intergovernmental Panel on Climate
Change, which summarize the current state of scientific and tech
nical knowledge in that area. The most recent set of reports, which
are cited in detail in the reference list beginning on page 57, are
Houghton and others (2001); McCarthy and others (2001); Metz
and others (2001); and Watson and others (2001). Other sources
are specifically noted. The Congressional Research Service (2001)
provides another summary. For a short history of scientific research
on climate change, see Weart (1997).
2. Greenhouse gases differ in their ability to trap energy; they interact
with each other, and they stay in the atmosphere for different and
varying lengths of time. By convention, scientists apply a standard
metric to the gases by comparing their 100year global warming
potentials, or GWPs (the amount of warming that an incremental
quantity of a given gas would cause over the course of a century),
with that of carbon dioxide. The convention is somewhat rough
because the GWP of each gas is affected by the quantity of other
gases, but it is used in international negotiations because of its sim
plicity. GWPs range from 1 for carbon dioxide to many thousands
for halocarbons. Using 100year GWPs, scientists convert quantities
of other greenhouse gases to metric tons of carbon equivalent, or
mtce.
CHAPTER
6 THE ECONOMICS OF CLIMATE CHANGE: A PRIMER
Figure 1.
The Atmospheric Energy Budget and the Greenhouse Effect
Source: Congressional Budget Office adapted from J.T. Houghton and others, eds., Climate Change 2001: The Scientific Basis (Cambridge, U.K.: Cambridge University
Press, 2001).
CHAPTER TWO THE SCIENTIFIC AND HISTORICAL CONTEXT 7
Figure 1.
Continued
Note: Numbers represent watts per meter squared (W/m
2
). With an atmosphere, 492 W/m
2
(instead of 318 W/m
2
) reach the Earth’s surface because the atmosphere
absorbs radiation from the Earth and radiates it back. That process constitutes the greenhouse effect.
a. Includes thermals and evapotranspiration.
8 THE ECONOMICS OF CLIMATE CHANGE: A PRIMER
160
200
240
280
320
-450 -400 -350 -300 -250 -200 -150 -100 -50 0
Thousands of Years Before the Present
-12
-8
-4
0
4
-450 -400 -350 -300 -250 -200 -150 -100 -50 0
Thousands of Years Before the Present
Atmospheric Carbon Dioxide
Carbon Dioxide Concentration (Parts per million)Carbon Dioxide Concentration (Parts per million)
Temperature Over Antarctica
a
Temperature Relative to Present Climate (°C)
Figure 2.
Carbon Dioxide and Temperature
Source: Congressional Budget Office based on J. M. Barnola, C. Lorius Raynaud, and N.I. Barkov, “Historical CO
2
Record from the Vostok Ice Core,” and J.R. Petit
and others, “Historical Isotopic Temperature Record from the Vostok Ice Core,” in Department of Energy, Oak Ridge National Laboratory, Carbon Dioxide
Information Analysis Center, Trends: A Compendium of Data on Global Change (2003), available at http://cdiac.esd.ornl.gov/trends/trends.htm.
a. Variations in antarctic temperatures are roughly double average global variations.

CHAPTER TWO THE SCIENTIFIC AND HISTORICAL CONTEXT 9
casionally been relatively warm while concentrations were
relatively low and cool while they were high. Moreover,
climate change has occurred without alterations in green
house gas concentrations. Nevertheless, significant changes
in concentrations appear to be nearly always accompanied
by changes in climate.
3
The link between greenhouse gases and climate is greatly
complicated by a variety of physical processes that obscure
the direction of cause and effect. Variations in the Sun’s
brightness and the Earth’s orbit affect the climate by
changing the amount of radiation that reaches the Earth.
Clouds, dust, sulfates, and other particles from natural
and industrial sources affect the way radiation filters in
and out of the atmosphere. Snow, ice, vegetation, and soils
control the amount of solar radiation that is directly re
flected from the Earth’s surface. And the Earth’s vast ocean
currents, themselves partly driven by solar radiation,
greatly influence climate dynamics. Moreover, the climate
system exhibits socalled threshold behavior: just as a
minor change in balance can flip a canoe, relatively small
changes sometimes can abruptly trigger a shift from one
stable global pattern to a noticeably different one (Alley
and others, 2003).
Fluctuations in those physical processes affect the complex
balance among the reservoirs of carbon dioxide and
methane in the atmosphere and the larger reservoirs of
carbon in the biosphere—which comprises soils, vegeta
tion, and creatures—and in the oceans. Large quantities
of carbon flow back and forth between those reservoirs,
regulated by the seasons, winds, and ocean currents.
4
The
flows maintain a rough equilibrium among the reservoirs,
which all gradually adjust to other influences—and to
influxes of carbon—over periods of decades to centuries.
Other greenhouse gases, such as nitrous oxide, are part
of similarly complex cycles.
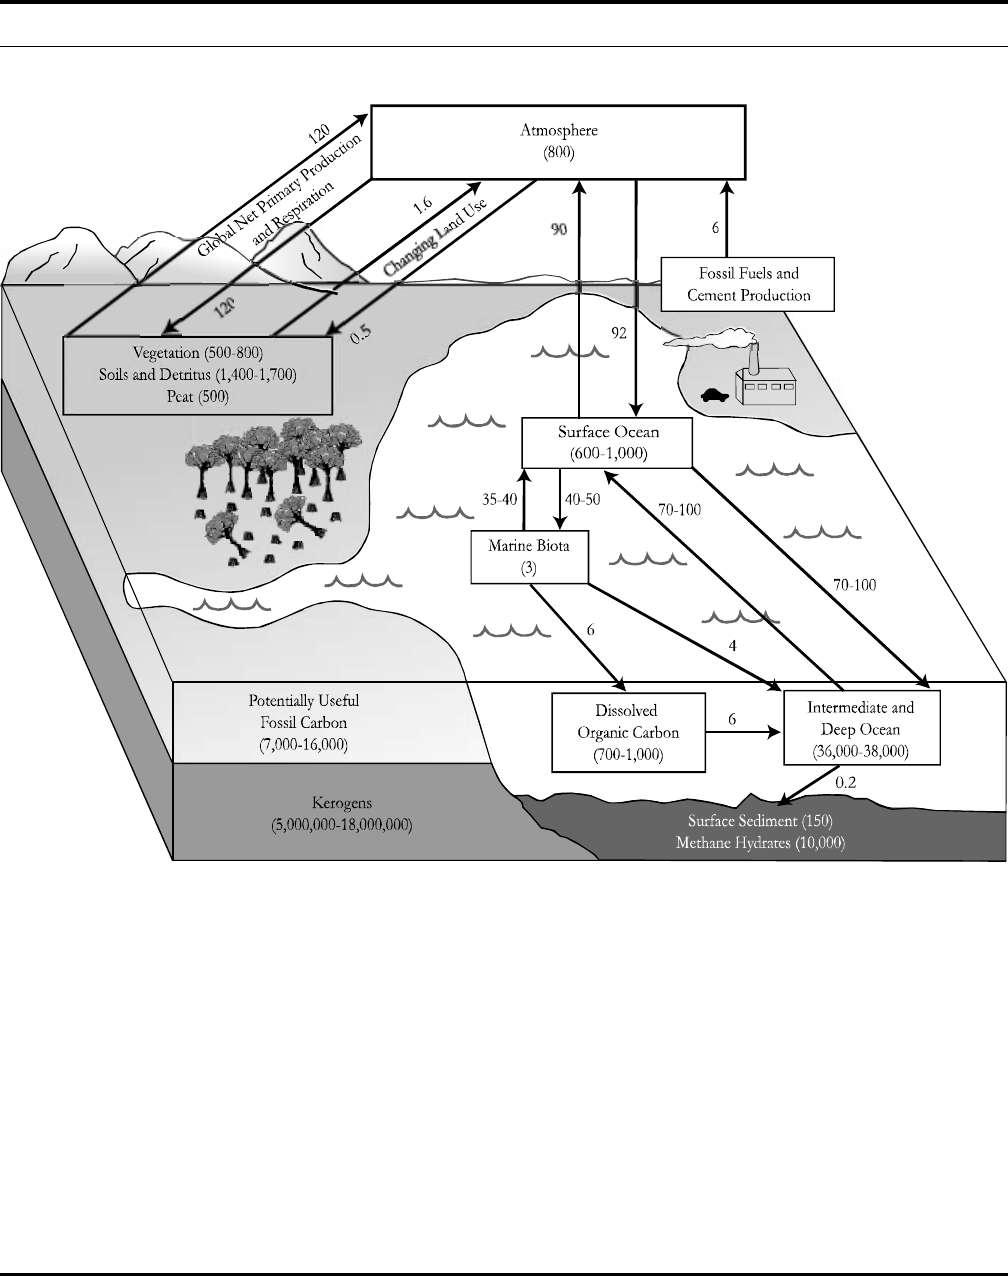
In the absence of human activity, other, even larger res
ervoirs of carbon adjust only over thousands to millions
of years. They include fossil deposits of coal, oil, and
natural gas, which hold 10 to 20 times as much carbon
as the atmosphere; deposits of methane hydrate in the
ocean floors, which contain perhaps 12 times as much
carbon; and rocks that contain much more carbon than
all of the surface reservoirs, or “sinks,” combined (see Fig
ure 3).
Over the past million and a half years, the Earth has ex
perienced a period of “ice ages”—hundredthousandyear
cycles of cooling and warming that are governed mainly
by variations in the Earth’s orbit around the Sun. That
period, which is unusual in geologic history, has been ac
companied by changes in greenhouse gas concentrations
that interact with and magnify the effects of the orbital
variations (Shackleton, 2000). Geologically speaking, the
most recent ice age just ended: less than 20,000 years ago,
large parts of North America and Eurasia were covered
by huge glaciers. Atmospheric concentrations of carbon
dioxide were only half of what they are today; average
global temperatures were roughly 7ºF to 9ºF (4ºC to 5ºC)
lower; and the global climate was apparently drier and
much more variable (Broecker and Hemming, 2001;
Crowley, 1996; and Ganopolski and Rahmstorf, 2001).
In addition, the trees and soils of the biosphere held per
haps onethird less carbon than they do now; tropical
forests were much less extensive; and sea level was hun
dreds of feet lower.
All of recorded human history, as well as the development
of agriculture, has occurred during a temporary interglacial
period that began about 12,000 years ago and that has
been warmer and unusually stable by comparison with
the preceding cold period. Even during that stable interval,
however, minor climatic changes have had substantial ef
fects on preindustrial economies throughout the world.
(For an extensive description of the effects of climate
change over history, see Lamb, 1995.)
Historical Emissions and
Climate Change
With the onset of the industrial revolution more than two
centuries ago, people have begun to change the carbon
cycle significantly, increasing the amount of carbon diox
ide in the atmosphere by about a third, or from roughly
3. See Falkowski and others (2000); Veizer, Godderis, and François
(2000); Crowley and Berner (2001); and Zachos and others (2001).
4. Quantities of carbon in gases and elsewhere are measured in metric
tons of carbon, or mtc. Mtc differs from mtce, which measures
warming potential rather than quantities of carbon.
10 THE ECONOMICS OF CLIMATE CHANGE: A PRIMER
Figure 3.
The Carbon Cycle
Source: Congressional Budget Office adapted from D. Schimel and others, "Radiative Forcing of Climate Change," Chapter 2 in J.T. Houghton and others, eds., Climate
Change 1995: The Science of Climate Change (Cambridge, U.K.: Cambridge University Press, 1996). The figure draws on data from Mustafa Babiker and
others, The MIT Emissions Prediction and Policy Analysis (EPPA) Model: Revisions, Sensitivities, and Comparisons of Results, Report no. 71 (Cambridge,
Mass.: Massachusetts Institute of Technology Joint Program on the Science and Policy of Global Change, 2001); Department of Energy, Energy Information
Administration, Annual Energy Review 2000, DOE/EIA-0384(2000) (November 2001); P. Falkowski and others, “The Global Carbon Cycle: A Test of Our
Knowledge of Earth as a System,” Science, vol. 290, no. 5490 (October 13, 2000), pp. 291-296; J.T. Houghton and others, eds., Climate Change 2001: The
Scientific Basis (Cambridge, U.K.: Cambridge University Press, 2001); R.A. Houghton and David L. Skole, “Carbon,” in B.L. Turner II and others, eds., The
Earth as Transformed by Human Action: Global and Regional Changes in the Biosphere over the Past 300 Years (Cambridge, U.K.: Cambridge University
Press, 1990), pp. 393-408; Keith A. Kvenvolden, “Potential Effects of Gas Hydrate on Human Welfare,” Proceedings of the National Academy of Sciences,
vol. 96 (March 1999), pp. 3420-3426; Bert Metz and others, eds., Climate Change 2001: Mitigation (Cambridge, U.K.: Cambridge University Press, 2001);
Edward D. Porter, Are We Running Out of Oil? Discussion Paper no. 81 (Washington, D.C.: American Petroleum Institute, December 1995); and World Energy
Council, Survey of Energy Resources, 19th ed. (London: World Energy Council, 2001), available at www.worldenergy.org/wec-geis/publications.
Note: Reservoirs of carbon are in billions of metric tons (shown in parentheses); flows of carbon (shown as arrows) are in billions of metric tons per year.

CHAPTER TWO THE SCIENTIFIC AND HISTORICAL CONTEXT 11
600 billion to 800 billion metric tons of carbon (mtc)—
the highest amount in at least 400,000 years.
5
About 30
percent of the increase has come from cutting timber and
clearing land for agriculture; the rest stems from extracting
coal, oil, and natural gas from the fossil reservoir and
burning them.
6
Atmospheric concentrations of methane
and nitrous oxide have also risen over the past two cen
turies—by about 150 percent and 16 percent, respectively
—as a result of various agricultural and industrial activi
ties. More recently, halocarbons have begun to accumulate
as well. The combined effect of these additions to the
atmosphere has been to enhance the greenhouse effect
slightly by raising the amount of radiation at the Earth’s
surface by about 0.5 percent—with perhaps half of that
impact offset by the effects of other human activities, such
as the cooling influence of sulfate emissions.
Current evidence indicates that since the mid19th cen
tury, the average surface temperature of the Earth has risen
by between 0.7ºF and 1.4ºF (0.4ºC and 0.8ºC). The
warming trend has been most pronounced during the past
decade and in higher latitudes. Ocean temperatures are
also rising, expanding the volume of water, and that ex
pansion, combined with water from melting glaciers, has
raised global sea level by about four to 10 inches (10 to
20 centimeters) over the past century.
Scientists generally agree that the observed warming is
roughly consistent with the expected effects of changing
concentrations of greenhouse gases and other emissions.
However, other phenomena also appear to be influencing
the Earth’s climate—for example, variations in the Sun’s
brightness and magnetic field, and poorly understood
fluctuations in the circulation of the oceans. As a result,
although scientists have dramatically improved their
understanding of the atmosphere, oceans, and climate in
recent years, they are uncertain about how much of the
observed warming is due to greenhouse gas emissions.
They are even more uncertain about whether the warming
that has occurred has caused moreextreme weather, such
as more and bigger hurricanes, floods, and droughts.
However, some evidence suggests that unusually warm
conditions may have contributed to persistent droughts
in North America, Europe, and Asia between 1998 and
2002 (Hoerling and Kumar, 2003).
Some researchers believe that if people immediately halted
emissions of greenhouse gases, gradual warming of the
oceans would ultimately contribute to an additional warm
ing of the atmosphere of between 0.9ºF and 2.7ºF, or
0.5ºC and 1.5ºC (Mahlman, 2001, p. 8). Over the follow
ing centuries, the climate would return nearly to its pre
industrial state, as the oceans gradually absorbed most of
the extra carbon dioxide from the atmosphere and other
greenhouse gases broke down.
However, as the world’s population grows and the global
economy continues to industrialize, the pace of emissions
—particularly of carbon dioxide—is accelerating. The
period since World War II has seen 80 percent of all car
bon dioxide ever emitted from the burning of fossil fuels
—and twothirds of the entire increase in atmospheric
concentrations (Marland, Boden, and Andres, 2002). Dur
ing the 1990s, annual global emissions of greenhouse gases
ran at about 10 billion metric tons of carbon equivalent
(mtce; see footnote 2), and carbon dioxide concentrations
grew by more than 4 percent. Fossil fuels accounted for
about 6 billion mtc per year; of that total, oil claimed a
share of 45 percent, natural gas, 20 percent; and coal, 35
percent.
7
Net deforestation contributed roughly 1 billion
to 2 billion mtc annually (Watson and others, 2000,
p. 32). About 2½ billion to 3 billion mtce per year of
other greenhouse gases, mostly methane, came from a wide
variety of sources, mainly agricultural activities but also
5. Atmospheric concentrations of carbon dioxide are usually measured
in parts per million (ppm). In those terms, atmospheric carbon
dioxide has increased from about 280 ppm to about 370 ppm.
6. Estimates of emissions and reabsorption of carbon from land use
are based on data for 1850 to 1990 from R.A. Houghton of the
Woods Hole Research Center and an extrapolation based on data
from Houghton and Skole (1990). Estimates of emissions from
fossil fuels are from Marland, Boden, and Andres (2002). Much
of the available data on greenhouse gas emissions, changes in
atmospheric concentrations, and changes in temperature is available
from the Carbon Dioxide Information Analysis Center at http://
cdiac.esd.ornl.gov/pns/pns_main.html. For a discussion of recent
research, see Schimel and others (2001).
7. Coal contains about 80 percent more carbon per unit of energy
than gas does, and oil contains about 40 percent more. For the
typical U.S. household, a metric ton of carbon equals about 10,000
miles of driving at 25 miles per gallon of gasoline or about one year
of home heating using a natural gasfired furnace or about four
months of electricity from coalfired generation.

12 THE ECONOMICS OF CLIMATE CHANGE: A PRIMER
fossil fuel production, diverse industrial processes, and
landfills.
The international distribution of emissions from fossil
fuels largely reflects the global pattern of economic devel
opment because fossil fuels have powered the dramatic
increase in industrial output and material wellbeing that
has taken place in many nations over the past two cen
turies. In the United States, for instance, fossil fuels pro
vided nearly 90 percent of all energy used in the 20th
century, and they account for about 85 percent of the
energy used today. Developed, industrialized countries—
the members of the Organisation for Economic Co
operation and Development (OECD) and of the former
Soviet bloc—are responsible for nearly 80 percent of
historical carbon emissions, even though they have only
about 20 percent of the world’s population. Historically
speaking, people in developed countries have emitted
roughly 10 times more carbon per person than people in
developing countries. Indeed, it is the technological access
to energy from fossil fuels that has helped make them
roughly 10 times wealthier.
Yet the relationship between the use of fossil energy and
economic prosperity is not a strict one. Countries that
have significant reserves of nonfossil energy, that rely on
imports for much of their fuel supply, or that tax the
consumption of fuel tend to have lower emissions levels.
Some highincome countries have emissions levels per
person that are quite low: for instance, Sweden maintains
roughly the same standard of living as the United States
does but emits only 30 percent as much carbon per person,
largely by relying extensively on hydroelectric and nuclear
power. In contrast, countries that have large reserves of
fossil fuels or that subsidize their population’s consump
ti on o f f ue l t end to ha ve h ig her p er capita em is sions levels.
Such nations include oilexporting countries and members
of the former Soviet bloc.
Nor is the relationship between economic growth and
emissions a smooth one. Developing countries in the ini
tial stages of industrialization tend to have fairly high levels
of emissions per dollar of output, because a large share
of their economic activity involves the energyintensive
manufacturing of metals, cement, and other basic com
modities. In contrast, developed countries devote an in
creasing share of their resources to the production of less
energy intensive outputs, including services. Economic
development therefore tends to involve rising energy in
tensity in its initial stages and falling energy intensity as
the efficiency of energy use and the service sector’s share
of economic activity grow (HoltzEakin and Selden,
1995). In the United States, for example, per capita emis
sions of carbon dioxide from fossil fuels grew nearly seven
fold between 1870 and 1920 but have grown by less than
onethird since then and are roughly the same now as they
were 30 years ago.
On a perperson basis, OECD countries currently burn
about 3 mtc of fossil fuels per year—three times the world
average—with national figures ranging from over 5½ mtc
per person for the United States to less than 1 mtc for
Mexico and Turkey.
8
The former Soviet bloc countries
had very high per capita emissions levels before their eco
nomic collapse but now average about 2 mtc per person—
the figures range from nearly 3 mtc for Russia to less than
a third of a ton for Armenia. Developing countries average
only ½ mtc per capita annually—or onesixth the OECD
average and only onetenth that of the United States. The
poorest 2 billion people—onethird of the world’s popu
lation—average less than a fifth of a ton annually, or the
equivalent of about 80 gallons of gasoline. (Figures 4 and
5 compare different regions’ populations, per capita eco
nomic activity, and per capita emissions, as well as ranges
of uncertainty about those factors’ future growth.)
Because of their greater reliance on subsistence farming
and forestry, developing countries currently account for
most of the world’s carbon dioxide and methane emissions
from land use. Even so, on a per capita basis, people in
developing countries are responsible for far fewer green
house gas emissions than are their counterparts in the in
dustrialized countries, and their total emissions levels are
lower as well.
8. The United States accounts for nearly as many emissions as the
former Soviet bloc, the Middle East, Central and South America,
and Africa combined. Use of fossil fuel in the United States is split
roughly into three categories: commercial and residential buildings
and appliances, industry, and transportation. More than a third
of that fuel is used to generate electricity, twothirds of which goes
to buildings and onethird to industry (see Department of Energy,
2002a). Other developed countries have somewhat different con
sumption patterns for fossil fuel, depending on their income levels,
climates, and other factors.
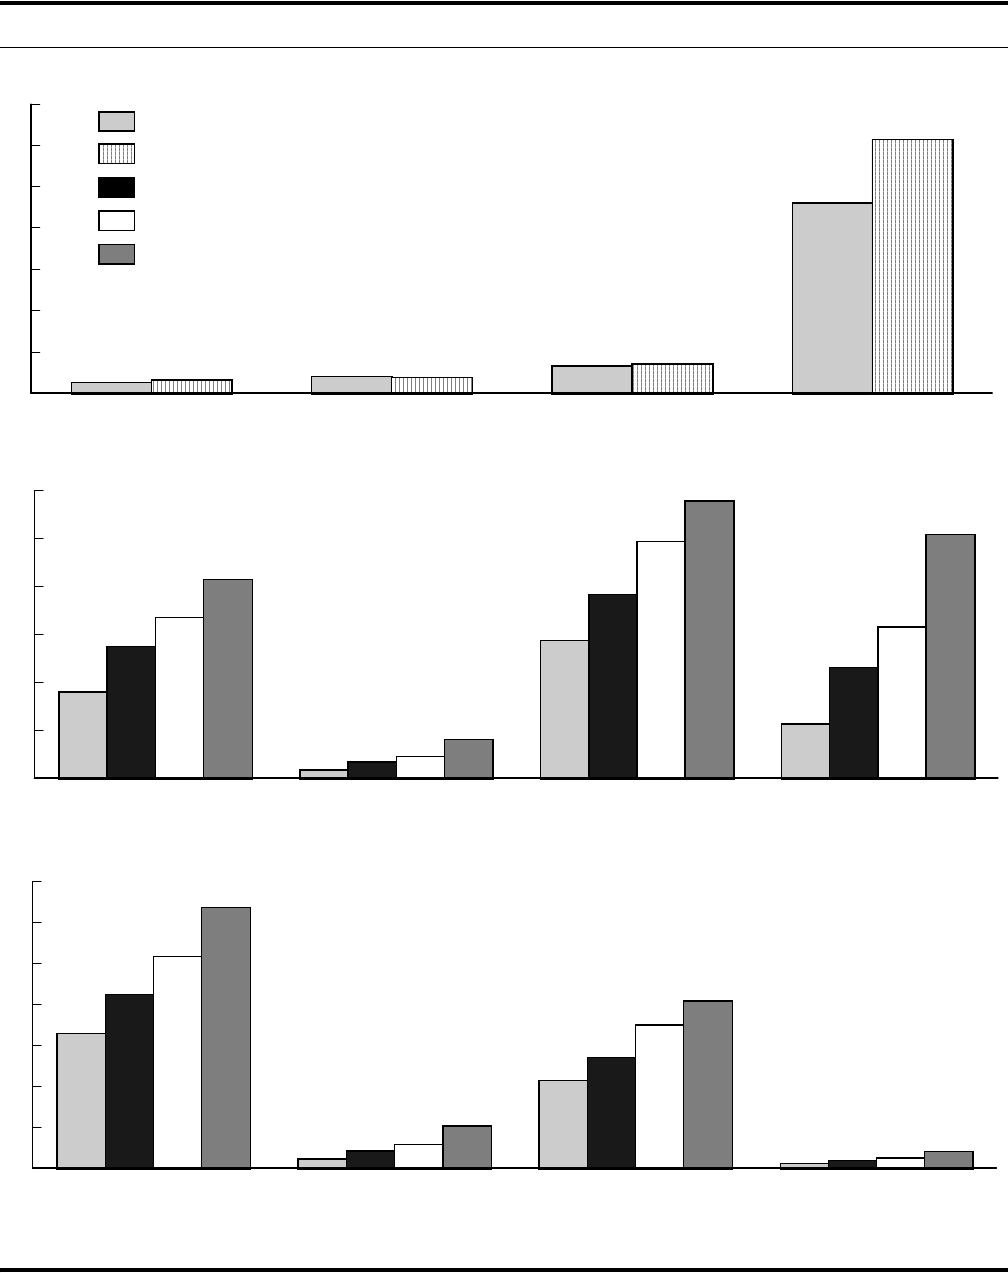
CHAPTER TWO THE SCIENTIFIC AND HISTORICAL CONTEXT 13
Figure 4.
Uncertainty in Projections of Regional Population and Economic Growth
Source: Congressional Budget Office based on Department of Energy, Energy Information Administration, International Energy Outlook 2002, DOE/EIA-0484
(2002).
United States Former Soviet Bloc Other Developed Countries Developing Countries
0
1
2
3
4
5
6
7
Population
United States Former Soviet Bloc Other Developed Countries Developing Countries
0
5
10
15
20
25
30
United States Former Soviet Bloc Other Developed Countries Developing Countries
0
10
20
30
40
50
60
70
Gross Domestic Product
GDP per Capita
1999
2020
2020 Low Economic Growth
2020 Base-Case Economic Growth
2020 High Economic Growth
Billions
Trillions of 1997 Dollars
Thousands of 1997 Dollars
14 THE SCIENTIFIC AND HISTORICAL CONTEXT
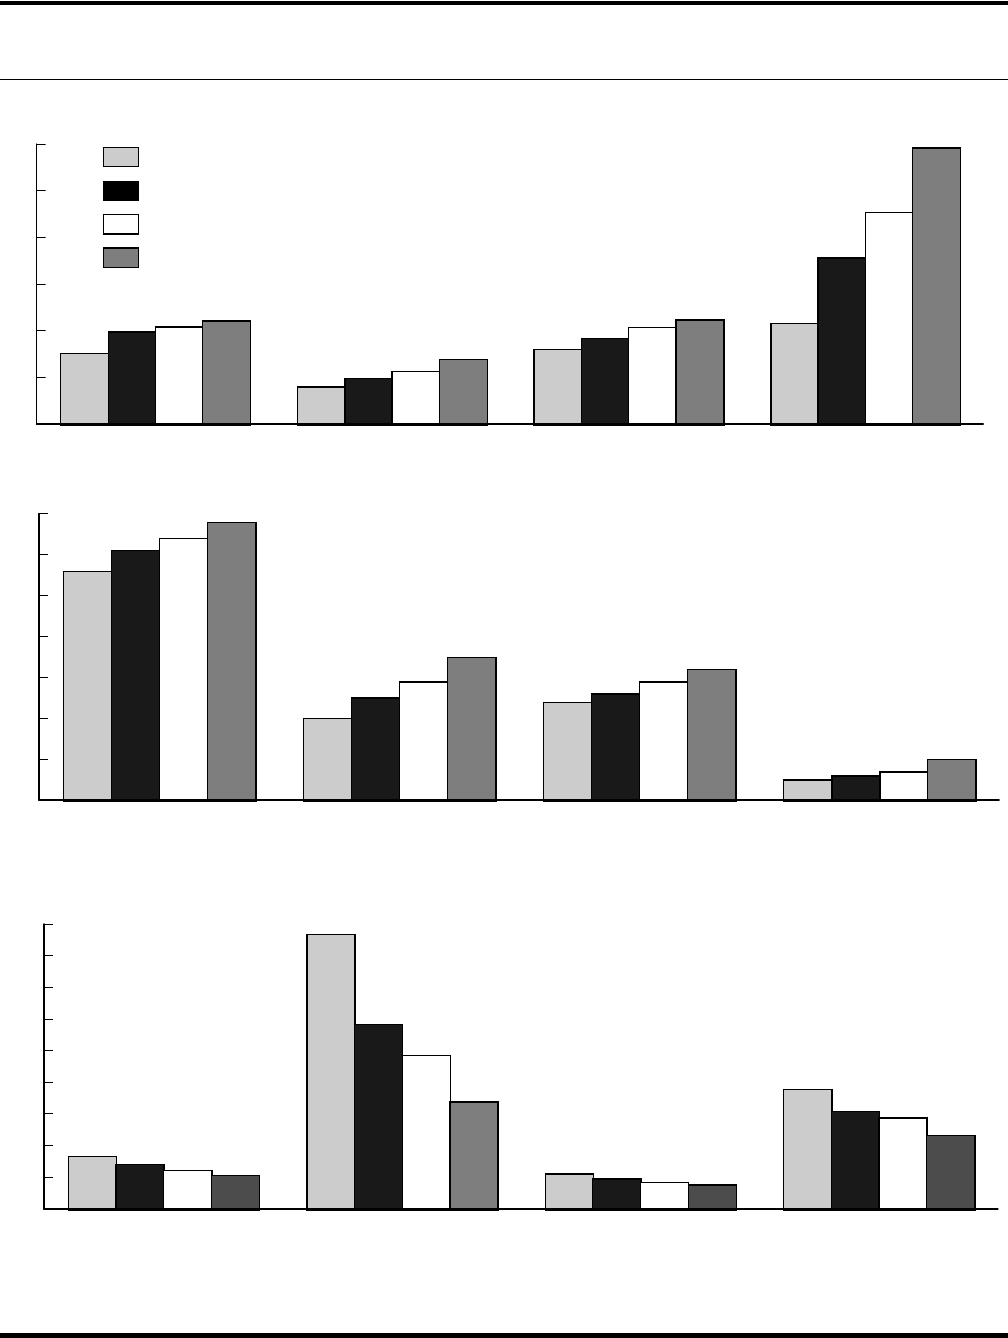
Figure 5.
Uncertainty in Projections of Regional Carbon Dioxide Emissions and
Emissions Intensity
Source: Congressional Budget Office based on Department of Energy, Energy Information Administration, International Energy Outlook 2002, DOE/EIA-0484
(2002).
Note: All emissions are from fossil fuels.
Total Emissions
Emissions Intensity
1999
2020 Low Economic Growth
2020 Base-Case Economic Growth
2020 High Economic Growth
Billions of Metric Tons of Carbon
Metric Tons of Carbon Dioxide Emissions
per Thousand 1997 Dollars of GDP
Metric Tons of Carbon per Person
Emissions per Capita
United States Former Soviet Bloc Other Developed Countries Developing Countries
0
0.1
0.2
0.3
0.4
0.5
0.6
0.7
0.8
0.9
United States Former Soviet Bloc Other Developed Countries Developing Countries
0
1
2
3
4
5
6
7
United States Former Soviet Bloc Other Developed Countries Developing Countries
0
1
2
3
4
5
6

CHAPTER TWO THE SCIENTIFIC AND HISTORICAL CONTEXT 15
What the Future May Hold
Recent studies have estimated that the average global
temperature is likely to rise by between 0.5ºF and 2.3ºF
(0.3ºC and 1.3ºC) during the next 30 years (Zwiers,
2002). Most of the warming during that period will be
due to emissions that have already occurred. Over the
longer term, the degree and pace of warming will depend
mainly on future emissions. Given current trends in popu
lation, economic growth, and energy use, global emissions
are likely to increase substantially. The populations and
economies of developing countries are growing rapidly,
and their total greenhouse gas emissions could surpass
those of developed countries over the next generation or
so—although on a perperson basis, emissions from devel
oping countries will continue at much lower levels than
emissions from developed countries for a long time to
come.
Even with substantial research, development, and adoption
of alternative energy technologies, fossil fuels are likely
to remain among the cheapest abundant energy resources
for many years. There are roughly 1,500 billion to 1,700
billion mtc in proven coal, oil, and natural gas reserves
that can be extracted using current technology, along with
an estimated 7,000 billion to 16,000 billion mtc in re
sources that might ultimately be recovered using advanced
technology—not including reservoirs of methane hydrate
under the ocean.
9
Without some sort of intervention, in
creasing levels of emissions—mainly of carbon dioxide
from the use of fossil fuels—will continue to raise atmo
spheric concentrations of greenhouse gases for the foresee
able future.
To illustrate how concentrations might change over the
next century, a study for the Intergovernmental Panel on
Climate Change presented a series of scenarios of green
house gas emissions, with cumulative carbon dioxide
emissions from both developed and developing countries
ranging from under 700 billion mtc to nearly 2,500 bil
lion mtc (Naki
ƒenoviƒ and Swart, 2000; see Figure 6). By
2100, under the scenario with the lowest levels of emis
sions, atmospheric concentrations of carbon dioxide would
be about onethird more than today’s levels; under the
highemissions scenario, concentrations would be nearly
triple today’s. Under the more likely scenarios in the
middle of the range, carbon dioxide concentrations could
ro ug hl y d oubl e d ur ing the nex t c entu ry, to leve ls no t s ee n
in over 20 million years (Pearson and Palmer, 2000).
Concentrations of other greenhouse gases are also likely
to grow by a considerable amount. Under the above range
of emissions projections—to which the authors do not
assign any probabilities—the average global temperature
could rise over the next century by about 2ºF (1ºC) or
by more than 9ºF (5ºC).
10
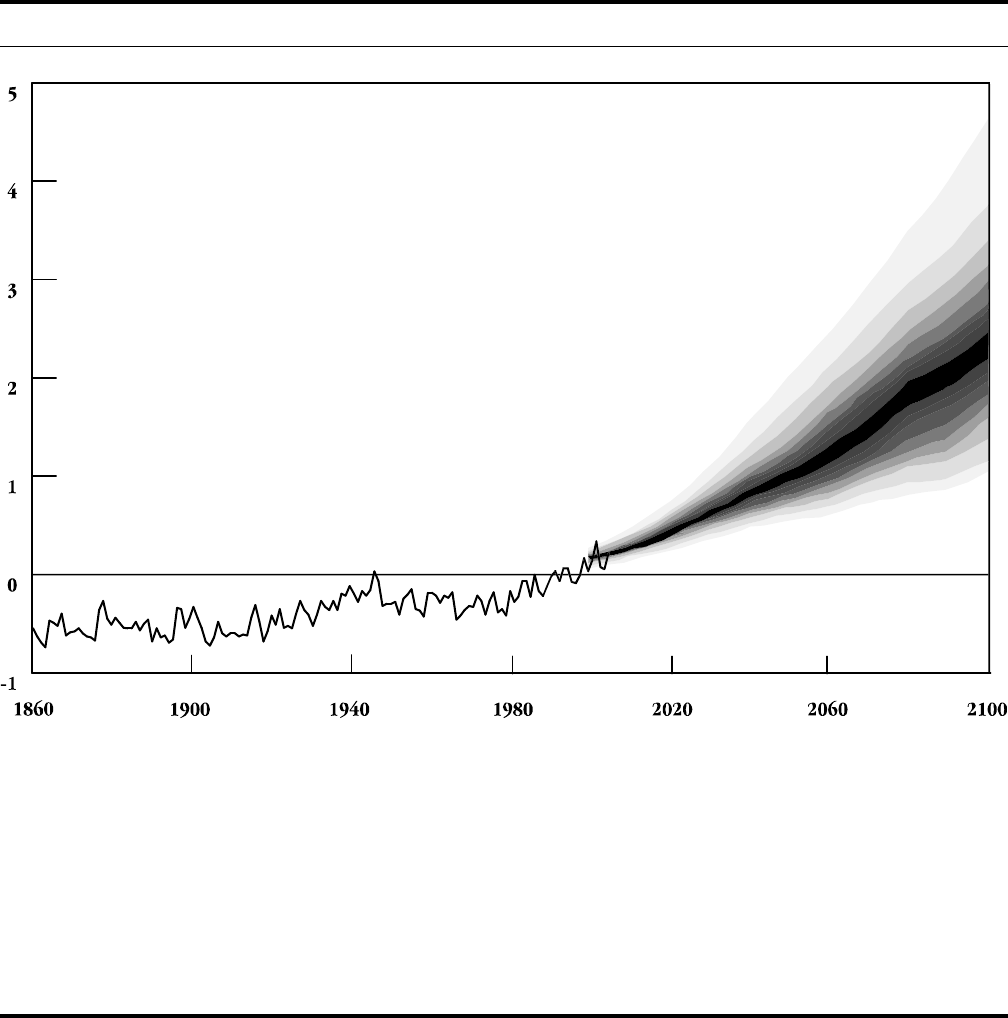
Other researchers have explicitly addressed a variety of
uncertainties in economic and climate forecasting; one
recent study projected an increase in the average global
temperature of 4.3ºF (2.4ºC) between 1990 and 2100,
with a 95 percent chance that the change will be between
1.8ºF (1.0ºC) and 8.8ºF (4.9ºC) (Webster and others,
2002; see Figure 7). The economic and physical factors
included in the study accounted for roughly similar shares
of the uncertainty surrounding the human contribution
to warming by 2100. Other factors, including variations
in solar radiation and volcanic activity, could also influ
enc e the f uture clim ate in ways that are hard er to qu an ti fy ,
but those factors were not included in the study.
At the low end of the projected range, the effects of climate
change would probably be relatively mild—although even
modest warming might trigger an abrupt, largerthan
expected shift in weather patterns. At the high end of the
range—an unlikely but possible prospect—the world
could face an abrupt change in climate that would be
roughly as large as the one at the end of the last ice age
but much more rapid. In the more plausible middle of
the range, the effects of climate change might still be quite
significant. Moreover, even if emissions were eliminated
before the end of the century, the oceans would continue
to warm—and thus further warm the climate—for cen
turies thereafter. And, of course, continued emissions be
9. Those estimates are derived from Babiker and others (2001),
Department of Energy (2001), Metz and others (2001), Porter
(1995), and World Energy Council (2001).
10. The economic projections for developing countries that underly
those scenarios were criticized in an article appearing in the Febru
ary 15, 2003, issue of The Economist. The criticism appears to be
valid but does not undermine the study’s main conclusions about
the range of possible climate change.
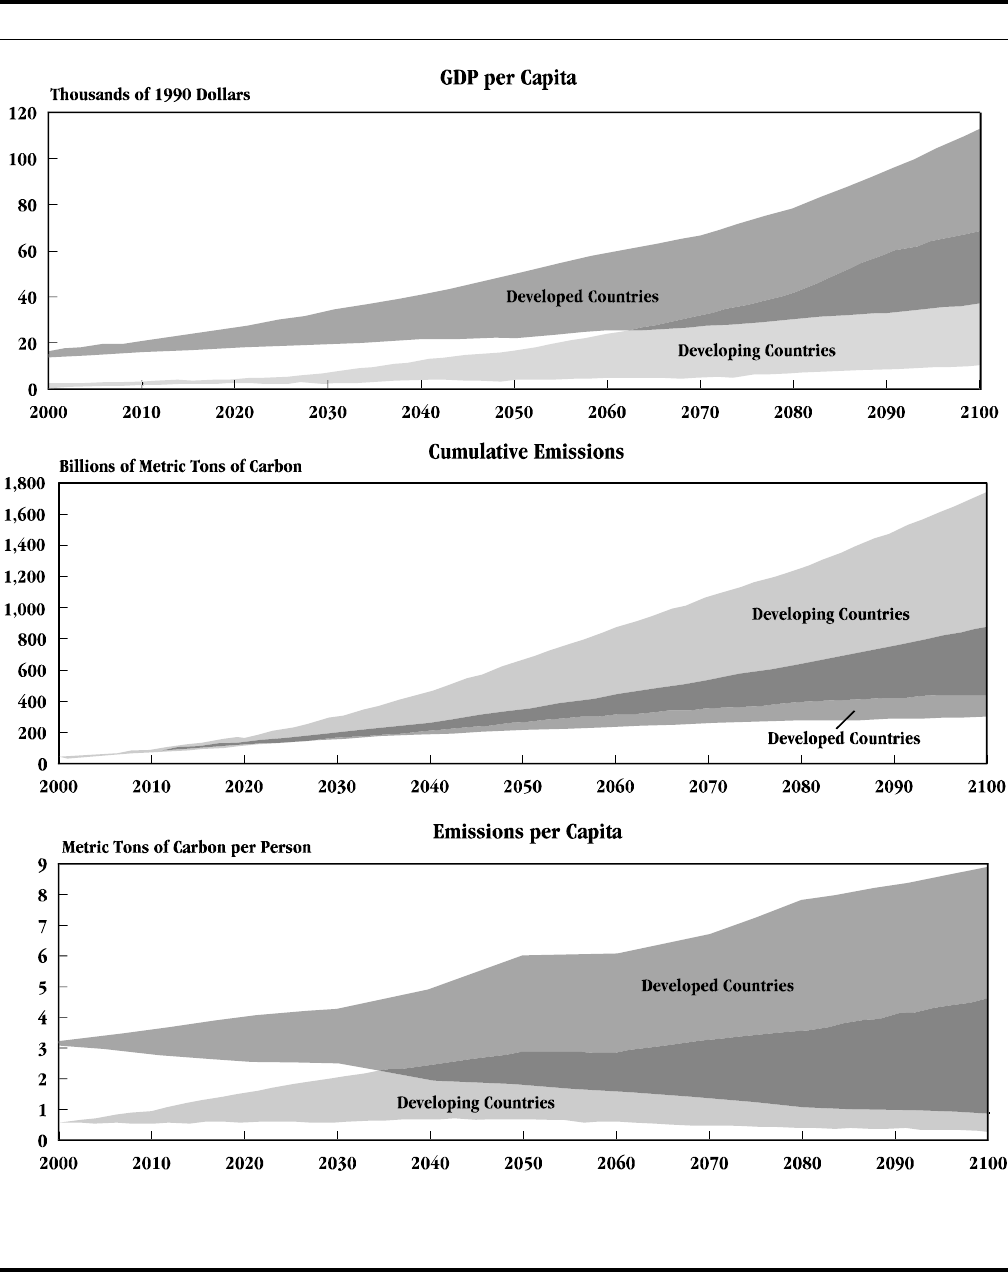
16 THE ECONOMICS OF CLIMATE CHANGE: A PRIMER
Figure 6.
Range of Uncertainty in Economic and Carbon Dioxide Emissions Projections
Source: Congressional Budget Office based on Nebojša Nakiƒenoviƒ and Rob Swart, eds., Emission Scenarios (Cambridge, U.K.: Cambridge University Press, 2000).
Note: All emissions are from fossil fuels.
CHAPTER TWO THE SCIENTIFIC AND HISTORICAL CONTEXT 17
Figure 7.
Historical and Projected Climate Change
(Average Global Temperature (°C) Relative to 1986-1995 Average)
Source: Congressional Budget Office. Historical data are from the Hadley Centre for Climate Prediction and Research, available at www.met-office.gov.uk/research/
hadleycentre/CR_data/Annual/land+sst_web.txt and described primarily in C.K. Folland and others, “Global Temperature Change and Its Uncertainties Since
1861,” Geophysical Research Letters, vol. 28 (July 1, 2001), pp. 2621-2624. The projection is based on data provided by Mort Webster, University of North
Carolina at Chapel Hill, in a personal communication, December 11, 2002; the results are discussed in Mort Webster and others, Uncertainty Analysis of
Climate Change and Policy Response, Report no. 95 (Cambridge, Mass.: Massachusetts Institute of Technology Joint Program on the Science and Policy
of Global Change, December 2002).
Note: The projection, which is interpolated from decadal averages beginning in 1995, shows the possible distribution of changes in average global temperature as
a result of human influence, relative to the 1986-1995 average and given current understanding of the climate. Under the Webster study’s assumptions, the
probability is 10 percent that the actual global temperature will fall in the darkest area and 90 percent that it will fall within the whole shaded area. However,
actual temperatures could be affected by factors that were not addressed in the study (such as volcanic activity and the variability of solar radiation) and whose
effects are not included in the figure.
yond the next hundred years would contribute to addi
tional warming.
The potential effects of any particular amount or rate of
climate change over the next few centuries are very un
certain. Research on the connection between the climate
and economic wellbeing yields particularly ambiguous
co nclus ions. Hu mans gener al ly ap pe ar to ha ve p ros pe re d
during warmer (or warming) periods and suffered during
colder (or cooling) ones. People did not—perhaps could
not—begin farming until after the last ice age ended.
Agriculture spread rapidly 6,000 to 8,000 years ago, when
the Sahara was largely grassland instead of desert and
average global temperatures were warmer than they are
today by perhaps a degree Celsius. Conversely, numerous
episodes of cooling seem to have disrupted cultures

18 THE ECONOMICS OF CLIMATE CHANGE: A PRIMER
throughout history. Europe prospered during a warm
period that occurred in the Middle Ages, but it suffered
during the colder Little Ice Age of between 300 and 800
years ago.
Yet the past effects of climate change on preindustrial
societies may not provide much information about its
future effects on technologically advanced societies—
especially the effects of significantly greater warming.
11
Researchers who study the sources of economic growth
consistently find that at least during the past halfcentury,
regions in temperate climates tended to prosper more than
regions in tropical ones, even after differences in levels of
income and education, rates of saving and investment,
and other factors were taken into account. (For example,
Masters and McMillan, 2000, and SalaiMartin, 1997,
discuss the positive correlation between temperate climate
and economic development.)
When considered as a whole, the historical and statistical
evidence suggests that a warmer global climate—as well
as the period during which warming occurred—could
have both beneficial and harmful effects. One global effect
would be generally harmful: sea levels would rise as glaciers
melted and the oceans warmed and expanded. The gradual
inundation of seashores would create problems for coun
tries (particularly lowlying island nations), regions, and
cities that were mostly near sea level. In the middle of the
range of climate change described earlier, sea level would
rise by up to 1½ feet (50 centimeters) over the next cen
tury. And even if emissions were eliminated after 2100,
thermal expansion of the oceans could ultimately raise sea
level by roughly 6 feet (2 meters) over a few centuries.
Because climate is generally a regional phenomenon, how
ever, the effects of climate change would vary by region—
and be even more uncertain than the effects globally. If
warming followed recent patterns, it would tend to be
concentrated in colder areas and periods—near the poles,
in the winter, and at night—but daylight temperatures
in the tropics during the summer would also rise.
12
A
somewhat w ar mer Ea rth w ou ld pro ba bly hav e m or e rai n
fall, and the resulting moderately warmer, wetter climate
—combined with more carbon dioxide in the atmosphere
—would probably improve global agricultural produc
tivity overall. Nevertheless, dramatic warming could
reduce the yields of important food crops in most of the
world. Shifts in weather patterns would probably cause
more heat waves and droughts in some regions, which
would substantially reduce their crop yields and supplies
of drinking water as well as exacerbate the effects of urban
air pollution. Other areas would experience more flooding.
Moreover, as Alley and others (2003) discuss, the climate’s
response to rising concentrations of greenhouse gases could
involve unexpectedly large and abrupt shifts, which would
be much more disruptive and costly to adapt to than
would gradual changes.
People in developing countries are probably more vul
nerable to the damaging effects of climate change than
are people in developed countries, in large part because
they have fewer resources for coping with the impacts. In
addition, a number of developing countries have large
populations that are either concentrated in lowlying
regions vulnerable to a rise in sea level or flooding or that
subsist on marginal agricultural lands vulnerable to
drought.
In contrast, industrial economies can draw on many more
resources to ease the adaptation to changes in climate.
Moreover, recent comprehensive study of the potential
impacts of climate change suggests that for a 4.5
/F (2.5/C)
increase in average global temperature, some developed
countries could actually experience economic benefits
because warming would improve climates for agriculture
(Nordhaus and Boyer, 2000). The United States could
experience a loss of about half a percent of total income;
the poorest developing countries could experience losses
of more than 2.5 percent—and from much lower levels
of income per person than those of developed countries.
11. Moore (1998) describes the potentially beneficial effects of warm
climates. Richerson and others (2001) discuss the relationship
between warming and the development of farming. Lamb (1995)
addresses the broader effects of climate over human history.
12. Until recently, evidence from fossils indicated that tropical weather
was relatively insensitive to global climate change. However, re
search by Kump (2001) suggests that tropical regions are, indeed,
affected.

CHAPTER TWO THE SCIENTIFIC AND HISTORICAL CONTEXT 19
But point estimates like those conceal a great deal of un
certainty. As an example, estimates of the effects on the
United States of a rise of 4.5
/F (2.5/C) in average global
temperature range from a loss of 1.5 percent of gross
domestic product to a gain of 1.0 percent.
13
For particular
temperate regions of the United States, the likely changes
in temperature and rainfall and the possible intensity of
extreme weather conditions are very poorly understood.
For example, recent reviews of the potential regional ef
fects of climate change in the United States (National
Assessment Synthesis Team, 2000, and Department of
State, 2002) found that rainfall and summer soil moisture
might rise significantly in much of the Midwest, or it
might fall significantly.
In addition, some researchers fear that climate change
might occur so rapidly that some types of plants—most
notably, in marginal ecosystems such as alpine meadows
and barrier islands and in immobile ecosystems such as
coral reefs—would not be able to adapt to the altered cli
mate and would disappear. Migratory animals, birds, and
insects could be similarly affected.
14
Moreover, warming
would probably increase the natural range of insectborne
diseases that are now found mainly in warmer regions.
Finally, among the most worrisome possible consequences
of rising greenhouse gas concentrations is the potential
disruption of deep ocean currents that strongly influence
the global climate. Those currents are directed partly by
thermohaline circulation; that is, the evaporation or freez
ing of seawater in various regions leaves the remaining
water increasingly salty, and therefore dense, and it sinks
into the deep. Warmer weather could slow or even stop
the current pattern of thermohaline circulation by increas
ing rainfall and reducing the formation of sea ice in the
North Atlantic.
Northern Europe appears to be particularly vulnerable
to such a change because its relatively warm, rainy weather
depends on the northerly flow of warm water from the
Gulf Stream, which in turn is linked to thermohaline
circulation in the North Atlantic. An abrupt halt of that
circulation—such as the halt that occurred after the last
ice age, as the climate warmed up—could seriously disrupt
the flow of warm water into the North Atlantic, leading
to much colder weather in parts of North America and
Europe for decades or centuries coupled with greater
warming elsewhere in the world. (Clark and others, 2001,
discuss that scenario.) Most climate models project that
the North Atlantic thermohaline circulation will weaken
during the next century because of higher levels of rainfall
in a warmer climate. However, they do not predict a
complete shutdown over that period.
Potential Responses
To control the longrun growth of greenhouse gas con
centrations in the atmosphere, countries could either limit
emissions or develop means of drawing greenhouse gases
back out of the atmosphere after they were emitted. One
significant remedy would be to control the longrun
growth of fossil fuel use. There are many alternatives to
current patterns of energy use, including technologies that
could make that use more efficient and others that could
exploit alternative energy sources—for example, solar en
ergy, wind, biomass, and hydroelectric and nuclear power.
However, expanding the reliance on any of those alterna
tives is relatively expensive compared with the market cost
of using fossil fuels. Restrictions on such use would there
fore impose economic costs—costs that would rise with
the stringency of the restrictions and would climb particu
larly quickly if extensive controls were imposed in the
short run. Over the longer term, control of fossil fuel use
will depend on the development of relatively inexpensive
alternative energy technologies (Edmonds, 2002).
Because plants absorb carbon dioxide from the atmos
phere, countries could sequester carbon by planting and
growing trees and partly offset emissions from the burning
of fossil fuels. (Scholes and Noble, 2001, and McCarl and
Schneider, 2001, discuss the role of sequestration in limit
ing carbon dioxide emissions.) In theory, the potential
for sequestration in forests is very large: if people could
replant all of the forest land around the world that has
13. Nordhaus (1994, 1998a,b), Nordhaus and Boyer (2000),
Mendelsohn and Neumann (1999), and Moore (1998) discuss
those cost estimates.
14. That problem could be aggravated by the environmental stresses
of population growth and industrialization. As Field (2001)
discusses, under an intermediate definition of appropriation, human
beings already appropriate an estimated 10 percent to 55 percent
of the energy transferred from plants to other life on Earth, and
that fraction is expected to grow in the future.

20 THE ECONOMICS OF CLIMATE CHANGE: A PRIMER
been cleared in the past two centuries and then leave the
forests alone, the trees and soils could eventually trap
much of the carbon that has accumulated in the atmo
sphere since the beginning of the industrial revolution.
In practice, though, reforestation on that scale is infeasible:
people need much of the land to grow crops and to live
on. Furthermore, people would continue to use fossil fuels,
and all of the carbon sequestered in trees over several
decades would be replaced in the atmosphere by the con
tinued emissions. So carbon sequestration in forests and
agricultural soils can only partially offset past and future
carbon emissions from fossil fuels.
But forests can offer a partial alternative to fossil fuels as
a source of energy. Although burning wood releases carbon
into the atmosphere (and is relatively dirty and expensive
as well), the carbon is removed again as another tree grows
in place of the one cut down, a cycle that could be re
peated over and over. Thus, a wood lot capable of pro
ducing 1 mtc of renewable biomass fuel every 20 years
or so could, over a century, replace 5 mtc from fossil fuels
that would otherwise be emitted into the atmosphere.
Engineers have developed technologies to remove carbon
dioxide from the exhaust of a combustion process and to
store it underground or in the ocean. Those carbon
capture technologies appear to be relatively straightforward
for large emissions sources such as electric power gen
erating plants, but they also significantly increase the cost
of generating power (Department of Energy, 1997).
15
Geoengineering solutions, such as adding iron to oceans
to fertilize the absorption of carbon by plankton, have also
been advanced. Some research suggests that iron fertiliza
tion may help reduce atmospheric concentrations of car
bon dioxide, although its effectiveness and cost are very
uncertain, as are its potential side effects (Boyd and others,
2000). Other geoengineering technologies, such as remov
ing greenhouse gases directly from the atmosphere, are
extremely expensive.
Some relatively simple and inexpensive options are avail
able for controlling some emissions of greenhouse gases
other than carbon dioxide. However, controlling those
gases in a costeffective manner is considerably compli
cated by the fact that they come from so many different
and widespread agricultural, industrial, and other activities
(Reilly, Jacoby, and Prinn, 2003).
Types of Uncertainty
As the preceding discussion emphasized, scientists and
economists are very uncertain about the potential eco
nomic threat posed by a changing climate. Some of the
uncertainty is scientific. For a given amount of greenhouse
gas emissions, what portion will accumulate in the atmos
phere? How much will a given change in those concen
trations affect the global climate? How will that global
change be distributed throughout the world, and how
rapidly will it occur? How much will regional climate
change affect sea level, agriculture, forestry, fishing, water
resources, disease risks, and natural ecosystems? Will rising
greenhouse gas concentrations increase the probability of
threshold effects, which could suddenly shift the climate
into a significantly different global pattern?
Other sources of uncertainty are essentially economic.
How rapidly will the world’s population and economies
grow? How energy and landintensive will human activi
ties be, and how much of the energy used for those ac
tivities will come from fossil fuels? How will policies to
control emissions of greenhouse gases or to encourage
technological developments affect the accumulation of
gases in the atmosphere? And how much will those policies
cost? At a deeper level, how will future generations value
the effects of averting climate change? Future generations
ar e likely to be wealthier, o n average, than people are today
and thus better able to adjust to changes in climate. But
they might also have been willing to forgo some of their
affluence to have their natural surroundings and climate
preserved.
Researchers’ increased understanding of climate change
has often uncovered areas of inquiry whose importance
had previously gone unrecognized. In that respect, greater
knowledge has sometimes served to expand the range of
scientific and economic unknowns, even as it has resolved
15. An extensive discussion of technological options and the costs of
capturing and sequestering carbon dioxide from power plants can
be found at the Web site of the International Energy Agency’s
Greenhouse Gas Research and Development Programme at
www.ieagreen.org.uk/index.htm.

CHAPTER TWO THE SCIENTIFIC AND HISTORICAL CONTEXT 21
specific issues (see Kerr, 2001, pp. 192194). Because of
that tendency, policymakers for the foreseeable future will
continue to face great uncertainty in determining the
potential costs and effects of different policies to address
the problem of climate change. Furthermore, policies that
explicitly take into account that range of uncertainty are
likely to be more effective than policies that do not.
16
16. See Heal and Kriström (2002) for a more extensive discussion of
uncertainty and climate change.


3
The Economics of Climate Change
The Earth’s atmosphere and climate are part of the
stock of natural resources that are available to people to
satisfy their needs and wants over time. From an economic
point of view, climate policy involves measuring and com
paring people’s valuations of climate resources, across
alternative uses and at different points in time, and apply
ing the results to choose a best course of action. Effective
climate policy would balance the benefits and costs of
using the atmosphere and climate and would distribute
them among people in an acceptable way.
Common Resources and Property Rights
Prosperity depends not only on technological advances
but also on developing legal, political, and economic insti
tutions—such as private property, markets, contracts, and
courts—that encourage people to use resources to create
wealth without fighting over or, in the case of renewable
resources, significantly degrading them. The effectiveness
of those institutions depends in part on characteristics of
the resources. Market institutions do not work well when
resources have the characteristics of public goods—that
is, when it is difficult to prevent people from using the
resources without paying for them (consumption is “non
excludable”) and when the incremental cost of allowing
more users is near zero (consumption is “nonrival”).
Market failures also arise when the many people using a
resource affect each others’ use—for instance, when rush
hour drivers create congestion and air pollution. (In that
case, consumption is nonexcludable but rival.) Those
characteristics make property rights for public goods diffi
cult to create and enforce. Private industry finds it rela
tively unprofitable to produce such goods, and consumers
have relatively little incentive to maintain them.
The Earth’s oceans and air are particularly hard to carve
up into private property, and in the ongoing process of
attempting to develop effective institutions to manage
them, access to those resources has largely remained open
—for the most part, no one owns them, anyone can use
them, and no one has to pay. For most of human history,
open access to the oceans and air was appropriate because
the world’s population was too small and its technologies
too limited to deplete stocks of fish, degrade air quality,
or affect the climate.
But population growth and advances in technology have
changed the way people use natural resources and made
them vulnerable to overuse, depletion, and degradation.
If resources are free for the taking, people will tend to
overuse them; if nobody owns them, nobody will take care
of them. That phenomenon is referred to as the tragedy
of the commons: everyone wants to use free resources but
will degrade them if they do, to the detriment of all.
In the case of climate, people want to use the atmosphere
to absorb greenhouse gases so that they may benefit from
cheap food and timber and from plentiful fossil energy.
In the long run, however, that use may significantly de
grade the climate.
An Example: Common Fishing Resources
To keep from overusing a common resource, people must
negotiate and agree on rules about who may use it and
how much of which types of uses are acceptable. Fisheries
provide a common, straightforward example of the prob
lem: a fishing community may have to determine the sus
tai nable l evel of fishing for each kind of f is h a nd then li mi t
catches to those levels. Limits on fishing will reduce the
CHAPTER

24 THE ECONOMICS OF CLIMATE CHANGE: A PRIMER
market supply of fish and raise their market value. People
who are allowed to keep fishing will reap a windfall profit
on the fish they can legally catch. (Cheaters, or “free
riders,” who catch more than their allowance will also get
windfall profits.) In the meantime, anyone whose fishing
is restricted is likely to sustain a loss.
1
The community’s
challenge is to reach a consensus about who gets to fish
and how much; about whether, how, and how much to
compensate the losers to win their support; and about how
to prevent free riders from catching extra fish and breaking
down the agreement. In short, the challenge is to negotiate
and enforce a new set of property rights.
The task of developing and enforcing property rights gen
erally falls to governments—and it may be further compli
cated if several countries are involved and international
negotiations are needed to resolve conflicts. Governments
use a variety of approaches to regulate fisheries, many of
which explicitly involve the technology of fishing. For
instance, the government may restrict the size of fish that
can be taken, prohibit the use of large dragnets, or require
the use of handheld lines. Other regulatory strategies apply
more directly to the market for fish. One alternative is to
create and distribute a fixed number of fishing permits
that limit recipients’ catches (see, for example, Newell,
Sanchirico, and Kerr, 2002). Under that approach, fisher
men may lose part of their previously unrestricted catch,
but their losses are at least partly offset because greater
scarcity drives up the price of fish. Consumers lose by
paying more per fish for fewer fish. If the government
auctions off the limited fishing rights to the highest bid
ders, fishermen will have to pay to fish; they will thus lose
the profits they could have reaped from higher, scarcity
driven fish prices. However, the government will take in
revenue that it can use for various purposes, including
partially compensating consumers and fishermen.
Whether it distributes or sells them, a government can
create private fishing rights (which recipients can buy and
sell on open markets) or common property rights (in
which a restricted group of people own the fishery together
and can exclude everyone else from fishing). A government
can also keep or appropriate the common resource as a
public property under public management and create a
use right—such as a fishing license or a catch limit—that
gives recipients temporary or limited access to the
resource.
Another alternative for the government is to sell use rights
by levying a tax on fishing activity or a “landing fee” on
fish catches. Because the tax becomes a cost of catching
fish, fishermen will raise the market price of their fish,
consumers will buy fewer fish as the price rises, and the
government will receive tax revenues. As the demand for
fish falls, fishermen will make less money, and some of
them will be pushed out of the market. As in the case of
auctioned rights, the government will receive revenues that
it can use to partially offset consumers’ and fishermen’s
losses, and fishing will be maintained at a sustainable level.
A Second Example: Common Air Resources
As a resource problem, air pollution is typically more com
plicated than overfishing. Unlike markets for fish, in
which a product actually changes hands, people generally
do not buy and sell air, so there is no market price that
reflects the value of air. In addition, modest air pollution
may hurt only some especially sensitive people, or it may
contribute to health problems in ways that are hard to
trace back to it. Pollution levels may have to be very high
before many people notice a problem and demand a
remedy. Moreover, there may be many different types of
emissions from a variety of sources, so it can be difficult
or even impossible to trace particular problems to particu
lar origins.
For example, regional air pollution may come from power
plants, factories, buildings, trucks, and cars. Emissions
from cars alone can involve millions of drivers, each hav
ing a minor effect on the health of millions of people,
including each other. No practical way exists for each
inhabitant to bargain with each driver over the minor
effect that that driver has on him or her.
Nor is it simple to measure the economic tradeoffs
involved. The benefits from less pollution—improved
health, better visibility, and so on—are certainly real but
notoriously difficult to evaluate because they are generally
not bought and sold in markets. The relative costs of re
ducing emissions from different sources can also be hard
to determine. And the people who enjoy the benefits of
1. Under certain circumstances, limits on fishing may drive up the
market price for fish to such an extent that it raises the total value
of the catch. In that case, it may be easier to get fishers to agree
to restrictions—although limits will raise costs for consumers.
CHAPTER THREE THE ECONOMICS OF CLIMATE CHANGE 25
lower pollution levels may not be the ones who incur the
costs.
Those complexities make it very difficult to determine
the costs and benefits of reducing air pollution and to
balance or distribute them in a politically acceptable way.
Nor is it easy to develop standard property rights for air
resources. As a result, people find it extremely challenging
to use private markets to resolve conflicts over the use of
air resources. The fundamental problem is transaction
costs—the costs of motivating and coordinating ex
changes; too many parties are involved in too many inter
actions to negotiate agreement in private markets. High
transaction costs force governments to come up with other
approaches to managing air pollution.
The Atmosphere and Climate
The problem of climate change involves very large trans
action costs. Emissions come from the land and energy
using activities of practically everyone in the world, and
the potential burden of their effects will be borne through
out the world by generations of people who are not even
born. Moreover, many of the potential impacts of climate
change—the disruption of ecosystems and extinction of
species, for instance—are themselves public in nature.
Those factors make it very hard—if not impossible—to
clearly define individual rights and responsibilities for
many of the activities that may contribute to climate
change and the effects that may come from it. Certain
types of rights, such as rights to emit greenhouse gases by
burning fossil fuels, could be delineated without great
difficulty. Other rights, such as credits for carbon stored
in t he s oi l and tr ees of a fores t s tand or in the ocean, wo ul d
be more complicated to define. Still others—such as the
right to enjoy a particular type of climate in a particular
part of the world at a particular time—would be impos
sible. Without clearly delineated, enforceable rights, indi
viduals cannot easily bargain with one another in markets
to resolve their conflicting claims. And as Chapter 2 dis
cussed, the scientific and economic uncertainty involved
makes climate tradeoffs extremely difficult to evaluate.
In sum, policymakers may be faced with the extraordi
narily complicated task of managing a resource that no
one owns, that everyone depends on, and that provides
a wide range of very different—and often public—benefits
to different people in different regions over very long
periods, benefits for which property rights would be very
difficult to define, agree on, and enforce. The causes and
consequences of climate change are international, and that
fact has several ramifications: governments will probably
have to cooperate for any management approach to be
effective; for some time to come, they will have only very
imperfect information on which to base decisions; and
their decisions may affect the world for centuries. If gov
ernments decided that the risks associated with climate
change called for action, they might have to persuade
people to make sacrifices today to benefit future genera
tions.
Reaching collective agreement on a policy involving use
of the atmosphere and climate change is an immense
challenge because everyone has an incentive to “free ride.”
A successful agreement need not require equal action by
all parties, but an agreement of any kind will break down
if some parties sacrifice to meet an overall goal and other
parties cheat, increasing their emissions in violation of the
goal. Moreover, without a clear sense of whether, when,
and by how much emissions should be constrained,
nations will find it very hard to agree on the appropriate
level of action. Equally important, nations have very dif
ferent historical and economic circumstances; they vary
widely in their ability and willingness to bear the cost of
reducing emissions—or the possible costs of climate
change. These factors help explain the great difficulty
nations are experiencing in trying to reach agreement on
a distribution of rights and responsibilities.
Further complicating any collective agreement is the fact
that governments generally are not subject to the market
forces that drive competitive firms to efficiently provide
the goods and services that consumers most want to buy.
Instead, governments tend to represent coalitions of pri
vate and bureaucratic interests that often engage in rent
seeking behavior—attempting to redirect the economy’s
resources to their own advantage. As a result, governments
do not necessarily provide the public services most desired
by consumers; nor do they provide them at the lowest cost.
There is consequently no guarantee that governments will
be better than markets at managing common resources.
Economic Trade-Offs
Economic valuation is inherently about measuring trade
offs—among people and resources and across time. Re

26 THE ECONOMICS OF CLIMATE CHANGE: A PRIMER
sources are limited, and people are forced to choose among
alternative uses, trading some things that they might like
to have for things of higher priority. The economic value
of a resource reflects those choices rather than something
intrinsic to it. Value is measured by people’s willingness
to p ay fo r the b enefits that a res ource p rovides—o r, ne ar ly
equivalent, their willingness to accept compensation for
lost benefits.
2
When markets work well, market prices communicate
people’s preferences—their choices among alternative uses
of resources and between using resources today (and
perhaps damaging or depleting them) and maintaining
them in their current state to be used later. For nonre
newable resources such as oil, the tradeoff involves
balancing the benefits of using them up now against the
benefits of preserving them so that they can be used later.
For renewable resources such as fisheries, the tradeoff
involves balancing the benefits of fish consumption today
against the benefits of maintaining a breeding stock for
tomorrow. In an efficient market, resources are used to
provide people with the goods and services that they most
want to have, when they most want to have them.
When markets do not work well, prices may not ade
quately reflect people’s willingness to pay for the benefits
that the use of a resource provides. That situation can arise
when property rights are poorly delineated or inherently
difficult to define, as in the case of public goods. It also
can arise when limited information makes it difficult or
impossible for individuals to decide what value they place
on a resource. For instance, even experts are uncertain
about the likelihood of abrupt changes in climate, or how
changes in climate might disrupt species and ecosystems,
or how those disruptions might affect society. Those fac
tors converge in the case of climate change, which involves
great uncertainty about a public good.
In attempting to manage such resources, policymakers
may simulate markets by estimating individuals’ willing
ness to pay, using proxy measures that economists have
developed for resources that are not directly bought and
sold. Even with those measures, however, policymakers
face the challenge of limited information, as well as the
impossibility of learning what values future generations
might assign to those resources.
Balancing Competing Uses of the Atmosphere
Effective management of the atmosphere involves bal
ancing the incremental benefits of using it as a sink for
greenhouse gas emissions—that is, the additional benefits
provided by the last ton of emissions—against the incre
mental costs (or benefits) of the climate change that may
gradually result from that ton of emissions.
3
Similarly,
effective management involves balancing the incremental
costs of investing in research on climate change against
the incremental benefits of the advancements in knowl
edge that result. That balancing of current costs and future
benefits also includes weighing the cost of reducing emis
sions to avert climaterelated problems in the future
against the cost of adapting to the climate change that oc
curs—that is, balancing mitigation and adaptation. If the
incremental costs of reducing emissions today are higher
than those of adapting to the consequences of emissions
in the future—say, by spending more on insect control
to prevent the spread of tropical diseases—then it would
be more costeffective to reduce emissions less and to
adapt more.
Put another way, effective climate policy involves making
investments today to yield future returns in the form of
a beneficial climate—with due regard for the scientific
and economic uncertainty involved. Those investments
could take several forms, such as restrictions on emissions
levels and research to improve understanding of the phy
2. People may express their beliefs about intrinsic values in their
willingness to pay for environmental benefits. For instance, they
may be willing to pay to ensure that a forest they may never see
is not cut down or that a species of animal does not become extinct.
They are expressing their willingness to sacrifice some other benefits
—cheap timber, for example—for the benefit of knowing that the
forest or species will be preserved.
3. The atmosphere is a partly renewable resource because the oceans
can indefinitely absorb only limited amounts of greenhouse gases.
Beyond those limits, the gases begin to build up in the atmosphere
and gradually affect the climate. (For carbon dioxide, the limit
appears to be roughly a billion metric tons of carbon per year.)
In that sense, the atmosphere is a depletable resource.

CHAPTER THREE THE ECONOMICS OF CLIMATE CHANGE 27
sical processes of climate change and to develop alterna
tives to fossil fuels.
4
Climate policy thus involves balancing investments that
may yield future climaterelated benefits against other,
nonclimaterelated investments—such as education, the
development of new technologies, and increases in the
stock of physical capital—that are also beneficial. If cli
mate change turned out to be relatively benign, a policy
that restricted emissions at very high expense might divert
funds from other investments that could have yielded
higher returns. Conversely, if climate change proved to
be a very serious problem, the same policy could yield a
much higher return.
Since resources devoted to climate policy would be di
verted from other uses, the total benefit from all types of
investment would be greatest if the rates of return were
the same “at the margin”—that is, for the last dollar of
each type of investment. However, efforts to ensure equal
rates of return become extremely complicated in the case
of longterm issues such as climate change. Few other
investments compare with climate policy in yielding an
enormous variety of returns on a global scale and over such
long periods, or in having returns that are as uncertain.
Furthermore, very long time horizons render the results
of costbenefit analyses extremely sensitive to the rate of
return that is assumed for the analysis.
The appropriate course of action—and the appropriate
level of climaterelated investment—depends on how one
balances the competing interests of present and future
generations and how one accounts for the existing sci
entific and economic uncertainty. Those choices, in turn,
are expressed in the desired rate of return on that invest
ment—that is, the chosen discount rate (see Box 1). While
analysts have reached no consensus on what discount rate
should be applied, several of them have argued that it
should be lower than the rates assumed in typical cost
benefit analyses, for several reasons:
• Society’s investment opportunities over the long term
are uncertain;
• There are no centurieslong financial markets in which
to invest risk free or from which to determine very
longterm rates of return; and
• People’s attitudes toward the distant future may not
be correctly reflected in the assumption of a constant
discount rate based on historical market returns.
5
The challenge is to come up with valuations that reflect
what people, taken together, may plausibly be said to
consider appropriate and that are also consistent with how
people may actually be able to transfer resources across
time (by making investments today that yield income in
the future).
If lower discount rates are deemed appropriate for evalu
ating very longterm costs and benefits, they justify taking
measures to increase society’s rate of investment not only
in preserving a benign climate but in expanding the stock
of all types of longlasting capital. By increasing invest
ment to the point at which the last investments all earn
rates of return that are consistent with the lower discount
rate, such measures would tend to reduce current genera
tions’ consumption in order to provide more wealth for
generations in the future.
Integrated Assessments of Costs and Benefits
Over the past 15 years, a large number of studies have
analyzed the potential costs and benefits of averting cli
mate change. Some researchers have attempted to incorpo
rate the studies’ results in global and regional models of
economic growth and climate effects and have used the
models to conduct socalled integrated assessments of
policy proposals related to climate change. They have also
estimated the costs of emissions control policies that would
yield the greatest net benefits in terms of economic
growth, reduced emissions, and the resulting climate
effects.
4. To the extent that they encouraged research or reduced emissions,
such investments might also yield benefits in the form of techno
logical side effects, or “spillovers,” or a decline in conventional air
pollution. And to the extent that greenhouse gas emissions also
contribute to conventional pollution, the costs and benefits of abat
ing such pollution need to be factored in as well.
5. Weitzman (1999, 2001) and Newell and Pizer (2001) discuss that
issue further; Cropper, Aydede, and Portney (1994) describe efforts
to determine people’s attitudes toward intergenerational equity
by measuring longterm discount rates.

28 THE ECONOMICS OF CLIMATE CHANGE: A PRIMER
Box 1.
Discounting and the Distant Future
For a variety of reasons, people place less value on the
future than they do on the present; a dollar today is
worth more to them than a dollar tomorrow. The
practice of valuing future income less highly than
current income is called discounting. A person who
greatly devalues, or discounts, future consumption and
hence does not save and invest much is said to have a
high discount rate. A person who places great value on
the future is said to have a low discount rate.
Such valuations are expressed in the market as interest
rates. Market interest rates balance everyone’s current
supply of and demand for savings—they represent the
market’s summing up of society’s competing preferences
for present and future income. Some people save part
of their income, thus accumulating wealth; others spend
more than their income, making up the difference by
borrowing or by running down their savings. Overall,
savers outpace dissavers; thus, society as a whole saves
a fraction of current income and invests it in activi
ties—such as conducting research, building physical
capital, and developing human skills—that will help
provide goods and services in the future.
1
Adjusted for
taxes and risk, interest rates also represent the marginal
rate of return on investment (the rate on the last dollar
of investment), or the rate—given the existing stock of
resources, capital, technology, and labor—at which sav
ings can be converted into future income.
If people had less of a preference for current consump
tion (a lower time preference)—and thus lower discount
rates—they would save and invest more of their current
income. Because highly profitable investment oppor
tunities are not unlimited, people’s pursuit of increas
ingly less profitable ones would drive down the marginal
rate of return. Ultimately, their lower time preference
would be reflected in a larger stock of capital, greater
output and income, and lower interest rates. Conversely,
greater preference for current income would be reflected
in lower future income and higher interest rates.
Economists who analyze public policy reason that if a
public investment is going to improve public welfare,
it should produce rates of return similar to those of the
private investments that it displaces. So in analyzing the
costs and benefits of policies intended to avert climate
1. Physical capital is land and the stock of products set aside to
support future production and consumption. Human skills—
education, training, work experience, and other attributes that
enhance the ability of the labor force to produce goods and
services—are sometimes referred to as human capital.
Those assessments and their findings are best thought of
as general illustrations rather than as exact calculations
of the cost of optimal policies. Analysts must make many
simplifying assumptions for such evaluations; conse
quently, every study excludes some potentially important
dimension—dealing with different gases, technologies,
countries, generations, environments, and so forth. None
theless, integrated assessments provide a sense of the rela
tive importance of different factors, highlight those of
greatest importance, and help policymakers focus on the
tradeoffs involved.
Integrated assessments of the potential costs and benefits
of averting climate change typically find relatively small
net benefits from stringent emissions controls in the near
term, even though they conclude that the continued
growth of emissions could ultimately cause extensive
physical and economic damage. In balancing alternative
investments, the assessments conclude, modest restrictions
on emissions today would yield net benefits in the future,
but extensive restrictions would crowd out other types of
investment. The loss of that investment would in turn
reduce the rate of economic growth and thus damage fu
ture generations’ material prosperity even more than the
avoided climate change would have.
Integrated assessments generally conclude that the most
costeffective way to respond to the risks of climate change
is through a gradual process of adjustment. Several con
siderations support that conclusion (see Wigley, Richels,
and Edmonds, 1996):
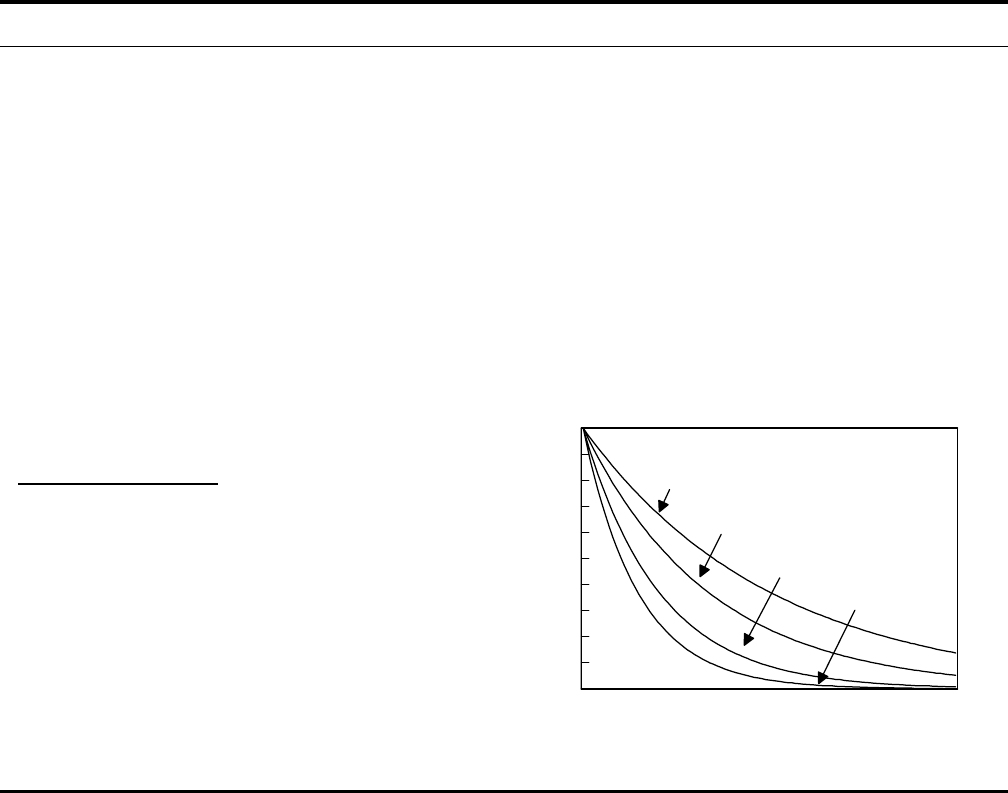
CHAPTER THREE THE ECONOMICS OF CLIMATE CHANGE 29
0255075100
0
100
200
300
400
500
600
700
800
900
1000
1,000
At 3 Percent
At 5 Percent
At 7 Percent
Years in the Future
At 2 Percent
The Present Discounted Value of $1,000
Dollars
Box 1.
Continued
change, economists typically apply discount rates that
are similar to market interest rates, after adjusting for
taxes, risk, and inflation. Those discount rates reflect
the distributional choices that people in the economy,
taken together, actually make.
However, conventional discounting arouses a great deal
of controversy when it is applied to longterm issues
because at discount rates that approximate market rates,
even very large longterm costs and benefits are dra
matically devalued (see the figure).
2
The choice of dis
count rate therefore makes a huge difference in thinking
about longterm problems such as climate change.
2. For instance, imagine a stream of income equal to your current
income but beginning in the year 2200 and stretching into the
distant future. In one sense, that stream of income is not worth
anything to you today because you will not be around to enjoy
it. However, you might wish to make an investment today to
ensure that your descendants will have that income. If you
evaluated that extended stream of income at a discount rate of
2 percent, it would be worth one year of your present income
to you today. At 3 percent, it would be worth one month of your
current income. At 5 percent, it would be worth half a day’s
income, and at 7 percent, it would be worth 10 minutes of
income.
Longterm discounting has such a strong effect precisely
because private investments yield relatively high rates
of return. As long as society continues to have extensive
opportunities for investment, it will be able to set aside
modest resources today, continuously reinvest the earn
ings, and have enormous wealth in the distant future.
If income continues to grow at 20thcentury rates,
future generations will have much greater resources than
current generations have to offset a climaterelated loss
of wellbeing.
Source: Congressional Budget Office.
• Much of the energyusing capital stock is in the form
of very long lived power plants, buildings, and ma
chinery. Gradual adjustment would give people time
to use up the existing stock and replace it with more
efficient equipment.
• When viewed from the present, the cost of reducing
emissions in the future is cheaper because of dis
counting.
• Technological change will probably lower the cost of
controlling emissions. (In addition, it might take a long
time to develop alternative technologies, and there
would be more incentive to engage in research and de
velopment over the long term if it was fairly certain that
the policies in place were gradually going to create a
large market for nonfossil energy.)
• People are likely to be wealthier in the future and there
fore may find it easier to pay to reduce emissions. If
income and wealth grow and technology improves as
expected, future generations may find it relatively easy
to cope with the impacts of climate change and to
gradually impose increasingly strict restraints on emis
sions to avert further change.
• At least for carbon dioxide, emissions that occur sooner
rather than later will have more time to be absorbed
from the atmosphere by the oceans. As a result, any
given future target for concentrations could be met with

30 THE ECONOMICS OF CLIMATE CHANGE: A PRIMER
Box 2.
An Example of Integrated Assessment
A recent study by William Nordhaus, reported in 2000, illus
trates how integrated assessment can be used to analyze the
tradeoffs involved in climate policy.
1
Drawing on an extensive
review of the literature, the study concluded that modest
warming of up to 2.3º Fahrenheit (1.3º Celsius) would have
essentially no net impact on the world economy and might
even yield some net benefits. But the study also concluded
that in the absence of efforts to reduce emissions, the average
global temperature would rise by about 3.6ºF (2.0ºC) over
the next century and by 6.1ºF (3.4ºC) over the next two cen
turies. Those changes would inflict damages—measured as
a reduction in world economic output—of roughly 1.0 per
cent (about $1 trillion in 2000 dollars) in 2100 and about
3.4 percent (nearly $7 trillion) in 2200. Such damages would
include losses of agricultural land, forests, fisheries, and
freshwater resources; gradual inundation of coastal areas as
sea level rose; adverse effects on people’s health; and, to some
extent, possibly catastrophic surprises.
Yet the study concluded as well that those significant damages
would have only a relatively minor economic impact because
the world economy was likely to grow very rapidly over the
period. Under the study’s “best guess” assumptions, costs and
benefits would be best balanced by imposing a charge today
on greenhouse gas emissions throughout the world of roughly
$10 per metric ton of carbon (mtc) and gradually raising that
charge at a pace related to the rate of global economic growth.
2
(Morerapid economic growth would lead to higher levels
of emissions and therefore require an emissions charge that
also grew more rapidly.) By 2100, the study’s recommended
policy would have reduced global emissions by only about
10 percent. The cumulative reduction in emissions over the
1. The estimates provided here, which are in 2000 dollars, come
from Nordhaus’s DICE99 model, available as an Excel spread
sheet file at www.econ.yale.edu/~nordhaus/homepage/homepage.
htm. The model is a recent update of the original DICE model
(described in Nordhaus, 1994), which was one of the seminal
integrated assessments of climate change. Both models address
emissions only of carbon dioxide rather than of all greenhouse
gases, but the results roughly generalize to policies that include
all gases.
2. An emissions charge of $10 per mtc would add about $5 to the
price of a short ton of coal, about 2.5 cents to the price of a gallon
of gasoline, and about 15 cents to the price of a thousand cubic
feet of natural gas.
century would have little effect on average global warming,
reducing it from about 4.4ºF to 4.2ºF (2.5ºC to 2.4ºC).
The study found little net advantage in averting climate
change because the assessment balanced current prosperity
against future prosperity and the future benefits of economic
growth against the future benefits of a stable climate. To avert
climate change over the long run, society would have to
reduce emissions both today and later. That policy would
reduce current generations’ prosperity and slow the rate of
economic growth, thus leaving future generations less affluent,
too. Given the contribution of fossil fuel use to both economic
growth and climate change, the study found little benefit in
slowing warming.
Sensitivity to Assumptions
The study’s results were strongly influenced by its estimates
of how much warming would occur in the future and of the
impacts from such warming. Another important factor was
its assumptions about how future generations would value
those effects. Morerapid warming from a given quantity of
emissions would justify higher charges on emissions, as would
a higher level of damages from a given amount of warming.
But if those greater damages occurred sufficiently far in the
future, they would not justify higher charges on emissions
today. For instance, if warming of more than 4.5ºF (2.5ºC)
would cause an economic catastrophe, it would be cost
effective to impose very high emissions charges as warming
approached 4.5ºF toward the end of the century to force the
economy to move away from its reliance on fossil energy
sources. Even in that case, however, the most costeffective
approach would still be to impose relatively small charges on
emissions today and then raise them rapidly in the future.
3
Like the results of all such assessments, the Nordhaus study’s
findings were also strongly tied to its assumptions about the
sources of future growth and its weighing of the welfare of
current generations against that of future generations.
4
Apply
3. Keller and others (2000) come to a similar conclusion in a study
that explicitly considers the possibility of a shutdown of thermo
haline circulation.
4. The study imposed a discount rate that gradually declined from
over 4 percent today to under 3 percent in 100 years. Those rates
led the model to assign a present value of about $25 billion—one
fortieth the future value—to a trillion dollars of damages a cen
tury from now. The rates had two components. The first and
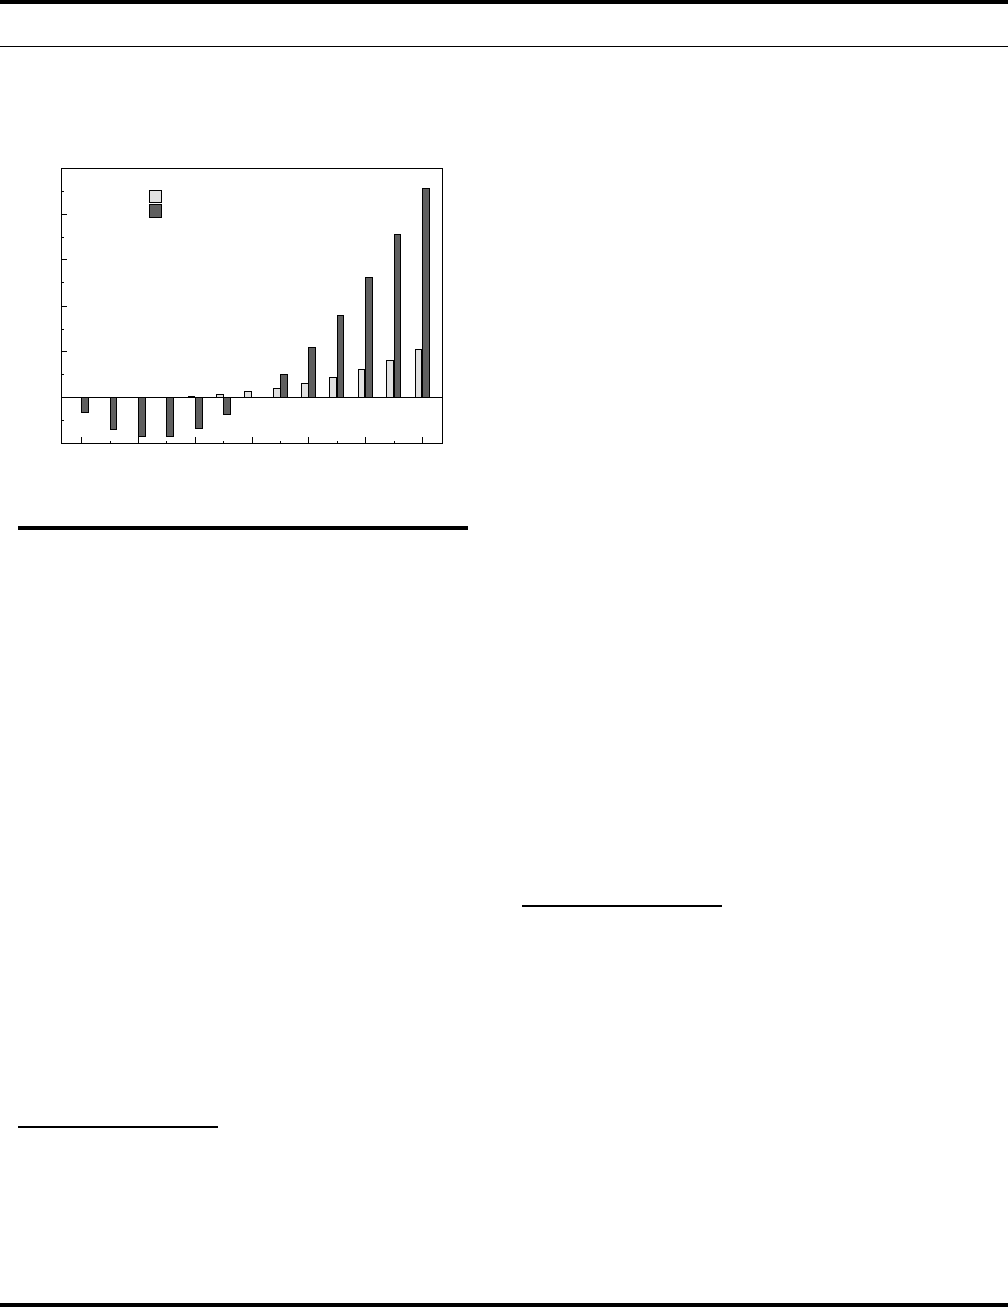
CHAPTER THREE THE ECONOMICS OF CLIMATE CHANGE 31
(2000 dollars per person)
2000 2040 2080 2120 2160 2200 2240
-100
0
100
200
300
400
500
Market Discount Rates
Below-Market Discount Rates
Box 2.
Continued
Projected Benefits of Climate Mitigation
Under Different Discount Rates
Source: Congressional Budget Office, using the DICE99 model.
ing a lower discount rate gives more weight to the wellbeing
of future generations, shifting the balance of costs and benefits
in favor of investing more to reduce emissions today (and
investing more in other kinds of capital formation as well).
An extreme case would be to apply a discount rate that took
into account only the expected gradual increase in future
generations’ wellbeing that sprang from economic growth.
Such a rate would still discount events a century from now
by about twothirds, but it would justify much higher current
charges on emissions—on the order of $160 per mtc—to
balance current and future costs and benefits. That stringent
a policy would slightly reduce the consumption of people alive
over the coming century but greatly increase the consumption
of succeeding generations (see the figure).
5
Conversely, a higher
discount rate would give more weight to the present and shift
the balance of costs and benefits in favor of less investment
and more consumption today.
The study’s recommended policy is much less sensitive to
estimates of costs for abating emissions than to the choice of
discount rate.
6
If abatement turned out to be considerably
cheaper (or considerably more expensive) than the study’s
dominant one simply reflected current generations’ preference
for income today over income for future generations. The second,
relatively minor, component took into account that future gen
erations would be wealthier than current generations, so an addi
tional dollar of income would be worth less to them than to
people alive now.
“best guess,” the recommended charge would still be roughly
$10 per mtc, but it would induce greater (or fewer) reductions
in emissions.
7
Evaluating the Integrated Assessment Method
The Nordhaus study illustrates both the usefulness and the
limitations of integrated assessment. On the plus side, the
study assesses different aspects of the climate problem in a
consistent, relatively simple framework. It also provides a
point estimate based on best guesses about global economic
growth, energy use, and emissions; the climate’s response to
rising greenhouse gas concentrations; the economic value of
the resulting impacts; and the discount rate. The model’s
simplicity helps analysts understand how changes in those
assumptions affect estimates of costs and benefits.
On the minus side, the assessment includes only energy
related carbon dioxide emissions. Moreover, it ignores distri
butional issues within generations, in part because it combines
all impacts into a single estimate—which offers little insight
into the extent to which positive and negative effects might
offset each other or might be experienced by different groups
of people. (Nordhaus, 2000, addresses some international
distributional issues in an extension of the model discussed
here.) The model is also based on crude guesses about the
value of changes in unmanaged ecosystems, for which there
are no market measures. Perhaps most important, it does not
explicitly consider the wide range of uncertainty that exists
on many dimensions—which, if incorporated into an assess
ment, can strongly influence its conclusions.
5. Lower discount rates would also justify much higher rates of
investment than society currently undertakes, so they would not
be consistent with the market’s balancing of the welfare of current
and future generations.
6. Compared with the range of cost estimates in the literature, the
Nordhaus study assumed that it would be relatively inexpensive
to reduce emissions and that technological improvements would
make such reductions even easier over time.
7. In the Excel version of DICE99, raising marginal abatement costs
tenfold reduces the abatement rate by a factor of eight but raises
the currently costeffective charge on carbon by only 3 percent.
Reducing marginal abatement costs by a factor of 10 raises the
abatement rate by a factor of six; however, it reduces the cost
effective charge by only about 20 percent.

32 THE ECONOMICS OF CLIMATE CHANGE: A PRIMER
somewhat greater total emissions over the next century
if the bulk of the emissions occurred early on.
Box 2 on pages 30 and 31 summarizes findings from a
particularly wellknown integrated assessment model
developed by William Nordhaus. The study illustrates how
integrated assessment can be used to provide a “best guess”
of the climate policy that would yield the greatest net
benefits and how sensitive that sort of estimate is to the
assumptions built into the assessment. However, the study
does not explicitly consider the wide range of uncertainty
about scientific and economic aspects of climate change—
the topic of the next section.
Coping with Uncertainty
The extensive scientific and economic uncertainty dis
cussed in Chapter 2 greatly complicates assessment of the
costs and benefits of averting climate change. No one
wishes to undertake extensive, expensive actions to solve
a problem that turns out to be relatively mild—or to take
no action to solve a problem that later proves catastrophic.
Policymakers are thus forced to hedge their bets and pre
pare for more than one possible outcome, with the addi
tional complication that whatever outcome occurs is likely
to be largely irreversible.
6
In general, uncertainty about a problem may indicate the
need for more, or less, action to address it, depending on
the nature of the unknowns (Webster, 2002). The amount
of appropriate action also depends on how riskaverse
people are—that is, how much they are willing to pay to
avoid an uncertain but costly outcome. The greater their
degree of risk aversion, the more people will be willing
to sacrifice today to reduce the likelihood of adverse
changes in climate.
Studies that explicitly account for uncertainty generally
recommend greater effort to avert climate change than
do analyses that do not account for it—mainly because
the studies include the longterm discount rate as an
uncertain variable.
7
However, the way those studies treat
uncertainty about the discount rate in effect simply applies
greater weight to future generations and therefore recom
mends more action. Because the issue of discounting is
mainly a distributional one, many analysts question
whether it should be treated as a matter of uncertainty in
the same sense that, say, the sensitivity of the climate to
carbon dioxide concentrations is uncertain.
Another area of uncertainty—often ignored in economic
analyses—involves the actions of governments in the fu
ture. Integrated assessments that conclude that only mod
est actions are called for today assume that policymakers
will in fact take morestringent action in the future, should
it prove prudent. However, governments may not be able
to commit themselves to increasingly stringent future poli
cies. That problem is part of a broader difficulty in ad
dressing longterm challenges: current generations have
few means to constrain the behavior of succeeding genera
tions.
Because of uncertainty and the long time frame involved,
climate policy will inevitably involve a sequence of deci
sions. At each stage, policymakers would determine a near
term plan, based on the information accumulated to that
date and composed of both research to further improve
knowledge and action to reduce risk. The information
uncovered during the succeeding period would set the
stage for the following round of decisionmaking.
Because better information can help policymakers make
better choices, there are likely to be benefits to conducting
climaterelated research and developing technological
options to reduce the cost of controlling emissions. One
6. Climate policy involves a degree of irreversibility in both mitigation
and impacts. On the one hand, expensive investments to reduce
emissions will be impossible to recoup if warming proves modest
or largely beneficial. On the other hand, emitted greenhouse gases
are likely to be difficult to withdraw from the atmosphere if
warming proves to be very damaging.
7. An analysis of climaterelated uncertainty can be found in
Nordhaus (1994); two analyses that expand on that work are Pizer
(1997) and Newell and Pizer (2001). Because small changes in
the discount rate can significantly shift the balance of current and
future values, uncertainty about the discount rate dominates those
analyses. Under the studies’ assumptions, costs and benefits would
be balanced by imposing an international charge on greenhouse
gas emissions of roughly $15 to $20 per metric ton of carbon
equivalent (in today’s dollars) and raising the charge gradually over
time. That estimate is nearly double the estimated charge when
uncertainty is not taken into account. Evidence from a wide variety
of estimates of mitigation costs suggests that such a charge would
reduce global emissions by roughly 4 percent (Lasky, forthcoming).

CHAPTER THREE THE ECONOMICS OF CLIMATE CHANGE 33
recent analysis estimated that the potential benefits of
research to reduce uncertainty about the risks of climate
change could total roughly $1 billion to $2 billion per year
in 1990 dollars ($1.3 billion to $2.6 billion in 2002 dol
lars).
8
About half of those benefits of research would come
from better information about the value of damages from
different amounts of climate change. Another quarter
would come from better information about how much
it would actually cost to reduce emissions. Relatively little
of the total benefit would come from better information
about future growth of the global population or particular
nations’ economies, or about the functioning of the cli
mate system.
Other studies suggest that research to accelerate the devel
opment and deployment of lowemissions technologies
might yield net benefits, given the current range of
uncertainty about future technological advances (see, for
example, Papathanasiou and Anderson, 2001). The bene
fits would flow from lowering the cost of such tech
nologies and thus making the transition to nonfossil en
ergy less expensive than it would otherwise have been if
potential damages from climate change had turned out
to be large.
Distributional Issues
Crafting climate policy involves not only balancing costs
and benefits but also distributing them—within and
among countries, regions, and generations. Policies that
balance overall costs and benefits do not necessarily bal
ance them for every person, and policies that maximize
the net benefits to society do not necessarily provide bene
fits to each individual. A policy may yield positive net
benefits by causing both very large aggregate losses and
only slightly larger aggregate gains.
9
Distributional concerns are at the heart of much of the
controversy about climate policy. For example, imposing
controls on emissions today would cut coal mining com
panies’ profits but would benefit manufacturers of solar
energy equipment. Preventing climate change in the future
might greatly benefit countries at very high risk of damage
but might actually hurt countries that stood to gain from
a warmer climate. Similarly, emissions control policies
would impose costs on people today and yield benefits
to people in the future.
10
Issues Among Generations
Acting to prevent climate change today would place a bur
den on people now alive and would probably leave coming
generations with a climate more similar to today’s—but
with somewhat less wealth—than they would have had
otherwise. In contrast, not acting would benefit people
today and probably yield somewhat more wealth in the
future—but it might also leave the world with a different
and possibly worse climate for many generations to come.
Choosing among policies is not purely a matter of bal
ancing costs and benefits but also a question of how to
distribute the benefits of energy consumption, land use,
and climate among generations. Policy recommendations
from the integrated assessments described earlier are very
sensitive to such intergenerational choices. (Howarth,
2001, provides an example of an integrated assessment
that explicitly considers intergenerational equity.)
Instead of restricting emissions, current generations could
address these distributional concerns by making additional
capital investments to benefit future generations, with the
intention of offsetting potential future damages from cli
mate change or of compensating future generations for
8. Nordhaus’s and Popp’s analysis (1997, pp. 147) measures only
the expected benefits of research and not what the required studies
would cost.
9. In studying economic problems, economists seek policies that will
improve economic efficiency—that will make at least one person
better off without making anyone worse off. Such policies are
termed Pareto improvements. However, many policy proposals
whose net benefits exceed their net costs also have substantial
distributional effects. That is, the improvements are worth more
than the losses, all told, but some people are made worse off even
while others are made better off. Economists refer to such policies
as potential Pareto improvements: in principle, the winners could
compensate the losers for their losses and still be better off. Such
a policy passes a standard costbenefit test but could still make
many people worse off unless it also provided for their compen
sation.
10. Gradually rising emissions taxes or permit prices would also effec
tively imply a particular distribution of emissions rights across gen
erations.
34 THE ECONOMICS OF CLIMATE CHANGE: A PRIMER
those damages. However, because of uncertainty about
the kind of damages climate change would cause, it is un
clear whether (or how much) more capital would be neces
sary—or useful—to offset them. Also uncertain is whether
intervening generations would pass the additional re
sources on to subsequent generations or consume the re
sources themselves.
Concerns Within and Among Countries
Dealing with the issue of climate change is likely to involve
difficult decisions about distributing costs and burdens
within countries. Some workers and industries—coal pro
ducers, electric utilities, and others—would probably bear
a disproportionate share of the burden of restrictions on
domestic emissions, as would the regions of a country that
produced fossil energy. (The Congressional Budget Office
discusses issues of equity in domestic climate policy in its
2000 report on carbonallowance trading.)
Distributional concerns also dominate discussions of inter
national climate policy and are likely to play at least as
important a role in its development as the balancing of
costs and benefits will. Policymakers in many developing
countries emphasize that developed countries are respon
sible for the bulk of historical emissions and that many
developing countries are apparently more vulnerable to—
and less able to cope with—the more damaging effects
of climate change. Such leaders tend to argue that devel
oped countries should not only shoulder any nearterm
burden of reducing emissions but also compensate devel
oping countries for climaterelated damages. They also
tend to be skeptical of arguments that favor balancing net
economic costs and benefits, recognizing that such rea
soning may be used to gloss over both distributional issues
and disparities in impacts.
In contrast, other policymakers in both developed and
developing countries tend to be less concerned about
climaterelated issues because they believe that their
nations are not particularly vulnerable to potential changes
in climate or will be able to adapt to whatever changes may
occur.

4
Trade-Offs Among Policy Options
Governments may respond to the challenge that
climate change poses by adopting a “waitandsee” ap
proach or by pursuing research programs to improve
scientific knowledge and develop technological options,
regulating emissions, or engaging in a combination of
research and regulation. Should policymakers decide to
act, they can choose from among a wide variety of ap
proaches to regulate emissions and encourage the develop
ment of lowemissions and emissionsremoval technolo
gies.
Several characteristics of greenhouse gases make it possible
to lower the costs of regulation by allowing for a great deal
of flexibility in controlling emissions. Different greenhouse
gases , me as ur ed in metr ic to ns of car bo n eq ui vale nt, hav e
essentially the same effect on climate; they mix uniformly
throughout the atmosphere and will only gradually affect
the climate as they accumulate over time. Consequently,
which gas is controlled and where—and, to some extent,
whether a given reduction in emissions occurs this year
or next—are immaterial. That principle is often referred
to as “what, where, and when” flexibility in discussions
of climate policy.
Governments could control greenhouse gas emissions in
a variety of ways. Under direct commandandcontrol regu
lation, the government could specify the types of equip
m ent and te ch no lo gy tha t m ay be used, or it could s pe ci fy
energyefficiency or emissions standards for buildings,
vehicles, and equipment. Alternatively, the government
could impose emissions taxes or fees, which would dis
courage emissions by increasing their cost. It could also
directly control emissions through a system of emissions
permits, or allowances, that would strictly limit the total
quantity of emissions.
Another option combining elements of taxes and permits
would be a hybrid permit system under which the govern
ment allocated a fixed quantity of permits but sold an
unlimited number of additional permits at a set “trigger”
price. In such a system, if the cost of reducing emissions
rose above the trigger price, emitters would simply buy
additional permits rather than reduce emissions further.
The system would thus cap the incremental cost of emis
sions at the trigger price—acting, in effect, like a tax.
Although U.S. environmental regulations are largely of
the commandandcontrol type, most economists agree
that as a general rule, taxes or permits—loosely termed
“marketbased” systems—can control emissions while
offering greater flexibility and lower costs. In contrast to
direct controls, marketbased systems give firms and
households stronger incentives to find lowcost ways to
reduce emissions through behavioral changes and inno
vative technologies.
In the case of carbon dioxide emissions from the burning
of fossil fuels, the most direct approaches would involve
taxes or permits based on the carbon content of fossil
fuels.
1
Under either system, fossil fuel suppliers—pro
1. The quantity of carbon dioxide emitted is directly proportionate
to the carbon content of fuels and is therefore easy to measure.
Carbon taxes fall most heavily on coal, which is composed almost
entirely of carbon; they fall somewhat less heavily on petroleum
products and least heavily on natural gas because those fuels also
contain hydrogen. An emissions tax of $100 per metric ton of
carbon equivalent translates to roughly $50 per short ton of coal,
25 cents per gallon of gasoline, and $1.50 per thousand cubic feet
of natural gas. Other taxes on fuels—for instance, ad valorem (or
valueadded) taxes in proportion to sales prices or energy taxes in
proportion to the energy content of fuels—would not be targeted
CHAPTER

36 THE ECONOMICS OF CLIMATE CHANGE: A PRIMER
ducers and importers of coal, oil, and natural gas—would
have to pay taxes or acquire permits in proportion to the
carbon content of the fuel they sold. Such systems would
be relatively simple to administer, monitor, and enforce
if they were applied at the point of import or first sale
because relatively few companies actually import or
produce fossil fuels. The system would impose price in
creases or restrictions on output that would filter down
the distribution chain, but it would avoid the administra
tive difficulties of a system that directly taxed “down
stream” retailers and consumers.
2
The relative ease of regulating energyrelated emissions
contrasts with the difficulties of regulating emissions from
most other sources, particularly the substantial fraction
that originates from forestry and farming. Because those
other emissions come from many different kinds of mainly
small sources under highly variable conditions, they tend
to be m uch m ore d ifficult to trac k an d m easu re . A lt hough
some such emissions could be regulated in a costeffective
manner (Reilly, Jacoby, and Prinn, 2003), controlling
those sources would generally require different and varying
approaches. That could complicate the regulatory process
and might easily swamp the relatively low engineering
costs of controlling some nonenergyrelated emissions.
For instance, carbon emissions from fossil fuels could be
par tly o ffs et by p ay in g la nd ow ner s to p lant trees to abs orb
and sequester carbon, thus reducing net emissions. Some
tree planting is already supported for other purposes, such
as soil conservation, and expanding those policies would
be relatively straightforward. However, for the purposes
of carbon sequestration, such policies are complicated by
issues that do not arise in regulating fossil fuels. They
include the costs of monitoring tree growth to determine
how much carbon is absorbed and the difficulty of deter
mining whether landowners would have grown the trees
anyway. Another complicating factor is how sequestration
activities might ripple through markets and affect carbon
flows on agricultural and forest land not dedicated to
sequestration. For instance, a decision to set aside a certain
amount of forest for sequestration might lead to another
area of forest being cleared that otherwise would have
remained untouched. In that case, the carbon sequestered
in the setaside area would simply be offset by clearing
elsewhere.
Taxes and Permits: Similarities
and Differences
Taxes and permits affect a regulated activity in similar
ways as long as people can buy and sell the permits on
open markets. A tax on the carbon content of fuels directly
raises the price of those fuels for the end user; a strict per
mit system indirectly raises the price by reducing the
quantity of fuel that suppliers can sell. (As noted earlier,
a fixedprice permit system works like a tax.) Either way,
hi gher pr ices lead peop le to reduce their fuel consum ption
and thus their emissions. So for any level of emissions
restrictions in a permit system, there is a corresponding
tax level that will achieve the same purpose. In principle,
both approaches should lead to identical levels and prices
of emissions.
In practice, however, uncertainty about the costs and
benefits of restricting emissions can greatly influence the
relative costeffectiveness of the two approaches. The gov
ernment could impose a tax, expecting some level of re
duced emissions; but emissions could end up higher or
lower than it expected. Likewise, the government could
impose a permit system with a cap on emissions and ex
pect a given cost for meeting the cap; but that cost could
end up being much higher or lower. And in either case,
the price might not be consistent with the uncertain
benefits of mitigating climate change. Which system is
preferable depends on which type of uncertainty is the
greatest and how rapidly costs rise—and benefits fall—as
the government tightens restrictions on emissions.
Some research indicates that climaterelated uncertainty
gives an emissions tax (or fixedprice permit system) sig
ni ficant economic advantages over a system of strictly fixed
permits, or allowances. Those advantages stem from two
factors: both the costs and benefits of reducing carbon
specifically toward the carbon content and would therefore be
somewhat less costeffective in discouraging carbon emissions.
2. The characteristics of such emissions permit systems are discussed
in greater detail in two studies published in 2000 and 2001 by the
Congressional Budget Office. Another CBO study, published in
2002, discusses the relative merits of different approaches to
regulating gasoline consumption, including a carbon tax.

CHAPTER FOUR TRADE-OFFS AMONG POLICY OPTIONS 37
emissions are uncertain, and the incremental costs can be
expected to rise much faster than the incremental benefits
fall as regulation becomes more restrictive. Because climate
change will result only from the longterm buildup of
gases over many years, incremental benefits are essentially
flat in any given year; that is, the incremental benefits of
the millionth ton of carbon reduced are essentially the
same as those of the billionth. In contrast, the incremental
costs of reducing emissions are likely to rise sharply the
more emissions are constrained.
3
Thus, choosing to strictly
limit the quantity of emissions could prove very expensive
compared with the potential benefits, but choosing to
impose a tax whose level reflected the expected benefits
probably would not. A pricing system—of either taxes
or fixedprice permits—is therefore likely to constrain
emissions more costeffectively than will a system with
fixed limits on emissions.
4
The Distributional Effects of Regulation
Regulatory systems generally create winners and losers,
even when the benefits of less pollution are ignored. Bal
ancing the distributional effects of such systems can be
more complicated and controversial than balancing their
costs and benefits. Economic analysis provides several
useful insights about the distributional issues involved in
regulating greenhouse gas emissions.
5
Regulations Impose Costs
Regulations come with a price: one way or another, some
one ends up paying for the environmental benefits they
may generate. Households and firms, for instance, may
have to make do with less energy, paying higher prices
either directly or indirectly (in the form of lower wages,
salaries, and profits)—or both.
Some analysts have argued that the regulation of energy
markets might not be costly because energy conservation
pays for itself. According to that point of view, people fail
to use energy efficiently, either because they do not make
sensible decisions about energy use or because they are
poorly informed, or because they face a variety of market
failures or barriers that deter them from making more
sensible decisions or becoming better informed. Propo
nents of that view believe that the government may be able
to regulate energy use and emissions at a net savings to
the economy by providing information, overcoming
market barriers, and correcting market failures—for ex
ample, by including energyefficiency requirements in
standards governing buildings and appliances—and that
the resulting energy savings may more than pay for the
additional costs of moreefficient equipment.
6
Although energy markets do not necessarily function with
textbook perfection—for instance, energy use produces
pollution, the electricity distribution system is largely
composed of regulated monopolies, and the electricity
industry remains heavily regulated—neither are govern
ments always able to correct energy market failures with
out imposing other costs that offset or even exceed the
savings that the corrections might achieve. For example,
inefficient electricity consumption is sometimes the result
of regulations that are intended to prevent monopoly
behavior by utilities. Nevertheless, governments may be
able to intervene in some circumstances—for instance,
by setting standards in markets in which reliable product
information is hard to obtain or in situations in which
specific regulatory failures may constrain businesses and
households from making the most costeffective capital
3. In technical terms, price controls dominate when the marginal cost
curve is steep or very uncertain and the marginal benefit curve is
flat; quantity controls dominate when the marginal cost curve is
flat or well understood and the marginal benefit curve is steep.
A permit system would be more appropriate than a tax system if
the unit cost of reducing emissions was relatively constant while
the incremental damages from emissions increased very quickly
with rising emissions levels. Weitzman (1974) and Pizer (1997,
1998, 1999) discuss these issues in more detail.
4. The balance could shift in favor of a strict permit system if
technological advances made large reductions in emissions possible
at a low unit cost that was more or less fixed.
5. Congressional Budget Office (2000) discusses the distributional
impacts of different control policies for greenhouse gases.
6. Sutherland (2000, pp. 89112) examines the differences between
this “energy conservation” view and that of mainstream economics.
A recent report from the energy conservation standpoint, prepared
by five U.S. Department of Energy national laboratories, can be
found in Interlaboratory Working Group (2000). The Energy
Modeling Forum, in a 1996 report, offers a comprehensive
discussion of the difficulties of identifying and measuring market
failures and barriers in the energy sector.

38 THE ECONOMICS OF CLIMATE CHANGE: A PRIMER
investments. Economists find it difficult, however, to
determine the circumstances in which standards clearly
induce people to reduce their use of energy at no cost or
with net savings.
7
Consumers Bear Most of the Direct Costs
in the Long Run
Producers who are required to pay a tax will not neces
sarily bear the burden of the tax if they can pass it on to
others. Characteristics of the markets for fossil fuels would
enable producers to pass on most of the costs of emissions
taxes—or the burden of higher prices under a permit sys
tem—to consumers.
8
Nevertheless, producers would still bear some of those
costs in the short run. And many firms and workers in
the energy sector—coal mine operators and miners, oil
companies, and electricity producers that rely on fossil
fuels for generation—would bear a disproportionate
burden in lost profits and wages. (In the oil sector, how
ever, foreign oil producers would probably bear a signifi
cant portion of those losses.) So would companies and
workers in energyintensive industries such as petroleum
refining, primary metals, chemicals, and paper.
9
In con
trast, alternative energy suppliers would tend to benefit
from higher demand for their products, as would natural
gas producers (since natural gas contains much less carbon
per unit of energy than coal does).
Regulations and Taxes Have Substantial
Distributional Effects
A third important insight is that the distributional conse
quences of pricing and permit systems can be very large
compared with their costs and benefits. Whenever the gov
ernment restricts something of value, people will bid up
the market price in trying to obtain it. The difference be
tween the supply, or production, price and the higher
market price is known as a scarcity rent.
If the government restricts emissions by imposing a tax,
it will receive the scarcity rent as tax revenues. By contrast,
if it imposes a permit system and gives the permits away,
the permits’ recipients will receive the scarcity rents as
higher profits—because they can either charge higher
prices for the fuel they sell or sell the permit. The income
received as tax revenue or scarcity rents can be many times
larger than the net efficiency loss.
10
One important conse
quence of that fact is that efforts to restrict emissions may
encourage the affected parties to seek regulatory provisions
7. In recent years, the U.S. government has tried to restrain the
growth of emissions through a system of voluntary programs that
attempt to identify opportunities for lowcost or costless emissions
reductions and to promote them in the private sector. However,
the programs have not been very successful in controlling emissions.
For example, the Climate Change Action Plan developed in 1993
by the Executive Office of the President projected that voluntary
programs would nearly stabilize U.S. greenhouse gas emissions at
1990 levels in 2000. (The plan is available at www.gcrio.org/
USCCAP/toc.html.) In fact, emissions were roughly 12 percent
higher in 2000 than they had been at the beginning of the decade.
The plan’s failure was due in part to unexpectedly high levels of
economic growth and low energy prices. Nevertheless, the voluntary
programs’ successes are very difficult to evaluate because it is nearly
impossible to determine what businesses and households would
have done in the absence of the program. Welch, Mazur, and
Bretschneider (2000) present a rigorous study that concludes that
one such program had relatively little effect on emissions.
8. The supply of fossil energy is fairly elastic: for example, coal sup
pliers can easily raise or lower their production in response to small
changes in coal prices. Moreover, demand for fossil energy is fairly
inelastic because currently there are few cheap, plentiful substitutes
for it. Inelastic demand and elastic supply together imply that
energy producers can pass on taxes to consumers.
9. The Department of Energy (1997) notes that those four industries
accounted for about 22 percent of manufacturing gross product
originating in 1994 but 78 percent of manufacturing energy use.
Yuskavage (1996) also treats this issue; updated data can be found
at www.bea.doc.gov/bea/dn2/gpo.htm.
10. Tax revenues equal total emissions under the tax times the tax,
whereas the net economic costs from the tax (called the efficiency
loss, or the deadweight loss) are roughly onehalf the tax times the
reduction in emissions. A higher tax raises more revenues, but it
reduces emissions even more; so the income loss rises faster than
the tax revenues, and the ratio of revenues to income loss declines.
For example, based on the analysis of the potential costs of the
Kyoto Protocol by Lasky (forthcoming), a reduction of 5 percent
in U.S. carbon dioxide emissions in 2010 would involve direct costs
of just over $1 billion but would raise almost $50 billion in reve
nues. However, a reduction of 15 percent would cost $12 billion
(10 times as much) and raise over $150 billion in revenues (less
than four times as much); a reduction of 30 percent would cost
almost $60 billion and raise $330 billion in revenues. In those
examples, tax revenues (or permit values) are between six and 40
times the direct costs.

CHAPTER FOUR TRADE-OFFS AMONG POLICY OPTIONS 39
that provide them with tax exemptions or access to per
mits—that is, they may engage in rentseeking behavior.
For example, fossil fuel suppliers might advocate a system
in which they were given emissions permits free of charge
—so that they would receive the entire scarcity rent re
sulting from the emissions limits.
Distributional Effects Depend on How the
Government Regulates Emissions
Under a system of taxes or auctioned permits, the govern
ment would receive revenues, and it could redistribute
some of them in various ways—by cutting other taxes,
reducing government debt, or funding new programs.
11
Each method of “recycling,” or returning revenues to the
economy, would benefit different groups of consumers
and suppliers in different ways. Some of those approaches
could offset some of the costs of regulation but probably
not all of them.
The cas e o f permits is m or e c om pli ca ted tha n th at o f taxes
because permits can be distributed in different ways: the
government could auction them and receive revenues, it
could give the permits away, or it could use a combination
of the two approaches.
12
Auctioned permits are similar
to emissions taxes in their distributional effects.
13
In
contrast, freely allocated emissions permits would greatly
benefit their recipients, who could reap profits from the
nowscarce right to sell fossil fuels (while passing on most
of the costs to fuelconsuming businesses and households)
or from the sale of permits to a fuel supplier. One possible
approach to a permit system, known as grandfathering,
would be to give all the permits to fossil fuel suppliers in
proportion to their historical sales. Another method would
be to distribute permits free to households and require
that fuel suppliers buy them. Suppliers would then include
the cost of the permits in the price of fuel. That approach
would spread regulatory costs more evenly across the
population but would also involve high transaction costs.
Alternative Uses of Revenues
Most government revenues are collected from income,
payroll, and sales taxes, which tend to distort taxpayers’
behavior by discouraging people from working or saving.
The government also uses tax incentives to encourage
certain types of activities—for example, home ownership,
through the home mortgage interest deduction. Such
subsidies distort households’ and businesses’ behavior by
encouraging greater spending on taxfavored goods and
services, relative to spending on other items. In economic
terms, taxes and tax incentives impose significant losses
of economic efficiency.
14
In contrast, emissions restrictions are intended to correct
existing market failures—and thus improve economic effi
ciency—by discouraging harmful emissions. (When those
restrictions take the form of taxes, they are referred to as
Pigouvian taxes.) Of course, the restrictions also discour
age productive activity to some degree and so impose a
direct cost on the economy. However, if the restrictions
11. Not all of the revenues from an emissions tax would be available
for redistribution. The tax would curb economic activity, reducing
other tax revenues and raising government spending for income
related programs. The tax would also raise the government’s costs
for purchasing fossil energy and energyintensive goods. As a conse
quence, some emissions tax revenues would be needed to cover
higher spending and lost revenues from other taxes. However,
emissions tax revenues would generally be greater than policy
induced increases in government expenditures and revenue losses
from other taxes, so net government revenues available for redis
tribution would rise.
12. Regarding auctions of permits for greenhouse gas emissions,
Crampton and Kerr (1998) show that a standard ascendingclock
auction is the most effective system to ensure that all bidders pay
a uniform price that reflects the market value of the standard emis
sions permit. Under that kind of system, the auction would begin
at a low asking price, and in each succeeding round, the price would
rise and bidders would reveal the number of permits they wanted
to buy at that price. The process would continue until the number
of permits demanded was exactly equal to the number being
auctioned.
13. Even if the government gave permits away, it would collect some
revenues because permit recipients would pay taxes on their higher
income. However, the government would also lose revenues from
other taxes and would spend more on transfers, fossil energy, and
energyintensive goods.
14. Congressional Budget Office (1996) and Gravelle (1994) examine
the distorting effects of taxes on labor supply and on saving and
investment, respectively.

40 THE ECONOMICS OF CLIMATE CHANGE: A PRIMER
were set at an appropriate level, their cost would be bal
anced by the benefits of lower levels of emissions.
But there is a catch: emissions controls—be they taxes,
permits, or oldfashioned commandandcontrol regula
tions—also interact with the existing tax system and tend
to aggravate its distortions. For instance, emissions restric
tions would raise the prices of energyintensive products,
thus lowering real (inflationadjusted) wages and further
discouraging people from working. Through that sort of
tax interaction effect, any regulation that raised the prices
of products and lowered income would also impose
additional, hidden costs by enhancing the distortions
caused by the existing tax system. The more distortionary
the existing system, the larger the interaction effect—and
the higher the hidden costs—tend to be.
15
However, policymakers could offset at least part of the
interaction effect by using the revenues from the emissions
tax (or auctioned permits) to reduce the marginal rates—
the rate on an additional dollar of taxed activity—of some
existing distortionary taxes.
16
Some analysts (for example,
17
Jorgenson and Goettle, 2000, and Shackleton and others,
1993) argue that emissions taxes could even yield a
“double dividend” of fewer emissions and more output
if the revenues were used to eliminate particularly distor
tionary taxes in the current code—especially taxes that dis
courage saving and investment.
17
The existing research
on the question is not definitive, however.
Emissions restrictions that raised revenues, coupled with
reductions in distortionary marginal tax rates, would im
pose significantly lower economic costs than emissions
controls would in two circumstances: if the controls did
not raise revenues (as in the cases of commandandcontrol
regulations or freely allocated permits) or if they returned
revenues to the economy in ways that did not reduce dis
tortionary marginal rates. Policymakers would face a trade
off between using such revenues to offset some of the
distributional effects of emissions controls (by making
payments to affected producers and consumers) and using
the revenues to offset some of the controls’ effects on eco
nomic efficiency (by reducing marginal tax rates). As a
general rule, policymakers cannot fully achieve both goals.
These points are true for any sort of regulation, but they
are particularly applicable to climate change policy because
greenhouse gas regulations could involve so much money.
The United States alone emits roughly 1.5 billion metric
tons of carbon annually, so every dollar of tax per mtc
would raise up to $1.5 billion per year. A carbon tax of
$100 per mtc would raise about 15 percent as much reve
nue as the individual income tax and nearly 80 percent
as much as the corporate income tax. Those large amounts
suggest that some of the revenues from a carbon tax could
be used to finance cuts in marginal income tax rates.
Emissions could also be reduced by eliminating subsidies
and tax incentives that encouraged the production and
consumption of fossil fuels or that encouraged deforesta
tion. In the United States, such subsidies and incentives
are fairly modest, and removing them would have rela
tively little impact on emissions (Congressional Budget
Office, 1990).
18
But many developing countries heavily
15. For discussions of the tax interaction effect, see Congressional
Budget Office (2001), Parry (1997, 2002), Parry and Bento (1999),
Parry and Oates (1998), and Parry, Williams, and Goulder (1996).
16. That “revenue recycling” effect could be particularly strong in the
presence of tax incentives such as the home mortgage interest
deduction (see Parry, 2002). However, as discussed in Babiker,
Metcalf, and Reilly (2002), if the existing tax system was sufficiently
distortionary, some forms of revenue recycling might actually en
hance the interaction effect, so that the negative economic effects
of the emissions tax would actually outweigh the positive environ
mental benefits.
17. Proponents of the “strong” version of the hypothesis argue that
substituting appropriately set environmental fees for existing taxes
would more than offset the tax interaction effect and thus improve
both the environment and the economy. Proponents of the “weak”
version argue that such a substitution would offset at least part of
the tax interaction effect. The potential for a double dividend de
pends mainly on the distortions of the existing tax system and is
thus more a statement about the existing system than about the
benefits of emissions taxes. In principle, policymakers could also
reduce the existing system’s distortions by replacing it with other,
less distortionary taxes. That alternative would tend to lower the
potential for a double dividend from an emissions tax.
18. Using a conservative definition, the Department of Energy’s Energy
Information Administration (1992, 2000) estimates that federal
subsidies and tax incentives to the energy sector amounted to about

CHAPTER FOUR TRADE-OFFS AMONG POLICY OPTIONS 41
subsidize energy use and land development. In those
economies, the elimination of subsidies might lead to both
reduced emissions and higher output.
Proposals for emissions taxes sometimes include a provi
sion that the revenues be used for environmental purposes,
such as an investment tax credit for energyefficient equip
ment. Some studies suggest that such tax credits are con
siderably more effective than equivalent energy price
changes in encouraging users to purchase such equipment,
perhaps because purchasers focus more on upfront capital
costs than on longerterm operating costs or because they
are more uncertain about longerterm costs (see Jaffe,
Newell, and Stavins, 2000, pp. 5152 and 63).
However, such tax credits also have disadvantages. An
emissions tax is intended to signal polluters to cut emis
sions; in effect, a tax credit for abatement distorts that
message. Tax credits can cost the government a great deal
per unit of reduced emissions, since purchasers who would
have bought the equipment even without the credit receive
it, too. Taken together, the literature on environmental
taxation and revenue recycling suggests that using revenues
from emissions taxes to finance a general reduction in taxes
on all sorts of investment would be more costeffective
than using them to target investments for environmental
purposes (Oates, 1992; and Baumol and Oates, 1988).
19
Regulation and Innovation
To a great extent, the cost of controlling greenhouse gas
emissions and stabilizing atmospheric concentrations will
ultimately depend on technological developments over
the next century. Innovation that dramatically reduces the
cost of producing energy from nonfossil sources or of
sequestering carbon dioxide emissions will ease the process
of controlling emissions; innovation that tends to reduce
the cost of finding, extracting, and using fossil fuels will
complicate it.
Although technological innovations over the long run are
impossible to predict with any reliability, relative energy
prices have influenced the direction and pace of research
and development (R&D). For instance, when energy
prices rose in the 1970s, not only did people use less en
ergy and install more energyefficient capital goods but
businesses shifted resources into the development of
energyefficient equipment, moreefficient ways of finding
and extracting fossil fuels, and alternative energy sources
(Newell, Jaffe, and Stavins, 1998; Jaffe, Newell, and
Stavins, 2000; and Popp, 2001).
20
Emissions controls that raised the prices of fossil fuels
would be likely to have somewhat similar effects, tending
to redirect R&D efforts from finding more fossil fuels to
improving energy efficiency, developing alternative sources
of energy, and removing greenhouse gases from the atmo
sphere. Over time, those efforts would tend to lower the
incremental cost of controlling emissions, reducing the
tax (or permit price) needed to achieve a given emissions
target and inducing more reductions at a given tax rate.
Moreover, emissions controls are likely to induce more
innovation if they exact a payment from emitters, as emis
sions taxes and auctioned permits do. In contrast, com
panies would have less incentive to innovate under a sys
tem of freely allocated permits—and even less under a
commandandcontrol regulatory system.
21
Although the inducement effect would tend to lessen the
incremental costs of controlling emissions, analysis sug
gests that such benefits would be offset to some extent by
the costs of research and development (Goulder and
Schneider, 1996). Some of the resources used to finance
R&D projects would simply be redirected from the fossil
$7.3 billion in 1992 and $6.2 billion in 1999 (both in 1999 dol
lars)—or roughly 1 percent of total energy expenditures. Applying
a much broader definition, a study funded by the Alliance to Save
Energy and reported by Koplow (1993) estimates that subsidies
in 1989 totaled from $21 billion to $36 billion in 1989 dollars—or
from 5 percent to 8 percent of total energy expenditures.
19. Gravelle (1994, Chapter 5) provides a broader discussion of the
costeffectiveness of investment tax credits.
20. Some research—for example, Nordhaus’s 1997 study—suggests
that the innovation inducement effect of higher energy prices will
not be very large, compared with the more basic inducement to
substitute capital and labor for energy.
21. Under certain circumstances, which are discussed at length in
Fischer, Parry, and Pizer (1998), freely allocated permits may
induce more innovation than taxes or auctioned permits. However,
the case of climate change does not involve such circumstances.
42 THE ECONOMICS OF CLIMATE CHANGE: A PRIMER
fuel sector, but some would probably be redirected from
other economic activities.
Basic research is often considered to be a public good.
Private firms have relatively little incentive to undertake
basic scientific research on the functioning of the climate
or on the costs and benefits of averting climate change
because they cannot easily reap profits from the wide
spread, longterm public benefits of learning about or
averting such change. Nor does industry have sufficient
incentive to develop lowemissions and emissionsfree
energy technologies as long as the prices of fossil fuels do
not reflect the potential costs of the damages to the climate
that fossil fuel use may cause. Because of the disparity be
tween private incentives and public benefits, the govern
m ent may be a bl e to pl ay a us ef ul rol e b y i nvesti ng in— or
encouraging private industry to invest in—basic and
applied R&D projects that will yield widespread public
benefits. However, constraints on emissions would tend
to enhance private incentives to undertake such projects
and weaken that rationale for governmentsponsored
research.
Ancillary Benefits of Greenhouse
Gas Restrictions
By reducing the use of fossil fuels, restrictions on green
house gas emissions would also reduce emissions of other
pollutants such as sulfur dioxide from coal burning and
nitrous oxide from automobiles. Those reductions, in
turn, could yield a variety of benefits such as improve
ments in health, visibility, and water quality. Thus, the
costs of mitigating emissions of greenhouse gases would
be p ar ti al ly of fs et by the an ci lla ry ben ef it s o f red uc in g the
problems caused by conventional pollutants.
In the United States, some economic studies (for example,
Burtraw and others, 1999; and Burtraw and Toman,
1997) have found that ancillary benefits from modest
restrictions on carbon dioxide emissions in the electric
utility sector could offset a significant part of the restric
tions’ cost. Those side benefits would include lower costs
for complying with current and impending regulations
that restrict conventional air pollution, and healthrelated
benefits from reduced emissions of conventional pollutants
that are not already strictly controlled. Morerestrictive
limits on greenhouse gases could also lead to reductions
of conventional emissions beyond those already mandated,
yielding further ancillary benefits. However, the more
emissions were reduced, the smaller the share of total costs
that the ancillary benefits would offset—mainly because
the additional benefits from reducing conventional air
pollutants would decline while the additional cost of re
ducing carbon emissions would continue to rise.
In developed countries that already control pollution,
ancillary benefits from restricting greenhouse gas emissions
are likely to be similar to those found in the United States.
But in developing countries with extensive conventional
pollution problems that remain unaddressed, ancillary
benefits—such as improvements in people’s health—could
be significant.

5
International Coordination of Climate Policy
Because the causes of climate change are global,
the stabilization of greenhouse gas concentrations in the
atmosphere will ultimately require international coopera
tion. However, the nature of the climate problem will
make agreement difficult to reach. Nearterm, concen
trated costs of regulation combined with diffuse, long
term future benefits make it easy for countries to postpone
action. The scientific and economic uncertainty discussed
in earlier chapters also makes it difficult to reach a con
sensus about the appropriate response. Although nations
have found it relatively easy to agree to ex pand , coordinate,
and report climaterelated scientific and technological re
search, they have found it very hard to agree about whether
and how much to restrict the growth of greenhouse gas
emissions.
That lack of agreem ent m ay s tem in part from uncertainty,
but it also reflects nations’ differing circumstances and
conflicting interests. Policymakers in countries vulnerable
to potential changes in climate favor dramatic action to
avert warming, while policymakers whose countries appear
to be less vulnerable are correspondingly less concerned.
Countries with significant fossilfuel production or high
levels of emissions tend to oppose policies that would re
strict the use of fossil fuels. Five countries (the United
States, China, Russia, Saudi Arabia, and Canada) produce
more than half of the world’s fossil carbon, and five coun
tries (the United States, China, Russia, Japan, and India)
account for about half of all fossil carbon consumption.
Thus, a small group of nations can strongly influence the
structure and effectiveness of any agreement related to
climate change.
But the fundamental differences at the global level are
between more and less affluent countries. Developed
countries have contributed the majority of historical
emissions, but countries that are now in the early stages
of development will account for the bulk of emissions over
the next century. Even so, on a per capita basis, developing
countries will continue to have much lower income and
levels of emissions than developed countries will have, and
they appear to be m ore vulnerable to damage from clim ate
change. As a consequence, policymakers in many devel
oping countries favor significant action to reduce global
emissions—but only by developed nations. Put another
way, they maintain that developed countries have already
used up a large portion of their rightful allotment of emis
sions and that developing countries now have a strong
claim to the bulk of emissions to be allowed in the future
—those that are unlikely to cause serious damage to the
climate.
Because of the global nature of the climate problem and
competing national interests, countries have little incentive
to act unilaterally to reduce emissions, and every nation
has an incentive to free ride and let other countries
shoulder most of the burden. As a result, the development
of effective coordination of international climate policy
is likely to be gradual, as was the 50year process that
brought the World Trade Organization to its current
form.
International Policy Considerations
In addition to considering the nature of the climate change
problem and the distribution of interests, policymakers
CHAPTER

44 THE ECONOMICS OF CLIMATE CHANGE: A PRIMER
who seek to foster effective international coordination may
draw from a wide range of past experience in the design
and implementation of international environmental and
other treaties, and of domestic regulatory systems as well.
Some of the factors to be considered are purely inter
national in scope. Other factors, which have been dis
cussed in previous chapters, are common to domestic and
international regulatory systems alike.
Cooperation among sovereign, independent nations can
involve a variety of formal structures. Governments can
agree to formal treaties, which are considered binding
instruments under international law; or they can agree to
less rigorous, nonbinding instruments—referred to as ex
ecutive agreements in the United States—that serve as
guidelines to action rather than as legal requirements.
1
Cooperation can range from modest commitments to
share information and undertake coordinated research,
to more extensive agreements to restrict emissions, moni
tor compliance, and enforce penalties.
Several other institutional considerations can influence
the effectiveness of international agreements (Victor and
others, 1998). Such agreements tend to be more effective
when they:
• Encourage relatively frequent interaction and extensive
sharing of information among national delegates;
• Help link the solutions of related problems, such as
climate change and energy security or climate change
and biodiversity;
• Give countries incentives to continue to participate
even if other countries refuse to;
• Allow new countries to enter with relatively little effect
on the system; and
• Distribute the cost of the response in a way that is
acceptable to participating countries.
Regulatory Approaches
To regulate the global growth of emissions, international
negotiators can draw on essentially the same set of options
as domestic policymakers can: commandandcontrol
regulations, emissions taxes or permits, or a hybrid system.
Negotiators would need to consider whether and how to
coordinate such policies among countries. Alternatively,
they might allow each country to choose an independent
system but still coordinate action in the form of agreed
upon national targets.
As Victor and others (1998) have noted, agreements are
more likely to succeed if they involve commitments that
are relatively straightforward to apply and enforce. Nations
may find it easier to commit to undertake research pro
grams than to adopt uniform technologies, complex regu
latory policies, or specific targets for emissions. Targets
m ay be p ar ti cul ar ly di ffi cu lt to decide on o r achi eve in the
face of uncertainty about implementation costs.
Past international agreements have called for varying levels
of effort by different countries, but they have not usually
called for formally differentiated commitments. Instead,
countries tend to interpret their commitments in ways
that reflect their different national circumstances and
domestic goals. Given the complexities that policymakers
face in securing domestic political agreement about im
plementation, the more ambitious the commitments, the
more varied the implementations are likely to be.
Countries with relatively large absolute or per capita emis
sions, or with large fossilfuel industries, are likely to insist
on some degree of costeffectiveness before committing
themselves to restrictions on emissions—although political
and distributional considerations may lead nations to ig
nore costeffectiveness. An international commandand
control approach would be much more costly and difficult
to monitor and enforce than would other approaches and
is therefore unlikely to secure much backing.
Uniform international incentives are likely to be more
costeffective than countryspecific regulations because
every country has at least some lowcost opportunities to
reduce emissions, whereas the incremental cost of con
trolling emissions in any given country is likely to rise
steeply with increasingly tight restrictions. Developing
countries have particularly extensive lowcost opportuni
1. This distinction is particularly important in the United States,
where the terms of treaties, once ratified, take on the force of federal
legislation within the U.S. legal system. Under international law,
however, both types of agreements are considered binding.
CHAPTER FIVE INTERNATIONAL COORDINATION OF CLIMATE POLICY 45
ties, for several reasons: many of the costs of production
there tend to be relatively low; energy use is rarely taxed
and often subsidized; and energy efficiency is cheaper to
build into new infrastructure in developing industries than
to retrofit in industries in developed nations. Restricting
emissions in only a few countries—particularly developed
ones—would therefore significantly raise the cost of
achieving almost any global goal for emissions.
Differences between countries’ emissions control policies
can also lead to “leakage” of energy consumption—and
therefore emissions—from one country to another. For
instance, if only developed countries controlled emissions,
they would consume less oil. International oil prices would
fall in response, and developing countries would be able
to increase their oil consumption. Similarly, corporations
in emissionsintensive industries could simply reduce their
investments in countries with stricter controls and increase
their investments in countries with less strict or no con
trols, gradually transferring their production to them. That
potential leakage effect would raise the cost and reduce
the effectiveness of morerestrictive countries’ commit
ments.
Independent action would allow each country to tailor
policies to its national circumstances. But a system of inde
pendent approaches would still require international agree
ment about what constituted an acceptable degree of
action and of burden sharing. It would also be unlikely
to minimize emissions control costs, could lead to exten
sive leakage, and might present difficult problems in
monitoring and enforcement.
Much of the debate about international climate policy has
focused on national quotas, or allowances, for emissions.
Under such a system, nations would agree to allocate emis
sions rights in the form of strict limits, or caps. The limits
could apply to one, five, or 10year periods, or indefi
nitely; nations would be free to meet the caps by using
the domestic regulatory system of their choice. Some pro
posals would allow nations to trade emissions allowances.
That feature would tend to equalize permit prices—and
thus the incremental costs of mitigation—among partici
pating countries and result in the most costeffective
achievement of the overall emissions cap.
A system of quotas would make the international alloca
tion of rights transparent. If quotas could be enforced,
they would ensure that a strict emissions cap was met in
participating countries. Given a strict limit, the inter
national trading of emissions allowances could equalize
incremental costs, and the system would be relatively
straightforward to implement—at least it would be if it
was limited to carbon dioxide from fossil fuels—once
countries determined how to allocate emissions allowances
domestically.
However, an international cap on emissions could entail
unnecessarily high costs if the cap was tighter than was
warranted for balancing the overall costs and benefits of
averting climate change. That pitfall could be avoided by
implementing a hybrid permit system with a price cap
—but only at the cost of abandoning strict emissions
limits and clear emissions rights.
In contrast to quotas, a price mechanism—a system of
uniform emissions taxes or fixedprice permits—would
guarantee equal incremental costs for emissions controls
at a fixed price without requiring any international trading
of emissions allowances. Furthermore, as discussed in
Chapter 4, price mechanisms are likely to constrain emis
sions more costeffectively than strict quotas, given the
uncertainty about the net benefits of doing so.
But price mechanisms also present problems. A system
of taxes would not, by itself, address issues of international
burden sharing. And maintaining strictly uniform taxes
on emissions would be difficult in the face of fluctuating
exchange rates. Moreover, in negotiating a uniform price
mechanism, countries might want to consider the exten
sive variation in their existing energy taxes: even in the
absence of price or quantitybased controls, the effective
price of carbon from fossil fuels differs significantly among
countries and across fuels. Gasoline prices in western
European countries, for example, are about three times
higher, on average, than in the United States, largely be
cause of taxes. In contrast, gasoline prices in many devel
oping countries are lower. Countries that implicitly taxed
emissions through their gasoline levies might argue that
their existing systems constituted sufficient action and no
further efforts were necessary.

46 THE ECONOMICS OF CLIMATE CHANGE: A PRIMER
Compliance
International agreements are particularly difficult to moni
tor and enforce because the parties to them are sovereign
nations that tend to resist international oversight of do
mestic policies—and whose participation is ultimately vol
untary. Few international environmental agreements have
provisions for enforcement, and as a general rule, inter
national organizations lack the jurisdiction or the resources
to enforce them (General Accounting Office, 1999). To
many observers, binding treaties with penalties seem more
likely than nonbinding ones to ensure compliance, and
experience shows that nearly all countries do, in fact, fulfill
their binding commitments. However, given the uncer
tainty of politics and markets, governments cannot in
variably ensure that they will be able to meet such com
mitments. They generally do so, not because they would
face penalties for noncompliance but because they would
not have agreed in the first place to commitments that
they were unlikely to fulfill.
Some observers argue that for a problem as complex as
climate change, international enforcement would require
some form of penalty that involved trade and therefore
indirectly the World Trade Organization (WTO). Recent
decisions by the WTO have allowed nations to enforce
environmental rules by penalizing imports on the basis
of the processes used in their production (Victor, 2001,
pp. 8789). But some experts worry that entangling the
WTO in complex environmental issues could endanger
the international trade system.
Yet experience also shows that countries tend to be more
willing to adopt clear, ambitious commitments when those
commitments are nonbinding, especially when uncertainty
about costs makes nations unwilling to accept binding
agreements that they might not be able to fulfill. (Escape
clauses in binding commitments can perform the same
function.) Moreover, a nonbinding framework allows
subsets of countries to undertake deeper cooperation with
out excluding others from an agreement and promotes
learning by doing. The evidence thus suggests that in
practice, nonbinding agreements may significantly influ
ence behavior (Victor and others, 1998, p. 685).
Restrictions on greenhouse gases vary in the ease with
which emissions can be monitored and the limits on them
enforced. Under binding agreements, carbon dioxide
emissions from the use of fossil fuels would be relatively
easy to monitor, although in countries that had serious
problems with law enforcement and tax evasion, compli
ance with the established limits could be difficult to
achieve. For most other types of greenhouse gas emissions,
the high costs of monitoring would reduce the likelihood
of strict compliance—or even of accurate documentation
—in all countries.
International Institutions to Address
Climate Change
International cooperation to address the prospect of
climate change has been developing since 1988, when the
United Nations and the World Meteorological Organiza
tion created the Intergovernmental Panel on Climate
Change (IPCC) to collect information and report on
climaterelated issues. Shortly thereafter, negotiations
began on the United Nations Framework Convention on
Climate Change (FCCC), which was signed in 1992 and
subsequently ratified by nearly all the world’s nations. The
convention provides for a permanent standing bureaucracy
dedicated to coordinating international climate policy and
for a Conference of the Parties to meet roughly once a year
to r ev iew and reco nsider countr ie s’ co mm itm ents in li ght
of the most recent findings on climate change.
The FCCC commits its signatories to undertake extensive
research (to better understand the climate system) and to
stabilize atmospheric concentrations of greenhouse gases
at levels that would prevent dangerous climate change.
The convention calls for managing the global climate in
a manner that is both efficient and equitable, stipulating
that climaterelated policies should be costeffective, but
it also urges greater effort from a set of 35 developed
countries that are listed in the FCCC’s Annex I.
2
However,
the convention does not specify any targets for greenhouse
gas concentrations or a time frame for achieving stabiliza
2. Specifically, the document states that “policies and measures should
be costeffective so as to ensure global benefits at the low est p ossi bl e
cost. To achieve this, such policies and measures should take into
account different socioeconomic contexts, be comprehensive, cover
all relevant sources, sinks and reservoirs of greenhouse gases and
adaptation, and comprise all economic sectors” (United Nations,
1997, article 3, section 3).

CHAPTER FIVE INTERNATIONAL COORDINATION OF CLIMATE POLICY 47
tion. Nor does it commit any country to specific limits
on emissions or to specific actions to reduce emissions.
The Kyoto Protocol
After five years of international negotiations following the
FCCC’s adoption, the third Conference of the Parties
adopted the 1997 Kyoto Protocol to the convention. The
protocol calls for strict quantitative limits (or allowances)
on emissions from 38 developed countries—largely the
same ones listed in Annex I of the convention.
3
Those
complicated limits, which are specified in Annex B of the
protocol, are generally somewhat below the countries’
1990 emissions levels and are scheduled to take effect dur
ing the socalled First Budget Period, from 2008 to 2012.
NonAnnex B countries remain exempt from overall emis
sions constraints.
Under the protocol, countries are allowed a significant
degree of flexibility in meeting their commitments. Each
country may:
• Use any policies or technologies it prefers to meet its
targets;
• Achieve its overall target by reducing emissions over
a “basket” of six different greenhouse gases rather than
just reducing carbon dioxide emissions;
• Average its emissions across the entire fiveyear period
rather than meet a specific target every year;
• Earn a limited quantity of credits (that is, additional
allowances) for forestry and agricultural projects that
sequester carbon;
• Receive credits by financing emissionsreducing proj
ects in other Annex B countries through a process
called Joint Implementation;
• Receive credits by financing projects in nonAnnex B
countries through another process known as the Clean
Development Mechanism;
• Buy, sell, or trade emissions allowances to an undeter
mined extent; and
• Join with other countries to reduce emissions as a
group.
4
The protocol explicitly mentions that countries should
pursue research and development programs but does not
require a specific level of expenditures.
To enter into force, the Kyoto Protocol must be accepted,
approved, acceded to, or ratified by at least 55 signatories
to the convention, including countries that together in
1990 accounted for at least 55 percent of total carbon
dioxide emissions from Annex I countries. In effect, the
provision means that the protocol must be ratified or ap
proved by either the United States or Russia, which to
gether accounted for over 50 percent of emissions from
Annex I countries in that year. It also means that a handful
of countries with high levels of emissions could, if they
acted together, effectively veto the protocol.
Subsequent Negotiations
The negotiations that followed those in Kyoto brought
a substantial shift in direction. Talks collapsed in 2000
over a dispute between U.S. and European delegates about
the use of international emissions trading and forestry pro
grams to meet their commitments, with the United States
arguing in favor of much greater flexibility than European
3. All of the countries listed in Annex B of the protocol are also listed
in Annex I of the FCCC; however, a handful of Annex I countries
are not in Annex B. The protocol specifies an annual limit on emis
sions, measured as metric tons of carbon equivalent for each An
nex B country. The limit is figured as a percentage of the country’s
baseyear emissions level. The base year is generally 1990, but
countries can choose 1995 as the base year for hydrofluorocarbons,
perfluorocarbons, and sulfur hexafluoride. In addition, former
Soviet bloc nations, under some circumstances, can choose an alter
nate base year for all gases. The specified limits are 93 percent of
baseyear emissions for the United States, 92 percent for the
countries of the old European Community, and 94 percent for
Japan. The countries of the former Soviet bloc have limits ranging
from 92 percent to 100 percent of their baseyear emissions levels.
Other Annex B countries have limits ranging from 92 percent to
108 percent of their baseyear emissions.
4. The countries of the European Union (EU), for example, intend
to meet their individual targets as a group, with some countries
reducing emissions by more than the amount required by their
targets to allow emissions to increase in other countries while still
meeting the overall EU cap.
48 THE ECONOMICS OF CLIMATE CHANGE: A PRIMER
countries would accept. In early 2001, the Bush Adminis
tration indicated that it would not continue to negotiate
the terms of the protocol or submit the protocol to the
Senate for ratification. Following the effective withdrawal
of the United States from the process, the other parties
decided to move ahead. In November 2001, they reached
agreement on nearly all outstanding implementation
issues, largely along the more liberal lines of interpretation
that the United States had originally advocated. (Without
U.S. participation to potentially drive up the demand for
emissions credits, the liberal interpretation allowed the
remaining parties to dramatically lower their likely imple
mentation costs; Babiker and others, 2002, provide a de
tailed discussion.) The European Union ratified the pro
tocol in May 2002, and Japan followed suit in June. As
of March 2003, 106 countries had ratified or acceded to
the protocol, and the ratifying countries accounted for
44 percent of the carbon dioxide emissions from Annex I
countries in 1990 (United Nations, 2003). Ratification
by Russia would bring the treaty into force.
Assuming ratification under the current terms of the pro
tocol, participating Annex B countries would probably
be able to meet their commitments at very little cost. They
would have two sources of lowcost emissions credits: they
could earn substantial credit for forestry projects, and they
could supplement reductions of domestic emissions with
purchases of emissions allowances and credits from other
countries. A few nations are expected to have substantial
amounts of surplus emissions allowances during the 2008
2012 period—particularly Russia and the Ukraine: their
emissions fell dramatically during the economic collapse
of the 1990s, and they have experienced substantial forest
growth. (The expected surplus is often referred to as “hot
air.”) Without U.S. participation to boost demand, the
remaining Annex B countries will be able to buy the sur
plus allowances and forestry credits at a low cost and meet
their commitments without undertaking extensive domes
tic emissions reductions.
The upshot of these developments—assuming ratification
and implementation by the remaining parties and full use
of the treaty’s many flexibility provisions—is that the pro
tocol will result in relatively few commitments to under
take research, a complex set of emissions caps for a limited
set of developed countries for the 20082012 period, fi
nancial transfers among the parties amounting to several
billion dollars per year for the purchase of emissions allow
ances, unlimited emissions rights for most countries, and
a very limited reduction in the growth of global green
house gas emissions.
Implementation Costs
The international negotiations surrounding the protocol
inspired a large number of analyses of the cost to the
United States of meeting its proposed commitments. Such
analyses are complicated by uncertainty about how the
details of implementation might have been negotiated in
an agreement that included the United States. In a recent
review of a number of studies, Lasky (forthcoming) has
estimated U.S. mitigation costs under three different sets
of implementation rules.
• Under moderately restrictive implementation rules—
that is, with some trading of emissions allowances
among Annex B countries and modest reductions in
emissions by nonAnnex B countries—Lasky estimates
that the United States could have met its Kyoto com
mitment in 2010 for an incremental cost ranging from
$44 to $245 per metric ton of carbon equivalent (in
2002 dollars) and an overall economic cost of between
0.4 percent and 1.5 percent of gross domestic product.
• Under a loose set of rules that permitted Annex B
countries to pay for large emissions reductions in non
Annex B countries and allowed extensive credit for the
net absorption of carbon dioxide by forests, the United
States would have been able to meet its targets at almost
no cost and with little effect on its economy.
• Under a very restrictive set of implementation rules
that prohibited international trading of emissions al
lowances or credits and permitted only limited credit
for forestry projects, the United States could have faced
incremental costs for emissions reductions ranging
from $171 to $297 per mtce. Annual tax revenues (or
the annual value of auctioned emissions permits) could
have totaled between $261 billion and $452 billion,
and the policy might have reduced GDP by nearly
2 percent.

CHAPTER FIVE INTERNATIONAL COORDINATION OF CLIMATE POLICY 49
Actions by the United States
Over the past 15 years, the federal government has made
substantial investments in research to understand the
global climate system and the potential effects of climate
change, and to subsidize the development of carbon
removal and alternative energy technologies. The United
States has also continued a variety of longstanding pro
grams that tend to discourage emissions or encourage the
removal of greenhouse gases from the atmosphere—but
that were originally intended to achieve other goals, such
as pollution reduction, energy independence, and the
limitation of soil erosion. The programs include corporate
average fuel economy (CAFE) standards, taxes on gasoline,
air quality improvement programs, and the Conservation
Reserve Program. However, the United States has not
adopted taxes or quotas that explicitly address the restraint
of greenhouse gas emissions.
After negotiating and signing the Kyoto Protocol in 1997,
the Clinton Administration did not offer it to the Senate
for ratification. It presented a plan for meeting the United
States’ commitment, but many analysts raised concerns
about whether the plan could accomplish its goal. The
Bush Administration, having withdrawn the United States
from subsequent protocol negotiations, has largely con
tinued the previous administration’s level of climate
related expenditures: the President’s budget for fiscal year
2003, for instance, proposed $4.5 billion of climate
related spending, with $1.7 billion dedicated to climate
science (including potential impacts of climate change)
and $1.3 billion to the development of energy and seques
tration technologies.
5
The Bush Administration currently
defines its goals in terms of a modest acceleration in the
rate of decline of emissions per dollar of GDP rather than
the achievement of an emissions target at some point in
the future.
6
In the meantime, and largely independently
of federal action, some states and firms are adopting
policies that are intended to reduce their emissions.
Alternative Approaches
The problems associated with the Kyoto Protocol have
inspired researchers to propose a variety of alternative
policies for coordinating international efforts related to
climate change. Each approach represents a distinct inter
pretation of the available evidence about the likely benefits
and costs of climate change, the uncertainty surrounding
it, and practical concerns about how climate policy would
affect domestic economies and the world economic sys
tem. Many of the approaches offer novel ways to address
the simultaneous problems of limiting emissions and dis
tributing the burden of regulation.
Some researchers (for example, Michaels, 2001) conclude
that the rate of climate change is likely to be at the low
end of the current range of estimates and the effects largely
benign, and they argue for a laissezfaire approach.
7
Such
a policy would take no affirmative steps to avert potential
damages from climate change or to develop institutions
to help coordinate international action.
Other analysts have proposed systems of emissions taxes
or tradable emissions permits with fixed prices to limit
the costs of mitigation. One such proposal envisages a sys
tem of auctioned emissions permits for the United States
5. The Clinton Administration’s policies are enumerated in Con
gressional Budget Office (1998), and the Bush Administration’s
in Executive Office of the President (2002). Relatively little sci
entific research is dedicated to understanding the potential effects
of climate change on society, the area that studies suggest would
yield the largest economic benefits. According to the National
Science and Technology Council (2001), the U.S. Global Change
Research Program allocated over 80 percent of its $1.6 billion
budget for fiscal year 2002 to basic climate science and less than
20 percent to research on the human and ecosystem dimensions
of climate change.
The federal government spent approximately $69 billion (in 2001
dollars) between 1978 and 2001 on energyrelated research and
development, with expenditure levels currently running at roughly
onethird of their pre1980 level. Roughly 41 percent of the cumu
lative spending was focused on nuclear energy, 27 percent on fossil
energy, and 32 percent on conservation and renewable energy. See
Department of Energy, Energy Information Administration (2000),
Table C1, pp. 114115, as well as the Budget of the United States
Government for fiscal year 2003, p. 171.
6. The Administration has released a draft research plan for comments
(Climate Change Science Program, 2002) and stated that it will
release a revised plan in June 2003.
7. In this view, the Framework Convention on Climate Change and
the Kyoto Protocol are “based on a naive interpretation of . . .
science” and their benefits are “undetectable.”

50 THE ECONOMICS OF CLIMATE CHANGE: A PRIMER
that would require producers to purchase permits for the
right to sell fossil fuels. The permits would be required
at the point of import or first sale, and the revenues would
be returned to households and states. The charge would
start at $25 per metric ton of carbon in 2002 and rise by
7 percent per year (after inflation) through 2007.
8
That
approach would be relatively costeffective, although it
would not be as costeffective as using the revenues to re
duce distortionary preexisting taxes. The option would
also address distributional concerns but only at the domes
tic level. A similar system could be envisaged for other
countries, and several proposals for an international system
call for both setting national targets for emissions and
establishing a maximum price (or “safety valve”) at which
governments provide additional permits for domestic
emissions (see Aldy, Orszag, and Stiglitz, 2001, pp. 2528;
McKibbin and Wilcoxen, 2002, pp. 199221; and Victor,
2001, pp. 101108).
Another researcher (Nordhaus, 1998) has proposed a sys
tem in which countries with per capita income of more
than $10,000 (in 1990 dollars) impose emissions taxes
on domestic sales of fossil fuels. Under that approach,
countries would use a complex voting scheme to decide
on a price path for emissions over time, and developing
countries would join the system once their per capita
annual income rose above the trigger level. Participating
nations would enforce the system through duties on im
ports from nonparticipating countries, which would be
levied on each such country in proportion to the carbon
content of its total exports. The approach has several ad
vantages: it provides a method for deciding on a uniform
emissions price in the face of conflicting views about the
appropriate price and allows for gradual implementation
and enforcement through international trade institutions.
For simplicity’s sake, the proposal ignores emissions from
nonfossilenergy sources and exempts countries with low
per capita income for distributional reasons. The system
would yield an estimated twothirds of the net benefits
that could be realized by an ideal system covering only
emissions from fossil energy use. Furthermore, nearly all
regions would share in the system’s beneficial effects on
the climate.
An alternative approach (Bradford, 2002) differs from the
preceding one by advocating explicit emissions rights, the
equivalent of a uniform international emissions tax, and,
at the same time, a system of international burden sharing
that would be institutionally separate from the allocation
of property rights. The approach calls for countries to
negotiate and agree on countryspecific, longterm, pro
jected “businessasusual” trends in emissions. For each
country, its agreedupon trend would serve as its emissions
quota, which it could allocate domestically as it saw fit.
Countries would also contribute financial resources to an
international bank that would purchase and retire emis
sions allowances from their owners at a fixed, negotiated
price, which could be renegotiated from time to time in
the light of new information. The approach thus involves
three elements: allocating emissions, determining a price
trajectory, and distributing burdens.
9
Yet another proposal (McKibbin and Wilcoxen, 2000,
2002) would create and distribute among nations two
related types of explicit property rights for emissions. A
longterm emissions endowment, which would be valid
in only one country, would give its owner a permanent
right to receive annual emissions permits. A limited num
ber of endowments would be allocated to each country
on the basis of the Kyoto targets for domestic distribution.
Each government could also sell an unlimited number
of permits every year at a price that would be fixed each
decade by international agreement. There would be no
international trading of emissions allowances or credits.
8. Kopp, Morgenstern, and Pizer (1997) describe the original proposal
by Resources for the Future (RFF), a nonprofit research group
specializing in environmental economics. Another version can be
found in Sky Trust (2000). According to RFF researchers’
estimates, the program would reduce U.S. emissions by roughly
16 percent in 2007, yielding a substantial fraction of the emissions
reductions needed to meet the original U.S. commitment under
the Kyoto Protocol. Using Lasky’s (forthcoming) estimates of U.S.
mitigation costs, that system would reduce emissions by between
5 percent and 8 percent. A number of other proposed domestic
programs are described in detail in Congressional Budget Office
(2000, 2001).
9. Short of controlling emissions directly, developed countries could
slow emissions growth in developing countries by helping finance
the installation of energyefficient and nonfossilenergy tech
nologies during the development proce ss. Su ch a pl an is p roposed
by Schelling (2002, p. 8).
CHAPTER FIVE INTERNATIONAL COORDINATION OF CLIMATE POLICY 51
The system would yield two distinct markets in every
country: a market for permits, with the permits’ price fixed
by international accord and their number determined by
market demand; and a market for endowments, with the
number of endowments set internationally and their price
determined by the market’s expectations about future
permit prices. If the demand for permits in a country rose
above the number of endowments in a given year, the gov
ernment would sell enough permits to meet demand at
the fixed price. If demand did not exceed the number of
endowments, the permits’ price would be lower.
To address developing countries’ distributional concerns,
Annex I countries would receive endowment levels that
were below their total current emissions; nonAnnex I
countries would receive endowments above their current
levels. That distribution would lead to different prices for
permits and endowments in the two groups of countries.
But even if developing countries’ permit prices were zero
in a given year, their endowments would reflect the per
mits’ expected future value—which would send a long
term signal to investors in those countries about the cost
of emissions in the future. That signal could help encour
age investment in energyefficient technologies and pro
cesses in the long term and discourage emissions “leakage”
from Annex I countries.
If the risks of climate change proved to be significant,
countries could negotiate an increasingly higher world
price for emissions that would gradually reduce each coun
try’s to the level of its endowments. After that, the coun
try’s government would have to buy back endowments
to further constrain emissions and be consistent with the
negotiated permit price.
By allowing different permit prices in different regions,
possibly for an extended period, the proposed system
would trade away some costeffectiveness to accommodate
distributional concerns. Governments could also address
domestic distributional concerns through their allocations
of emissions endowments. At the same time, the system
would build a constituency of endowment owners in both
developed and developing countries who would hold
property rights for emissions—and who would therefore
benefit from a rise in permit prices.
The system would be decentralized but coordinated
through the initial international allocation of endowments
and the establishment of permit prices. As a result, prob
lems in one country would generally not affect markets
for permits and endowments in others. The system would
be flexible eno ug h to a da pt bo th to ch ang ing political and
economic circumstances and to shifts in the rate of climate
change. Permit prices could be rapidly adjusted in re
sponse to new information, and endowment prices would
adjust accordingly. Countries could enter the system
simply by agreeing to an internationally negotiated emis
sions endowment and permit price, allocating their en
dowments domestically, and enforcing the fixedprice
permit system.


Economic Models and Climate Policy
The economics literature contains hundreds of esti
mates of the costs or benefits (or both) of slowing, miti
gating, or adapting to changes in the global climate result
ing from human activities. Those estimates are derived
mainly from a variety of computer models of economic
activity that have been developed for other purposes and
adapted to climate policy analysis. The variety of analytic
approaches used makes it difficult even for modelers to
interpret the differences among results from different
studies. Researchers and policymakers are forced to inte
grate information from many sources and develop a syn
thesis based on a range of studies and approaches, each
of which provides insight into some aspects of the problem
while ignoring others.
Like their climaterelated counterparts, modern models
of the economy are composed of systems of mathematical
equations that represent distinct but interacting processes
in the real world and that are solved together to represent
the simultaneous interaction of the parts within the whole.
Even the most complex models of the physical climate
or the economy inevitably lack detail. For example, many
studies focus on the costs of mitigating climate change
and ignore the potential benefits. Others focus only on
costs in one sector or only on certain kinds of costs. Engi
neering studies evaluate the direct costs associated with
adopting specific efficient technologies but tend to ignore
largerscale economic issues such as macroeconomic costs
and impacts on international trade. Economic studies at
tempt to include a wider range of direct and indirect eco
nomic costs associated with emissions controls or with
the effects of climate change, but they tend to use simple
representations of technology. Some integrated assessment
studies go further and try to incorporate both the costs
of mitigation and the economic impacts of climate change.
But to capture those very largescale aspects of the prob
lem, they rely on simplistic representations of many
economic and environmental details.
Types of Models
Economic analyses yield a wide range of cost estimates
for a given climate change mitigation policy, but most
of the variation in results is due to identifiable differences
in the approaches and assumptions that the studies use.
Many analyses use one of several “topdown” approaches
that represent the entire economy in an internally consis
tent way: they account for more or less all production and
consumption; inputs of capital, labor, and energy; invest
ment, taxes, and government spending; international
trade; prices; interest and exchange rates; and so on. Top
down approaches allow researchers to account for many
of the indirect economic effects of climate change policies
that would primarily affect markets for energy; but they
often ignore important details involving the gradual turn
over of energyusing equipment, the choice of equipment,
energy market barriers, and other factors. Nevertheless,
they tend to produce fairly reasonable projections of over
all energy use and thus emissions.
In contrast, “bottomup” models draw on engineering cost
studies to represent the details of specific energyrelated
technologies, but they tend to include much less detail
about nonenergy sectors and other aspects of the economy.
Unless constrained to do otherwise, bottomup models
always choose the most costeffective technologies (from
an engineering standpoint)—and therefore tend to pro
duce rather unrealistic results.
Topdown modeling approaches, which as a class are
sometimes referred to as macroeconomic models, generally
fall into one of two groups. The traditional macro
APPENDIX
54 THE ECONOMICS OF CLIMATE CHANGE: A PRIMER
econometric, or “macro,” forecasting models that make
up the first group are particularly useful in simulating the
gradual adjustment of the economy to various kinds of
shocks, such as changes in monetary and fiscal policy,
higher energy prices, and exchange rate fluctuations.
Macro models are particularly helpful in studying short
term (for example, fiveyear) responses and adjustments
to economic shocks, but they do not represent specific
markets in detail. Nor do they represent forwardlooking
expectations and behavior—an important element of eco
nomic activity, as discussed in the next section.
In contrast, computable general equilibrium (CGE)
models, which form the second group, are useful in ana
lyzing longterm responses to policies, over a decade or
more. Stateoftheart CGE models incorporate forward
looking behavior, fairly detailed markets for specific factors
and products, some types of gradual adjustment, aspects
of longrun growth and technological progress, and de
tailed representations of the tax system and of international
trade and finance. Some CGE models also include differ
ent groups and generations of households so that they can
analyze the distributional impacts of climate change poli
cies. Their disadvantage is that they do not capture gradual
adjustments or elements of the business cycle very well.
In particular, they have a hard time representing the grad
ual process through which industries and households re
place equipment that is outmoded by policy shifts (as
when consumers replaced cars that used leaded gas) and
the gradual process through which a market economy ad
justs to the economywide inflation that could result from
significant increases in energy prices brought on by re
stricting emissions.
Many researchers combine several different models within
a single modeling framework. For example, the Energy
Information Administration’s National Energy Modeling
System integrates a set of models of particular energy sec
tors, a national macroeconometric model, and an inter
national econometric model. Other frameworks add
models of the agriculture and forestry sectors to simulate
flows of carbon dioxide and methane in those areas of the
economy. Models that treat in detail the economy’s
energy or carbonintensive subsectors tend to provide
greater insight into those sectors’ responses to climate poli
cies than do less complex approaches.
Treatment of Expectations
One of the most complicated aspects of economics is that
peo pl e d ec ide w hat to do to day in part on the basi s of their
expectations about the future. Modeling people’s expecta
tions is crucial to forecasting, but there is no simple form
ula to describe how people form them. Economists
typically model expectations in one of two almost polar
ways. One method represents behavior as adaptive: in that
representation, people do not have an explicit under
standing of how the economy will evolve and simply
extrapolate from past experience into the future. The other
approach represents people’s behavior as forwardlooking,
which is also termed modelconsistent or rational: in that
representation, people correctly anticipate the future evolu
tion of the economy unless the modeler engineers an
explicit shock.
The assumption of adaptive behavior, which is generally
used in macroeconometric models, yields forecasts in
which people fail to anticipate known developments—for
example, they will fail to prepare for a change in policy
that is announced 10 years in advance. In contrast, the
assumption of forwardlooking behavior, which is used
in a number of sectoral and generalequilibrium models,
yields forecasts in which people perfectly anticipate all
developments. Both assumptions are extreme, and they
yield significantly different results.
When models with adaptive expectations are used to esti
mate the costs of a tax on emissions or a permit system,
they tend to produce somewhat higher cost estimates than
models with forwardlooking expectations, all else being
equal. That happens because people in forwardlooking
models have time to adapt to any policy that is announced
in advance. Modelers who use adaptive expectations adjust
for that limitation by gradually phasing in the policy, to
simulate the anticipation of forwardlooking individuals.
A more difficult problem for models that use adaptive ex
pectations is how to represent the gradual turnover of the
capital stock in response to a policy shift. A few modelers
combine adaptive and forwardlooking assumptions,
yielding results that in many ways are between the two
extremes.

APPENDIX ECONOMIC MODELS AND CLIMATE POLICY 55
Technological Change
To model future economic growth and the effects of emis
sions restrictions, modelers have to guess what kinds of
technologies are going to be available at various points
in the future and simulate their effects under scenarios
that include and exclude policies to reduce emissions.
Forecasting the use of particular technologies for the near
to medium term is relatively straightforward, for two rea
sons: much of the capital stock (especially energyusing
capital) lasts a long time, and innovations usually take a
fai rly long tim e to make t hei r w ay in to the m ar ket. Never
theless, analysts have often failed in the past to anticipate
technological advances that seem fairly obvious in retro
spect, such as the relatively rapid development of the Inter
net in the 1990s, or—an innovation that is closer to the
issue of climate change—the adoption of naturalgas
powered combinedcycle electricity generation. As fore
casters look forward over two or more decades, their ability
to anticipate technological developments becomes increas
ingly weak.
Most models represent the pace and direction of tech
nological change in a fairly simple way because the under
lying forces of change are not well understood. The models
typically assume that independent developments will grad
ually reduce the amount of capital, labor, and, in particu
lar, energy required to produce goods and services. The
process of reducing energy inputs per unit of output is
often represented by a parameter called the autonomous
energy efficiency improvement (AEEI) parameter.
1
For
given rates of growth of gross domestic product and
energy prices, an assumption of a higher AEEI implies
that energy efficiency will improve more quickly and
emissions will grow less quickly. A lower AEEI implies
the reverse. Such a model can be used to analyze how
changes in energy prices might encourage more or less use
of energy, relative to the autonomous trend. Somewhat
more complex models extend that basic process by pro
jecting a menu of technologies that are expected to be
available in the future and then analyzing how changes
in energy prices would encourage people to switch to more
energyefficient types of equipment.
However, as discussed in Chapter 4, technological devel
opments also respond to shifts in relative prices. Virtually
no model simulates the effect of energy prices on the
autonomous trend or on the menu of available tech
nologies. Although the size of that socalled inducement
effect is controversial, cost estimates that ignore it prob
ably overestimate the incremental cost of reducing
emissions over the longer run—say, 20 years or more.
Integrated Assessment
A consistent analysis of both the costs and benefits of
policies related to climate change requires a modeling
framework with certain characteristics: it should cover
national and international greenhouse gas emissions from
many sectors of the economy; it should translate emissions
of greenhouse gases into changes in the atmospheric and
global climate; and it should evaluate the impacts of
climate change on people and ecosystems. A number of
socalled integrated assessment models are under develop
ment, as are simplified reducedform models based on
more complicated frameworks. To analyze distributional
issues, some models separate the world into a number of
regions or include several overlapping generations of
households. A few of the models also incorporate a range
of uncertainty in their choice of parameters or in their
solution procedures (see Chapter 3).
1. The simpler models also use the same representation to account
for the fact that as people’s income rises, they use more and more
of it to buy services that do not require as much energy to produce
as do manufactured goods.


References
The references cited in this study, organized by chapter, are listed below.
Chapter 2
Alley, R.B., and others. 2003. “Abrupt Climate Change.” Science, vol. 299 (March 28), pp. 20052010.
Babiker, Mustafa, and others. 2001. The MIT Emissions Prediction and Policy Analysis (EPPA) Model: Revisions, Sensitivities,
and Comparisons of Results. Report no. 71. Cambridge, Mass.: Massachusetts Institute of Technology Joint Program
on the Science and Policy of Global Change.
Boyd, Philip W., and others. 2000. “A Mesoscale Phytoplankton Bloom in the Polar Southern Ocean Stimulated by Iron
Fertilization.” Nature, vol. 407 (October 12), pp. 695702.
Broecker, Wally S., and Sidney Hemming. 2001. “Climate Swings Come into Focus.” Science, vol. 294 (December 14),
pp. 23082309.
Carbon Dioxide Information Analysis Center. 2000. Trends Online: A Compendium of Data on Global Change. Oak Ridge,
Tenn.: Department of Energy, Oak Ridge National Laboratory, Carbon Dioxide Information Analysis Center. Available
at http://cdiac.esd.ornl.gov/trends/trends.htm.
Clark, Peter U., and others. 2001.“The Role of the Thermohaline Circulation in Abrupt Climate Change.” Nature, vol. 415
(February 21), pp. 863869.
Congressional Research Service. 2001. Global Climate Change Briefing Book. March 8. Available at www.congress.
gov/brbk/html/ebgcc1.shtml.
Crowley, Thomas J. 1996. “Remembrance of Things Past: Greenhouse Lessons from the Geologic Record.” Consequences,
vol. 2, no. 1, pp. 212.
Crowley, Thomas J., and Robert A. Berner. 2001. “CO
2
and Climate Change.” Science, vol. 292 (May 4), pp. 870872.
Department of Energy. 1997. CO
2
Capture, Reuse, and Storage Technologies for Mitigating Global Climate Change: A White
Paper. DOE Order no. DEAF2296PC01257. Prepared by Howard Herzog and others at the Massachusetts Institute
of Technology Energy Laboratory. January.
58 THE ECONOMICS OF CLIMATE CHANGE: A PRIMER
Department of Energy, Energy Information Administration. 2001. Annual Energy Review 2000. DOE/EIA0384 (2000).
Department of Energy, Energy Information Administration. 2002a. Annual Energy Review 2001. DOE/EIA0384(2001).
November.
Department of Energy, Energy Information Administration. 2002b. International Energy Outlook 2002. DOE/
EIA0484(2002). March.
Department of State. 2002. United States Climate Action Report 2002. May.
The Economist, “Economics Focus: Hot Potato, the Intergovernmental Panel on Climate Change Had Better Check Its
Calculations,” February 15, 2003, p. 72.
Edmonds, J. 2002. “Atmospheric Stabilization: Technology Needs, Opportunities, and Timing.” Pp. 4757 in J.A. Riggs,
ed., U.S. Policy on Climate Change: What Next? Aspen, Colo.: Aspen Institute. Available at www.aspeninstitute.org/
aspeninstitute/files/Img/EdmondsEEEClimate.pdf.
Falkowski, P., and others. 2000. “The Global Carbon Cycle: A Test of Our Knowledge of Earth as a System.” Science,
vol. 290, no. 5490 (October 13), pp. 291296.
Field, Christopher B. 2001.“Sharing the Garden.” Science, vol. 294 (December 21), pp. 24912492.
Ganopolski, Andrey, and Stefan Rahmstorf. 2001. “Rapid Changes of Glacial Climate Simulated in a Coupled Climate
Model.” Nature, vol. 409 (January 11), pp. 153158.
Heal, Geoffrey, and Bengt Kriström. 2002. “Uncertainty and Climate Change.” Environmental and Resource Economics,
vol. 22, pp. 339.
Hoerling, Martin, and Arun Kumar. 2003. “The Perfect Ocean for Drought.” Science, vol. 299 (January 31), pp. 691694.
HoltzEakin, Douglas, and Thomas M. Selden. 1995. “Stoking the Fires? CO
2
Emissions and Economic Growth.” Journal
of Public Economics, vol. 57 (January), pp. 85101.
Houghton, J.T., and others, eds. 2001. Climate Change 2001: The Scientific Basis. Cambridge, U.K.: Cambridge University
Press.
Houghton, R.A., and David L. Skole. 1990. “Carbon.” In B.L. Turner II and others, eds., The Earth as Transformed by
Human Action: Global and Regional Changes in the Biosphere over the Past 300 Years. Cambridge, U.K.: Cambridge
University Press, pp. 393408.
Kerr, Richard A. 2001. “Rising Global Temperature, Rising Uncertainty.” Science, vol. 292, no. 5515 (April 13), pp. 192194.
Kump, Lee R. 2001. “Chill Taken Out of the Tropics.” Nature, vol. 413 (October 4), pp. 470471.
Kvenvolden, Keith A. 1999. “Potential Effects of Gas Hydrate on Human Welfare.” Proceedings of the National Academy
of Sciences, vol. 96 (March), pp. 34203426.
Lamb, H.H. 1995. Climate, History, and the Modern World. 2nd ed. New York: Routledge.
REFERENCES 59
Mahlman, Jerry D. 2001. “The Long Time Scales of HumanCaused Climate Warming: Further Challenges for the Global
Policy Process.” Paper prepared for the Pew Center on Global Climate Change Workshop on the Timing of Climate
Change Policies. October. Available at www.pewclimate.org/events/timing_presentations.cfm.
Marland, G., T.A. Boden, and R.J. Andres. 2002. “Global, Regional, and National Fossil Fuel CO
2
Emissions.” In Trends:
A Compendium of Data on Global Change. Oak Ridge, Tenn.: Oak Ridge National Laboratory, Carbon Dioxide
Information Analysis Center.
Masters, William A., and Margaret S. McMillan. 2000. “Climate and Scale in Economic Growth.” CID Working Paper
no. 48. Cambridge, Mass.: Center for International Development at Harvard University.
McCarl, Bruce A., and Uwe A. Schneider. 2001. “Greenhouse Gas Mitigation in United States Agriculture and Forestry.”
Science, vol. 294 (December 21), pp. 24812482.
McCarthy, James J., and others, eds. 2001. Climate Change 2001: Impacts, Adaptation, and Vulnerability. Cambridge, U.K.:
Cambridge University Press.
Mendelsohn, Robert O., and James E. Neumann, eds. 1999. The Impact of Climate Change on the United States Economy.
Cambridge, U.K.: Cambridge University Press.
Metz, Bert, and others, eds. 2001. Climate Change 2001: Mitigation. Cambridge, U.K.: Cambridge University Press.
Moore, Thomas Gale. 1998. Climate of Fear: Why We Shouldn’t Worry About Global Warming. Washington, D.C.: Cato
Institute.
Naki
ƒenoviƒ, Nebojša, and Rob Swart, eds. 2000. Emission Scenarios. Cambridge, U.K.: Cambridge University Press.
National Assessment Synthesis Team. 2000. Climate Change Impacts on the United States: The Potential Consequences of
Climate Variability and Change. Cambridge, U.K.: Cambridge University Press.
National Science and Technology Council, Committee on Environment and Natural Resources, Subcommittee on Global
Change Research. 2001. Our Changing Planet: The FY2002 United States Global Change Research Program. September.
Available at www.gcrio.org/ocp2002/.
Nordhaus, William D. 1994. Managing the Global Commons: The Economics of Climate Change. Cambridge, Mass.: MIT
Press.
Nordhaus, William D., ed. 1998a. Economic and Policy Issues in Climate Change. Washington, D.C.: Resources for the
Future Press.
Nordhaus, William D. 1998b. “New Estimates of the Economic Impacts of Climate Change.” Unpublished paper,
Department of Economics, Yale University. December. Available at www.econ.yale.edu/~nordhaus/homepage/
climatewrite.htm.
Nordhaus, William D., and Joseph Boyer. 2000. Warming the World: Economic Models of Global Warming. Cambridge,
Mass.: MIT Press.
60 THE ECONOMICS OF CLIMATE CHANGE: A PRIMER
Pearson, Paul N., and Martin R. Palmer. 2000. “Atmospheric Carbon Dioxide Concentrations over the Past 60 Million
Years.” Nature, vol. 406 (August 17), pp. 695699.
Porter, Edward D. 1995. “Are We Running Out of Oil?” Discussion Paper no. 81. Washington, D.C.: American Petroleum
Institute. December.
Reilly, John M., Henry D. Jacoby, and Ronald G. Prinn. 2003. MultiGas Contributors to Global Climate Change: Climate
Impacts and Mitigation Costs of NonCO
2
Gases. Arlington, Va.: Pew Center on Global Climate Change. February.
Richerson, Peter J., and others. 2001. “Was Agriculture Impossible During the Pleistocene but Mandatory During the
Holocene? A Climate Change Hypothesis.” American Antiquity, vol. 66, no. 3 (July), pp. 387411.
SalaiMartin, Xavier. 1997. “I Just Ran Two Million Regressions.” American Economic Review, vol. 87, no. 2 (May),
pp. 178183.
Schimel, D. S., and others. 2001. “Recent Patterns and Mechanisms of Carbon Exchange by Terrestrial Ecosystems.” Nature,
vol. 414 (November 8), pp. 169172.
Scholes, R.J., and I.R. Noble. 2001. “Storing Carbon on Land.” Science, vol. 294 (November 2), pp. 10121013.
Shackleton, N. J., 2000. “The 100,000Year IceAge Cycle Identified and Found to Lag Temperature, Carbon Dioxide,
and Orbital Eccentricity.” Science, vol. 289, no. 5486 (September 15), pp. 18971902.
Veizer, Ján, Yves Godderis, and Louis M. François. 2000. “Evidence for Decoupling of Atmospheric CO
2
and Global
Climate During the Phanerozoic Eon.” Nature, vol. 408 (December 7), pp. 698701.
Watson, Robert T., and others, eds. 2000. Land Use, LandUse Change, and Forestry. Cambridge, U.K.: Cambridge University
Press.
Watson, Robert T., and others, eds. 2001. Climate Change 2001: Synthesis Report. Cambridge, U.K.: Cambridge University
Press.
Weart, Spencer R. 1997. “The Discovery of the Risk of Global Warming.” Physics Today, vol. 50, no. 1 (January), pp. 3440.
Webster, Mort, and others. 2002. Uncertainty Analysis of Climate Change and Policy Response. Report no. 95. Cambridge,
Mass.: Massachusetts Institute of Technology Joint Program on the Science and Policy of Global Change. December.
World Energy Council. 2001. Survey of Energy Resources, 19th Edition. London: World Energy Council. Available at
www.worldenergy.org/wecgeis/publications/default/launches/ser/ser.asp.
Zachos, James, and others. 2001. “Trends, Rhythms, and Aberrations in Global Climate 65 Ma to Present.” Science, vol. 292
(April 27), pp. 686693.
Zwiers, Francis W. 2002. “The 20Year Forecast,” Nature, vol. 416 (April 18) , pp. 690691.
REFERENCES 61
Chapter 3
Congressional Budget Office. 2000. Who Gains and Who Pays Under CarbonAllowance Trading? The Distributional Effects
of Alternative Policy Designs. June.
Cropper, Maureen L., Sema K. Aydede, and Paul R. Portney. 1994. “Preferences for Life Saving Programs: How the Public
Discounts Time and Age.” Journal of Risk and Uncertainty, vol. 8, pp. 243265.
Heal, Geoffrey, and Bengt Kriström. 2002. “Uncertainty and Climate Change.” Environmental and Resource Economics,
vol. 22, pp. 339.
Howarth, Richard B. 2001. “Climate Rights and Economic Modeling.” Pp. 315336 in Darwin Hall and Richard B.
Howarth, eds. The LongTerm Economics of Climate Change: Beyond a Doubling of Greenhouse Gas Concentrations.
Amsterdam: Elsevier Science B.V.
Keller, Klaus, and others. 2000. Preserving the Ocean Circulation: Implications for Climate Policy. Working Paper no. 7476.
Cambridge, Mass.: National Bureau of Economic Research. January.
Lasky, Mark. Forthcoming. The Economic Costs of Reducing Emissions of Greenhouse Gases: A Survey of Economic Models.
CBO Technical Paper.
Newell, Richard, and William Pizer. 2001. Discounting the Benefits of Climate Change Mitigation: How Much Do Uncertain
Rates Increase Valuations? Arlington, Va.: Pew Center on Global Climate Change. December.
Newell, Richard, James Sanchirico, and Suzi Kerr. 2002. Fishing Quota Markets. Discussion Paper 0220. Washington,
D.C.: Resources for the Future. August.
Nordhaus, William D. 1994. Managing the Global Commons: The Economics of Climate Change. Cambridge, Mass.: MIT
Press.
Nordhaus, William D. 2000. Warming the World: Economic Models of Global Warming. Cambridge, Mass.: MIT Press.
Nordhaus, William D., and David Popp. 1997. “What Is the Value of Scientific Knowledge? An Application to Global
Warming Using the PRICE Model.” Energy Journal, vol. 18, no. 1, pp. 147.
Papathanasiou, Demetrios, and Dennis Anderson. 2001. “Uncertainties in Responding to Climate Change: On the Economic
Value of Technology Policies for Reducing Costs and Creating Options.” Energy Journal, vol. 22, no. 3, pp. 79114.
Pizer, William A. 1997. Prices vs. Quantities Revisited: The Case of Climate Change, Working Paper no. 9802. Washington,
D.C.: Resources for the Future. October.
Webster, M.D. 2002. “The Curious Role of ‘Learning’ in Climate Policy: Should We Wait for More Data?” Energy Journal,
vol. 23, no. 2, pp. 97119.
Weitzman, Martin L. 1999. “Just Keep Discounting, But. . . .” In Paul R. Portney and John P. Weyant, eds., Discounting
and Intergenerational Equity. Washington, D.C.: Resources for the Future, pp. 2329.
Weitzman, Martin L. 2001.“Gamma Discounting.” American Economic Review, vol. 91, no. 1, pp. 260271.
62 THE ECONOMICS OF CLIMATE CHANGE: A PRIMER
Wigley, T.M.L., R. Richels, and J.A. Edmonds. 1996. “Economic and Environmental Choices in the Stabilization of
Atmospheric CO
2
Concentrations.” Nature, vol. 379 (January 18), pp. 240243.
Chapter 4
Babiker, Mustafa H., Gilbert E. Metcalf, and John Reilly. 2002. Tax Distortions and Global Climate Policy. Report no. 85.
Cambridge, Mass.: Massachusetts Institute of Technology Joint Program on the Science and Policy of Global Change.
May.
Baumol, William J., and Wallace E. Oates. 1988. The Theory of Environmental Policy. 2nd ed. Cambridge, U.K.: Cambridge
University Press.
Burtraw, Dallas, and Michael Toman. 1997. The Benefits of Reduced Air Pollutants in the United States from Greenhouse
Gas Mitigation Policies. Discussion Paper 9801REV. Washington, D.C.: Resources for the Future. November.
Burtraw, Dallas, and others. 1999. Ancillary Benefits of Reduced Air Pollution in the United States from Moderate Greenhouse
Gas Mitigation Policies in the Electricity Sector. Discussion Paper 9951. Washington, D.C.: Resources for the Future.
September.
Congressional Budget Office. 1990. Energy Use and Emissions of Carbon Dioxide: Federal Spending and Credit Programs
and Tax Policies. CBO Paper. December.
Congressional Budget Office.1996. Labor Supply and Taxes. CBO Memorandum. January.
Congressional Budget Office. 2000. Who Gains and Who Pays Under CarbonAllowance Trading? The Distributional Effects
of Alternative Policy Designs. June.
Congressional Budget Office. 2001. An Evaluation of CapandTrade Programs for Reducing U.S. Carbon Emissions. June.
Congressional Budget Office. 2002. Reducing Gasoline Consumption: Three Policy Options. November.
Crampton, Peter, and Suzi Kerr. 1998. Tradable Carbon Allowance Auctions: How and Why to Auction. Washington, D.C.:
Center for Clean Air Policy. March.
Department of Energy. 1997. Manufacturing Consumption of Energy 1994. DOE/EIA0512(94). December.
Department of Energy, Energy Information Administration. 1992. Federal Energy Subsidies: Direct and Indirect Interventions
in Energy Markets. DOE/EIASR/EMEU/9202.
Department of Energy, Energy Information Administration. 2000. Federal Financial Interventions and Subsidies in Energy
Markets,1999: Energy Transformation and End Use. DOE/EIASR/OIAF/200002. May. Available at www.eia.doe.gov/
oiaf/servicerpt/subsidy1/pdf/sroiaf(2000)02.pdf.
Department of Energy, Energy Information Administration. 2002. Federal Financial Interventions and Subsidies in Energy
Markets, 1999: Primary Energy. DOE/EIASR/OIAF/9903. September. Available at www.eia.doe.gov/oiaf/servicerpt/
subsidy/pdf/sroiaf(99)03.pdf.
REFERENCES 63
Energy Modeling Forum. 1996. Markets for Energy Efficiency. EMF Report no. 13, vol. 1. Stanford, Calif.: Stanford
University. September.
Executive Office of the President. 1993. The Climate Change Action Plan. October. Available at www.gcrio.org/
USCCAP/toc.html.
Fischer, Carolyn, Ian W.H. Parry, and William A. Pizer. 1998. Instrument Choice for Environmental Protection When
Technological Innovation Is Endogenous. Discussion Paper no. 9904. Washington, D.C.: Resources for the Future. October.
Goulder, Lawrence H., and Steven H. Schneider. 1996. Induced Technological Change, Crowding Out, and the Attractiveness
of Carbon Dioxide Emissions Abatement. Stanford, Calif.: Stanford University Institute for International Studies. October.
Gravelle, Jane G. 1994. The Economic Effects of Taxing Capital Income. Cambridge, Mass.: MIT Press.
Interlaboratory Working Group. 2000. Scenarios for a Clean Energy Future. ORNL/CON476 and LBNL44029. Oak
Ridge, Tenn., and Berkeley, Calif.: Oak Ridge National Laboratory and Lawrence Berkeley National Laboratory.
November.
Jaffe, Adam B., Richard G. Newell, and Robert N. Stavins. 2000. Technological Change and the Environment. Discussion
Paper 0047. Washington, D.C.: Resources for the Future. October.
Jorgenson, Dale W., and Richard J. Goettle. 2000. The Role of Substitution in Understanding the Costs of Climate Change
Policy. Arlington, Va.: Pew Center on Global Climate Change. September.
Koplow, Douglas N. 1993. Federal Energy Subsidies: Energy, Environmental, and Fiscal Impacts. Washington, D.C.: The
Alliance to Save Energy.
Lasky, Mark. Forthcoming. The Economic Costs of Reducing Emissions of Greenhouse Gases: A Survey of Economic Models.
CBO Technical Paper.
Newell, Richard G., Adam B. Jaffe, and Robert N. Stavins. 1998. The Induced Innovation Hypothesis and EnergySaving
Technological Change. Discussion Paper 9812 (revised). Washington, D.C.: Resources for the Future. October.
Nordhaus, William D. 1997. “Modeling Induced Innovation in ClimateChange Policy.” Paper presented at the
IIASA/NBER Workshop on Induced Technical Change and the Environment, International Institute for Applied Systems
Analysis, Laxenburg, Austria, June 2627.
Oates, Wallace B. 1992. “Taxation and the Environment: A Case Study of the United States.” Unpublished manuscript.
Department of Economics, University of Maryland, College Park. May.
Parry, Ian W.H. 1997. Revenue Recycling and the Costs of Reducing Carbon Emissions. Climate Issues Brief no. 2. Washington,
D.C.: Resources for the Future. June.
Parry, Ian W.H. 2002. Adjusting Carbon Cost Analyses to Account for Prior Tax Distortions. Discussion Paper 0247.
Washington, D.C.: Resources for the Future. August.
Parry, Ian W.H., and Antonio Miguel Bento. 1999. Tax Deductible Spending, Environmental Policy, and the “Double Dividend”
Hypothesis. Discussion Paper 9924. Washington, D.C.: Resources for the Future. February.
64 THE ECONOMICS OF CLIMATE CHANGE: A PRIMER
Parry, Ian W.H., and Wallace E. Oates. 1998. Policy Analysis in a SecondBest World. Discussion Paper 9848. Washington,
D.C.: Resources for the Future. September.
Parry, Ian W.H., Roberton C. Williams III, and Laurence H. Goulder. 1996. When Can Carbon Abatement Policies Increase
Welfare? The Fundamental Role of Distorted Factor Markets. Discussion Paper 9718. Washington, D.C.: Resources for
the Future. December.
Pizer, William A. 1997. Prices vs. Quantities Revisited: The Case of Climate Change. Working Paper no. 9802. Washington,
D.C.: Resources for the Future. October.
Pizer, William A. 1998. Optimal Choice of Policy Instrument and Stringency Under Uncertainty: the Case of Climate Change.
Working Paper no. 98XX. Washington, D.C.: Resources for the Future. August.
Pizer, William A. 1999. Choosing Price or Quantity Controls for Greenhouse Gases. Climate Issues Brief no. 17. Washington,
D.C.: Resources for the Future. July.
Popp, David. 2001. Induced Innovation and Energy Prices. Working Paper no. 8284. Cambridge, Mass.: National Bureau
of Economic Research. May.
Reilly, John M., Henry D. Jacoby, and Ronald G. Prinn. 2003. MultiGas Contributors to Global Climate Change: Climate
Impacts and Mitigation Costs of NonCO
2
Gases. Arlington, Va.: Pew Center on Global Climate Change. February.
Shackleton, Robert G., and others. 1993. “The Efficiency Value of Carbon Tax Revenues.” Energy Modeling Forum Working
Paper no. 128. Stanford, Calif.: Energy Modeling Forum, Stanford University. January.
Sutherland, Ronald J. 2000. “‘No Cost’ Efforts to Reduce Carbon Emissions in the United States: An Economic Perspective.”
Energy Journal, vol. 21, no. 3, pp. 89112.
Weitzman, Martin L. 1974. “Prices vs. Quantities.” Review of Economic Studies, vol. 41, no. 4 , pp. 477491.
Welch, Eric W., Allan Mazur, and Stuart Bretschneider. 2000. “Voluntary Behavior by Electric Utilities: Levels of Adoption
and Contribution of the Climate Challenge Program to the Reduction of Carbon Dioxide.” Journal of Policy Analysis
and Management, vol. 19, no. 3, pp. 407425.
Yuskavage, Robert E. 1996. “Improved Estimates of Gross Product by Industry, 195994.” Survey of Current Business,
vol. 76, no. 8, pp. 133155. August. Updated data can be found at www.bea.doc.gov/bea/dn2/gpo.htm.
Chapter 5
Aldy, Joseph E., Peter R. Orszag, and Joseph E. Stiglitz. 2001. Climate Change: An Agenda for Collective Action. Prepared
for the Pew Center on Global Climate Change Workshop on the Timing of Climate Change Policies. October. Available
at www.pewclimate.org/events/timing_presentations.cfm.
Babiker, Mustafa H., and others. 2002. The Evolution of a Climate Regime: Kyoto to Marrakech. Report No. 82. Cambridge,
Mass.: Massachusetts Institute of Technology Joint Program on the Science and Policy of Global Change. February.
REFERENCES 65
Bradford, David F. 2002. “Improving on Kyoto: Greenhouse Gas Control as the Purchase of a Global Public Good.” April
30. Available at www.wws.princeton.edu/~bradford/globalpublicghgcontrol01.pdf.
Budget of the United States Government, Fiscal Year 2003: Analytical Perspectives, p. 171.
Climate Change Science Program. 2002. Strategic Plan for the Climate Change Science Program. November 19. Available
at www.climatescience.gov/library/stratplan2003/default.htm.
Congressional Budget Office. 1990. Energy Use and Emissions of Carbon Dioxide: Federal Spending and Credit Programs
and Tax Policies. CBO Paper. December.
Congressional Budget Office. 1996. Labor Supply and Taxes. CBO Memorandum. January.
Congressional Budget Office. 1998. Climate Change and the Federal Budget. CBO Memorandum. August.
Congressional Budget Office. 2000. Who Gains and Who Pays Under CarbonAllowance Trading? The Distributional Effects
of Alternative Policy Designs. June.
Congressional Budget Office. 2001. An Evaluation of CapandTrade Programs for Reducing U.S. Carbon Emissions. June.
Department of Energy, Energy Information Administration. 2000. Federal Financial Interventions and Subsidies in Energy
Markets, 1999: Energy Transformation and End Use. DOE/EIASR/OIAF/200002. May. Available at www.eia.doe.gov/
oiaf/servicerpt/subsidy1/pdf/sroiaf(2000)02.pdf.
Executive Office of the President. 2002. Global Climate Change Policy Book. Available at www.whitehouse.gov/news/
releases/2002/02/climatechange.html.
General Accounting Office. 1999. International Environment: Literature on the Effectiveness of International Environmental
Agreements. GAO/RCED99148. May.
Kopp, Raymond, Richard Morgenstern, and William Pizer. 1997. Something for Everyone: A Climate Policy That Both
Environmentalists and Industry Can Live With. September. Available at www.weathervane.rff.org/features/ feature015.html.
Kopp, Raymond, and others. 1999. A Proposal for Credible Early Action in United States Climate Policy. February. Available
at www.weathervane.rff.org/features/feature060.html.
Lasky, Mark. Forthcoming. The Economic Costs of Reducing Emissions of Greenhouse Gases: A Survey of Economic Models.
CBO Technical Paper.
McKibbin, Warwick. 2000. Moving Beyond Kyoto. Policy Brief no. 66. Washington, D.C.: Brookings Institution. October.
Available at www.brook.edu/comm/policybriefs/pb066/pb66.htm.
McKibbin, Warwick, and Peter Wilcoxen. 2000. The Next Step for Climate Change Policy. Background Paper no. 1.
Washington, D.C.: Brookings Institution. February. Available at www.brook.edu/dybdocroot/views/papers/mckibbin/
climate.htm.
McKibbin, Warwick, and Peter Wilcoxen. 2002. “The Role of Economics in Climate Change Policy.” Journal of Economic
Perspectives, vol. 16, no. 2 (Spring), pp. 107130.
66 THE ECONOMICS OF CLIMATE CHANGE: A PRIMER
Michaels, Patrick. 2001.“Global Warming.” Chapter 47 in Edward H. Crane and David Boaz, eds., Cato Handbook for
Congress: Policy Recommendations for the 107th Congress. Washington, D.C.: Cato Institute.
National Science and Technology Council, Committee on Environment and Natural Resources, Subcommittee on Global
Change Research. 2001. Our Changing Planet: The FY2002 United States Global Change Research Program. September.
Available at www.gcrio.org/ocp2002/.
Nordhaus, William D. 1998. “Is the Kyoto Protocol a Dead Duck? Are There Any Live Ducks Around? Comparison of
Alternative Global Tradable Emissions Regimes.” Unpublished paper, version 073198a.wpd. July 31. Available from
the author at william[email protected].
Schelling, Thomas C. 2002 .“What Makes Greenhouse Sense? Time to Rethink the Kyoto Protocol.” Foreign Affairs, vol. 81,
no. 3 (May/June), pp. 29.
Sky Trust. 2000. The Sky Trust EconomyWide Proposal to Reduce U.S. Carbon Emissions. June. Available at www.cfed.org/
sustainable_economies/common_assets/.
United Nations. 1992. United Nations Framework Convention on Climate Change. Available at http://unfccc.int/resource/docs/
convkp/conveng.pdf.
United Nations. 1997. Kyoto Protocol to the United Nations Framework Convention on Climate Change. Available at
http://unfccc.int/resource/docs/convkp/kpeng.pdf.
United Nations. 2000. A Guide to the Climate Change Convention and Its Kyoto Protocol. Available at unfccc.int/resource/
guideconvkpp.pdf.
United Nations. 2003. Kyoto Protocol Status of Ratification. March 20. Available at unfccc.int/resource/kpstats.pdf.
Victor, David G., and others, eds. 1998. The Implementation and Effectiveness of International Environmental Commitments.
Cambridge, Mass.: MIT Press.
Victor, David G. 2001. The Collapse of the Kyoto Protocol and the Struggle to Slow Global Warming. Princeton, N.J.: Princeton
University Press.


