
1
Annual Water Consumer
Confidence Report
Dix Drinking Water System on
Joint Base McGuire-Dix-Lakehurst
(JB MDL)
Public Water System ID No. 0325001
Monitoring Period:
January 1, 2022 – December 31, 2022
Publish Date: June 30, 2023
Is my water safe?
Yes. Last year, as in years past, the tap water in the Dix Drinking Water System on JB MDL met
all U.S. Environmental Protection Agency (EPA) and New Jersey Department of Environmental
Protection (NJDEP) drinking water health standards. Members of the 87th Air Base Wing, 87th
Medical Group, 87th Civil Engineer Group, and Pride Industries safeguarded water supplies and
once again, we are proud to report that our system currently is in full compliance with primary
water quality standards. This report is being distributed to you, the consumer, to provide you with
information to allow you to make personal health-based decisions regarding drinking water
consumption. The report provides sampling data for the water system and discusses health
concerns for each contaminant detected in the system. The report also provides definitions, so
consumers are clear on the terminology and material presented in this report. Additional
information concerning water consumption anywhere in the United States can be obtained by
calling the Safe Drinking Water Hotline, toll free at (800) 426-4791.
Where does my water come from?
The Dix drinking water system obtains water from three groundwater wells and a surface water
treatment plant. The wells are screened in the Potomac-Raritan-Magothy (PRM) Aquifer System.
The wells range in depth from 1118 feet to 1155 feet. Total pumping capacity for each of the
wells is approximately 700 gallons per minute (GPM). The groundwater is filtered through
manganese greensand filters, for iron and manganese removal. Sodium hypochlorite is used for
disinfection.
The surface water source is the Greenwood Branch of the North Branch of the Rancocas Creek.
The surface water plant has a capacity of 4 million gallons per day (MGD). Surface water is
treated using sodium hydroxide to adjust pH, rapid mixing with aluminum sulfate addition
for flocculation (a process where solids in water aggregate through chemical action so they can be
separated from water), sedimentation (solids settling by gravity), multimedia filtration, and
2
chlorine gas for disinfection. The water system has a total storage capacity of 3,000,000 gallons
for use at JB MDL - Dix in four water towers/clear wells.
Source Water Assessments
The NJDEP has prepared Source Water Assessment Reports and Summaries for all public water
systems. Further information on the Source Water Assessment Program can be obtained by
logging onto NJDEP’s source water assessment web site at www.state.nj.us/dep/swap or by
contacting NJDEP’s Bureau of Safe Drinking Water at (609) 292-5550. You may also contact the
personnel in charge of the public water system through the Joint Base Public Affairs office, 87
ABW/PA, at (609) 754-2104.
Source Water Assessment Summary
The results of the source water assessment performed on our five water sources (four active
groundwater wells, and one surface water source) are presented in the following table. The table
illustrates the susceptibility ratings for the seven contaminant categories and radon for each well in
the system. The table provides the rating for each well: high, medium, and low for each
contaminant category. The Dix system does not have any sources that are classified as
groundwater under the direct influence of surface water, and it does not purchase water from other
public water systems. The eight contaminant categories are defined in Table 1.
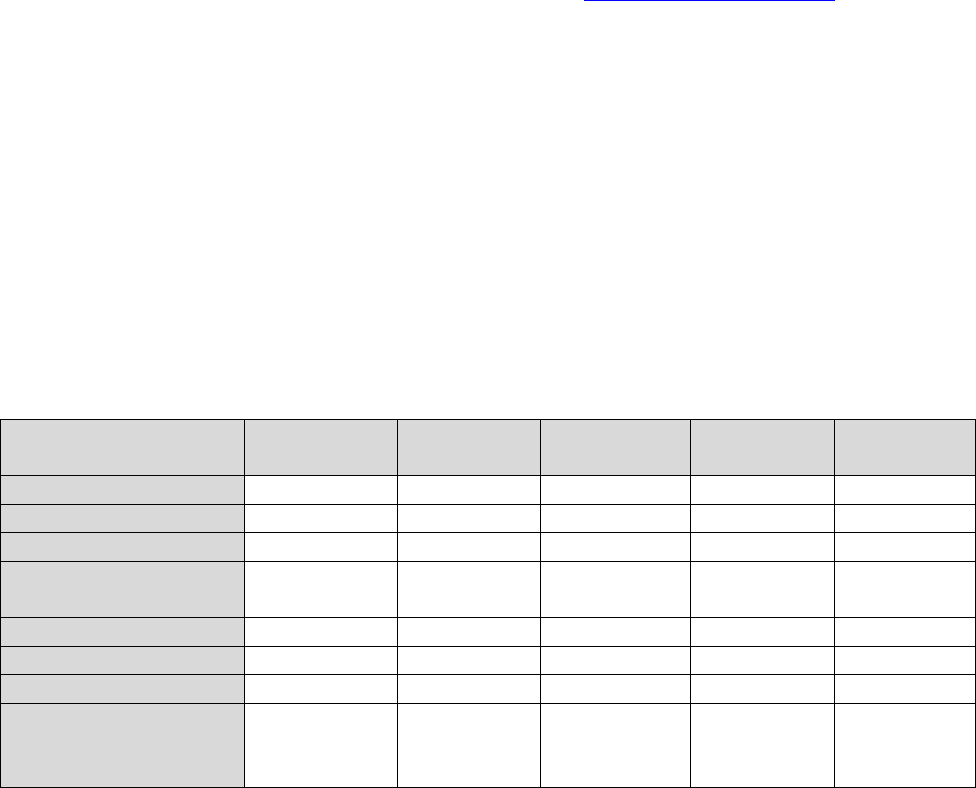
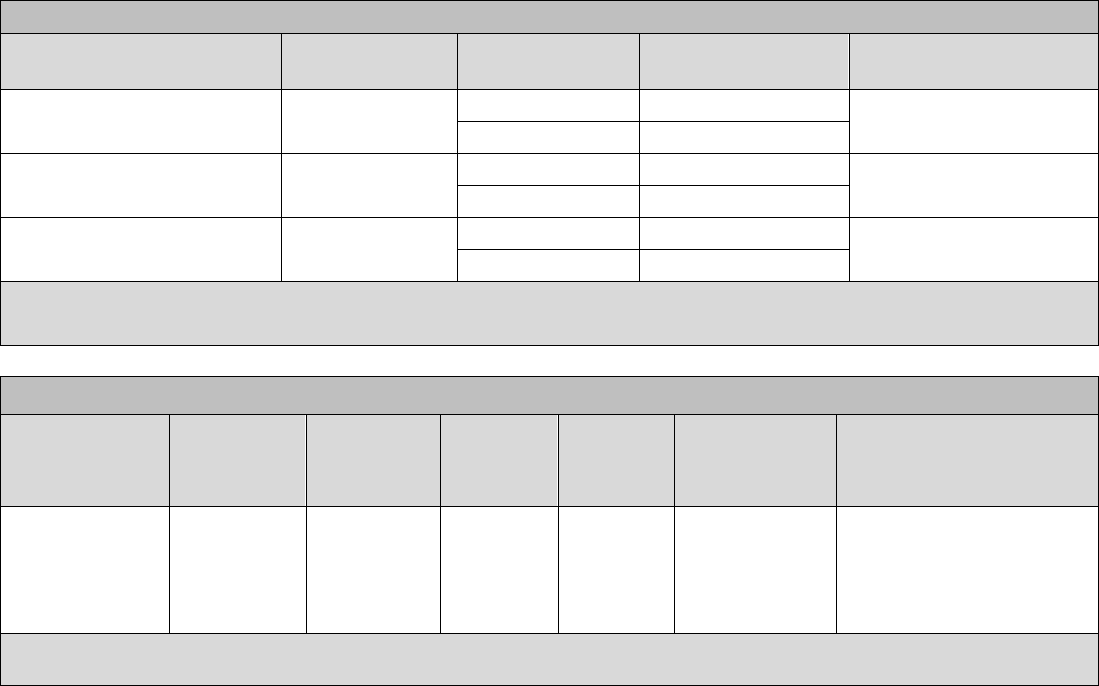
Table 1 – Source Water Assessment Summary
Contaminant
Rancocas
Creek
Well 2R Well 4R Well 5 Well 6*
Pathogens
High
Low
Low
Low
Low
Nutrients
Low
Low
Low
Low
Low
Pesticides
Low
Low
Low
Low
Low
Volatile Organic
Compounds (VOCs)
Low Low Low Low Low
Inorganics
High
Low
Low
Low
Low
Radionuclides
Low
Medium
Medium
Medium
Medium
Radon
Low
Low
Low
Low
Low
Disinfection
Byproducts
Precursors (DBPs)
High Medium Medium Medium Medium
*Well 6 is currently inactive
Pathogens: Disease causing organisms such as bacteria and viruses. Common sources are animal
and human fecal wastes.
Nutrients: Compounds, minerals and elements that aid growth, that are both naturally occurring
and man-made. Examples include nitrogen and phosphorous.
VOCs: Man-made chemicals used as solvents, degreasers, and gasoline components. Examples
include benzene, methyl tertiary butyl ether (MTBE) and vinyl chloride.
Pesticides: Man-made chemicals used to control pests, weeds, and fungus. Common sources
include land application and manufacturing of pesticides. Examples include herbicides such as
atrazine and insecticides such as chlordane.
3
Inorganics: Mineral based compounds that are both naturally occurring and man-made.
Examples include arsenic, asbestos, copper, lead and nitrate.
Radionuclides: Radioactive substances are both naturally occurring and man-made. Examples
include radium and uranium.
Radon: Colorless, odorless, cancer-causing gas that occurs naturally in the environment.
DBPs: A common source is naturally occurring organic matter in surface water. Disinfection
byproducts are formed when the disinfectant (usually chlorine) used to kill pathogens reacts with
dissolved organic material (for example leaves) present in surface water. Examples include
Trihalomethanes (TTHMs) & Halo acetic Acids (HAA5).
If a system is rated highly susceptible for a contamination category, it does not mean a customer is
or will be consuming contaminated water. The rating reflects the potential for contamination of
source water, not the existence of contamination. Public water systems are required to monitor for
regulated contaminants and to install treatment if any are detected at frequencies and
concentrations above allowable levels.
NJDEP found the following potential contaminant sources within the Source Water Assessment
areas for our sources. All potential contaminant sources are on the base.
1. Solid and hazardous waste handling and transfer facilities.
2. Closed solid waste landfill.
3. Septic tanks.
4. Urban, commercial, and industrial land use.
5. Distance of the wells to wetlands.
6. The Golf Course.
7. Population density.
8. Density of known contaminated sites, and NJDEP permitted surface water discharges.
Source Water Protection Tips
Protection of drinking water is everyone’s responsibility. You can help protect your community’s
drinking water source in several ways:
• Eliminate excess use of lawn and garden fertilizers and pesticides – they contain hazardous
chemicals that can reach your drinking water source
• Pick up after your pets
• If you have your own septic system, properly maintain your system to reduce leaching to
water sources or consider connecting to a public water system
• Dispose of chemicals properly; take used motor oil to a recycling center
• Volunteer in your community. Find a watershed or wellhead protection organization in
your community and volunteer to help. If there are no active groups, consider starting one.
Use EPA’s Adopt Your Watershed to locate groups in your community, or visit the
Watershed Information Network’s How to Start a Watershed Team
• Organize a storm drain stenciling project with your local government or water supplier.
Stencil a message next to the street drain reminding people “Dump No Waste – Drains to
River” or “Protect Your Water.” Produce and distribute a flyer for households to remind
residents that storm drains dump directly into your local water body.
4
Sources of Drinking Water Contamination
Sources of drinking water (both tap water and bottled water) may include rivers, lakes, streams,
ponds, reservoirs, springs, and wells. As water travels over the surface of the land or through the
ground, it dissolves naturally occurring minerals and, in some cases, radioactive material, and can
pick up substances resulting from the presence of animals or from human activity. Regulated
substances that may be present in source water include:
• Microbial contaminants, such as viruses and bacteria, which may come from sewage
treatment plants, septic systems, agricultural livestock operations, and wildlife;
• Inorganic contaminants, such as salts and metals, which can be naturally occurring or result
from urban storm water runoff, industrial or domestic wastewater discharges, oil and gas
production, mining, or farming;
• Pesticides and herbicides, which may come from a variety of sources such as agriculture,
urban storm water runoff, and residential uses;
• Organic chemical compounds, including synthetic organic compounds (SOCs) and volatile
organic compounds (VOCs), which are byproducts of industrial processes and petroleum
production, and can also come from gas stations, urban storm water runoff, and septic
systems;
• Radioactive contaminants, which can be naturally occurring or be the result of oil and gas
production and mining activities.
• Per- and polyfluoroalkyl substances (PFAS) are a group of thousands of man-made
chemicals. PFAS have been used in a variety of industries and consumer products around
the globe, including in the U.S., since the 1940s. PFAS have been used to make coatings
and products that are used as oil and water repellents for carpets, clothing, paper packaging
for food, and cookware. They are also contained in some foams (aqueous film-forming
foam or AFFF) used for fighting petroleum fires at airfields and in industrial fire
suppression processes because they rapidly extinguish fires, saving lives and protecting
property. PFAS chemicals are persistent in the environment and some are persistent in the
human body – meaning they do not break down and they can accumulate over time. (See
Page 5 of this report for additional information.)
In order to ensure that tap water is safe to drink, the Environmental Protection Agency (EPA)
prescribes regulations that limit the amount of certain contaminants in water provided by public
water systems. Food and Drug Administration regulations establish limits for contaminants in
bottled water that must provide the same protection for public health. Table 2 summarizes the
regulated analytes and monitoring frequencies for the wells (points of entry) and distribution
system servicing the Dix area.
5
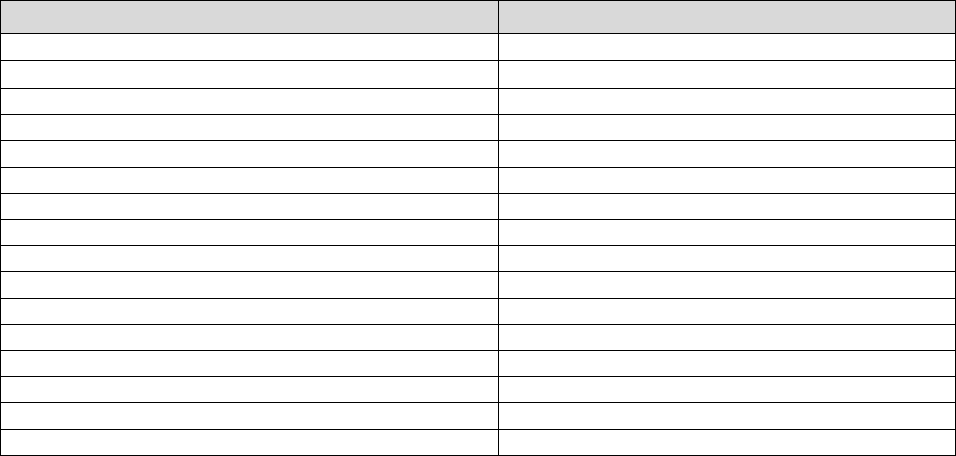
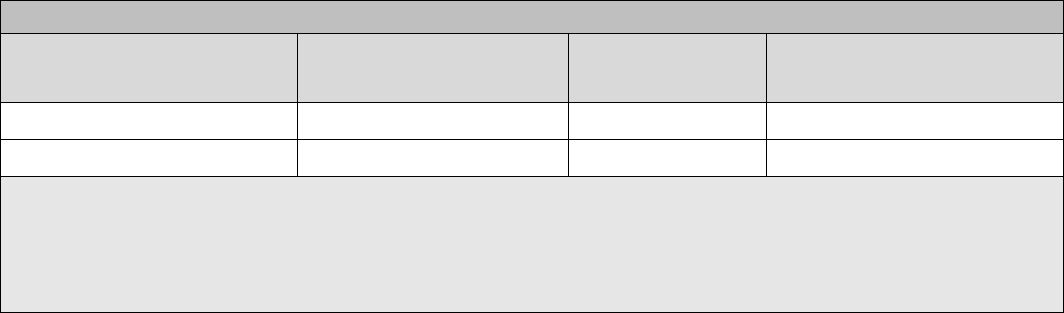
Table 2 – Regulated Substances and Monitoring Frequencies
Regulated Substance
Frequency*
Total Coliform, Free Available Chlorine
Monthly
Nitrates
Annually
TTHM
Quarterly
HAA5
Quarterly
Inorganics
Annually
Secondary Standards
Annually or Every 3 years
Federal and State VOC lists
Annually or Every 3 years
Radiologicals
Every 3 years or Every 6 years
Lead and Copper
30 samples every third year of a 3-year cycle
Asbestos
Within the first 3-years of 9-year cycle
DBP Precursors
Monthly
Iron & Manganese
Annually
1,2,3-Trichloropropane (TCP)
2 Samples Every 3 years
Ethylene dibromide (EDB)
2 Samples Every 3 years
1,2 Dibromo-3-chloropropane (DBCP)
2 Samples Every 3 years
PFAS
Annually
*Frequency is determined by the NJDEP schedule and the source of the water (surface or groundwater).
The NJDEP regulations allow monitoring waivers to reduce or eliminate the monitoring
requirements for asbestos, radiological, VOCs, and SOCs. Our system received monitoring
waivers for asbestos, radiological, and SOCs because prior samplings have demonstrated that these
substances were not detected in our source water.
Drinking water, including bottled water, may reasonably be expected to contain at least small
amounts of some contaminants. The presence of contaminants does not necessarily indicate that
water poses a health risk. More information about contaminants and potential health effects can be
obtained by calling the EPA’s Safe Drinking Water Hotline (800-426-4791).
Parts per million (ppm), parts per billion (ppb), and parts per trillion (ppt) are the most used terms
to describe very small amounts or trace levels of chemicals of concern in our drinking water.
• One ppm is the equivalent of four drops of impurity in a 55-gallon barrel of water or one
minute in two years, also expressed as milligrams per liter (mg/L).
• One ppb is the equivalent of one drop of impurity in 500 barrels of water or 1 cent out of $10
million, also expressed as micrograms per liter (µg/L).
• One ppt is the equivalent of one drop of impurity in 500,000 barrels of water or traveling 6
inches out of a 93-million-mile journey toward the sun, also expressed as nanograms per liter
(ng/L).
Additional Information for Lead and Copper Rule
If present, elevated levels of lead can cause serious health problems, especially for pregnant
women and young children. Lead in drinking water is primarily from materials and components
associated with service lines and home plumbing. JB MDL is responsible for providing high
quality drinking water but cannot control the variety of materials used in plumbing components.

6
When your water has been sitting for several hours, you can minimize the potential for lead
exposure by flushing your tap for 30 seconds to 2 minutes before using water for drinking or
cooking. If you are concerned about lead in your drinking water, you may wish to have your water
tested. Information on lead in drinking water is available from the Safe Drinking Water Hotline or
at http://www.epa.gov/safewater/lead.
JB MDL participated in lead and copper monitoring in 2021. In accordance with NJDEP
regulation, the 90th percentile of sample results are required to be at or below the Action Level
(AL), which is 15 ppb (or µg/L). Of the 30 samples collected in 2021 for lead, the 90th percentile
result was 0 ppb. The AL for copper by regulation is 1,300 ppb. Of the 30 samples collected in
2021 for copper, the 90th percentile result was 200 ppb.
Additional Information for PFAS
PFAS compounds are a subset of man-made compounds containing approximately 6,000
chemicals formed from carbon chains with fluorine attached to these chains. PFAS are part of a
group of the most extensively produced and studied chemicals and are currently classified as
unregulated or “emerging” contaminants. There are currently no Federal Safe Drinking Water Act
(SDWA) regulatory standards.
There is currently no established federal water quality regulation for any PFAS compounds. In
May 2016, the EPA established a health advisory level (HAL) at 70 ppt for individual or combined
concentrations of perfluorooctanoic acid (PFOA) and perfluorooctanesulfonic acid (PFOS).
Both
chemicals are types of PFAS.
Out of an abundance of caution for your safety, the Department of Defense’s (DoD) PFAS testing
and response actions go beyond EPA Safe Drinking Water Act requirements. In 2020 the DoD
promulgated a policy to monitor drinking water for PFAS at all service owned and operated water
systems at a minimum of every three years. The DoD policy states that if water sampling results
confirm that drinking water contains PFOA and PFOS at individual or combined concentrations
greater than the 2016 EPA HAL of 70 ppt, water systems would quickly undertake additional
sampling to assess the level, scope, and localized source of contamination, and take action to
reduce exposure to PFOS or PFAS.
The interim Health Advisories for PFOS and PFOA are based on draft analyses that are still
undergoing review by EPA's Science Advisory Board. Since HALs are below quantifiable limits
and are non-regulatory levels, DoD is instead looking to EPA to promulgate a regulatory drinking
water standard, which is anticipated by the end of 2023. DoD looks forward to the clarity that a
nationwide regulatory standard for PFOS and PFOA in drinking water will provide.
In anticipation of this EPA drinking water regulation and to account for emerging science that
shows potential health effects of PFOS and PFOA at levels lower than 70 ppt, DoD is evaluating
its efforts to address PFAS in drinking water, and what actions we can take to be prepared to
incorporate this standard, such as reviewing our current data and collecting additional sampling

7
where necessary. We remain committed to fulfilling our cleanup responsibilities, operating within
the law and authorities provided by the federal cleanup law, and clearly communicating and
engaging with our communities.
In 2018, the NJDEP established health based Maximum Contaminant Level (MCL) for PFNA,
PFOA and PFOS and has identified these three analytes as “Regulated PFAS”. The MCLs are 13
ppt for PFNA and PFOS, and 14 ppt for PFOA. Regulated PFAS were below the detection limit
in the Ft Dix Water System for 2022. Results of sampling are provided in Table 3.
For more information on how EPA manages the unregulated or “emerging” contaminants, refer to:
UCMR - https://www.epa.gov/dwucmr/learn-about-unregulated-contaminant-monitoring-rule
For more information on drinking water health advisories for PFOS and PFOA, refer to:
https://www.epa.gov/ground-water-and-drinking-water/drinking-water-health-advisories-pfoa-and-
pfos
8
Water Quality Data Tables
To ensure that tap water is safe to drink, EPA prescribes regulations that limit the amount of contaminants in water
provided by public water systems. All sources of drinking water contain some naturally occurring contaminants. At
low levels, these substances are generally not harmful in our drinking water. Table 3 below lists the drinking water
monitoring results for the calendar year of this report. Some of our data, though representative, may be more than one
year old but still within required sampling frequency. To help you understand the contents of this Consumer
Confidence Report, we have provided the common abbreviations, terms, and definitions in Tables 4 and 5 below.
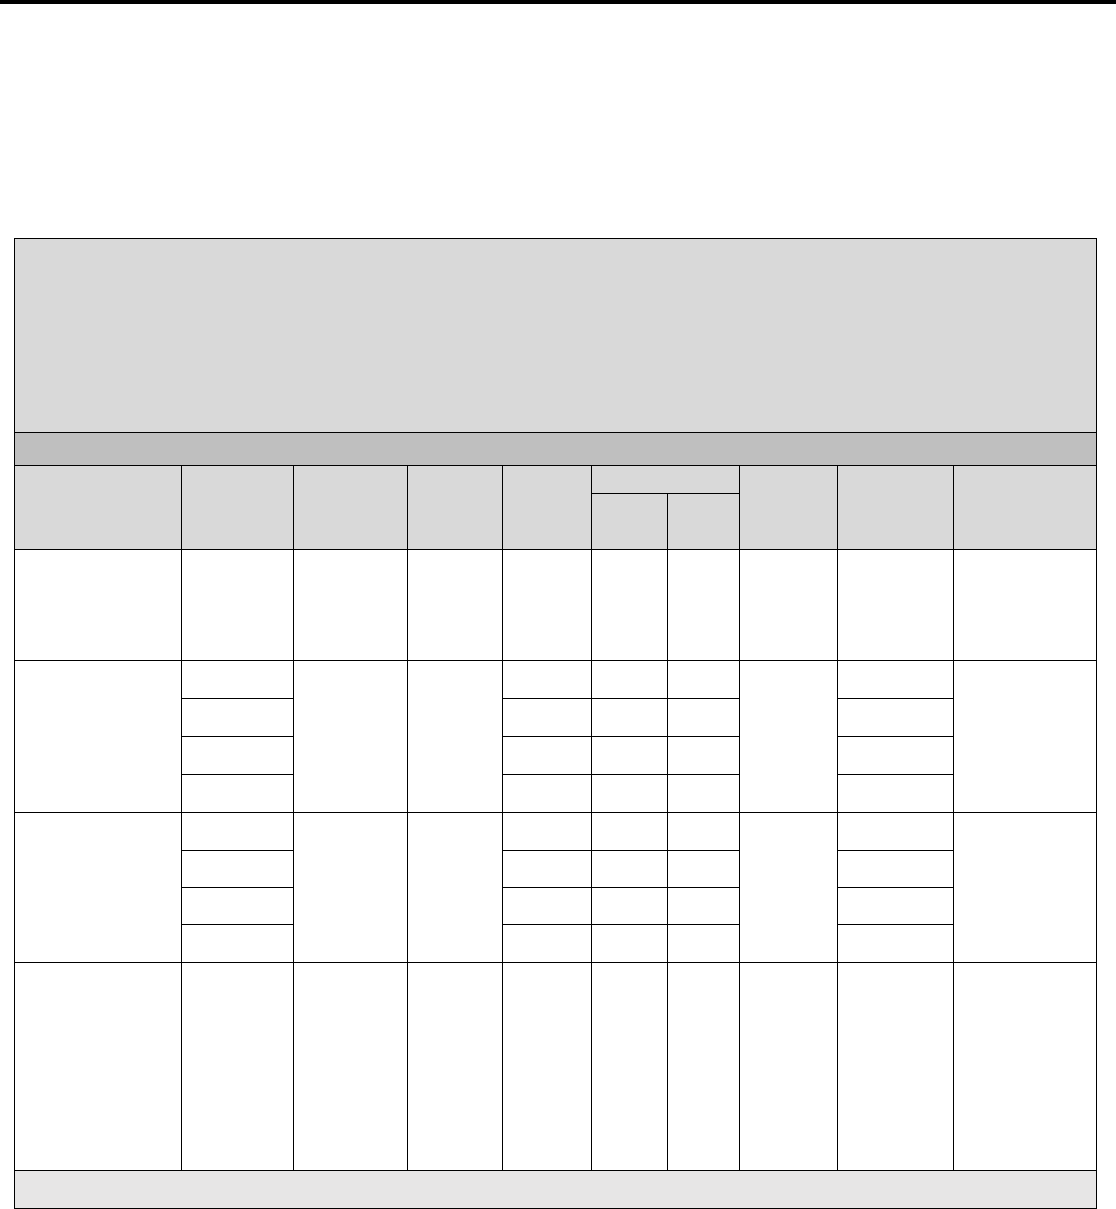
Table 3 – Water Monitoring Results
Some people may be more vulnerable to contaminants in drinking water than the general population.
Immuno-compromised persons such as persons with cancer undergoing chemotherapy, persons who
have undergone organ transplants, people with HIV/AIDS or other immune system disorders, some
elderly, and infants can be particularly at risk from infections. These people should seek advice about
drinking water from their health care providers. EPA/Centers for Disease Control (CDC) guidelines
on appropriate means to lessen the risk of infection by Cryptosporidium and other microbial
contaminants are available from the Safe Water Drinking Hotline (800-426-4791).
Disinfectant, Disinfectant Precursors and Byproducts
1
Contaminants
(Units)
Location
MCLG
or
MRDLG
MCL,
TT, or
MRDL
LRAA
Results
Sample
Date
Violation
Typical
Source
Low High
Chlorine
(as Cl
2
, ppm)
(Monthly
Range)
NA 4.0 4.0 NA 0.99 1.36 2022 No
Drinking
water
disinfectant
1
TTHMs (ppb)
1220
NA 80
20 1.28 60.2
2022
No
Byproduct
of drinking
water
disinfection
1
3601 19 5.08 40 No
5255 14 3.14 41.3 No
5953 34 12.33 60.2 No
HAA5 (ppb)
1220
NA 60
19 1.5 58.4
2022
No
Byproduct
of drinking
water
disinfection
1
3601 14 4.74 31.8 No
5255 13 3.58 39.6 No
5953 35 17 58.2 No
Total Organic
Carbon
(% Removal)
NA NA TT NA
42.39 79.74
2022 No
Organic
materials
naturally
present in the
environment
Disinfectants
and
Disinfection
byproducts
1. There is convincing evidence that addition of a disinfectant is necessary for control of microbial contaminants.
9
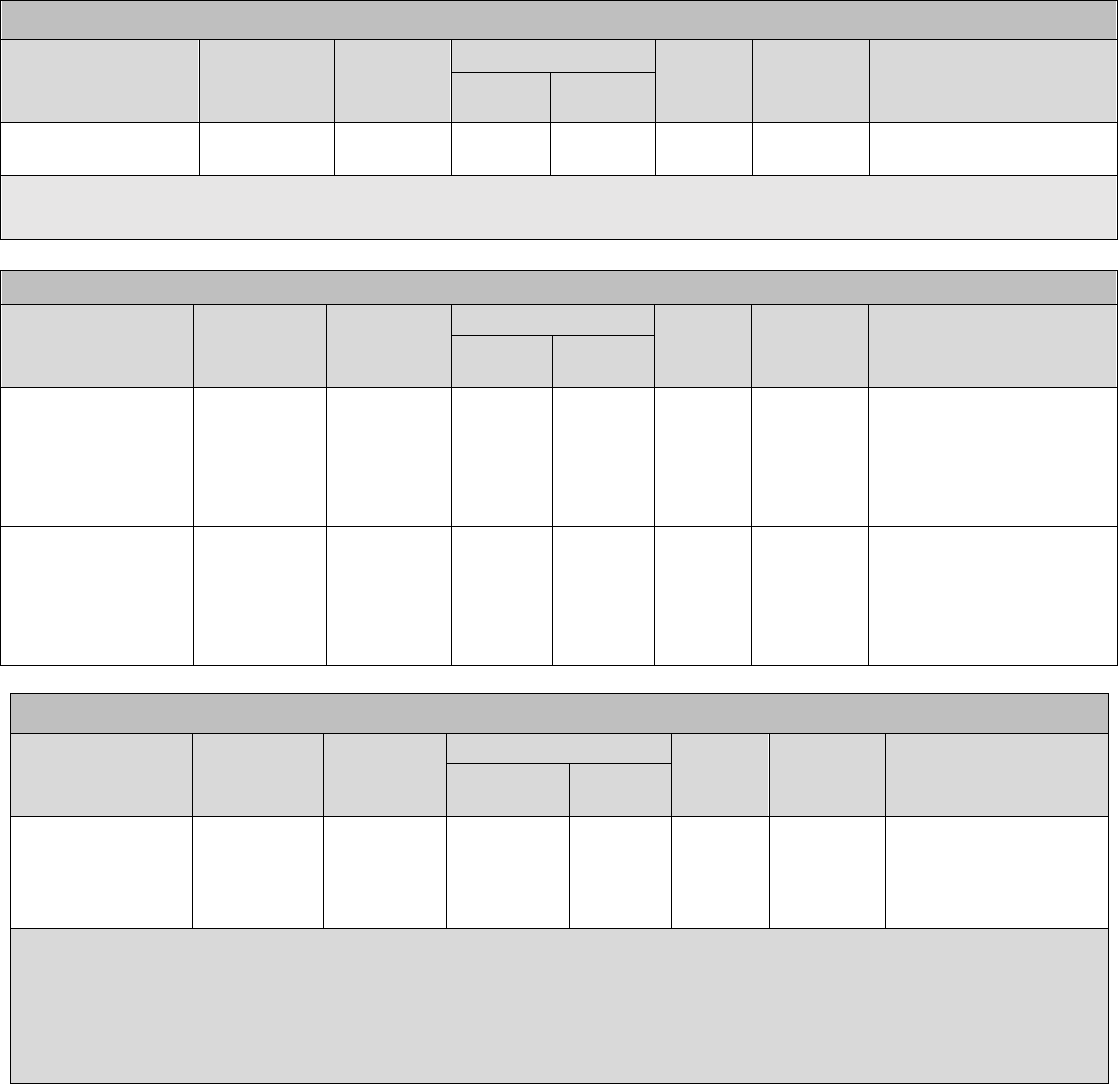
Physical Contaminants
Contaminants
(Units)
MCLG or
MRDLG
MCL,
TT, or
MRDL
Results
Sample
Date
Violation Typical Source
Low High
Turbidity
2
NA 0.3 NA 0.00 2022 No Soil runoff
2. 100% of the samples were below the TT value of 0.3. A value less than 95% constitutes a TT violation. Any
measurement more than 1 is a violation unless otherwise approved by the State.
Nitrate
Contaminants
(Units)
MCLG or
MRDLG
MCL,
TT, or
MRDL
Results
Sample
Date
Violation Typical Source
Low High
Groundwater
Treatment-
Nitrate
[measured as
Nitrogen] (ppm)
1 10 NA <0.1 2022 No
Runoff from fertilizer
use; Leaching from
septic tanks, sewage;
Erosion of natural
deposits
Surface Water
Treatment-
Nitrate
[measured as
Nitrogen] (ppm)
1 10 NA 0.3 2022 No
Runoff from fertilizer
use; Leaching from
septic tanks, sewage;
Erosion of natural
deposits
Microbiological
Contaminants
(Units)
MCLG or
MRDLG
MCL,
TT, or
MRDL
Results
Sample
Date
Violation Typical Source
Negative* Positive
Total Coliform
(positive
samples/
months)
3,4
0 0 173 0 2022 No
Human or animal
fecal waste
3. A violation occurs when a routine sample and a repeat sample, in any given month, are total coliform
positive, and one is also fecal coliform or E. coli positive.
4. If a system collecting fewer than 40 samples per month has two or more positive samples in one month, the
system has an MCL violation.
*Negative means no bacteria was detected in the sample
10
NJDEP Regulated PFAS
Contaminant
(Units)
NJDEP
MCL
Location Results Monitoring Year
PFOS (ppt) 13
GW
< 2
2022
SW
< 2
PFOA (ppt) 14
GW
< 2
2022
SW
< 2
PFNA (ppt) 13
GW
< 2
2022
SW
< 2
PFNA = Perfluorononanoic acid, PFOS = Perfluoroctane sulfonic acid, PFOA = Perfluoroctanoic acid
GW = Groundwater Treatment Plant; SW = Surface Water Treatment Plant
Inorganic Compounds*
Contaminants
(Units)
MCLG or
MRDLG
MCL, TT,
or MRDL
Result Sampled Violation Typical Source
Fluoride (ppm) 4 4 0.7 2022 No
Water additive which
promotes strong teeth;
erosion of natural deposits;
discharge from fertilizer
and aluminum factories
*No other compounds were detected above the method detection limit (MDL), therefore are considered non-detect and
not reported herein.
11
Table 4 – Secondary
5
and Unregulated Contaminants
6
- No MCL Established
Secondary Group
Secondary Contaminant
(Unit)
Recommended Upper
Limit (RUL)
Result Date of Monitoring
Iron (ppm) 0.3 <0.04 2022
Manganese (ppm) 0.05 <0.04 2022
4. Secondary contaminant Recommended Upper Limits (RULs) are established as guidelines to assist public water
systems in managing their drinking water for aesthetic considerations, such as taste, color, and odor. These
contaminants are not considered to present a risk to human health and are not enforced by the NJDEP or the EPA.
5. Unregulated contaminant monitoring helps EPA to determine where certain contaminants occur and whether the
agency should consider regulating those contaminants in the future. No monitoring for UCMR was required for 2022.
12
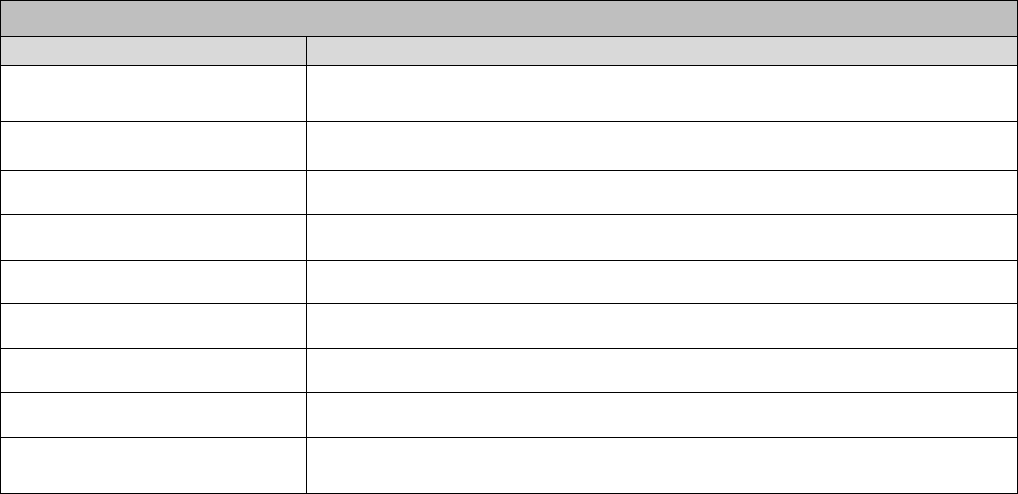
Table 5 – Unit Descriptions
Unit Descriptions
Term
Definition
<
Less than the lowest detectable concentration for the specific approved
analysis method used, the result can be considered zero
ppm parts per million, or milligrams per liter (mg/L)
ppb parts per billion, or micrograms per liter (µg/L)
ppt
parts per trillion or nanograms per liter (ng/L)
positive samples The number of positive samples taken that year
NA Not applicable
ND Not detected
NR Monitoring not required but recommended.
pCi/L
PicoCuries of contaminant per Liter of water – a Curie is a measurement
of how radioactive a material is.
13
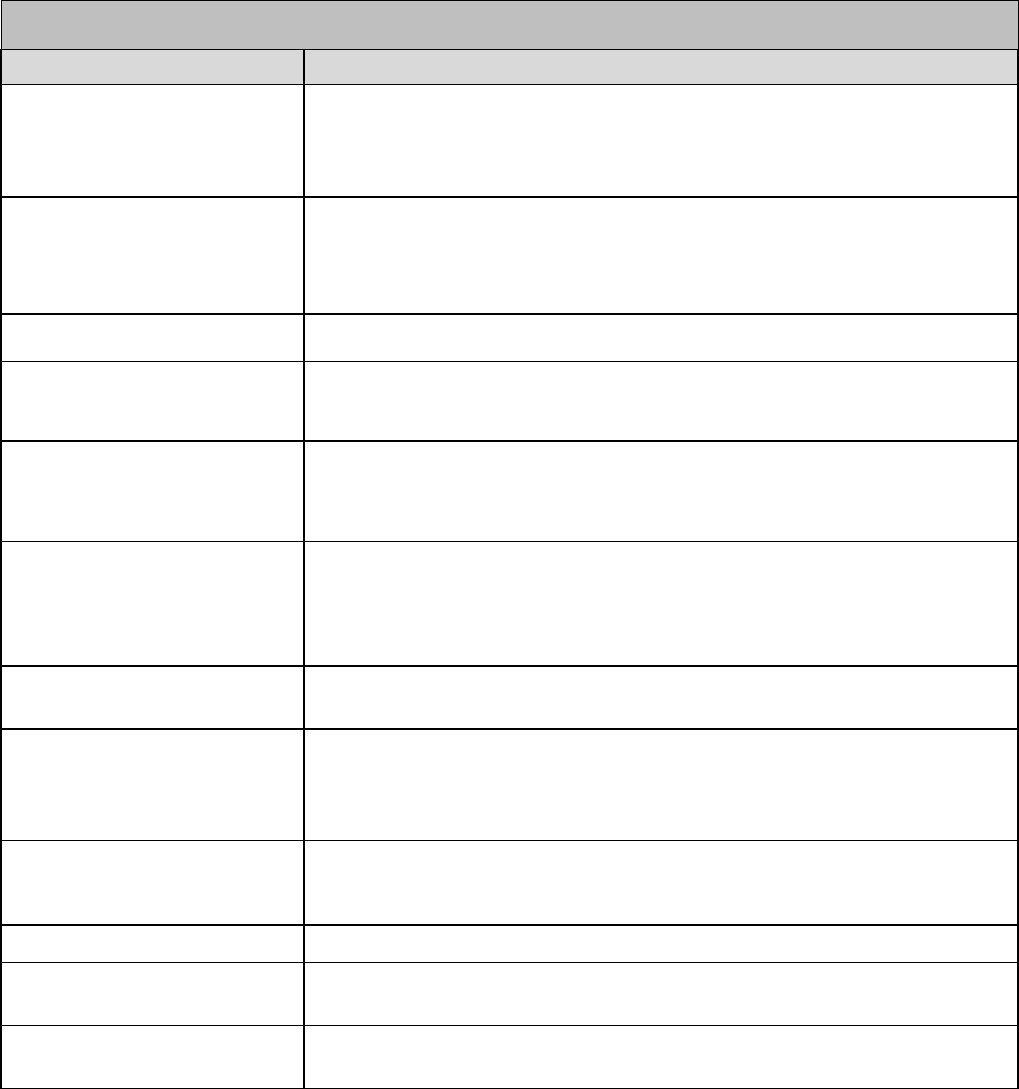
Table 6 – Drinking Water Definitions
Important Drinking Water Definitions
Term
Definition
MCLG
Maximum Contaminant Level Goal: The level of a contaminant in
drinking water below which there is no known or expected risk to health.
MCLGs allow for a margin of safety.
MCL
Maximum Contaminant Level: The highest level of a contaminant that is
allowed in drinking water. MCLs are set as close to the MCLGs as
feasible using the best available treatment technology.
RUL Recommended Upper Limit: NJDEP
TT
Treatment Technique: A required process intended to reduce the level of
a contaminant in drinking water.
AL
Action Level: The concentration of a contaminant which, if exceeded,
triggers treatment or other requirements which a water system must
follow.
LHA
Lifetime Health Advisory levels (LHAs) are not regulatory standards.
LHAs identify the concentration of a chemical of concern in drinking
water at and below which adverse health effects are not anticipated to
occur over specific exposure durations (e.g., 1 day, 10 days, a lifetime).
Variances and Exemptions
Variances and Exemptions: State or EPA permission not to meet an
MCL or a treatment technique under certain conditions.
MRDLG
Maximum residual disinfection level goal. The level of a drinking water
disinfectant below which there is no known or expected risk to health.
MRDLGs do not reflect the benefits of
the use of disinfectants to control
microbial contaminants.
MRDL
Maximum residual disinfectant level. The highest level of a disinfectant
allowed in drinking water. There is convincing evidence that addition of
a disinfectant is necessary for control of microbial contaminants.
MNR Monitored Not Regulated
MPL State Assigned Maximum Permissible Level
LRAA Local (site specific) Running Annual Average

14
Water Conservation Tips
The average U.S. household uses approximately 400 gallons of water per day or 100 gallons per person
per day. Luckily, there are many low-cost and no-cost ways to conserve water. Small changes can
make a big difference – try one today and soon it will become second nature.
• Take short showers - a 5 minute shower uses 4 to 5 gallons of water compared to up to 50 gallons for a
bath.
• Shut off water while brushing your teeth, washing your hair and shaving and save up to 500 gallons a
month.
• Use a water-efficient showerhead. They're inexpensive, easy to install, and can save you up to 750 gallons
a month.
• Run your clothes washer and dishwasher only when they are full. You can save up to 1,000 gallons a
month.
• Water plants only when necessary.
• Fix leaky toilets and faucets. Faucet washers are inexpensive and take only a few minutes to replace. To
check your toilet for a leak, place a few drops of food coloring in the tank and wait. If it seeps into the
toilet bowl without flushing, you have a leak. Fixing it or replacing it with a new, more efficient model
can save up to 1,000 gallons a month.
• Adjust sprinklers so only your lawn is watered. Apply water only as fast as the soil can absorb it and
during the cooler parts of the day to reduce evaporation.
• Teach your children about water conservation to ensure a future generation that uses water wisely. Make
it a family effort to reduce next month's water bill.
• Visit www.epa.gov/watersense for more information.
How can I get Involved?
The Consumer Confidence Report was prepared by Joint Base Water Working Group members from
the 87th Medical Group, 87th Civil Engineer Group and Pride Industries. We welcome your questions
and comments about the water quality from the Dix system. Any questions regarding this report or the
quality of Dix tap water should be directed to the Public Affairs office at (609) 754-2104,
Bioenvironmental Engineering at (609) 754-9057 or Civil Engineering at (609) 754-6166. Copies of
this report are available in the following locations: United Communities Housing Office, Joint Base
Library, Warfighter and Family Readiness Centers, Bioenvironmental Engineering Office, Civil
Engineering Office, and the Dix Correctional Facility.
The public website for the JB MDL installation posted links to the reports here:
https://www.jbmdl.jb.mil/Activity-Feed/About-Us/Environmental-Publications/Consumer-
Confidence-Report/
