
Consumer Confidence Report 2023 - Charlotte Water 1
2023 Annual Drinking Water Quality Report
Charlotte Water
Water System Number: 01-60-010
We are pleased to present to you this year's Annual Drinking Water Quality Report. This report is a snapshot of
last year’s water quality. Included are details about your source(s) of water, what it contains, and how it
compares to standards set by regulatory agencies. Our constant goal is to provide you with a safe and
dependable supply of drinking water. We want you to understand the efforts we make to continually improve
the water treatment process and protect our water resources. We are committed to ensuring the quality of your
water and to providing you with this information because informed customers are our best allies. If you have
any questions about this report or concerning your water, please call 311 or 704-336-7600. You can also
find more information regarding water quality on our website:
https://www.charlottenc.gov/water/Water-Quality
What EPA Wants You to Know
Drinking water, including bottled water, may reasonably be expected to contain at least small amounts of some
contaminants. The presence of contaminants does not necessarily indicate that water poses a health risk. More
information about contaminants and potential health effects can be obtained by calling the Environmental
Protection Agency's Safe Drinking Water Hotline (800-426-4791) or at https://www.epa.gov/aboutepa/epa-
hotlines#drinking
Some people may be more vulnerable to contaminants in drinking water than the general population. Immuno-
compromised persons such as persons with cancer undergoing chemotherapy, persons who have undergone
organ transplants, people with HIV/AIDS or other immune system disorders, some elderly, and infants can be
particularly at risk from infections. These people should seek advice about drinking water from their health care
providers. EPA/CDC guidelines on appropriate means to lessen the risk of infection by Cryptosporidium and other
microbial contaminants are available from the Safe Drinking Water Hotline (800-426-4791), safew[email protected],
or at https://www.epa.gov/aboutepa/epa-hotlines#drinking
If present, elevated levels of lead can cause serious health problems, especially for pregnant women and young
children. Lead in drinking water is primarily from materials and components associated with service lines and
home plumbing. Charlotte Water is responsible for providing high quality drinking water but cannot control the
variety of materials used in plumbing components. When your water has been sitting for several hours, you can
minimize the potential for lead exposure by flushing your tap for 30 seconds to 2 minutes before using water for
drinking or cooking. If you are concerned about lead in your water, you may wish to have your water tested.
Information on lead in drinking water, testing methods, and steps you can take to minimize exposure is available
from the Safe Drinking Water Hotline (800-426-4791) or at https://www.epa.gov/safewater/lead
You may also visit our website at https://charlottewaterlead.org/ for more information on how Charlotte Water’s
lead reduction program.

Consumer Confidence Report 2023 - Charlotte Water 2
The sources of drinking water (both tap water and bottled water) include rivers, lakes, streams, ponds, reservoirs,
springs, and wells. As water travels over the surface of the land or through the ground, it dissolves naturally
occurring minerals and, in some cases, radioactive material, and can pick up substances resulting from the
presence of animals or from human activity. Contaminants that may be present in source water include
microbial contaminants, such as viruses and bacteria, which may come from sewage treatment plants, septic
systems, agricultural livestock operations, and wildlife; inorganic contaminants, such as salts and metals, which
can be naturally-occurring or result from urban storm water runoff, industrial or domestic wastewater
discharges, oil and gas production, mining, or farming; pesticides and herbicides, which may come from a variety
of sources such as agriculture, urban storm water runoff, and residential uses; organic chemical contaminants,
including synthetic and volatile organic chemicals, which are by-products of industrial processes and petroleum
production, and can also come from gas stations, urban storm water runoff, and septic systems; and radioactive
contaminants, which can be naturally-occurring or be the result of oil and gas production and mining activities.
In order to ensure that tap water is safe to drink, EPA prescribes regulations which limit the amount of certain
contaminants in water provided by public water systems. FDA regulations establish limits for contaminants in
bottled water, which must provide the same protection for public health.
When You Turn on Your Tap, Consider the Source
Mountain Island Lake and Lake Norman supply our treatment plants with high quality water for your home,
business, or school. These surface waters are part of the Catawba River Basin, which provides water for more
than 1.5 million people in our growing region. Charlotte Water operates three water treatment plants, and they
collectively treat an average of 116 million gallons of water a day.
Our Treatment Process
Long before you step in the shower or turn on the tap, Charlotte Water employees have managed numerous
processes to protect our drinking water and those who use it. First, we pump the water from Mountain Island
Lake and Lake Norman to one of the three water treatment plants - Franklin, Dukes, or Vest. We add powdered
activated carbon for taste and odor control followed by aluminum sulfate (alum) in the rapid mix phase to cause
dirt particles to coagulate, which are then removed through settling. The water then flows through filters that
trap even smaller particles. We add chlorine to prevent bacterial growth and fluoride to promote dental health.
We also add lime to adjust the water’s pH, which helps prevent pipe corrosion and the leaching of metals into the
water. We then pump the water to homes, businesses, and storage tanks through over 4,570 miles of water
pipes.
Consumer Confidence Report 2023 - Charlotte Water 3
Source Water Assessment Program (SWAP) Results
The North Carolina Department of Environmental Quality (DEQ) Public Water Supply (PWS) Section, Source Water
Assessment Program (SWAP) conducted assessments for all drinking water sources across North Carolina. The
purpose of the assessments was to determine the susceptibility of each drinking water source (well or surface
water intake) to Potential Contaminant Sources (PCSs). The results of the assessment are available in SWAP
Assessment Reports that include maps, background information and a relative susceptibility rating of Higher,
Moderate or Lower.
The relative susceptibility rating of each source for Charlotte Water was determined by combining the
contaminant rating (number and location of PCSs within the assessment area) and the inherent vulnerability
rating (i.e., characteristics or existing conditions of the well or watershed and its delineated assessment area).
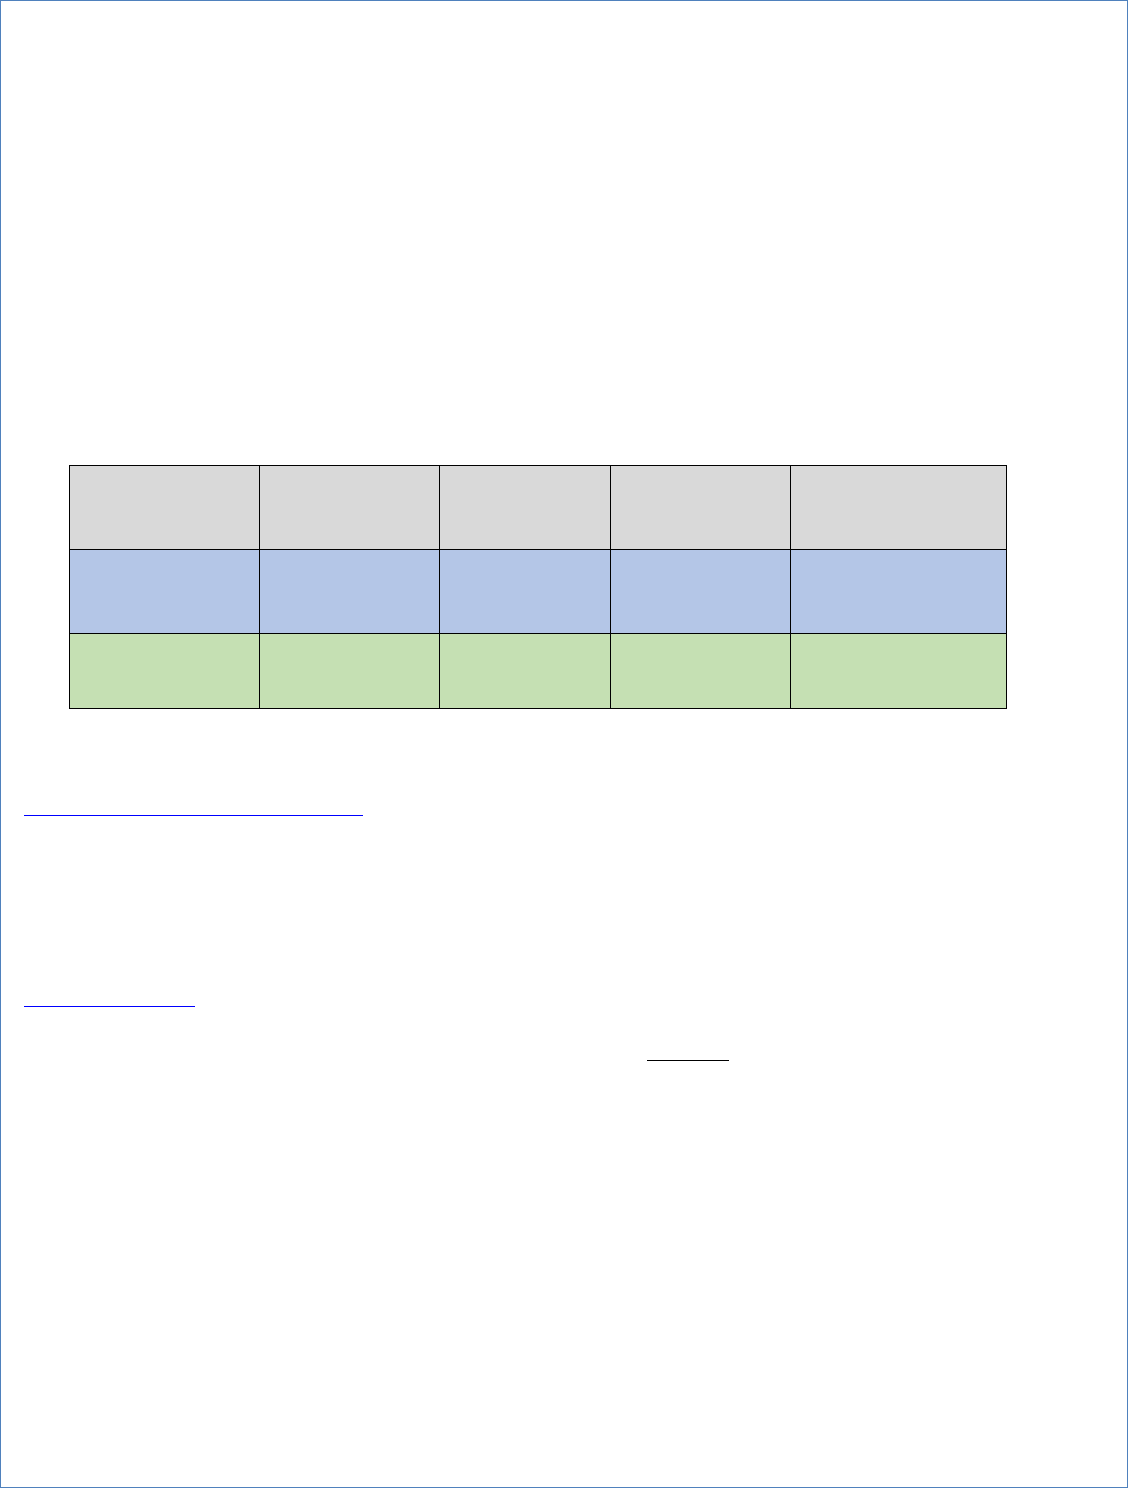
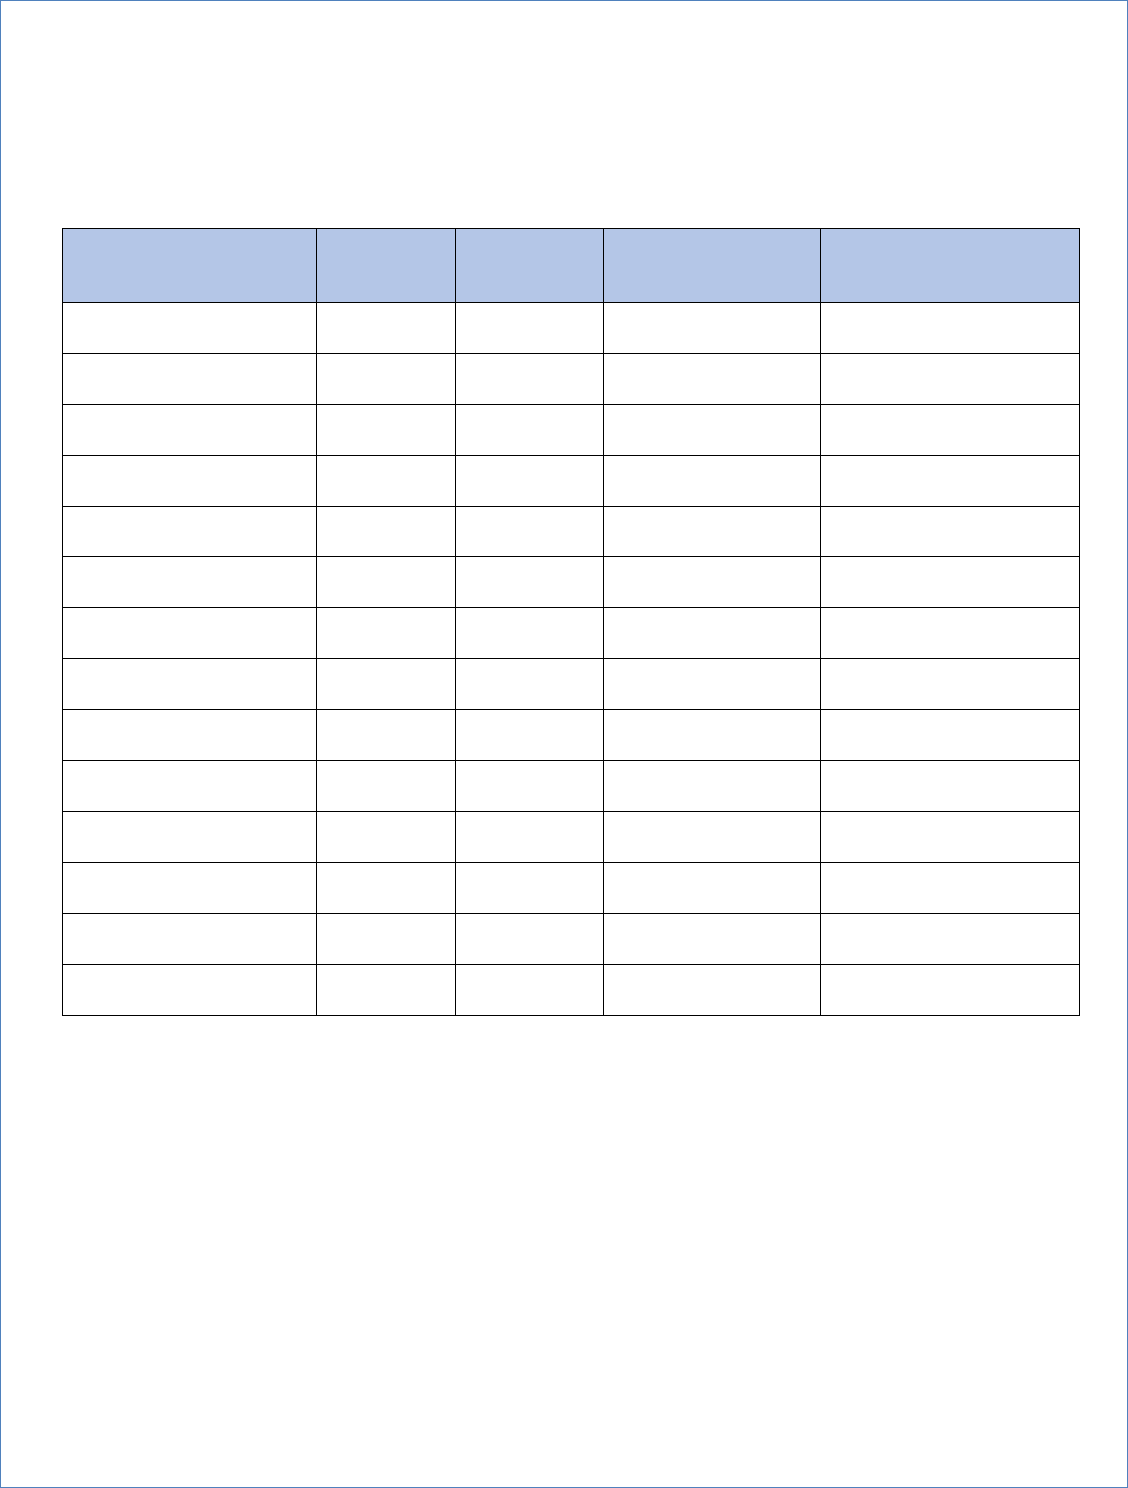
The assessment findings are summarized in the following table:
Susceptibility of Sources to Potential Contaminant Sources (PCSs)
Source
Inherent
Vulnerability
Rating
Contaminant
Rating
Susceptibility
Rating
SWAP
Report
Date
Mt. Island
Lake/Catawba
River
Moderate
Moderate
Moderate
September 2020
Lake Norman
Higher
Higher
Higher
September 2020
Report Date: September 9, 2020
The complete SWAP Assessment report for Charlotte Water may be viewed on the Web at
https://www.ncwater.org/?page=600. Note that because SWAP results and reports are periodically updated by
the PWS Section, the results available on this web site may differ from the results that were available at the time
this Consumer Confidence Report (CCR) was prepared. If you are unable to access your SWAP report on the web,
you may mail a written request for a printed copy to: Source Water Assessment Program – Report Request, 1634
Mail Service Center, Raleigh, NC 27699-1634, or email requests to swap@ncdenr.gov. Please indicate your
system name, number, and provide your name, mailing address and phone number. If you have any questions
about the SWAP report, please contact the Source Water Assessment staff by phone at 919-707-9098 or email at
It is important to understand that a susceptibility rating of “higher” does not imply poor water quality, only the
system’s potential to become contaminated by PCSs in the assessment area.
Help Protect Your Source Water
Protection of drinking water is everyone’s responsibility. Charlotte Water partners with Charlotte-Mecklenburg
Storm Water Services, Duke Energy, the Lake Norman Marine Commission, NC State University, and the NC
Department of Environmental Quality to expand the scope of source water quality monitoring and watershed
protection in Lake Norman and Mountain Island Lake. You can help protect your community’s drinking water
source(s) in several ways: If you see or suspect potential water contaminations, water leaks, or sewage spills,
please call 311 or 704-336-7600. We will respond 24 hours-a-day, 365 days-a-year. Dispose of chemicals
properly and take used motor oil to the four Mecklenburg County recycling centers. Put only toilet paper in the
toilet. All other products should go in the trash including ‘flushable’ wipes.

Consumer Confidence Report 2023 - Charlotte Water 4
Violations that Your Water System Received for the Report Year
During 2023, we received zero drinking water violations.
Important Drinking Water Definitions:
Action Level (AL) - The concentration of a contaminant which, if exceeded, triggers treatment or other
requirements which a water system must follow.
Locational Running Annual Average (LRAA) – The average of sample analytical results for samples taken at a
particular monitoring location during the previous four calendar quarters under the Stage 2 Disinfectants and
Disinfection Byproducts Rule.
Maximum Contaminant Level (MCL) - The highest level of a contaminant that is allowed in drinking water. MCLs
are set as close to the MCLGs as feasible using the best available treatment technology.
Maximum Contaminant Level Goal (MCLG) - The level of a contaminant in drinking water below which there is no
known or expected risk to health. MCLGs allow for a margin of safety.
Maximum Residual Disinfection Level (MRDL) – The highest level of a disinfectant allowed in drinking water.
There is convincing evidence that addition of a disinfectant is necessary for control of microbial contaminants.
Maximum Residual Disinfection Level Goal (MRDLG) – The level of a drinking water disinfectant below which
there is no known or expected risk to health. MRDLGs do not reflect the benefits of the use of disinfectants to
control microbial contaminants.
Nephelometric Turbidity Unit (NTU) - Nephelometric turbidity unit is a measure of the clarity of water. Turbidity
in excess of 5 NTU is just noticeable to the average person.
Non-Detects (ND) - Laboratory analysis indicates that the contaminant is not present at the level of detection set
for the particular methodology used.
Not-Applicable (N/A) – Information not applicable/not required for that particular water system or for that rule.
Parts per million (ppm) or Milligrams per liter (mg/L) - One part per million corresponds to one minute in two
years or a single penny in $10,000.
Parts per billion (ppb) or Micrograms per liter (ug/L) - One part per billion corresponds to one minute in 2,000
years, or a single penny in $10,000,000.
Parts per trillion (ppt) or Nanograms per liter (nanograms/L) - One part per trillion corresponds to one minute
in 2,000,000 years, or a single penny in $10,000,000,000.
Parts per quadrillion (ppq) or Picograms per liter (picograms/L) - One part per quadrillion corresponds to one
minute in 2,000,000,000 years or one penny in $10,000,000,000,000.
Picocuries per liter (pCi/L) - Picocuries per liter is a measure of the radioactivity in water.
Running Annual Average (RAA) – The average of samples taken at all locations throughout the system.

Consumer Confidence Report 2023 - Charlotte Water 5
Total Organic Carbon (TOC) - has no health effects, however, organics provide a medium for the formation of
disinfection byproducts. The TOC compliance criterion applies only to treated water.
Treatment Technique (TT) - A required process intended to reduce the level of a contaminant in drinking water.
___________________________________________________________________________________________
Water Quality Data Tables of Detected Contaminants
We routinely monitor for over 150 contaminants in your drinking water according to Federal and State laws. The
following tables list all the drinking water contaminants that we detected in the last round of sampling for each
contaminant group. The presence of contaminants does not necessarily indicate that water poses a health risk.
Unless otherwise noted, the data presented in this table is from testing done January 1 through
December 31, 2023. The EPA and the State allow us to monitor for certain contaminants less than once per year
because the concentrations of these contaminants are not expected to vary significantly from year to year. Some
of the data, though representative of the water quality, is more than one year old.
Note: Vest WTP was offline part of the year: from 1/1/23 – 5/21/23 for rehabilitation.
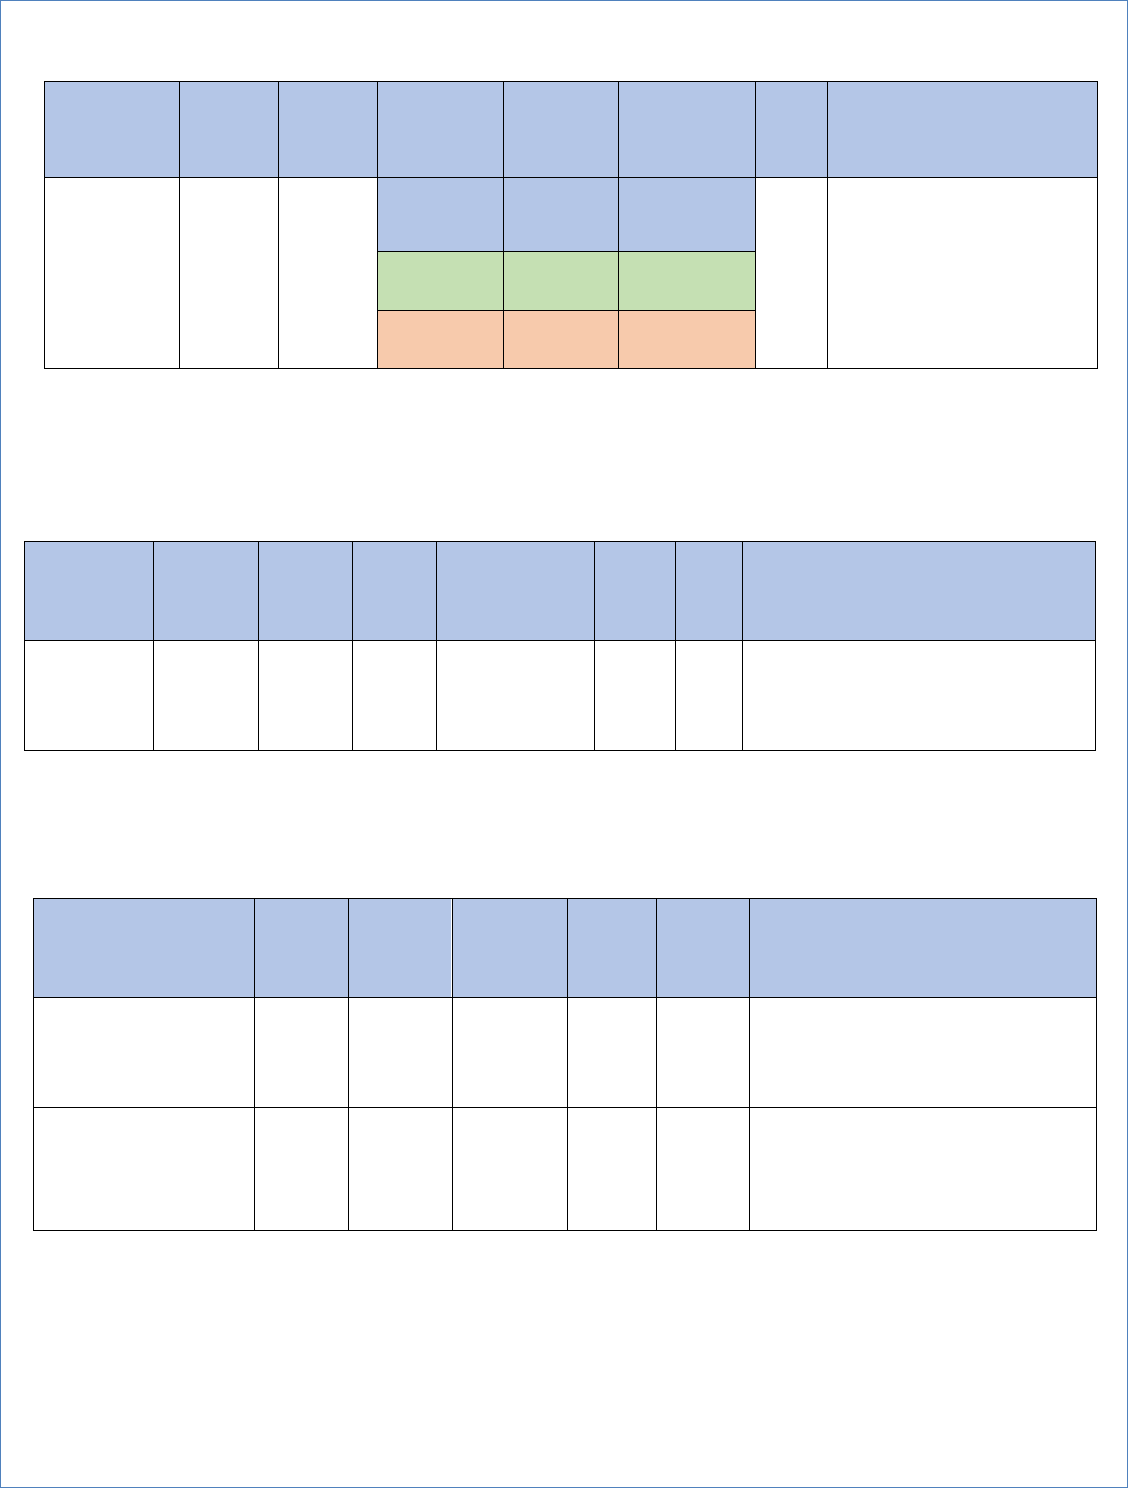
Tables of Detected Contaminants
Turbidity*
Nephelometric
Turbidity Unit
(NTU)
Year
Sampled
Treatment
Technique
(TT)
Violation
Y/N
Water
Treatment
Plant (WTP)
Result
NTU
MCLG
Treatment
Technique (TT)
Violation if:
Likely Source of
Contamination
Highest Single
Turbidity
Measurement
2023
N
Franklin
0.274
N/A
Turbidity > 1.0
NTU
Soil runoff
Dukes
0.187
Vest
0.098
Lowest Monthly
Percentage (%) of
Samples Meeting
Turbidity Limits
2023
N
Franklin
100%
N/A
Less than 95% of
monthly turbidity
measurements
are
≤0.3 NTU
Dukes
100%
Vest
100%
* Turbidity (NTU) is a measure of the cloudiness of the water. We monitor it because it is a good indicator of the effectiveness
of our filtration system. The turbidity rule requires that 95% or more of the monthly samples must be less than or equal to 0.3
NTU.
Consumer Confidence Report 2023 - Charlotte Water 6
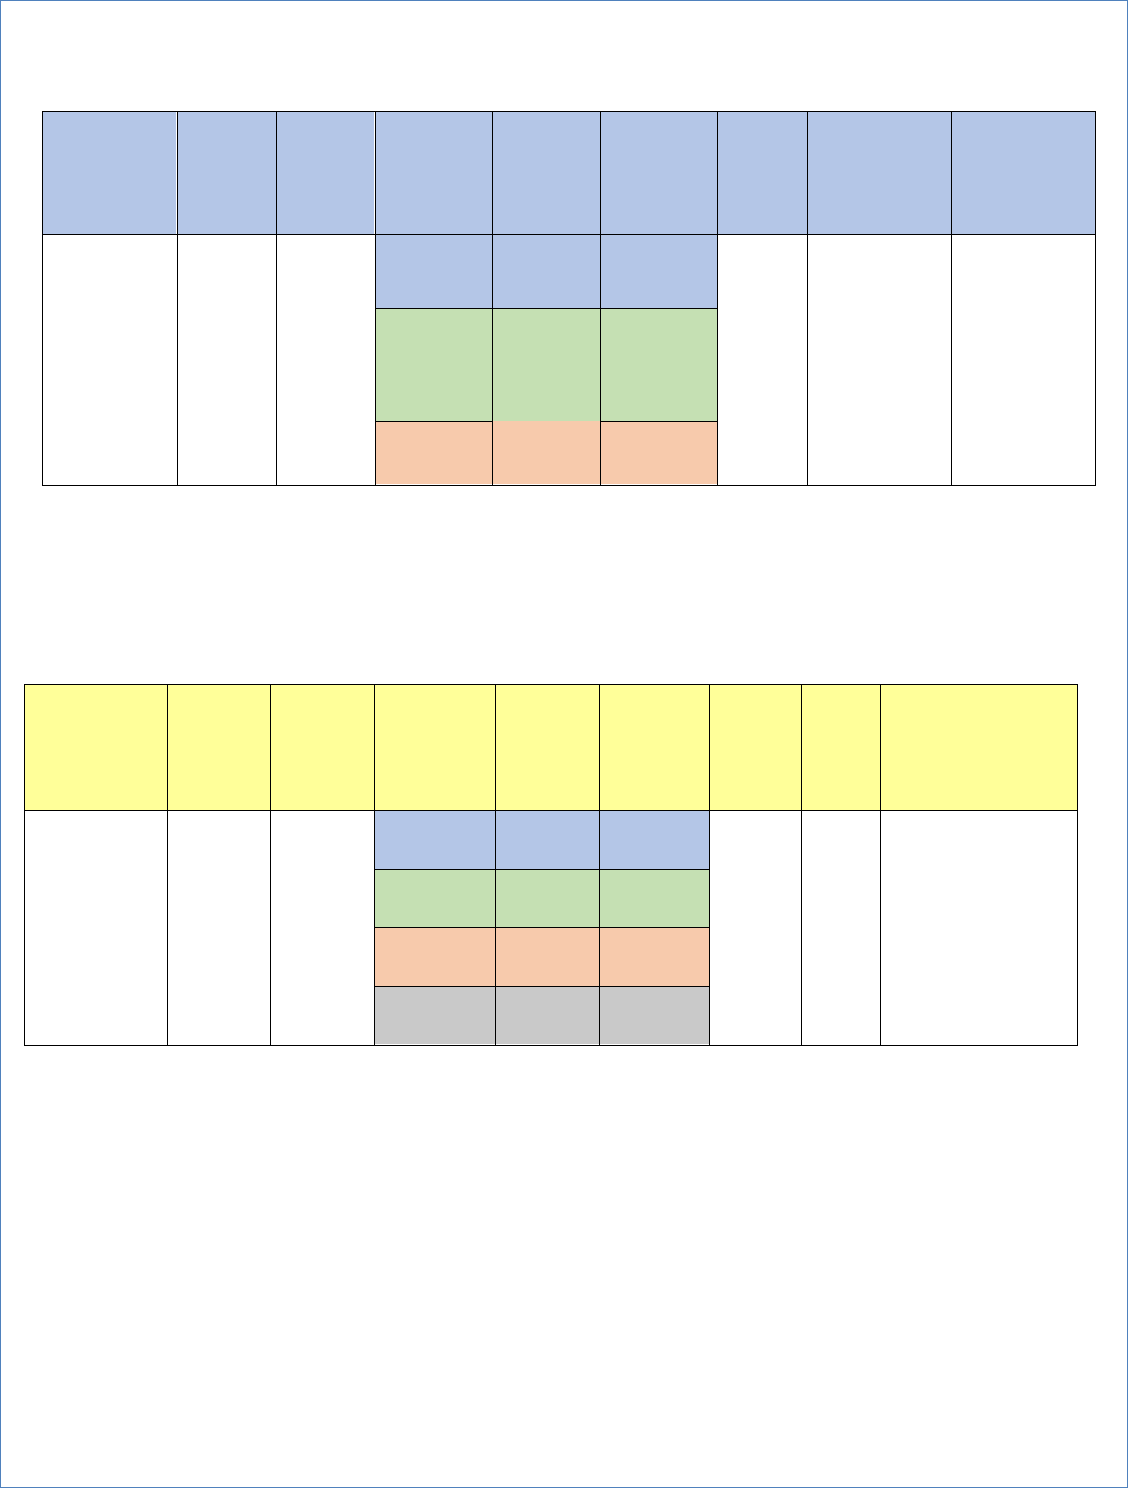
Inorganic Contaminants
Contaminant
Year
Sampled
MCL
Violation
Y/N
Water
Treatment
Plant (WTP)
Result
(highest)
Range
Low - High
MCLG
Likely source of
contamination
Fluoride
(ppm)
2023
N
Franklin
0.84
0.19 – 0.84
4
Erosion of natural deposits;
water additive which
promotes strong teeth;
discharge from fertilizer and
aluminum factories
Dukes
0.83
0.60 - 0.83
Vest*
1.55*
0.09 – 1.55*
* A Tracer Study was conducted at the Vest WTP using Fluoride and is the reason for the expanded low-high range. This
was temporary, over the range of just a few days in 2023.
Synthetic Organic Chemical (SOC) Contaminants Including Pesticides and Herbicides
Contaminant
(units)
Sample
Date
MCL
Violation
Y/N
Result
Range
Low - High
MCLG
MCL
Likely Source of Contamination
2,4-D (ppb)
7/11/2023
N
0.15
ND – 0.15
70
70
Runoff from herbicide used on row
crops
Lead and Copper Contaminants
Contaminant (units)
Year
Sampled
Result
Number of
sites found
above the
AL
MCLG
AL
Likely Source of Contamination
Copper (ppm)
(90
th
percentile)
2022
None
detected
at 90
th
percentile
0
1.3
AL=1.3
Corrosion of household plumbing
systems; erosion of natural deposits
Lead (ppb)
(90
th
percentile)
2022
None
detected
at 90
th
percentile
0
0
AL=15
Corrosion of household plumbing
systems; erosion of natural deposits
Compliance sampling schedule is once/3yrs. The next sampling event will be in 2025.
Consumer Confidence Report 2023 - Charlotte Water 7
Total Organic Carbon (TOC)
Contaminant
(units)
Year
Sampled
TT
Violation
Y/N
Water
Treatment
Plant (WTP)
Lowest
RAA
Removal
Ratio
Range
Monthly
Removal
Ratio
Low – High
MCLG
Compliance
Method
(Step 1 or
ACC#__)
Likely Source of
Contamination
Total Organic
Carbon
(removal
ratio)
(TOC)-
TREATED
(ppm)
2023
No
Franklin
0.87
0.76 - 1.18
N/A
Naturally
present in the
environment
Dukes
0.86
0.71 – 1.07
Compliance
Method ACC#2
Treated Water
<2.00 ppm
Vest
0.95
0.89 – 1.01
The RAA of our removal ratio was below 1.00 during the year, but this was not a treatment technique violation because we
met the alternative compliance criteria (ACC) Method #2 for TOC removal as our Treated Water TOC was less than 2.00
ppm.
Disinfectant Residuals Summary
Contaminant
(units)
Year
Sampled
MRDL
Violation
Y/N
Water
Treatment
Plant
(WTP)
Highest
Running
Annual
Average
(RAA)
Range
Low - High
MRDLG
MRDL
Likely Source of
Contamination
Chlorine
(ppm)
2023
No
Franklin
1.42
0.82 – 1.79
4
4.0
Water additive used
to control microbes
Dukes
1.38
1.12 – 1.68
Vest
1.49
1.14 – 1.95
Distribution
System
1.02
0.51 – 1.59
Consumer Confidence Report 2023 - Charlotte Water 8
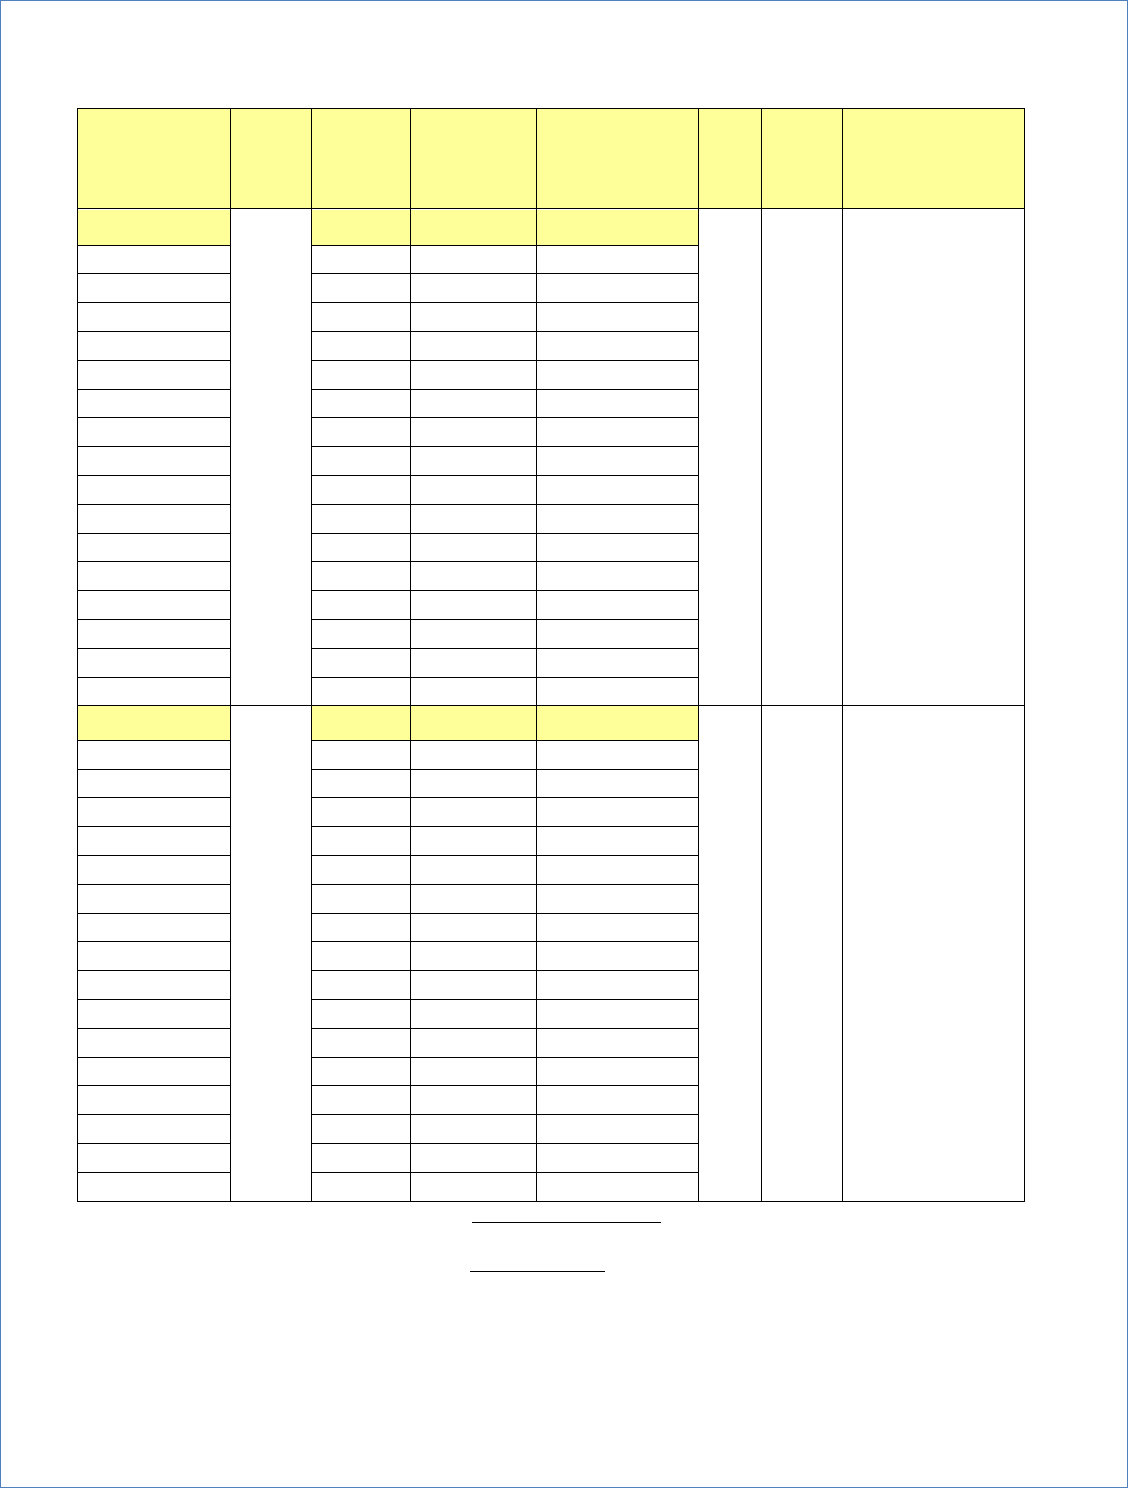
Stage 2 Disinfection Byproduct Compliance - Based upon Locational Running Annual Average (highest
LRAA)
Disinfection
Byproduct
Year
Sampled
MCL
Violation
Y/N
Result
(highest LRAA)
Range
Low High
MCLG
MCL
Likely Source of
Contamination
TTHM (ppb)
2023
N
53.6
22.5 – 77.0
N/A
80
Byproduct of drinking
water disinfection
Location: B01
N
45.8
29.1 – 60.5
Location: B02
N
43.3
32.3 – 58.1
Location: B03
N
42.8
29.0 – 59.3
Location: B04
N
53.6
35.6 – 77.0
Location: B05
N
49.8
33.0 – 67.2
Location: B06
N
53.0
32.3 – 75.1
Location: B07
N
41.7
26.4 – 51.8
Location: B08
N
40.8
26.2 – 59.6
Location: B09
N
42.3
30.9 – 57.0
Location: B10
N
39.6
24.1 – 58.2
Location: B11
N
40.6
23.1 – 64.4
Location: B12
N
53.4
33.0 – 77.0
Location: B13
N
48.4
29.4 – 71.1
Location: B14
N
33.5
22.5 – 44.9
Location: B15
N
49.0
31.4 – 76.8
Location: B16
N
44.1
27.6 – 65.5
HAA5 (ppb)
2023
N
20.1
11.8 – 23.8
N/A
60
Byproduct of drinking
water disinfection
Location: B01
N
20.1
14.1 – 23.8
Location: B02
N
17.8
12.8 – 20.7
Location: B03
N
17.9
14.0 – 21.5
Location: B04
N
18.3
15.1 – 21.6
Location: B05
N
18.5
15.9 – 20.6
Location: B06
N
18.3
15.9 – 22.5
Location: B07
N
16.8
13.7 – 18.9
Location: B08
N
17.5
12.4 – 20.4
Location: B09
N
18.2
12.5 – 21.8
Location: B10
N
17.8
12.2 – 21.4
Location: B11
N
17.7
11.8 – 19.8
Location: B12
N
16.4
12.9 – 22.1
Location: B13
N
17.5
14.4 – 21.6
Location: B14
N
16.7
12.5 – 18.9
Location: B15
N
19.8
14.5 – 23.0
Location: B16
N
17.2
13.0 – 22.0
For TTHM: Some people who drink water containing Total Trihalomethanes above the MCL over many years may experience
problems with their liver, kidneys, or central nervous systems, and may have an increased risk of getting cancer.
For HAA5: Some people who drink water containing Haloacetic Acids above the MCL over many years may have an increased
risk of getting cancer.
Consumer Confidence Report 2023 - Charlotte Water 9
The PWS Section requires monitoring for other misc. contaminants, some for which the EPA has set national
secondary drinking water standards (SMCLs) because they may cause cosmetic effects or aesthetic effects (such
as taste, odor, and/or color) in drinking water. The contaminants with SMCLs normally do not have any health
effects and normally do not affect the safety of your water.
Other Miscellaneous Water Characteristics Contaminants – At Entry Point to Distribution System
* The PWS Section has established a pH range of 7.0 – 9.2 for Charlotte Water in order to ensure optimal
corrosion control treatment.
Contaminant (units)
Year Sampled
Result
(average)
Range
Low High
Secondary MCL
Alkalinity (ppm)
2023
22
20 – 24
N/A
Aluminum (ppb)
2023
33
25 – 48
50-200 ppb
Calcium Hardness as
CaCO3 (ppm)
2023
23
20 – 25
N/A
Chloride (ppm)
2023
6.6
6.1 – 7.0
250 ppm
Conductivity (umhos/cm)
2023
94
87 – 98
N/A
Hardness, Total as CaCO3
(ppm)
2023
30
27 – 32
N/A
Iron, Total (ppb)
2023
1
0 - 14
300
Magnesium (ppm)
2023
1.8
1.7 – 1.9
N/A
Manganese (ppb)
2023
0.2
0 – 23
50
pH
2023
8.6
7.0 – 9.4
6.5 – 8.5*
Silica (ppm)
2023
9.1
7.6 – 11.4
N/A
Sodium (ppm)
2023
3.9
3.6 – 4.8
N/A
Sulfate (ppm)
2023
8.2
7.5 – 9.0
250 ppm
Total Dissolved Solids (TDS)
(ppm)
2023
59
50 – 65
500 ppm
Consumer Confidence Report 2023 - Charlotte Water 10
Cryptosporidium
Charlotte Water monitors quarterly for Cryptosporidium and Giardia. There were zero detects for 2023.
Cryptosporidium is a microbial pathogen found in surface water throughout the U.S. Although filtration removes
Cryptosporidium, the most commonly used filtration methods cannot guarantee 100 percent removal. Our
monitoring indicates the presence of these organisms in our source water and/or finished water. Current test
methods do not allow us to determine if the organisms are dead or if they are capable of causing disease.
Ingestion of Cryptosporidium may cause cryptosporidiosis, an abdominal infection. Symptoms of infection
include nausea, diarrhea, and abdominal cramps. Most healthy individuals can overcome the disease within a
few weeks. However, immuno-compromised people, infants and small children, and the elderly are at greater
risk of developing life-threatening illness. We encourage immuno-compromised individuals to consult their
doctor regarding appropriate precautions to take to avoid infection. Cryptosporidium must be ingested to cause
disease, and it may be spread through means other than drinking water.
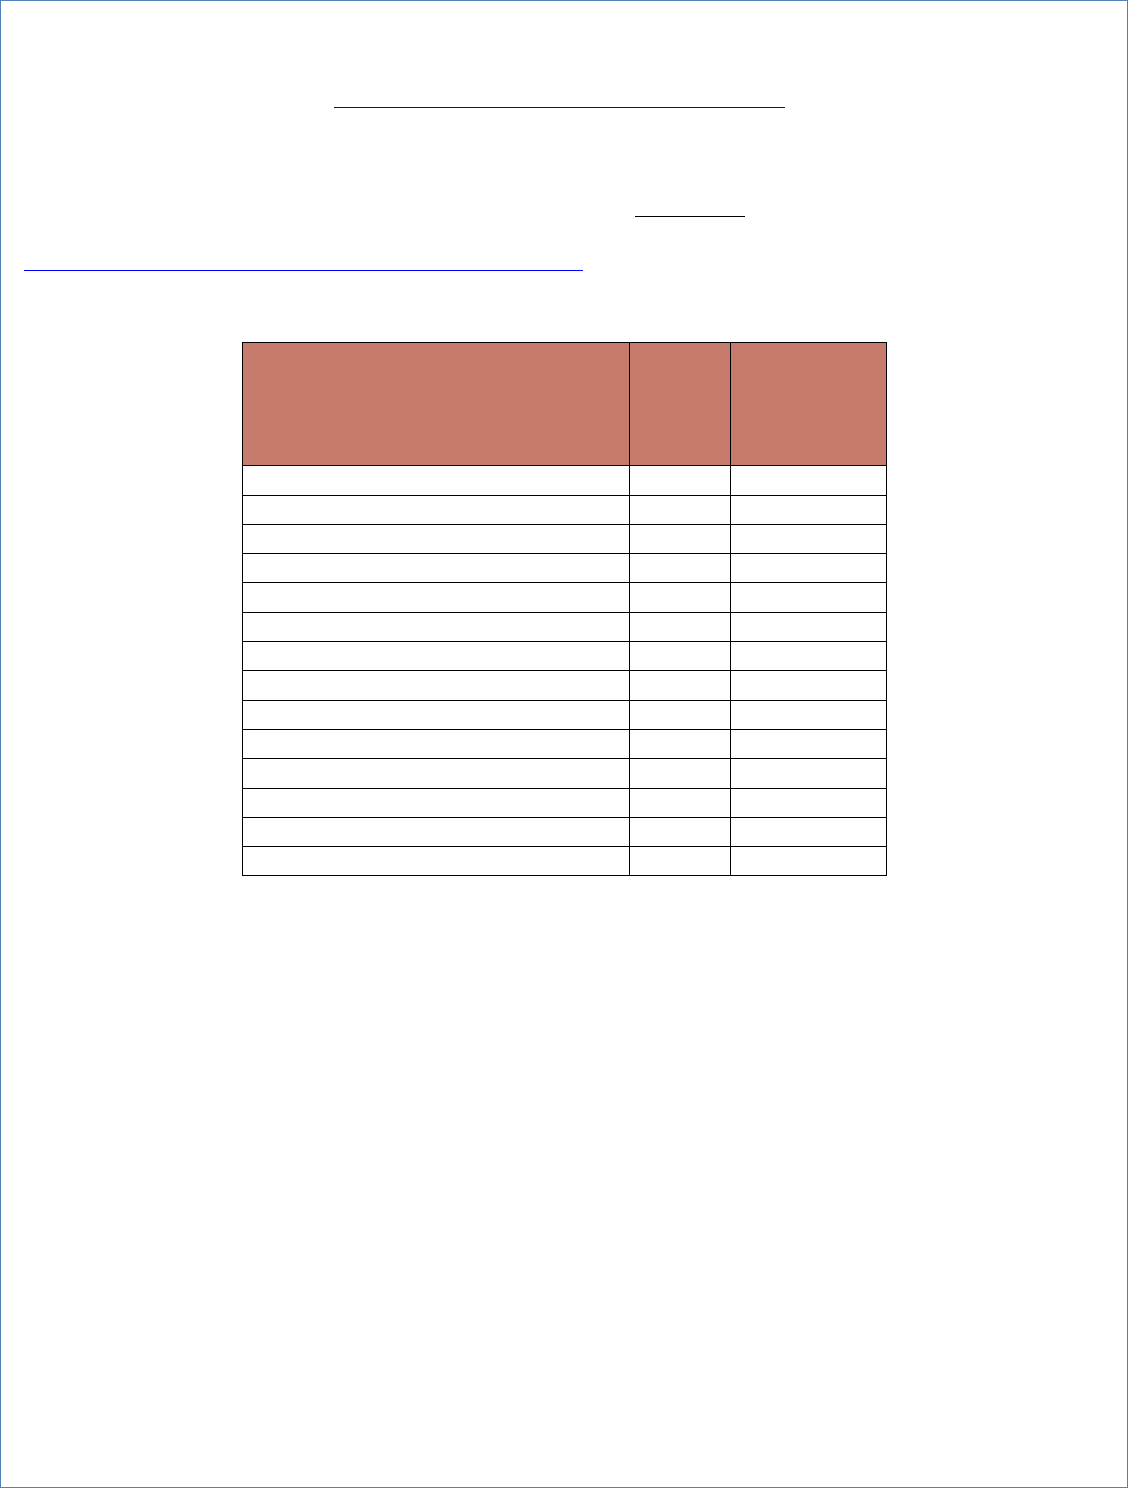
Unregulated Contaminants Monitoring Rule (UCMR) 5 – Required by EPA
Unregulated contaminants are those for which EPA has not established drinking water standards. The purpose
of unregulated contaminant monitoring rule is to assist EPA in determining the occurrence of unregulated
contaminants in drinking water and whether future regulations are warranted.
This sampling is conducted once every 5 years.
Contaminant (units)
Sample Date(s)
Result
(Average of all
Entry Point
samples)
Range
Low High
PFPeA - Perfluoropentanoic Acid (ppt)
Aug 2023, Nov 2023
1.3
ND – 3.4
PFBA – Perfluorobutanoic Acid (ppt)
Aug 2023, Nov 2023
1.5
ND – 9.7
Consumer Confidence Report 2023 - Charlotte Water 11
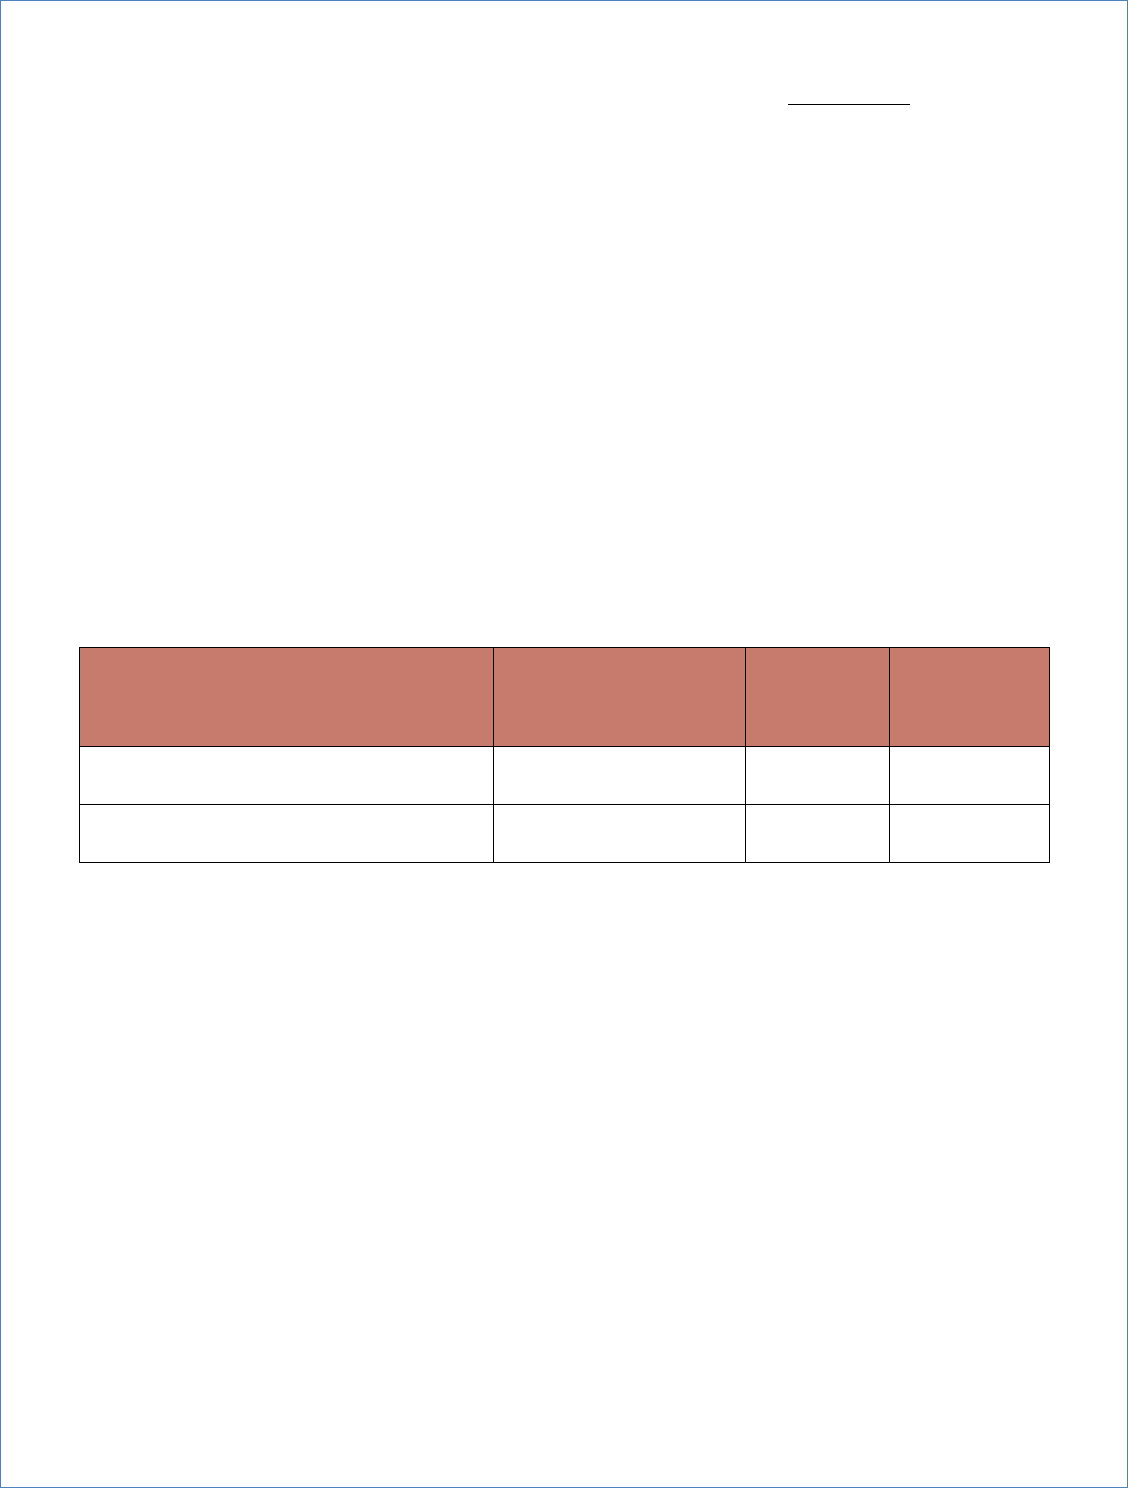
Additional Monitoring of Other Unregulated Contaminants
In addition to participating in the EPA’s Unregulated Contaminant Monitoring Rule, Charlotte Water has been
working with an outside certified laboratory to analyze drinking water samples for other unregulated
contaminants.
The following table reflects results only when a contaminant is detected. A full list of all the non-detected
contaminants can be found on our website at:
https://www.charlottenc.gov/water/Water-Quality/CCR#tabs
Definitions from EPA 2018 Edition of the Drinking Water Standards and Health Advisories Tables:
Health Advisory (HA): An estimate of acceptable drinking water levels for a chemical substance based on health effects information;
an HA is not a legally enforceable Federal standard, but serves as technical guidance to assist Federal, State, and local officials.
1
DWEL: Drinking Water Equivalent Level. A DWEL is a drinking water lifetime exposure level, assuming 100% exposure from that
medium, at which adverse, noncarcinogenic health effects would not be expected to occur.
2
Subchronic value for pregnant women.
3
Lifetime HA: The concentration of a chemical in drinking water that is not expected to cause any adverse noncarcinogenic effects
for a lifetime of exposure, incorporating a drinking water RSC factor of contaminant-specific data or a default of 20% of total
exposure from all sources. The Lifetime HA is based on exposure of a 70-kg adult consuming 2 liters of water per day. For Lifetime
HAs developed for drinking water contaminants before the Lifetime HA policy change to develop Lifetime HAs for all drinking water
contaminants regardless of carcinogenicity status in this DWSHA update, the Lifetime HA for Group C carcinogens, as indicated by
the 1986 Cancer Guidelines, includes an uncertainty adjustment factor of 10 for possible carcinogenicity.
Contaminant (units)
Result
(Highest)
EPA Health
Advisory (DWEL
used unless
otherwise
noted)
Boron (ppb)
37
7,000
1
Bromochloroacetic acid (ppb)
3.3
Bromochloroacetonitrile (ppb)
0.83
Bromodichloroacetic acid (ppb)
1.3
Chromium, Hexavalent (ppb)
0.14
Dibromoacetonitrile (ppb)
0.52
Dichloroacetonitrile (ppb)
1.2
Iodate (ppb)
7.0
Perchlorate (ppb)
0.06
25
2
Perfluorohexanoic acid (PFHxA) (ppt)
2.4
Perfluorooctanesulfonamide (PFOSA) (ppt)
2.6
Perfluorooctanoic acid (PFOA) (ppt)
1.7
0.004
3
Perfluoropentanoic acid (PFPeA) (ppt)
2.7
Strontium (ppb)
39
20,000
1
