
Page 1
Consumer Confidence Report 2016
City of Great Falls, Public Drinking Water Supply
P. O. Box 5021, Great Falls, MT 59403 Phone (406) 455 -8557
This report is prepared annually by the City of Great Falls Water Utility. Its purpose is to inform the public about the quality
of our municipal drinking water. Please take a few minutes to review it and feel free to call us with any questions.
The source of our water
The drinking water used by the residents of Great Falls, Malmstrom Air Force Base and Black Eagle is water that was
pumped from the Missouri River and treated to make it safe to drink. The water treatment facility is located just upstream
from the Missouri’s confluence with the Sun River in Great Falls.
Water treatment and purification
Great Falls utilizes a conventional water treatment process, producing on average 4.5 billion gallons of safe drinking water
per year. The process is monitored continuously both electronically and with grab samples of treated water. Only after
careful scrutiny is water allowed to flow through underground water mains to reservoirs for use in homes and businesses.
City water personnel stay abreast of new Federal and State drinking water regulations so that treatment and/or monitoring
changes can be implemented as needed in a timely and cost-effective manner. The City is committed to the goal of
providing its citizens with a safe and dependable supply of drinking water. This goal was achieved during 2016 by
operating without any violations or variances regarding water quality.
What contaminants are present in our source water?
Water that precipitates from the atmosphere flows
across the surface of the land or percolates through the
soil. Naturally occurring minerals dissolve and waste
substances produced by plants, animals and humans
are picked up. The water then either becomes
groundwater or makes its way to a stream, river, pond,
lake or reservoir. This accumulated water can then be
used as a drinking water source.
Contaminants that may need to be removed from
source water before it can be considered safe to drink
include:
Microbial contaminants, including viruses, bacteria
and protozoa. These can originate from sewage
treatment plants, septic systems, agricultural
livestock operations and wildlife.
Inorganic contaminants, such as salts and metals.
These can be naturally occurring or the result of
urban storm water runoff, industrial or domestic
wastewater discharges, oil and gas production,
mining or farming.
Pesticides and herbicides. These may come from a
variety of sources including agriculture, urban storm
water runoff and residential uses.
Organic chemical contaminants, including synthetic
and volatile organic chemicals. These are by-
products of industrial processes and petroleum
production and can also come from gas stations,
urban storm water runoff and septic systems.
Radioactive contaminants. These can be naturally
occurring or the result of oil and gas production or
mining activities.
Montana’s Department of Environmental Quality (DEQ)
completed and made available the Great Falls source
water delineation and assessment report. This report
delineates a source water protection area for Great
Falls (an area of surface water and land that contributes
water to the Great Falls Public Water Supply). It also
identifies locations or regions within this area where
contaminants might be generated, stored or transported
and addresses their relative potential for contaminating
Great Falls drinking water. The report can be used to
develop a source water protection plan for Great Falls.

Page 2
Do I need to take special precautions?
The Environmental Protection Agency diligently
establishes regulations setting allowable limits for
contaminants in drinking water delivered by public water
systems. The Food and Drug Administration regulates
contaminants in bottled water, affording equivalent
protection to public health. Any drinking water may be
reasonably expected to contain allowable amounts of
some contaminants. It's important to remember that the
presence of these contaminants does not necessarily
mean the water will pose a health risk. Detailed
information about contaminants and potential health
effects can be obtained by calling the Environmental
Protection Agency’s Safe Drinking Water Hotline (1-800-
426-4791) or our local City-County Health Department
(454-6950).
Certain people may be more vulnerable to contaminants
in drinking water than the general population. For
example, immuno-compromised persons such as
persons with cancer undergoing chemotherapy, persons
who have undergone organ transplants, persons having
HIV/AIDS or other immune system disorders, some
elderly, and infants can be particularly at risk from
infections caused by certain microbiological
contaminants. These people should seek advice about
their drinking water from their health care providers.
EPA/CDC guidelines on appropriate means to lessen the
risk of infection by cryptosporidium and other
microbiological contaminants are available from the Safe
Drinking Water Hotline (1-800-426-4791).
How can I become involved?
You can learn more about your local water utility by attending any of the regularly scheduled City Commission meetings
on the first and third Tuesdays of every month at 7:00 p.m. in the Commission Chambers at the Great Falls Civic Center.
You may also arrange a tour of the local water treatment plant by calling 727-1325. Regulatory updates and other
interesting information can be found by visiting the American Water Works Association web site at http://www.awwa.org.
Questions & Answers
Q: How often is our drinking water tested?
A: The type and frequency of testing required is based
on the water's source and the number of people served.
Great Falls is classified as a medium-sized (between
50,000 and 100,000 served) surface water (Missouri
River) community public water supply. As such, Great
Falls is required to monitor the levels of some drinking
water constituents, such as disinfectant residual,
continuously while other constituents, such as
radionuclides, are required to be tested only once every
several years. The data presented in the tables
contained in this report are the results from the most
recent testing done in accordance with the applicable
regulations.
Q: Why does the water coming out of my tap look
milky sometimes but then clear up in my glass after
a few seconds?
A: The water coming into your home may contain air
held in solution by the pressure of the water system. As
the water leaves the tap, the pressure rapidly decreases
causing millions of tiny air bubbles to be suspended in
the water, producing the milky appearance. The water
then clears from the bottom of the container as the air
bubbles rise and return to the atmosphere.
Q: How hard is Great Falls water?
A: Great Falls water is classified as moderately hard,
ranging from 127 to 167 milligrams per liter as calcium
carbonate or 7.4 to 9.8 grains per gallon. Some
households install water softeners as a matter of
personal preference but softening is generally not
necessary.
Some Facts about Water
Of the 326 million cubic miles of water on earth, 97% is seawater. Of the remaining 3%, 77% is frozen and 22% is
underground. This leaves each person on our planet enough liquid fresh surface water to fill a cube 130 feet on a side.
But the water is not evenly distributed and is in constant demand. One gallon of water weighs about 8⅓ pounds. Average
total water use (both indoor and outdoor) for a typical single-family home is about 100 gallons per person per day. You
can fill an 8-ounce glass with drinking water 15,000 times for the same cost as a six-pack of soda. You can survive about
a month without food, but only 5 to 7 days without water.

Page 3
Water Analysis Data
The data tables on the next several pages contain terms and abbreviations with which you may be unfamiliar. In order to
help you better understand this data we offer the following definitions and explanations:
parts per million (ppm) or milligrams per liter (mg/l) - one part per million is equivalent to one minute in two years or
one penny in $10,000.
parts per billion (ppb) or micrograms per liter (
g/l) - one part per billion is equivalent to one minute in 2,000 years or
one penny in $10,000,000.
picocuries per liter (pCi/l) - a measure of radioactivity in water.
millirems per year (mrem/yr) - a measure of radiation exposure. In the United States, the average person is exposed to
an effective dose equivalent of approximately 360 mrem (whole body exposure) per year from all sources.
Nephelometric Turbidity Unit (NTU) - a measure of the clarity of water. Water having turbidity in excess of 5 NTU would
appear noticeably cloudy to the average person.
Maximum Contaminant Level Goal - the “Goal” (MCLG) is the level of a contaminant in drinking water below which
there is no known or expected risk to health. MCLGs allow for a margin of safety.
Maximum Contaminant Level - the “Maximum Allowed” (MCL) is the highest level of a contaminant that is allowed in
drinking water. MCLs are set as close to the MCLGs as feasible using the best available treatment technology.
Maximum Residual Disinfection Level Goal or MRDLG - the level of a drinking water disinfectant below which there is
no known or expected risk to health. MRDLGs do not reflect the benefits of the use of disinfectants to control microbial
contaminants.
Maximum Residual Disinfection Level or MRDL - the highest level of a disinfectant allowed in drinking water. There is
convincing evidence that the addition of a disinfectant is necessary for control of microbial contaminants.
Action Level (AL) - the concentration of a contaminant which, if exceeded, triggers treatment or other requirements
which a water system must follow.
Treatment Technique (TT) - a required process intended to reduce the level of a contaminant in drinking water.
Variances and Exemptions – State or EPA permission not to meet an MCL or a treatment technique under certain
conditions.
The City of Great Falls routinely monitors for contaminants in drinking water according to Federal and State laws. The four
data tables included in this report document the test results from monitoring during the period January 1
st
through
December 31
st
, 2016. The State of Montana requires monitoring for some contaminants less than once per year because
the concentrations of these contaminants do not change frequently. Therefore some of the following data, though
representative, are more than one year old. The tables are arranged as follows:
Table I. Regulated Contaminants Detected
Table II. Unregulated Contaminants Detected
Table III. Regulated Contaminants Not Detected
Additional report copies are available free of charge from the Great Falls Water Treatment Plant.
If you have any questions about this report or your water utility, please contact Eva Maydole, Water Quality Specialist for
city of Great Falls or Wayne Lovelis, the Plant Manager at (406) 727-1325.
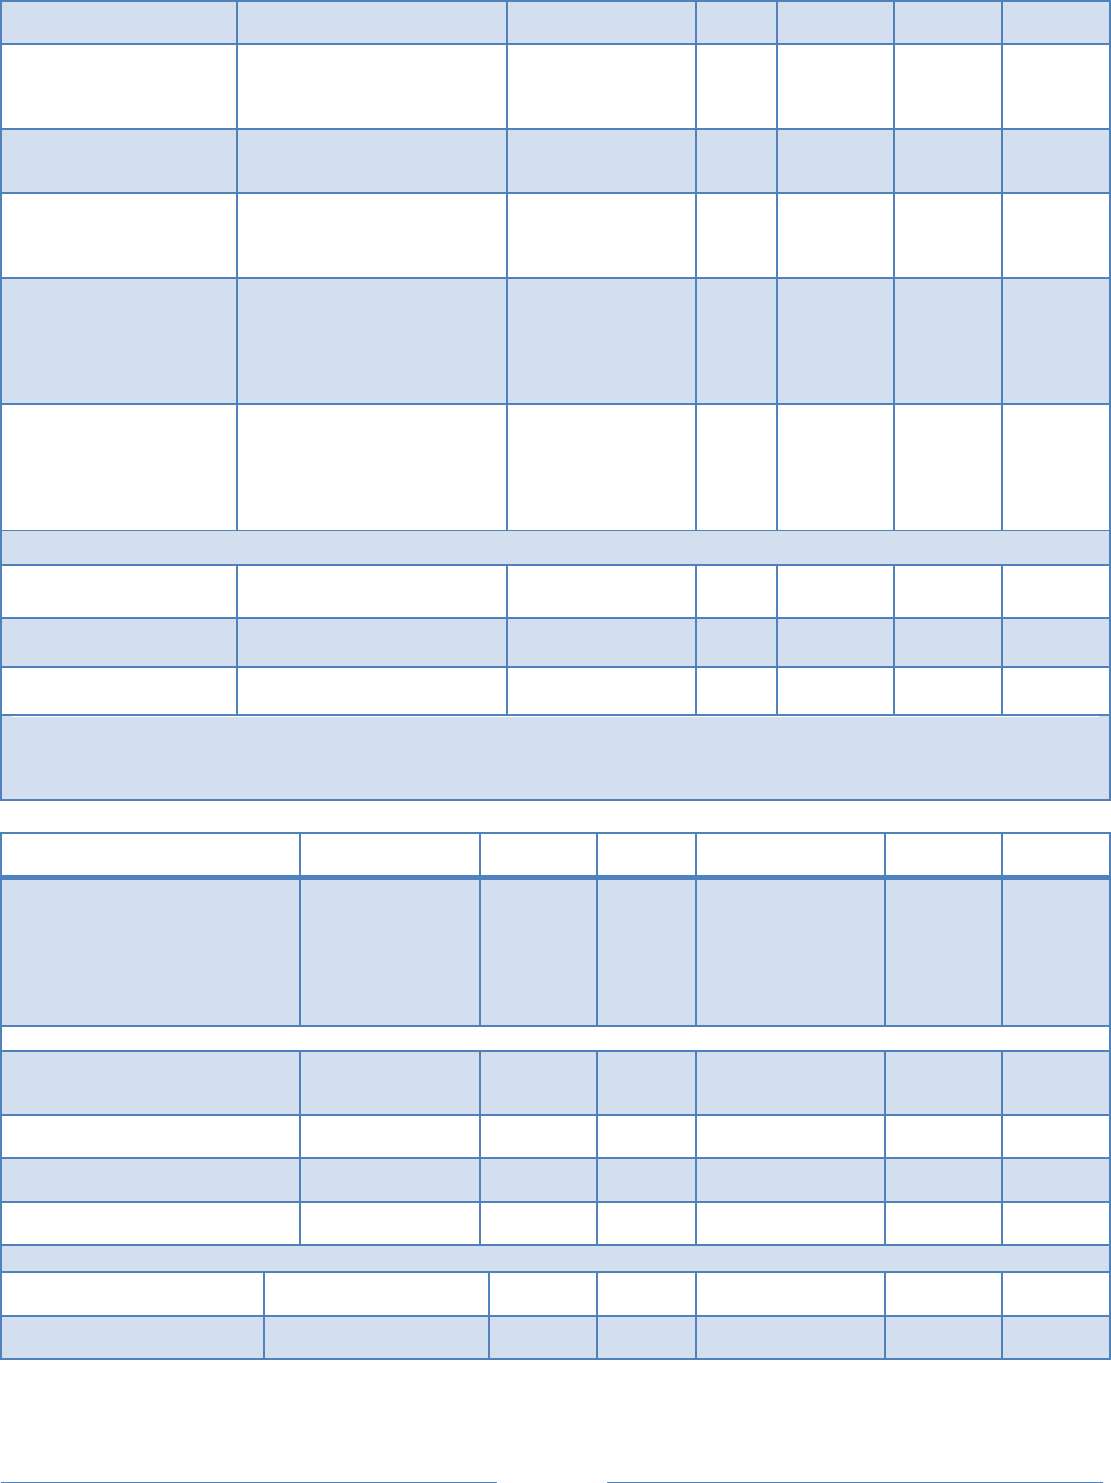
Table I. Regulated Contaminants Detected
Page 4
Contaminant
Likely Source
MCL
MCLG
Date
Sampled
Level
Detected
Violation
Yes or No
Arsenic
Erosion of natural deposits;
runoff from orchards and glass
and electronics production
wastes.
0.01 ppm
0 ppm
1/21/2016
0.004 ppm
no
Fluoride
Erosion of natural deposits;
discharge from fertilizer and
aluminum factories.
4 ppm
4 ppm
1/21/16
0.9 ppm
no
Nitrate plus Nitrite as
Nitrogen
Runoff from fertilizer use;
leaching from septic tanks,
sewage; erosion of natural
deposits.
10 ppm
10
ppm
1/21/2016
0.19 ppm
no
Lead
Note: In samples collected
1/21/2016 no lead was
detected in the treated
water as it left the water
treatment plant.
Corrosion of household
plumbing systems; erosion of
natural deposits.
AL = 15 ppb
90
th
percentile level
must be less than 15
ppb
0 ppb
6/2016 to
9/2016
5 ppb@
90th
percentile
(see
below)
no
Copper
Note: In samples collected
1/21/2016 no copper was
detected in the treated
water as it left the water
treatment plant.
Corrosion of household
plumbing systems; erosion of
natural deposits; leaching from
wood preservatives.
AL = 1.3 ppm
90
th
percentile level
must be less than
1.3 ppm
1.3
ppm
6/2016 to
9/2016
0.625 ppm
@ 90th
percentile
one site
exceeded
1.3 ppm
no
DISINFECTANTS
Contaminant
Likely Source
MRDL
MRDLG
Sampled
Level
Detected
Violation
Yer or No
Chlorine
water additive used to control
microbes
4 ppm
4 ppm
continuously
0.03 to 1.88
ppm
No
Chloramines†
water additive used
to control microbes
4 ppm
4 ppm
continuously
0.03 to 1.88
ppm
No
† The primary disinfectant used in Great Falls is free chlorine. Through the addition of ammonia, monochloramine is formed just before
the water exits the treatment plant. Monochloramine does not dissipate as readily as free chlorine and thus helps in maintaining
disinfection at the far edges of the distribution system. Compared to free chlorine, monochloramine is a weak oxidizer and so minimizes
disinfection by-product formation.
Contaminant
Likely Source of
Contamination
MCL
MCLG
Date Sampled
Level
Detected
Violation
Yes or No
Turbidity
Turbidity is a measure of the
cloudiness of the water. It is
monitored because it is a good
indicator of the effectiveness of
the water filtration system.
Soil runoff
TT = 1 NTU
maximum
TT < 0.15
NTU 95%
of the time
0
Throughout the year
every 4 hours
manually;
____________
every 15 minutes
electronically
0.120 NTU
on 2/6/2016
<0.05 NTU
99% of time
No
No
RADIONUCLIDES
Beta/Photon Emitters
decay of natural
and man-made
deposits
4 mrem/yr
0
mrem/yr
2/23/99
2.7 (± 2.7)
pCi/l gross
beta
No
Gross Alpha
erosion of natural
deposits
15 pCi/l
0 pCi/l
7/1/14
4.1
No
Radium 226 + Radium 228
erosion of natural
deposits
5 pCi/l
0 pCi/l
7/1/14
<0.5
No
Uranium
erosion of natural
deposits
0.03 ppm
0 ppm
7/1/14
0.001
No
Synthetic Organic Contaminants Including Pesticides and Herbicides
Contaminant
Likely Source of
Contamination
MCL
MCLG
Date Sampled
Level
Detected
Violation
Yes or No
Hexachlorocyclopentadiene
discharge from chemical
factories
50 ppb
50 ppb
6/13/16
<0.10
No
Page 5
. LEAD AND COPPER RULE SAMPLING SUMMARY (triennial samples)
Note:
Each sample collected for lead analysis was also analyzed for copper. In this report the sites are separately numbered
1-32 based on ascending levels of lead or copper, that is, the site having the highest level of lead did not necessarily also
have the highest level of copper.
Site
Ranking
Copper results in
ascending order
in ppm
Lead results in
ascending order
in ppb
Table I. Regulated Contaminants Detected
(continued)
The 1994 Federal Lead & Copper Rule mandates a
household testing program for these substances.
Under the provisions of the Lead & Copper Rule high-
risk sites include, but are not limited to single-family
residences served by a lead service line, having
interior lead piping or having lead-soldered copper
pipe installed after 1982 but prior to Montana’s ban on
lead solder, which began December 31, 1987.
According to the Rule, 90% of the samples from high-
risk homes must have lead levels less than 15 ppb
and copper levels less than 1.3 ppm. Samples were
collected from water that had remained within the
building’s interior plumbing for a period of at least six
hours. Lead and copper levels below the MCL
indicated water that was not corrosive to lead or
copper plumbing.
If present, elevated levels of lead can cause serious
health problems, especially for pregnant women and
young children. Lead in drinking water is primarily
from materials and components associated with
service lines and home plumbing. The City of Great
Falls is responsible for providing high quality drinking
water, but cannot control the variety of materials used
in plumbing components. When your water has been
sitting for several hours, you can minimize the
potential for lead exposure by flushing your tap for 30
seconds to 2 minutes before using water for drinking
or cooking. If you are concerned about lead in your
water, you may wish to have your water tested.
Information on lead in drinking water, testing methods,
and steps you can take to minimize exposure is
available from the Safe Drinking Water Hotline or at
http://www.epa.gov/safewater/lead
1
0.013
0
2
0.026
0
3
0.027
0
4
0.035
0
5
0.041
0
6
0.052
0
7
0.053
0
8
0.057
0
9
0.062
0
10
0.072
0
11
0.087
0
12
0.089
0
13
0.097
0
14
0.101
0
15
0.106
1
16
0.147
1
17
0.157
1
18
0.158
1
19
0.195
1
20
0.198
1
21
0.209
1
22
0.232
1
23
0.262
2
24
0.284
2
25
0.295
3
26
0.314
3
27
0.523
3
28
0.613
5
29
0.636
5
30
0.740
6
31
1.020
8
32
1.740
8
90
th
Percentile
0.625 ppm
5 ppb
Page 6
Table I. Regulated Contaminants Detected (continued)
Disinfection By-Products (DBPs)
Contaminant
Likely Source of
Contamination
MCL
Date Sampled
Level
Detected
Violation
TTHMs
(total trihalomethanes)
by-product of drinking water
disinfection
80 loc. avg.
‡
quarterly
see table
below
No
HAA5s
(five haloacetic acids)
by-product of drinking water
disinfection
60 loc. avg.
‡
quarterly
see table
below
No
TTHM
Summary
Site #1
Site #2
Site #3
Site #4
Site #5
Site #6
Site #7
Site #8
1
st
Quarter
2016
33 ppb
38 ppb
35 ppb
37 ppb
35 ppb
30 ppb
34 ppb
37 ppb
2
nd
Quarter
2016
35 ppb
38 ppb
38 ppb
38 ppb
39 ppb
35 ppb
35 ppb
31 ppb
3
rd
Quarter
2016
53 ppb
56 ppb
50 ppb
56 ppb
56 ppb
53 ppb
54 ppb
53 ppb
4
th
Quarter
2016
34 ppb
43 ppb
39 ppb
42 ppb
44 ppb
38 ppb
39 ppb
42 ppb
‡
locational
average
38.8 ppb
43.8 ppb
40.5 ppb
43.3 ppb
43.5 ppb
39 ppb
40.5 ppb
40.8 ppb
highest compliance level for 2016 = 43.8 range = 38.8 to 43.8
Some people who drink water containing trihalomethanes in excess of the MCL over many years may experience problems with their
liver, kidneys, or central nervous systems, and may have an increased risk of getting cancer.
HAA5
Summary
Site #1
Site #2
Site #3
Site #4
Site #5
Site #6
Site #7
Site #8
1
st
Quarter
2016
32 ppb
35 ppb
31 ppb
26 ppb
33 ppb
31 ppb
34 ppb
31 ppb
2
nd
Quarter
2016
32 ppb
30 ppb
32 ppb
30 ppb
30 ppb
33 ppb
34 ppb
34 ppb
3
rd
Quarter
2016
48 ppb
49 ppb
46 ppb
41 ppb
1.9 ppb
48 ppb
46 ppb
46 ppb
4
th
Quarter
2016
35 ppb
34 ppb
32 ppb
14 ppb
1.7 ppb
29 ppb
30 ppb
33 ppb
‡
locational
average
36.8 ppb
37.0 ppb
35.3 ppb
27.8 ppb
16.7 ppb
35.3 ppb
36.0 ppb
36.0 ppb
highest compliance level for 2016 = 36.8 ppb range = 16.7 to 36.8 ppb
Some people who drink water containing haloacetic acids in excess of the MCL over many years may have an increased risk of getting
cancer.
TOC (Total Organic Carbon)
Total Organic Carbon (TOC) provides a medium for the formation of disinfection by-products, which include TTHMs and HAA5s. Removing TOC at the
water treatment plant is important in reducing the potential for the formation of all disinfection by-products, both regulated and unregulated.
Date Sampled
River Water TOC
Treated Water
TOC
% Removal
Required (A)
% Removal
Achieved (B)
Compliance Ratio
(B/A)*
1/4/16
2.7 mg/L
2.0 mg/L
15.0
25.9
1.73
2/4/16
2.4 mg/L
2.0 mg/L
15.0
16.7
1.11
3/2/16
2.1 mg/L
1.7 mg/L
15.0
19.0
1.27
4/4/16
2.3 mg/L
1.8 mg/L
15.0
21.7
1.45
5/2/16
2.4 mg/L
1.9 mg/L
15.0
20.8
1.39
6/2/16
2.3 mg/L
1.8 mg/L
15.0
21.7
1.45
7/12/16
2.3 mg/L
1.7 mg/L
15.0
26.1
1.74
8/4/16
2.5 mg/L
2.0 mg/L
15.0
20.0
1.33
9/13/16
2.8 mg/L
2.0 mg/L
15.0
28.6
1.90
10/3/16
2.6 mg/L
2.0 mg/L
15.0
23.1
1.54
11/7/16
2.5 mg/L
1.9 mg/L
15.0
24.0
1.60
12/5/16
2.4 mg/L
1.8 mg/L
15.0
25.0
1.67
*Compliance is based, in part, upon the yearly average compliance ratio being equal to or > 1.0. In 2016, the average compliance ratio
was 1.51.
Page 7
Table I. Regulated Contaminants Detected (continued)
Secondary Parameter
Date Sampled
Level Detected
SMCL**
** Secondary Maximum
Contaminant Level (SMCL) -
a chemical contaminant in
excess of this amount may
affect aesthetic qualities and
public acceptance. SMCLs
are non-enforceable
standards.
Calcium
1/21/16
37 mg/L
N/A
Magnesium
1/21/16
12 mg/L
N/A
Sodium
1/21/16
19 mg/L
< 20 recommended
Total Hardness as CaCO3
1/21/16
142 mg/L
N/A
Total Alkalinity as CaCO3
1/21/16
129 mg/L
N/A
Conductivity
1/21/16
362 umhos/cm
N/A
pH
1/21/16
7.6 s.u.
6.5 - 8.5
Langelier Index
1/21/16
- 0.1
N/A
Table II. Unregulated Contaminants Detected
Unregulated contaminant monitoring helps EPA to determine where certain contaminants occur and whether it needs to regulate those
contaminants.
Inorganic Contaminant
Date Sampled
Level Detected
SMCL
Aluminum
1/21/16
0.03 mg/L
N/A
Bicarbonate as HCO3
1/21/16
157 mg/L
N/A
Chloride
1/21/16
11 mg/L
250
Potassium
1/21/16
3 mg/L
N/A
Silica
1/21/16
18.8 mg/L
N/A
Strontium
1/21/16
0.22 mg/L
N/A
Sulfate
1/21/16
34 mg/L
250
Radionuclides
Date Sampled
Level Detected
Unit of
Measurement
Significance
Radon-222 *
1/09/95
47 (± 37)
pCi/l
see comments below
*About radon: There is currently no federal regulation for radon in drinking water. Radon is a radioactive gas that you can’t see, taste
or smell. It is found all over the U.S. Radon can move up through the ground and into a home through cracks and holes in the
foundation. Radon can build up to high levels in all types of homes. Radon can also get into indoor air when released from tap water
from showering, washing dishes, and other household activities. Compared to radon entering the home through soil, radon entering the
home through tap water will in most cases be a small source of radon in indoor air. Radon is a known human carcinogen. Breathing air
containing radon can lead to lung cancer. Drinking water that contains radon may also cause increased risk of stomach cancer. If you
are concerned about radon in your home, test the air in your home. Testing is inexpensive and easy. Fix your home if the level of
radon in your air is 4 picocuries per liter of air (4pCi/l) or higher. There are simple ways to fix a radon problem that aren’t too costly.
For additional information, call your state radon program or call EPA’s Radon Hotline (1-800-SOS-RADON).
Table III. Regulated Contaminants NOT Detected
Microbiological Contaminants – tested throughout 2015, 70 routine distribution system samples per month
Total Coliform Bacteria
Escherichia coli
Inorganic Contaminants – all tested
1/21/16
unless otherwise indicated
Antimony
Beryllium
Copper
Lead
Molybdenum
Silver
Asbestos (5/24/11)
Cadmium
Cyanide
Manganese
Nickel
Thallium
Barium
Chromium
Iron
Mercury
Selenium
Zinc
Volatile Organic Contaminants (VOCs) – all tested 6/13/16 unless otherwise indicated
Benzene
1,1-Dichloroethene
Styrene
Toluene
Carbon tetrachloride
cis-1,2-Dichloroethene
Tetrachloroethene
Vinyl chloride
Chlorobenzene
trans-1,2-Dichloroethene
1,2,4-Trichlorobenzene
Xylenes (ortho-, meta-, para-)
1,2-Dichlorobenzene
Methylene chloride
1,1,1-Trichloroethane
1,2-Dibromo-3-chloropropane
1,4-Dichlorobenzene
1,2-Dichloropropane
1,1,2-Trichloroethane
1,2-Dibromoethane
1,2-Dichloroethane
Ethylbenzene
Trichloroethene

Page 8
Table III. Regulated Contaminants NOT Detected
Volatile Organic Contaminants (VOCs) – all tested 6/13/16 unless otherwise indicated
Bromobenzene
2-Chlorotoluene
cis-1,3-Dichloropropene
1,1,2,2-Tetrachloroethane
Bromochloromethane
4-Chlorotoluene
trans-1,3-Dichloropropene
1,2,3-Trichlorobenzene
Bromoform
Dibromomethane
Hexachlorobutadiene
Trichlorofluoromethane
Bromomethane
1,3-Dichlorobenzene
Isopropylbenzene
1,2,3-Trichloropropane
n-Butylbenzene
Dichlorodifluoromethane
p-Isopropyltoluene
1,2,4-Trimethylbenzene
sec-Butylbenzene
1,1-Dichloroethane
Methyl tert-butyl ether (MTBE)
1,3,5-Trimethylbenzene
tert-Butylbenzene
1,3-Dichloropropane
Naphthalene
m+p Xylenes
Chloroethane
2,2-Dichloropropane
n-Propylbenzene
o-Xylene
Chloromethane
1,1-Dichloropropene
1,1,1,2-Tetrachloroethane
In Summary, analysis of Great Falls drinking water revealed no violations during 2016. Although some constituents
were detected, the Environmental Protection Agency considers water to be safe at these levels. Furthermore, MCLs are
set very stringently. To put this into perspective, for a given regulated contaminant a person would have to drink 2 liters of
water every day at the MCL for a lifetime for there to be a one-in-a-million chance of having a corresponding adverse
health effect.
Important additional information regarding source water monitoring: During 2007 Great Falls collected monthly
water samples directly from the Missouri River intake and had them analyzed for Cryptosporidium, a microbial pathogen
found in surface water throughout the United States. Although the filtration aspect of our water treatment process removes
Cryptosporidium it cannot guarantee 100% removal. Our monitoring indicated the presence of these organisms in our
source water during the months of February, April, July, September, October and December.
In October 2015 we started a second round of monitoring for Cryptosporidium and Giardia. Cryptosporidium was present
in our source water in October 2015 and in September and October of 2016.
Current test methods do not allow us to determine whether the organisms are dead or if they are capable of causing
disease. Ingestion of Cryptosporidium may cause cryptosporidiosis, an abdominal infection. Symptoms of infection include
nausea, diarrhea and abdominal cramps. Most healthy individuals can overcome the disease within a few weeks.
However, immuno-compromised people are at greater risk of developing life-threatening illness. We encourage immuno-
compromised individuals to consult their doctor regarding appropriate precautions to take to avoid infection.
Cryptosporidium must be ingested to cause disease, and it may be spread through means other than drinking water.
The Long Term 2 (LT2) Enhanced Surface Water Treatment Rule requires an additional 1 log removal of Cryptosporidium
from the source water. The City of Great Falls is in the process of making capital improvements by installing an Ultra
Violet treatment system in order to consistently achieve this removal. In the meantime we have been achieving the
additional 1 log removal requirement and the City of Great Falls will strive to continue to meet the requirements of LT2.
