
Dollars and Sense in Cook County
1
Title Page
DOLLARS AND
SENSE IN
COOK COUNTY
Examining the Impact of General
Order 18.8A on Felony Bond
Court Decisions, Pretrial Release,
and Crime
Don Stemen and David Olson
Loyola University Chicago

Dollars and Sense in Cook County
2
This research was supported by the John D. and Catherine T. MacArthur Foundation through the Safety
and Justice Challenge Research Consortium (Consortium). Launched in 2019, the Consortium advances
criminal justice research, grounded in the efforts and data of Safety and Justice Challenge sites, to
expand the field’s collective knowledge of how to safely reduce the overuse and misuse of jails and!racial
and ethnic disparities through fair and effective pretrial reforms. The Consortium is comprised of
research organizations who develop and are granted projects!under independent review by a panel!of
academic,!policy, and practice experts, including individuals with lived experience.!The Consortium is
managed by the CUNY Institute for State and Local Governance.
Dollars and Sense in Cook County
iii
Contents
INTRODUCTION
1
A
NOTE
ON
DATA
AND
METHODS
3
BOND COURT DECISIONS
5
PRETRIAL RELEASE
8
PRETRIAL RELEASE OUTCOMES
10
FAILURE
TO
APPEAR
10
NEW
CRIMINAL
ACTIVITY
10
NEW
VIOLENT
CRIMINAL
ACTIVITY
11
AGGREGATE LEVELS OF CRIME
12
CONCLUSION
13
APPENDICES
14
APPENDIX
A
–
DATA
AND
METHODS
14
APPENDIX
B
–
LOGISTIC
REGRESSION
RESULTS
18
NOTES
26

Dollars and Sense in Cook County
iv

Dollars and Sense in Cook County
1
DOLLARS AND
SENSE IN COOK
COUNTY
Examining the impact of General
Order 18.8A on felony bond court
decisions, pretrial release, and
crime
INTRODUCTION
ail reform efforts across the United States have
accelerated in recent years, driven by concerns about
the overuse of monetary bail, the potentially
disparate impact of pretrial detention on poor and minority
defendants, and the effects of bail decisions on local jail
populations. Proponents of bail reform advocate for
reducing or eliminating the use of monetary bail, arguing
that many defendants are held in jail pretrial solely because
they cannot afford to post bail. Opponents counter that
reducing the use of monetary bail or increasing the number
of people released pretrial could result in more defendants
failing to appear for court hearings (FTAs) or committing
crimes while on pretrial release.
Evaluations of recent bail reform efforts indicate that these
efforts have not been associated with increases in new
criminal activity. In 2017, for example, New Jersey
eliminated cash bail, resulting in a!drop!in the number of
pretrial detainees but no change in crime rates.
1
An
evaluation of New York City’s Supervised Release – which
allowed judges to release certain defendants under specific
supervisory conditions in lieu of monetary bail – found that
the program had no impact on FTAs or arrests for new
crimes among those released.
2
Similarly, in 2018, the
Philadelphia District Attorney’s Office created a
presumption of no cash bail for twenty-five non-violent
offenses; an evaluation of the policy found a 41% reduction
in the use of monetary bail and a 22% reduction in pretrial
detention, but no increase in FTAs or new criminal charges
for those released pretrial.
3
On September 17, 2017, the Chief Judge of the Circuit Court
of Cook County issued General Order 18.8A (GO18.8A) to
reform bail practices in Cook County.
4
GO18.8A established
a decision-making process for bond court judges. Under the
order, bond court judges were to first determine whether a
defendant should be released pretrial and, if not, hold the
defendant in jail. If the defendant could be released,
GO18.8A created a presumption of release without
monetary bail; however, if monetary bail was necessary, the
order stated that bail should be set at an amount affordable
for the defendant. In the end, GO18.8A established a
presumption of release without monetary bail for the large
majority of defendants in Cook County and encouraged the
use of lower bail amounts for those required to post
monetary bail. !
A debate has played out in the media regarding the link
between GO18.8A, the types of individuals released pretrial,
and the number and percent of individuals charged with a
new crime while on pretrial release. The debate centers
around an evaluation of GO18.8A conducted by the Office of
the Chief Judge (OCJ).
5
The OCJ’s evaluation found that the
number and percent of felony defendants released pretrial
increased after GO18.8A but that the percent of felony
defendants charged with a new crime while on pretrial
release was similar before and after GO18.8A.
Subsequent analyses by the media
6
and academics
7
suggested that the OCJ’s evaluation underestimated the
percent of defendants charged with a new crime after
GO18.8A. These subsequent analyses identified several
methodological problems with the OCJ’s evaluation that
could potentially influence the findings: a truncated follow-
up period for individuals released after GO18.8A, a failure to
account for seasonality in follow-up periods for individuals
released before and after GO18.8A, and a conservative
definition of violent offenses used to estimate rates of new
violent criminal activity of those released. These critiques
suggested that GO18.8A may have led to an increase in new
criminal activity of those released pretrial and contributed
directly to increases in crime in Chicago and Cook County.
These subsequent analyses, however, also suffer from
methodological problems similar to those in the OCJ’s
evaluation. By relying on the same public data collected and
distributed by the OCJ, these analyses were unable to
correct for the critiques made of the OCJ’s analyses –
namely a truncated follow-up period and a failure to
account for seasonality – without making assumptions
about, and estimations of, underlying recidivism rates of
those released.
8
More importantly, the analyses were
unable to verify or refute the OCJ’s analyses of bond court
decisions, release rates, or new criminal activity through the
independent analysis of defendant- and charge-level court
or jail data. As a result of these methodological
shortcomings and contradictory findings, the actual impact
of GO18.8A remains unclear. Missing from the discussion to
date, is a rigorous, objective, external assessment of the
impact of GO18.8A that can correct for these problems.
With data provided to the Institute for State and Local
Governance (ISLG) at the City University of New York,
Loyola University Chicago’s Center for Criminal Justice
Research, Policy, and Practice undertook an evaluation of
the impact of GO18.8A on four outcomes: bond court
decisions, pretrial release, pretrial release outcomes (FTAs,
new criminal activity, and new violent criminal activity), and
crime rates. This research was funded as part of the John D.
and Catherine T. MacArthur Foundation’s Safety and Justice
Challenge Research Consortium.
B
Dollars and Sense in Cook County
2
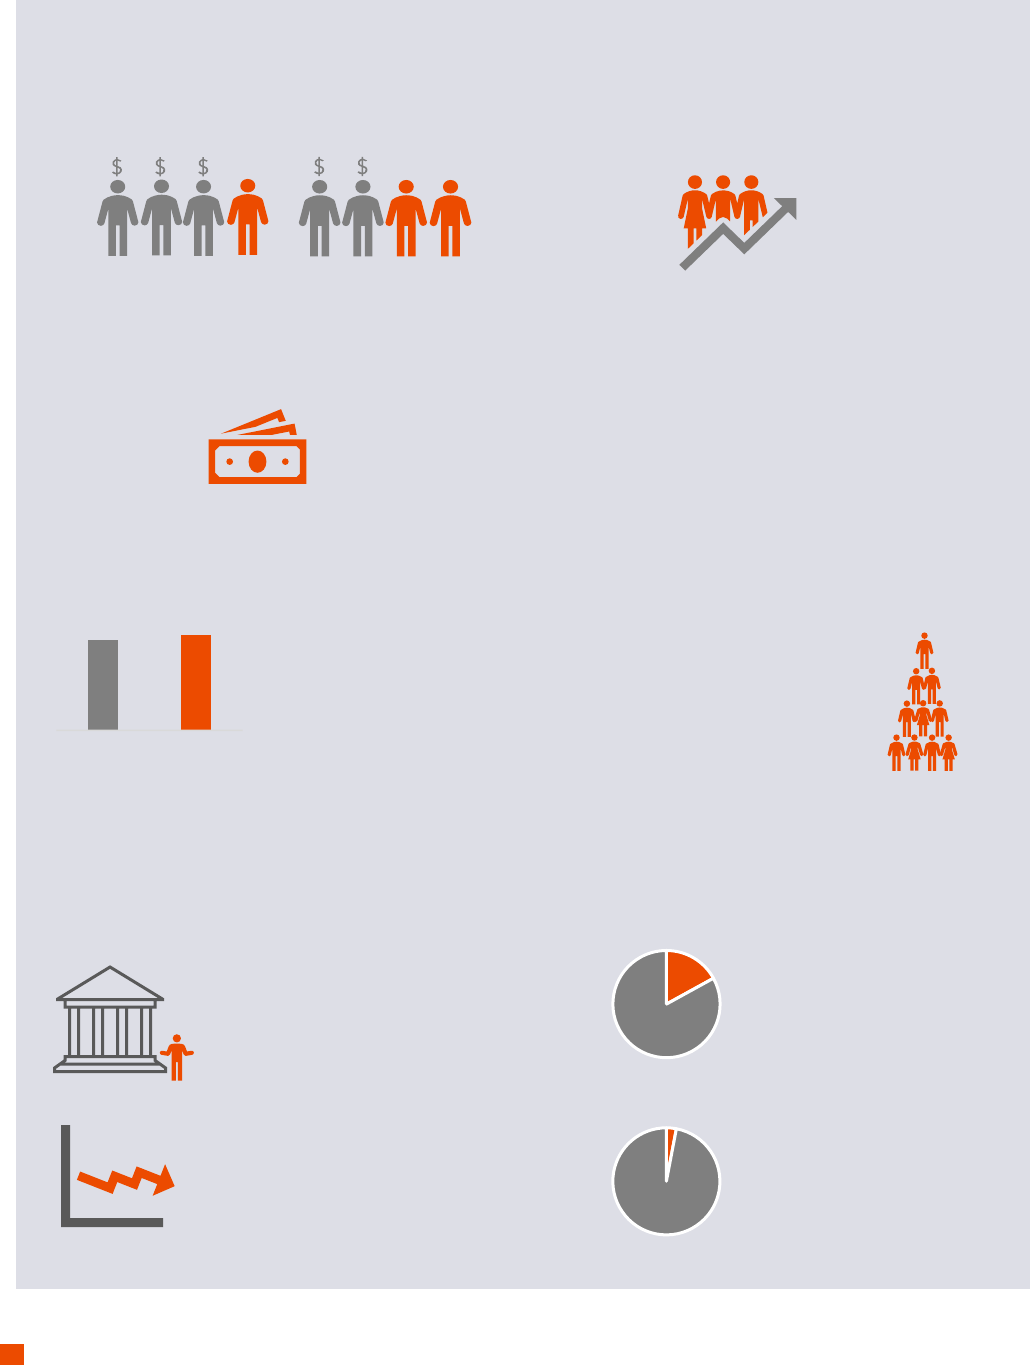
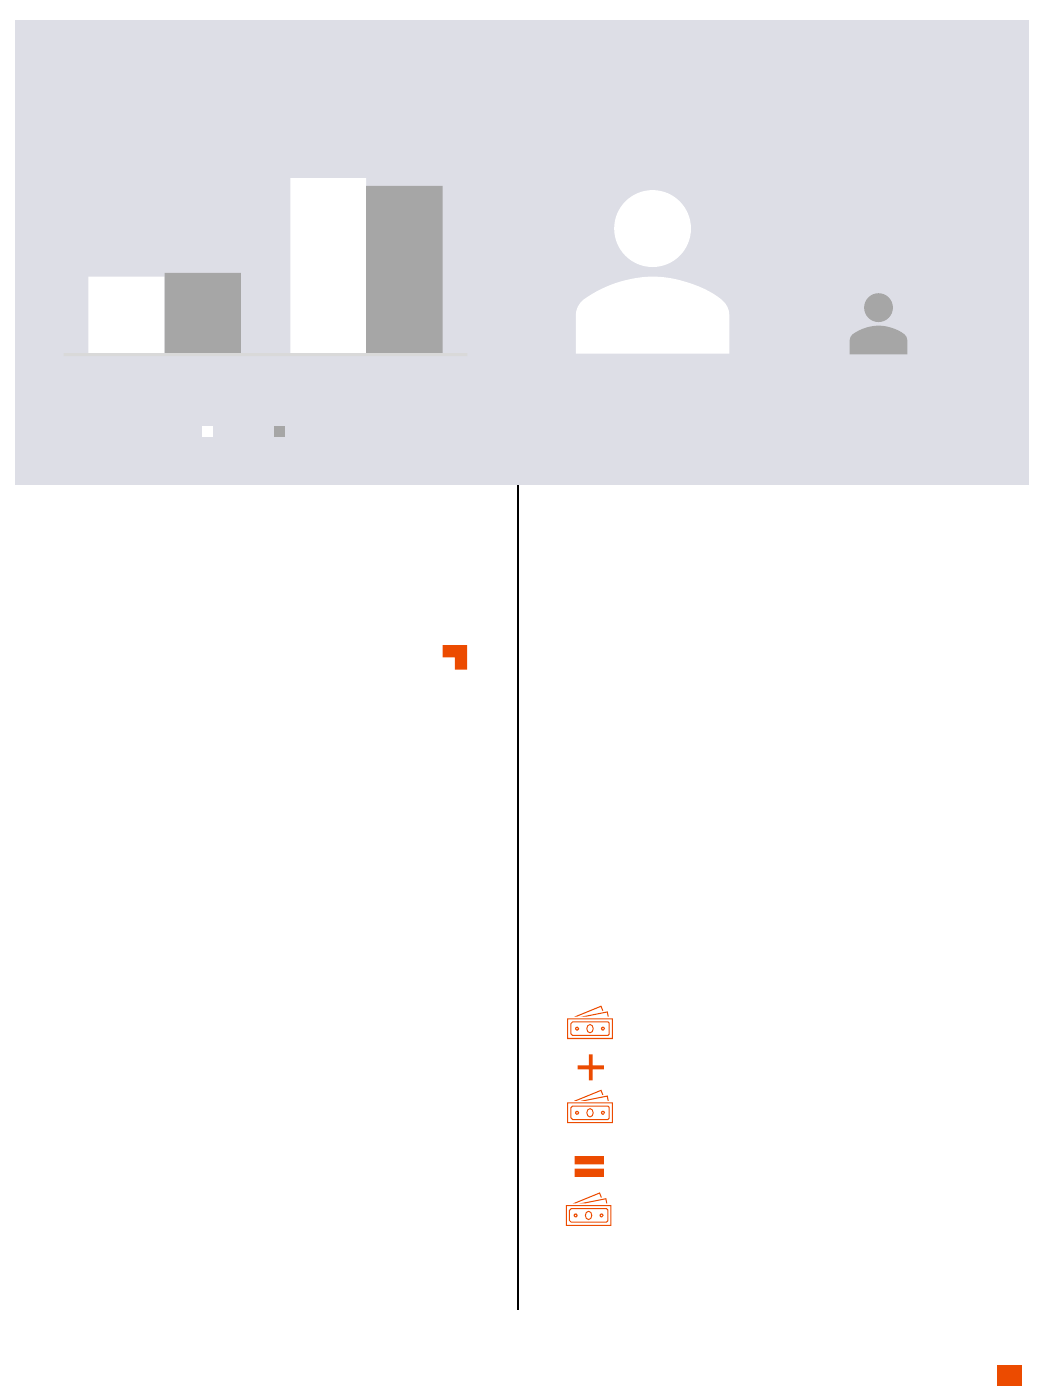
3,559 more defendants received an
I-Bond in the six months after GO18.8A
who would not have received one before
$31.4 million in bond costs were avoided by defendants
in the six months after GO18.8A due to increased use of I-Bonds
and lower D-Bond amounts
GO18.8A increased the use of I-Bonds and reduced the costs of bail for defendants
I-Bond
I-Bond
I-Bond
26%
of defendants received
an I-Bond before
GO18.8A
57%
of defendants received
an I-Bond after
GO18.8A
PRIMARY FINDINGS
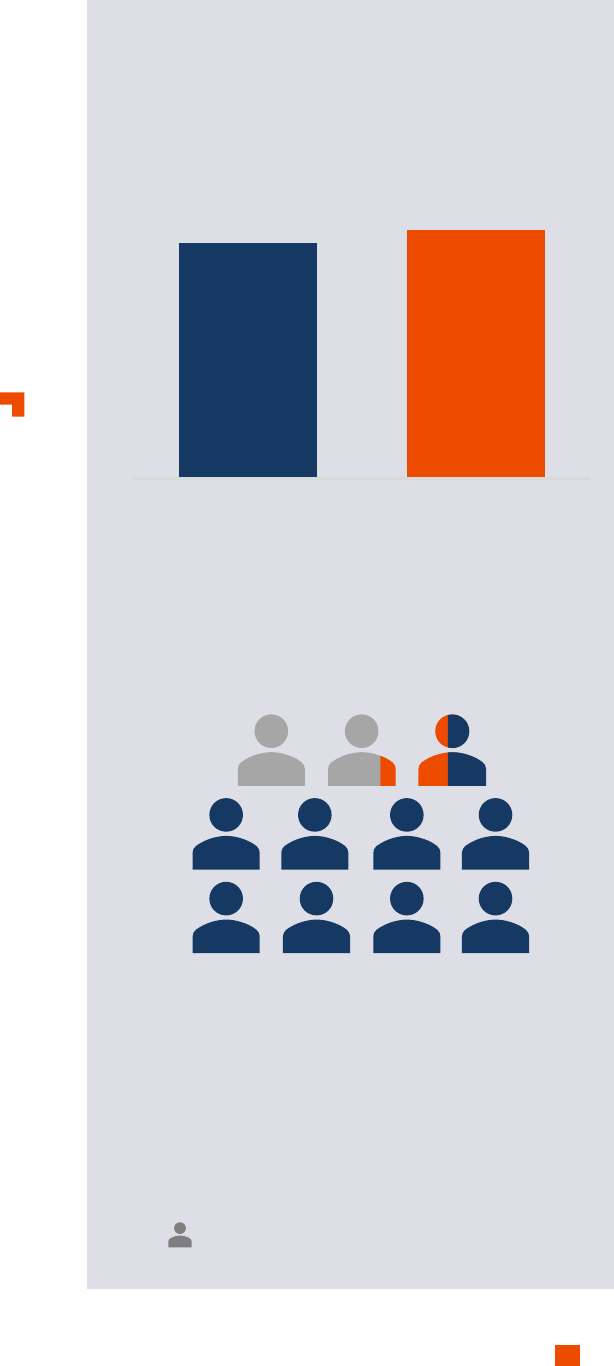
77%
81%
Before
GO18.8A
After
GO18.8A
77% of defendants were
released pretrial before GO18.8A
81% of defendants were
released pretrial after GO18.8A
500 more defendants were
released in the six months after
GO18.8A than would have been if
release rates had remained unchanged
GO18.8A increased the percent and number of people released pretrial
17%
of defendants released
before and after GO18.8A had a
new criminal case filed while on
pretrial release
3%
of defendants released
before and after GO18.8A had a
new violent criminal case filed
while on pretrial release
17% of defendants released before GO18.8A
failed to appear for a court hearing
20% of defendants released after GO18.8A
failed to appear for a court hearing
There was no statistically significant change
in the amount of crime in Chicago in the
year after GO18.8A
GO18.8A had no effect on new criminal activity or crime

Dollars and Sense in Cook County
3
A NOTE ON DATA AND METHODS
This report details two sets of analyses: 1) an analysis of
bond court decisions, pretrial release, and pretrial release
outcomes for defendants charged with felonies in Cook
County and 2) an analysis of crime rates in Chicago. This
section briefly details the data and methods used in the
analyses. For a detailed description of data and analytic
methods see Appendix A.
Felony Bond Court Decisions and Pretrial Release
The analyses of felony bond court decisions, pretrial release,
and pretrial release outcomes relied on data for all cases
filed in the Circuit Court of Cook County between January 1,
2013 and April 30, 2019, all defendants screened using the
Public Safety Assessment (PSA)
9
between October 1, 2015
and April 30, 2019, and all individuals admitted to or
released from the Cook County jail between May 1, 2013
and May 2, 2019. These data provided information on
defendant demographics, charges, bond court decisions,
and jail bookings and releases.
The analyses examined two groups of defendants: a pre-
GO18.8A cohort consisting of all defendants with an initial
felony bond court hearing in the six months between
November 1, 2015 and April 30, 2016 and a post-GO18.8A
cohort consisting of all defendants with an initial felony
bond court hearing in the six months between November 1,
2017 and April 30, 2018. Overall, the analyses included
12,756 defendants in the pre-GO18.8A cohort and 11,372
defendants in the post-GO18.8A cohort. For each cohort, a
series of outcomes were tracked from the initial bond court
date until the case was disposed or for twelve months,
whichever came first. This follow-up period ensured the
same duration of at-risk periods for both pre- and post-
GO18.8A cohorts and accounted for potential seasonality
during time at risk.
The first outcome examined was the initial felony bond
court decision. All individuals arrested for a felony in Cook
County appear for a bond court hearing before a judge who
sets bail and determines the location and date of the next
court appearance. Bond court judges may impose four
different bond types:
• Individual recognizance bond (I-Bond) for which
defendants are released without having to post
monetary bail
• Deposit bond (D-Bond) for which defendants pay
10% of the bail amount in order to secure release
from jail
• Cash bond (C-Bond) for which defendants pay the
full value of the bail amount in order to secure
release from jail
• No bail in which defendants are denied bail and
ordered to remain in jail
Judges also may impose electronic monitoring (EM) as a
condition of release, which requires defendants to pay a fee
before being placed on EM. Based on these options, the
analyses categorized the bond decision into four possible
outcomes – I-Bond, EM, D/C-Bond, and No Bail – which was
used to categorize defendant/cases for subsequent
analyses.
The second outcome examined was release pretrial. If a
defendant spent any time outside of jail during the follow-
up period, they were considered released pretrial.
For defendants released pretrial, three additional outcomes
were examined: failure to appear (FTA), new criminal
activity, and new violent criminal activity. FTA was defined
as a defendant failing to appear for any court event in the
case during the follow-up period. New criminal activity was
defined as any new misdemeanor or felony case filed
General Order 18.8A - Procedures for Bail
Hearings and Pretrial Release
This order is intended to ensure no defendant is held in
custody prior to trial solely because the defendant cannot
afford to post bail, to ensure fairness and the elimination of
unjustifiable
!
delay in the administration of justice, to
facilitate the just determination of every criminal
proceeding, and to preserve the public welfare and secure
the fundamental human rights of individuals with interests
in criminal court cases,…
4. If the court determines that release on bail is not
appropriate, the court shall…make one or more of the
following findings and state the finding(s), together with
sufficient supporting facts, on the record in open court:
a. the defendant will not appear as required, and no
condition or combination of conditions of release can
reasonably
!
assure the defendant 's appearance in
court; or
b. the defendant poses a real and present threat to any
person or persons….
5. When setting bail, there shall be a presumption that any
conditions of release imposed shall be non-monetary in
nature, and
!
the court shall impose the least restrictive
conditions or combination of conditions necessary to
reasonably assure the
!
appearance of the defendant for
further court proceedings….
7. When the court determines that monetary bail is a
necessary condition of release, the court shall, in
substance, make the
!
following findings and state them,
together with sufficient supporting facts, on the record in
open court:
a. no other conditions of release, without monetary bail,
will reasonably assure the defendant 's appearance in court;
b. the amount of bail is not oppressive, is considerate of
the financial ability of the defendant, and the
defendant has
!
the present ability to pay the amount
necessary to secure his or her release on bail…

Dollars and Sense in Cook County
4
against the defendant within Cook County during the
follow-up period. New violent criminal activity was defined
as any new misdemeanor or felony case with a top charge
of a Person offense filed against the defendant within Cook
County during the follow-up period.
The examination of bond court decisions and pretrial
release outcomes relied on a series of multivariate
statistical models that isolated the influence of specific
defendant and case characteristics. Specifically, the
analyses used logistic regression models, which estimate
the effects of defendant and case factors on the odds of
specific outcomes (e.g., the odds of receiving an I-Bond or
the odds of having a new criminal case filed during the
follow-up period). The sections below summarize the most
important results of the logistic regression models. The full
results of all logistic regression models are presented in
Appendix B.
10
Following each logistic regression model, expected rates of
each outcome were estimated using predicted probabilities,
which represent the expected outcome for the average
defendant/case. The predicted probabilities are reported as
the percent of defendants with each outcome after
controlling for all defendant and case factors. For example,
calculating the predicted probability of receiving an I-Bond
provides an estimation of the percent of defendants who
would receive an I-Bond taking into account defendant
characteristics, offense types, and PSA scores that influence
the likelihood of receiving an I-Bond.
Crime Rates
The analyses of crime rates relied on data obtained from
the Chicago Police Department’s online public data portal. A
series of Bayesian Structural Time Series (BSTS) analyses
estimated the degree to which crime levels were different
than would have been expected between the pre- and post-
GO18.8A periods. For these analyses, historical data on the
number of violent and property crimes were used to model
expected crime rates using factors known to influence crime
and proxies for policing activity. Actual crime rates were
then compared to these expected crime rates to determine
whether crime rates fell within expected ranges.
Dollars and Sense in Cook County
5
BOND COURT DECISIONS
eneral Order 18.8A established a presumption of
release without monetary bail for the large majority
of defendants in Cook County. This presumption
implies an increased use of I-Bonds - individual
recognizance bonds for which defendants are released
without having to post monetary bail - after the
implementation of GO18.8A. Our analyses indicate that
GO18.8A was associated with an increase in the odds of
receiving an I-Bond.
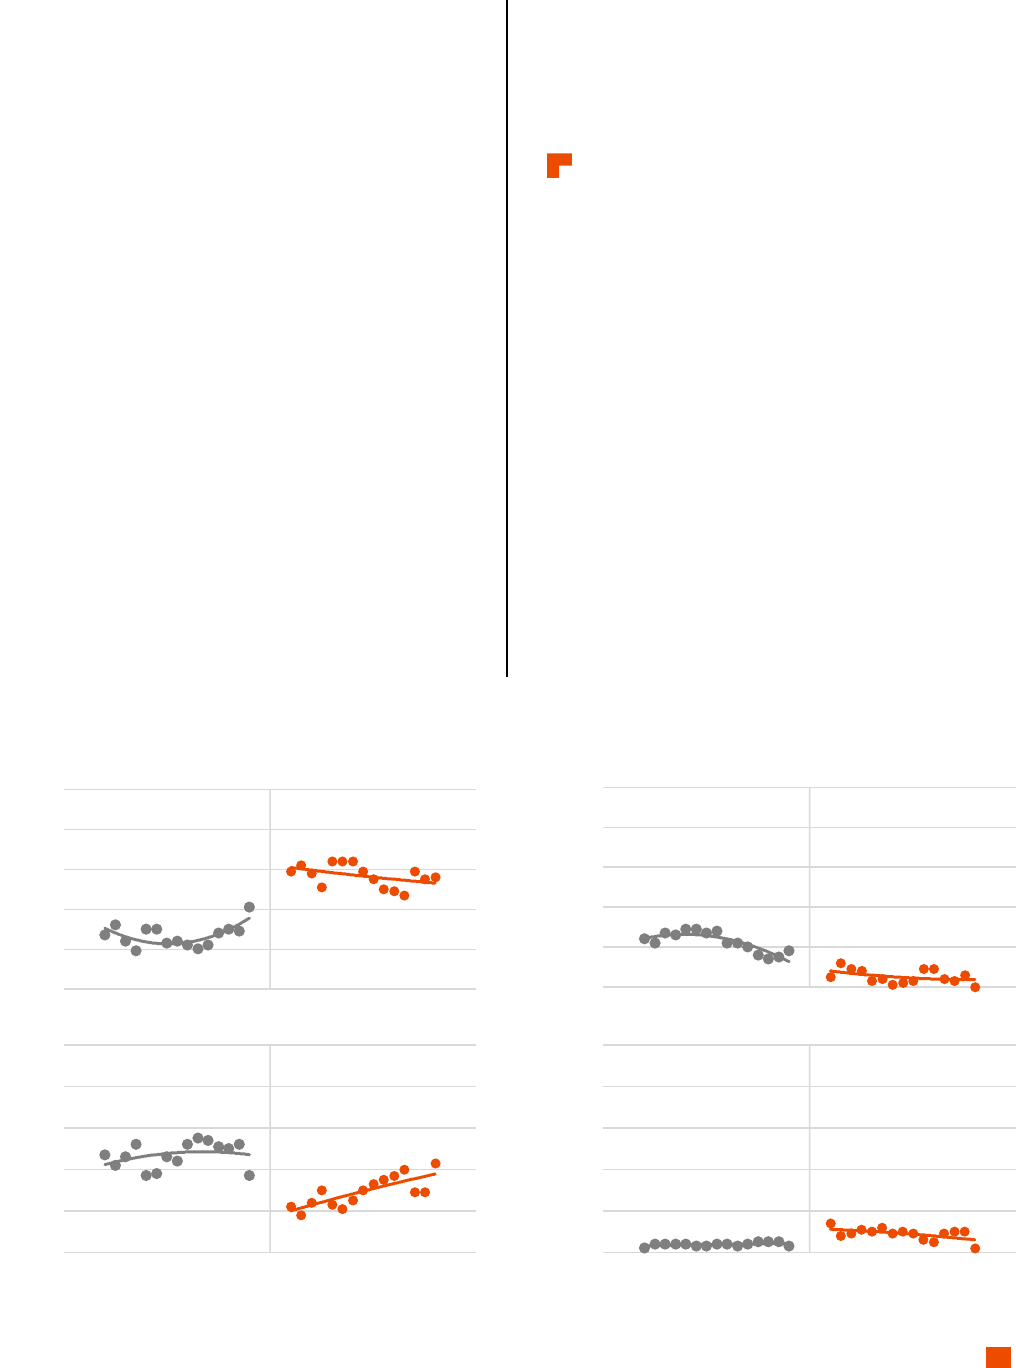
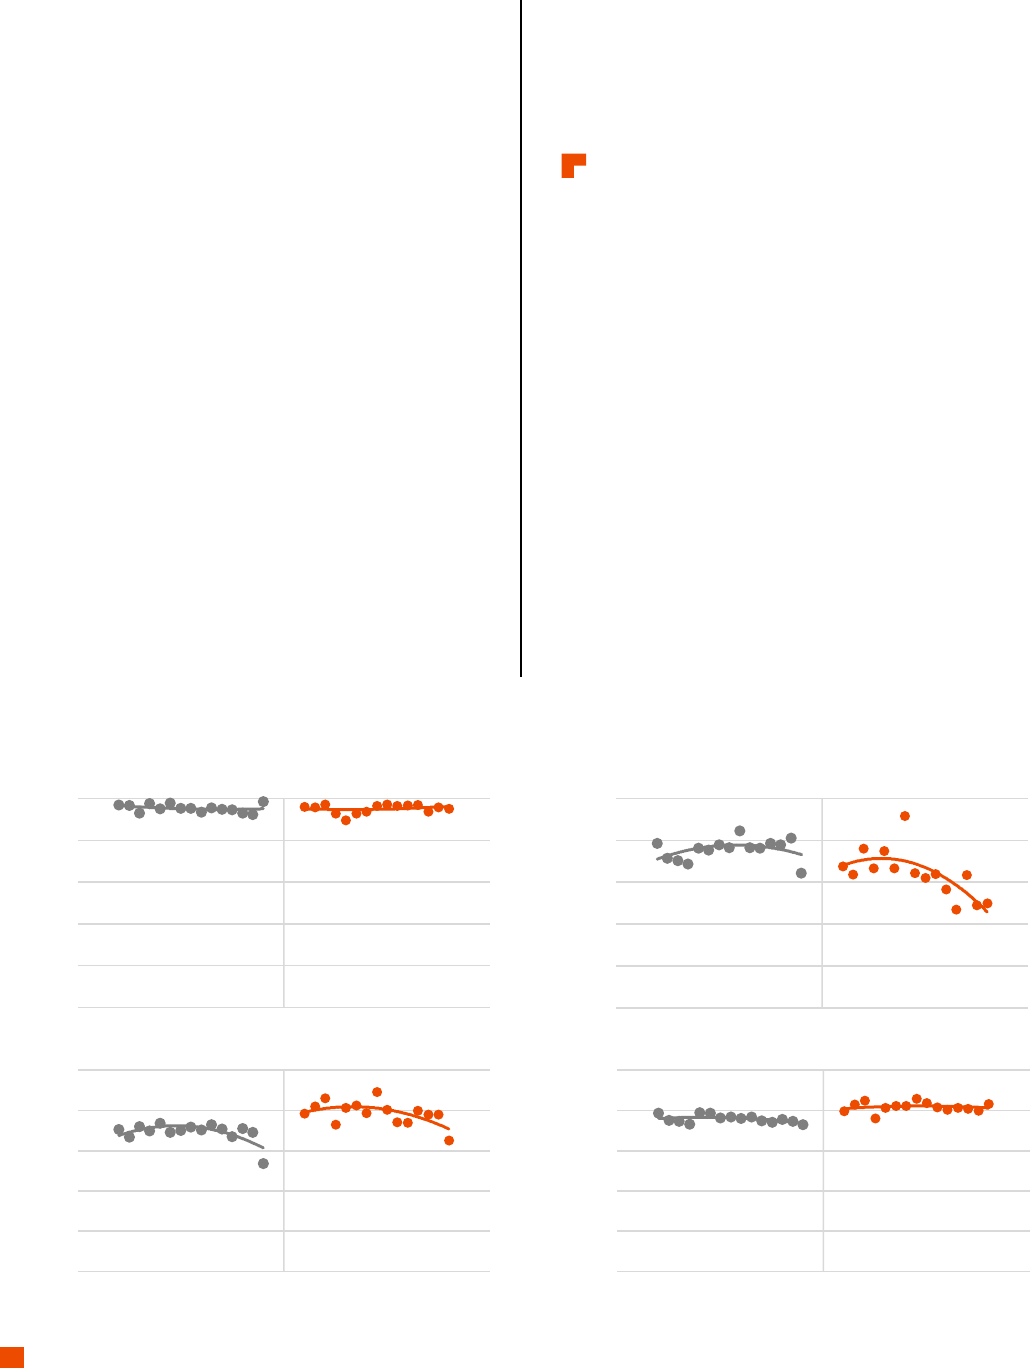
Figure 1 shows trends in bond court decisions before and
after GO18.8A. Each dot in the graphs represents a two-
week average of the percent of felony defendants receiving
an I-Bond, EM, D/C-Bond, and No Bail at their initial bond
court hearing.
11
As Figure 1 shows, bond court decisions
changed markedly after GO18.8A. Prior to GO18.8A, 20% to
40% of felony defendants received an I-Bond at their initial
bond court hearing. After GO18.8A, 50% to 60% received an
I-Bond. Figure 1 also shows that the use of I-Bonds
decreased slightly over time after GO18.8A. In November
2017 – immediately after implementation of GO18.8A – 59%
of felony defendants received an I-Bond; by April 2018, this
decreased to 55%.
There was a contrasting drop in the use of EM and D/C-
Bonds after GO18.8A. Prior to GO18.8A, 20% to 30% of
defendants received EM, decreasing to just less than 10%
after GO18.8A. Similarly, 40% to 60% of felony defendants
received a D/C-Bond before GO18.8A, dropping to 20% to
40% after GO18.8A. However, in contrast to I-Bonds, the
use of D/C-Bonds increased over time after GO18.8A, rising
from 22% in November 2017 to nearly 43% in April 2018.
Finally, the use of No Bail increased after GO18.8A, rising
from less than 4% of cases to roughly 8% of cases.
The percent of defendants
receiving an I-Bond increased
after GO18.8A.
While the descriptive statistics indicate an increase in the
use of I-Bonds after GO18.8A, this increase could be due to
differences in the types of defendants or cases appearing in
bond court before and after GO18.8A. In order to control for
such differences, a series of logistic regression models were
generated to examine the odds of a defendant receiving an
I-Bond. The analyses indicate that GO18.8A was associated
with a statistically significant increase in the odds of a
defendant receiving an I-Bond, after controlling for
defendant and case factors.
In addition to statistically isolating the effect of GO18.8A on
the likelihood of defendants receiving I-Bonds, the logistic
models also revealed that defendants were less likely to
receive an I-Bond when they were male, younger, charged
with a Person or Weapons offense, charged with a higher
G
0%
20%
40%
60%
80%
100%
Before GO18.8A After GO18.8A
D/C-Bond
0%
20%
40%
60%
80%
100%
EM
Figure 1.
Time trends in bond court outcomes
0%
20%
40%
60%
80%
100%
Before GO18.8A After GO18.8A
No Bail
0%
20%
40%
60%
80%
100%
I-Bond
Dollars and Sense in Cook County
6
felony class, or charged with more felony offenses, and
when they had a violation of probation or bail bond and
higher PSA scores. Defendant race was not associated with
the odds of receiving an I-Bond.
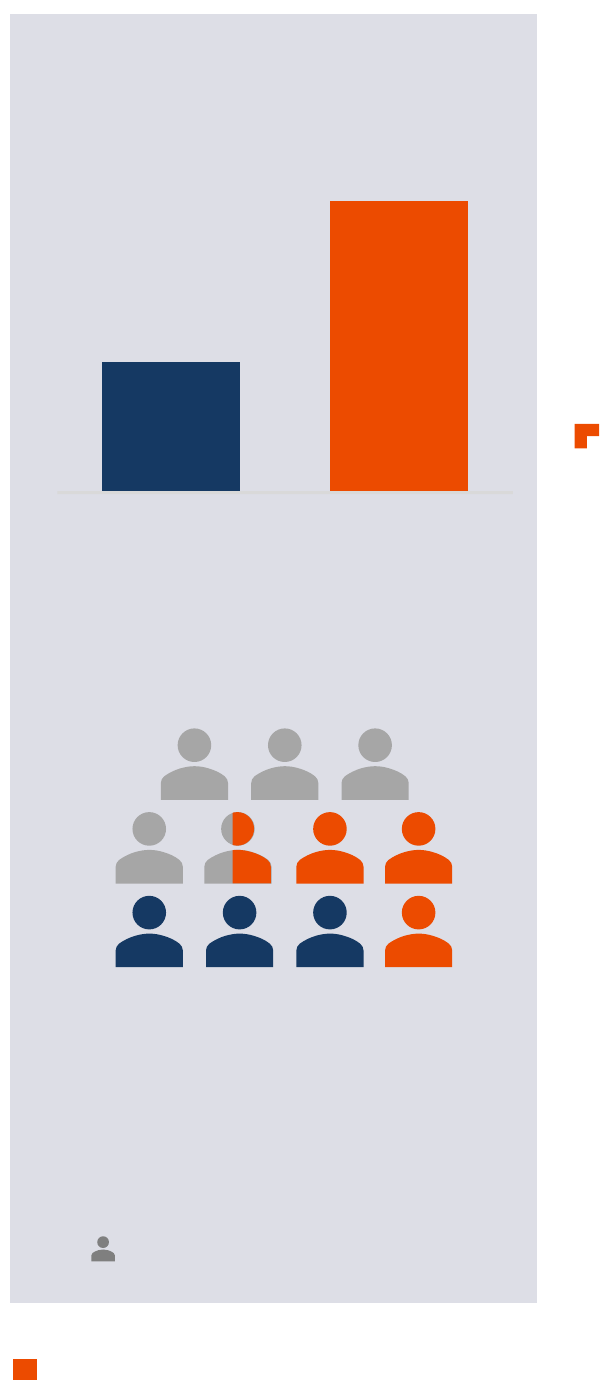
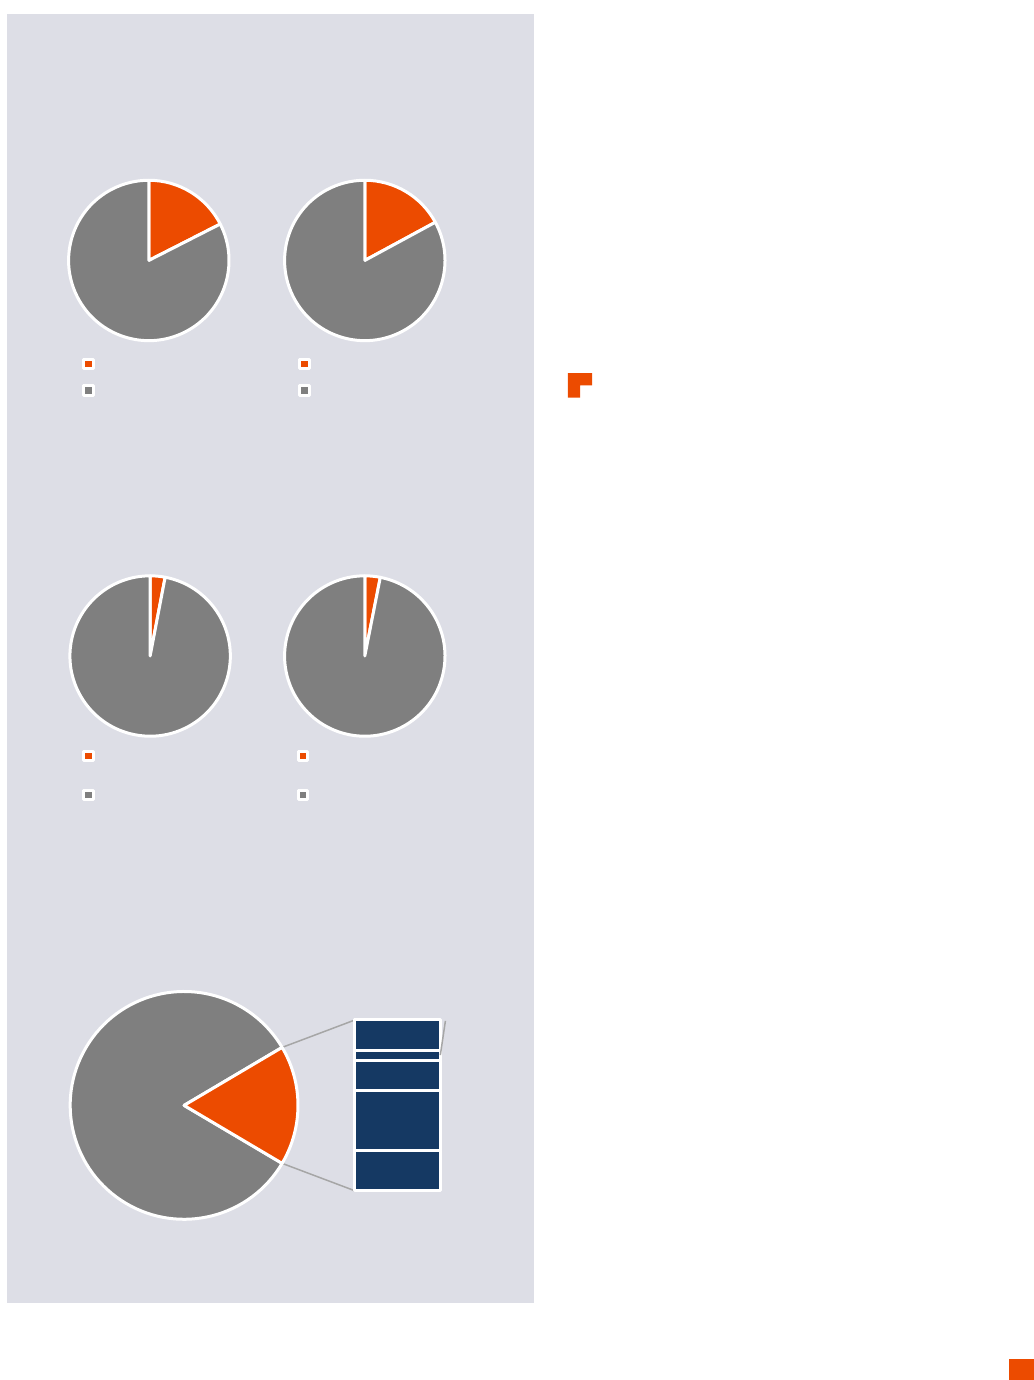
After controlling for defendant and case factors, roughly
26% of defendants were expected to receive an I-Bond
before GO18.8A compared to 57% after GO18.8A (Figure 2).
12
To put the increased use of I-Bonds into context, of the
11,372 defendants with an initial bond court hearing in the
six months after GO18.8A, just 2,900 would have received
an I-Bond if the pre-GO18.8A rates had continued (Figure 3).
However, the statistical model revealed that 6,459
defendants received an I-Bond after accounting for
defendant and case characteristics. Thus, 3,559 additional
defendants received an I-Bond in the six months after
GO18.8A than would have if pre-GO18.8A rates had
continued.
13
3,559 defendants - who would
have been required to post
monetary bond to secure
release before GO18.8A - did not
have to post any monetary
bond after GO18.8A
Although defendant race was not associated with the odds
of receiving an I-Bond before GO18.8A, the analyses
revealed that race was associated with receiving an I-Bond
after GO18.8A, with Black defendants more likely than
White defendants to receive an I-Bond after GO18.8A.
Controlling for other defendant and case factors, roughly
25% of Black defendants received an I-Bond before GO18.8A
compared to 26% of White defendants (Figure 4).
14
After
GO18.8A, 56% of Black defendants received an I-Bond
compared to 54% of White defendants.
15
This difference
was statistically significant.
To put this in context, of the 7,869 Black defendants with an
initial bond court hearing in the six months after GO18.8A,
just 1,952 would have received an I-Bond if the pre-GO18.8A
rates had continued. The statistical model revealed that
4,415 of these defendants received an I-Bond after
GO18.8A. Thus, 2,463 Black defendants received an I-Bond
after GO18.8A who would not have received an I-Bond
before GO18.8A. There was an increase in the likelihood of
receiving an I-Bond for White defendants as well; but, the
increase was not as great. Of the 2,578 White defendants
with an initial bond court hearing in the six months after
Figure 2.
Probability of receiving an I-Bond
before and after GO18.8A
25.5%
56.8%
Before GO18.8A After GO18.8A
Figure 3.
Number of additional people
receiving an I-Bond due to GO18.8A
11,372 defendants with an initial bond court hearing
in the six months after GO18.8A
• 2,900 defendants would have received an I-
Bond if the pre-GO18.8A rates had continued.
• 6,459 defendants received an I-Bond after
GO18.8A.
• 3,559
additional
defendants received an I-Bond
after GO18.8A than would have if pre-GO18.8A
rates had continued.
=1,000 defendants
Dollars and Sense in Cook County
7
GO18.8A, 673 would have received an I-Bond if the pre-
GO18.8A rates had continued and 1,382 received an I-Bond
after GO18.8A. Thus, 709 White defendants received an I-
Bond after GO18.8A who would not have received an I-Bond
before GO18.8A.
GO18.8A reduced the financial
burden on defendants by
$31.4 million in the six months
from November 1, 2017 to
April 20, 2018
GO18.8A also encouraged the use of lower bail amounts for
defendants required to post D-Bonds - deposit bonds for
which defendants pay 10% of the bail amount in order to
secure release from jail. In addition to the increased use of I-
Bonds after GO18.8A, there also was a reduction in the
average bond amounts individuals with a D-Bond had to
pay to secure pretrial release. Before GO18.8A, defendants
receiving a D-Bond were required to pay an average of
$9,316 to secure release; this decreased to an average of
just $3,824 after GO18.8A.
16
Thus, the financial burden on
individual defendants who received a D-Bond after GO18.8A
was reduced by $5,492. This means that the 3,256
defendants who received a D-Bond in the six months after
GO18.8A would have had to post a combined $30,332,896
to secure release if the pre-GO18.8A bond amounts had
continued. However, these defendants had to post just
$12,450,944 to secure release under the post-GO18.8A
amounts. Thus, the financial burden on these defendants
was reduced by $17,881,952 (Figure 5).
17
The financial burden on all defendants was reduced even
further. As noted above, 3,559 additional defendants
received an I-Bond in the six months after GO18.8A. If these
defendants had been required to post D-Bonds instead to
secure pretrial release, they would have posted an average
of $3,824 or a total of $13,609,616 in bond. Thus, GO18.8A
resulted in an additional reduction of roughly $13.6 million
($3,824 per individual) in bond to secure release.
Overall, GO18.8A saved defendants and their families a total
of $31.4 million in just the first six months after GO18.8A -
$17.8 million from reduced bond amounts for D-Bonds and
$13.6 million from the increased use of I-Bonds.
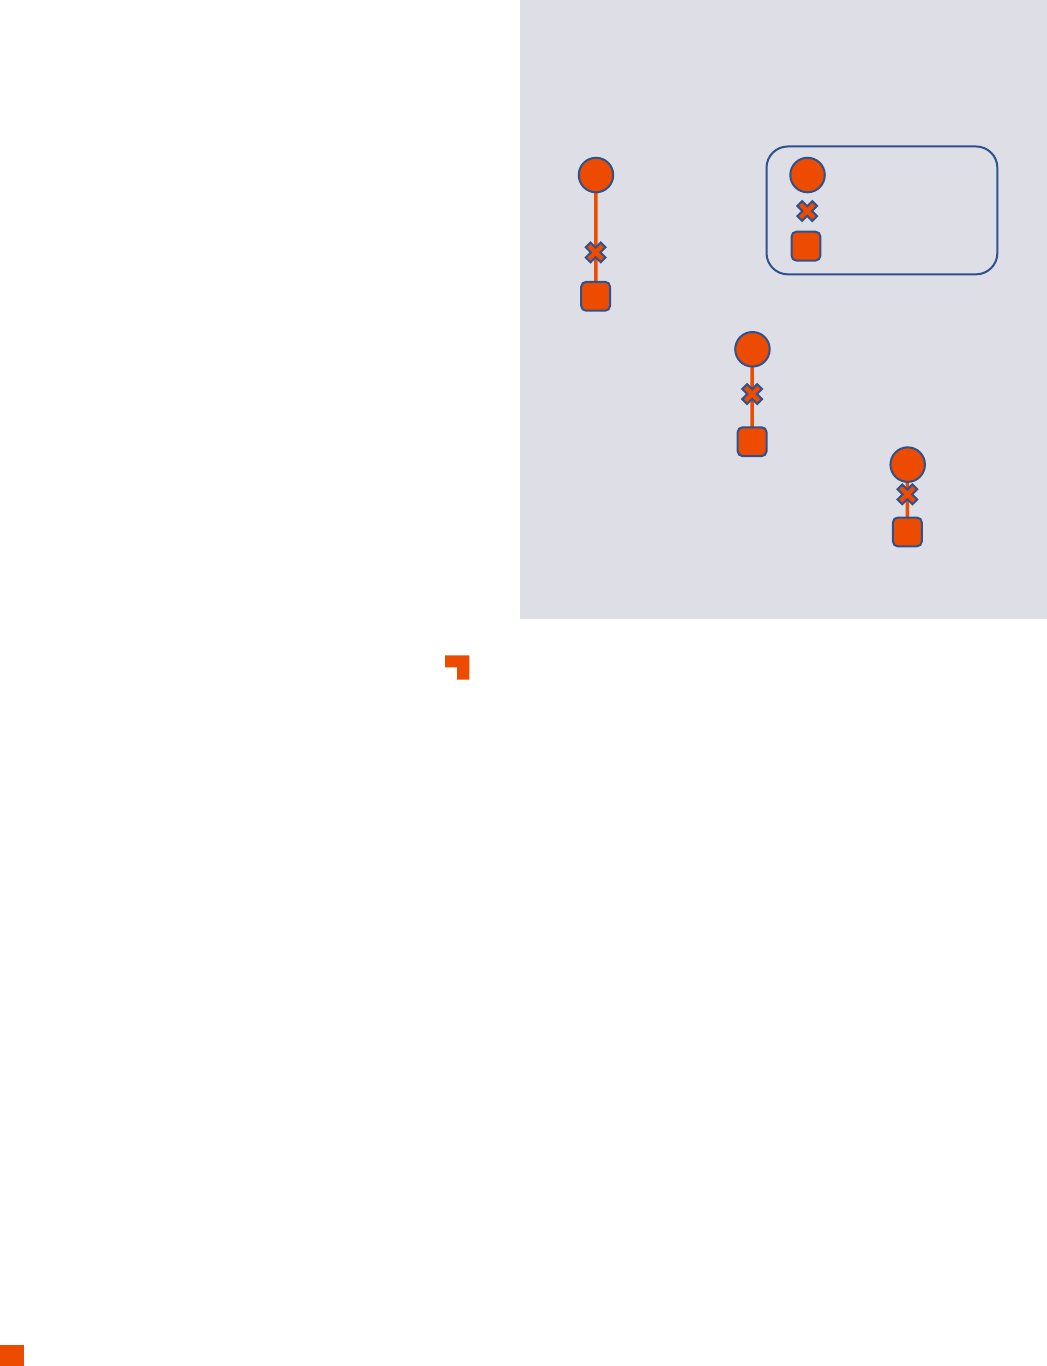
Figure 5.
Total bond savings for defendants with
I-Bonds and D-Bonds
$13.6 million saved by defendants
receiving I-Bonds instead of D-Bonds
$17.8 million saved by defendants
receiving lower D-Bond amounts
$31.4 million saved by all defendants
Figure 4.
Probability of receiving an I-Bond before and after GO18.8A and number of defendants
impacted, by race
2,463
709
Black defendants who received
an I-Bond after GO18.8A who
would not have received an I-
Bond before GO18.8A
White defendants who received
an I-Bond after GO18.8A who
would not have received an I-
Bond before GO18.8A
24.8%
56.1%
26.1%
53.6%
Before GO18.8A After GO18.8A
Black White
Dollars and Sense in Cook County
8
PRETRIAL RELEASE
lthough GO18.8A did not explicitly call for expanded
pretrial release, the increased use of I-Bonds and the
deceased bail amounts for D-Bonds may be expected
to lead to more defendants released pretrial. The analyses
presented here indicate that GO18.8A was associated with a
slight increase in the odds of pretrial release.
Figure 6 shows trends in pretrial release before and after
GO18.8A. Each dot in the graphs represents a two-week
average of the percent of felony defendants who were
released pretrial – meaning that they spent any time
outside of jail during the 12-month follow-up period. As
Figure 6 shows, the percent of defendants released pretrial
increased slightly for all bond types after GO18.8A, from
just
below
80% to just
above
80%. Trends were slightly
different for various bond types. The percent of defendants
released pretrial increased after GO18.8A for defendants
receiving D/C-Bonds, but decreased for defendants
receiving EM. And pretrial release rates remained stable for
defendants receiving I-Bonds.
Specifically, prior to GO18.8A, 60% to 70% of felony
defendants who received a D/C-Bonds at their initial bond
court hearing were released pretrial. After GO18.8A, 70% to
80% were released. In contrast, the percent of defendants
receiving EM who were released pretrial decreased from
75% to 80% before GO18.8A to 50% to 60% after GO18.8A;
in fact, Figure 6 shows that release rates for defendants
receiving EM also decreased slightly over time after
GO18.8A from 76% in November 2017 – immediately after
implementation of GO18.8A – to 50% by April 2018. Finally,
both before and after GO18.8A, almost all felony defendants
who received an I-Bond were released pretrial
(approximately 95%).
18
The percent of defendants
released pretrial increased
slightly after GO18.8A.
While the descriptive statistics indicate an increase in
pretrial release after GO18.8A, again, this increase could be
due to differences in the types of defendants or cases
appearing in bond court before and after GO18.8A. In order
to control for such differences, a series of logistic regression
models were generated to examine the odds of a defendant
being released pretrial; these estimates include all
defendants who appeared in bond court, regardless of the
bond type imposed. The analyses indicate that GO18.8A was
associated with a statistically significant increase in the
odds of a defendant being released pretrial, after controlling
for defendant and case factors.
While there was an overall increase in the likelihood of
release, the analyses also revealed that defendants were
less likely to be released when they were male, Black,
A
0%
20%
40%
60%
80%
100%
I-Bond
0%
20%
40%
60%
80%
100%
Before GO18.8A After GO18.8A
D/C-Bond
0%
20%
40%
60%
80%
100%
EM
0%
20%
40%
60%
80%
100%
Before GO18.8A After GO18.8A
All Bond Types
Figure 6.
Time trends in pretrial release
Dollars and Sense in Cook County
9
younger, charged with a Person offense, charged with a
higher felony class, charged with more felony offenses, or
they had higher PSA scores or received EM, a D/C-Bond, or
No Bail.
After controlling for defendant and case factors, roughly
77% of defendants were expected to be released before
GO18.8A compared to roughly 81% after GO18.8A (Figure 7).
To put this increased probability of pretrial release in
context, of the 11,372 defendants with an initial bond court
hearing in the six months after GO18.8A, 8,700 would have
been released if pre-GO18.8A rates had continued (Figure
8). However, the statistical models revealed that 9,200
defendants were released. Thus, just 500 additional
defendants were released in the six months from November
1, 2017 to April 30, 2018 as a result of GO18.8A who would
not have been released before GO18.8A.
19
Just 500 additional
defendants were released in
the six months after GO18.8A
than would have been if
release rates had remained
unchanged.
Overall, the increased use of I-Bonds and the reduction in
average bail amounts after GO18.8A did not dramatically
increase the percent or number of people released pretrial.
However, GO18.8A did change
how
people were released –
far fewer people were required to post monetary bond to
secure their release, resulting in individuals and their
families not having to post nearly $31.4 million in bond.
Figure 7.
Probability of pretrial release
before and after GO18.8A
76.5%
80.9%
Before GO18.8A After GO18.8A
Figure 8.
Number of additional people
released due to GO18.8A
11,372 defendants with an initial bond court hearing
in the six months after GO18.8A
• 8,700 defendants would have been released if
the pre-GO18.8A rates had continued.
•
9,200 defendants were released after GO18.8A.
• 500
additional
defendants were released after
GO18.8A than would have been if pre-GO18.8A
rates had continued.
=1,000 defendants
Dollars and Sense in Cook County
10
PRETRIAL RELEASE
OUTCOMES
eneral Order 18.8A decreased the use of monetary
bail and increased the percent and number of
defendants released pretrial. Critics contend that such
changes result in more defendants failing to appear for
court hearings (FTAs) and more defendants committing
crimes while on pretrial release. The following sections
examine the impact of GO18.8A on FTAs, new criminal
activity, and new violent criminal activity. For each of these
outcomes, a series of logistic regression models were
generated to examine the odds of defendants released
pretrial having each outcome. Our analyses indicate that
GO18.8A was associated with a slight increase in the odds
of an FTA but was not associated with the odds of new
criminal activity or new violent criminal activity.
FAILURE TO APPEAR
The analyses tracked defendants released pretrial to
determine if there was an FTA associated with any court
event in the case during the follow-up period (i.e., until the
case was disposed or for twelve months, whichever came
first). The analyses indicate that GO18.8A was associated
with a statistically significant increase in the odds of a
defendant having an FTA, after controlling for defendant
and case factors.
While there was an overall increase in the odds of an FTA,
the analyses also revealed that released defendants were
less likely to have an FTA when they were older, charged
with a Person or Weapons or Drug offense, charged with a
higher felony class, or received EM or a D/C-Bond.
Defendants were more likely to have an FTA when they had
higher PSA scores indicating higher risk of FTA or new
criminal conduct and spent more time on pretrial release.
GO18.8A was associated with
a slight increase in the odds of
an FTA.
After controlling for defendant and case factors, 16.7% of
released defendants were expected to have an FTA before
GO18.8A compared to roughly 19.8% after GO18.8A (Figure
9). In other words, of the 9,200 defendants who were
released in the six months after GO18.8A, we would have
expected 1,536 to have an FTA if the pre-GO18.8A rates had
continued. However, the statistical model revealed that
1,822 defendants had an FTA after GO18.8A. Thus, just 286
additional defendants had an FTA in the six months from
November 1, 2017 to April 30, 2018 as a result of GO18.8A.
NEW CRIMINAL ACTIVITY
The analyses also tracked defendants released pretrial to
determine if they had any new misdemeanor or felony case
filed against them within Cook County during the follow-up
period. The analyses indicate that, after controlling for
defendant and case factors, there was no statistically
significant change in the odds of released defendants being
charged with new criminal activity after GO18.8A.
GO18.8A had no effect on
the odds of new criminal
activity of defendants
released pretrial.
The analyses did indicate that defendants were less likely to
have new criminal activity when they were female, White,
older, charged with a Person or Drug offense, or they spent
longer on pretrial release.
20
Defendants were more likely to
have new criminal activity when they were charged with a
higher felony class, had higher PSA scores indicating higher
risk of FTA or new criminal activity, had a violation of
probation/bail, or received EM. There were no differences in
the likelihood of new criminal activity between defendants
who received I-Bonds and defendants who received D/C-
Bonds.
After controlling for defendant and case factors, 17.5% of
released defendants were expected to have new criminal
activity before GO18.8A compared to 17.1% after GO18.8A
(Figure 10); this difference of 0.4 percentage points was not
G
16.7%
83.3%
Before GO18.8A
FTA No FTA
19.8%
80.2%
After GO18.8A
FTA No FTA
Figure 9.
Probability of FTA before and after
GO18.8A
Dollars and Sense in Cook County
11
statistically significant. Thus, most defendants released
pretrial were not charged with new criminal activity during
the follow-up period – 82% of released defendants before
GO18.8A and 83% of released defendants after GO18.8A.
NEW VIOLENT CRIMINAL ACTIVITY
The analyses also tracked released defendants to determine
if they had any new violent criminal activity – any new
felony or misdemeanor case with a top charge of a Person
offense filed against the defendant within Cook County
during the follow-up period. The analyses indicate that
there was no statistically significant change in the odds of
released defendants being charged with new violent
criminal activity.
GO18.8A had no effect on the
odds of new violent criminal
activity of defendants released
pretrial.
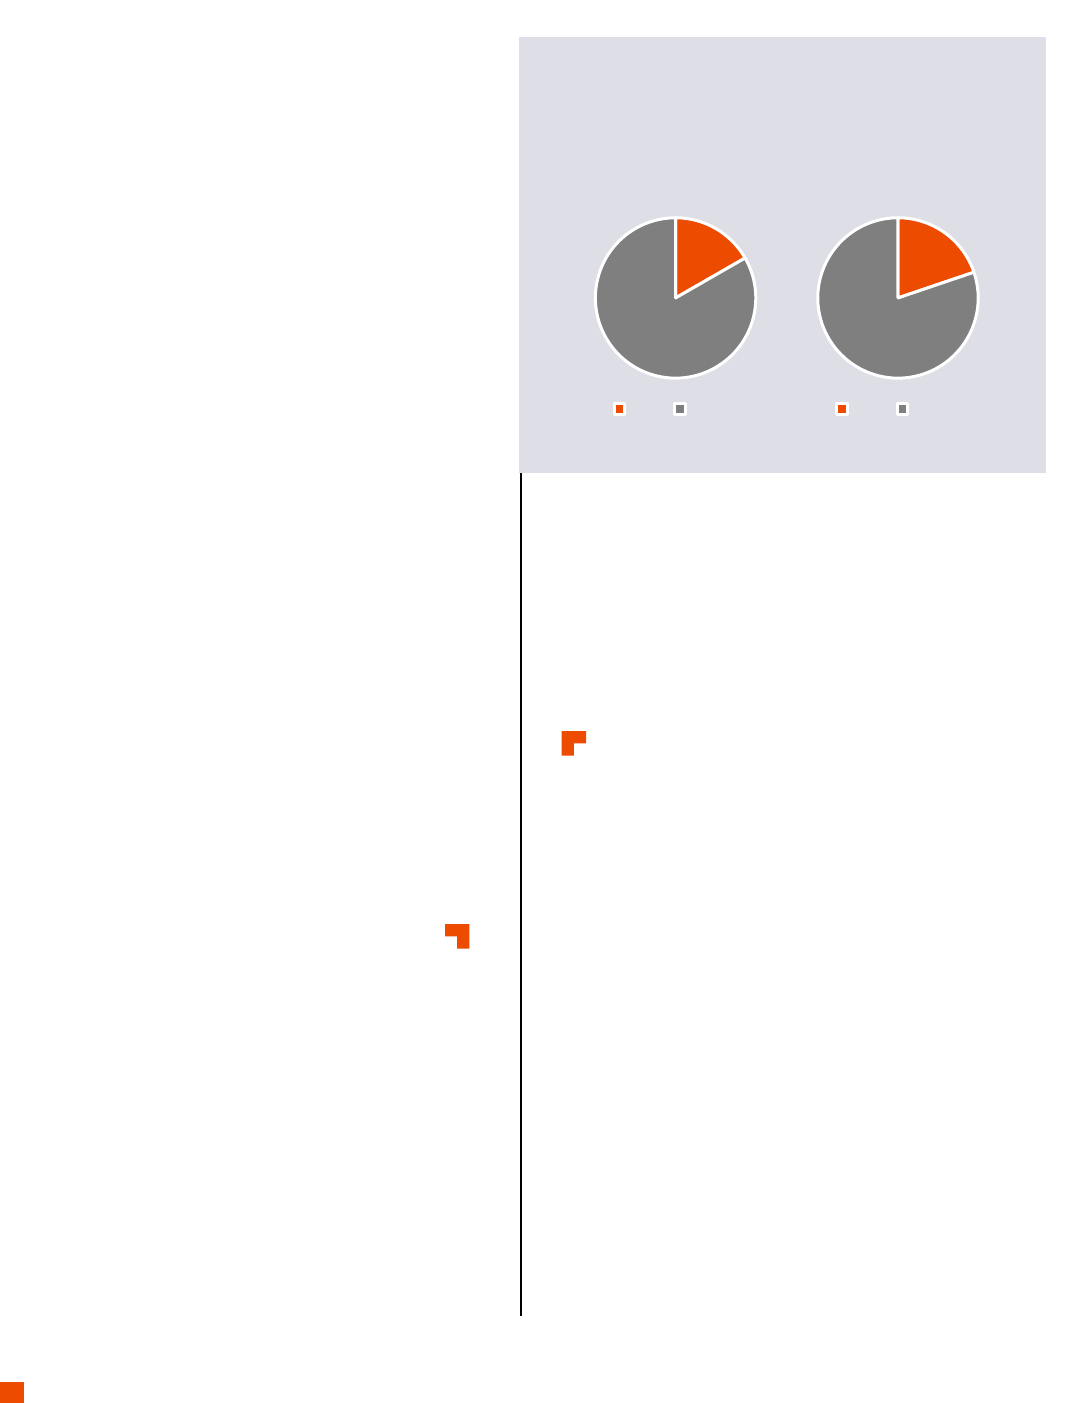
After controlling for defendant and case factors, just 3.0%
of released defendants were expected to have new criminal
activity before GO18.8A compared to 3.1% after GO18.8A
(Figure 11). Although this represents an increase of 0.1
percentage points, the difference is not statistically
significant. Put differently, of the defendants released
pretrial before and after GO18.8A, 97% were not charged
with a new violent offense while on pretrial release.
Defendants were less likely to have new violent criminal
activity when they were female, White, older, and charged
with a Drug offense. Defendants were more likely to have
new violent criminal activity when they were charged with
a Person offense, had a violation of probation/bail, or
received a D/C-Bond. No other defendant or case factors
were associated with the odds of new violent criminal
activity. While those originally charged with a Person
offense and released pretrial were more likely to have a
new violent offense, a relatively small percent had this
outcome. Specifically, just 6.0% of those originally charged
with a Person offense and released pretrial had a new
violent offense, compared to 2.8% of those originally
charged with other crimes.
Overall, just 6% of released defendants were charged with a
new Drug offense, 4% with a new Public Order offense, 3%
with a new Property offense, and 1% with a new Weapon
possession offense (Figure 12).
Figure 10.
Probability of new criminal activity
before and after GO18.8A
17.5%
82.5%
Before GO18.8A
New Crim. Act.
No New Crim. Act.
Figure 11.
Probability of new violent criminal
activity before and after GO18.8A
17.1%
82.9%
After GO18.8A
New Crim. Act.
No New Crim. Act.
3.0%
97.0%
Before GO18.8A
New Viol. Crim.
Act.
No New Viol. Crim.
Act.
3.1%
96.9%
After GO18.8A
New Viol. Crim.
Act.
No New Viol. Crim.
Act.
No New
Criminal
Activity 83%
Person 3%
Weapon 1%
Property 3%
Drugs 6%
Other 4%
New Criminal
Activity
17%
Figure 12.
New criminal activity before and
after GO18.8A, by offense type
Dollars and Sense in Cook County
12
AGGREGATE LEVELS OF
CRIME
s the preceding analyses indicate, GO18.8A was
associated with a slight increase in the likelihood that
defendants charged with a felony offense were
released pretrial, resulting in an estimated 500 additional
people released in the six months after GO18.8A. However,
there was no change in the likelihood that released
defendants were charged with new criminal offenses while
on pretrial release.
To gauge the degree to which there were changes in the
overall amount of crime in Chicago following GO18.8A, a
series of Bayesian Structural Time Series (BSTS) models
were generated to compare the number of Property Index
Crimes, Violent Index Crimes, and Violent Index Crimes with
a Gun reported to the Chicago Police Department before
and after GO18.8A.
21
These models created estimated
ranges of how many crimes would be expected in the 365
days after GO18.8A based on pre-GO18.8A crime patterns
and other factors that correlate with crime, but are
unaffected by GO18.8A.
22
Actual crime rates were then
compared to these estimates. In all of these models, the
number of crimes observed during the post-GO18.8A period
were not statistically different than the number of crimes
projected to occur.
23
There was no statistically
significant change in level of
crime in Chicago in the year
after GO18.8A.
As Figure 13 shows, the analyses estimated that between
77,407 and 107,316 Property Index Crimes would be
reported in Chicago in the 365 days following GO18.8A.
There were 88,085 actual Property Index Crimes reported
during this period. In other words, the number of Property
Index Crimes that occurred in Chicago in the year after
GO18.8A was within the range that would normally be
expected. To conclude that GO18.8A increased (or
decreased) crime, the number of crimes would have had to
be above (or below) the projected range. Similarly, the
number of Violent Index Crimes was projected to be
between 31,623 and 22,341 in the 365 days following
GO18.8A; there were 27,074 actual crimes reported. Finally,
the number of Violent Index Crimes with a Gun was
projected to be between 5,635 and 12,487, and there were
9,694 actual crimes reported. Again, all were within the
expected ranges.
A
Figure 13.
Projected and actual crime in
Chicago 365 days after GO18.8A
107,613
77,407
88,085
31.623
22,341
27,074
12,487
5,635
9,694
Property
Index
Projected High
Projected Low
Actual
Violent
Index
Violent Index
w/Gun

Dollars and Sense in Cook County
13
CONCLUSION
eneral Order 18.8A had two clear objectives – create a
presumption of release without monetary bail for the
large majority of felony defendants in Cook County
and consider defendants’ ability to pay monetary bail. The
analyses described here indicate that GO18.8A achieved its
intended objectives.
There was a significant increase in the use of I-Bonds, from
26% of defendants receiving I-Bonds before GO18.8A to 57%
receiving I-Bonds after GO18.8A. The impact of this shift
was dramatic – 3,559 additional people received an I-Bond
in the six months after GO18.8A than would have if these
rates had remained unchanged. The real impact of this
change – none of these defendants had to post monetary
bail to be released pretrial, saving these defendants and
their families $13.6 million in avoided bond costs.
GO18.8A also led to a dramatic change in bond amounts
imposed for defendants receiving D-Bonds. Average bond
amounts for defendants with D-Bonds decreased from
$9,316 before GO18.8A to $3,824 after GO18.8A. Again, the
real impact of this change – the 3,256 defendants who
received D-Bonds in the six months after GO18.8A saved
$17.8 million in bond costs needed to secure release.
Combined with the avoided bond costs associated with the
increased use of I-Bonds, GO18.8A saved defendants and
their families over $31.4 million in the six months after
GO18.8A. Although most money posted as bond is
eventually returned once the case is resolved, this is money
that defendants and their families do not have available to
them throughout the durtation of the case. In other words,
GO18.8A allowed defendants and their families to have
$31.4 million available to be used for rent, food, and medical
care while their case was being resolved.
Overall, the percent and number of individuals released
pretrial changed very little after GO18.8A. After controlling
for defendant and case characteristics, the percent of
defendants released pretrial increased from 77% before
GO18.8A to 81% after GO18.8A. Just 500 more people were
released in the six months after GO18.8A than would have
been released if these rates had remained unchanged.
Moreover, the risk assessment tool adopted as part of Cook
County’s bond court reforms appears to be providing judges
with additional insights to better inform bond court
decisions. Specifically, the analyses described here found
that the higher the risk level, the less likely the defendant
was to receive an I-Bond or to be released pretrial.
In the end, GO18.8A did not dramatically change the number
of people released pretrial. What did change was
how
people were released pretrial.
GO18.8A also had no impact on new criminal activity or new
violent criminal activity of those defendants released
pretrial. Overall, the probability of new criminal activity
remained at roughly 17% before and after GO18.8A.
Similarly, the probability of new violent criminal activity
remained constant at just 3% before and after GO18.8A.
And overall crimes rates in Chicago – including violent crime
rates – were not any higher than expected after the
implementation of GO18.8A.
Thus, GO18.8A increased the use of I-Bonds, decreased the
financial burden on defendants and their families, and
increased the percent and number of people released
pretrial – all without affecting new criminal activity of those
released or increasing crime.
Opponents of bail reform may continue to argue that
reducing the use of monetary bail and increasing the
number of people released pretrial will result in more
defendants committing more crimes while on pretrial
release. But that is not what happened following bail reform
in Cook County, consistent with experiences following bail
reform in New York,
24
New Jersey,
25
and Philadelphia.
26
Like
these other reform efforts, GO 18.8A demonstrates that it is
possible to decrease the use of monetary bail and decrease
pretrial detention – and lessen the financial, physical, and
psychological harms that come with pretrial detention –
without affecting criminal activity or crime rates.
Everyone wants safe communities. Releasing people on
their own recognizance does not make communities less
safe. Taking money away from people to secure their
release does not make communities safer – but it does
impose a significant burden on those individuals and their
families who are least able to afford it.
G

Dollars and Sense in Cook County
14
APPENDICES
APPENDIX A – DATA AND METHODS
Felony Bond Court Decisions and Pretrial Release
Data
The current study relied on three sets of data initially
provided to the Institute for State and Local Governance
(ISLG) as part of the John D. and Catherine T. MacArthur
Foundation’s Safety and Justice Challenge (SJC). These data
were provided to the Center for Criminal Justice Research,
Policy, and Practice under a grant from the SJC Research
Consortium to examine the impact of GO18.8A on bail
decisions, pretrial release outcomes, and crime in Cook
County.
The first set of data included all cases filed in the Circuit
Court of Cook County between January 1, 2013 and April 30,
2019 (court data).
27
These data were originally obtained
from the Clerk of the Circuit Court of Cook County, which
collects and maintains data on all criminal court cases filed
in Cook County. Though administrative data have limitations
(e.g. they are collected to track cases not to conduct
research, and data entry and terminology use may vary
over time), the court data provided rich detail on defendant
characteristics, bond court decisions, initial and final charge
information, dates and outcomes of all court events, final
charge dispositions, and sentences. Unique defendants
were identified using the Individual Record number (IR
Number); unique cases were identified using the court case
number (CR Number).
28
The combination of IR Number and
CR Number was used to identify unique defendant/case
combinations.
29
The court data included 714,327 unique
defendant/case combinations.
Court data were structured so that each court event
appeared as a separate row in the dataset. In other words,
the data were structured so that each row in the dataset
represented a unique court event for each defendant/case
combination, with a specific court event date for each event.
These court events included bond court, arraignment,
disposition, sentencing, and general hearings. For each
unique defendant/case combination, the analyses identified
the initial (earliest) bond court date. Initial analyses of the
data indicated that individual defendants were often
associated with multiple court cases that had bond court
hearings on the same date. The analyses treated separate
cases that involved the same defendant and the same bond
court hearing date as a single case, which reduced the total
number of defendant/cases to 711,947. Since the analyses
focused on initial bond court decisions, it also was
necessary to identify any defendant/case combinations that
overlapped in time in the dataset (e.g., if a defendant had an
initial bond court hearing in Case 1 and had a bond court
hearing in Case 2 before the disposition of Case 1); in such
instances, the bond court hearing in Case 1 was included as
the controlling case, which reduced the total number of
defendant/cases to 558,680.
Since cases often involve multiple charges, a procedure was
devised to categorize cases according to the “top charge” at
case filing. To determine the top charge at case filing, filed
charges were first ranked by offense severity according to
the state’s three-part misdemeanor and six-part felony
classification system. Filed charges were then classified into
five distinct offense types (person, weapons, property,
drugs, public order/other). The filed charge with the highest
offense severity in a case was designated as the initial top
charge for analysis purposes. When a case contained two
filed charges with the same offense severity but different
offense types, charges were ranked according to offense
type in the following way: person (most serious), weapons,
property, drugs, public order/other (least serious); when a
case contained two filed charges with the same offense
severity and the same offense type, charges were allowed
to randomly select as the top charge. For the analyses, only
defendant/cases with a felony as the top charge in the case
were included, which reduced the number of
defendant/cases to 203,003.
The second set of data included information for all felony
defendants screened using the Public Safety Assessment
(PSA, a pre-trial risk assessment instrument developed by
the Arnold Foundation) between October 1, 2015 and
December 9, 2019 (PSA data). These data were originally
collected by Cook County Adult Probation - Pretrial Services
Unit and obtained from the Office of the Chief Judge (OCJ).
The PSA data included information on defendant
characteristics, initial charge information, pretrial risk
assessment scores (risk of failure to appear, risk of new
criminal activity, and risk of new violent criminal activity
flag), initial bond court decisions, and bond court condition
recommendations. Unique defendants were identified using
the IR Number and unique cases were identified using CR
Number. As above, the combination of IR Number and CR
Number was used to identify unique defendant/case
combinations. The PSA data included 104,158 unique
defendant/case combinations.
Court data and PSA data were then merged using the CR
Numbers and IR Numbers to link the datasets. As noted in
the OCJ’s bond court report,
30
the PSA was implemented for
felony defendants on a pilot basis in Central Bond Court
beginning July 2015 and was implemented in Suburban
Districts for felony defendants in August 2016. As such, PSA
information was not available for 66.4% (134,854) of all
defendant/cases in the court data. The analyses accounted
for missing PSA data by including multiple models with and
without PSA information (see analytic strategy below).
Finally, the third set of data included information for all
defendants admitted to or released from the Cook County
jail between May 1, 2013 and May 2, 2019 (jail data). These
data were originally obtained from the Cook County
Sheriff’s office, which collects and maintains data on all

Dollars and Sense in Cook County
15
individuals admitted to and released from the Sheriff’s
custody. The jail data provided detail on defendant
characteristics, holding offenses, jail admission and release
dates, and reason for release (if released). Unique
defendants were identified using the Inmate Identification
Number (Inmate Number); unique bookings associated with
specific court cases were identified using the Jail Booking
Number (Booking Number). The jail data included 346,171
unique defendant/booking combinations.
Jail data were restructured so that each entry and exit from
the jail appeared as a separate row in the dataset. In other
words, the data were restructured so that each row in the
dataset represented a jail entry or jail exit for each
defendant/booking combination, with a specific jail entry
date or jail exit date. Many defendant/booking
combinations had multiple jail entries/exits if the defendant
was admitted to and released from jail custody multiple
times during the duration of a case. The jail data were then
merged with the combined court/PSA dataset.
The jail data also included IR Numbers for each unique
defendant and CR Numbers for each unique case. The
merged court/PSA/jail dataset was then sorted according
to IR Number, CR Number, and event date (i.e., court event
date, jail entry, jail exit date). This final merged dataset then
included events for each defendant/case combination in
chronological order.
The final merged dataset contained 5,084,471 rows of data,
representing every court event and jail entry/exit for unique
defendant/case combinations in which a top charge in the
initial bond court hearing involved a felony.
Sample
The purpose of the analyses was to examine changes in
bond court decisions, pretrial release, and pretrial release
outcomes before and after GO18.8A. Thus, a pre-GO18.8A
cohort of defendants was selected and compared to a post-
GO18.8A cohort. The current analyses included a pre-
GO18.8A cohort consisting of all defendants with an initial
felony bond court hearing in the six months between
November 1, 2015 and April 30, 2016 and a post-GO18.8A
cohort consisting of all defendants with an initial felony
bond court hearing in the six months between November 1,
2017 and April 30, 2018. Overall, the analyses included
12,859 defendants in the pre-GO18.8A cohort and 11,372
defendants in the post-GO18.8A cohort.
For each cohort, a series of outcomes was tracked from the
initial bond court date until the case was disposed or for
twelve months, whichever came first (follow-up period). A
critique of the initial OCJ report was a difference in follow-
up periods for the pre-GO18.8A and post-GO18.8A cohorts.
In order to ensure an equal follow-up period for the two
cohorts and a follow-up period that would allow sufficient
tracking of outcomes, it was necessary to restrict the
cohorts to a six-month window. Since court data included
court events only through April 30, 2019, it was necessary
to limit the post-GO18.8A cohort to cases only through April
30, 2018, which would allow a twelve month follow up for
the latest case. Also, to ensure that the post-GO18.8A
cohort began after the implementation of GO18.8A, the
cohort necessarily began on November 1, 2017. A similar
pre-GO18.8A cohort was chosen using the same start and
end dates (November 1, 2015 and April 30, 2016). The
follow-up periods ensured the same duration of at-risk
periods for both the pre- and post-GO18.8A cohorts,
accounted for potential seasonality during time at risk,
31
and
ensured that the two cohorts and follow-up periods did not
overlap in time.
Dependent variables
The analyses examined five dependent variables. The first
dependent variable, I-Bond, captured whether a defendant
received an I-Bond at the initial bond court hearing (1 = I-
Bond imposed; 0 = Other bond type imposed). The raw
court data included eight bond types: release on conditions
(ROC), I-Bond, electronic monitoring (EMI), C-Bond, D-Bond,
D-Bond with electronic monitoring (D-Bond/EMI), No Bail,
and Bond to Stand. These were combined in to four bond
types as follows: I-Bond (ROC, I-Bond), EM (EMI), D/C-Bond
(C-Bond, D-Bond, D-Bond/EMI) and No Bail (No Bail). Initial
bond court hearings with a bond type of Bond to Stand
(0.4% of cases) were dropped from the analyses. If a
defendant had multiple bond court hearings on the same
day for different cases, we used the most restrictive bond
court decision as the controlling decision and treated these
separate cases as a single case. In such instances, bond
court decisions were ranked from I-Bond (least restrictive)
to EM to D/C-Bond to No Bail (most restrictive). This initial
bond court decision was then used to categorize
defendant/case combinations for subsequent analyses. If a
defendant received a revised bond court decision later in a
case, the initial bond court decision was still used to
categorize the case.
32
For each defendant/case combination, the initial bond court
date was determined and an end date 12 months from the
initial bond court data was created; if the defendant/case
combination was disposed, the disposition date was also
included. These dates were used to calculate the follow-up
period for each defendant/case combination – from the
initial bond court data to the disposition date or to the end
date, whichever came first.
The second dependent variable, Released, captured
whether a defendant was released pretrial (1=Released
pretrial; 0=Not released pretrial). If a defendant spent any
time outside of jail during the follow-up period they were
considered released pretrial.
The third dependent variable, FTA, captured whether a
defendant had a failure to appear while on pretrial release
(1=Failure to Appear; 0=No Failure to Appear). FTA was
calculated only for defendants released pretrial. If a
defendant had any failure to appear flag during the follow-
up period, they were considered to have a failure to appear.

Dollars and Sense in Cook County
16
The fourth dependent variable, New Criminal Activity,
captured whether a released defendant had a new criminal
case filed in Cook County while on pretrial release (1=New
Criminal Activity; 0=No New Criminal Activity).
33
New
Criminal Activity was calculated only for defendants
released pretrial. If a defendant had any new case filed
during the follow-up period, they were considered to have
new criminal activity.
Finally, the fifth dependent variable, New Violent Criminal
Activity, captured whether a released defendant had a new
criminal case filed for a Person offense while on pretrial
release (1=New Violent Criminal Activity; 0=No New Violent
Criminal Activity). New Violent Criminal Activity was
calculated only for defendants released pretrial. If a
defendant had any new felony or misdemeanor case filed
during the follow-up period in which the most serious filed
charge was a Person offense, they were considered to have
new violent criminal activity.
34
Person offenses included
murder, kidnapping, criminal sexual abuse or assault,
assault, battery, domestic battery, reckless conduct,
robbery, vehicular hijacking, and violation of an order of
protection.
Case-level variables
Case-level variables in the present study included several
defendant, offense, and case processing characteristics.
Defendant characteristics were drawn from the court data
and included information on demographic attributes of
defendants. The analyses included a trichotomous variable
measuring defendant race/ethnicity (0=Defendant White
(reference), 1=Defendant Black, 3=Defendant
Hispanic/Other). The court data included one variable
capturing defendant race and ethnicity in the following
categories: American Indian and Alaskan Native,
Asian/Pacific Islander, Black Latino/Hispanic, Black non-
Latino/Hispanic, Other, Unknown/Missing, White
Latino/Hispanic, White non-Latino/Hispanic. These
categories were initially recoded into two variables
measuring race (White, Black, American Indian and Alaskan
Native, Asian/Pacific Islander, Other/Missing) and ethnicity
(Hispanic, Non-Hispanic). However, it was evident that
Hispanic ethnicity was not captured consistently in the
court data; just 1.7% of defendants in the pre-GO18.8A
cohort were Hispanic compared to 16.3% of defendants in
the post-GO18.8A cohort. Thus, in order to ensure the
inclusion of these defendants and the ability to examine the
effects of race and ethnicity, a single race/ethnicity variable
was created with Hispanic, American Indian, Alaskan Native,
and Asian/Pacific Islander defendants included in a third
race/ethnicity category. The analyses also included
defendant sex (0=Female (reference), 1=Male) and age (in
years). A variable capturing whether the defendant was in
violation of probation or bail bond was also included (0=No
Violation (reference); 1=Violation). A defendant was
determined to have a violation of probation if they had a
sentence of probation imposed within one year prior to the
initial felony bond court hearing date; a defendant was
determined to have a violation of bail bond if they had a
charge of violation of bail bond included in a prior case.
PSA scores measuring risk of FTA or New Criminal Activity
were coded as ordinal variables with three categories (1-2
(low risk) (reference), 3-4, and 5-6 (high risk)). A third
dichotomous PSA score measuring risk of New Violent
Criminal Activity was also included (0=No Risk, 1=Risk). PSA
scores were missing for 26.4% of the sample (35.5% of the
pre-GO18.8A sample and 16.0% of the post-GO18.8A
sample). In order to include PSA scores in the analyses,
missing values were recoded (Missing=99) to ensure the
cases were not dropped. Cook County Adult Probation and
the Office of the Chief Judge have found that over 90% of
felony defendants receive an assessment. The high missing
rate here is likely not due to Adult Probation - Pretrial
Services failing to meet assessment obligations; rather, it is
likely due to data quality issues and the study’s difficulty in
matching defendants across court and PSA datasets.
Offense characteristics included the number of filed charges
(continuous), number of filed felony charges (continuous),
and offense severity, which was coded as an ordinal
variable with seven categories (0=Unspecified Felony (least
serious) through 6=Murder (most serious)). The type of
offense was measured with a categorical variable
measuring the most serious offense in the defendant/case
combination (0=Property (reference), 1=Person, 2=Weapons,
3=Drugs, 4=Public Order/Other).
35
Lastly, one case processing variable was included: weeks at
risk (continuous), which measured the number of weeks a
defendant was released from jail during the follow-up
period. This was calculated only for defendants released
pretrial and included only the time that they were not
physically in the jail.
Analytical strategy
The impact of defendant, offense, and case characteristics
on case outcomes was analyzed using standard statistical
procedures to examine categorical data in multivariate
settings. Specifically, the baseline estimations relied on a
series of multivariate logistic regression models to estimate
the effect of these factors on the dependent variables listed
above. All models are estimated using Stata 14.
For each dependent variable, the analyses considered thee
models. The first model included the pre- and post-GO18.8A
cohorts with a control for the pre- and post-periods. This
allowed an estimation of the impact of GO18.8A on the odds
of the outcome (e.g., odds of I-Bond, Release, etc.),
controlling for defendant, offense, and case characteristics.
Two separate models were then run separately for each of
the pre- and post-GO18.8A cohorts; this was to examine
potential variation in the influence of defendant, offense,
and case characteristics during the two time periods.
Following each model, expected rates of each outcome
were estimated using predicted probabilities generated
using the Stata
margins
command. Predicted probabilities

Dollars and Sense in Cook County
17
represent the expected rate of a specific outcome after
controlling for all defendant and case factors.
Although results generated by the logistic regression
models are informative, these may be biased due to
differences in the pre- and post-GO18.8A cohorts. To
minimize this problem, propensity scores were used to
reconfigure the study sample to include similar offenders.
The creation of matched samples explicitly takes into
consideration that the variables differentiating each cohort
may not be independent of the variables associated with
case outcomes. These models report the average effect of
GO18.8A on the specific outcome.
Crime Rates
Data
The current study relied on data obtained from the Chicago
Police Department’s online public data portal. Data included
incident-level information on the number of Violent Index
Offenses, Property Index Offenses, and Violent Index
Offenses with a Gun. Counts of these offenses were
aggregated by day and week.
Control variables
Control variables in the present study included several
factors that correlate with crime, but are unaffected by
GO18.8A. For the day of each criminal incident, the following
information was included: whether the day was a weekend
day or a holiday, the average daily temperature, the level of
precipitation, the monthly unemployment rate, and the
number of drug arrests. Because unemployment rate data
was only available on a monthly basis, these monthly
unemployment rate measures were used for all days during
a particular month. Drug arrests were included as a proxy
variable to measure the degree to which police were
making arrests for “on-view” behaviors (i.e., an indicator of
how aggressively police were approaching enforcement).
Analytic strategy
To gauge the degree to which there were changes in the
overall amount of crime (Violent Index offenses, Property
Index Crimes, and Violent Index Crimes with a Gun) in
Chicago following GO18.8A, Bayesian Structural Time Series
(BSTS) models were used to develop a counterfactual
forecast of how many of these crimes would have been
expected in the 90 day- and 365 day-period following the
implementation of GO18.8A based on pre-GO18.8A crime
patterns and the control variables noted. These analyses
create a range of the expected number of crimes for each
crime type which are then compared to the actual number
of offenses reported to the Chicago Police Department in
each of these crime categories before and after GO18.8A.
A total of 16 multivariate models were developed and
tested. For each of the three types of crime examined,
models were developed examining daily crime counts as
well as weekly crime counts, and also to gauge 90 day-
impacts and 365 day-impacts of GO18.8A on crime. The pre-
GO18.8A period used to train the BSTS models covered
October 1, 2015 to August 31, 2017, while the post-period
covered October 1, 2017 to August 31, 2019. September
2017 was excluded as the reform was implemented during
that month.
Dollars and Sense in Cook County
18
APPENDIX B – LOGISTIC REGRESSION
RESULTS
Descriptive Statistics
Descriptive statistics for the study sample are presented in
Tables B.1 and B.2. Table B.1 includes descriptive statistics
for the entire study sample and separately for the pre-
GO18.8A and post-GO18.8A cohorts; Table B.2 includes
descriptive statistics only for the defendants in the sample
who were released pretrial, and separately for those
released in the pre-GO18.8A and post-GO18.8A cohorts.
The first outcome variable, I-Bonds, showed significant
variation across the pre- and post-GO18.8A cohorts: overall,
39.9% of defendants in the sample received an I-Bond at the
initial bond court date, but the percent of defendants
receiving an I-Bond was significantly lower for the pre-
GO18.8A cohort than for the post-GO18.8A cohort (25.6% vs.
55.9%). There was also an increase in the second outcome
variable, the percent of defendants released pretrial;
overall, 78.3% of defendants in the sample were released
pretrial, with 75.7% of the pre-GO18.8A cohort released
pretrial compared to 81.3% of the post-GO18.8A cohort.
Table B.1 also shows that defendants in the overall sample
and in the pre- and post-GO18.8A cohorts tended to be
male and Black, with these percentages increasing slightly
in the post-GO18.8A cohort; roughly 30% of defendants
were 18-25 years old, but the largest proportion of
defendants were over 36 years old. There was a slight
increase in the percent of defendants in violation of
probation/bail bond, with 7.2% of defendants in the pre-
GO18.8A cohort in violation of probation/bail bond
compared to 11.8% of defendants in the post-GO18.8A
cohort. Defendants tended to be charged with unspecified,
Class 3, or Class 4 Felonies, and over 40% were charged
with Drug offenses. The percent of defendants charged with
Weapons offenses was lower in the pre-GO18.8A cohort
compared to the post-GO18.8A cohort (8.0% vs. 13.4%);
conversely, the percent of defendants charged with
Property offenses was higher in the pre-GO18.8A cohort
compared to the post-GO18.8A cohort (10.3% vs. 14.2%). The
majority of defendants (over 70%) in the overall sample and
in the pre- and post-GO18.8A were charged with a single
felony and over 40% were charged with a single offense.
Finally, the mean PSA scores – for FTAs, New Criminal
Activity, and New Violent Criminal Activity – remained
constant in the pre- and post-GO18.8A cohorts.
Table B.1. Descriptive Statistics for Initial Sample
Full
Sample
Pre-
GO18.8A
Post-
GO18.8A
Total Cases
36
24,056
12,756
11,300
I-Bond
39.9%
25.6%
55.9%
Released
78.3%
75.7%
81.3%
Female
14.4%
15.3%
13.4%
Male
85.6%
84.7%
86.6%
White
18.8%
20.2%
17.4%
Black
63.2%
61.7%
64.8%
Hispanic/Other
18.0%
18.1%
17.8%
18-25 years old
31.8%
32.3%
31.2%
26-35 years old
29.0%
28.3%
29.9%
36+ years old
39.2%
39.4%
38.8%
Viol. of Prob./Bail
9.3%
7.2%
11.8%
Unclassified Felony
11.5%
12.3%
10.6%
Class 4 Felony
45.7%
46.1%
45.6%
Class 3 Felony
13.9%
13.3%
14.8%
Class 2 Felony
11.7%
10.9%
12.7%
Class 1 Felony
6.5%
6.2%
6.9%
Class X Felony
9.9%
10.6%
8.8%
Murder
0.7%
0.6%
0.7%
Person Offense
11.1%
10.9%
11.3%
Weapon Offense
10.5%
8.0%
13.4%
Property Offense
17.5%
20.3%
14.2%
Drug Offense
42.9%
42.3%
43.5%
Other Offense
18.0%
18.4%
17.6%
1 Charge
43.2%
45.2%
41.0%
2 Charges
21.8%
20.9%
22.7%
3+ Charges
35.0%
33.9%
36.3%
1 Felony Charge
75.9%
77.8%
73.7%
2 Felony Charges
16.2%
15.5%
17.1%
3+ Felony Charges
7.9%
6.7%
9.2%
PSA FTA Score
(mean)
2.5
2.5
2.5
PSA New Crim. Act.
Score (mean)
2.9
2.9
2.9
PSA New Viol. Crim.
Act. Score (mean)
0.6
0.5
0.7
Missing PSA
26.3%
35.5%
16.0%

Dollars and Sense in Cook County
19
The remaining outcome variables – FTA, New Criminal
Activity, New Violent Criminal Activity – showed little
variation across the pre- and post-GO18.8A cohorts (Table
B.2). Overall, 18.3% of released defendants in the sample
had an FTA during the follow-up period, with the percent of
released defendants with an FTI slightly lower for the pre-
GO18.8A cohort than for the post-GO18.8A cohort (16.7% vs.
19.8%). There was also a slight increase in New Criminal
Activity; overall, 17.3% of released defendants in the sample
were charged with New Criminal Activity, with 16.7% of the
pre-GO18.8A cohort released pretrial compared to 17.8% of
the post-GO18.8A cohort. Finally, overall, 3.1% of released
defendants in the sample were charged with New Violent
Criminal Activity during the follow-up period, with the
percent of released defendants with New Violent Criminal
Activity slightly lower for the pre-GO18.8A cohort than for
the post-GO18.8A cohort (2.9% vs. 3.2%).
Table B.2 also shows that few differences in defendant and
case characteristics existed between the initial sample and
the released sample of defendants. The primary differences
involved charge factors. A slightly larger proportion of
released defendants were charged with Unspecified, Class
3, or Class 4 Felonies than the overall sample (74.9% vs.
70.1%). Similarly, a slightly higher proportion of released
defendants were charged with Property, Drug, or Other
Offenses than the overall sample (82.8% vs. 78.4%).
Differences between the pre- and post-GO18.8A cohorts
observed in the initial sample also remained in the released
sample. Among released defendants, there was a slight
increase in the percent of defendants in violation of
probation/bail bond and a slight increase in the percent of
defendants charged with Weapons offenses in the post-
GO18.8A cohort compared to the pre-GO18.8A cohort.
Table B.2. Descriptive Statistics for Released Sample
Full
Sample
Pre-
GO18.8A
Post-
GO18.8A
Total Cases
37
18,024
8,891
9,133
FTA
18.3%
16.7%
19.8%
New Crim. Act.
17.3%
16.7%
17.8%
New Viol. Crim. Act.
3.1%
2.9%
3.2%
Female
15.6%
16.6%
14.7%
Male
84.4%
83.4%
85.3%
White
19.5%
20.5%
18.4%
Black
61.9%
60.6%
63.2%
Hispanic/Other
18.6%
18.9%
18.4%
18-25 years old
30.9%
31.3%
30.7%
26-35 years old
28.1%
27.0%
29.2%
36+ years old
41.0%
41.7%
40.1%
Viol. of Prob./Bail
8.9%
6.2%
11.7%
Unclassified Felony
9.5%
10.4%
8.6%
Class 4 Felony
51.5%
51.2%
51.8%
Class 3 Felony
13.9%
12.9%
14.9%
Class 2 Felony
10.9%
9.9%
11.8%
Class 1 Felony
6.1%
5.5%
6.7%
Class X Felony
8.0%
9.9%
6.1%
Murder
0.07%
0.08%
0.07%
Person Offense
7.4%
7.7%
7.2%
Weapon Offense
9.7%
7.5%
11.9%
Property Offense
17.3%
19.8%
14.9%
Drug Offense
49.2%
48.5%
49.9%
Other Offense
16.3%
16.6%
16.1%
1 Charge
42.1%
43.9%
40.3%
2 Charges
22.3%
21.2%
23.4%
3+ Charges
35.6%
34.9%
36.4%
1 Felony Charge
77.7%
79.2%
76.2%
2 Felony Charges
15.6%
14.8%
16.5%
3+ Felony Charges
6.7%
6.0%
7.3%
PSA FTA Score
(mean)
2.5
2.5
2.5
PSA New Crim. Act.
Score (mean)
2.9
2.9
2.9
PSA New Viol. Crim.
Act. Score (mean)
0.3
0.3
0.3
Missing PSA
23.0%
32.8%
13.6%
Weeks at Risk
(mean)
20.1
19.7
20.4

Dollars and Sense in Cook County
20
I-Bond – Logistic Regression Models
A series of logistic regression models examined the
association between GO18.8A and the odds of defendants
receiving an I-Bond (Table B.3). Model 1 assesses the
influence of GO18.8A on the full sample; this allows for
examination of the influence of GO18.8A on the likelihood of
receiving an I-Bond, controlling for defendant and case
factors. Models 2 and 3 examine the pre- and post-GO18.8A
cohorts separately; these models allow for examination of
changes in the influence of different defendant and case
factors pre- and post-GO18.8A. Odds ratios for GO18.8A and
for defendant and case factors represent the independent
influence of that factor on the odds of receiving an I-Bond.
Estimates from Model 1 show that, controlling for a number
of defendant and case factors, defendants with a bond
court hearing after GO18.8A were
more likely
to receive an
I-Bond. Specifically, having a hearing after GO18.8A
increased the odds of receiving an I-Bond by 516%.
Several defendant and case factors also affected the odds
of receiving an I-Bond. Male defendants and younger
defendants were less likely to receive an I-Bond. While
Hispanic/Other defendants were more likely than White
defendants to receive an I-Bond, Black defendants were
neither more nor less likely than White defendants. As
Model 1 indicates, receiving an I-Bond also was related to
several offense factors, with defendants charged with more
serious felonies, Person/Weapons/Other offenses, and
multiple felony charges less likely to receive an I-Bond; in
contrast, defendants charged with Drug offenses were
more likely to receive an I-Bond relative to defendants
charged with Property offenses. Defendants with higher
PSA scores for risk of FTA, New Criminal Activity, and New
Violent Criminal Activity were less likely to receive I-Bonds.
Estimates remain fairly stable when considering the
likelihood of receiving an I-Bond pre-GO18.8A (Model 2) and
post-GO18.8A (Model 3). The most notable difference is the
impact of defendant race. As Model 2 indicates, before
GO18.8A, being Black or Hispanic/Other was not associated
with the odds of receiving an I-Bond; however, as Model 3
indicates, after GO18.8A Black and Hispanic/Other
defendants were
more likely
to receive an I-Bond relative to
White defendants.
To further examine the effect of GO18.8A on the likelihood
of receiving an I-Bond, propensity score matching was used
to generate a sample of comparable sets of defendants in
the pre- and post-GO18.8A cohorts. This procedure allows
the pairing of defendants in the pre-GO18.8A cohort with
“equivalent” defendants in the post-GO18.8A cohort based
on defendant and case factors. The matching routine is
based on the specification of a selection model aimed at
minimizing the compositional differences across
subsamples. Failing to account for these differences would
confound the effect of GO18.8A on the odds of receiving an
I-Bond with the effects of differences in defendant and case
factors between the pre- and post-GO18.8A cohorts.
Table B.3. Logistic Regression Models, I-Bond
Model 1
Model 2
Model 3
Full
Sample
Pre-
GO18.8A
Post-
GO18.8A
(Odds)
(Odds)
(Odds)
GO18.8A
6.16***
--
--
Female (ref.)
--
--
--
Male
0.49***
0.49***
0.53***
White (ref.)
--
--
--
Black
0.98
0.92
1.16*
Hisp./Other
1.12*
1.09
1.28***
Age
1.01***
1.01***
1.01***
Offense Class
0.79***
0.81***
0.75***
Prop. Off (ref)
--
--
--
Person Off.
0.17***
0.20***
0.20***
Weapon Off.
0.25***
0.11***
0.30***
Drug Off.
3.01***
3.08***
3.13***
Other Off.
0.49***
0.44***
0.59***
Total Charges
1.01
0.95**
1.04**
Fel. Charges
0.75***
0.79***
0.74***
Viol. Pro./Bail
0.89*
0.68***
0.94
PSA FTA
Score 1-2 (ref)
--
--
--
Score 3-4
0.85***
0.81**
0.86*
Score 5-6
0.71**
0.83
0.64***
Missing
0.33***
0.40***
0.19***
PSA NCA
Score 1-2 (ref)
--
--
--
Score 3-4
0.39***
0.24***
0.56***
Score 5-6
0.21***
0.11***
0.27***
Missing
38
--
--
--
PSA NVCA
0.39***
0.21**
0.36***
Missing
--
--
--
-2 log
likelihood
-11,656.06
-5,674.68
-5,752.03
Negerlkerke
pseudo R
0.28
0.22
0.25
Chi-Square
8,987.13***
3,332.15***
3,980.27***
N
24,056
12,756
11,300
*p<.05; **p<.01, ***p<.001
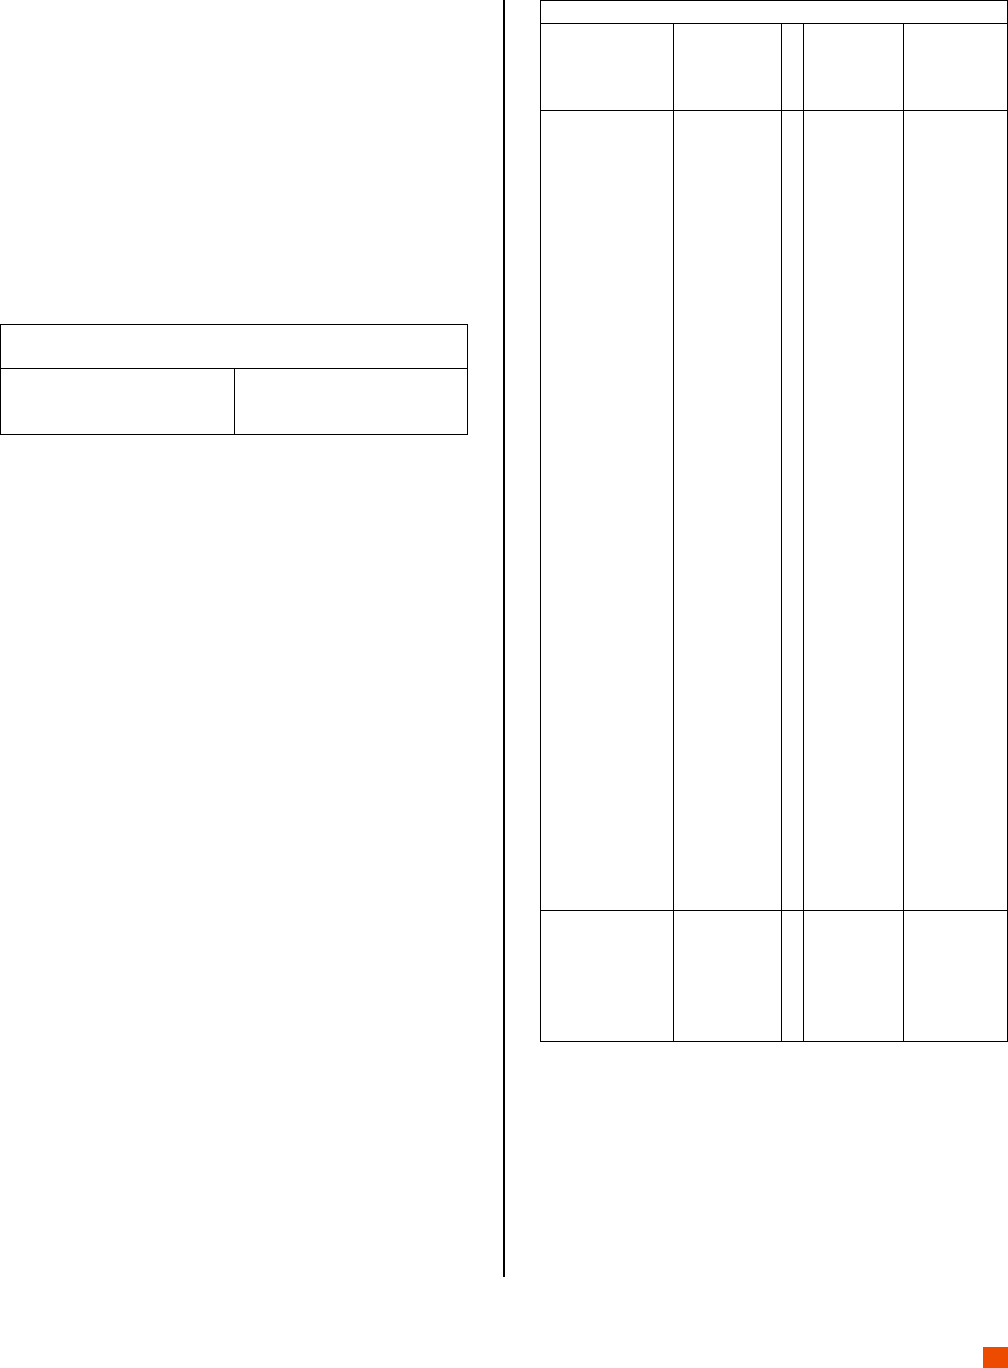
Dollars and Sense in Cook County
21
To calculate a propensity score for each defendant, a
logistic model was fit. Next, individuals were matched on
the basis of their propensity scores. The newly configured
matched samples were then used to measure the effect of
GO18.8A on the likelihood of receiving an I-Bond. Given that
the matched samples were relatively balanced, variations in
the defendants receiving I-Bonds may be attributed to the
impact of GO18.8A.
Results for the matched sample shown in Table B.4 indicate
that GO18.8A significantly increased the odds of receiving
an I-Bond. Specifically, GO18.8A increased the percent of
defendants receiving an I-Bond by roughly 30 percentage
points.
Table B.4. Propensity Score Matched Samples – Average
Effect of GO18.8A on I-Bond
GO18.8A coefficient
0.301***
Standard Error
0.007
95% bounds: lower, upper
0.286, 0.315
*p<.05; **p<.01, ***p<.001
Release – Logistic Regression Results
The next series of logistic regression models examined the
association between GO18.8A and the odds of defendants
being released pretrial (Table B.5). Model 4 assesses the
influence of GO18.8A on the full sample; Models 5 and 6
examine the pre- and post-GO18.8A cohorts separately.
Odds ratios for GO18.8A and for each defendant and case
factor represent the independent influence of that factor on
the likelihood of a defendant being released.
Estimates from Model 4 show that, controlling for
defendant and case factors, defendants with a bond court
hearing after GO18.8A were
more likely
to be released
pretrial. Specifically, having a hearing after GO18.8A
increased the odds of being released pretrial by 42%.
Several defendant and case factors also affected the odds
of being released pretrial. Male defendants, Black
defendants, younger defendants, and defendants with
probation/bail bond violations were less likely to be
released. Defendants charged with more serious felonies,
Person/Weapons/Other offenses, and multiple felony
charges were less likely to be released; in contrast,
defendants charged with Drug offenses were more likely to
be released relative to defendants charged with Property
offenses. Finally, defendants with higher PSA scores for risk
of FTA, New Criminal Activity, and New Violent Criminal
Activity were less likely to be released. Surprisingly,
defendants with more total charges were more likely to be
released.
Estimates remain fairly stable when considering the
likelihood of being released pre-GO18.8A (Model 5) and
post-GO18.8A (Model 6). The most notable difference is the
impact of Weapons offenses on release. As Model 5
indicates, before GO18.8A, defendants charged with
Weapons offenses were
more likely
to be released pretrial
Table B.5. Logistic Regression Models, Release
Model 4
Model 5
Model 6
Full
Sample
Pre-
GO18.8A
Post-
GO18.8A
(Odds)
(Odds)
(Odds)
GO18.8A
1.42***
--
--
Female (ref.)
--
--
--
Male
0.81**
0.82***
0.81*
White (ref.)
--
--
--
Black
0.83***
0.86*
0.74***
Hisp./Other
1.03
1.09
0.87
Age
1.02***
1.02***
1.02***
Offense Class
0.90***
0.92***
0.85***
Prop. Off. (ref)
--
--
--
Person Off.
0.62***
0.72***
0.45***
Weapon Off.
0.88
1.29**
0.56***
Drug Off.
1.39***
1.28***
1.53***
Other Off.
0.72***
0.83*
0.53***
Total Charges
1.05***
1.04**
1.05**
Fel. Charges
0.95*
0.97
0.92**
Viol. Pro./Bail
0.84**
0.67***
1.14
PSA FTA
Score 1-2 (ref)
--
--
--
Score 3-4
1.00
0.93
1.10
Score 5-6
0.80*
0.78
0.88
Missing
0.877*
1.04
0.70***
PSA NCA
Score 1-2 (ref)
--
--
--
Score 3-4
0.73***
0.92
0.52***
Score 5-6
0.59***
1.07
0.30***
Missing
--
--
--
PSA NVCA
0.69***
0.63***
0.82
Missing
--
--
--
I-Bond (ref.)
--
--
--
EM
0.19***
0.19***
0.15***
D/C-Bond
0.22***
0.17***
0.32***
No Bail
0.02***
0.02***
0.02***
-2 log
likelihood
-9,667.27
-6,001.60
-3,563.49
Negerlkerke
pseudo R
0.23
0.15
0.34
Chi-Square
5,780.36***
2,133.12***
3,736.01***
N
24,056
12,756
11,300
*p<.05; **p<.01, ***p<.001
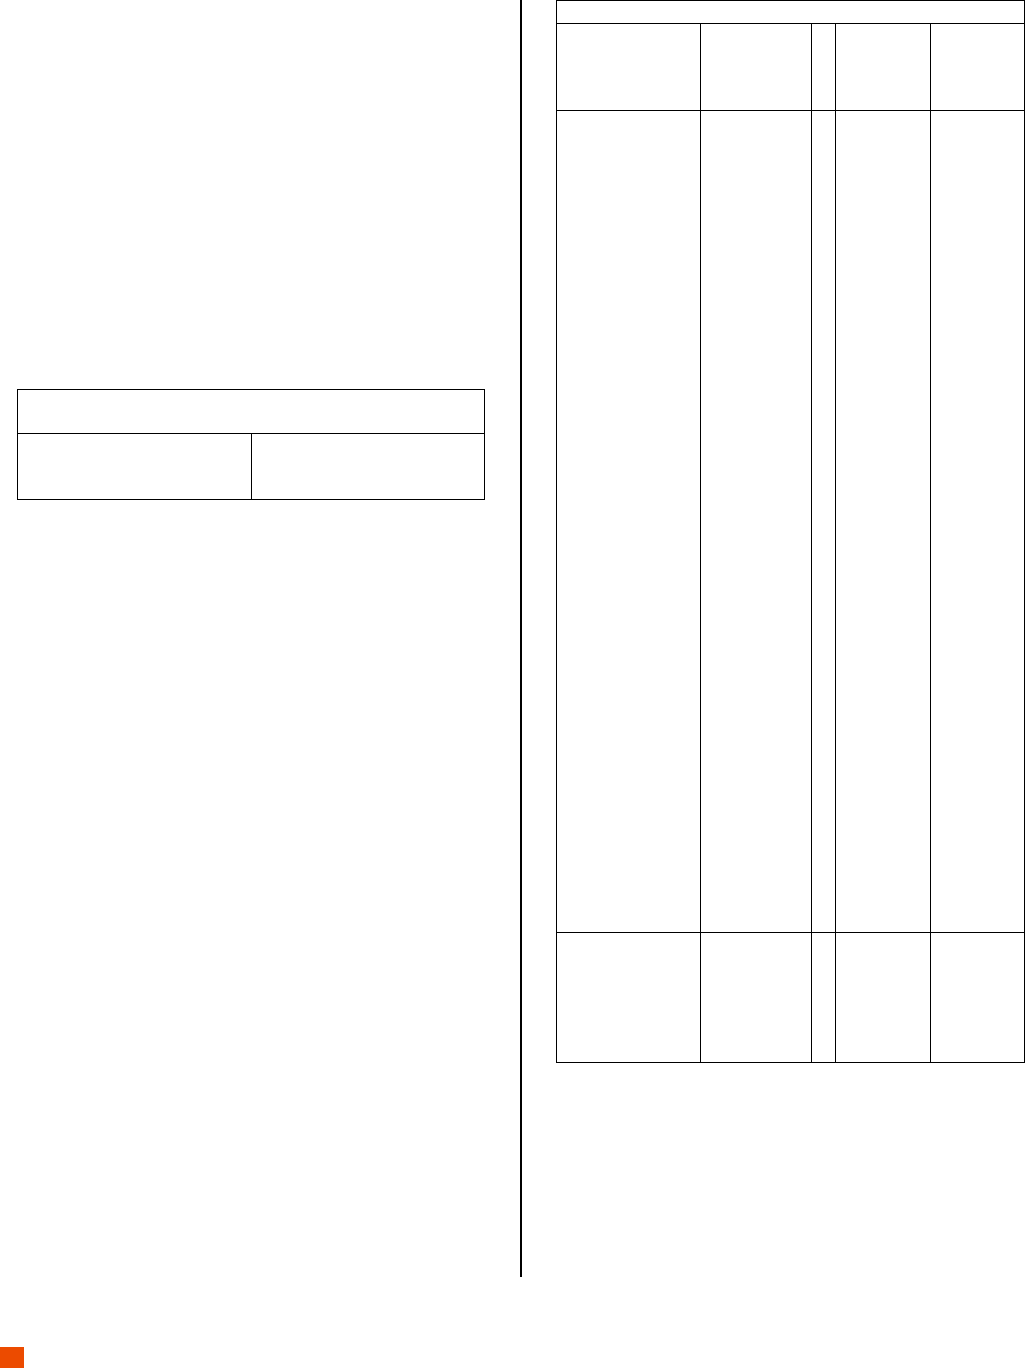
Dollars and Sense in Cook County
22
relative to defendants charged with Property offenses;
however, as Model 6 indicates, after GO18.8A, defendants
charged with Weapons offenses were
less likely
to be
released pretrial. In addition, before GO18.8A, PSA scores
for risk of New Criminal Activity were not associated with
odds of release; however, after GO18.8A, defendants with
higher PSA scores for risk of New Criminal Activity were
less likely to be released.
To further examine the effect of GO18.8A on the likelihood
of pretrial release, propensity score matching was used to
generate a sample of comparable sets of in the pre- and
post-GO18.8A cohorts. Results for the matched sample
shown in Table B.6 indicate that GO18.8A significantly
increased the odds of pretrial release. Specifically, GO18.8A
increased the percent of defendants released pretrial by
roughly 6 percentage points.
Table B.6. Propensity Score Matched Samples – Average
Effect of GO18.8A on Release
GO18.8A coefficient
0.059***
Standard Error
0.007
95% bounds: lower, upper
0.045, 0.073
*p<.05; **p<.01, ***p<.001
FTA – Logistic Regression Results
The next series of logistic regression models examined the
association between GO18.8A and the odds of released
defendants receiving an FTA (Table B.7). Model 7 assesses
the influence of GO18.8A on the full sample; Models 8 and 9
examine the pre- and post-GO18.8A cohorts separately.
Odds ratios for GO18.8A and for each defendant and case
factor represent the independent influence of that factor on
the likelihood of a FTA.
Estimates from Model 7 show that, after controlling for
defendant and case factors, released defendants with a
bond court hearing after GO18.8A were
more likely
to have
an FTA. Specifically, having a hearing after GO18.8A
increased the odds of an FTA by 24%.
Hispanic/Other defendants and older defendants were less
likely to have an FTA. Defendants charged with more
serious felonies and Person/Weapons/Drugs/Other
offenses also were less likely to have an FTA. Finally,
defendants with higher PSA scores for risk of FTA and New
Criminal Activity were more likely to have an FTA; in
contrast, defendants with higher PSA scores for risk of New
Violent Criminal Activity were less likely to have an FTA.
Defendants with an initial bond type of EM or D/C-Bond
were less likely to have an FTA, but defendants with an
initial bond type of No Bail were more likely to have an FTA,
relative to defendants with an initial bond type of I-Bond.
Finally, defendants who spent more time in the community
were more likely to have an FTA.
Estimates remain fairly stable when considering the
likelihood of an FTA pre-GO18.8A (Model 8) and post-
GO18.8A (Model 9). The most notable difference is the
Table B.7. Logistic Regression Models, FTA
Model 7
Model 8
Model 9
Full
Sample
Pre-
GO18.8A
Post-
GO18.8A
(Odds)
(Odds)
(Odds)
GO18.8A
1.24***
--
--
Female (ref.)
--
--
--
Male
0.92
0.84*
1.02
White (ref.)
--
--
--
Black
0.96
1.03
0.90
Hisp./Other
0.82**
0.87
0.76**
Age
0.99***
0.99***
0.99*
Offense Class
0.90***
0.89***
0.92***
Prop. Off. (ref.)
--
--
--
Person Off.
0.51***
0.55***
0.47***
Weapon Off.
0.33***
0.27**
0.37***
Drug Off.
0.47***
0.47***
0.46***
Other Off.
0.74***
0.78*
0.68***
Total Charges
0.98
0.99
0.98
Fel. Charges
1.00
1.00
0.99
Viol. Pro./Bail
1.12
0.91
1.23**
PSA FTA Score
1-2 (ref)
--
--
--
Score 3-4
1.41***
1.35***
1.45***
Score 5-6
2.20***
1.78**
2.52***
Missing
1.70***
1.38***
2.20***
PSA NCA Score
1-2 (ref.)
--
--
--
Score 3-4
1.27***
1.28*
1.28***
Score 5-6
1.17
1.29
1.12
Missing
--
--
--
PSA NVCA
0.64*
0.37***
0.84
Missing
--
--
--
I-Bond (ref.)
--
--
--
EM
0.80***
0.74***
0.69**
D/C-Bond
0.86***
0.75***
0.96
No Bail
3.69***
8.51***
2.21***
Weeks at risk
1.01***
1.01***
1.01***
-2 log
likelihood
-8,155.18
-3,785.46
-4,331.55
Negerlkerke
pseudo R
0.05
0.05
0.05
Chi-Square
801.92***
433.53***
415.42***
N
18,024
8,891
9,133
*p<.05; **p<.01, ***p<.001
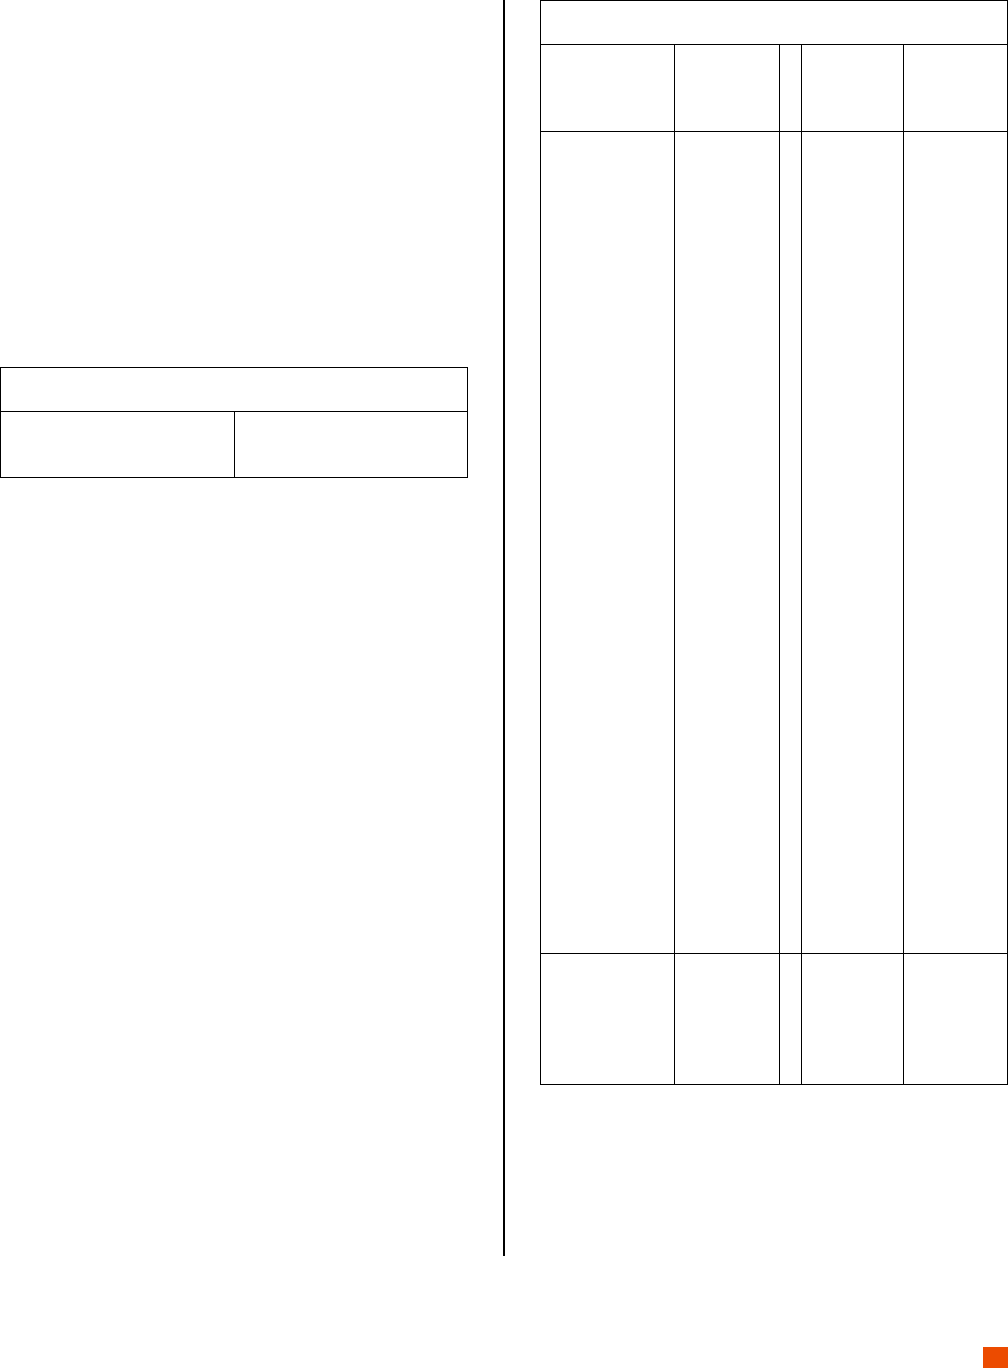
Dollars and Sense in Cook County
23
impact of bond type. As Model 8 indicates, before GO18.8A,
defendants with an initial bond type of D/C-Bond were
less
likely
to have an FTA relative to defendants with an initial
bond type of I-Bond; however, as Model 9 indicates, after
GO18.8A, there were no differences in the odds of an FTA
for defendants with an initial bond type of D/C-Bond and
defendants with an I-Bond.
To further examine the effect of GO18.8A on the likelihood
of an FTA, propensity score matching was used to generate
a sample of comparable sets of defendants in the pre- and
post-GO18.8A cohorts. Results for the matched sample
shown in Table B.8 indicate that GO18.8A significantly
increased the odds of an FTA. Specifically, GO18.8A
increased the percent of defendants with an FTA by roughly
4 percentage points.
Table B.8. Propensity Score Matched Samples – Average
Effect of GO18.8A on FTA
GO18.8A coefficient
0.038***
Standard Error
0.007
95% bounds: lower, upper
0.023, 0.054
*p<.05; **p<.01, ***p<.001
New Criminal Activity – Logistic Regression Results
The next series of logistic regression models examined the
association between GO18.8A and the odds of released
defendants being charged with new criminal activity while
on pretrial release (Table B.9). Model 10 assesses the
influence of GO18.8A on the full sample; Models 11 and 12
examine the pre- and post-GO18.8A cohorts separately.
Odds ratios for GO18.8A and for each defendant and case
factor represent the independent influence of that factor on
the likelihood of new criminal activity.
Model 10 shows that, controlling for defendant and case
factors, released defendants with a bond court hearing
after GO18.8A were neither more nor less likely to be
charged with new criminal activity. Put differently, GO18.8A
had no impact on the odds of a released defendant being
charged with new criminal activity.
Several defendant and case factors, however, did affect the
odds of new criminal activity. Defendants who were male,
Black, and younger were more likely to have new criminal
activity. As Model 10 indicates, defendants charged with
more serious felonies also were more likely to have new
criminal activity, but defendants charged with
Person/Drugs/Other offenses were less likely to have new
criminal activity; defendants charged with Weapons
offenses were neither more nor less likely to have new
criminal activity relative to defendants charged with
Property offenses. Finally, defendants with higher PSA
scores for risk of FTA and New Criminal Activity were more
likely to have new criminal activity; while, defendants with
higher PSA scores for risk of New Violent Criminal Activity
were less likely to have new criminal activity. Defendants
with an initial bond type of EM were more likely to have
Table B.9. Logistic Regression Models, New Criminal
Activity
Model 10
Model 11
Model 12
Full
Sample
Pre-
GO18.8A
Post-
GO18.8A
(Odds)
(Odds)
(Odds)
GO18.8A
0.97
--
--
Female (ref.)
--
--
--
Male
1.38***
1.36***
1.39***
White (ref.)
--
--
--
Black
1.37***
1.60***
1.20*
Hisp./Other
0.88
0.99
0.81
Age
0.97***
0.96***
0.97***
Offense Class
1.17***
1.13***
1.20***
Prop. Off (ref)
--
--
--
Person Off.
0.65***
0.64**
0.59***
Weapon Off.
0.87
0.84
0.84
Drug Off.
0.50***
0.57***
0.40***
Other Off.
0.67***
0.83
0.52***
Total Charges
1.00
0.98
1.01
Fel. Charges
1.03
1.03
1.03
Viol. Pro./Bail
2.75***
1.13
4.45***
PSA FTA
Score 1-2 (ref)
--
--
--
Score 3-4
1.26***
1.06
1.43***
Score 5-6
1.42**
1.05
1.73***
Missing
1.04
1.09
0.85
PSA NCA
Score 1-2 (ref)
--
--
--
Score 3-4
1.39***
1.38***
1.38***
Score 5-6
1.42***
1.61**
1.28
Missing
--
--
--
PSA NVCA
0.75*
0.63*
0.78
Missing
--
--
--
I-Bond (ref.)
--
--
--
EM
1.16*
1.29**
0.97
D/C-Bond
0.91
0.93
0.96
No Bail
0.71
1.08
0.55**
Weeks at risk
0.97***
0.97***
0.96***
-2 log
likelihood
-7,830.72
-3,890.94
-3,836.31
Negerlkerke
pseudo R
0.10
0.07
0.14
Chi-Square
1,672.68***
580.26***
1,295.29***
N
18,024
8,891
9,133
*p<.05; **p<.01, ***p<.001
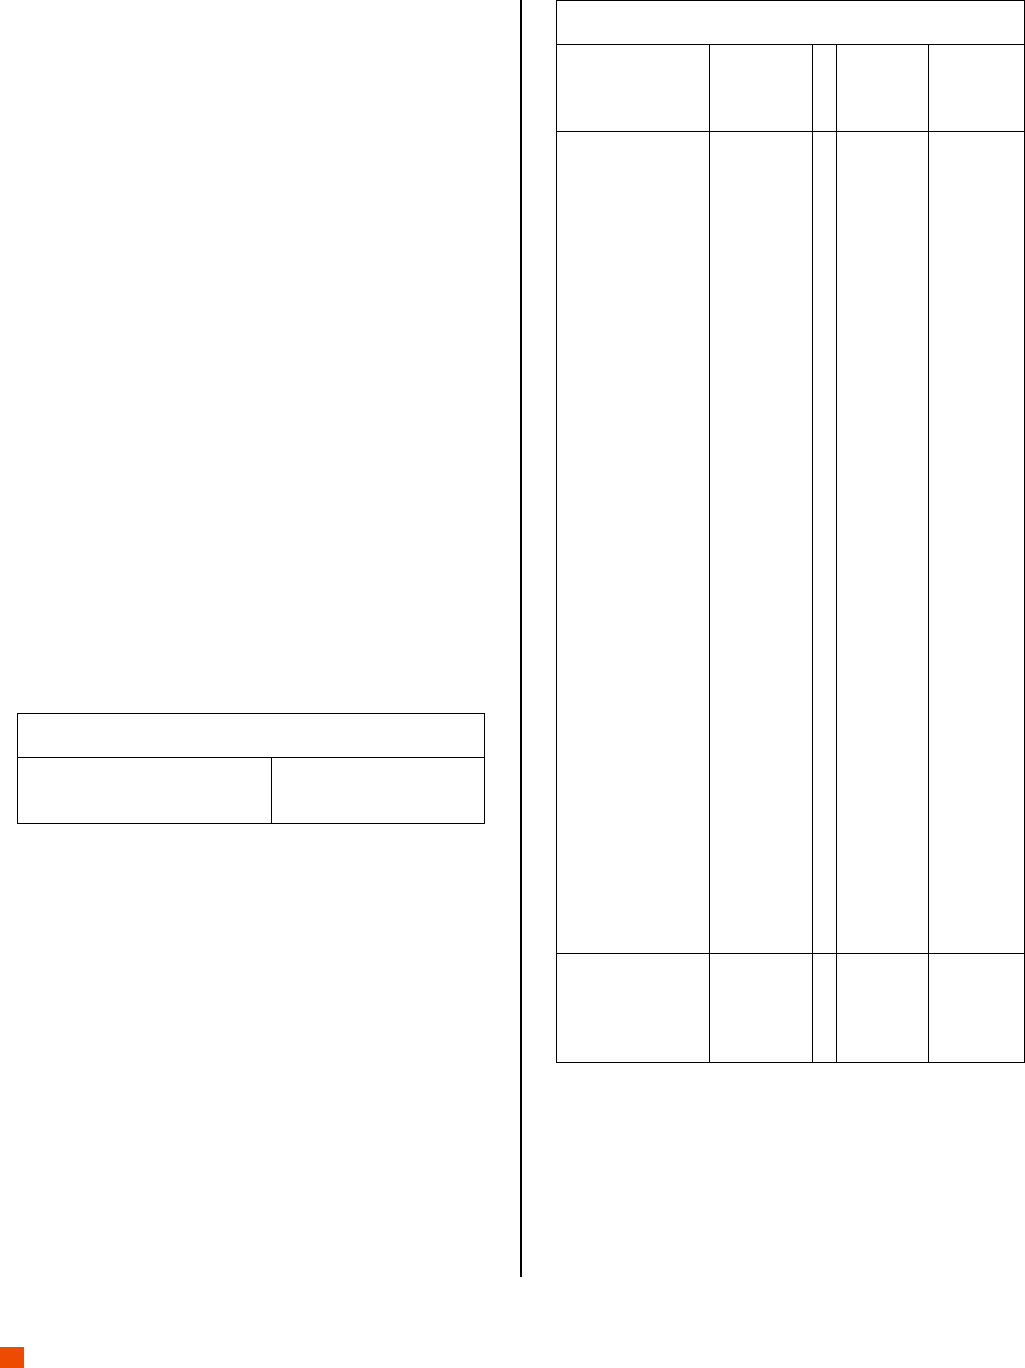
Dollars and Sense in Cook County
24
new criminal activity, but defendants with an initial bond
type of D/C-Bond or No Bail were neither more nor less
likely to have new criminal activity, relative to defendants
with an I-Bond. Finally, defendants who spent more time in
the community were less likely to have new criminal
activity.
Estimates remain fairly stable when considering the
likelihood of new criminal activity pre-GO18.8A (Model 11)
and post-GO18.8A (Model 12). The most notable difference
is the impact of PSA scores. As Model 11 indicates, before
GO18.8A, PSA scores for risk of an FTA were unrelated to
new criminal activity; however, as Model 12 indicates, after
GO18.8A, defendants with higher PSA scores for risk of an
FTA were more likely to have new criminal activity. A
second notable difference is the impact of initial bond type.
Before GO18.8A, defendants with an initial bond type of EM
were more likely to have new criminal activity, but
defendants with an initial bond type of D/C-Bond or No Bail
were neither more nor less likely to have new criminal
activity, relative to defendants with an initial bond type of I-
Bond; after GO18.8A, however, bond type was unrelated to
new criminal activity (the negative, significant finding for No
Bail is likely due to the very small number of defendants
released with No Bail).
To further examine the effect of GO18.8A on the likelihood
of new criminal activity, propensity score matching was
used to generate a sample of comparable sets of
defendants in the pre- and post-GO18.8A cohorts. Results
for the matched sample shown in Table B.10 indicate that
GO18.8A had no impact on the odds of new criminal activity.
Table B.10. Propensity Score Matched Samples –
Average Effect of GO18.8A on New Criminal Activity
GO18.8A coefficient
0.005
Standard Error
0.007
95% bounds: lower, upper
-0.009, 0.020
*p<.05; **p<.01, ***p<.001
New Violent Criminal Activity – Logistic Regression Results
The final series of logistic regression models examined the
association between GO18.8A and the likelihood of released
defendants being charged with new violent criminal activity
while on pretrial release (Table B.11). Model 13 assesses the
influence of GO18.8A on the full sample; Models 14 and 15
examine the pre- and post-GO18.8A cohorts separately.
Odds ratios for GO18.8A and for each defendant and case
factor represent the independent influence of that factor on
the likelihood of new violent criminal activity.
Estimates from Model 13 show that, controlling defendant
and case factors, released defendants with a bond court
hearing after GO18.8A were neither more nor less likely to
be charged with new violent criminal activity. Put
differently, GO18.8A had no impact on the odds of a
released defendant being charged with new violent criminal
activity.
Table B.11. Logistic Regression Models, New Violent
Criminal Activity
Model 13
Model 14
Model 15
Full
Sample
Pre-
GO18.8A
Post-
GO18.8A
(Odds)
(Odds)
(Odds)
GO18.8A
1.05
--
--
Female (ref.)
--
--
--
Male
1.43*
1.53*
1.34
White (ref.)
--
--
--
Black
1.40**
1.79**
1.15
Hisp./Other
1.14
1.43
0.95
Age
0.96***
0.96***
0.95***
Offense Class
1.04
1.02
1.04
Prop. Off. (ref.)
--
--
--
Person Off.
1.84***
2.34***
1.41
Weapon Off.
1.23
1.40
1.09
Drug Off.
0.54***
0.65**
0.45***
Other Off.
1.15
1.19
1.11
Total Charges
1.04
1.03
1.04
Fel. Charges
0.97
0.96
0.98
Viol. Pro./Bail
1.48***
1.33
1.56**
PSA FTA Score
1-2 (ref)
--
--
--
Score 3-4
1.27
1.11
1.39*
Score 5-6
1.62*
2.14*
1.41
Missing
1.08
1.29
0.81
PSA NCA Score
1-2 (ref.)
--
--
--
Score 3-4
0.94
1.00
0.90
Score 5-6
1.10
0.95
1.16
Missing
--
--
--
PSA NVCA
1.41
1.02
1.70*
Missing
--
--
--
I-Bond (ref.)
--
--
--
EM
1.00
1.09
0.78
D/C-Bond
1.27*
1.16
1.39*
No Bail
0.87
0.71
0.95
Weeks at risk
0.97***
0.97***
0.96***
-2 log likelihood
-2,408.59
-1,160.90
-1,238.54
Negerlkerke
pseudo R
0.07
0.06
0.09
Chi-Square
373.79***
153.51***
237.66***
N
18,024
8,891
9,133
*p<.05; **p<.01, ***p<.001

Dollars and Sense in Cook County
25
Several defendant and case factors, however, did affect the
odds of new violent criminal activity. Defendants who were
male, Black, and younger were more likely to have new
violent criminal activity. As Model 13 indicates, defendants
charged with Person offenses were more likely and
defendants charged with Drug offenses were less likely to
have new violent criminal activity relative to defendants
charged with Property offenses. PSA scores and initial bond
types were not associated with new violent criminal
activity. Finally, defendants who spent more time in the
community were less likely to have new violent criminal
activity.
Estimates remain fairly stable when considering the
likelihood of new violent criminal activity pre-GO18.8A
(Model 14) and post-GO18.8A (Model 15). The most notable
difference is the impact of race and gender. As Model 14
indicates, before GO18.8A, defendants who were male and
Black were more likely to have new violent criminal activity;
however, as Model 15 indicates, after GO18.8A, defendant
gender and race were unrelated to new violent criminal
activity. A second notable difference is the impact of initial
bond type. Before GO18.8A, bond type was unrelated to
new criminal activity; however, after GO18.8A defendants
with an initial bond type of D/C-Bond were more likely to
have new violent criminal activity, relative to defendants
with an initial bond type of I-Bond. Finally, as Model 14
indicates, before GO18.8A, PSA scores for risk of new
violent criminal activity were unrelated to new criminal;
however, as Model 15 indicates, after GO18.8A, defendants
with higher PSA scores for risk of new violent criminal
activity were more likely to have new violent criminal
activity.
To further examine the effect of GO18.8A on the likelihood
of new criminal activity, propensity score matching was
used to generate a sample of comparable sets of
defendants in the pre- and post-GO18.8A cohorts. Results
for the matched sample shown in Table B.12 indicate that
GO18.8A had no impact on the odds of new violent criminal
activity.
Table B.12. Propensity Score Matched Samples – Average
Effect of GO18.8A on New Violent Crim Act
GO18.8A coefficient
0.002
Standard Error
0.003
95% bounds: lower, upper
-0.004, 0.008
*p<.05; **p<.01, ***p<.001
Dollars and Sense in Cook County
26
NOTES
1
Chloe Anderson, Cindy Redcross, and Erin Valentine (2019).
Evaluation of Pretrial Justice System Reforms That Use the
Public Safety Assessment: Effects of New Jersey’s Criminal
Justice Reform. New York City: MDRC.
2
Melanie Skemer, Cindy Redcross, and Howard Bloom
(2020). Pursuing Pretrial Justice Through an Alternative to
Bail: Findings from an Evaluation of New York City’s
Supervised Release Program. New York City: MDRC.
3
Oren M. Gur, Michael Hollander, and Pauline Alvarado
(2019). Prosecutor-Led Bail Reform: Year One. Philadelphia:
Philadelphia District Attorney’s Office.
4
Office of the Chief Judge Circuit Court of Cook County .
General Order 18.8A - Procedures for Bail Hearings and
Pretrial Release (July 17, 2017).
http://www.cookcountycourt.org/Manage/Division-
Orders/View-Division-Order/ArticleId/2562/GENERAL-
ORDER-NO-18-8A-Procedures-for-Bail-Hearings-and-
Pretrial-Release. Accessed September 1, 2020
5
Office of the Chief Judge Circuit Court of Cook County
(2019). Bail Reform in Cook County: An Examination of
General Order 18.8A and Bail in Felony Cases. Chicago:
Office of the Chief Judge Circuit Court of Cook County.
6
David Jackson, Todd Lighty, and Gary Marx (2020). “Bail
Reform Analyses by Cook County Chief Judge Based on
Flawed Data, Undercounts New Murder Charges,” Chicago
Tribune (February 13, 2020).
7
Paul G. Cassell and Richard Fowles (Forthcoming). “Does
Bail Reform Increase Crime? An Empirical Assessment of
the Public Safety Implications of Bail Reform in Cook
County, IL.” Wake Forest Law Review.
8
James Austin and Wendy Naro-Ware (2020) pointed out
additional methodological problems encountered in the
Cassell and Fowles analyses, namely “equating arrests with
crimes committed; using relative rate rather than the actual
rate of change in estimates; …failing to account for changes
in prosecutorial policies that may have increased the
number of felony filings; and applying national state prison
recidivism rates to Cook County pretrial releases” (4) see
James Austin and Wendy Naro-Ware (2020). Why Bail
Reform is Safe and Effective: The Case of Cook County.
Washington, DC: The JFA Institute.
9
The PSA is a pre-trial risk assessment instrument
developed by the Arnold Foundation and implemented in
Cook County beginning in 2015.
10
Using these data, we initially conducted a series of
analyses to replicate those detailed in the OCJ report. These
initial analyses relied on the same date range to identify a
pre-reform cohort (July 1, 2016 through September 30,
2017) and a post-reform cohort (October 1, 2017 through
December 31, 2018), definition of eligible cases and
defendants (i.e., “initial felony bond hearings of defendants
with completed PSAs”), follow-up period (i.e., cases followed
through disposition or March 28, 2019), and definition of
outcomes (i.e., failures to appear (FTA) and new criminal
case filed before case disposition). We were able to
replicate the descriptive findings detailed in the OCJ’s
report, with the exception of release rates. Our analyses,
relying on an independent analyses of individual-level data
provided by the Clerk of the Circuit Court of Cook County
and the Cook County Sheriff, found higher rates of release
than those described in the OCJ’s report. The results of the
replication analyses are available upon request.
11
The x-axis represents the bi-weeks within the cohort. The
trend lines are the quadratic trends in outcomes.
12
These numbers represent the predicted probabilities of
receiving an I-Bond. These predicted probabilities are the
expected outcome for the average defendant/case. The
predicted probabilities are reported as the percent of
defendants with each outcome after controlling for all
defendant- and case-level factors.
13
The estimated number of people affected by the change
in the use of I-Bonds was calculated by comparing the
number of people predicted to receive an I-Bond after
GO18.8A to the number of people who would have received
an I-Bond after GO18.8A had the pre-GO18.8A I-Bond rates
remained unchanged. Thus, the calculation was: (‘post-
GO18.8A predicted probability of I-Bond’ X ‘number of
defendants in post-GO18.8A cohort’) - (‘pre-GO18.8A
predicted probability of I-Bond’ X ‘number of defendants in
post-GO18.8A cohort’). The final result was 3,559 people.
This is an estimate because, first, there is no way to know
how many people would have been given I-Bonds had
GO18.8A not been implemented and, second, the I-Bond
rates pre- and post-GO18.8A are based on predicted
probabilities accounting for defendant and case factors.
14
To determine if the effects of different defendant and
case factors varied before and after GO18.8A, the logistic
regression models were run separately for each period.
Defendant race was one factor that displayed variable
effects before and after GO18.8A. As the logistic regression
models indicate, the effect of race on the odds of receiving
an I-Bond was not statistically significant in the pre-
GO18.8A cohort; however, the effect of race was
statistically significant in the post-GO18.8A cohort.
15
As noted in Appendix A, a limitation of the current study
was the lack of information on Hispanic ethnicity,
particularly in the pre-GO18.8A cohort. It is unclear how
Hispanic defendants may have been categorized in court
data during this period, including whether they were
categorized as White defendants. As such, ethnicity is not
included in the analyses; rather, three race/ethnicity
categories were created – White, Black, Hispanic/Other.
Thus, the interpretation of the change in the likelihood of
receiving an I-Bond for White and Black defendants may be

Dollars and Sense in Cook County
27
affected by these categorizations in the court data. If data
allowed for a more accurate categorization, these observe
changes and the interpretation of disparities may be
different.
16
The bond amounts reflect 10% of the face value of the
bond, or the amount defendants would have to pay to
secure their release.
17
Although most of the posted bond is eventually returned
once the case is resolved, this is money that the defendant
or their family do not have available to them throughout the
durtation of the case.
18
It is possible that defendants receiving an I-Bond are held
due to warrants in other jurisdictions. A separate graph
showing defendants receiving No Bail who were released is
not included, given the low number of defendants with No
Bail pre-GO18.8A.
19
To determine if the effect of different defendant and case
factors varied before and after GO18.8A, the logistic
regression models were run separately for each period and
the probability of pretrial release was generated for select
defendant and case factors. Defendant race was one factor
that displayed variable effects before and after GO18.8A.
After controlling for defendant and case factors, roughly
75% of Black defendants and 77% of White defendants were
expected to be released before GO18.8A. Release rates for
both Black and White defendants increased after GO18.8A;
however, 81% of Black defendants were expected to be
released after GO18.8A compared to 83% of White
defendants. Thus, GO18.8A was associated with no change
in racial disparities in pretrial release; rather, a slight racial
disparity in release rates continued after GO18.8A. Although
it is beyond the scope of the current analyses, this requires
additional exploration. Defendant race likely also picks up
variance associated with socio-economic status and ability
to pay bond amounts. Despite the reduction in overall bond
amounts detailed in the current study, ability to pay a D-
Bond amount might explain some of these differences in
release rates. If this were the case, that would suggest
differential implementation of “affordability” in the decision
process outlined in GO18.8A.
20
The influence of weeks at risk in the community on new
criminal activity is contrary to expectations. However, this
may be an indication that, if defendants are committing
new offenses while on pretrial release, it is likely they are
committing those offenses very soon after release.
21
The BSTS method was developed by researchers at
Google and originally made available to other analysts via
an R package named CausalImpact.!- K. H. Brodersen, F.
Gallusser, J. Koehler, N. Remy, S. L. Scott. (2015). “Inferring
causal impact using Bayesian structural time-series models,”
The Annals of Applied Statistics 9: 247–274.
URL:!https://projecteuclid.org/euclid.aoas/1430226092.
doi:10.1214/14-AOAS788, publisher: Institute of
Mathematical Statistics.
22
Projecting crime out more than 365 days from the policy
implementation period examined in this report was not
done because of the inability to account for all of the
changes to policy and practice (both criminal justice and
beyond) that could influence crime levels. For the most part,
these control variables were correlated with the crime
measures in the directions that would be expected. There
was a positive correlation between average temperature
and all crime measures, with higher temperatures being
correlated with more crime (indicative of the seasonality of
crime). There was an inverse correlation between
precipitation and all crimes other than murder (if there was
precipitation, there were fewer crimes). Unemployment
rates were positively correlated with Violent Index Crime
with a Gun, but were not correlated with the overall Violent
Index Crime and inversely related to Property Index Crimes.
There was an inverse correlation between arrests for drug-
law violations and all crimes examined except for Property
Index Crimes. Finally, for all crimes other than Property
Index Crime, crimes tended to be higher on weekends.
23
This is estimated using a 68% confidence interval.
24
Melanie Skemer, Cindy Redcross, and Howard Bloom
(2020). Pursuing Pretrial Justice Through an Alternative to
Bail: Findings from an Evaluation of New York City’s
Supervised Release Program. New York City: MDRC.
25
Chloe Anderson, Cindy Redcross, and Erin Valentine
(2019). Evaluation of Pretrial Justice System Reforms That
Use the Public Safety Assessment: Effects of New Jersey’s
Criminal Justice Reform. New York City: MDRC.
26
Oren M. Gur, Michael Hollander, and Pauline Alvarado
(2019). Prosecutor-Led Bail Reform: Year One. Philadelphia:
Philadelphia District Attorney’s Office.
27
The initial data set provided by ISLG included cases with
court event dates as early as September 29, 1960. To
ensure we captured only those cases initiated after 2013,
we deleted all cases that had a court event with an event
date earlier than January 1, 2013.
28
The court data included cases that originated in both
municipal court and felony court. Cases that originate in
municipal court are initially given a municipal court case
number; if such cases are subsequently transferred to
felony court, they are then given a new felony court case
number. In such cases, a central booking number is used to
link the cases across courts. For the current analyses, a
unique case number was created by ISLG for such cases and
was used in place of the municipal and felony court cases
numbers to track cases and court events.
29
The analyses track defendant/case combinations since
defendants could have multiple cases during the study
period. For example, a defendant may have multiple bond
court hearings on the same day for different cases. It also is
possible for the same defendant to appear multiple times in
the dataset if they have multiple cases initiated during the
study period.

Dollars and Sense in Cook County
28
30
See, Office of the Chief Judge Circuit Court of Cook
County (2019). Bail Reform in Cook County: An Examination
of General Order 18.8A and Bail in Felony Cases. Chicago:
Office of the Chief Judge Circuit Court of Cook County, at
page 3.
31
All defendants in the sample were tracked until their case
was disposed or for a full twelve months, whichever came
first, ensuring that all follow-up periods potentially covered
both summer and winter months.
32
This explains why defendants with, for example, No Bail
are released from jail.
33
Due to the availability of data, it was only possible to
examine new charges filed in Cook County. Thus, new
charges filed in other jurisdictions are not included.
34
This provided a broader definition of New Violent Criminal
Activity than defined in the OCJ’s report. While the OCJ
report included only Part I felony offenses, we included any
misdemeanor or felony Person offense, including simple
assault and domestic battery.
35
Weapons offenses include Unlawful Use of a Weapon,
Unlawful Use of a Weapon by a Felon, Aggravated Unlawful
Use of a Weapon, Unlawful Possession/Purchase of
Firearms and Firearms Ammunition,
Unlawful/Aggravated/Reckless Discharge of a Firearm,
Armed Habitual Offender, Gunrunning, Unlawful
Sale/Delivery of a Firearm, Armed Violence.
36
Total cases reported here are slightly lower than the total
samples due to missing values for some variables.
37
Total cases reported here are slightly lower than the total
samples due to missing values for some variables
38
Missing values for PSA scores for risk of New Criminal
Activity and risk of New Violent Criminal Activity were
omitted due to collinearity with missing values for PSA
scores for risk of FTA. Thus, only the coefficients for PSA
scores for risk of FTA are reported in this and all
subsequent logistic regression tables.

Dollars and Sense in Cook County
1
Acknowledgements
A special thank you to Branden DuPont at the Medical
College of Wisconsin for his assistance with the analyses of
Chicago crime rates. Thank you to Jennifer Ferone and
Reagan Daly at the Institute for State and Local Governance
at the City University of New York for their insights and
support. Finally, we would like to thank Laurie Garduque
and Maria Speiser of the MacArthur foundation for their
support throughout this project.
About the Center for Criminal Justice Research,
Policy, and Practice
The Center for Criminal Justice Research, Policy, and
Practice at Loyola University Chicago promotes fair,
informed, effective, and ethical criminal justice approaches
through collaborative interdisciplinary research, professional
development, and targeted projects.
For more information, visit https://www.luc.edu/ccj/
Center for Criminal Justice Research, Policy & Practice
Loyola University Chicago
25 East Pearson, Suite 1116 Chicago, Illinois 60611
For more information about this report, contact Don Stemen
at [email protected] or David Olson at [email protected]. For
more information about the Center for Criminal Justice
Research, Policy, and Practice, contact David Olson, Director.
Suggestion citation
Don Stemen and David Olson.
Dollars and Sense in Cook
County: Examining the Impact of General Order 18.8A on
Felony Bond Court Decisions, Pretrial Release, and Crime
.
Chicago: Loyola University Chicago, 2020.

Dollars and Sense in Cook County
2
This report was created with support from the
John D. and Catherine T. MacArthur Foundation as
part of the Safety and Justice Challenge, which
seeks to reduce over-incarceration by changing
the way America thinks about and uses jails.
www.SafetyAndJusticeChallenge.org
