Course Recommendation for University Environments
Boxuan MA
Kyushu University
ma.boxuan.61[email protected]ushu-
u.ac.jp
Yuta Taniguchi
Kyushu University
taniguchi@ait.kyushu-u.ac.jp
Shin’ichi Konomi
Kyushu University
konomi@acm.org
ABSTRACT
Recommending courses to students is a fundamental and also
challenging issue in the traditional university environment. Not
exactly like course recommendation in MOOCs, the selection and
recommendation for higher education is a non-trivial task as it
depends on many factors that students need to consider. Although
many studies on this topic have been proposed, most of them only
focus either on historical course enrollment data or on models of
predicting course outcomes to give recommendation results,
regardless of multiple reasons behind course selection behavior. To
address such a challenge, we first conduct a survey to show the
underlying characteristic of the course selection of university
students. According to the survey results, we propose a hybrid
course recommendation framework based on multiple features. Our
experimental result illustrates that our method outperforms other
approaches. Also, our framework is easier to interpret, scrutinize,
and explain than conventional black-box methods for course
recommendation.
Keywords
Educational Data Mining; Recommender Systems; University
Environments
1. INTRODUCTION
Course selection in university is a crucial and challenging problem
that students have to face. It is difficult to decide which courses
they should take because there are a large number of courses
opened each semester and students have to spend a lot of time
exploring those courses. Moreover, the decisions they make shape
their future in ways they may not be able to conceive in advance.
We collected a dataset during 2015 and 2018 from our university to
gain a better understanding of the elective course enrollment
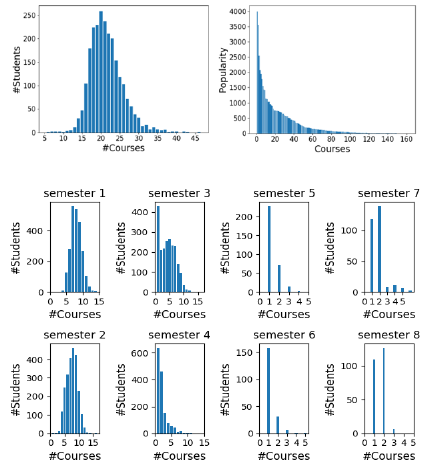
patterns. Figure 1(a) presents the distribution of the enrolled course
number of students on the left and the distribution of the popularity
for each course of our university on the right. There are hundreds
of elective courses offered by the university while averagely
students only select a few of them to satisfy the requirements for
their degree program. Figure 1(b) shows the distribution of the
enrolled courses for each semester. We can also see that students
may take courses in the first two years mostly
(semester1~semester4), because they may potentially be busy with
an internship or finding jobs in the third and fourth year.
(a) #Course distribution.
(b) #Course distribution for each semester.
Figure 1. Distribution of courses.
From the discussion above, a safe conclusion could be drawn that
due to a large number of available but unfamiliar courses, course
selection is a critical activity for students.
With the increasing amount of available data about undergraduate
students and their enrollment information, data-driven methods
supporting decision making have gained importance to empower
student choices and scale advice to large cohorts [14]. Many
relevant studies on course recommendation focus on online
learning platforms such as MOOCs. Other studies on course
recommendation use datasets collected in physical university
environments, however, they rely on approaches that are similar to
the ones used in recommending MOOC courses without fully
considering the different reasons involved in course selection
process in physically-based university environments.
In fact, course recommendation for higher education can be more
“messy and unorganized” [1] as it depends on many factors that
students need to concern. Intuitively, the reasons behind course
selection are manifold. Likewise, students who enrolled in the same
course may have completely different orientations based on their
own reasons, which serves as different criteria for course selection
[34]. It inspires us to try to find more useful features for the
recommendation.
To make the point clear, a survey is conducted on 81 students in
our university to better understand student perceptions and attitudes
for their course selection process. [10] Figure 2 shows the main
underlying reasons for their course selection.
Boxuan Ma, Yuta Taniguchi and Shinichi Konomi "Course
Recommendation for University Environment" In: Proceedings of
The 13th International Conference on Educational Data Mining
(EDM 2020), Anna N. Rafferty, Jacob Whitehill, Violetta
Cavalli-Sforza, and Cristobal Romero (eds.) 2020, pp. 460 - 466
Proceedings of The 13th International Conference on Educational Data Mining (EDM 2020) 460
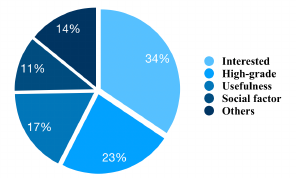
Figure 2. The distribution of main reasons for course selection.
(1) Interest
As Figure 2 shows, the overall most important factor was students’
interest and it is often taken as a main contributing factor to the
recommendation. However, students may not choose courses based
purely on their interest in the university environment. It is expected
that students will be more inclined to choose courses that do not
require too much effort or difficulty. For example, some students
would not enroll in a course which contains contents they are
interested in, they just choose the course that allows them to get
credits easily.
(2) High-Grade
Improperly selecting courses would seriously affect the students’
course achievements, which enforces students to drop out [12].
Getting relatively high grades for students is another factor
influences student’s choice especially for successful students.
Some students even prefer to choose what they perceived would be
an easier course for fear that a tougher course might lower their
GPA.
(3) Learning goal and career plan
It is natural to recommend courses that align with student’s learning
goals and career plans as students consider the usefulness of
courses as an important factor in their course selection process.
However, first-year students may lack learning goals and career
planning for the future, and the choice of courses is aimless. Also,
student interest and goal can change as they explore and discover
something meaningful on and off campus.
(4) Social Aspect
Social factor also plays a part in the course selection process. For
example, some students prefer to enroll in a course with their
friends or classmates together. Potts et.al [21] conclude that the risk
of social isolation is a problem in the learning process especially
for first-year students at university, who have difficulty navigating
their new academic and environment. Tinto [22] concludes that
participation in a collaborative learning group encourages student’s
attendance and class participation. Therefore, the classmates or
friends based social links could be important information in course
recommendation.
(5) Popularity
As shown in Figure 1(a), the long-tail distribution of course
popularity indicates that students are more motivated to choose
popular courses as their first choice. However, the popular courses
will be filled up quickly while others will not be selected by
students frequently.
In summary, all these discussions above indicate that there are
complex constraints and contexts that have to be considered
together to balance all those factors above, made more difficult by
the multiple objectives that students want to maximize and risks
they want to hedge against. For example, choosing challenging
courses of value while maintaining a high GPA [16]. This suggests
that recommendations that are aimed only at one or a few factors
are likely not enough to help the students.
To address these challenges which have not been well explored in
the research community, we propose our hybrid course
recommendation framework, which incorporates different criteria
in a modular way. Moreover, in our approach selection criteria can
further be prioritized by the student. We believe that weaving those
criteria could increase the usability of our recommendations
compared to previous work focusing only on one of the two. Also,
our framework is very efficient and easy to interpret.
2. RELATED WORK
2.1 Course selection
Some work has been done on analyzing the college students’ course
selection. Morsy and Karypis [23] investigated how the student’s
academic level when they take different courses, relate to their
graduation GPA and time to degree. This study suggests that
course recommendation approaches could use this information to
better assist students towards academic success, by graduating on-
time with high GPA. Also, understanding students’ reasons for
enrolling in a course provides key information for recommending
courses and improving students’ learning experiences [24-27].
Additionally, there is still a lack of study on the factors that
influence students’ course selection in university and how the
course selection would impact the students’ educational
achievement.
2.2 Personalized Course Recommendation
Various approaches have been used in applications for course
recommendation by learning from historical enrollment data [32,
33].
Content-based filtering approaches recommend a course to a
student by considering the content of the course and clustering
course and student into groups to gain similarity between them [2,3].
Collaborative filtering approaches recommend a course to a student
by investigating student's similarity with the student's historical
data in a system and predict the course that the student would be
interested in [4-6]. Association rules based on frequent patterns are
used to discover interesting relations that describe previous course
selections from students [8,9]. Recently, other methods including
sequence discovery and representation learning have been used in
this domain [11,19,20]. However, those systems often behave like
a “black box", i.e., recommendations are presented to the users, but
the rationale for selecting recommendations is often not explained
to end-users.
2.3 Grade Prediction
While some researchers have focused on between-course
enrollment data, others have focused on models of predicting
grades in future courses [13-6]. Based on what courses they
previously took and how well they performed in them, the predicted
grades give an estimation of how well students are prepared for
future courses, then recommending courses to students that will
help them to get relatively high grades [18,28,29,31].
However, these methods can be prone to recommending relatively
easier courses in which students usually get high grades [17]. In
addition, there are some students who like challenge difficult
courses if they are interested in or think it is helpful for their future
career, for those students, the grade prediction based
recommendations are not enough.
461 Proceedings of The 13th International Conference on Educational Data Mining (EDM 2020)
Despite the significant success of various course recommendations,
constraints on the number of student preferences in the university
environment resulting in inflexibility where a student’s
requirements do not align perfectly with those built into the system.
In contrast to the aforementioned approaches, our model combines
the concerns of performance and interest together. Also, it has the
benefit of allowing for a custom weighting of those components, as
well as the increased explanatory value of the model itself.
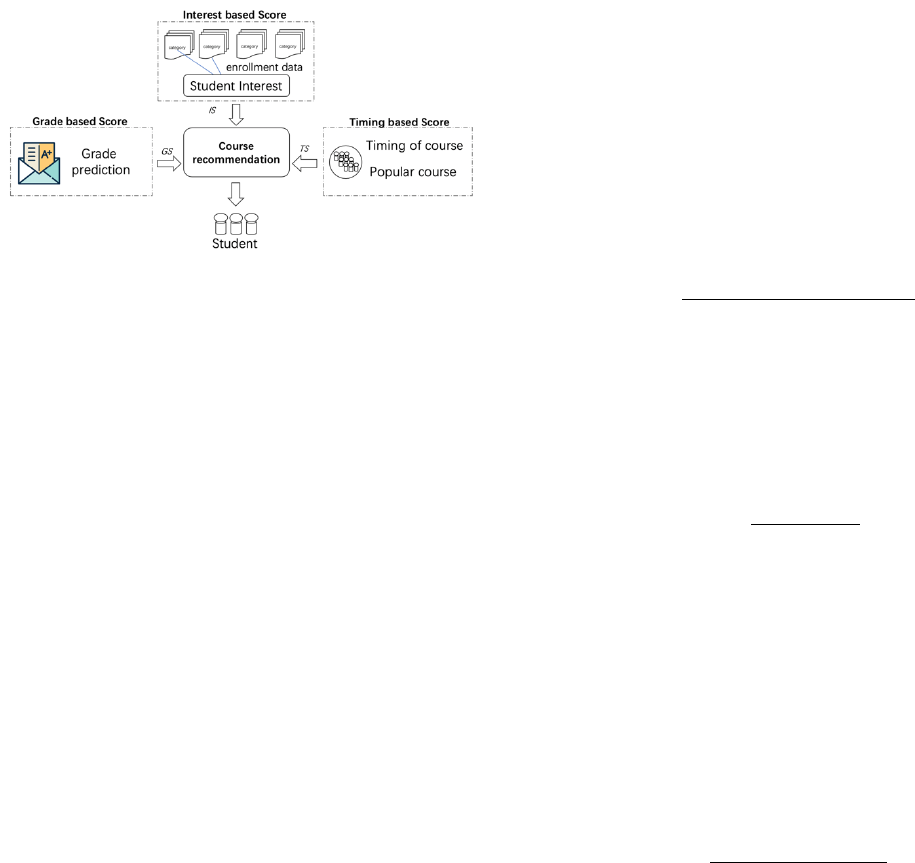
3. PROPOSED METHOD
We first give the definition of our recommendation problem in
Section 3.1. Then we propose our hybrid course recommendation
framework with three subsections introducing our Interest-based
Score, Timing-based Score, and Grade-based Score in detail.
Finally, those different scores are used in our course
recommendation algorithm introduced in Section 3.3.
Figure 3. Overview of the proposed course recommendation.
3.1 Problem Formulation
Like every classic recommendation task, there are two basic
elements user and item in our course recommendation task, where
a user represents a student and an item represents a course. We use
!
to denote a set of students and
"
to denote a set of courses. Each
# $!
has enrolled some courses denoted by
"
%
& "
and each
'( $
"
has its enrollment set denoted by
!
)
& !
. Let
*
denote a set of all
available semesters, and
+
to denote a specific semester. Generally,
there are 8 semesters for 4 academic years degree program. Let
,
denote a set of grades that student could get, and each
- $ ,
denote
a specific grade that student obtained for a course. Let
. /
0
1
#2(2- 2+
3
4#$!2( $ "
%
2- $ ,2+ $ *5
be the set of all enrollment
relations, which means student
#
enrolled in course
(
in semester
+
,
and got the final grade
-
.
Given enough students enrollment data
1!2"2.3
, our goal is
recommending courses to a specific student
#
which are not in
"
%
for next semester.
3.2 Framework
According to the result of the survey shown in Section 1, students
may concern different factors while they choose courses. Inspired
by that, we propose our hybrid course recommendation framework
that considers student interest, the timing of taking the course and
the predicted grade of the student together. Figure 3 shows the
overview of the proposed course recommendation.
For each pair of student and course
1#2(3
, we need to understand
how suitable the course is for the specific student. We use three
different aspects to calculate the
!(6781#2(3
for each pair of
student and course:
(i)
9:+878#+';<#8='!(678'19!3
, which is to measure how
interesting the course is for a specific student. (ii)
*>?>:-';<#8='!(678'1*!3
, which is to measure how suitable
students enroll in the course at a specific time (semester) since
different courses may have different suitable time periods. (iii)
,7<=8';<#8='!(678'1,!3
, which is to predict students’
performance for the course.
We propose our approaches to estimate
9!
,
'*!
and
,!
,
respectively. Then, they are fused by a student-specific weight
parameter as the
!(6781#2(2+3
. Once all of the
!(6781#2(2+3
have
been computed, the
@
courses with the highest score are selected.
3.2.1 Interest-based Score
Let
#
and
(
be a student and a course, respectively, the goal of
interest score estimation is to calculate
9!1#2(3
.
In our framework, we extract user interest from student historical
enrollment behaviors. Since each course of university belongs to a
category, let
"A*.
denote the set of all categories,
(<+8
to denote
a specific category, then
"A*. /0(<+8
B
2(<+8
C
2D2(<+8
4
EFGH
4
5
.
We think that there is a strong relationship between student interest
and course categories. For instance, a student frequently enrolls in
courses which belong to “Computer Science” may imply that the
student has an interest in this category or he may have personal
learning goal in this domain. Hence, it is appropriate to recommend
the student the courses such as “Python Programming” and “Data
science”.
For a student
#
, the idea is to count the number of courses that he
enrolled in and belongs to a category, i.e.,
IJ?1#2(<+83
. Then, all
of the values are normalized as the preference score from 0 to 1,
denoted as
K1#2(<+83
, which is defined as equation (1).
K
1
#2(<+8
3
/
IJ?
1
#2(<+8
3
L<M
)NOPQ$EFGH
R
IJ?
1
#2(<+8S
3
T
''''''''''''''''1U3
For a student
#
, the preference vector
V
W
, is obtained by the
preference score of each category, which is defined as equation (2).
V
W
/ 1K
1
#2(<+8
B
3
2K
1
#2(<+8
C
3
2D2K
R
#2(<+8
4
EFGH
4
T
3''''1X3
We can further use
V
W
to calculate the similarity between student
#
and other students. Let
#
Y
and
#
Z
be two students, the similarity
between
#
Y
and
#
Z
can be measured by the cosine similarity
measurement as shown below.
#>?
R
#
Y
'2#
Z
T
/
[
%
\
G
][
%
^
_
[
%
\
_
`
a
[
%
^
a
''''''''''''''''''''''''''''''1b3
For the convenience of computation, we use a matrix form
representation
c' /1[
Q
%
d
e'[
Q
%
f
'e'ggge'[
Q
%
4
h
4
3
to denote the interest
of all students where
[S
%
/'[
%
i
j
[
%
j
means the normalization of
[
%
. Then the similarity matrix
!>?
can be simply written as:
!>?' /'c
G
'`'c'''''''''''''''''''''''''''''''''''''''''1k3'
where
!>?
Y2Z
is the result of
#>?
R
#
Y
'2#
Z
T.
Based on the similarity, we could estimate the user-based interest
score. For a student
#
and a course
(
, the Interest Score denoted as
9!1#2(3
, is defined as (5), where
!
%2l
indicates the set of top-k
similar students of
#
as neighbors, and
9
E
mn
is an indicator function
whose value is 1 when
(' $'"#S
.
9!
1
#'2(
3
/
o
9
E
mn
`#>?
1
#'2#S
3
%Q$p
m2q
o
#>?
1
#'2#S
3
%Q$p
m2q
'''''''''''''''''''''''1r3
Furthermore, we try to utilize students’ major information together
with their similarity as equation (6).
#>?
s
1
#'2#S
3
/t#>?
1
#'2#
Q
3
u
1
Uvt
3
#<?8?<w67
1
#'2#
Q
3
''''' 1x3
Proceedings of The 13th International Conference on Educational Data Mining (EDM 2020) 462

Where
#<?8?<w67
1
#'2#
Q
3
function equal to 1 if student
#
and
student
#
Q
have the same major, otherwise, the function equal to 0.
t
(limited from 0 to 1) is used to control the weight between
similarity and major information. The underlying rationale is that
each major has its owner preference on courses enrolling, students
have the same major will generally make a similar choice in course
selection. Also, students in the same major are more likely to be
friends or classmates, which brings potential social link
information into the course recommendation. Then equation (5) can
be rewritten as below.
9!
1
#'2(
3
/
o
9
E
mn
`#>?
s
1
#'2#S
3
%Q$p
m2q
o
#>?
s
1
#'2#S
3
%Q$p
m2q
'''''''''''''''''''''''1y3
3.2.2 Timing and popularity based Score
Different courses may have different suitable time periods
(semesters). For example, in each department, courses can be taken
by students of different grades, e.g., freshman or sophomore.
Previous studies showed that the timing of courses has a strong
correlation with student graduation GPA and time to degree [23].
Based on that, we assume that the timing of courses is also
important for course selection. The suitable timing of courses will
help students for good grades and successful graduation in a timely
manner.
For each course
(
, we define the
*>?>:-';<#8='!(678#'1*!3
,
denoted as
*!1(2+3
, where
+
indicates a specific semester. In our
framework,
*!
is considered from two aspects:
(1) Which semester is more suitable for taking this course? For a
specific course, we sum up the number of enrollments for every
semester and normalize all of the values. The result is denoted as
*
O
1
(2+
3
.
*
O
1
(2+
3
/
IJ?
1
(2+
3
L<M
O
n
$G
R
IJ?
1
(2+
Q
3
T
''''''''''''''''''''''
1
z
3
''
where
IJ?
1
(2+
3
represents the number of enrollments of course
(
in semester
+
, and
*
indicates the set of all time periods, i.e., 8
semesters for 4 academic years degree program.
(2) Which courses are popular now? For a specific semester, we
sum up the number of enrollments for every course and normalize
all of the values. The result is denoted as
*
{
1
(2+
3
.
*
{
1
(2+
3
/
IJ?
1
(2+
3
L<M
)Q$E
R
IJ?
1
(S2+
3
T
'''''''''''''''''''''''1|3
where
"
indicates the set of all courses.
*
O
1
(2+
3
and
*
{
1
(2+
3
are
then fused by the harmonic mean since we want both of the two
values are relatively high. The final
'*>?>:-';<#8='!(6782
*!1(2+3
can be defined as:
*!
1
(2+
3
/ X`
*
O
1
(2+
3
`'*
{
1
(2+
3
*
O
1
(2+
3
u*
{
1
(2+
3
'''''''''''''''''''1U}3
Therefore, we can use
*!
1
(2+
3
to ensure that the semester
+
is
suitable for taking the course
(
and the course
(
is suitable for
taking in the semester
+
.
3.2.3 Grade-based Score
Improperly selecting courses would seriously affect the students’
course achievements, which may decrease their GPA even enforce
students to drop out. Accurately predicting students’ grades in
future courses has attracted much attention as it can help identify
at-risk students early [30].
We use the grade prediction method called cross-user-domain
collaborative filtering proposed by Ling et al. [12]. For predicting
the score of each course
'('$'"
for each student
#' $!'
, a small set
of senior students who have already enrolled on course
(
and have
the most similar previous score distribution to student
#
will be
discovered by means of Pearson correlation coefficient. The
underlying rationale is that students with similar scores in the
previous courses will generally obtain similar scores in the
subsequent courses.
Let
!
%
denote the set of senior students who have already enrolled
on course
(
. For any senior student
#
%
'$'!
%
, the following Pearson
correlation coefficient is used to measure the course score
similarity between student
#
and the senior student
#
%
.
#>?
1
#'2#
%
3
/
o 1
-
%Y
v-
~
%Y
3
Y$E
mm
m
R
-
%
m
Y
v-
~
%
m
Y
T
•
o 1
-
%Y
v-
~
%Y
3
C
Y$E
€€
m
•
o
R
-
%
m
Y
v-
~
%
m
Y
T
C
Y$E
mm
m
(11)
where
"
%%
m
denotes the courses that are enrolled by both students
#
and
#
%
,
-
%Y
and
-
%
m
Y
denote the grade of course
>
by students
#
and
#
%
respectively.
-
~
%Y
and
-
~
%
m
Y
denote the average grade of courses
enrolled by students
#
and
#
%
, respectively. Accordingly, the grade
of the course
(
by student
#'
can be predicted as follows.
-
%)
/
o
1-
%
m
)
3`#>?
1
#'2#
%
3
%
m
$p
m2q
o
#>?
1
#'2#
%
3
%
m
$p
m2q
'''''''''''''''''''1UX3
where
!
%2l
indicates the set of top-k similar senior students of
#
. It
should be noticed that students often achieve inconsistent grades in
the various courses they take, and different students may have
varying grades deviations, i.e. the grades deviation compared with
the average grades among all students. Similarly, different courses
may have varying grades deviations, i.e. the score deviation
compared with the average score among all courses. In order to deal
with those variations. We use the grade deviation of student
#
and
the grade deviation of course
(
to predict student grades.
Accordingly, equation (12) could be rewritten as below.
-
%)
/;
%)
u
o
1-
%
m
)
v;
%
m
)
3`#>?
1
#'2#
%
3
%
m
$p
m2q
o
#>?
1
#'2#
%
3
%
m
$p
m2q
''''''1Ub3
where
;
%)
'/'•u;
%
'u;
)
denotes the baseline estimate for
-
%)
with
•
being the overall mean grade of all courses enrolled by all
students,
;
%
'/'-
~
%
'v'•
being the grade deviation of student
#
and
;
)
'/'-
~
)
'v'•
being the grade deviation of course
(
, where
-
~
%
is
the overall mean grade of student
#
and
-
~
)
is the overall mean
grade of course
(
.
Finally, we could use the grades that students are expected to obtain
in future courses to boost the performance of our recommendation.
The final
',7<=8';<#8='!(678#2
,!1 #2(3
can be defined as
normalized values of grades.
,!
1
#2(
3
/
-
%)
L<M
)
n
$E
1
-
%)Q
3
''''''''''''''''''''''''''1Uk3
The total score of student and course pair
'#(678'1#2(3'
can be
written as:
!(678 /‚`9!
1
#2(
3
uƒ`*!
1
#2+
3
u„`,!
1
#2(
3
'''''''1Ur3
Where
‚
,
'ƒ
,
„
are parameters to control the proportion of weights
from different sources. By taking those scores into account
simultaneously, a course that the student interested in, and suitable
for him to take to get a high grade could be ranked higher than other
courses. Also, student could control the weighting of those
components to have a better understanding of the data and decision-
making.
463 Proceedings of The 13th International Conference on Educational Data Mining (EDM 2020)

3.3 Course Recommendation Algorithm
The whole framework can be written as Algorithm 1. Student set
!
,
course set
"
, enrollment set
.1#2(2-2+3
are input and output is a
list of recommendations
…#
for student’s next semester that
includes up to
@
recommendations per student.
Algorithm 1: Generating a list of course recommendations for
student
Input :
Student set !, course set ", enrollment set .1#2(2-2+3;
Output :
Recommendation results for each student …#.
1
Calculate student interest'†
W
for each #' $'! by equation 1;
2
Calculate student interest similarity by equation 4;
3
Calculate student grade similarity by equation 11;
4
Calculate student deviation of each student;
5
Calculate course grade deviation of each course;
6
foreach #' $'! do
7
Calculate user interest-based score'9!1#2(3 by equation 7;
8
Calculate timing-based score'*!1(2+3 by equation. 10;
9
Calculate user grade-based score',!1#2(3 by equation 13
and equation 14;
10
Calculate final score '!(6 78'1#2(2+3 by equation 15;
11
Let …# be the sorted list of " ordered by its !(678'1#2(2+3 in
descending order.
12
endfor
4. EVALUATION
In this section, we conducted a series of experiments to evaluate the
effectiveness of our proposed method. We first describe the dataset
and experimental settings. Next, the evaluation methodology and
metrics are introduced in detail. Finally, the results are shown in
Section 4.4.
4.1 Dataset
This work focuses on undergraduate students in a traditional
educational institution. We used a dataset from our university that
spans for 5 years. The dataset consisted of per-semester course
enrollment information of 2,366 students from 12 departments,
with a total of 38,968 pseudonymized enrollment records from
2014 through 2018. Each row of the course enrollment data
contained semester and department information, an anonymous
student ID and course information included course name, instructor
and course category.
4.2 Experiment Settings
4.2.1 Data selection
The most natural approach to evaluate the model is to split the data
by semesters. As shown in Figure 1(b), most of the undergraduate
students may take courses in the first two years. Therefore, for
students who enrolled in 2015, the semester of Spring 2015 was
used for training, the subsequent semesters of Fall 2015, Spring
2016 and Fall 2016 are regarded as the testing semesters, each of
which is tested separately. The results are evaluated by comparing
the predicted courses and the ground-truth courses he/she has
enrolled in.
4.2.2 Comparison
We name our methods as Hybrid Course Recommendation (HCR).
We compare our method with two group popularity approaches [14]
and Random recommendation (Random). The two group popularity
approaches including the department level (Grp-Pop-1), which
recommend the most popular courses in the major, and the
academic level (Grp-Pop-2), which recommend the most popular
courses on the major and the academic level of the student
(“freshmen”, “sophomores”, “juniors”, and “seniors”).
4.3 Evaluation Metrics
Like previous work [11,14,15,20], we used Recall@ns and
Coverage as the evaluation metric for the performance.
Coverage is measured based on the percentage of courses that have
been recommended at least once to students, which describes the
ability of a recommendation system to explore the long-tail item.
Recall@ns is the percentage of actually enrolled courses of
#
in
semester
+
that were contained in the recommendation list, where
ns is the number of courses that the student took in the target
semester. The reported metrics are averaged out across all students.
Since our proposed course recommendation method considers both
student interest and the grade he/she may obtain, we cannot only
use the Recall metric, and instead, we use a variation of it. For the
list of the courses
…
%
that recommended to a student
#
, Let
*
%
is the
set of courses in the test set of
#
,
A
%
is the set of courses which
student is expected to get the grade equal to or higher than his/her
average previous grade. We use the ratio of
4…
%
‡*
%
‡A
%
4
and
4*
%
‡A
%
4
to measures the fraction of the actual well performed
courses that are retrieved.
4.4 Results
4.4.1 Interest-based Score
In collaborative filtering strategy, taking how many similar
students as neighbors is an important problem which is sensitive to
the quality of the result. We investigate the performance of our
interest model with different neighbor numbers. As shown in
Figure 4, the performance of the model increases with the increase
of neighbor number at first then decreases. According to the
observation above, we pick a practical value 40 as the value of the
neighbor number parameter in our follow-up experiments.
We also investigate the performance of our interest model with
different weights between similarity and major information. As
shown in Figure 5, we can observe that the performance of the
model increases with the decrease of
t
in terms of Recall. The
reason is that the model considers not only the similarity but also
the major information. That is, each major has its own preference
for courses enrolling, major information will improve the
performance of the algorithm.
However, 100% recall could be bad because the system just
recommends what students do anyway. We noticed that the
Coverage also decreases with the decrease of
t
. The model seems
benefit from the major information while scarifying the diversity of
results. Recommendations for courses at other departments
sometimes are useful to mine more long-tail student interest while
students usually ignored that these courses existed or that their
content matched their interests. To achieve the best performance
of recommendation, we need to make a trade-off. According to the
observation above, we set
't
as 0.2 in our follow-up experiments.
Proceedings of The 13th International Conference on Educational Data Mining (EDM 2020) 464
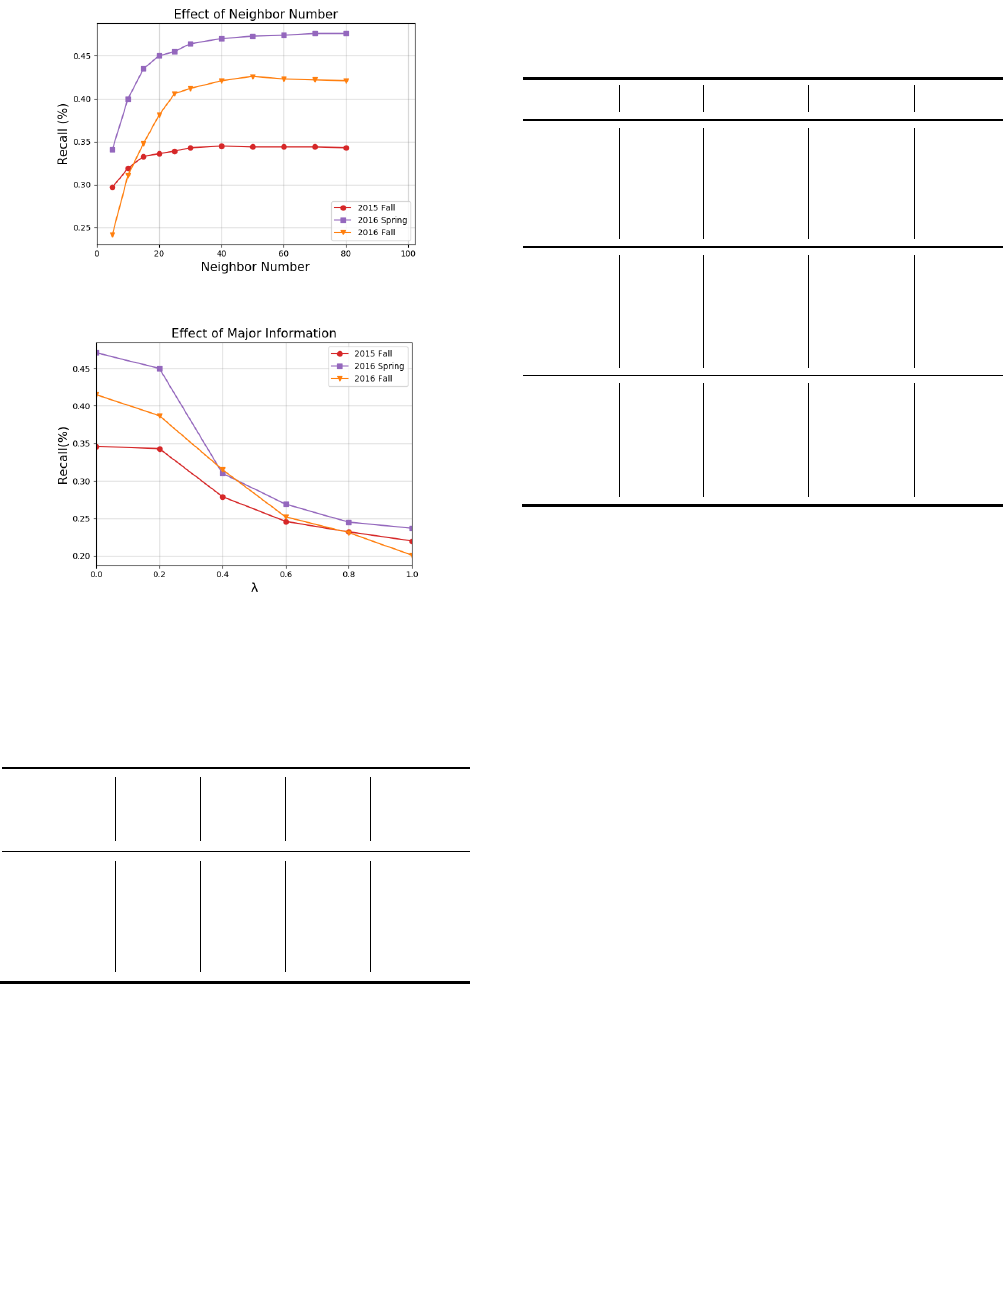
Figure 4. Performance of different neighbor numbers.
Figure 5. Evaluation of major information.
4.4.2 Influence of different factors
To illustrate the influence of different factors, we set each
parameter
‚2ƒ2„
from 0 to 1 with a step size 0.05 to find the
optimal combination.
Table 2. Performance of different parameters
Model
1‚2ƒ2„3=
(1,0,0)
1‚2ƒ2„3
= (0,1,0)
1‚2ƒ2„3
= (0,0,1)
1‚2ƒ2„3*
Recall@ns
0.380
0.412
0.341
0.434
Recall(a)@ns
0.311
0.315
0.332
0.322
Coverage
0.534
0.212
0.356
0.516
As shown in Table 2, the interest score and timing score has a good
explanatory value for the recommendation than others. Also, the
suitable timing of taking a course will help students to get a good
grade. A recommendation only based on the grade has a good
performance for recommending high grade courses. However, the
results cannot help all the students. We reached the best Recall@ns
with (
‚
=0.4,
ƒ
=0.45 and
„
=0.15)*.
The results indicate that recommendations that are aimed only at
one factor are likely not to be satisfied by every student. As we
discussed before, different students may have completely different
orientations based on their own reasons, which serves as different
criteria such as their preferences, interests, needs, performance,
etc. Such a hybrid system could provide explanations and user
controls for different categories of target students to support the
interpretation of the data and decision-making.
Table 3. Evaluation of course recommendation
Semester
Model
Recall@ns
Recall(a)@ns
Coverage
Fall 2015
Random
0.048
0.036
-
Fall 2015
Grp-Pop-1
0.374
0.306
0.272
Fall 2015
Grp-Pop-2
0.452
0.342
0.342
Fall 2015
HCR
0.472
0.393
0.578
Spring 2016
Random
0.025
0.020
-
Spring 2016
Grp-Pop-1
0.325
0.201
0.305
Spring 2016
Grp-Pop-2
0.423
0.372
0.237
Spring 2016
HCR
0.431
0.402
0.342
Fall 2016
Random
0.002
0.002
-
Fall 2016
Grp-Pop-1
0.326
0.243
0.213
Fall 2016
Grp-Pop-2
0.441
0.387
0.250
Fall 2016
HCR
0.463
0.392
0.559
4.4.3 Comparison result
We analyze the performance of different algorithms. The results in
Table 3 show that our framework performs well when compared
with other methods.
As the results show, both of the Recall and Recall(a) of Random
recommendation strategies are very low since there are a large
number of courses, but each student only averagely chooses a few
courses per semester. Hence, it is difficult to recommend the right
course. Popularity approaches are having considerably satisfactory
performance in Recall since popular courses which are taken by
students frequently usually attract most of students. However, Grp-
Pop-1 and Grp-Pop-2 do not consider student preference, it is also
difficult to mine more long-tail student interest as the Coverage is
low. In addition, Grp-Pop-1 and Grp-Pop-2 are not good in Recall(a)
since they only consider the popular courses, ignore the
performance the student is expected to get in the recommended
courses.
5. CONCLUSION
This research aims to recommend suitable courses for learners and
study how to design a personalized course recommendation in the
university environments. In this paper, we propose a hybrid course
recommendation framework that considers student interest, the
timing and popularity of courses, and predicted performance of
students, simultaneously. Experiments are conducted to confirm
the effectiveness of the proposed approach. The results show that
the proposed hybrid course recommendation approach performed
well compared to other methods. Also, the model itself is flexible
in the sense that one can easily adjust or extend it by changing the
recommendation formula and incorporate more information.
6. REFERENCES
[1] E. Babad and A. Tayeb. 2003. Experimental analysis of students’
course selection. British Journal of Educational Psychology,
73(3):373–393.
[2] Piao G, Breslin JG. 2016. Analyzing MOOC Entries of
Professionals on LinkedIn for User Modeling and Personalized
465 Proceedings of The 13th International Conference on Educational Data Mining (EDM 2020)

MOOC Recommendations. In Proceedings of the 2016 Conference
on User Modeling Adaptation and Personalization. ACM, 291–
292.
[3] Apaza RG, Cervantes EV, Quispe LC, Luna JO. 2014. Online
Courses Recommendation based on LDA. In SIMBig. 42–48.
[4] BYDŽOVSKÁ, Hana. 2016. Course Enrollment Recommender
System. Proceedings of the 9th International Conference on
Educational Data Mining. Raleigh, NC, USA: International
Educational Data Mining Society. 312-317.
[5] Khorasani ES, Zhenge Z, Champaign J. 2016. A Markov Chain
Collaborative Filtering Model for Course Enrollment
Recommendations: 2016 IEEE International Conference on Big
Data (Big Data). 3484 – 3490.
[6] Jing, X., Tang,J. 2017. Guess you like: course recommendation in
Moocs. In: Proceedings of the International Conference on Web
Intelligence, ACM, 783–789.
[7] Bhumichitr K, Channarukul S, Saejiem N, Jiamthapthaksin R,
Nongpong K. 2017. Recommender Systems for university elective
course recommendation. 14th International Joint Conference on
Computer Science and Software Engineering (JCSSE) (2017): 1-5.
[8] Aher SB, Lobo LM. 2013. Combination of machine learning
algorithms for recommendation of courses in E-Learning system
based on historical data. Knowledge-Based Systems (2013), 1–14.
[9] Bendakir N, Aïmeur E. 2006. Using association rules for course
recommendation. Proceedings of the AAAI Workshop on
Educational Data Mining. Vo l. 3 .
[10] Ma, B.X., Lu, M., Taniguchi, Y. and Konomi, S. 2020. Exploring
the Design Space for Explainable Course Recommendation
Systems in University Environments. In Companion Proceedings
of the 10th International Conference on Learning Analytics &
Knowledge.
[11] Polyzou A, Nikolakopoulos AN, Karypis G. 2019. Scholars Wa lk :
A Markov Chain Framework for Course Recommendation.
International Educational Data Mining Society. (2019 Jul).
[12] Huang L, Wang CD, Chao HY, Lai JH, Philip SY. A score
prediction approach for optional course recommendation via cross-
user-domain collaborative filtering. IEEE Access. (2019 Feb
7);7:19550-63.
[13] Sweeney, M., Lester, J., Rangwala, H., and Johri, A. 2016. Next-
term student performance prediction: A recommender systems
approach. Journal of Educational Data Mining 8, 1, 22–51.
[14] Elbadrawy, A. and Karypis, G. 2016. Domain-aware grade
prediction and top-n course recommendation. In Proceedings of the
10th ACM Conference on Recommender Systems. ACM, 183–190.
[15] Morsy, S. and Karypis, G. 2017. Cumulative knowledge-based
regression models for next- term grade prediction. In Proceedings
of the 2017 SIAM International Conference on Data Mining.
SIAM, 552–560.
[16] Jiang W, Pardos ZA and Wei Q. 2019. Goal-based course
recommendation. In Proceedings of the 9th International
Conference on Learning Analytics & Knowledge. ACM, 36–45.
[17] Morsy S, Karypis G. 2019. Will this Course Increase or Decrease
Your GPA? Towards Grade-aware Course Recommendation[J].
arXiv preprint arXiv:1904.11798.
[18] Okubo F, Yamashita T, Shimada A, Ogata H. 2017. A neural
network approach for students’ performance prediction. In
Proceedings of the Seventh International Learning Analytics &
Knowledge Conference (2017 Mar 13). 598-599.
[19] Pardos ZA, Jiang W. 2019. Combating the Filter Bubble:
Designing for Serendipity in a University Course Recommendation
System. arXiv preprint arXiv:1907.01591 .2019.
[20] Pardos ZA, Fan Z, Jiang W. 2019. Connectionist recommendation
in the wild: on the utility and scrutability of neural networks for
personalized course guidance. User Modeling and User-Adapted
Interaction. (2019 Apr 1). 487-525.
[21] Potts BA, Khosravi H, Reidsema C, Bakharia A, Belonogoff M,
Fleming M. 2018. Reciprocal peer recommendation for learning
purposes. In Proceedings of the 8th International Conference on
Learning Analytics and Knowledge (2018 Mar 7). 226-235.
[22] Tinto V. 1997. Classrooms as communities: Exploring the
educational character of student persistence. The Journal of higher
education. (1997 Nov 1).68(6):599-623.
[23] Morsy, S. and Karypis, G. 2019. A study on curriculum planning
and its relationship with graduation gpa and time to degree. In
Proceedings of the 9th International Conference on Learning
Analytics & Knowledge. ACM, 26–35.
[24] Kinnunen P, Malmi L. 2006. Why students drop out CS1 course?
In Proceedings of the second international workshop on
Computing education research (2006 Sep 9). 97-108.
[25] Crues R, Bosch N, Anderson CJ, Perry M, Bhat S, Shaik N. 2018.
Who They Are and What They Want: Understanding the Reasons
for MOOC Enrollment. International Educational Data Mining
Society. (2018 Jul 16).
[26] Kardan, H. Sadeghi, S. S. Ghidary, and M. R. F. Sani. 2013.
Prediction of student course selection in online higher education
institutes using neural network. Computers & Education. vol. 65.
1–11.
[27] Feng W, Tang J, Liu T X. 2019. Understanding dropouts in
MOOCs. Proceedings of the AAAI Conference on Artificial
Intelligence. 2019. 33: 517-524.
[28] Elbadrawy, A., Studham, R. S., and Karypis, G. 2015.
Collaborative multi-regression models for predicting students’
performance in course activities. In Proceedings of the 5th
International Learning Analytics and Knowledge Conference.
[29]Hu, Q. and Rangwala, H. 2018. Course-specific markovian models
for grade prediction. In Pacific-Asia Conference on Knowledge
Discovery and Data Mining. Springer, 29–41.
[30] Hu, Qian and Huzefa Rangwala. 2019. Reliable Deep Grade
Prediction with Uncertainty Estimation. In Proceedings of the 9th
International Conference on Learning Analytics & Knowledge.
ACM,76–85.
[31] Backenköhler M, Scherzinger F, Singla A, Wolf V. 2018. Data-
Driven Approach towards a Personalized Curriculum.
International Educational Data Mining Society.
[32] Morsomme R, Alferez SV. 2019. Content-based course
recommender system for liberal arts education. In Proceedings of
the 12th International Conference on Educational Data Mining
2019. Vol . 7 4 8 , p . 7 5 3 .
[33] Bydžovská H. 2016. Course Enrollment Recommender System.
International Educational Data Mining Society.
[34] Esteban A, Zafra A, Romero C. 2018. A Hybrid Multi-Criteria
Approach Using a Genetic Algorithm for Recommending Courses
to University Students. International Educational Data Mining
Society. (2018 Jul).
Proceedings of The 13th International Conference on Educational Data Mining (EDM 2020) 466
