
PUBLIC
SAP Data Services
Document Version: 4.3 (14.3.00.00)–2024-03-15
Management Console Guide
© 2024 SAP SE or an SAP aliate company. All rights reserved.
THE BEST RUN
Content
1 About the Management Console.................................................7
1.1 Who should read this guide......................................................7
1.2 Naming conventions and variables.................................................8
2 Logging into the Management Console...........................................13
2.1 Management Console navigation................................................. 13
3 Administrator..............................................................15
3.1 Administrator navigation.......................................................15
Status node..............................................................16
Batch node..............................................................17
Real-Time node...........................................................18
Web Services node.........................................................18
Adapter Instances node.....................................................19
Server Groups node........................................................19
Proler Repositories node....................................................19
Management node.........................................................20
Job Execution History node.................................................. 20
Node pages..............................................................21
3.2 Administrator Management.....................................................21
Managing database account changes............................................21
Editing le location object information...........................................24
Conguring the report server.................................................24
Adding Access Servers......................................................25
Setting the status interval....................................................26
Exporting certication logs...................................................27
3.3 Central Repository management.................................................30
Setting up users and groups..................................................30
Viewing reports...........................................................32
3.4 Server Groups..............................................................34
Server group architecture....................................................34
Editing and removing a server group............................................38
Monitoring Job Server status in a server group.....................................38
Executing jobs using server groups.............................................39
3.5 Batch Jobs.................................................................39
Executing batch jobs.......................................................39
Scheduling jobs...........................................................40
2
PUBLIC
Management Console Guide
Content
Downloading a debug package................................................53
Monitoring RFC trace logs................................................... 54
3.6 Real-Time Jobs..............................................................54
Supporting real-time jobs....................................................55
Conguring and monitoring real-time services.....................................56
Creating and monitoring client interfaces.........................................65
3.7 Real-Time Performance........................................................70
Conguring Access Server output..............................................70
Service conguration parameters..............................................73
Service statistics..........................................................76
Service provider statistics....................................................77
Using statistics and service parameters..........................................78
3.8 Prole Server Management.....................................................79
Dening a proler repository..................................................79
Proler task parameters.....................................................80
Monitoring proler tasks using the Administrator ...................................82
3.9 RFC Server Management.......................................................84
64-bit platform prerequisites.................................................84
Adding an RFC server interface................................................85
Starting or stopping an RFC server interface connection..............................86
Monitoring RFC server interfaces.............................................. 86
Removing one or more RFC server interfaces......................................87
3.10 Adapters..................................................................88
3.11 Support for Web Services......................................................89
3.12 Troubleshooting the Administrator................................................89
Reestablishing network connections............................................89
Finding problems......................................................... 90
Error and trace logs........................................................91
Resolving connectivity problems...............................................96
Restarting the Access Server................................................. 97
4 Metadata Reports ..........................................................99
4.1 Requirements for metadata reports...............................................99
4.2 Repository reporting tables and views............................................. 99
5 Impact and Lineage Analysis Reports...........................................102
5.1 Navigate impact and lineage information...........................................102
5.2 Impact and lineage object analysis information...................................... 103
5.3 Searching in the Impact and Lineage Analysis page................................... 108
5.4 Impact and Lineage Analysis Settings control panel...................................108
Impact and lineage Settings tab...............................................108
Impact and lineage Refresh Usage Data tab...................................... 109
Management Console Guide
Content
PUBLIC 3
About tab...............................................................110
5.5 Increasing the java heap memory in Windows........................................111
5.6 Increasing the java heap memory in UNIX...........................................111
6 Operational Dashboard......................................................112
6.1 Dashboard tab..............................................................112
Job Execution Status pie chart................................................113
Job Execution Statistics History bar chart........................................113
Job Execution table........................................................113
6.2 License Management.........................................................115
7 Data Validation Dashboard Reports.............................................116
7.1 Conguring Data Validation dashboards............................................116
Creating functional areas....................................................116
Creating business rules.....................................................117
Enabling data validation statistics collection......................................119
7.2 Viewing Data Validation dashboards.............................................. 119
7.3 Functional area view......................................................... 120
Functional area pie chart....................................................120
History line chart......................................................... 121
7.4 Business rule view...........................................................121
7.5 Validation rule view..........................................................122
Validation rule bar chart....................................................122
History line chart.........................................................123
7.6 Sample data view........................................................... 123
Sample data table........................................................ 123
History line chart.........................................................124
7.7 Data Validation dashboards Settings control panel....................................124
Repository tab...........................................................124
Functional area tab........................................................125
Business rule tab.........................................................125
8 Auto Documentation Reports.................................................126
8.1 Navigation................................................................126
Searching for a specic object................................................127
Repository..............................................................127
Project................................................................ 127
Job...................................................................128
Work ow.............................................................. 128
Data ow...............................................................128
8.2 Generating documentation for an object...........................................129
Printing Auto Documentation for an object.......................................129
4
PUBLIC
Management Console Guide
Content
8.3 Auto Documentation Settings control panel.........................................130
9 Data Quality Reports........................................................131
9.1 Conguring report generation...................................................131
9.2 Opening and viewing reports................................................... 132
9.3 Lists of available reports...................................................... 133
9.4 List of reports by job.........................................................134
9.5 Data Quality Reports Settings control panel.........................................134
9.6 Report options.............................................................134
9.7 Troubleshooting reports.......................................................135
9.8 USA CASS report: USPS Form 3553..............................................136
9.9 NCOALink Processing Summary Report........................................... 136
9.10 Delivery Sequence Invoice report................................................138
Contents of report........................................................138
9.11 US Addressing Report........................................................139
Enabling the report........................................................140
Percent calculation........................................................140
Information in the US Addressing report .........................................141
DPV sections............................................................142
NCOALink sections........................................................143
Information in the DSF2 sections..............................................143
LACSLink sections........................................................144
SuiteLink sections........................................................144
9.12 DSF2 Augment Statistics Log File................................................145
9.13 US Regulatory Locking Report.................................................. 145
9.14 Canadian SERP report: Statement of Address Accuracy................................146
9.15 Australian AMAS report: Address Matching Processing Summary......................... 147
9.16 New Zealand Statement of Accuracy (SOA) report....................................147
9.17 Address Information Codes Sample report......................................... 148
9.18 Address Information Code Summary report.........................................149
9.19 Address Validation Summary report..............................................150
9.20 Address Type Summary report..................................................151
9.21 Address Standardization Sample report............................................151
9.22 Address Quality Code Summary report............................................152
9.23 Data Cleanse Information Code Summary report.....................................153
9.24 Data Cleanse Status Code Summary report.........................................154
9.25 Geocoder Summary report.....................................................155
9.26 Overview of match reports .....................................................155
9.27 Best Record Summary report...................................................156
9.28 Match Contribution report.....................................................157
9.29 Match Criteria Summary report.................................................159
9.30 Match Duplicate Sample report................................................. 160
Management Console Guide
Content
PUBLIC 5
9.31 Match Input Source Output Select report.......................................... 160
9.32 Match Multi-source Frequency report............................................. 161
9.33 Match Source Statistics Summary report.......................................... 162
6 PUBLIC
Management Console Guide
Content
1 About the Management Console
A brief description of the SAP Data Services Management Console and the Data Services operations that it
administers.
The Management Console contains a collection of Web-based applications for administering the following Data
Services features and objects:
• Jobs and services executions
• Object relationship analysis
• Job execution performance evaluation
• Data validity
• Data quality report generation
Install the Management Console on a separate computer from other Data Services components. Management
Console runs on your Web application server. Management Console is written in Java and uses a JDBC
connection to repositories.
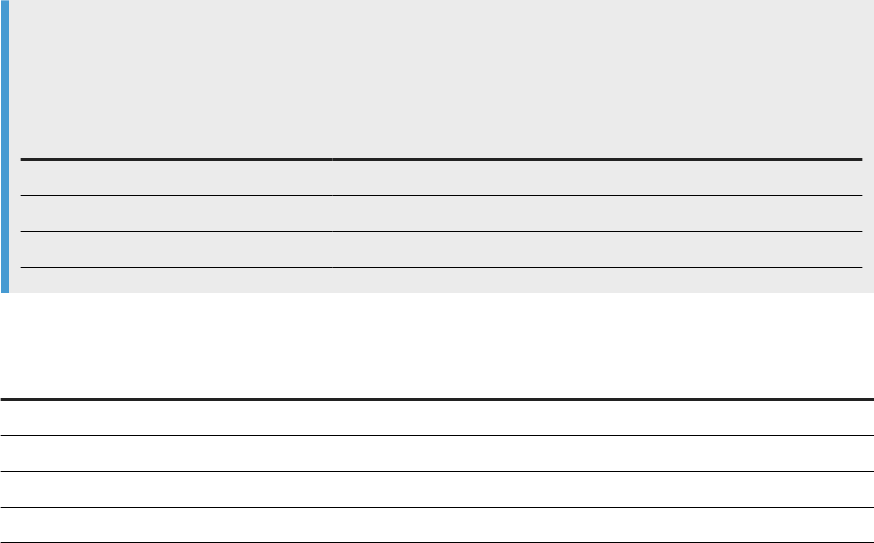
The following table contains Management Console applications and descriptions.
Management Console applications
Application
Description
Administrator Manage your production environment including batch job execution, real-time serv-
ices, web services, adapter instances, server groups, central repositories, proler
repositories, and more.
Impact and Lineage Analysis Analyze the end-to-end impact and lineage for source and target objects used
within the Data Services local repository.
Operational Dashboard View dashboards that provide at-a-glance statistics, status, and performance of
your job executions for one or more repositories over a given time period.
Data Validation Dashboard Evaluate the reliability of your target data based on the validation rules you created
in your batch jobs. Quickly review, assess, and identify potential inconsistencies or
errors in source data.
Auto Documentation View, analyze, and print graphical representations of all objects as depicted in the
Designer including their relationships, properties, and more.
Data Quality Reports View and export reports for batch and real-time jobs, such as job summaries and
data quality transform reports.
1.1 Who should read this guide
This and other SAP Data Services documentation assume the following:
• You are an application developer, consultant or database administrator working on data extraction, data
warehousing, data integration, or data quality.
Management Console Guide
About the Management Console
PUBLIC 7

• You understand your source and target data systems, DBMS, legacy systems, business intelligence, and
messaging concepts.
• You understand your organization's data needs.
• You are familiar with SQL (Structured Query Language).
• If you are interested in using this software to design real-time processing, you are familiar with:
• DTD and XML Schema formats for XML les
• Publishing Web Services (WSDL, REST, HTTP/S and SOAP protocols, etc.)
• You are familiar with SAP Data Services installation environments: Microsoft Windows or UNIX.
1.2 Naming conventions and variables
This documentation uses specic terminology, location variables, and environment variables that describe
various features, processes, and locations in SAP Data Services.
Terminology
SAP Data Services documentation uses the following terminology:
• The terms Data Services system and SAP Data Services mean the same thing.
• The term BI platform refers to SAP BusinessObjects Business Intelligence platform.
• The term IPS refers to SAP BusinessObjects Information platform services.
Note
Data Services requires BI platform components. However, when you don't use other SAP applications,
IPS, a scaled back version of BI, also provides these components for Data Services.
• CMC refers to the Central Management Console provided by the BI or IPS platform.
• CMS refers to the Central Management Server provided by the BI or IPS platform.
Variables
The following table describes the location variables and environment variables that are necessary when you
install and congure Data Services and required components.
8
PUBLIC
Management Console Guide
About the Management Console
Variables Description
INSTALL_DIR
The installation directory for SAP applications such as Data
Services.
Default location:
• For Windows: C:\Program Files (x86)\SAP
BusinessObjects
• For UNIX: $HOME/sap businessobjects
Note
INSTALL_DIR isn't an environment variable. The in-
stallation location of SAP software can be dierent than
what we list for INSTALL_DIR based on the location
that your administrator sets during installation.
BIP_INSTALL_DIR
The directory for the BI or IPS platform.
Default location:
• For Windows: <INSTALL_DIR>\SAP
BusinessObjects Enterprise XI 4.0
Example
C:\Program Files
(x86)\SAP BusinessObjects\SAP
BusinessObjects Enterprise XI 4.0
• For UNIX: <INSTALL_DIR>/enterprise_xi40
Note
These paths are the same for both BI and IPS.
Note
BIP_INSTALL_DIR isn't an environment variable.
The installation location of SAP software can be dierent
than what we list for BIP_INSTALL_DIR based on the
location that your administrator sets during installation.
Management Console Guide
About the Management Console
PUBLIC 9

Variables Description
<LINK_DIR>
An environment variable for the root directory of the Data
Services system.
Default location:
• All platforms
<INSTALL_DIR>\Data Services
Example
C:\Program Files (x86)\SAP
BusinessObjects\Data Services
10 PUBLIC
Management Console Guide
About the Management Console
Variables Description
<DS_COMMON_DIR>
An environment variable for the common conguration di-
rectory for the Data Services system.
Default location:
• If your system is on Windows (Vista and newer):
<AllUsersProfile>\SAP
BusinessObjects\Data Services
Note
The default value of <AllUsersProfile> environ-
ment variable for Windows Vista and newer is
C:\ProgramData.
Example
C:\ProgramData\SAP
BusinessObjects\Data Services
• If your system is on Windows (Older versions such as
XP)
<AllUsersProfile>\Application
Data\SAP BusinessObjects\Data
Services
Note
The default value of <AllUsersProfile> en-
vironment variable for Windows older versions
is C:\Documents and Settings\All
Users.
Example
C:\Documents and Settings\All
Users\Application Data\SAP
BusinessObjects\Data Services
• UNIX systems (for compatibility)
<LINK_DIR>
The installer automatically creates this system environment
variable during installation.
Note
Starting with Data Services 4.2 SP6, users
can designate a dierent default location for
Management Console Guide
About the Management Console
PUBLIC 11
Variables Description
<DS_COMMON_DIR> during installation. If you can't nd
the <DS_COMMON_DIR> in the listed default location, ask
your System Administrator to nd out where your de-
fault location is for <DS_COMMON_DIR>.
<DS_USER_DIR>
The environment variable for the user-specic conguration
directory for the Data Services system.
Default location:
• If you're on Windows (Vista and newer):
<UserProfile>\AppData\Local\SAP
BusinessObjects\Data Services
Note
The default value of <UserProfile> environment
variable for Windows Vista and newer versions is
C:\Users\{username}.
• If you're on Windows (Older versions such as XP):
<UserProfile>\Local
Settings\Application Data\SAP
BusinessObjects\Data Services
Note
The default value of <UserProfile> en-
vironment variable for Windows older ver-
sions is C:\Documents and Settings\
{username}.
Note
The system uses <DS_USER_DIR> only for Data
Services client applications on Windows. UNIX plat-
forms don't use <DS_USER_DIR>.
The installer automatically creates this system environment
variable during installation.
12
PUBLIC
Management Console Guide
About the Management Console
2 Logging into the Management Console
When you log into the Management Console, you must log in as a user dened in the Central Management
Server (CMS). The rst time you log into the Management Console, use the default user name and password
(admin/admin). It's recommended that you change the defaults by updating user roles in the Administrator.
1. Open a web browser, enter the following case-sensitive URL, and then press Enter:
http://<hostname>:8080/DataServices
where <hostname> is the name of the computer hosting the web application server.
Note
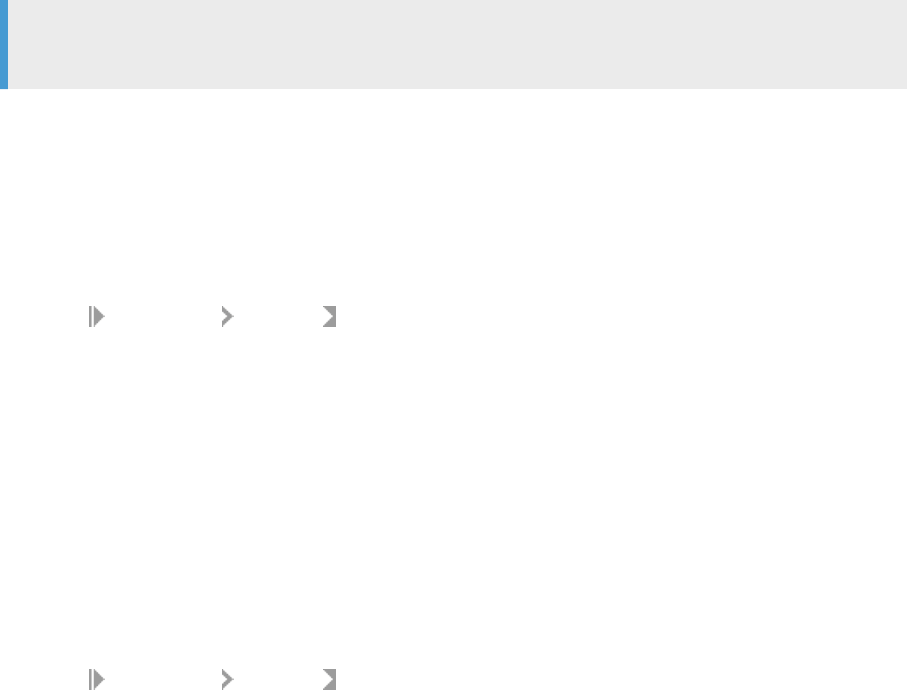
If you are logged in to the Designer, you can also access the Management Console home page in
several ways.
From
Select
Start page Data Services Management Console
Tools menu Data Services Management Console
Toolbar icon Data Services Management Console
2. Enter your user credentials for the CMS.
Option
Description
System Specify the server name and optionally the port for the CMS.
User name Specify the user name to use to log into CMS.
Password Specify the password to use to log into the CMS.
Authentication Specify the authentication type used by the CMS.
3. Click Log on.
The software attempts to connect to the CMS using the specied information. When you log in
successfully, the list of local repositories that are available to you is displayed.
2.1 Management Console navigation
The Management Console contains links to various applications that help you manage all aspects of SAP Data
Services. Click the application name to open the application.
After you open an application, the name of that application displays under the Management Console banner
at the top of the screen. There is a navigation tree along the left of the screen under the banner, that lists the
option categories (as nodes) for the application. Choose a node from the navigation tree, and the right side of
Management Console Guide
Logging into the Management Console
PUBLIC 13

the screen displays the related options. Sometimes there is more than one tab to choose from in the right side
of the screen.
The upper-right side of the main window for each application includes helpful links that vary based on the
application you have open. The following table describes the links that can appear.
Link Description
Home Click to return to the Management Console home page
where you can select another application, for example.
Settings Click to open a dialog box for changing a variety of options
depending on the selected application.
Logout Click to exit the Management Console application and Data
Services software, and display the log in page.
? Question mark icon Click to open the Documentation Map, which lists the SAP
Data Services technical documentation available to end
users or administrators, and a link to the customer portal
where you can fnd the latest versions of the documentation.
Your Management Console session times out after 120 minutes (2 hours) of inactivity.
14
PUBLIC
Management Console Guide
Logging into the Management Console
3 Administrator
This section describes the Administrator and how to navigate through its browser-based, graphical user
interface.
Use the Administrator to:
• Set up users and their roles
• Add connections to Access Servers and repositories
• Access job data published for Web Services
• Schedule and monitor batch jobs
• Congure and monitor:
• Access Server status
• Real-time services
• Client interfaces including SAP application client interfaces (to read IDocs) and message trac moving
in and out of an Access Server
• Adapter instances (a prerequisite for creating adapter datastores)
Additionally, you use the tools under the Promotion Management node to congure options to transport Data
Services objects from one system to another. For example, to export changes from a development system
to a test system. For more information about lifecycle management, including promotion management, see
the Administrator Guide. If you have a Change Transport System (CTS) installed in an SAP NetWeaver or SAP
Solution Manager environment, you can use CTS+ to transport Data Services objects. For more information,
see the SAP Data Services Conguration Guide for CTS+.
Related Information
Logging into the Management Console [page 13]
Administrator navigation [page 15]
3.1 Administrator navigation
Set up administrative aspects of Data Services such as users, user permissions, access servers, repositories,
schedules, and so on.
The navigation tree on the left side of the Administrator screen contains nodes that you can expand to make
related settings. The options for each chosen node appear on the right side of the screen. The right portion of
the screen may contain one or more tabs based on the node that you choose.
The navigation tree nodes contain options related to the user's permissions. Therefore not all nodes appear for
all users. For example, the Proler Repositories node only appears if the user has permission to view or manage
a proler repository. An administrator sets user permissions in the Central Management Console (CMC).
Management Console Guide
Administrator
PUBLIC 15
Possible nodes that appear in the navigation tree are:
• Status
• Batch
• Real-Time
• Web Services
• Adapter Instances
• Server Groups
• Proler Repositories
• Management
• Job Execution History
3.1.1Status node
Displays status indicators and detailed information about aspects of your jobs.
The Status page displays red, yellow, and green status icons that indicate the overall status of your batch and
real-time jobs, associated access servers, adapter and proler repositories jobs, services, and other related
systems. You can drill down into the information for more details. The following options appear as column
headings in the Status page.
Option
Description
Batch
Contains repository names that are associated with the Job Server on which
you run your batch jobs. To see batch jobs status, connect the repository to the
Administrator.
Note
The repository must be connected to the Management Console Administra-
tor before you can view it here.
Click the repository name listed under the Batch column to display a list of batch
jobs and the status for each.
Real-Time
Contains Access Server names associated with the real-time service. To see real-
time jobs status, connect the Access Server to the Administrator.
Note
The Access Server must be connected to the Management Console Adminis-
trator before you can view it here.
Click the Access Server name listed under the Real-Time column to display a list
of services and related client interfaces.
16 PUBLIC
Management Console Guide
Administrator
Option Description
Adapters
Contains repository names associated with the Job Server on which you run the
adapter.
Note
You must enable the Job Server for adapters before you can see the adapter
status here.
Click the repository name to display more adapter information.
Proler
Contains the repository name associated with the Proler Server.
Note
You must connect the proling repository to the Management Console Ad-
ministrator before you can view it here.
Click the repository name to display a list of proler tasks and their status.
For more information about adapter and prole repositories, and about repository and server connections, see
the Administrator Guide.
3.1.2Batch node
The Batch node contains job status, job conguration, and repository schedule information.
After you add at least one repository connection to the Administrator, you can expand the Batch node and view
a repository Batch Job Status page.
Click the All Repositories option to see jobs in all repositories connected to this Administrator. (The All
Repositories node appears only when you have more than one repository connected).
Each repository under the Batch node includes the following tabs.
Tab
Description
Batch Job Status View the status of the last execution and in-depth information about each job.
Batch Job Conguration Congure execution and scheduling options for individual jobs.
Repository Schedules
View and congure schedules for all jobs in the repository.
There is a Delete button in the Batch node that deletes the selected job as well as the history and log les. If
you intend to create reports based on specic jobs, transforms, time periods, and job statistics, or if you need
information to create regulatory or certied reports, you should create a local backup copy of the tables or log
les before you delete.
Management Console Guide
Administrator
PUBLIC 17

Related Information
Batch Jobs [page 39]
3.1.3Real-Time node
After you add a connection to an Access Server in the Administrator, you can expand the Real-Time node.
Expand an Access Server name under the Real-Time node to view the options.
Access Server node options
Description
Status View status of real-time services and client interfaces supported by this Access
Server. Control, restart, and set a service provider interval for this Access Server.
Real-time Services View status for services and service providers, start and stop services, add or
remove a service, congure Job Servers for a service.
Client Interfaces View status for client interfaces, start and stop interfaces, add or remove an inter-
face.
Logs - Current View list of current Access Server logs, content of each log, clear logs, congure
content of logs for display, enable or disable tracing for each Access Server.
Logs - History View list of historical Access Server logs, view content of each log, delete logs.
Related Information
Real-Time Jobs [page 54]
Real-Time Performance [page 70]
3.1.4Web Services node
Use this node to select real-time and batch jobs that you want to publish as Web service operations and to
monitor the status of those operations. You can also use the node to set security for jobs published as Web
service operations and view the WSDL le that SAP Data Services generates.
Related Information
Support for Web Services [page 89]
18
PUBLIC
Management Console Guide
Administrator
3.1.5Adapter Instances node
Use this node to congure a connection between SAP Data Services and an external application by creating
an adapter instance and dependent operations. This is a prerequisite requirement for creating a datastore for
adapters in the Designer.
After you create a datastore, import data through the adapter and create jobs. Then use this node to view the
status of Adapter instances. Options are listed by Job Server under the Adapter Instance node.
Related Information
Adapters [page 88]
3.1.6Server Groups node
The Server Groups node allows you to group Job Servers that are associated with the same repository into a
server group.
Use a server group if you want SAP Data Services to automatically use the Job Server on a computer with
the lightest load when a batch job is executed. This functionality improves load balancing (throughput) in
production environments and also provides a hot backup method. When a job is launched, if a Job Server is
down, another Job Server in the same group executes the job.
Related Information
Server Groups [page 34]
3.1.7Proler Repositories node
After you connect a proler repository to the Administrator, you can expand the Proler Repositories node.
Click a repository name to open the Proler Tasks Status page.
Related Information
Prole Server Management [page 79]
Management Console Guide
Administrator
PUBLIC 19

3.1.8Management node
The Management node contains the conguration options for the Administrator application. Before you can
use some features of the Administrator, you must add connections to other SAP Data Services components
using the Management node. For example, expand the management node and:
• Expand Datastore and click a repository to manage datastore congurations for that repository.
• Click Access Servers to add a connection to your Access Servers (for real-time jobs).
Related Information
Administrator Management [page 21]
3.1.9Job Execution History node
Contains execution history for a job or data ow.
When you expand the Job Execution History node, The following information may be available as applicable:
Tab
Description
Job Execution History
You can view execution history for a single batch job or for all batch jobs.
You can rene the history by selecting to view reports that were generated
between a specic start and end date.
The information for the selected batch job appears in a table. This table
displays the repository name, job name, the start and end time of the job
execution, the execution time (elapsed), the status, and whether the job is
associated with a system conguration.
• Under the Job information column, click the Trace, Monitor, or Error
link to open the Log Viewer page, which displays the logs associated
with the job. Click the other tabs in the Log Viewer page to view the
other types of logs.
• Click the Performance Monitor link under the Job information column
to open the Performance Monitor page.
20 PUBLIC
Management Console Guide
Administrator

Tab Description
Data Flow Execution History
This page includes three options for customizing the display:
• Data Flow: Enter a data ow name for which to search and click Search.
• Job Name: Select all jobs or an individual job.
• View history for x days: Select over how many days you want to view
the history
Related information appears in a table. This table displays the repository
name, data ow name, job name, the start and end time of the data ow
execution, the execution time (elapsed), and the number of rows extracted
and loaded.
Related Information
3.1.10Node pages
Each node that you expand on the left opens a page on the right that displays information relating to the node
that you have selected.
The top of the page indicates the currently selected node. If applicable, a page contains tabs that you can use
to navigate further into the node. For example, the Batch node page contains the tabs: Batch Job Status, Batch
Job Conguration, and Repository Schedules.
The tabs names appear on light blue tabs. A dark blue (shaded) tab signies the active page. Click a light blue
tab to go to that page. Some pages do not include tabs.
As you drill into various pages, a “bread crumb” trail often indicates where you are in the Administrator
application. In some pages, you can click on the bread crumb links to navigate to a dierent page.
3.2 Administrator Management
Use the Management features to congure the Administrator.
3.2.1Managing database account changes
SAP Data Services uses several types of user accounts and associated passwords. For various reasons,
database account parameters such as user names or passwords change. For example, perhaps your
company's compliance and regulations policies require periodically changing account passwords for security.
Management Console Guide
Administrator
PUBLIC 21

3.2.1.1 Updating local repository login parameters
If the login information, particularly the password, for a repository has changed, SAP Data Services provides
an optional password le that all schedules or exported execution commands use. In other words, the software
uses this password le to store and update connection information in one location that multiple schedules or
exported execution commands share for that repository.
Note
This description does not apply to central repositories.
The password le:
• Species the connection information for the repository.
• Can be stored in a central location for access by others who run jobs in that repository.
• Is created when you create or update a job schedule to minimize associated maintenance.
Related Information
Using a third-party scheduler [page 48]
3.2.1.1.1 Updating the CMS connection information and
use a password le
1. Expand the Management node.
2. Click CMS Connection.
3. Edit the connection information as necessary.
4. Click Apply.
5. Click Generate password le to create or update the password le.
The default name and location of the le are <DS_COMMON_DIR>\conf\repositoryname.txt.
3.2.1.1.2 Updating job schedules
When database account information for your repository changes, the SAP Data Services job schedules
associated with that account must also be updated. When you use a password le, the job schedules access it
at runtime to automatically retrieve the updated account information.
22
PUBLIC
Management Console Guide
Administrator
Related Information
Scheduling jobs [page 40]
3.2.1.2 Updating datastore connection parameters
If the information associated with a datastore connection changes, particularly passwords, you can update the
changes using the Administrator.
Note
Only users with Administrator role privileges can edit datastore parameters.
3.2.1.2.1 Editing the connection information for an
individual conguration in a datastore
1. Select Management Datastore , and select the repository that contains the datastore conguration
that you want to edit.
2. Click the conguration name to congure.
3. Edit the enabled elds as necessary.
4. Click Apply. To return all elds to the last set of values applied, click Reset.
3.2.1.2.2 Editing the connection information for multiple
congurations in a datastore
1. Select
Management Datastore , and select the repository that contains the datastore congurations
that you want to edit.
2. Click the datastore name to congure.
All congurations for that datastore display.
3. Edit the enabled elds as necessary.
Click More to display the page for that individual conguration, which includes more options specic to it.
4. Click Apply. To return all elds to the last set of values applied, click Reset.
Management Console Guide
Administrator
PUBLIC 23
3.2.2Editing le location object information
Edit a le location object conguration to change current settings like host, port, user, password, remote and
local directories.
1. Select Management File Locations .
2. Select the repository that contains the le location object conguration to edit.
3. Click the File location and conguration name to edit.
4. Edit the enabled elds as necessary.
Note
You cannot change the Name, Type, or Protocol options.
5. Click Apply.
Related Information
3.2.3Conguring the report server
For each repository registered in the Central Management Console (CMC), a report server conguration is
automatically created with default parameters. The Report Server Conguration node in the Management
Console Administrator lets you edit the default parameters, including the location where job reports are written
upon execution.
1. Select Management Report Server Conguration <repository> .
The Report Server Conguration page opens and displays the report export conguration parameters. If
the conguration has not yet been saved for the selected repository, the page displays default parameters.
2. Enter the appropriate conguration information.
Option
Description
Host name The name of the machine that the report server is running on. By default, the current
web application server name is used. Localhost is not a valid name.
Communication port The port number of the machine that the report server is running on.
24 PUBLIC
Management Console Guide
Administrator
Option Description
Export location The path where the reports will be exported to. The default path is
<DS_COMMON_DIR>\DataQuality\reports\. Upon execution, the repository
name and job name folders are appended to the path. If the Overwrite option is not
selected, a run ID folder is also appended to the path.
Note
If you export reports to a location other than a local drive, such as a network drive,
before you execute the job you must start the Server Intelligence Agent service with
an account that has access rights to that location.
Export type
The format in which the reports can be exported (PDF or RTF).
Overwrite Species whether existing reports will be overwritten when the reports are exported. If
this option is not selected, the reports are exported to a subfolder with the run ID, which
species a unique identication of an instance of the executed job.
Language The supported language that the reports are generated in. Note that some reports,
such as country-specic certication reports, are designed only to support English, so
changing the option for those reports has no eect.
3. Click Apply to save the conguration. To return all elds to the last set of values applied, clicking Reset.
4. Verify that the security setting for this operation is disabled. Select Administrator Web Services and
click the Web Services Conguration tab. If the Export_DQReport operation is enabled (displays a check
in the Session Security column), select the checkbox next to it, select Disable Session Security from the
pull-down menu, and click the Apply button.
To generate and export all of the job reports to the specied location at runtime, select the Export Data Quality
Reports option when you execute the job.
Related Information
Adding a job schedule [page 41]
3.2.4Adding Access Servers
The Administrator acts as a front end for Access Servers connected to it. Use the Administrator to:
• Congure real-time jobs as real-time services.
• Congure real-time services with service providers.
• Monitor Access Servers, real-time services, and service providers.
You rst must connect an Access Server to the Administrator so that you can use the Administrator to create
a real-time service from a real-time job. After a service starts, the Access Server brokers messages between
external applications and SAP Data Services.
When a message request comes in, the Access Server communicates with the Job Server to get the repository
data needed to run a real-time service and process the message. A reply comes back through the Access
Management Console Guide
Administrator
PUBLIC 25
Server to the message originator and the Access Server log records the event, which you can monitor from the
Administrator.
Use the Access Servers page to connect an Administrator to a repository.
1. Select Management Access Servers .
2. Click Add.
3. Enter the following information.
Option
Description
Machine Name Host name of the computer on which the Access Server is installed.
Communication Port Port assigned to the Access Server in the Server Manager utility.
4. (Optional) Before attempting to register the Access Server with the Administrator, click Ping to see if the
Access Server is available and exists on the computer and port you specied.
5. Click Apply.
The Administrator registers the Access Server, validates the Access Server connection information, and
displays the information on the Access Servers page.
To view a list of Access Servers connected to the Administrator, select Management Access Servers .
The Access Servers page lists the Access Servers that are connected to the Administrator. You can also remove
a connection to an Access Server from this page.
3.2.5Setting the status interval
Use the Status Interval page to specify the time period for which the Administrator displays the status (using
the red, yellow, and green status icons) on the Batch Job Status page and the Real-Time History page.
1. Select Management Status Interval .
2. On the Status Interval page, specify the time period.
You can lter the information for Batch and Real-time jobs in the following ways:
• By the last execution of each job
• By number of days
Note
The default for Real-Time Display is 5 days.
• By range of dates
3. Click Apply.
The Administrator updates the list of job executions and the status interval displays on the Batch Job
Status page and the Real-Time History page.
26
PUBLIC
Management Console Guide
Administrator
3.2.6Exporting certication logs
Generate and export certication logs for supported postal authorities.
When you run address cleanse jobs and set the appropriate options, you can generate reports to qualify
for mailing discounts with supported postal authorities. Generate the certication log les required for
certications in the Management Console.
The Certication Logs page is available to users who are assigned either the Administrator or Operator role.
Related Information
Exporting NCOALink report data [page 27]
Exporting New Zealand SOA certication logs [page 28]
Exporting DSF2 certication log [page 29]
3.2.6.1 Exporting NCOALink report data
Before you export report data (with exception of Null reports), you must rst run a job containing a USA
Regulatory Address Cleanse transform with the NCOA options set appropriately. You must also congure your
repository in the Central Management Console (CMC).
You can export report data for the data in one repository or in all repositories.
Caution
If you select all repositories and have more than one connection to the same repository, your results may
contain duplicate records.
1. Select Management Certication Logs , and select the repository that contains the data that you
want to export.
2. Click the NCOALink tab.
3. Select the date range that contains the data that you want to export.
4. To export standard reports, enable Export standard monthly reports for NCOA Licensee ID and select the
NCOALink Licensee ID for the les that you want to export. To export a null monthly report, enable Export
Null monthly reports for NCOA Licensee ID and enter a 4-character NCOALink Licensee ID.
Note
Selecting an entry with a NCOA Processed? value of Yes for export will result in standard monthly
reports being exported even if you have the Export NULL monthly reports for NCOA Licensee ID option
selected. A No value indicates that data isn't available (for example, NCOA jobs were not run for the
specied Licensee ID(s) and date range), which results in a null monthly report being exported.
5. Specify the location where the les will be exported.
Management Console Guide
Administrator
PUBLIC 27

Note
The location that you specify is relative to the web application server.
To reset the export location to the default, click the Reset button. The default location is
<DS_COMMON_DIR>\DataQuality\certifications\CertificationLogs\<repository>\.
6. If you want to overwrite an existing le, click the Overwrite option.
7. Click the Search button. The page displays available report entries based on the options you select. For
example, if you have Export standard monthly reports for NCOA Licensee ID and All NCOA Licensee IDs
selected, report entries for all IDs for the specied dates will appear in the table. You can sort using the
column headers.
8. Select the report data that you want to export or select Select All.
9. Click the Export button.
After the report data is exported, a conrmation message is displayed at the top of the page.
Related Information
NCOALink Processing Summary Report [page 136]
3.2.6.2 Exporting New Zealand SOA certication logs
Before you export the certication log, you must have run a job containing a Global Address Cleanse transform
with the New Zealand SOA certication options set appropriately. You must also congure your repository in
the CMC.
You can export the certication log for the data in one repository or in all repositories.
Caution
If you select all repositories and have more than one connection to the same repository, your results may
contain duplicate records.
1. Select Management Certication Logs , and select the repository that contains the certication log
that you want to export.
2. Click the New Zealand SOA tab.
3. Select whether you want to export all certication log data that is in the selected repository or just the data
within a specied date range.
The Year list contains the current year and the two previous years, because certication logs are required
to be retained for two years.
4. Specify the location where the certication logs will be exported.
The default location is
<DS_COMMON_DIR>\DataQuality\certifications\CertificationLogs\<repository>\. To reset
the export location to the default, click the Reset button.
5. If you want to overwrite an existing log le, click the Overwrite option.
28
PUBLIC
Management Console Guide
Administrator

6. Click the Export button.
After the log le is exported, a conrmation message is displayed at the top of the page.
Related Information
New Zealand Statement of Accuracy (SOA) report [page 147]
3.2.6.3 Exporting DSF2 certication log
Export DSF2 log les to submit them to the USPS as required by your DSF2 license agreement.
Select to export from one repository or from multiple repositories as applicable. However, if you select multiple
repositories, and there is more than one connection to a repository, you may export duplicate records.
1. Open and log in to the Data Services Management Console.
2. In the Administrator, select
Management Certication Logs .
3. Select the repository that contains the certication log that you want to export.
4. Open the DSF2 tab and select the date range for when you generated the log le.
5. Click DSF2 licensee ID and select the applicable licensee ID from the dropdown list. Or, select All DSF2
License IDs.
6. Specify a location for the exported certication logs.
Note
The location that you specify is relative to the web application server.
To reset the export location to the default, click the Reset button. The default location is
<DS_COMMON_DIR>\DataQuality\certifications\CertificationLogs\<repository>\.
7. Optional. Click Overwrite to overwrite any existing log le.
8. Click Search.
The page displays the available log les with the specied criteria. You can sort the log les using the
column headers. The Data Available column has a status of Yes when there is data for the log le. A status
of No indicates that no data is available and the export results in an empty log le.
9. Select the log le or les to export or check Select All.
10. Click Export.
The software displays a conrmation message when the export completes.
Related Information
DSF2 Augment Statistics Log File [page 145]
Data Quality Reports [page 131]
Management Console Guide
Administrator
PUBLIC 29

3.3 Central Repository management
This section describes how to manage your secure central repositories using the Administrator.
When you log into the Management Console as a user with the appropriate rights, the name of each secure
central repository appears under the Central Repositories node. Links under this node include:
• Users and groups
Use to add, remove, and congure users and groups for secure object access.
• Reports
Use to generate reports for central repository objects such as viewing the change history of an object.
Note
Before you can manage a secure central repository, it must be registered in the Central Management
Console (CMC) and have appropriate user access applied.
Related Information
3.3.1 Setting up users and groups
The general process for setting up secure central repository users and groups is as follows:
1. Register the secure central repository in the Central Management Console (CMC).
2. Add central repository groups.
3. Associate users with groups.
The following sections describe these procedures.
Related Information
3.3.1.1 Adding a group to a central repository
Groups are specic to a secure central repository and are not visible in any other local or central repository.
1. Expand the Central Repositories node in the navigation tree and expand the repository to congure.
2. Click Users and Groups.
The Groups and Users page displays.
30
PUBLIC
Management Console Guide
Administrator
3. On the Groups tab, click Add.
4. Type a Name for the group.
5. Optionally, type a Description for the group.
6. Click Apply.
The group appears on the Groups tab.
3.3.1.2 Adding users
1. Expand the Central Repositories node in the navigation tree and expand the repository to congure.
2. Click Users and Groups.
The Groups and Users page displays.
3. Click the Users tab.
4. Click Add.
On the Add/Edit User page, enter the following information.
Option
Description
User name Select the user to add to the group.
Note
The list of available users includes all users dened in the Central
Management Console (CMC).
Default group
The default central repository group to which the user belongs. You can
change the default by selecting another from the drop-down list.
Status Select a value from the drop-down list:
• Active
Enables the user's account for normal activities.
• Suspended
Select to disable the login for that user.
Description
Optionally, type a description for the user.
The User is a member of list on the left shows the groups to which this user belongs.
5. Click Apply.
Clicking Reset returns all elds to the last set of values applied.
3.3.1.3 Adding or removing a user from a group
1. Expand the Central Repositories node in the navigation tree and expand the repository to congure.
2. Click Users and Groups.
3. Click the Group tab.
Management Console Guide
Administrator
PUBLIC 31

4. Click the group name.
5. The Members list on the left shows the users in this group.
To add users to a group, click the user names from the Not Members list and click Add Users. Select
multiple user names using the Ctrl or Shift keys.
To remove a user from the group, select a user name from the Members list and click Remove Users. Select
multiple user names using the Ctrl or Shift keys.
6. Click Apply.
Clicking Reset returns all elds to the last set of values applied.
Alternately, click the Users tab, click the user name, and associate the user with one or more groups by
selecting group names and adding or removing them.
Related Information
3.3.1.4 Deleting a group
1. Expand the Central Repositories node in the navigation tree, expand the repository to congure, and click
Users and Groups.
2. Click the Group tab.
3. Select the check box for the group.
4. Click Remove.
Note
You cannot delete a group in the following instances:
• It is the default group for any user (whether or not they are active).
• It is the only group with full permissions for an object.
• A member of the group is undertaking any central repository tasks using the Designer.
3.3.2Viewing reports
You can generate reports about objects in a central repository such as which objects a user currently has
checked out or the changes made to an object over a specied time frame.
Expand the central repository to view and expand the Reports link.
32
PUBLIC
Management Console Guide
Administrator

Related Information
Object state report [page 33]
Change report [page 33]
3.3.2.1 Object state report
Use the object state report to view details on one or more objects such as whether the objects are checked out
and by whom.
Click the Object State Report link to display a search page with the following criteria (all elds are optional):
Option
Description
Object name Type an object name. You can use the % symbol as a wildcard.
Object type For example select Batch job, Table, or Stored procedure.
State For example select Checked out.
User Select a central repository user name.
Click Search to generate the report. The report has the following columns:
• Object name
• Object type
• State
• User name—The user account associated with the check-out or check-in.
• Associated repository—The repository to which the object belongs.
• Time—Check-out or check-in date and time.
• Comments—Comments added when user checked out or checked in the object.
Click the object name to display the object's history.
Related Information
3.3.2.2 Change report
Use the change report to view the change history for an object over a specied period of time.
Click the Change Report link to display a search page with the following criteria:
• Start date—Enter a date or click the calendar icon to select a start date.
• End date—Enter a date or click the calendar icon to select an end date.
Management Console Guide
Administrator
PUBLIC 33
• Object type—Optionally select an object type; for example batch job, table, or stored procedure.
• State—Optionally select an object state; for example Checked out.
• User—Optionally select a central repository user name.
Click Search to generate the report. The report has the following columns:
• Object name
• Object type
• State
• Version—The version number of the object.
• User name—The user account associated with the check-out or check-in.
• Associated repository—The repository to which the object belongs.
• Time—Check-out or check-in date and time.
• Comments—Comments added when user checked out or checked in the object.
3.4 Server Groups
Use the Administrator to create and maintain server groups.
This section describes how to work with server groups.
3.4.1Server group architecture
You can group Job Servers on dierent computers into a logical SAP Data Services component called a server
group. A server group automatically measures resource availability on each Job Server in the group and
distributes scheduled batch jobs to the Job Server with the lightest load at runtime.
There are two rules for creating server groups:
• All the Job Servers in an individual server group must be associated with the same repository, which must
be dened as a default repository. The Job Servers in the server group must also have:
• Identical SAP Data Services versions
• Identical database server versions
• Identical locale
• Each computer can only contribute one Job Server to a server group.
34
PUBLIC
Management Console Guide
Administrator
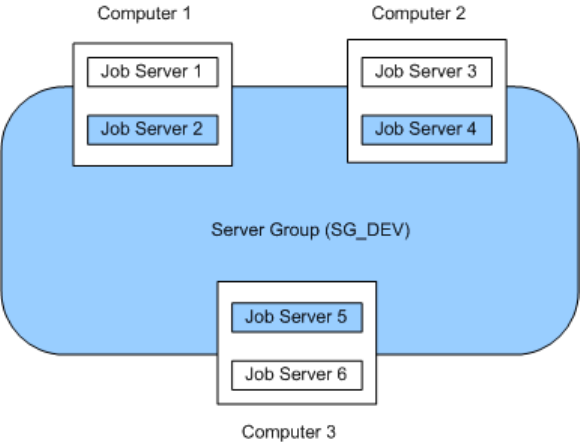
The requirement that all Job Servers in a server group be associated with the same repository simply allows
you to more easily track which jobs are associated with a server group. It is recommended that you use a
naming convention for server groups that includes the name of the repository. For example, for a repository
called DEV, a server group might be called SG_DEV.
On startup, all Job Servers check the repository to nd out if they must start as part of a server group.
Compared to normal Job Servers, Job Servers in a server group each:
• Collect a list of other Job Servers in their server group
• Collect system load statistics every 60 seconds:
• Number of CPUs (on startup only)
• Average CPU load
• Available virtual memory
• Service requests for system load statistics
• Accept server group execution requests
3.4.1.1 Load balance index
All Job Servers in a server group collect and consolidate system load statistics and convert them into a
load balance index value for each Job Server. A Job Server's load balance index value allows the software to
normalize statistics taken from dierent platforms. The Job Server with the lowest index value is selected to
execute the current job. The software polls all Job Server computers every 60 seconds to refresh the load
balance index.
Management Console Guide
Administrator
PUBLIC 35
3.4.1.2 Job execution
After you create a server group, you can select a server group to execute a job from the Designer's Execution
Properties window or from the Execute Batch Job, Schedule Batch Job, and Export Batch Job pages in the
Administrator.
When you execute a job using a server group, the server group executes the job on the Job Server in the group
that is running on the computer that has the lightest load. The Administrator will also resynchronize a Job
Server with its repository if there are changes made to the server group conguration settings.
You can execute parts of your job on dierent Job Servers in a server group. You can select the following
distribution levels from the Designer's Execution Properties window or from the Execute Batch Job, Schedule
Batch Job, and Export Execution Command pages in the Administrator:
• Job level
A job can execute on an available Job Server.
• Data ow level
Each data ow within a job can execute on an available Job Server.
• Sub data ow level
A resource-intensive operation (such as a sort, table comparison, or table lookup) within a data ow can
execute on an available Job Server.
Related Information
3.4.1.3 Job launcher
The Job Launcher, exported as part of a job's execution commands, includes a specic command line option
for server groups. You can use this option to change the Job Servers in a server group.
Related Information
About the job launcher [page 51]
3.4.1.4 Working with server groups and Designer options
Some Designer options assume paths are relative to a Job Server. If your Job Servers are on dierent machines
from your Designer (typically the case in a production environment) you must ensure that connections and
directory paths point to the Job Server host that will run the job. Such options include:
• Source and target directories for les
36
PUBLIC
Management Console Guide
Administrator

• Bulk load directories
• Source and target connection strings to databases
• Path to repositories
When using server groups consider the additional layer of complexity for connections. For example, if you have
three Job Servers in a server group:
• Use the same directory structure across your three host computers for source and target le operations
and use relative paths for le names.
• Use the same connection strings to your databases for all three Job Server hosts.
If you use job distribution levels, the Job Servers in the server group must have:
• Identical SAP Data Services versions
• Identical database server versions
• Identical locale
• Identical operating systems
Thoroughly test the Job Server job options when working with server groups.
Adding a server group:
• In the Administrator, use the Server Groups node to create and add a server group.
3.4.1.4.1 Adding a server group
1. Select
Server Groups All Server Groups .
2. Click the Server Group Conguration tab.
3. Click Add.
4. Follow the instructions on the Add Server Group page to create a server group.
• When you select a repository, all Job Servers registered with that repository display. You can create
one server group per repository.
• Notice that the Administrator provides a default server group name. It is the name of your repository
with the prex SG_ (for server group). You can change the default name, however, labeling a server
group with the repository name is recommended.
• One Job Server on a computer can be added to a server group. Use the Host and Port column to verify
that the Job Servers you select are each installed on a dierent host.
5. After you select the Job Servers for a server group, click Apply.
The display returns to the Server Group Conguration page.
Related Information
Monitoring Job Server status in a server group [page 38]
Management Console Guide
Administrator
PUBLIC 37

3.4.2Editing and removing a server group
You can select a new set of Job Servers for an existing server group or remove a server group.
Trace messages are written for a change in Job Server status when you create, edit, or remove server groups.
• When a Job Server is upgraded to membership in a server group, the trace message is:
Collecting system load statistics, maintaining list of Job Server(s) for this
server group, and accepting Job Server execution requests.
• When a Job Server is downgraded out of a server group, the trace message is:
Deleting current system load statistics, and not collecting more. Not accepting
job execution requests from a server group.
3.4.2.1 Editing a server group
1. Select a server group from the navigation pane on the left.
2. In the Server Groups page, click the Server Group Conguration tab.
3. Select a new set of Job Servers.
4. Click Apply.
Your edited server group is saved and the display returns to the Server Groups Conguration tab.
3.4.2.2 Removing a server group
1. In the Server Groups page, click the Server Group Conguration tab.
2. Select the check box for the server group(s) that you want to remove.
3. Click Remove.
Note
If you delete Job Servers from a repository in order to delete all the Job Servers in a server group, the
Administrator displays an invalid status for the server group.
3.4.3Monitoring Job Server status in a server group
If Job Servers are in a server group, you can view their status in the Administrator.
• To monitor the status of these Job Servers, select Server Groups All Server Groups .
The Server Group Status page opens. All existing server groups are displayed with the Job Servers they
contain.
38
PUBLIC
Management Console Guide
Administrator
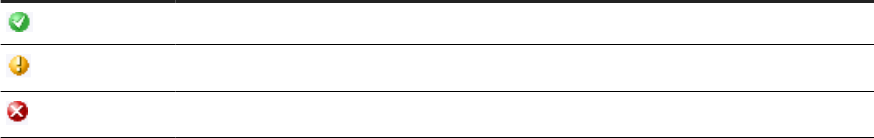
Indicator Description
A green icon indicates that a Job Server is running.
A yellow icon indicates that a Job Server is not running.
A red icon indicates that the Job Server cannot connect to the repository.
If a server group contains Job Servers with a mix of green, yellow, or red indicators, then its indicator
appears yellow:
Otherwise, a server group indicator displays the same color indicator as its Job Servers.
• To view the status for a single server group, select its name.
3.4.4Executing jobs using server groups
After you create a server group, you can select a server group to execute a job from the Designer's Execution
Properties window or from the Execute Batch Job and Schedule Batch Job pages in the Administrator.
Related Information
Batch Jobs [page 39]
3.5 Batch Jobs
This section describes how to execute, schedule, and monitor batch jobs from the Administrator.
Before you can manage batch jobs with the Administrator, add repository connections.
You can control some of the behavior in the Batch Job Status tab by making settings in the Central
Management Console (CMC). For example, set the number of days to retain the job execution history or the
Job Server log. Or set the number of seconds from the job start time that the Managemet Console displays an
accurate job status for jobs that crash mid-execution.
For complete descriptions of these options, see the Server Management section of the Administrator Guide, or
search for History Retention Period, Job Server Log Retention Period, or Job History Cleanup Period.
3.5.1Executing batch jobs
You can execute batch jobs from the Administrator if their repositories are registered in the Central
Management Console (CMC) and your user has the appropriate rights.
Management Console Guide
Administrator
PUBLIC 39

1. Select Batch <repository> .
The Administrator opens the Batch Job Status page, which lists all of the jobs in the selected repository.
To view jobs in all repositories from this page, select Batch All Repositories . (The All Repositories
option appears under the Batch Job node if more than one repository is connected to the Administrator.)
2. Click the Batch Job Conguration tab.
3. To the right of the job you want to run, click Execute.
The Administrator opens the Execute Batch Job page.
4. Under Enter Execution Options, set the parameters for the execution of this job.
5. Under Select Trace Options, set the trace properties for this execution of the job.
6. To create a debug package, select the Debug Package option.
You can download the package from the Batch Job Status page.
7. Click Execute to run the job.
The Administrator returns to the Batch Job Status page.
Related Information
3.5.2Scheduling jobs
There are three ways to manage job schedules.
Related Information
Using the job scheduler [page 40]
Scheduling jobs in SAP BusinessObjects Business Intelligence platform [page 45]
Using a third-party scheduler [page 48]
3.5.2.1 Using the job scheduler
When you schedule batch jobs using the SAP Data Services job scheduler, it creates an entry in the operating
system's scheduling utility on the Job Server computer. Windows uses the Task Scheduler and UNIX systems
use the CRON utility. (Note that if you make changes to a schedule directly through these utilities, the job
scheduler will not reect those changes.)
40
PUBLIC
Management Console Guide
Administrator
3.5.2.1.1 Adding a job schedule
1. Select Batch <repository> .
2. Click the Batch Job Conguration tab.
3. For the job to congure, click Add Schedule.
4. On the Schedule Batch Job page, enter the desired options:
Option
Description
Enter a job schedule
Schedule name Enter a unique name that describes this schedule.
Note
You cannot rename a schedule after you create it.
Active
Select this box to enable (activate) this schedule, then click Apply. This
option allows you to create several schedules for a job and then activate
the one(s) you want to run.
Select a scheduler
Data Services scheduler Creates the schedule on the Job Server computer.
BOE scheduler Creates the schedule on the selected Central Management Server
(CMS).
Select scheduled day(s) for executing the job
Calendar From the drop-down list on the calendar, select:
• Day of Week to schedule the job by the day of the week. You can
select one or more days. Click again to deselect.
• Day of Month to schedule the job by date. You can select one or more
dates. Click again to deselect.
If Recurring is selected, then the Administrator schedules this job to
repeat every week or month on the selected day. Note that if you select
multiple days of the week or month, the job will run on a recurring basis
by default.
Select scheduled time for executing the jobs
Once a day Enter the time for the scheduler to start the job (hours, minutes, and
either AM or PM).
Multiple times a day
• For the Data Services scheduler, enter the time (hours, minutes, and
either AM or PM) for the scheduler to repeatedly run the job for the
selected duration (in minutes) at the selected interval (in minutes).
• For the BOE scheduler, enter (in minutes) the repeat interval to run
the job. You must also select all days in the calendar (for weekly or
monthly).
Select a time when all of the required resources are available. Typically,
you want to schedule jobs to ensure they nish before the target data-
base or data warehouse must be available to meet increased demand.
Management Console Guide
Administrator
PUBLIC 41
Option Description
Select job execution parameters
System conguration Select the system conguration to use when executing this job. A system
conguration denes a set of datastore congurations, which dene the
datastore connections.
For more information, see “Creating and managing multiple datastore
congurations” in the Designer Guide.
If a system conguration is not specied, the software uses the default
datastore conguration for each datastore.
This option is a run-time property. This option is only available if there are
system congurations dened in the repository.
Job Server or server group
Select the Job Server or a server group to execute this schedule.
Use password le Select to create or update the password le that the job schedule ac-
cesses for current repository connection information. Deselect the option
to generate the batch le with a hard-coded repository information.
Note
This option is disabled if you have not set up a CMS connection.
Enable auditing
Select this option if you want to collect audit statistics for this specic job
execution. This option is selected by default.
For more information about auditing, see “Using Auditing” in the De-
signer Guide.
Disable data validation statistics collection
Select this option if you do not want to collect data validation statistics
for any validation transforms in this job. This option is not selected by
default.
Enable recovery Select this option to enable the recovery mode when this job runs.
Recover from last failed execution Select this option if an execution of this job has failed and you want to
enable the recovery mode.
Collect statistics for optimization Select this option to collect statistics that the optimizer will use to
choose an optimal cache type (in-memory or pageable). This option is
not selected by default.
See “Monitoring and tuning caches” in the Performance Optimization
Guide.
Collect statistics for monitoring
Select this option to display cache statistics in the Performance Monitor
in the Administrator. This option is not selected by default.
See “Monitoring and tuning cache types” in the Performance Optimiza-
tion Guide.
Use collected statistics
Select this option if you want the optimizer to use the cache statistics
collected on a previous execution of the job. The option is selected by
default.
For more information, see “Monitoring and tuning caches” in the Per-
formance Optimization Guide.
42 PUBLIC
Management Console Guide
Administrator
Option Description
Export Data Quality reports Generates and exports all specied job reports to the location specied
in the
Management Report Server Conguration node. By default,
the reports are exported to
<DS_COMMON_DIR>\DataQuality\reports\<repository\j
ob>.
Distribution level Select the level within a job that you want to distribute to multiple Job
Servers for processing:
• Job: The whole job will execute on an available Job Server.
• Data ow: Each data ow within the job can execute on an available
Job Server.
• Sub data ow: Each sub data ow (can be a separate transform or
function) within a data ow can execute on an available Job Server.
For more information, see “Using grid computing to distribute data ows
execution” in the Performance Optimization Guide.
5. Click Apply. Clicking Reset returns all elds to the last set of values applied.
Related Information
Data Validation Dashboard Reports [page 116]
Conguring the report server [page 24]
3.5.2.1.2 Activating or deactivating one or more job
schedules
In order for a job schedule to run, it must be active.
To change an existing job schedule, you must rst deactivate it, make the changes, then reactivate it.
1. Select Batch <repository> .
2. Click the Repository Schedules tab.
In order for a job schedule to run, it must be active.
The Repository Schedules tab lists all schedules for all jobs in the repository, and you can remove, activate,
or deactivate one or more schedules.
Alternately, click the Batch Job Conguration tab, then for a particular job, click the Schedules link. The
Batch Job Schedules tab lists all schedules for that particular job. Here you can add, remove, activate, or
deactivate one or more schedules:
The Job Server column listed next to each schedule indicates which Job Server will execute it.
If there is a server group icon in the Job Server column, this indicates the schedule will be executed by
the server group, and the schedule is stored on the indicated Job Server. To see which server group is
associated with the schedule, roll your cursor over the server group icon.
Management Console Guide
Administrator
PUBLIC 43

If there is CMS icon in the Job Server column, this indicates the job schedule is managed by a Central
Management Server.
Click the System Conguration names, if congured, to open a page that lists the datastore congurations
in that system conguration.
3. On either the Repository Schedules tab or the Batch Job Schedules tab, select one or more check boxes for
a schedule.
4. Click Activate (or Deactivate).
Related Information
Updating a job schedule [page 44]
3.5.2.1.3 Updating a job schedule
To edit a job schedule, you must rst deactivate it, make the changes, then reactivate it.
1. Select Batch <repository> .
2. Click the Batch Job Conguration tab.
3. Click the Schedules link for the desired job.
4. Click the schedule name to edit.
5. The Schedule Batch Job page displays.
6. If the schedule is currently active, deactivate it by clearing the Active check box and click Apply.
Note
You do not need to deactivate the schedule to update most of the job execution parameters at the
bottom of the page. Only the schedule-related parameters require deactivation in order to update
them.
7. Edit the schedule parameters as required.
8. To reactivate the schedule now, select the Active check box.
9. Click Apply.
The status bar at the top of the page conrms that the schedule has been created and/or activated.
Related Information
Adding a job schedule [page 41]
44
PUBLIC
Management Console Guide
Administrator

3.5.2.1.4 Removing a job schedule
1. Select Batch <repository> .
2. Click the Repository Schedules tab.
3. Select one or more check boxes for a schedule.
4. Click Remove.
The Administrator deletes the information about this job schedule.
3.5.2.1.5 Migration considerations
Changes made to the Job Server, such as an upgrade, do not aect schedules created in SAP Data Services as
long as:
• The new version of the software is installed in the same directory as the original version (Data Services
schedulers use a hard-coded path to the Job Server).
• The new installation uses the Job Server name and port from the previous installation. (This occurs
automatically when you install over the existing DSConfig.txt le.)
When you export a repository via an .atl le, jobs and their schedules (created in Data Services)
automatically export as well.
You can also import a repository .atl le including jobs and their associated schedules (previously created in
Data Services) back into Data Services.
Remember that once imported, you must reactivate job schedules to use them. If the job schedule uses a
password le, then reactivating it will automatically generate the password le.
Related Information
3.5.2.2 Scheduling jobs in SAP BusinessObjects Business
Intelligence platform
If you are using SAP BusinessObjects Business Intelligence platform and you want to manage your SAP Data
Services job schedules in that application, rst create a connection to a Central Management Server (CMS),
then congure the schedule to use that server.
Management Console Guide
Administrator
PUBLIC 45
3.5.2.2.1 Adding a CMS connection
1. Select Management CMS Connection .
2. Click Add.
3. On the CMS Connections page, enter the connection information.
The parameters in the top section are the same as when logging in to an SAP BusinessObjects Business
Intelligence platform Central Management Console (CMC) or InfoView. For details, refer to the SAP
BusinessObjects Business Intelligence platform InfoView User's Guide.
The parameters in the bottom section (User account credentials for executing the program) depend on
how the CMS server is set up. For details, refer to "Authentication and program objects" in the SAP
BusinessObjects Business Intelligence platform Administrator Guide.
Option
Description
System Type the computer name that hosts the Central Management Server
(CMS), a colon, and the port number.
User name Type the CMC/InfoView user name.
Password Type the CMC/InfoView user password.
Authentication Select the authentication type for the server
User account credentials for executing the program (optional)
Note
If you do not have the following option cleared in the Central Management Console, you will be required to enter
user account credentials in order for your schedules to run:
In the CMC, select Objects Objects Settings Program objects and clear the Use Impersonation option.
User name
The CMS computer might require operating system login credentials to run
the schedule. If so, type the user name (and password) for the applicable
account.
Password The CMS computer might require operating system login credentials to run
the schedule. If so, type the (user name and) password for the applicable
account.
4. Click Apply.
3.5.2.2.2 Creating a job schedule in SAP BusinessObjects
Business Intelligence platform
1. Select Batch <repository> .
2. Click the Repository Schedules tab.
3. Click the schedule name to congure.
4. If the schedule is currently active, deactivate it by clearing the Active check box and click Apply.
46
PUBLIC
Management Console Guide
Administrator
5. Edit the schedule parameters as necessary.
Note
Time-sensitive parameters reect the time zone of the computer where the Administrator is installed,
not where the CMS is installed.
6. Under the Select a scheduler section, select BOE scheduler.
7. From the drop-down list, select a CMS name.
8. To reactivate the schedule now, select the Active check box.
9. Click Apply.
The status bar at the top of the page conrms that the schedule has been created and/or activated.
If it doesn't already exist, SAP BusinessObjects Business Intelligence platform creates a folder called Data
Services and stores the schedule le and a parameters le (called schedulename.txt).
For a BOE schedule with the Use password le option selected, then SAP Data Services also creates a
password le in the Data Services folder (called repositoryname.txt)
Note
When you deactivate a schedule created on a CMS, SAP BusinessObjects Business Intelligence platform
deletes the object. Therefore, any changes made to the calendar will be lost.
3.5.2.2.3 Removing a CMS connection
1. Select Management CMS Connection .
2. Select the check box for the connection to remove from the administrator.
3. Click Remove.
3.5.2.2.4 Enabling the Wait option for BOE scheduler
The Wait option (-w) applies to a job schedule that is set up using the BOE scheduler only.
You can enable the Wait (-w) option manually in the Central Management Console or through the admin.xml
le in %DS_COMMON_DIR%/conf/. Enabling this option tells the Job Launcher to wait for a job to nish before it
returns a success status to the CMS.
To enable it in the Central Management Console, do the following:
1. Make sure the BOE scheduler is active. For more information, see Creating a job schedule in SAP
BusinessObjects Business Intelligence platform [page 46].
2. Go to Folders All Folders Data Services .
3. Right-click on Schedule and click Properties.
4. Expand Default Settings and click Program Parameters.
5. Add -w to the beginning of the contents in the Arguments eld.
Management Console Guide
Administrator
PUBLIC 47
6. Click Save & Close.
7. Reschedule or run the schedule and you will see that the -w option is being applied.
You can check the run history by going to
Properties History .
Enabling the option via the %DS_COMMON_DIR%/conf/admin.xml le will apply this option to all schedules
upon reactivation or to a new schedule creation.
1. Deactivate the schedule.
2. Stop Tomcat.
3. Stop EIMAPS.
4.
Go to %DS_COMMON_DIR%/conf/admin.xml and set <enable-job-wait-finish>TRUE</enable-
job-wait-finish>.
For example:
<status-interval>
<job-max-execution-time>60</job-max-execution-time>
<js-socket-timeout>30000</js-socket-timeout>
<job-monitor-timer-rate>5</job-monitor-timer-rate>
<enable-browse-files>FALSE</enable-browse-files>
<enable-job-wait-finish>TRUE</enable-job-wait-finish>
</status-interval>
If the flag is set to TRUE, the Job Launcher waits for the job to finish and
returns success to CMS.
If the flag is set to FALSE, there is no “-w” in the command line, the Job
Launcher returns immediately after it can launch the job.
5. Save the changes.
6. Restart Tomcat and EIMAPS.
7. Re-activate the schedule.
3.5.2.3 Using a third-party scheduler
When you schedule jobs using third-party software:
• The job initiates outside of SAP Data Services.
• The job runs from an executable batch le (or shell script for UNIX) exported from Data Services.
• When you execute a Data Services job using the exported execution command on a Unix/Linux
environment from a third-party scheduler or any other application, source the $LINK_DIR/bin/
al_env.sh le before calling the script that contains the command to start the job. This can be done
by adding following lines in the beginning of the script containing the execution command:
export LINK_DIR=</usr/sw/sap/dataservices>
. $LINK_DIR/bin/al_env.sh
Where /usr/sw/sap/dataservices is the directory where Data Services is installed.
Note
When a third-party scheduler invokes a job, the corresponding Job Server must be running.
48
PUBLIC
Management Console Guide
Administrator
Related Information
About the job launcher [page 51]
3.5.2.3.1 Executing a job with a third-party scheduler
1. Export the job's execution command to an executable batch le (.bat le for Windows or .sh le for UNIX
environments).
2. Ensure that the Data Services Service is running (for that job's Job Server) when the job begins to execute.
The Data Services Service automatically starts the Job Server when you restart the computer on which you
installed the Job Server.
• You can also verify whether a Job Server is running at any given time using the Designer. Log in to
the repository that contains your job and view the Designer's status bar to verify that the Job Server
connected to this repository is running.
• You can verify whether all Job Servers in a server group are running using the Administrator. In the
navigation tree select
Server Groups All Server Groups to view the status of server groups and
the Job Servers they contain.
3. Schedule the batch le from the third-party software.
Note
To stop an SAP Data Services job that is launched through AL_RWJobLauncher, press CTRL+C on
the application's keyboard. The job will be terminated and the termination status will be recorded.
AL_RWJobLauncher is used by the Data Services job scheduler and third party schedulers for jobs
exported from Data Services Management Console.
3.5.2.3.2 Exporting a job for scheduling
1. Select Batch <repository> .
2. Click the Batch Job Conguration tab.
3. For the batch job to congure, click the Export Execution Command link.
4. On the Export Execution Command page, enter the desired options for the batch job command le that you
want the Administrator to create:
Option
Description
File name The name of the batch le or script containing the job. The third-party
scheduler executes this le. The Administrator automatically appends the
appropriate extension:
• .sh for UNIX
• .bat for Windows
Management Console Guide
Administrator
PUBLIC 49
Option Description
System conguration Select the system conguration to use when executing this job. A system
conguration denes a set of datastore congurations, which dene the
datastore connections.
For more information, see “Creating and managing multiple datastore con-
gurations” in the Designer Guide.
If a system conguration is not specied, the software uses the default
datastore conguration for each datastore.
This option is a run-time property. This option is only available if there are
system congurations dened in the repository.
Job Server or server group
Select the Job Server or a server group to execute this schedule.
Enable auditing Select this option if you want to collect audit statistics for this specic job
execution. The option is selected by default.
For more information about auditing, see “Using Auditing” in the Designer
Guide.
Disable data validation statistics collec-
tion
Select this option if you do not want to collect data validation statistics for
any validation transforms in this job. The option is not selected by default.
Enable recovery Select this option to enable the automatic recovery feature. When ena-
bled, the software saves the results from completed steps and allows you
to resume failed jobs.
See “Automatically recovering jobs” in the Designer Guide for information
about the recovery options.
Recover from last failed execution
Select this option to resume a failed job. The software retrieves the re-
sults from any steps that were previously executed successfully and re-ex-
ecutes any other steps. This option is a run-time property. This option
is not available when a job has not yet been executed or when recovery
mode was disabled during the previous run.
Use password le
Select to create or update a password le that automatically updates job
schedules after changes in database or repository parameters. Deselect
the option to generate the batch le with a hard-coded repository user
name and password.
Note
This option is disabled if you have not set up a CMS connection.
Collect statistics for optimization
Select this option to collect statistics that the optimizer will use to choose
an optimal cache type (in-memory or pageable). This option is not se-
lected by default.
See “Monitoring and tuning caches” in the Performance Optimization
Guide.
Collect statistics for monitoring
Select this option to display cache statistics in the Performance Monitor in
the Administrator. The option is not selected by default.
For more information, see “Monitoring and tuning cache types” in the
Performance Optimization Guide.
50 PUBLIC
Management Console Guide
Administrator
Option Description
Use collected statistics Select this check box if you want the optimizer to use the cache statistics
collected on a previous execution of the job. The option is selected by
default.
See “Monitoring and tuning caches” in the Performance Optimization
Guide.
Export Data Quality reports
Generates and exports all specied job reports to the location specied in
the
Management Report Server Conguration node. By default,
the reports are exported to
<DS_COMMON_DIR>\DataQuality\reports\<repository\jo
b>.
Distribution level Select the level within a job that you want to distribute to multiple Job
Servers for processing:
• Job: The whole job will execute on one Job Server.
• Data ow: Each data ow within the job will execute on a separate Job
Server.
• Sub data ow: Each sub data ow (can be a separate transform or
function) within a data ow can execute on a separate Job Server.
For more information, see “Using grid computing to distribute data ows
execution” in the Performance Optimization Guide.
5. Click Export.
The Administrator creates command les <filename>.txt (the default for lename is the job name) and
a batch le for the job and writes them to the local <DS_COMMON_DIR>\log directory.
Note
You can relocate the password le from the <DS_COMMON_DIR>\conf directory, but you must edit the
<filename>.txt le so that it refers to the new location of the password le. Open the le in a text
editor and add the relative or absolute le path to the new location of the password le in the argument -R
"<repositoryname>.txt".
3.5.2.4 About the job launcher
SAP Data Services exports job execution command les as batch les on Windows or CRON les on UNIX.
These les pass parameters and call AL_RWJobLauncher. Then, AL_RWJobLauncher executes the job, sends
it to the appropriate Job Server, and waits for the job to complete.
Caution
Do not modify the exported le without assistance from SAP Business User Support.
Management Console Guide
Administrator
PUBLIC 51
Related Information
3.5.2.4.1 Job launcher ag values and arguments
The following table lists job launcher ags and their values.
Flag
Value
-w
The job launcher starts the job(s) and then waits before
passing back the job status. If -w is not specied, the
launcher exits immediately after starting a job.
-t
The time, in milliseconds, that the Job Server waits before
checking a job's status. This is a companion argument for
-w.
-s
Status or return code. 0 indicates successful completion,
non-zero indicates an error condition.
Combine -w, -t, and -s to execute the job, wait for com-
pletion, and return the status.
-C
Name of the engine command le (path to a le which con-
tains the Command line arguments to be sent to the engine).
-v Prints AL_RWJobLauncher version number.
-S
Lists the server group and Job Servers that it contains using
the following syntax:
"SvrGroupName;inet:JobSvr1Host:JobSvr1
Port;inet:JobSvr2Host:JobSvr2Port";
-R
The location and name of the password le. Replaces the
hard-coded repository connection values for -S, -N,
-U, -P.
-xCR
Generates and exports all specied job reports to the loca-
tion specied in the
Management Report Server
Conguration node. By default, the reports are exported to
<DS_COMMON_DIR>\DataQuality\reports\<rep
ository\job>.
In order to use this ag, you must disable the security for the
Export_DQReport operation in the
Administrator Web
Services Web Services Conguration tab.
There are two arguments that do not use ags:
• inet address: The host name and port number of the Job Server. The string must be in quotes. For
example:
"inet:HPSVR1:3500"
52
PUBLIC
Management Console Guide
Administrator

If you use a server group, inet addresses are automatically rewritten using the -S ag arguments. On
execution, the rst Job Server in the group checks with the others and the Job Server with the lightest load
executes the job.
• server log path: The fully qualied path to the location of the log les. The server log path must be in
quotes. The server log path argument does not appear on an exported batch job launch command le. It
appears only when Data Services generates a le for an active job schedule and stores it in the following
directory: <DS_COMMON_DIR>/Log/<JobServerName>/<RepositoryName>/<JobInstanceName> .
You cannot manually edit server log paths.
Related Information
3.5.2.4.2 Job launcher error codes
The job launcher also provides error codes to help debug potential problems. The error messages are:
Error number
Error message
180002 Network failure.
180003 The service that will run the schedule has not started.
180004
LINK_DIR is not dened.
180005 The trace message le could not be created.
180006 The error message le could not be created.
180007 The GUID could not be found.
The status cannot be returned.
180008 No command line arguments were found.
180009 Invalid command line syntax.
180010 Cannot open the command le.
3.5.3Downloading a debug package
Download a job debug package that includes the ATL and trace, monitor, and log les.
You can generate a debug package as you execute the job either from the Execution Properties window of
the Designer or in the Execution Options page of the Management Console Administrator. The debug package
includes the ATL and trace, monitor, and log les.
After you execute a job and create a debug package, you can download the package from its location on the
machine where the Job Server is installed.
Management Console Guide
Administrator
PUBLIC 53
1. Select Batch <repository> .
The Administrator opens the Batch Job Status page, which lists all of the jobs in the selected repository.
To view jobs in all repositories from this page, select Batch All Repositories . (The All Repositories
option appears under the Batch Job node if more than one repository is connected to the Administrator.)
2. To the right of the job that you want to download the package for, click Download Logs/Debug Package.
3. Open or save the .zip or .tar le.
Note
The download option is available even if the package has not been created or is not available. If the
package is not available on the Job Server, a package containing log les is downloaded and a message
alerts you.
You can send the generated .zip or .tar le to SAP customer support to help you troubleshoot execution-related
issues.
3.5.4Monitoring RFC trace logs
Get brief, verbose, or full trace logs for SAP RFC functions calls.
For a batch job, you can choose to generate a trace log for RFC function calls, and set the level of detail in the
trace log.
1. In Management Console, navigate to the
Administrator Management Datastore Datastore
Congurations
page.
Note
You can also set the trace level in the Design datastore editor.
2. For the RFC Trace Level option, select brief, verbose, or full. The default value is brief.
3. When executing the job, in the Execution Properties window of the Designer or in the Execution Options
page of the Managment Console Administrator, set the Trace RFC Function option value to Yes.
3.6 Real-Time Jobs
This section describes how to support real-time jobs using the Administrator.
Before conguring services, add real-time job repository and Access Server connections to the Administrator.
Related Information
Supporting real-time jobs [page 55]
54
PUBLIC
Management Console Guide
Administrator
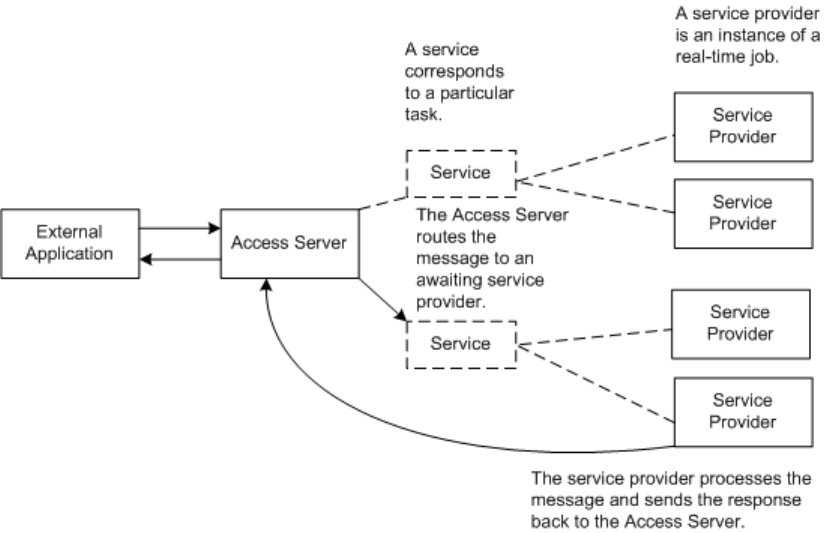
Conguring and monitoring real-time services [page 56]
Creating and monitoring client interfaces [page 65]
3.6.1Supporting real-time jobs
The Access Server manages real-time communication between SAP Data Services and external applications
(such as ERP or web applications). The Access Server determines how to process incoming and outgoing
messages based on the settings you choose for each real-time job in the Administrator.
In particular you use the Administrator to dene:
• Services: A service is a name that identies a task. The Access Server receives requests for a service. You
associate a service with a real-time job. The real-time job contains the real-time processing loop that can
process requests for this service and generate a response.
• Service providers: A service provider is the engine process that performs a service; the service provider
completes the tasks in a real-time job. A service provider is controlled by a Job Server. A Job Server can
control several service providers—each service provider is a unique process instance.
The Access Server uses services and service providers to process message requests. The following is an
example:
1. An external application sends a request to the Access Server.
2. The Access Server determines the appropriate service for the request.
3. The Access Server nds the associated service providers and dispatches the request to the next available
service provider.
4. Under the control of a Job Server, that service provider completes the processing for the request. A
dierent Job Server might control each service provider.
Management Console Guide
Administrator
PUBLIC 55
The Access Server manages the entire set of service providers, implementing conguration changes and telling
the appropriate Job Servers to start and stop service providers. At a prescribed interval, the Access Server
updates service providers, balancing loads and implementing conguration changes. To balance loads, the
Access Server monitors requests for services to ensure that no service provider is over-used or under-used.
Based on the number of requests for a service, the Access Server tells Job Servers to start or stop service
providers.
To support real-time jobs, you must:
• Create any number of Access Servers using the Server Manager utility, then add a connection to each local
or remote Access Server using the Management node in the Management Console Administrator.
• In the Real-Time node of the Administrator, create a service for each real-time job under each Access
Server's node.
• Create one or more service providers for each service.
• Start the services.
• Monitor the services.
Related Information
Creating services and service providers [page 57]
Starting and stopping services [page 60]
Monitoring services [page 63]
3.6.2Conguring and monitoring real-time services
To enable an Access Server to support real-time jobs, you must congure and monitor real-time services and
service providers for it.
• Congure services by specifying a real-time job and other operational parameters.
• Congure service providers by specifying a Job Server and indicating the maximum and minimum number
of instances that you want the Job Server to control. Each service provider is a unique process or instance
controlled by a Job Server.
Related Information
Creating services and service providers [page 57]
Starting and stopping services [page 60]
Updating service providers [page 63]
Monitoring services [page 63]
56
PUBLIC
Management Console Guide
Administrator
3.6.2.1 Creating services and service providers
In the Administrator, you create a service that processes requests for each real-time job. You also create the
service providers to perform that service. A service provider is the process that completes the tasks in a
real-time job.
3.6.2.1.1 Adding a service
1. Select Real-time <Access Server> Real-Time Services .
2. Click the Real-Time Services Conguration tab.
3. Click the Add button.
4. In the Service conguration section, enter information that describes this service.
Parameter Description
Service name A unique name for this service.
Job name Click Browse Jobs to view a list of all the real-time jobs available in the
repositories that you connected to the Administrator. Select a job name
to ll the service conguration form.
Repository name Logical name for a repository (used in the Administrator only).
Processing retry count max The number of times that the Access Server attempts to restart a job
that fails to respond.
Enable job tracing A ag that indicates whether the service will write trace messages.
Select Enable for the job to write trace messages.
Startup timeout The maximum time that the Access Server waits for the service to regis-
ter after startup (in seconds).
Queuing timeout The maximum time that the Access Server waits for the service to proc-
ess the request (in seconds).
Processing timeout The maximum time that the Access Server waits for a response from the
service (in seconds).
Recycle request count max The number of requests that the Access Server sends to a given real-
time service before automatically recycling the ow.
Management Console Guide
Administrator
PUBLIC 57

Parameter Description
System Conguration If congured, select the system conguration to use when executing this
service.
This option is available only if there are system congurations dened in
the repository. For more information, see “Parameters” in the Reference
Guide.
Enable A ag that indicates whether the Access Server attempts to automati-
cally start this service when the Access Server restarts.
Select Enable if you want to automatically start this service when the
Access Server restarts. This is the default setting.
If you clear the Enable option, when the Access Server restarts, it does
not automatically start this service. If you manually attempt to start
a disabled service, an error message appears in the Service's Status
column.
5. Add one or more job servers to start this service provider. In the Service provider section, click the Add
button to insert a new Job Server.
6. In the Job Server list, select a Job Server to control the service provider. Job Servers are dened by host
name and port number.
You may not select a Job Server more than one time.
7. In the Min instances and Max instances elds, enter a minimum and a maximum number of service
providers that you want this Job Server to control for this service.
8. The job server is enabled by default. To congure but not start the service providers controlled by this Job
Server, select the checkbox next to the Job Server, and click the Disable button.
9. To add a substitution parameter, click the Add Overridden Parameter link.
10. From the drop-down list, select the substitution parameter to override, and enter the override value.
11. Click Apply.
The Administrator updates the conguration parameters for this service. These conguration parameters
apply to all providers of this service.
When you are ready for the Access Server to process requests, start the service.
Related Information
Service startup behavior [page 73]
High-trac behavior [page 74]
Response time controls [page 75]
Starting a service [page 60]
58
PUBLIC
Management Console Guide
Administrator

3.6.2.1.2 Adding or changing a service provider for a
service
1. Select Real-time <Access Server> Real-Time Services .
2. Click the Real-Time Services Conguration tab.
3. Click the name of the service for which you want to change the service provider.
4. In the Service provider section, click the Add button.
5. In the Job Server list, select a Job Server to control the service provider. Job Servers are dened by host
name and port number.
You may not select a Job Server more than one time.
6. In the Min instances and Max instances elds, enter a minimum and a maximum number of service
provider instances that you want this Job Server to control.
7. The job server is enabled by default. To congure but not start the service providers controlled by this Job
Server, select the checkbox next to the Job Server, and click the Disable button.
8. Click the Apply button.
If the service has already started, the Access Server adds this service provider to the available list when it
next updates the service providers.
If the service has not yet started, the Access Server starts enabled service providers when the service
starts.
Related Information
Updating service providers [page 63]
3.6.2.1.3 Setting the service provider update interval
The Provider update interval for services option sets the time interval, in seconds, between service provider
updates. Valid values range from 10 to 120 seconds. The default is 30 seconds. When updating service
providers, the Access Server balances loads and implements any conguration changes you have applied to a
service provider.
If the provider update interval is too small, performance can decrease because the Access Server must
frequently check for events and collect statistics. It's recommended that you set the Provider update interval
for services to 30 seconds. On systems with heavy loads and production systems with fewer start and stop
events, you can increase the interval.
1. Select Real-Time <Access Server> Status .
This is the time interval, in seconds, between service provider updates. Valid values range from 10 to 120
seconds. The default is 30 seconds. When updating service providers, the Access Server balances loads
and implements any conguration changes you have applied to a service provider.
If the provider update interval is too small, performance can decrease because the Access Server must
frequently check for events and collect statistics. It's recommended that you set the Provider update
Management Console Guide
Administrator
PUBLIC 59

interval for services option to 30 seconds. On systems with heavy loads and production systems with fewer
start and stop events, you can increase the interval.
2. Click the Access Server Conguration tab.
3. Enter the desired Provider update interval for services.
Related Information
Updating service providers [page 63]
3.6.2.2 Starting and stopping services
After you create the required services and service providers, you can start them. After you start a service or
service provider, SAP Data Services ensures that it continues to run. You can also use the Administrator to stop
a service (such as for maintenance). Similarly, use the Administrator to remove, enable, or disable services and
service providers.
3.6.2.2.1 Starting a service
1. Select
Real-Time <Access Server> Real-Time Services .
2. In the Real-Time Services Status tab, select the check box next to the service or services that you want to
start.
3. Click Start.
The Access Server starts the minimum number of service providers for this service.
3.6.2.2.2 Enabling a service
1. Select Real-Time <Access Server> Real-Time Services .
2. Click the Real-Time Services Conguration tab. The table of services displays the status in the Enabled
column.
3. Select the check box next to the service or services that you want to enable.
4. Click the Enable button.
The Access Server enables the minimum number of service providers for this service, and the Enabled
column displays Yes.
This change does not start the service. Instead, the service is enabled the next time that the Access Server
attempts to start the service, such as after the Access Server restarts.
60
PUBLIC
Management Console Guide
Administrator
3.6.2.2.3 Disabling a service
1. Select
Real-Time <Access Server> Real-Time Services .
2. Click the Real-Time Services Conguration tab. The table of services displays the status in the Enabled
column.
3. Select the check box next to the service or services that you want to disable.
4. Click the Disable button.
This change does not have an immediate eect on the service. Instead, the service is disabled the next time
that the Access Server attempts to start the service, such as after the Access Server restarts. If you attempt to
start a disabled real-time service, an error message displays in the service's status.
3.6.2.2.4 Aborting or shutting down a service
1. Select
Real-Time <Access Server> Real-Time Services .
2. In the Real-Time Services Status tab, select the check box next to the service or services that you want to
abort or shut down.
Option
Description
Abort Shuts down all service providers for this service without waiting for them to complete processing. The
Access Server responds to current and new requests for this service with an error.
Shutdown Shuts down all service providers for this service after they complete processing any current requests. The
Access Server responds to new requests for this service with an error.
3. Click Abort or Shutdown.
Related Information
Starting a service [page 60]
Disabling a service [page 61]
3.6.2.2.5 Removing a service
1. Select Real-Time <Access Server> Real-Time Services .
2. Click the Real-Time Services Conguration tab.
3. Select the check box next to the service or services that you want to remove.
4. Click Remove.
The Administrator stops processing this service. The Access Server shuts down each of the service
providers dened for this service and removes the service from the list.
Management Console Guide
Administrator
PUBLIC 61
3.6.2.2.6 Removing, enabling, or disabling a service
provider
1. Select Real-Time <Access Server> Real-Time Services .
2. Click the Real-Time Services Conguration tab.
3. If you want to change a Job Service's service providers, select the check box next to a Job Server.
4. Click one of the buttons below the list of Job Servers to perform the appropriate action:
Option
Description
Enable Start the service providers controlled by the selected Job Servers. Each Job Server starts the minimum
number of service providers. The Access Server now includes the selected Job Servers in the set of available
service providers. If a Job Server is already enabled, this choice has no eect.
Remove
Discontinue using the service providers controlled by the selected Job Servers to process requests for this
service. The Access Server shuts down the service providers and removes the Job Server from the list.
5. Shut down the service providers controlled by the selected Job Servers. The Access Server nishes
processing any current requests and no longer includes the selected Job Servers in the set of service
providers available to process requests for this service.
The Administrator completes this action during the next service provider update.
Related Information
Updating service providers [page 63]
3.6.2.2.7 Restarting a service provider
1. Select Real-Time <Access Server> Real-Time Services .
2. Select the service that you want to restart the service provider for. The Service Provider Status page opens.
Note
Select Restart only if the service providers controlled by this Job Server are currently enabled. To verify
the status, select the Real-Time Services Conguration tab and view service provider status in the Job
Servers for Service section.
3. Click Restart.
The Administrator completes this action during the next service provider update. The Administrator shuts
down any service providers controlled by the selected Job Servers and immediately restarts the minimum
number of service providers. For example, you might restart a service provider after a computer running its
Job Server reboots following a crash.
62
PUBLIC
Management Console Guide
Administrator
3.6.2.3 Updating service providers
At a specied provider update interval, the Access Server updates service providers. When updating service
providers, the Access Server balances the work load—starting or stopping service providers as necessary—and
implements other events that you initiated since the last update.
When balancing the work load, the Access Server checks the number of requests in a service queue and the
minimum idle time for a service. If the number of requests in a service queue is greater than the number of
service providers started, the Access Server tries to start a new service provider. Conversely, if the minimum
idle time for a service is more than 10 minutes, the Access Server will shut down a service provider. However,
the number of service providers cannot exceed the maximum number of instances congured nor can it be less
than the minimum number of instances congured.
When implementing events that you initiated, the Access Server does the following:
• Enables service providers
• Disables service providers
• Recongures service providers
• Restarts service providers
• Adds service providers
• Removes service providers
Related Information
Setting the service provider update interval [page 59]
3.6.2.4 Monitoring services
Use the Administrator to monitor services. With the Administrator you can do the following:
• View service status—From the Access Server Status page or the Real-Time Services Status page, view
whether a service is running or not. Based on this information, you can begin troubleshooting problems.
• View service provider status—From the Real-Time Services Status page, click a service name to view:
• The statistics for a particular service.
• Detailed statistics about each service provider. Using this information, you can monitor and evaluate
system performance.
• The status of all service providers in that service.
• View logs—The Access Server node provides access to current and historical service provider trace and
error logs.
Related Information
Management Console Guide
Administrator
PUBLIC 63
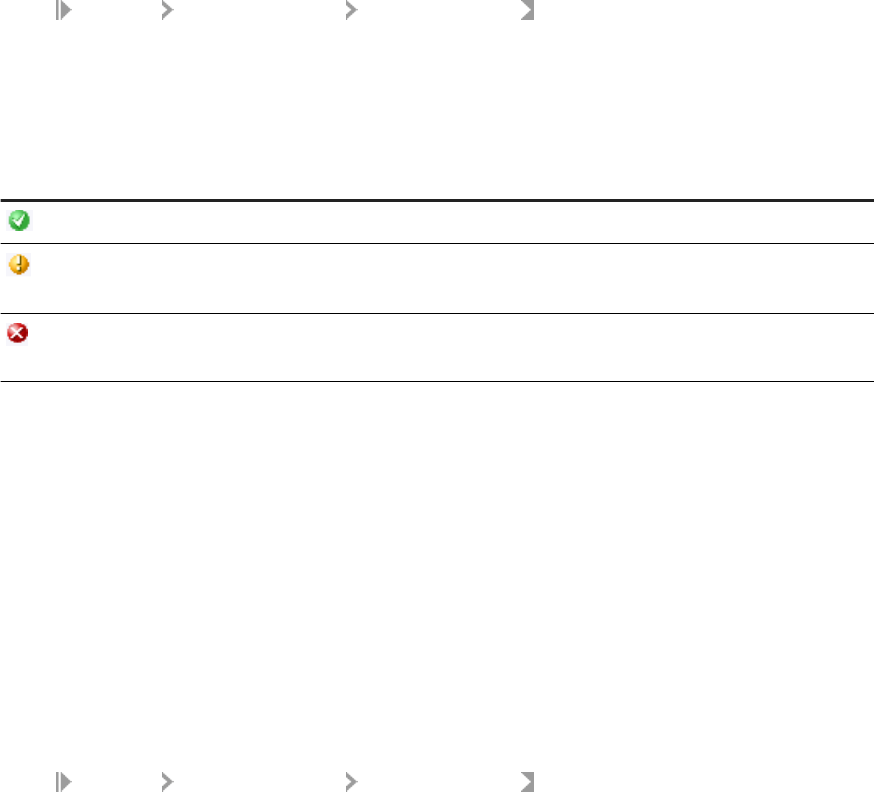
Viewing the status of services [page 64]
Service statistics [page 76]
Service provider statistics [page 77]
Viewing the statistics for a service provider [page 64]
Viewing the logs for a service provider [page 92]
3.6.2.4.1 Viewing the status of services
1. Select Real-Time <Access Server> Real-Time Services .
The Administrator opens the Real-Time Services Status page. For each service, this page shows the overall
status and statistics about the number of available service providers and the number of started service
providers.
2. Verify that the services are working.
Indicator
Description
A green icon indicates that the service is operating properly.
A yellow icon indicates that some aspect of the service is not working, and that the
Access Server is attempting to reestablish the service using error handling.
A red icon indicates that one or more aspects of the service is not working, and the
Access Server cannot reestablish the service.
3. If a service shows a yellow or red status, click the service name to see more information.
Related Information
Service statistics [page 76]
Troubleshooting the Administrator [page 89]
3.6.2.4.2 Viewing the statistics for a service provider
1. Select
Real-Time <Access Server> Real-Time Services .
2. Click the name of the service.
This page shows the overall statistics for the service, the service providers for the service (listed by
Job Server), and the status of each service provider. Start a service to see its service provider status
information.
3. Under Service Provider Status Information, click the Process ID of a service provider to view its statistics.
The Administrator opens the Service Provider Status page.
Under Service Provider Status Information, the page shows the statistics for this service provider.
64
PUBLIC
Management Console Guide
Administrator

Related Information
Service provider statistics [page 77]
Viewing the logs for a service provider [page 92]
3.6.3Creating and monitoring client interfaces
A client is an external application that communicates with SAP Data Services through the Access Server.
There are two types of client interfaces in the Administrator:
• Remote Function Call (RFC) clients
• Message broker clients
Congure RFC clients in the Administrator for real-time jobs that use SAP IDocs. To support these jobs, create
an RFC client interface and attach IDoc conguration information to it.
Data Services creates message broker client interfaces when communication occurs between the Access
Server and an external application that uses Data Services message client libraries. To monitor message
statistics, view the message broker clients of each Access Server as needed.
This section describes conguration and monitoring for each type of client.
For more information about using the Message Client library, see the SAP Data Services Integrator Guide.
3.6.3.1 RFC clients
You can congure IDoc message sources in the Administrator as well as in the Designer. You can congure
other IDoc sources and targets using the Designer.
Note
Using the Administrator, create a service for your real-time job that contains an IDoc as a message source
before you congure an RFC client.
An RFC client uses the SAP RFC protocol to communicate with the Access Server. An RFC client requires
connection information so that an Access Server can register to receive IDocs from an SAP application server.
An RFC client can process one or more IDoc types. An RFC client species which service will process a
particular IDoc type and whether or not the RFC client connection can process an IDoc type in parallel.
The process of creating an RFC client interface for IDocs has two parts:
• Adding an RFC client
• Adding IDoc congurations to an existing RFC client
Congure one RFC client per Access Server. This means that you can process IDocs from one instance of SAP.
To process IDocs from more than one instance, congure more than one Access Server.
Management Console Guide
Administrator
PUBLIC 65
Note
SAP application function modules are responsible for IDoc processing. In SAP Data Services, the RFC client
might fail if multiple IDocs are sent from SAP and you previously set the SAP packet size to 1. Therefore:
• Do not enable the option of immediate IDoc dispatch in SAP unless the volume of produced IDocs is very
low (no more than one IDoc per minute).
• For batch processing of IDocs, the packet size should never be smaller than 5 or larger than 1000. The
following table provides estimates for this parameter:
IDoc Processing Volume
IDocs per day Packet size
Light 1 to 300 5
Medium 301 to 1000 20
Heavy 1001 to 5000 80
Very Heavy more than 5000 800
For more information, see the SAP Data Services Supplement for SAP.
3.6.3.1.1 Adding an RFC client
1. Select
Real-time <Access Server> Client Interfaces .
2. Click the Client Interface Conguration tab.
3. Click Add.
The Administrator opens the RFC Client Conguration page.
4. Enter the client conguration information.
Field
Description
RFC program ID The registered server program ID from transaction SM59.
User name The user name through which SAP Data Services connects to this SAP appli-
cation server.
Password The password for the user account through which SAP Data Services con-
nects to this SAP application server.
SAP application server name The domain name or IP address of the computer where the SAP application
server is running.
Client number The SAP application client number.
System number The SAP application system number.
SAP gateway host name The domain name or IP address of the computer where the SAP RFC gateway
is located.
SAP gateway service name The TCP/IP service name for the SAP application server gateway. Typically,
this value is SAPGW and the system number. It can also be a service number,
for example 3301.
66 PUBLIC
Management Console Guide
Administrator
Field Description
Use sapnwrfc.ini Select to use an sapnwrfc.ini le, which overrides the datastore settings asso-
ciated with this RFC client. The default location to place the sapnwrfc.ini le is
in the current directory of the process being executed (%LINK_DIR/bin).
Note
The Access Server RFC Client is not able to connect to a message server/
logon group.
Destination name
If using an sapnwrfc.ini le, enter the destination name to reference.
RFC trace level Sets the level of detail in the RFC function trace log to brief, verbose, or full, or
o.
5. Click Apply.
For more information, see the SAP Data Services Supplement for SAP.
Related Information
3.6.3.2 Adding IDoc congurations to an RFC client
After you create an RFC client, you can list the IDoc types that you want to receive.
3.6.3.2.1 Adding an IDoc conguration to an RFC client
1. Select Real-time <Access Server> Client Interfaces .
2. Click the Client Interface Conguration tab.
3. Click the name of an existing RFC client interface.
The RFC Client Conguration page opens.
4. Click the Supported IDocs link.
5. Click Add.
6. Enter IDoc information:
a. In the IDoc Type box, enter the IDoc type that this SAP application server will send to the Access
Server.
b. In the Service Name box, enter the name of the service that will process this IDoc.
The service identies the job that processes this IDoc.
c. If you want the Access Server to read IDocs (of this type and from the specied SAP source) in parallel,
check the Parallel Processing check box.
Management Console Guide
Administrator
PUBLIC 67
Real-time services that contain an IDoc message source can be processed one at a time or in parallel.
The Parallel Processing option allows you to increase the number of IDoc source messages processed
per minute for the IDoc type specied. This option is disabled by default. The option allows the Access
Server to send an IDoc to a service queue (where it waits for a service provider) and continue with the
next IDoc without waiting for reply. The maximum number of outstanding IDoc requests in the queue is
the number of IDocs received or four, whichever is smaller.
Note
Where a strict IDoc processing sequence is required, do not use the Parallel Processing option.
7. Click Apply.
8. (Optional) Select
Real-time <Access Server> Client Interfaces .
9. From the Client Interface Status page, select the check box next to the new RFC client and click Start.
The Administrator starts the RFC client. A green indicator signies that the client is running. Detailed
status information is provided in the Status column.
Related Information
Conguring and monitoring real-time services [page 56]
3.6.3.2.2 Closing connections to an RFC client interface
1. Select Real-time <Access Server> Client Interfaces .
2. Select the check box next to the RFC client you want to disconnect.
If you choose Shut down, the Access Server allows the clients to nish processing any active requests
before closing the connection. The Access Server responds with an error to any new requests that arrive
during that interval.
If you choose Abort, the Access Server closes the connection to the client without responding to requests
currently being processed.
3. Click Shut down or Abort.
3.6.3.3 Message Broker clients
A Message Broker client uses an XML message to communicate with an Access Server.
Message Broker clients include:
• External applications
• Adapters
• Service providers
68
PUBLIC
Management Console Guide
Administrator
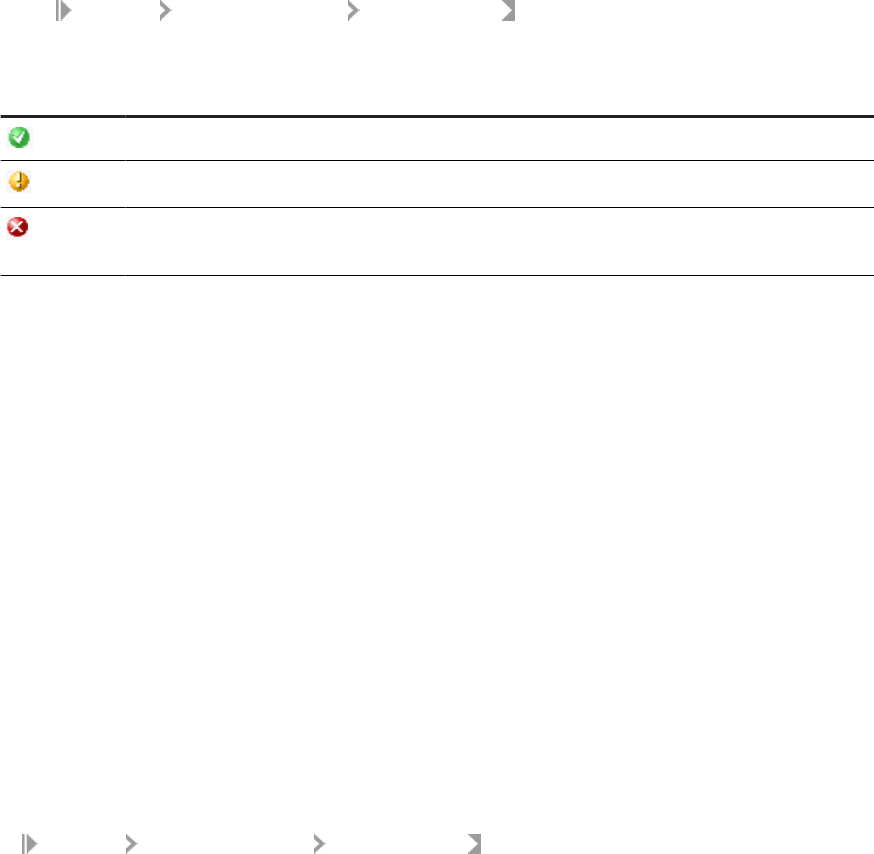
Use the Administrator to monitor Message Broker clients.
3.6.3.4 Monitoring client interfaces
From the Client Interface Status page, you can view the overall status of all client connections.
3.6.3.4.1 Viewing the overall status of client connections
1. Select
Real-time <Access Server> Client Interfaces .
2. Verify that the RFC client connections are working.
Indicator
Description
A green icon indicates that each client of this type has an open connection with Access Server.
A yellow icon indicates that at least one client of this type is disconnecting.
A red icon indicates that the Access Server could not reserve the specied port to listen for client
requests.
If an RFC client interface has a red status:
a. View the Status column and click the name of the client to view statistics about the particular client
connection with a problem.
b. If you want to restart, abort, or shut down a client interface, click the Back button in the navigation bar.
The Administrator returns to the Client Interface Status page.
c. Click Start, Abort, or Shutdown.
Related Information
Finding problems [page 90]
3.6.3.4.2 Monitoring Message Broker clients
Select Real-time <Access Server> Client Interfaces .
Under Message Broker Clients, this page lists each message broker client that has registered with the Access
Server along with statistics for that client.
Management Console Guide
Administrator
PUBLIC 69
Note
The rst client in this list is the Administrator. You registered with the Access Server when you added
connection information to the Administrator.
Message broker client interface information includes:
Item
Description
Name The name of the client.
Time Connected The total time that this client has been connected to the Access Server.
Last Message Received The length of time since the Access Server has received a message from
this client.
Last Message Sent The length of time since the Access Server has sent a message to this
client.
Received Messages The number of messages that the Access Server has received from this
client.
Sent Messages The number of messages that the Access Server has sent to this client.
3.7 Real-Time Performance
About this section
This section discusses the Access Server parameters, statistics for services and service providers, and how to
tune the performance of services and service providers.
Related Information
Conguring Access Server output [page 70]
Service conguration parameters [page 73]
Service statistics [page 76]
Service provider statistics [page 77]
Using statistics and service parameters [page 78]
3.7.1Conguring Access Server output
You can congure the Access Server to control its operation and output such as sending specic event
information to its trace log.
70
PUBLIC
Management Console Guide
Administrator
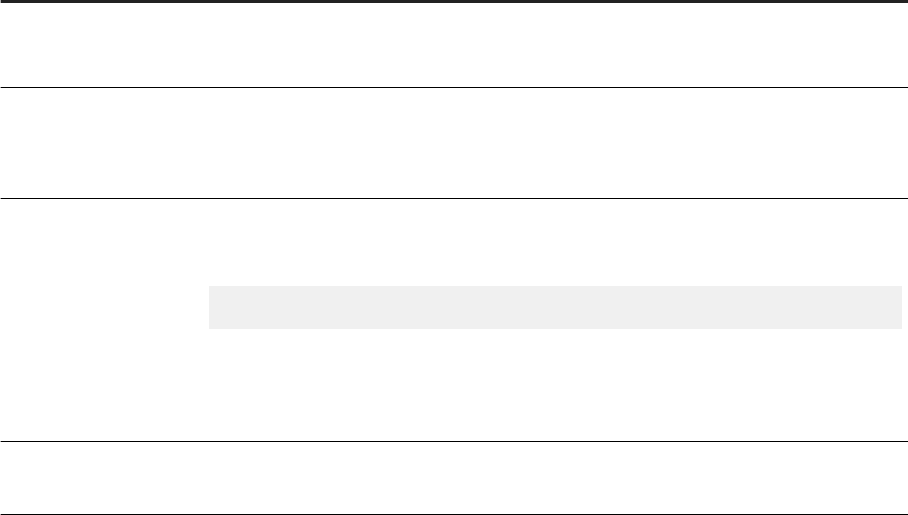
SAP Data Services installation includes a server conguration utility called the Server Manager. The Server
Manager allows you to view and change the following Access Server information:
Option Description
Directory The location of the conguration and log les for this instance of the Access Server.
Do not change this value after the initial conguration.
Communication Port The port on this computer the Access Server uses to communicate with the Administrator and
through which you can add additional conguration information to an Access Server.
Make sure that this port number is not used by another application on this computer.
Parameters Command-line parameters used by the Data Services Service to start this Access Server.
For development, consider including the following parameters:
-P -T16
where -P indicates that trace messages are recorded, and -T16 indicates that the Access
Server collects events for services and service providers.
For parameter descriptions, see "Conguring an Access Server" .
Enable Access Server An option to control the automatic start of the Access Server when the Data Services Service
starts.
Related Information
Conguring an Access Server [page 71]
3.7.1.1 Conguring an Access Server
1. Open Data Services Server Manager.
2. Navigate to the Access Server tab and click on Conguration Editor.
The Access Server Conguration Editor opens.
3. Click Add to congure a new Access Server or select an existing Access Server, then click Edit to change
the conguration for that Access Server.
4. Make the appropriate changes in the Access Server Properties window.
5. Click OK to return to the Access Server Conguration Editor.
6. Click OK to return to the Server Manager.
7. Click Restart to stop and start the Data Services Service with the new Access Server conguration.
The following parameters are available to control the operation and output of an Access Server:
Management Console Guide
Administrator
PUBLIC 71
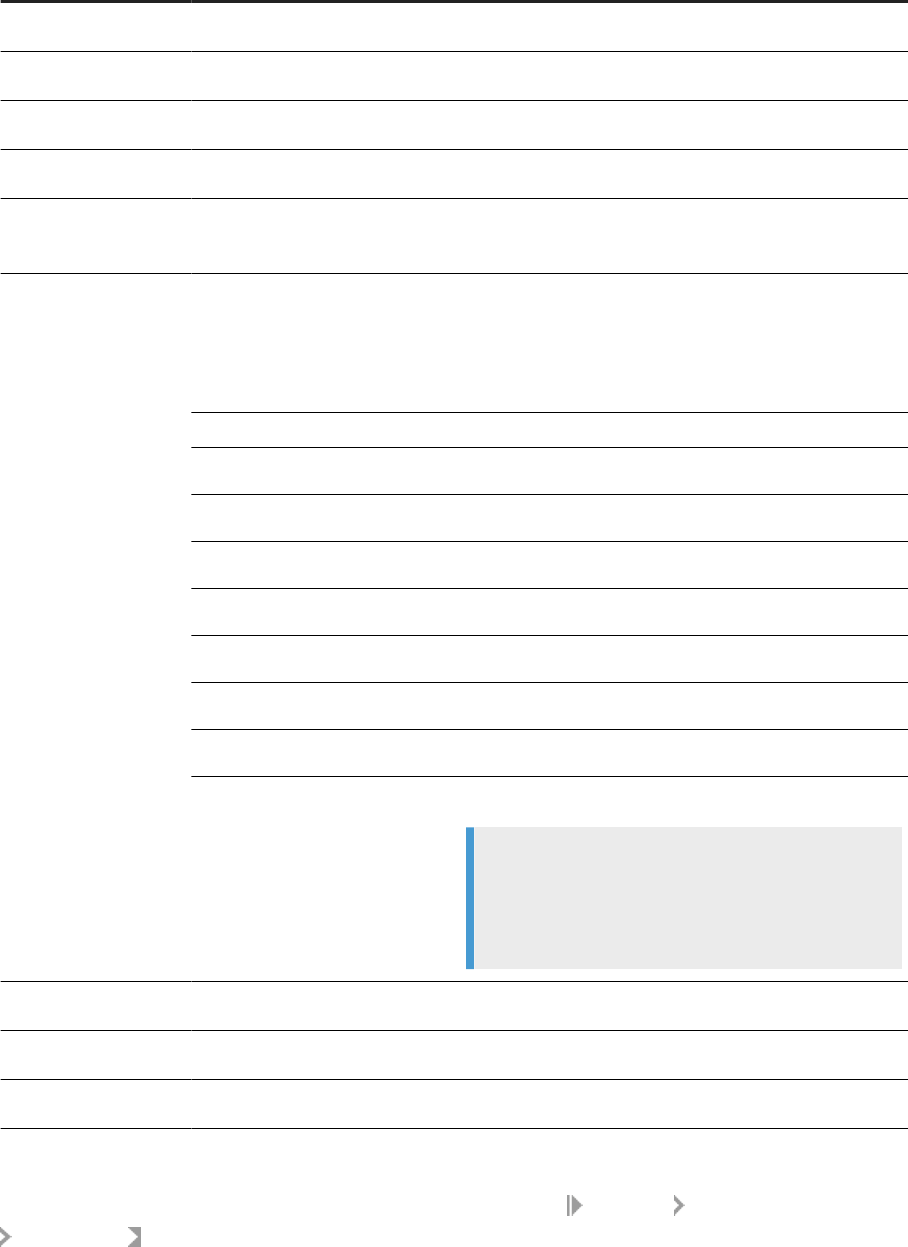
Parameter Description
-A Species the communication port for an Access Server. The default value is -A4000.
-C
Disables display output.
-H
Prints the parameter list to the console.
-P
Enables trace messages to the console and log.
-R
<root_directory>
Indicates the location of the Access Server directory.
-T <value>
Determines the type of tracing information displayed in the console and the Access Server log.
You can use any value or any combination of values.
For example, to enable tracing for both system-level and service-level operations, include the
value 17 (16 for service plus 1 for system) after the -T parameter.
Value Tracing information displayed
1 system
2 real-time service ow
4 client
8 transaction
16 service
64 administration
128 all requests
256 failed requests
Note
If you use –T 384, which is 128 (all requests) plus
256 (failed requests), the all requests tracing will take
precedence.
-V
Displays the version number of the Access Server.
-VC
Displays communication protocol and version number.
-X
Validates the Access Server conguration without launching the Access Server.
The -A and -R parameters can also be set using the Server Manager.
The -P and -T parameters can be set using the Administrator. Select Real-Time <Access Server>
Logs-Current , and click the Access Server Log Conguration tab.
72
PUBLIC
Management Console Guide
Administrator
3.7.2Service conguration parameters
Each service contains conguration parameters that control how the Access Server dispatches requests to
the assigned real-time job. These parameters determine how the system handles errors that occur during
operation.
Often, requirements during development dier from requirements during production. Therefore, the values of
your conguration parameters dier during development and production. To ensure that the system works as
expected, test the values before committing the Access Server conguration to production use.
Parameters control dierent categories of Access Server operation:
• Service startup behavior
• High-trac behavior
• Response time controls
Related Information
Adding a service [page 57]
Service startup behavior [page 73]
High-trac behavior [page 74]
Response time controls [page 75]
3.7.2.1 Service startup behavior
Use two parameters to congure how the Access Server starts service providers associated with a particular
service:
• Startup timeout—The maximum time that the Access Server waits for a ow (service and its providers) to
register after startup.
• Recycle request count max—The number of requests that the Access Server sends to a given ow before
automatically recycling.
When the Access Server starts, it immediately starts the service providers for each service. If you want the
Access Server to start more than one instance of a service to process a particular type of message, you must
dene more than one service provider for the service.
The Job Servers launch the jobs, which in turn initiate their corresponding real-time services. The rst
operation of each real-time service is to register with the Access Server.
If an error occurs and a real-time service fails to register, the Access Server instructs the Job Server to restart
the job. The Access Server waits the length of time that you congure as the startup timeout before instructing
the Job Server to start the job again. The startup timeout is in seconds. The Access Server continues to
instruct the Job Server to restart the job until the real-time service registers.
Management Console Guide
Administrator
PUBLIC 73
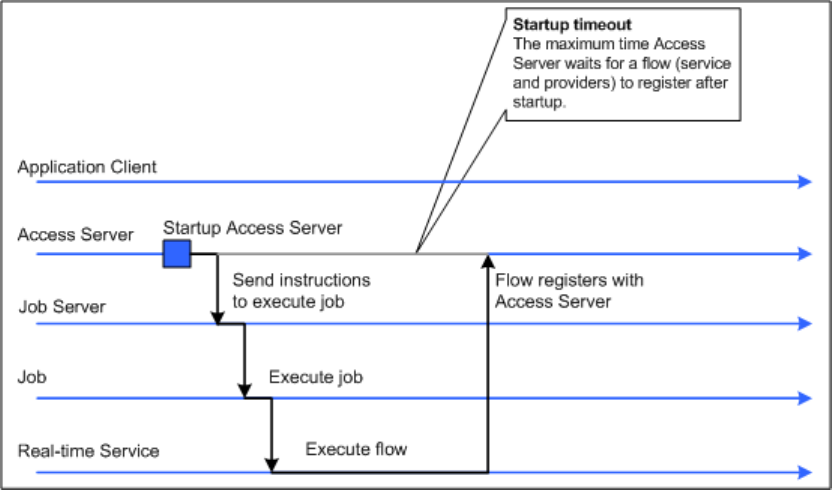
You can also control how many requests a particular service provider processes. After a provider processes the
number of requests specied by the Recycle request count max parameter, the Access Server automatically
recycles the service provider—that is, the Access Server automatically stops the current instance of the
real-time service and starts a new instance of that service. Setting this parameter to a higher value increases
the time that the service provider is available to accept requests for processing. Setting this parameter to a
lower value refreshes any data cached in the real-time service more often.
3.7.2.2 High-trac behavior
Use the Queuing Timeout parameter to specify the maximum amount of time the client application must wait
for a request to be processed.
If the number of requests the Access Server receives for a particular service exceeds the number of registered
service providers that can process those requests, the Access Server queues the requests in the order they
are received. When a service provider completes processing a request and responds to the Access Server, the
Access Server dispatches the next request in the queue for that service to the open service provider.
If there are many requests and the queue causes requests to exceed the queuing timeout, the Access Server
removes the oldest request from the queue and responds to the client with an error indicating that the request
failed. You can use the queuing timeout to ensure that the client receives a timely response, even during
high-trac periods.
The queuing timeout is in seconds.
74
PUBLIC
Management Console Guide
Administrator
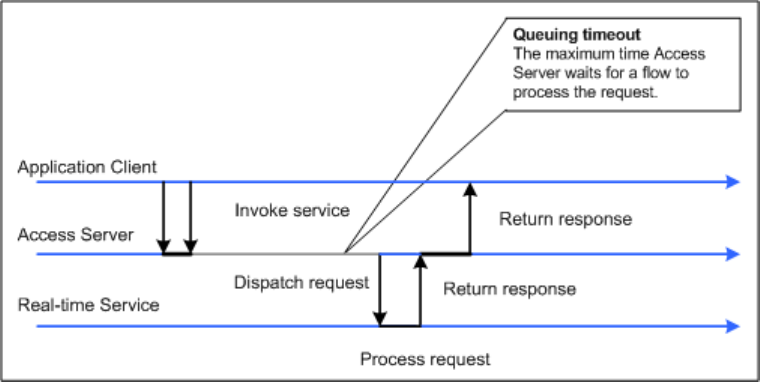
A service experiences high trac when the available resources cannot process the received requests eciently.
High trac occurs when the time messages wait to be processed exceeds the time required to process them.
Related Information
Using statistics and service parameters [page 78]
3.7.2.3 Response time controls
Use two parameters to congure how long the Access Server waits for responses from service providers for a
particular service:
• Processing timeout
• Processing retry count max
After the Access Server sends a request to a service provider to process, the Access Server waits for the
response. If the response does not arrive within the specied processing timeout, the Access Server sends the
request to another waiting service provider. The Processing timeout is in seconds.
If the rst attempt fails, the Access Server will attempt to process the request as many times as you specify in
the Processing retry count max parameter.
Management Console Guide
Administrator
PUBLIC 75
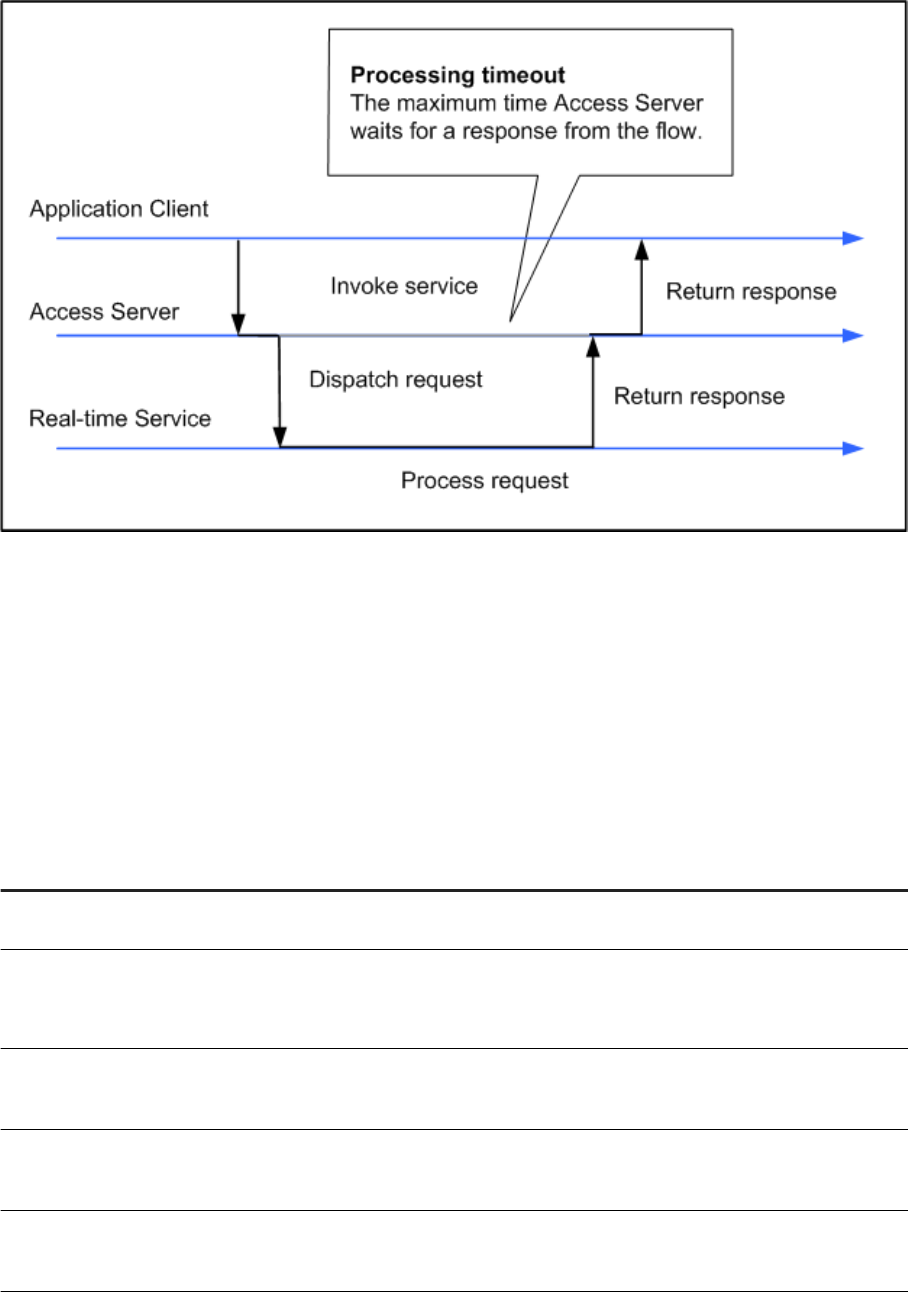
If Processing retry count max is set to zero, the maximum response time is equal to the queuing timeout plus
the processing timeout.
3.7.3Service statistics
The Real-Time Services Status page for a particular service shows overall statistics.
Statistic
Description
Number of processed requests The number of requests for this service from any client that the Access Server
received and responded to since the last time the Access Server started.
Number of requests in queue The number of messages that the Access Server has received from a client for
this service but has not sent to a service provider for processing.
This value reects the current state of the Access Server.
Maximum queuing time (milliseconds) The maximum time any request for this service waited after the Access Server
received the message and before the Access Server sent the request to a service
provider for processing.
Average queuing time (milliseconds) The average time that requests for this service waited after the Access Server
received the request and before the Access Server sent the request to a service
provider for processing.
Queuing timeout The number of requests to which the Access Server replied to the client with
an error indicating that there was no service provider available to process the
request.
76 PUBLIC
Management Console Guide
Administrator
Statistic Description
Maximum processing time (millisec-
onds)
The maximum time required to process a request for this service. It is the dier-
ence between the time the Access Server sent the request to a service provider
and the time that the Access Server responded to the client. The processing time
does not include time the request spent in a queue waiting to be sent to a service
provider.
Average processing time (milliseconds)
The average time required to process a request for this service. It is the dierence
between the time the Access Server sent the request to a service provider and
the time that the Access Server responded to the client. The processing time
does not include time the request spent in a queue waiting to be sent to a service
provider.
Processing timeouts
The number of requests that the Access Server sent to a service provider and did
not receive a response before exceeding the processing timeout. These requests
are either successfully processed by another service provider, or if they are left
unprocessed beyond the time indicated by the queuing timeout parameter, the
Access Server returns an error to the client.
3.7.4Service provider statistics
The Service Provider Status page shows the statistics for an instance of a real-time service.
When SAP Data Services measures a statistic "from the start," the value does not restart when the Access
Server restarts the service provider. The value restarts when the Access Server restarts.
When the software measures a statistic "for the current service provider," the value restarts when the Access
Server restarts the service provider, either due to error or when the service provider reaches the maximum
number of requests dened for the service.
Statistic
Description
Max processing time (milliseconds) The longest time it took between when the Access Server sent a message to this
service provider and when the service provider returned a response.
Average processing time (milliseconds)
The average time it took between when the Access Server sent a message to this
service provider and when the service provider returned a response.
If you are running more than one service provider for this service, compare this
statistic with the same statistic from the other instances. If this instance is sig-
nicantly dierent, look for processing constraints on the computer where this
instance runs.
Processed requests (for the current
service provider)
The number of requests that the Access Server sent to this service provider to
which the service provider responded.
Processed requests (since start) The number of requests that the Access Server sent to this service provider to
which the service provider responded.
Error replies received from the start The number of requests that the Access Server sent to this service provider to
which the service provider responded with an error.
Communication errors encountered
from the start
The number times that the communication link between the Access Server and
this service provider failed.
Management Console Guide
Administrator
PUBLIC 77
Statistic Description
Timeout errors encountered from the
start
The number of times the Access Server sent requests to this service provider and
did not receive a response within the time specied by the processing timeout.
Service provider connections (restarts)
from the start
The number of times the Access Server restarted this service provider when it did
not receive a response from the service provider.
The last time of a successful ow
launch
The system time when the Access Server last started the real-time service asso-
ciated with this service provider. If the Access Server never successfully started
an instance of this service provider, the value is "N/A."
This time is from the computer running the Access Server.
Time since start attempt
The amount of time since the Access Server last attempted to start this service
provider. This value reects successful and unsuccessful attempts.
Time since last request start The amount of time since the Access Server last sent a request to this service
provider. This value reects successful and unsuccessful attempts.
3.7.5Using statistics and service parameters
You can use the statistics for a service to tune the service parameters.
Statistic
Description
Average and maximum processing time If the average or maximum processing time for a service provider is equal or
close to the processing timeout value resulting in processing timeouts, consider
increasing the processing timeout parameter for the service.
Maximum queuing time
In a tuned system, the maximum and average queuing times should be close to-
gether, the dierence being an indication of the trac distribution for this service.
Values should not approach the value of the queuing timeout parameter listed for
the service.
If the maximum queuing time for a service provider is equal or close to the
queuing timeout parameter and there are queuing timeouts listed, consider the
following changes:
• Increase the queuing timeout parameter for the service.
• Increase the number of service providers available, either controlled by the
same Job Server host or by a dierent Job Server.
If you nd that the average time in the queue is longer than the average proc-
essing time, the trac for this service is too high for the resources provided.
Consider running multiple service providers to process the same message type.
You can add the same job many times in the service list, or you can add the same
job controlled by a dierent Job Server on a separate computer to the service list.
If you nd that the average queuing time is growing, consider increasing the
queuing timeout or adding processing resources.
78
PUBLIC
Management Console Guide
Administrator
Statistic Description
Processing timeouts If you see processing timeouts and service providers restarting successfully, con-
sider increasing the number of processing retries allowed for the service.
3.8 Prole Server Management
Use the Administrator to manage the data in the proler repository and manage tasks on the proler server.
The Data Proler executes on a proler server to provide the following data proler information that multiple
users can view:
Information
Description
Column analysis This information includes minimum value, maximum value,
average value, minimum string length, and maximum string
length. You can also generate detailed column analysis such
as distinct count, distinct percent, median, median string
length, pattern count, and pattern percent.
Relationship analysis
This information identies data mismatches between any
two columns for which you dene a relationship, including
columns that have an existing primary key and foreign key
relationship.
You can execute the Data Proler on data contained in databases and at les. Databases include DB2, Oracle,
SQL Server, SAP Sybase, and Attunity Connector for mainframe databases. See the Release Notes for the
complete list of sources that the Data Proler supports.
This section assumes that you have already installed SAP Data Services, which includes the Data Proler.
Related Information
3.8.1Dening a proler repository
The Data Proler repository is a set of tables that holds information about your data that the Data Proler
generates.
1. Create a database to use as your proler repository.
The proler repository can be one of the following database types: DB2, MySQL, Oracle, Microsoft SQL
Server, SAP HANA, or SAP Sybase.
2. Create a proler repository with the Repository Manager.
Select Proler in the Repository type option.
Management Console Guide
Administrator
PUBLIC 79
3. Associate the proler repository with a Job Server with the Server Manager.
Related Information
3.8.2Proler task parameters
Set conguration parameters to control the amount of resources that proler tasks use to calculate and
generate proler statistics.
Note
If you plan to use Detailed proling or Relationship proling, ensure that you use the Server Manager to
specify a pageable cache directory that:
• Contains enough disk space for the amount of data you plan to prole.
• Is on a separate disk or le system from the system where SAP Data Services is installed.
Related Information
3.8.2.1 Conguring proler task parameters
1. Select Management Proler Conguration to access the Proler Conguration page.
2. Keep or change the parameters values listed on the Proler Conguration page.
The Proler Conguration page groups the parameters into the following categories:
• Task execution parameters
• Task management conguration parameters
Related Information
Task execution parameters [page 81]
Task management conguration parameters [page 81]
80
PUBLIC
Management Console Guide
Administrator
3.8.2.2 Task execution parameters
The Proler Conguration page groups the Task execution parameters into subcategories Reading Data, Saving
Data, and Performance.
Task execution subca-
tegory
Parameter
Default
value Description
Reading Data Proling size All The maximum number of rows to prole.
You might want to specify a maximum number of rows to
prole if the tables you prole are very large and you want to
reduce memory consumption.
Reading Data Sampling rows 1 Proles the rst row of the specied number of sampling
rows.
For example, if you set Proling size to 1000000 and set
Sampling rows to 100, the Proler proles rows number 1,
101, 201, and so forth until 1000000 rows are proled. Sam-
pling rows throughout the table can give you a more accurate
representation rather than proling just the rst 1000000
rows.
Saving Data
Number of distinct
values
100 The number of distinct values to save in the proler reposi-
tory.
Saving Data Number of patterns 100 The number of patterns to save in the proler repository.
Saving Data Number of days to
keep results
90 The number of days to keep the proler results in the proler
repository.
Saving Data Number of records
to save
100 The number of records to save in the proler repository for
each attribute.
Saving Data Rows per commit 5000 The number of rows to save before a commit is issued.
Performance Degree of Parallel-
ism
2 The number of parallel processing threads that the proler
task can use.
Performance File processing
threads
2 The number of le processing threads for le sources.
3.8.2.3 Task management conguration parameters
The Proler Conguration page groups the Task management conguration parameters into subcategories,
basic and advanced.
Task management
subcategory Parameter
Default
value Description
Basic Maximum concurrent
tasks
10 The maximum number of proler tasks to run simultane-
ously.
Management Console Guide
Administrator
PUBLIC 81

Task management
subcategory Parameter
Default
value Description
Basic Refresh interval (days) 0 The number of days that must elapse before a proler
task is rerun for the same table or key columns when the
user clicks the Submit option. The Submit option is on
the Submit Column Prole Request and Submit Relationship
Prole Request windows in the Designer.
The default is 0, which is to always rerun the proler task
when the user clicks the Submit option. In other words,
there is no limit to the number of Data Proler tasks that
can be run per day.
To override this interval, use the Update option on the Prole
tab of the View Data window in the Designer.
Advanced
Invoke sleep interval
(seconds)
5 The number of seconds to sleep before the Data Proler
checks for completion of an invoked task.
Invoked tasks run synchronously, and the Data Proler must
check for their completion.
Advanced
Submit sleep interval
(seconds)
10 The number of seconds to sleep before the Data Proler
attempts to start pending tasks.
Pending tasks have not yet started because the maximum
number of concurrent tasks was reached.
Advanced
Inactive interval (mi-
nutes)
2 The number of minutes a proling task can be inactive be-
fore the Data Proler cancels it.
3.8.3Monitoring proler tasks using the Administrator
You can monitor your proler task by name in either the Designer or the Administrator.
On the Administrator, you can see the status of proler tasks, cancel proler tasks, or delete a proler task with
its generated prole statistics.
1. Expand the Proler Repositories node.
2. Click the proler repository name.
3. The Proler Tasks Status window displays.
This status window contains the following columns:
82
PUBLIC
Management Console Guide
Administrator
Column Description
Select If you want to cancel a proler task that is currently running, select this check box and
click Cancel.
If you want to delete a proler task and its proler data from the proler repository,
select this check box and click Delete.
If you click Delete on a running task, the Proler cancels the task before it deletes the
data.
Status
The status of a proler task can be:
• Done—The task completed successfully.
• Pending—The task is on the wait queue because the maximum number of concur-
rent tasks has been reached or another task is proling the same table.
• Running—The task is currently executing.
• Error—The task terminated with an error.
Task Name
The name of the proler task. The name is a link to the Proler Task Items report.
Description The names of the tables on which the proler task was run.
Run # The identication number for this proler task instance.
Last Update The date and time that this proler task last performed an action.
Status Message Is blank if the proler task completed successfully. Displays an error message if the
proler task failed.
4. Click the task name to display the Proler Task Items report, which displays the proling type that was
done for each column.
This Proler Task Items report contains the following columns:
Column
Description
Status The status for each column on which the proler task executed. The status can be:
• Done—The task completed successfully.
• Pending—The task is on the wait queue because the maximum number of
concurrent tasks has been reached or another task is proling the same table.
• Running—The task is currently executing.
• Error—The task terminated with an error.
Item
The column number in the data source on which this proler task executed.
Job Server The machine name and port number of the Job Server where the proler task
executed.
Process ID The process ID that executed the proler task.
Proling Type Indicates what type of proling was done on each column. The Proling Type can
be:
• Single Table Basic—Column prole with default prole statistics.
• Single Table Detailed—Column prole with detailed prole statistics.
• Relational Basic—Relational prole with only key column data.
• Relational Detailed—Relational prole with data saved from all columns.
Datastore
The name of the datastore.
Management Console Guide
Administrator
PUBLIC 83
Column Description
Source The name of the data source (table, at le, or XML le).
Column The name of the column on which the proler task executed.
Last Update The date and time that this proler task last performed an action.
Status Message Is blank if the proler task completed successfully. Displays an error message if the
proler task failed.
Related Information
3.9 RFC Server Management
The SAP Data Services RFC (remote function call) server is the execution link for Data Services jobs initiated by
SAP applications or SAP NetWeaver BW.
Data Services uses the SAP RFC Server interface for the following tasks:
• Scheduling SAP jobs
• Reading from SAP Open Hub destinations
• Loading SAP NetWeaver BW
• Viewing Data Services logs from SAP NetWeaver BW
Access the RFC Server interface in the Administrator of the Management Console. Make settings for the RFC
Server under the SAP Connections node.
3.9.164-bit platform prerequisites
To use the RFC Server Interface on 64-bit UNIX platforms, rst conrm that your environment is congured
correctly:
1. Ensure that the 64-bit Java Development Kit (JDK) is installed.
2. Ensure that SAP Data Services is correctly installed with a supported web application server.
3. Export the JAVA_HOME environment variable, pointing to the location of the 64-bit JDK.
4. Restart your web application server.
For the latest update of these conguration steps, see SAP Note 1394367 .
84
PUBLIC
Management Console Guide
Administrator
3.9.2Adding an RFC server interface
Add an RFC server interface in the Administrator of the Management Console.
1. Select SAP Connections RFC Server Interface .
2. Click the RFC Server Interface Conguration tab.
3. Click Add.
The Administrator opens the RFC Server Conguration page.
4. Enter the conguration information.
All options except the RFC Program ID, SAP Gateway Host Name, and SAP Gateway Service Name must
match the SAP Applications datastore settings.
Option Description
RFC program ID The registered server program ID in the SAP RFC destination to which this
RFC Server will connect.
User name The user name through which SAP Data Services connects to this SAP appli-
cation server. Use the same user name used to create the SAP BW Source
datastore.
Password The password for the user account through which SAP Data Services con-
nects to this SAP application server.
SAP application server name The domain name or IP address of the computer where the SAP application
server is running.
Client number The SAP application client number.
System number The SAP application system number.
SAP gateway host name The domain name or IP address of the computer where the SAP RFC gateway
is located.
SAP gateway service name The TCP/IP service name or service number for the SAP application server
gateway. Typically, this value is SAPGW plus the system number.
SAP gateway connection count The number of TCP/IP connections to the SAP gateway host. The default is
10.
RFC Server Number of Logs The number of log les for each RFC server conguration. The default is 3.
RFC Server Log Size in MB The maximum size of each RFC server log le. When this size is reached, the
system begins overwriting the oldest log le of the set for that RFC server
conguration. The default is 1 MB.
5. Click Apply.
The Administrator adds the RFC server interface denition and returns to the RFC Server Interface Status page.
After adding the interface, you must manually start it from the RFC Server Interface Status page.
Management Console Guide
Administrator
PUBLIC 85
Related Information
Viewing RFC server interface logs [page 87]
3.9.3Starting or stopping an RFC server interface
connection
After adding an interface, you must start it manually. To start the interface connection, on the RFC Server
Interface Status page, select the check box for the interface to start and click Start.
To stop an interface connection:
1. Select the check box for the RFC server to disconnect.
2. Click Abort or Shut down.
• If you choose Abort, the RFC server closes the connection to SAP BW without responding to requests
currently being processed.
• If you choose Shut down, the RFC server nishes processing any active requests before closing the
connection. Any new requests to this RFC server will result in an error.
3.9.4Monitoring RFC server interfaces
From the RFC Server Interface Status page (expand SAP Connections and click RFC Server Interface), you can
access the status, statistics, and logs for all interface connections.
3.9.4.1 Viewing the status of interface connections
The following tables describes the status icons.
Indicator
Description
A green icon indicates that each client of this type has an open connection with SAP BW server.
A yellow icon indicates that at least one client of this type is disconnecting.
A red icon indicates that there was a problem starting the RFC server or processing an SAP BW request.
If an RFC server interface has a red status, view the Status column and click the name of the interface to view
the log details.
To restart, abort, or shut down an interface, click the Back button in the navigation bar to return to the RFC
Server Interface Status page.
86
PUBLIC
Management Console Guide
Administrator

Related Information
Finding problems [page 90]
3.9.4.2 Monitoring interface statistics
The RFC Server Interface Statistics section lists each congured interface and statistics for that interface:
Item
Description
Name The name of the RFC server interface.
Time connected The total time that this interface has been connected to the SAP BW
server.
Last message received The length of time since the RFC server has received a message from SAP
BW.
Last message sent The length of time since the RFC server has sent a message to SAP BW.
Received messages The number of messages that the RFC server has received from SAP BW.
Sent messages The number of messages that the RFC server has sent to SAP BW.
3.9.4.3 Viewing RFC server interface logs
To view the logs for an interface, from the RFC Server Interface Status page, click the name of the interface. A
page with two tabs displays:
• RFC Server Log Viewer: This tab displays the most recent log for the interface with the log path displayed at
the top of the window.
• RFC Server History Log: This tab displays previous logs for the interface. Click a log name to view that log.
Related Information
Adding an RFC server interface [page 85]
3.9.5Removing one or more RFC server interfaces
1. Under the SAP Connections node, click RFC server Interface.
2. On the RFC Server Interface Conguration tab, select the check box for one or more interfaces.
3. Click Remove.
Management Console Guide
Administrator
PUBLIC 87

3.10 Adapters
An SAP Data Services adapter is a Java program that allows Data Services to communicate with front-oce
and back-oce applications. Depending on the adapter implementation, adapter capabilities include the ability
to:
• Browse application metadata.
• Import application metadata into the repository.
• Move batch and real-time data between Data Services and information resource applications.
Adapters can handle the following types of metadata: tables, documents, functions, outbound messages, and
message functions. Each of these can be used in real-time or batch jobs. Outbound messages and message
functions are the only objects that include operations.
An adapter can process several predened operations. An operation is a unit of work or set of tasks that the
adapter completes. Operations include:
• Taking messages from an application and send them to a real-time service for processing, possibly
returning a response to the application.
• Taking messages from a real-time service and send them to an application for processing, possibly
returning a response to the real-time service.
• Taking messages produced by a function call inside a real-time service, send the messages to an
application, and return responses to the function.
An adapter connects Data Services to a specic information resource application. You can create one or more
instances of an adapter. Each adapter instance requires a conguration le. That conguration le denes the
operations available.
All adapters communicate with Data Services through a designated Job Server. You must rst install an
adapter on the Job Server's computer before you can use the Administrator and Designer to integrate the
adapter with Data Services. See your specic adapter's documentation for its installation instructions.
After installing the adapter, congure its instances and operations in the Administrator before creating adapter
datastores in the Designer, because you must select an adapter instance name as part of an adapter datastore
conguration. It might help to think of the Adapter Instances node of the Administrator as part of your adapter
datastore conguration.
To enable an adapter datastore connection:
Tip
Adapter installation and conguration information appears in Supplement for Adapters. You should also
keep the Designer Guide and the Administrator Guide handy for reference.
1. Use the Server Manager to congure a Job Server that supports adapters.
2. Use the Administrator to add, congure, and start an adapter instance using the Adapter Instances node.
3. Use the Designer to create an adapter datastore and import metadata. Use the metadata accessed
through the adapter to create batch and/or real-time jobs.
88
PUBLIC
Management Console Guide
Administrator
Related Information
3.11 Support for Web Services
For information about using SAP Data Services as both a Web services server and client, see the Integrator
Guide.
3.12 Troubleshooting the Administrator
The Administrator provides status and error information. Use this information to discover problems with
your implementation and to nd the source of those problems. This section describes how you can use the
Administrator to nd and help resolve job processing issues.
Related Information
Reestablishing network connections [page 89]
Finding problems [page 90]
Error and trace logs [page 91]
Resolving connectivity problems [page 96]
Restarting the Access Server [page 97]
3.12.1Reestablishing network connections
When you disconnect from your network and re-connect or otherwise change an IP address (Dynamic IPs), the
Administrator encounters a database connection error.
To reestablish network connections for your repository, you can do one of two things:
• Rename the repository in the Administrator. This change forces the Administrator to drop and recreate the
connection to the database.
• Restart the Administrator.
Management Console Guide
Administrator
PUBLIC 89
3.12.2Finding problems
The Administrator uses colored indicators to show the status of the various system components. Generally, the
indicators mean the following:
Indicator
Description
A green icon indicates that the object is running properly.
A yellow icon indicates that some aspect of this object is not working. Either the Access Server is in
the process of its error-handling eorts to reestablish an operation, or the Access Server is waiting for
a manual intervention.
For example, when you rst add a service to the Access Server conguration, the service displays a
yellow icon until you manually start the service or until you restart the Access Server.
A red icon indicates that one or more aspects of this object is not working, and the error handling
eorts of Access Server were not able to reestablish the operation of the object.
When you see a yellow or red icon, the system requires manual intervention. You must:
• Determine which object is not operating properly.
• Determine the cause of the problem.
• Fix the problem.
• Restart the aected service providers if necessary.
3.12.2.1Determining which object is not operating properly
1. In the Administrator, click Home.
If there is an error anywhere in the system, you will see a red indicator next to a repository or Access Server
name.
2. If you see a red indicator, click a repository or Access Server name.
The page for that repository or Access Server appears.
3. Look for another red indicator on objects listed at this level.
4. If you can identify lower-level objects that have a red indicator, repeat the previous two steps.
When you have identied the lowest level object with the error, you are ready to determine the cause of the
error.
3.12.2.2Determining the cause of the error
1. Examine the error log for the aected subsystem, such as a batch job, a service provider, or an adapter
interface, or for the Access Server itself.
Use the timestamp on the error entries to determine which error accounts for the problem that you are
experiencing.
90
PUBLIC
Management Console Guide
Administrator

2. Cross-reference the error to the trace information.
When you identify the appropriate error message, you can use the timestamp to determine what other
events occurred immediately before the error.
For example, if an error occurred for a specic service provider, you can use the error timestamp in the
service provider error log to look up Access Server activities that preceded the error.
3.12.3Error and trace logs
The Administrator provides access to trace and error log les for each service provider, each batch job that ran,
and for the Access Server. Use these detailed log les to evaluate and determine the cause of errors.
You can set a period of time to save these log les. After the set time expires, the software deletes all log les.
Related Information
3.12.3.1Batch job logs
The Batch Jobs Status page provides access to trace, monitor, and error log les for each batch job that ran
during a specied period.
The Batch Jobs Status page also includes a button named Ignore Error Status and Delete. These buttons are
important job monitoring tools for adiminstrators to help them solve job execution problems.
Caution
Do not use these buttons unless you fully understand what they are for. Read about monitoring jobs in the
Administrator Guide.
Related Information
Setting the status interval [page 26]
3.12.3.1.1Viewing a batch job trace log
The trace log le lists the executed steps and the time that execution began. Use the trace log to determine
where an execution failed, whether the execution steps occurred in the order you expect, and which parts of the
execution were the most time-consuming.
Management Console Guide
Administrator
PUBLIC 91

1. Select Batch Jobs <repository> .
2. Identify the instance of the job execution in which you are interested by the job name, start time, and so on.
3. Under Job Information for that instance, click Trace.
The Administrator opens the Job Trace Log page.
3.12.3.1.2Viewing a batch job error log
The error log le shows the name of the object that was executing when an error occurred and the text of
the resulting error message. If the job ran against SAP application data, the error log might also include ABAP
errors.
Use the error log to determine how an execution failed. If the execution completed without error, the error log is
blank.
1. Select
Batch Jobs <repository> .
2. Identify the instance of the job execution in which you are interested by the job name, start time, and so on.
3. Under Job Information for that instance, click Error.
The Administrator opens the Job Error Log page.
3.12.3.2Service provider logs
The Service Provider Status page provides access to the error and trace log les for a service provider. These
are the log les produced by the Job Server that controls the service provider.
3.12.3.2.1Viewing the logs for a service provider
1. Select
Real-Time <Access Server> Real-time Services .
2. Click the name of a service.
The Administrator opens the Real-time Service Status page. This page shows a list of service providers for
the service and overall statistics for the service.
3. Click the name of the service provider process ID in which you are interested.
The Administrator opens the Service Provider Status page.
4. Click a link to view the desired service provider log.
To delete these logs, set the log retention period. To lter the list of real-time services on the Real-time
Service Status page by date, set the status interval.
92
PUBLIC
Management Console Guide
Administrator
Link Description
Trace Log Opens the Trace Log page for the current service provider execution.
This link appears only if the real-time service is registered with the Access Server.
Error Log Opens the Error Log page for the current service provider execution.
This page lists errors generated by the software, by the source or target DBMS, or the
operating system for job execution. If the error log is empty, the job has not encountered
errors in message processing.
This link appears only if the real-time service is registered with the Access Server.
The computer running the Job Server stores text les containing the batch and service provider trace, error
and monitor logs. If you installed SAP Data Services in the default installation location, these les are located in
the <<DS_COMMON_DIR>>/Logs/<JobServerName>/<RepoName> folder.
The name of the log le describes the contents of the le:
<type>_<timestamp>_<sequence>_<jobname>.txt, where:
• <type> is trace, monitor, or error.
• <timestamp> is the system date and time from when the job created the log.
• <sequence> is the number of this job related to all jobs run by this Job Server instance.
• <jobname> is the name of the job instance.
Batch job trace and error logs are also available on the Log tab of the Designer project area. To see the logs for
jobs run on a particular Job Server, log in to the repository associated with the Job Server when you start the
Designer.
Related Information
Setting the status interval [page 26]
3.12.3.3Access Server logs
Trace and error logs for each Access Server are available in
Real-Time <Access Server> Logs-
Current and Real-Time <Access Server> Logs-History . In addition, these les are located in the
Access Server conguration location, which you specify when you congure the Access Server.
Note
For remote troubleshooting, you can also connect to any Access Server through the Administrator.
Management Console Guide
Administrator
PUBLIC 93

3.12.3.3.1Viewing the current day's logs
1. Select Real-time <Access Server> Logs-Current .
2. This page lists the error log le followed by the trace log le. The Administrator shows the last 100,000
bytes of the Access Server error log or trace log for the current date.
The date of the le is included in the name:
• error_MM_DD_YYYY.log
• trace_MM_DD_YYYY.log
3. To view a le, click the le name. The Administrator shows the last 100,000 bytes of the Access Server
error log or trace log for the current date.
• The error log contains error information that the Access Server generates.
• The trace log contains a variety of system information. You can control the information the Access
Server writes to the trace log.
Related Information
Conguring the trace log le [page 94]
3.12.3.3.2Viewing the previous day's logs
1. Select
Real-Time <Access Server> Logs-History .
2. This page lists error log les followed by trace log les. The date of the le is included in the name:
• error_MM_DD_YYYY.log
• trace_MM_DD_YYYY.log
3. To view a le, click the le name.
3.12.3.3.3Conguring the trace log le
1. Select Real-Time <Access Server> Logs-Current .
2. Click the Access Server Log Conguration tab.
3. Under Log Contents, the Administrator lists several trace parameters that control the information that the
Access Server writes to the trace le.
Name
Description
Admin Writes a message when an Access Server connection to the Administrator changes.
94 PUBLIC
Management Console Guide
Administrator
Name Description
Flow Writes a message when an Access Server exchanges information with a real-time service.
Request Writes a message when an Access Server receives requests.
Security Writes a message when an Access Server processes authentication information (IP ad-
dresses, user name, or password).
Service Writes a message when an Access Server starts or stops a service.
System Writes a message when an Access Server initializes, activates, or terminates.
Failed_request Writes a message when a request to the Access Server fails.
4. Select the check box next to the name if you want the Access Server to write corresponding messages to
the trace log le.
5. Under Log Tracing, select the Enabled check box.
6. Click Apply.
The Administrator changes the Access Server conguration. The Access Server will now write the selected
trace messages to the trace log.
Note
Until you set the parameters on this page, the Access Server uses the startup parameters to determine
trace options. Each time you restart the Access Server, the startup parameters take precedence over
parameters set on this page. You can control the content of this log by setting parameters when conguring
the Access Server.
Related Information
Restarting the Access Server [page 97]
Conguring Access Server output [page 70]
Conguring an Access Server [page 71]
3.12.3.3.4Deleting Access Server logs
1. Select
Real-Time <Access Server> Logs-Current or Real-Time <Access Server> Logs-
History
.
2. Select the check box next to any log le that you want to delete.
Alternatively, to delete all of the log les, select the Select all check box.
3. Click Clear or Delete.
The Administrator clears the le size for current logs and deletes the selected history les from the display
and from the Access Server log directory.
Management Console Guide
Administrator
PUBLIC 95

3.12.3.4Adapter logs
For more detailed information about an adapter or an adapter's operations, see the adapter's error and trace
log les.
3.12.3.4.1Viewing log les for an adapter instance
1. Select Adapter Instance <Job Server> .
2. Find the adapter instance for which you want to view logs and from the Log Files column, click the Error Log
or Trace Log link.
3. The corresponding page opens.
These log les are also found in the <DS_COMMON_DIR>\adapters\log directory. The error
log le is named <adapter_instance_name>_error.txt and the trace log le is named
<adapter_instance_name>_trace.txt.
3.12.4Resolving connectivity problems
If you have determined that you have connectivity problems among your real-time system components,
consider the following possible failures:
• Application client cannot connect to Access Server
For example, an error appears in the logs generated by your application client or in the command prompt
when you execute the client test utility that looks like this:
• Error: unable to get host address
If you specied an IP address and received this error, your network might not support static IP address
resolution. Try using the computer name instead.
Match the port number that you specied in the client test utility (or in the Message Client library call) to
the Access Server's port number.
Make sure that the port that you specied is not in use by other applications on the computer where an
Access Server is installed.
• Access Server cannot connect to Job Server
If this error occurs, you would see a red indicator for a service provider and an error log for the Access
Server.
Match the host name and port number of the Job Server for the service being called (congured in the
Administrator) to the host name and port number that the Job Server is congured to use (as listed in the
Server Manager).
To make sure that the Job Server is running, check the Windows Task Manager for the
Al_jobserver.exe and Al_jobservice.exe processes or open the Designer, log in to the repository
that corresponds to the Job Server, and look for the Job Server icon at the bottom of the window.
• Job Server cannot start real-time service
If this error occurs, the status indicator for the related service and its service provider would be red and you
would be able to open the error log le from the Service Provider Status page.
Make sure that the job is properly indicated for the service called in the Real-Time Service Status page.
Make sure that the real-time jobs are available in the repository associated with the Job Server.
96
PUBLIC
Management Console Guide
Administrator

Make sure the repository and the Access Server are connected to the Administrator and that the
repository is available.
If you change the password for your repository database, the Job Server will not be able to start real-time
services. To x this problem, re-register your repository in the Administrator and recongure the real-time
services.
• Real-time service cannot register with Access Server
If this error occurs, you would see:
• A red indicator for the service provider.
• An error log in the Logs-Current page (the startup timeout will eventually be triggered).
• An error log available from the Service Provider Status page.
Make sure the Access Server host name correctly identies the computer where the Access Server is
running.
• Access Server cannot connect back to application client
If this error occurs, you would see an error log under the Access Server's Logs-Current node.
Make sure that the host name and port used by the message broker client to communicate with the Access
Server is correct.
3.12.5Restarting the Access Server
To restart the Access Server, you can use either of two methods:
• Controlled Restart
The Access Server responds to new and queued messages with a shutdown error. It waits for service
providers to complete processing existing messages, then returns the responses to those clients. Next,
the Access Server closes existing client connections (including adapters), stops, and restarts itself. Finally,
the Access Server reads the current conguration settings and restarts services, service providers, and
adapters.
Restarting the Access Server this way requires as much time as it takes to process requests in the system.
• Abort and Restart
The Access Server responds to new and queued messages with a shutdown error. It shuts down existing
service providers and responds to these messages with a shutdown error. Next, the Access Server closes
existing client connections (including adapters), stops, and restarts itself. Finally, the Access Server reads
the current conguration settings and restarts services, service providers, and adapters.
3.12.5.1Performing a controlled restart of the Access Server
1. Select
Real-Time <Access Server> Status .
2. Under Life Cycle Management, click Controlled Restart.
3. Click the Real-Time Services node to verify that all services started properly.
The Access Server allows running services to complete and returns incoming and queued messages to the
client with a message that the Access Server has shut down. When all services have stopped, the Access
Server stops and restarts itself. The Access Server reads the new conguration settings and starts services
as indicated.
Management Console Guide
Administrator
PUBLIC 97

If all service providers started properly, the Real-Time Service Status page shows a green indicator next to
each service name. A red indicator signies that a component of the service did not start.
3.12.5.2Performing an abort and restart of the Access Server
1. Select Real-Time <Access Server> Status .
2. Under Life Cycle Management, click Abort and Restart.
3. Click the Real-Time Services node to verify that all services started properly.
98 PUBLIC
Management Console Guide
Administrator
4 Metadata Reports
This section describes the overall requirements for enabling and viewing metadata reports including software
and conguration requirements and logging in to the Management Console.
4.1 Requirements for metadata reports
To make metadata reports available for objects, fulll the requirements for metadata reporting applications.
Use the SAP Data Services Administrator to congure repositories for metadata reporting applications to
access.
The following list contains the application requirements for making metadata reports available for objects:
• A web application server
• JDBC drivers to connect to a repository
• Congured repositories
4.2 Repository reporting tables and views
The SAP Data Services repository is a database that stores your software components and the built-in design
components and their properties. The open architecture of the repository allows for metadata sharing with
other enterprise tools.
Within your repository, the software populates a special set of reporting tables with metadata describing the
objects in your repository. When you query these tables, you can perform analyses on your applications.
The following table lists the Metadata reporting tables and what they contain:
Name
Contains
AL_ATTR Attribute information about native objects
AL_AUDIT Audit information about each data ow execution
AL_AUDIT_INFO Information about audit statistics
AL_CMS_BV Components of a Business View
AL_CMS_BV_FIELDS Business Fields within Business Elements in a Business View
AL_CMS_REPORTS Information that uniquely identies Crystal Reports reports, SAP BusinessObjects
Desktop Intelligence documents, or SAP BusinessObjects Web Intelligence docu-
ments
Management Console Guide
Metadata Reports
PUBLIC 99
Name Contains
AL_CMS_REPORTSUSAGE Tables, columns, or Business Views that a Crystal Reports report, SAP
BusinessObjects Desktop Intelligence document, or SAP BusinessObjects Web
Intelligence document uses
AL_CMS_FOLDER Folder names in which a Crystal Reports report, SAP BusinessObjects Desktop
Intelligence document, or SAP BusinessObjects Web Intelligence document resides
AL_HISTORY Execution statistics about jobs and data ows
AL_INDEX Index information about imported tables
AL_LANG Information about native (.atl) objects
AL_LANGXMLTEXT Information about objects represented in XML format
AL_PCOLUMN Column information about imported table partitions
AL_PKEY Primary key information about imported tables
AL_QD_VRULE Validation rule names
AL_QD_VRULE_OFLOW Rule name if it cannot t it into AL_QD_VRULE (if there is an overow)
AL_QD_STATS Runtime validation rule statistics
AL_QD_ROW_DATA Sample row data for which the validation rules have failed
AL_QD_COLINFO All the column information for the failed validation rules
AL_USAGE All ancestor-descendant relationships between objects
ALVW_COLUMNATTR Attribute information about imported columns
ALVW_COLUMNINFO Information about imported column
ALVW_FKREL Primary-foreign key relationships among imported tables
ALVW_FLOW_STAT Execution statistics about individual transforms within data ows
ALVW_FUNCINFO Information about both native functions and functions imported from external sys-
tems
ALVW_MAPPING Mapping and lineage information for target tables
ALVW_PARENT_CHILD Direct parent-child relationships between objects
AL_SETOPTIONS Option settings for all objects
ALVW_TABLEATTR Attribute information about imported (external) tables
ALVW_TABLEINFO Information about imported tables
Note
This is not the complete list because some repository tables and views are for internal use.
The software automatically creates reporting tables for each new or upgraded repository. Except for
AL_USAGE, the software automatically updates all reporting tables.
100
PUBLIC
Management Console Guide
Metadata Reports
Related Information
Management Console Guide
Metadata Reports
PUBLIC 101

5 Impact and Lineage Analysis Reports
The Impact and Lineage analysis provides a simple, graphical, and intuitive way to view and navigate through
various dependencies between objects that are within the Data Services local repository.
Impact and lineage analysis allows you to identify which objects are aected if you change or remove other
connected objects.
For example for impact analysis, a typical question might be, “If I drop the source column Region from this
table, what targets are aected?”
For lineage analysis, the question might be, “Where does the data come from that populates the Customer_ID
column in this target?”
In addition to the objects in your datastores, impact and lineage analysis allows you to view the connections to
other objects including:
• Classes and objects
• Business Views
• Business Elements and Fields
• Reports, such as Crystal Reports
• SAP BusinessObjects Desktop Intelligence documents
• SAP BusinessObjects Web Intelligence documents
Note
SAP Information Steward has additional impact and lineage capabilities, including the ability to combine
metadata from multiple external systems such as SAP BusinessObjects Enterprise and Hadoop.
5.1 Navigate impact and lineage information
To navigate impact and lineage information, use the le tree and the objects in the report.
View impact and lineage information by selecting the Impact and Lineage Analysis link in the Management
Console Administrator home page.
The Impact and Lineage Analysis page contains two primary panes:
• The left pane contains a hierarchy of objects in an object tree that reect objects in the Central
Management Server (CMS). The top of the tree is the default repository. The left pane also includes a
search tool.
• The right pane displays object content and context based on your selection in the le tree and the objects
you select in the right pane.
Expand the tree in the left pane and select an object in the tree to learn more about it. Details associated with
the selected object appear in the right pane in one or more tabs. Tabs vary depending on the object you select.
102
PUBLIC
Management Console Guide
Impact and Lineage Analysis Reports
The top level of the navigation tree displays the current repository. Objects that appear under the repository
include:
• Datastores: Contains tables and columns.
• CMS servers: Contains folders as dened in the Central Management Console (CMC), and business views.
To view or hide a pane in the display such as an attributes pane, click the up/down arrow in its header bar.
Moving your cursor over an object in the right pane displays a pop-up window with more information about that
object. For example, if you move the cursor of a table object, the following information appears as applicable:
• Data ow name
• Datastore name
• Owner name
Move your cursor over a report, and based on the report type, the following information apppears:
• CMS server name
• Business view name
To update the object tree with objects that have changed in the CMS, log out and log back into the
Management Console and redisplay Impact and Lineage Analysis page.
Example
Update the Impact and Lineage Analysis page after you add, delete, or rename an object.
If you receive the following error after you display an impact and lineage analysis, the java process (JVM)
doesn’t have enough memory to process the current task. Allocate more heap memory to the Java process
associated with the Web server to avoid image scaling.
This image is scaled to 50% of the original image. You could avoid scaling the
image by allocating more memory to the current java process.
5.2 Impact and lineage object analysis information
The right pane of the Impact and Lineage Analysis page displays information based on the object type that you
select from the object tree.
The following table lists the types of objects that appear in the navigation tree, the corresponding tabs that
appear in the right pane, and a summary of the associated content.
Object Tab Associated content
Repository Overview Repository name
Repository type: Database type
Repository version: Repository version
number
Management Console Guide
Impact and Lineage Analysis Reports
PUBLIC 103
Object Tab Associated content
Datastore Overview Overview information based on the type
of database information the datastore
contains.
Example
The following lists the information
for a Microsoft SQL Server data-
base datastore.
Datastore type: Database
Database type: Micro-
soft_SQL_Server
User: Database user name
Case sensitive: Case sensitive or
not case sensitive
Conguration: Conguration se-
lected in the datastore editor
SQL_Server version: Microsoft SQL
Server 2000
Database name: Database name
Server name: Host computer name
Table Overview Table name: Table name
Datastore: Datastore to which this table
belongs
Owner name: Table owner name in the
database.
Table schema: Table schema name if
Netezza 7 with schema is specied.
Business name: Business-use name of
the table if dened
Table type: Table or template table
Last update date: Date software last up-
dated the table
104
PUBLIC
Management Console Guide
Impact and Lineage Analysis Reports
Object Tab Associated content
Impact End-to-end impact of the selected
source table and the targets it aects
in a graphic.
Selecting an object in the Impact di-
agram displays the object attributes,
which are the same as on the Overview
tab.
Lineage Same information as on the Impact tab
except it describes the ow from target
to source.
Mapping tree Overall mapping information for each
column in the table. Select between
Group by data ow or Group by column.
Column Overview Column name: Column name
Table name: Parent table of the column
Table schema: Table schema name if
Netezza 7 with schema is specied.
Data type: Data type for the column
Nullable: Yes or no
Primary key: Yes or no
Foreign key: Yes or no
Impact End-to-end impact of the selected
source column and the targets it aects
in a graphic.
Selecting a column in the Impact di-
agram displays the object attributes,
which are the same as on the Overview
tab.
Management Console Guide
Impact and Lineage Analysis Reports
PUBLIC 105

Object Tab Associated content
Lineage Same information as on the Impact tab
except it describes the ow from target
to source.
It also displays any data ow objects
associated with the column. Move the
cursor over a data ow icon to display a
pop-up window with the mapping infor-
mation.
Select a data ow icon to open another
pop-up window that displays the Auto
Documentation information including
mapping.
Note
Notice that in the auto documenta-
tion window, any objects that are
not part of the lineage for this col-
umn are dimmed.
Business View Overview Business View: Business View name
Folder: Folder name on the CMS server
to where the Business View has been
exported
Last update date: Date the software last
updated the Business View in the Busi-
ness View Manager
CMS server: Name of the CMS server
for this Business View
Class Overview Class : Class name
CMS server: Name of the CMS server
for this class
Object Overview Object: Object name
Class: Class to which this object be-
longs
CMS Server: Name of the CMS server
for this object
Source column: Name of the source
column for this object followed by the
owner and table name
106 PUBLIC
Management Console Guide
Impact and Lineage Analysis Reports
Object Tab Associated content
Impact Reports that use the selected object
Lineage Column-level lineage for the selected
object
Business Element Overview Business element: Name
Business view: Business View to which
this business element belongs
CMS server: Name of the CMS server
for this object
Business Field Overview Business eld: Name
Business element: Business Element to
which this Business Field belongs
Business view:: Business View to which
this Business Field belongs
CMS server: Name of the CMS server
for this object
Impact All the reports that use the eld.
Lineage Column-level lineage for the selected
Business Field.
Reports:
Crystal
Web Intelligence
Desktop Intelligence
Overview Report: Name
Folder: Folder on the CMS server where
the report is stored
CMS server: Name of the CMS server
for this report
Last update date: Date the software last
updated the report
Lineage Lineage to the Business View elds
on which the report is based (if any)
and the column-level lineage in the da-
tastore.
Management Console Guide
Impact and Lineage Analysis Reports
PUBLIC 107

5.3 Searching in the Impact and Lineage Analysis page
Search for objects in the Impact and Lineage Analysis page to narrow the view of objects to display in the
navigation tree and the objects in the right pane.
1. Specify what to search for based on what you know.
Search methods
Option
Description
Select an object type Select an object type from the Select an object type drop-
down list. Use this method when you know the object type
but not the name of the object.
Options include:
• Table and column
• Class and object
• Business view
• Element and eld
• Report
Search box
Search for a specic object by typing all or part of the
object name.
The search feature isn’t case sensitive, spaces are al-
lowed, and you can use the percent symbol (%) as a wild-
card.
2. Select the Search icon (binoculars).
The software highlights the objects that meet your search criteria with a red border.
5.4 Impact and Lineage Analysis Settings control panel
The Impact and Lineage Analysis Settings control panel allows you to change the options for your reports. To
open it, click Settings in the upper-right corner of the window.
5.4.1Impact and lineage Settings tab
The Settings tab in the Impact and Lineage Anaysis control panel enables you to change repositories.
Select a repository from the drop-down list box and click Apply.
108
PUBLIC
Management Console Guide
Impact and Lineage Analysis Reports

5.4.2Impact and lineage Refresh Usage Data tab
To manually calculate column mappings, use the options the Refresh Usage Data tab.
5.4.2.1 Impact and lineage: Calculate column mappings
SAP Data Services calculates information about target tables, and columns, and the sources used to populate
target tables and columns.
When Data Services calculates column mappings, it populates the internal ALVW_MAPPING view and the
AL_COLMAP_NAMES table:
• The ALVW_MAPPING view provides current data to metadata reporting applications like Impact and Lineage
Analysis.
• Use a custom report to query the AL_COLMAP_NAMES table to generate a report about a data ow that
processes nested data (NRDM).
Whenever a column-mapping calculation is in progress, the Designer displays a status icon at the bottom right
of the window. You can double-click this icon to cancel the process.
To calculate column mappings, you can:
• Enable the option in the Designer to automatically calculate column mappings.
• Execute the column-mapping process manually from either the Designer or the Impact and Lineage
Analysis application in the Management Console.
Related Information
5.4.2.1.1 Calculating column mappings automatically
Set SAP Data Services to automatically calculate column mappings using the Tools menu in Designer.
SAP Data Services calculates information about target tables, and columns, and the sources used to populate
target tables and columns.
To have Data Services calculate column mapping information in the Designer automatically, perform the
following steps:
1. Select
Tools Options .
The Options dialog box opens.
2. Expand the Designer node and select General.
3. Select the check box for the option Automatically calculate column mappings.
The option is selected by default.
Management Console Guide
Impact and Lineage Analysis Reports
PUBLIC 109
Caution
If you deselect check box for Automatically calculate column mappings, any subsequent changes that
you make to the data ow requires that you manually recalculate the column mappings to ensure the
ALVW_MAPPING view and the AL_COLMAP_NAMES table have the most current information.
4. Select OK.
The Options dialog box closes.
5.4.2.1.2 Calculating column mappings manually
Calculate column mappings manually in either SAP Data Services Designer or SAP Data Services Management
Console.
Before you perform the task, ensure that the option Automatically calculate column mappings is not checked in
the Options dialog:
1. Select Tools Options .
2. Expand the Designer node and select General.
3. The Automatically calculate column mappings is in the General pane.
1. To start column calculation in Designer manually:
a. Right-click in a blank space in the object library.
b. Select Repository Calculate column mappings
Data Services calculates the column mappings for data ows in the repository. When it completes the
calculation, an Output dialog box opens with any errors or warnings. View the Information tab to see a
list of completed data ows.
2. To start column calculation in the Management Console manually:
a. Log into the Management Console and open the Impact and Lineage Analysis application.
b. Select Settings in the upper right menu.
The Data Services Management Console - Internet Explorer dialog box opens.
c. Open the Refresh Usage Data tab.
d. Select the Job Server that is associated with the applicable repository from the Job Server list.
e. Select Calculate Column Mapping.
When it completes calculation, the Management Console opens an Overview tab in the right pane of
the Impact and Lineage Analysis application. Expand Data Flow Column Mapping Calculations to view a
list of data ows and the calculation status. If the mapping calculation is complete, the Status indicator
is checked.
5.4.3About tab
This tab provides SAP Data Services version information.
110
PUBLIC
Management Console Guide
Impact and Lineage Analysis Reports

5.5 Increasing the java heap memory in Windows
1. In the Windows Services control panel, stop the Data Services Web Server.
2. In the installation directory, navigate to \ext\WebServer\conf.
3. Using a text editor, open the wrapper.properties le.
4. To allocate a minimum of 256 MB and a maximum of 512 MB to the java process, add the following
parameters to wrapper.cmd_ line:
-Xms256M -Xmx512M
The result will appear as follows:
wrapper.cmd_line=$(wrapper.javabin) -Xms256M -Xmx512M -Djava.endorsed.dirs==$
(ACTAHOME)\ext\webserver\common\endorsed ...
5. Save and close the le.
5.6 Increasing the java heap memory in UNIX
1. Stop the Data Services Web Server.
2. In the installation directory, navigate to /ext/WebServer/bin.
3. Using a text editor, open the setclasspath.sh le.
4. To allocate a minimum of 256 MB and a maximum of 512 MB to the java process, add the following lines to
the end of the setclasspath.sh le:
JAVA_OPTS="-Xms256M -Xmx512M"
export JAVA_OPTS
5. Save and close the le.
Management Console Guide
Impact and Lineage Analysis Reports
PUBLIC 111
6 Operational Dashboard
The Operational Dashboard has two tabs: Dashboard and License Management.
The Dashboard tab provides graphical depictions of SAP Data Services job execution statistics. Being able to
see task statuses across repository organizations allows you to view the status and performance of your job
executions for one or more repositories over a given time period.
You can use the information in the detailed visualized dashboard to:
• determine how many jobs succeeded or failed over a given time period.
• identify your performance by checking the CPU or buer uses of dataow.
• streamline and monitor your job scheduling and management for maximizing overall eciency and
performance.
For more information about how to use the dashboard to answer performance questions, see "Measuring
Performance" in the Performance Optimization Guide.
The License Management tab enables you to generate a report which contains licensing information and CPU
metrics for all of your registered job servers. You can then send the le containing the report to SAP's Global
License Auditing Services (GLAS).
For more information about how to use license management, see the "License Management" topic.
Related Information
Job Execution History node [page 20]
License Management [page 115]
6.1 Dashboard tab
The Dashboard tab displays a summary of executed jobs.
To view the dashboard, click Operational Dashboard on the Management Console home page, then Dashboard,
if it is not already selected.. To return to the Management Console home page, click Home.
The dashboard is divided into three parts:
• The pie chart shows task statuses (successful, failed, and warning).
• The bar chart shows the task execution time duration for a specic period of time.
• The table shows the repository name, job/task name, start and end time, execution time, and status for all
aggregated tasks.
The Available Repositories drop down allows you to view job execution history for all repositories (default) or
just one.
112
PUBLIC
Management Console Guide
Operational Dashboard

You can also search job execution history by time period.
• Last 24 hours (default)
• Last 7 days
• Last 30 days
• All
6.1.1Job Execution Status pie chart
The pie chart displays status information for jobs running on one or more repositories during a specic time
period.
The chart identies the number and ratio of jobs that succeeded, had one or more warnings, had one or more
errors, or are still currently running.
6.1.2Job Execution Statistics History bar chart
The Job Execution Statistics History bar chart shows the trend of the execution status.
The bar chart displays job execution numbers, which are broken down into four month periods. It provides you
with the following information:
• Number of jobs that completed successfully
• Number of jobs that failed
• Number of jobs that completed with warnings
6.1.3Job Execution table
The Job Execution table lists all the aggregated tasks for a repository.
You can do the following with the information in this table:
• Filter the data by selecting a Start Time and an End Time. Once you specify dates and times, click Apply.
• Sort the data in a column by clicking on the column heading and selecting a sort option. For example, most
columns can be sorted in ascending or descending order.
• Click Export to save the data to a .csv le.
• Drill into the data for more details. Double click on a row to open the Job Execution Details page for a job.
The table displays the following information:
Option
Description
Repository name The repository associated with this job.
Job name The name of the job in the Designer.
Management Console Guide
Operational Dashboard
PUBLIC 113
Option Description
Start time and End time The start and end timestamps in the format <hh:mm:ss>.
Execution time The elapsed time to execute the job.
Status The status of the job.
To lter the data in the table by status, click the Status column heading and select an
option.
6.1.3.1 Job Execution Details window
The Job Execution Details window shows execution history data for a job.
The following information is available in this window:
• The Job Execution History table shows the history of a job. The following information is available:
Column
Description
Repository name The repository associated with this job.
Job name The name of the job in the Designer.
Start time and End time The start and end timestamps in the format <hh:mm:ss>.
Execution time The elapsed time to execute the job.
Status The status of the job. To lter the data in the table by status, click the
Status column heading and select an option.
RunID An identier that represents a single job over its duration.
• The Job Execution History Status pie chart shows the status of the task that is highlighted in the Job
Execution History table. Green indicates the task was a success, yellow indicates that there were warnings,
and red indicates that there were errors.
• The Job Details table shows data ow information and indicates if audit data is available.
6.1.3.1.1 Viewing thread information for a data ow
To view information about the rst thread in a data ow, do the following:
1. Select an item in the Job Details table. Three bar charts appear showing you information about the buer
used, row processes, and the CPU used.
2. To view information about another thread, select a name from the Thread Name drop-down.
114
PUBLIC
Management Console Guide
Operational Dashboard

6.1.3.1.2 Viewing audit details
If auditing is enabled for a job, the Contains Audit Data column in the Job Details table indicates if audit data is
available. To view audit information, click View Audit Data.
The Audit Details window opens and provides the following information:
• An audit rule summary, if applicable
• A table with audit labels and values
For more information about auditing, see "Using auditing" in the Designer Guide.
Related Information
6.2 License Management
Use the license management feature to generate a report, which contains licensing information and CPU
metrics for all of your registered job servers.
To view the License Measurement tab, click Operational Dashboard on the Management Console home page,
then License Management, if it is not already selected. To return to the Management Console home page, click
Home.
The pane on the left of the window lists all of the measurement reports. Use the lter to display dierent time
periods. The pane on the right displays the contents of the .xml le for the selected time period.
Click the New Measurement button to collect current licensing information for all of your registered servers into
a single report, which is saved as an .xml le on the Central Management Server (CMS).
If requested by SAP's Global License Auditing Services (GLAS) to provide a license management report, click
Export to download the .xml report to a local server where you can access it. SAP's GLAS group will provide you
with instructions for sending the report to them.
Note
If the CMS is deployed on clustered BOE, you should congure the FRS (File Repository Server) as a shared
folder. You can nd information on how to do this in SAP Note 2341002
.
Management Console Guide
Operational Dashboard
PUBLIC 115

7 Data Validation Dashboard Reports
Data Validation dashboard reports provide graphical depictions that let you evaluate the reliability of your
target data based on the validation rules you created in your SAP Data Services batch jobs. This feedback
allows business users to quickly review, assess, and identify potential inconsistencies or errors in source data.
7.1 Conguring Data Validation dashboards
Create meaningful data validation dashboards.
The following steps describe the process for generating meaningful Data Validation dashboards.
1. In your jobs in Designer, create data ows that contain validation transforms with validation rules.
You use validation transforms to:
• Verify that your source data meets your business rules.
• Take the appropriate actions when the data does not meet your business rules.
2. In the Data Validation application of Management Console, create functional areas. A functional area
is a virtual group of jobs that relate to the same business function, for example Human Resources or
Customers. Functional areas can contain multiple jobs and one or more data validation business rules.
3. In the Data Validation application, create business rules. Business rules are typical categories of data, for
example Social Security Number or Address.
These business rules contain validation rules that you created in your validation transforms in your data
ows.
After you complete this process, begin to create validation dashboards by opening the Data Validation
application in the Management Console.
Related Information
Creating functional areas [page 116]
Creating business rules [page 117]
7.1.1Creating functional areas
After you create data ows with validation transforms and rules in Designer, next create functional areas.
Note
If you do not create any functional areas, the dashboard displays statistics for all jobs for the selected
repository.
116
PUBLIC
Management Console Guide
Data Validation Dashboard Reports

1. In the Data Validation module, click the Settings link.
The Repository tab displays.
2. Verify the desired repository displays.
To change the repository, select a dierent one from the drop-down list and click Apply.
3. Click the Functional area tab.
The selected repository displays.
4. Type a name for the new functional area (such as Customer) and optionally a description.
5. Click Save.
A list of batch jobs (and the associated system conguration for each, if any) appears that lets you select
the jobs you want to include in this functional area.
You can change the sort order of the table by clicking the arrow in a column heading.
6. From the list of Available batch jobs, select the check box for each job to include in this functional area and
click the arrow button to move it to the Associated batch jobs window.
• Jobs are not reusable among functional areas.
• In the Administrator, deleting job information on the Batch Job Status page (Batch Jobs History) also
clears data validation statistics from Data Validation Metadata Reports.
7. Click Apply to save the changes and keep the Functional area window open, for example to add more
functional areas.
Clicking OK saves your changes and closes the Settings control panel.
Clicking Cancel closes the Settings control panel without saving changes.
To add another functional area, on the Functional area tab click Add and follow steps 4 through 7 in the
previous procedure.
To display a dierent functional area for editing, select it from the drop-down list.
Delete a functional area by clicking Delete next to the functional area selected in the drop-down list.
Next, create business rules to associate the validation rules in your data ows with your functional areas.
Related Information
7.1.2Creating business rules
After creating functional areas, associate the business rules to each functional area as follows.
Note
If you do not create business rules, each validation rule in the jobs that you have associated with a
functional area becomes its own business rule.
Management Console Guide
Data Validation Dashboard Reports
PUBLIC 117
1. In the Settings control panel, click the Business rule tab.
On the Business rule tab, the default repository displays. (To change the repository, click the Repository
tab, select a dierent repository, and click Apply.)
2. From the drop-down list, select the functional area to which this business rule will belong.
3. In the business rule denition area, type a name for the business rule such as Phone number.
4. Select a priority for how signicant this group will be to your business end users: High, Medium, or Low.
5. Type an optional description for the business rule such as Phone and FAX. In this example, the validation
rule checks to see if telephone and fax numbers in the USA conform to the seven-digit standard.
6. Click Save.
A list of validation rules appears. Select the validation rules you want to include in this business rule. See
the following table for a description of the columns in the lists of validation rules (scroll horizontally to view
the other columns).
7. From the list of Available validation rules, select the check box for all of the rules to include in this business
rule and click the arrow button to move it to the Associated validation rules pane.
Note
Validation rules are not reusable among business rules (you can use a validation rule only once and
only in one business rule).
8. Click Apply to save the changes and keep the Business rule window open, for example to add more
business rules.
Clicking OK saves your changes and closes the Settings control panel.
Clicking Cancel closes the Settings control panel without saving changes.
The columns in the validation rule lists are as follows. Scroll horizontally to view the other columns. Note that
you can change the sort order of the tables by clicking the arrow in a column heading.
Column Description
Validation rule name
The validation rule name. The default is the column name, unless you create a new
name in the Validation transform Properties dialog box.
Description The description for the validation rule.
Full path Describes the hierarchy in the software from the job level to the data ow level to
indicate where this validation rule has been dened.
System conguration The name of the system conguration selected for this job.
To add another business rule, on the Business rule tab click Add and follow steps 3 through 8 in the previous
procedure.
To display a dierent functional area so you can edit its business rules, select it from the Functional area
drop-down list.
To display a dierent business rule for editing, select it from the Business rule drop-down list.
Delete a business rule by clicking Delete next to the business rule selected in the drop-down list.
118
PUBLIC
Management Console Guide
Data Validation Dashboard Reports
Related Information
7.1.3Enabling data validation statistics collection
To enable data validation statistics collection for your reports, you must verify two options—one at the
validation transform level and one at the job execution level.
7.1.3.1 Validation transform level
In Designer, navigate to the validation transforms from which you want to collect data validation statistics for
your reports. For the columns that have been enabled for validation, in the transform editor click the Validation
transform options tab and select the check box Collect data validation statistics.
7.1.3.2 Job execution level
When you execute a job, the Execution Properties window displays. On the Parameters tab, clear the option
Disable data validation statistics collection (the default) before executing the job.
To execute a job without collecting statistics, select the Disable data validation statistics collection option,
which suppresses statistics collection for all the validation rules in that job.
7.2 Viewing Data Validation dashboards
To view Data Validation dashboards, on the Management Console Home page, click Data Validation. The
functional area view displays.
The upper-right corner identies the repository for the reports you are viewing. You can change the repository
to view in the Settings control panel.
Some dashboards let you to drill in to some of the components for more details. The navigation path at the top
of the window indicates where you are in the Data Validation dashboard reports hierarchy. Click the hyperlinks
to navigate to dierent levels.
Related Information
Functional area view [page 120]
Management Console Guide
Data Validation Dashboard Reports
PUBLIC 119
Repository tab [page 124]
7.3 Functional area view
The top-level Data Validation dashboard view is the functional area view. This view includes two dashboards:
Dashboard
Description
Functional area pie chart A current (snapshot) report.
History line chart A historical (trend) report that displays trends over the last 7 days. To display this chart,
click the link below the pie chart.
To change the functional area dashboards to view, select a dierent functional area from the drop-down list at
the top of the window. Select All to view data for all batch jobs in that repository.
If there are no functional areas dened, the chart displays statistics for all jobs for the selected repository.
Related Information
Functional area pie chart [page 120]
History line chart [page 121]
7.3.1Functional area pie chart
The pie chart displays status information for jobs that ran in the time period displayed. The data collection
period begins at the time set on the Repository tab in the Settings control panel and ends with the time you
open the report Web page.
The color codes on this chart apply to the volume of validation rules that passed or failed:
Color
Description
Green The percentage of rules that passed for the selected functional area.
Red The percentage of rules that failed for the selected functional area with a High priority label.
Note
If you have All selected for Functional area, the failed portion appears red and does not
include priority information.
Yellow
The percentage of rules that failed for the selected functional area with a Medium priority label.
Blue The percentage of rules that failed for the selected functional area with a Low priority label.
Click on the failed pie "slices" to drill into the report:
120
PUBLIC
Management Console Guide
Data Validation Dashboard Reports

• If there is at least one functional area and business rule dened, the Business rule view displays.
• If no functional areas or business rules are dened, the Validation rule view displays.
Select the Click to show history link to view the applicable history line chart.
Related Information
Repository tab [page 124]
Business rule view [page 121]
Validation rule view [page 122]
Creating business rules [page 117]
History line chart [page 121]
7.3.2History line chart
The History line chart displays the percentage of all validation rule failures that occurred on each of the last
seven days. The software collects the number of failures for the last run of all of the batch jobs that are
associated with this functional area on each day.
To display the History line chart, click the link below the pie chart.
7.4 Business rule view
The Business rule dashboard is a bar chart that shows the percentage of validation failures for each dened
business rule. You access this chart by clicking on one of the failed “slices” of the functional area pie chart.
Note
If no functional areas or business rules have been dened, drilling down on the functional area pie chart
displays the Validation rule view. Therefore, the “business rules” are the same as the validation rules.
The data collection period begins at the time set on the Repository tab in the Settings control panel and ends
with the time you open the report Web page.
You can lter the view by selecting an option from the Priority drop-down list:
• All
• High priority
• Medium priority
• Low priority
The chart displays 10 bars per page; click the Next or Previous links to view more.
Management Console Guide
Data Validation Dashboard Reports
PUBLIC 121

To view the business rules associated with another functional area, select it from the Functional area drop-
down list.
To see the validation rules that apply to a particular business rule, click on that bar in the chart. The Validation
Rule View displays.
Related Information
Repository tab [page 124]
Validation rule view [page 122]
7.5 Validation rule view
When you view the Functional area pie chart (the Data Validation Home page) and click on one of the failed pie
“slices” to drill into the report, if no functional areas or business rules have been dened, the Validation rule
view displays.
The Validation Rule page includes two dashboards:
Dashboard
Description
Validation rule bar
chart
A current (snapshot) report.
History line chart A historical (trend) report that displays trends over the last 7 days. To display this chart, click the link
below the Validation rules bar chart.
The chart displays 10 bars per page; click the Next or Previous links to view more.
To view the validation rules for a dierent business rule, select it from the Business rule drop-down list.
Related Information
Validation rule bar chart [page 122]
History line chart [page 123]
7.5.1Validation rule bar chart
The Validation rule bar chart displays the percentage of rows that failed for each validation rule.
The Data collection period begins at the time set on the Repository tab in the Settings control panel and ends
with the time you open the report Web page.
122
PUBLIC
Management Console Guide
Data Validation Dashboard Reports
You can click on a bar to display the Sample data view.
Related Information
Repository tab [page 124]
Sample data view [page 123]
7.5.2History line chart
The History line chart displays the percentage of all validation rule failures that occurred on each of the last
seven days. The software collects the number of failures for the last run of all of the batch jobs that are
associated with this functional area.
To display this chart, click the link below the Validation rules bar chart.
7.6 Sample data view
If you have enabled the option to collect sample data in a validation transform, the Sample data page includes
two images:
• Sample data table [page 123]
• History line chart [page 124]
If you have not congured the validation transform to collect sample data, only the History line chart displays.
To view sample data from another validation rule, select it from the drop-down list.
Related Information
7.6.1Sample data table
If you have congured the validation transform to collect sample data , this page displays up to 50 rows of
sample data in tabular form.
The column that maps to the currently selected validation rule appears highlighted.
Management Console Guide
Data Validation Dashboard Reports
PUBLIC 123
Related Information
7.6.2History line chart
The History line chart displays the percentage of all validation rule failures that occurred on each of the last
seven days. The software collects the number of failures for the last run of all of the batch jobs that are
associated with this functional area.
To display this chart, click the link below the sample data table.
7.7 Data Validation dashboards Settings control panel
The dashboard settings window allows you to change the options for your reports.
In the upper-right corner of the window, click Settings.
The three settings tabs are:
• Repository tab [page 124]
• Functional area tab [page 125]
• Business rule tab [page 125]
For all of the Settings pages:
• Click Apply to save the changes and keep the Business rules dialog box open, for example to add more
business rules.
• Clicking OK saves your changes and closes the Settings control panel.
• Clicking Cancel closes the Settings control panel without saving changes.
7.7.1Repository tab
The settings on the Repository tab include:
• Repository—Select a repository to view from the drop-down list.
• View data starting at—Enter the time from when you want start viewing data in the format HH:MM (from
00:00 to 23:59). On the Data Validation dashboard charts, the end of the time window is the moment you
open one of the dashboard Web pages.
For example, entering 02:00 means your data validation reports will display data from the repository
starting at 2:00 a.m. through the time you open the report page. Each dashboard page displays the time
frame for which the dashboard statistics apply.
124
PUBLIC
Management Console Guide
Data Validation Dashboard Reports
7.7.2Functional area tab
For details on how to use the Functional area tab settings, see Creating functional areas [page 116].
7.7.3Business rule tab
For details on how to use the business rule tab settings, see Creating business rules [page 117].
Management Console Guide
Data Validation Dashboard Reports
PUBLIC 125

8 Auto Documentation Reports
Auto Documentation reports provide a convenient and comprehensive way to create printed documentation
for all of the objects you create in SAP Data Services.
Auto Documentation reports capture critical information for understanding your jobs so you can see at a
glance the entire ETL process.
After you create a project, you can use Auto Documentation reports to quickly create a PDF or Microsoft Word
le that captures a selection of job, work ow, and/or data ow information including graphical representations
and key mapping details.
The types of information provided by Auto Documentation reports include:
Information
Description
Object properties Apply to work ows, data ows, and ABAP data ows.
Variables and parameters Apply to jobs, work ows, data ows, and ABAP data ows.
Table usage Shows all tables used in this object and its child objects.
For example for a data ow, table usage information includes data-
stores and the source and target tables for each.
Thumbnails An image that reects the selected object with respect to all other
objects in the parent container. Applies to all objects except jobs.
Mapping tree Applies to data ows.
8.1 Navigation
Auto Documentation reports allow you to navigate to any project, job, work ow, data ow, or ABAP data ow
created in the Designer and view information about the object and its components.
To open Auto Documentation reports, from the Management Console Home page, click Auto Documentation.
Auto Documentation navigation is similar to that of Impact and Lineage reports. The Auto Documentation page
has two primary panes:
• The left pane shows a hierarchy (tree) of objects.
• The right pane shows object content and context.
Expand the tree to select an object to analyze. Select an object to display pertinent information in the right
pane. In the right pane, select tabs to display desired information. Tabs vary depending on the object you are
exploring.
Note that if the subcategory within a tab has a window icon on the far right side of its header bar, you can
collapse or expand that part of the display.
126
PUBLIC
Management Console Guide
Auto Documentation Reports
Related Information
Impact and Lineage Analysis Reports [page 102]
8.1.1Searching for a specic object
1. Type the object name in the Objects to analyze search eld. The search eld is not case sensitive, you may
use the percent symbol (%) as a wildcard, and spaces are allowed.
2. Click the search icon (binoculars) or press Enter.
The top level of the navigation tree displays the current repository. You can change this repository in the
Settings control panel.
When you rst open Auto Documentation, in the right pane the Project tab displays with hyperlinks to the
projects in the repository. You can click on these links to drill into the project to display a list of jobs. You can
also continue to click the job name links to continue drilling into objects for more information (thumbnails,
object properties, and so on).
You can also navigate to this content by selecting objects in the navigation tree. The hierarchy of the tree
matches the hierarchy of objects created in Designer.
• Repository
• Project
• Job
• Work ow
• Data ow
8.1.2Repository
Clicking a repository name in the navigation tree displays the Overview tab in the right pane, which includes the
following:
Option
Description
Repository name The name given to the repository in the Repository Manager.
Repository type The type of repository such as the database type.
Repository version The repository version.
8.1.3Project
Clicking on a project name in the navigation tree displays the Project tab in the right pane, which displays the
list of jobs in the project. You can click on these jobs to drill into the hierarchy.
Management Console Guide
Auto Documentation Reports
PUBLIC 127
8.1.4Job
Clicking on a job name displays information on two tabs:
Tab
Description
Name of job This tab includes:
• Description
• A graphical image of the next level of objects in the job (for example one or
more work ows or data ows)
• Variables and parameters used in the job
Table usage
This tab lists the datastores and associated tables contained in the selected
object if applicable.
8.1.5Work ow
Clicking on a work ow name displays information on two tabs:
Tab
Description
Name of work ow This tab includes:
• A thumbnail image reects the selected object with respect to all other ob-
jects in the parent container.
For example, if this work ow is the only one in the job, it appears alone;
but if there are two other work ows in the job, they will also appear in the
thumbnail image. You can click the other thumbnail images to navigate to
them, which replaces the content in the right pane with that of the selected
object.
• A graphical image of the object's workspace window as it appears in the
Designer.
You can click on objects to drill into them for more details. Objects that have a
workspace in Designer will display that workspace.
• The object properties displays properties such as Execute only once or
Recover as a unit if set.
• Variables and parameters used in the work ow
Table usage
This tab lists the datastores and associated tables contained in the selected object
if applicable.
8.1.6Data ow
Clicking a data ow name displays information on three tabs:
128
PUBLIC
Management Console Guide
Auto Documentation Reports
Tab Description
Name of data ow This tab includes the following:
• A thumbnail image reects the selected object with respect to all other objects
in the parent container.
• A graphical image of the object's workspace window as it appears in Designer.
You can click on an object in the data ow to drill into it for more information:
A table displays the following information when selected:
• A thumbnail of the table with respect to the other objects in the data ow
• Table properties including Optimizer hints (caching and join rank settings)
and Table basics (datastore and table name)
A transform displays the following information when selected:
• A thumbnail of the transform with respect to the other objects in the data
ow
• Mapping details including column names, mapping expressions, descrip-
tions, and data types.
To go to the top level of the data ow object, click the data ow name in the
navigation tree, or click the Back button on your browser.
• Object properties—Data ow properties such as Execute only once and Degree
of parallelism
• Variables and parameters used in the job
Mapping tree
This tab displays a list of target tables. You can expand or collapse each table display
by clicking its header bar. Each target table lists its target columns and the mapping
expressions (sources) for each.
Table usage This tab lists the datastores and associated tables contained in the selected object if
applicable.
8.2 Generating documentation for an object
For most objects, you can quickly generate documentation in Adobe PDF or Microsoft Word format by clicking
the printer icon next to the object name in the right pane.
8.2.1 Printing Auto Documentation for an object
1. Select the highest-level object you want to document in the left pane.
2. In the right pane, click the printer icon next to the object name.
3. In the Print window, select the check boxes for the items to include in your printed report.
4. Select PDF or Microsoft Word format.
5. Click Print.
The Windows File download dialog box displays. Click Open to generate and open the le now, or click Save
to save the le to any location.
Management Console Guide
Auto Documentation Reports
PUBLIC 129
6. After saving or printing your report, click Close to close the Print window.
8.3 Auto Documentation Settings control panel
The Auto Documentation Settings control panel allows you to change the options for your reports.
In the upper-right corner of the window, click Settings.
The following options are available in the Settings tab:
• Repository—Select a repository from the drop-down list box and click Apply.
• ImageDisplay—Specify whether a whole or partial image is displayed for large images. Setting the option to
Partial improves performance and memory utilization.
The About tab provides software version information.
130
PUBLIC
Management Console Guide
Auto Documentation Reports
9 Data Quality Reports
Many Data Quality transforms generate information about the data being processed. Data Quality reports
provide access to that data processing information. You can view and export these Crystal Reports for batch
and real-time jobs. The statistics-generating transforms include Match, USA Regulatory Address Cleanse, Data
Cleanse, Global Address Cleanse, Geocoder, and DSF2 Walk Sequencer transforms. Report types include
addressing reports, transform-specic reports, and transform group reports.
Note
Viewing or exporting data quality reports requires that you have rst installed the Data Services APS
services on the same machine that contains the BI platform (or IPS) Central Management Server. See the
Data Services Installation Guide and Master Guide for more information.
Related Information
9.1 Conguring report generation
To enable report generation, ensure the option Generate report data in the transform editor is enabled, or use
substitution variables to set this and other transform options at a repository level.
For details about setting the options for transforms, see the Reference Guide. For details about using
substitution variables, see the Designer Guide.
The following table lists the available reports and their associated transforms.
Report
Transform
US CASS report: USPS Form 3553 USA Regulatory Address Cleanse
NCOALink Processing Summary report USA Regulatory Address Cleanse
US Addressing report USA Regulatory Address Cleanse
US Regulatory Locking report USA Regulatory Address Cleanse
Delivery Sequence Invoice report DSF2 Walk Sequencer
Canadian SERP report: Statement of Ad-
dress Accuracy
Global Address Cleanse
Australia AMAS report: Address Matching
Processing Summary
Global Address Cleanse
Management Console Guide
Data Quality Reports
PUBLIC 131
Report Transform
Address Information Codes Sample re-
port
Global Address Cleanse and USA Regulatory Address Cleanse
Address Information Code Summary re-
port
Global Address Cleanse and USA Regulatory Address Cleanse
Address Validation Summary report Global Address Cleanse and USA Regulatory Address Cleanse
Address Type Summary report Global Address Cleanse and USA Regulatory Address Cleanse
Address Standardization Sample report Global Address Cleanse and USA Regulatory Address Cleanse
Address Quality Code Summary report Global Address Cleanse
Data Cleanse Information Code Summary
report
Data Cleanse
Data Cleanse Status Code Summary re-
port
Data Cleanse
Best Record Summary report Match
Match Contribution report Match
Match Criteria Summary report Match
Match Source Stats Summary report Match
Match Duplicate Sample report Match
Match Input Source Output Select report Match
Match Multi-source Frequency report Match
Geocoder Summary report Geocoder
9.2 Opening and viewing reports
To view Data Quality reports, from the Management Console Home page, click Data Quality Reports. The Batch
job reports tab appears.
Note
To view a Data Quality report, after clicking it, you will need to enter a user name and password for the
Data Services repository. Once you have logged in, you may view as many Data Quality reports as you want
during a single session in the Management Console without needing to provide the password again. This
is the default behavior. See the Administrator Guide for more information, including how to change this
behavior.
Note
Reports require the Arial Unicode MS font. This font is designed to support a wide variety of code pages
and is included with Microsoft Oce 2002 and later. To view Unicode data in PDF reports, this font must be
installed on the computer being used to view the reports. For more information about the Arial Unicode MS
font, including how to install from a Microsoft Oce CD, visit the Microsoft Web site.
132
PUBLIC
Management Console Guide
Data Quality Reports
9.3 Lists of available reports
After opening the Data Quality Reports module in the Data Services Management Console, the Batch job
reports tab displays a list of jobs and their associated available reports. Click the Real-time job reports tab to
display reports available for real-time jobs. The Real-time job reports tab includes the same information that is
on the Batch job reports tab.
The upper-right corner of either the Batch or Real-time pages displays the repository for the reports you are
viewing. You can change the repository that you want to view in the Settings control panel.
You can lter the list of reports displayed by selecting a job name and/or a date or date range.
To lter by job, select the job name from the Job name drop-down menu. Or type the name, or type part of the
name and a wildcard character (% or *), into the wildcard search string box and click Search. The Search eld
is not case sensitive and spaces are allowed.
To lter by when the job(s) executed, select one of the following options:
• Show last execution of a job.
• Show status relative to today: Select the number of previous days over which to view job executions.
• Show status as a set period: Type the date range or select the dates by clicking the calendar icons.
Click Search to update the list.
The report list includes the following headings. You can sort or reverse sort on any column by clicking the arrow
next to the column name.
Heading
Description
Report Click the icon in this column to go to a page that lists the reports for the associated job.
Job name The name of the job in the Designer.
Status The execution status of the job: green (succeeded), yellow (had one or more warnings), red (had
one or more errors), or blue (still executing).
Start time and End time The start and end dates (in the format yyyy-mm-dd) and times (in the format hh:mm:ss).
Execution time The elapsed time to execute the job.
Rows extracted and
Rows loaded
The number of rows read by the job and the number of rows loaded to the target.
Related Information
Data Quality Reports Settings control panel [page 134]
Management Console Guide
Data Quality Reports
PUBLIC 133
9.4 List of reports by job
On the list of available reports page (either the Batch job reports or Real-time reports tabs), click an icon in the
Report column to display a page with the list of reports that are available for the associated job. The job name
displays at the top of the page.
Filter the list by performing one of the following actions:
Action
Description
Select a report name from the drop-down list. This action automatically populates the Search box and sub-
mits the request.
Type the name or part of the name and a wildcard character
(% or *) into the Search box and click Search.
The Search eld is not case sensitive and spaces are al-
lowed.
The list of reports includes the following column headings. You can sort or reverse sort on any column by
clicking the arrow next to the column name.
Heading
Description
Report Click the icon in this column to open the report, which displays in a new browser window. The three
icons represent the type of report:
• Summary
• Transform-specic report
•
Report for a group of transforms (match set or associate set)
Path name
The transform location within the job if the report comes from a transform, match set, or associate
set. The location displays in the form of <data ow name>/<transform name>. If the report comes
from a job summary report, the job name displays.
Report name The type of report (for example Address Type Summary report or Match Contribution report).
Object name The source object used for the report, typically the transform name used in the data ow (blank for
job summary reports).
9.5 Data Quality Reports Settings control panel
Use the Settings control panel to select a dierent repository for viewing reports. In the upper-right corner of
the window, click Settings. Select a repository from the drop-down list box and click Apply.
9.6 Report options
After opening a report, use the toolbars at the top (and bottom) of the report window to perform the following
tasks:
134
PUBLIC
Management Console Guide
Data Quality Reports
• Export to one of the following formats: Crystal Report (RPT), Adobe Acrobat (PDF), Microsoft Word -
Editable (RTF), or Rich Text Format (RTF). The Export Report dialog box also lets you select a page range to
export.
• Print the full report or a range of pages
• Show the group tree, which displays a hierarchical navigation tree pane. Select links in the tree to navigate
to dierent sections of the report.
• Navigate through the report using the page links and elds at the top and bottom of the report page
• Refresh the report
• Search for text
• Resize the view
In many of the reports, you can select the transform name, path, charts, or other components to display a
separate report that is specic to that component. To identify which components are enabled for viewing as
a subreport, move the cursor over the report and look for objects that make it change to a hand icon. The
description (name) of the newly displayed report then appears in the tab at the top of the report. The tabs
displays all the subreports you have accessed. Select Main Report to return to the original report.
9.7 Troubleshooting reports
The following are several report tips and solutions that you can use to troubleshoot report problems.
Font
Reports require the Arial Unicode MS font. This font is designed to support a wide variety of code pages
and is included with Microsoft Oce 2002 and later. To view Unicode data in PDF reports, this font must be
installed on the computer being used to view the reports. For more information about the Arial Unicode MS
font, including how to install from a Microsoft Oce CD, visit the Microsoft Web site.
Slow reports or timeout error
If you encounter a timeout error or notice that your reports are running appreciably slower, your
DBA should update the database statistics on your repository database, primarily the AL_STATISTICS
ADDRINFOCODEDATA ADDRSTATUSCODEDATA table. In Oracle, this is called "Gather statistics."
If you use an Oracle database, here are some additional options that your DBA can modify to try to correct the
issue (other databases may have similar options):
• Increase the Processes value to 400 or greater.
• Increase the PGA Memory to 194MB or greater.
• Set the Cursor_Sharing value to Force.
Management Console Guide
Data Quality Reports
PUBLIC 135

9.8 USA CASS report: USPS Form 3553
The USPS requires Form 3553 each time you submit a mailing in which the addresses are CASS certied.
To generate the USPS Form 3553, include the USA Regulatory Address Cleanse transform in your data ow and
ensure that you make the following settings:
• Enable Generate Report Data located in the Report And Analysis group.
• Disable Disable Certication located in the Non Certied Options group.
• Complete all CASS required options in the CASS Report Options group.
• Set all CASS required options in the Assignment Options group to Yes.
• Specify valid address directory paths for each directory, or set values for the applicable substitution
parameters and use the substitution parameters for directory paths.
For complete information about CASS, visit the USPS PostalPro Web site at https://postalpro.usps.com/
certications/cass .
Related Information
9.9 NCOALink Processing Summary Report
Description
The NCOALink Processing Summary Report can provide a detailed breakdown of the various codes returned
by NCOALink and ANKLink processing, information regarding how the NCOALink job was congured, and
summary information for some job processing statistics. The report generates information and completes the
applicable elds based on your service provider level. The NCOALink Processing Summary Report can be used
for USPS certication and audit purposes.
To enable the report
To generate this report, use the USA Regulatory Address Cleanse transform. On the Options tab, enable the
following options or congure the appropriate substitution parameters:
• Set
Assignment Options Enable NCOALink to Yes.
• Set Report And Analysis Generate Report Data to Yes.
• Ensure that the other required NCOALink elds on the Options tab have been correctly congured.
136
PUBLIC
Management Console Guide
Data Quality Reports
How to read this report
The rst section of the report includes the report title, the date of the report, and other general information
about your job as follows:
• The job name
• The run ID, which species a unique identication of an instance of the executed job
• The name of the repository where the job is located
• The ocial transform name
• The path to the transform in the form <data ow name>/<transform name>
Depending on the transform option settings, the remainder of the report includes the following sections.
Section
Description
Move Update Summary Contains information about the job conguration and statistics for move-updated addresses
as well as pre-move update counts for Postcode2, DPV, LACSLink, and SuiteLink matches.
The Data Returned value shows the processing mode for the mailing list. The possible values
are C (change of address), F (return codes), or S (statistics). For a detailed description of the
values, see the Reference Guide. To change the processing mode, modify the NCOALink
Processing Options List Processing Mode option in the transform.
The Match Logic value is a single character code that denotes the combination of move
types processed. The setting for each move type (business, individual, and family) displays
in the area of the report immediately below the list of all processes used. To change the
match logic, modify the NCOALink Processing Options Retrieve Move Types option
in the transform.
The Mail Class character code is derived from the settings for processing standard mail, rst
class mail, package services, and periodicals. The setting for each mail class is shown in the
section immediately below the list of all processes used. To change the settings, modify the
previously noted elds located in the
NCOALink Processing Options option group in
the transform.
NCOALink Move Type Sum-
mary
Displays statistics for the types of moves (Individual, Family, or Business) processed.
NCOALink Return Code
Summary
Displays a summary of the NCOALink codes returned.
Move Eective Date Distri-
bution Analysis
Contains the number of records in each category and time period. Categories include new
address provided, new address not available, and new address not provided. Time frames
include in months: 0-3, 4-6, 7-12, 13-18, 19 plus.
ANKLink Return Code Sum-
mary
If ANKLink is enabled, displays a summary of the ANKLink codes returned. The section won't
display if there aren't any ANKLInk return codes in the output.
Return Code Descriptions
If enabled in the NCOALink Report Options Generate Return Code Descriptions
option, displays detailed return code descriptions.
Service Provider Summary Contains information specic to processing for limited or full service providers. This section
does not display if processing the job as an end user.
Management Console Guide
Data Quality Reports
PUBLIC 137
Related Information
Exporting NCOALink report data [page 27]
9.10 Delivery Sequence Invoice report
Description
The DSF2 Delivery Sequence Invoice is required by the USPS when you claim walk sequence discounts or when
you are certifying.
The Delivery Sequence Invoice report is automatically generated when you include the DSF2 Walk Sequencer
transform in your job.
Note
The DSF2 Walk Sequencer transform adds walk sequencing information to your data. However, to claim
walk sequence postage discounts, you must further process your data using presorting software (such as
the SAP BusinessObjects Presort product). There are four walk sequence discounts for which you may be
eligible:
• Carrier Route
• Walk Sequence
• 90% Residential Saturation
• 75% Total Active Saturation
Tip
The Delivery Sequence Invoice report can be large, sometimes exceeding 1000 pages. The number of
pages relates to the number of postcode1/sortcode route combinations in your input.
9.10.1Contents of report
The Delivery Sequence Invoice contains header information and information for each collection of data
processed. Header information includes the licensee name, customer ID, site location, and processing date.
The body of the report lists data for each postcode/sortcode route combination. The list below describes the
data reported in the Delivery Sequence Invoice.
Data
Description
Total Deliveries Indicates the total number of deliveries within the specied postcode/sortcode
combination.
138 PUBLIC
Management Console Guide
Data Quality Reports
Data Description
Total Residences Indicates the total number of residences within the specied postcode/sortcode
combination.
Delivery Points Sequenced Indicates the number of delivery points sequenced by the transform for the
specic postcode/sortcode combination
Residences Sequenced Indicates the number of residences sequenced for the specic postcode/sort-
code combination.
Percent Residences Indicates the percent of the residences sequenced by the transform for the
specied postcode/sortcode combination. The formula is 100 (residences se-
quenced ÷ total residences).
Percent Active Deliveries Indicates the percent of delivery points sequenced by the transform for the
specied postcode/sortcode compination.The formula is 100 (delivery points
sequenced ÷ total deliveries).
Discounts Indicates the type of discount the postcode/sortcode combination is eligible for.
A = Sortcode Route (Carrier Route)
B = 125 Walk Sequence
C = 90% Residential Saturation
D = 75% Total Active Saturation
9.11 US Addressing Report
The US Addressing Report provides a detailed breakdown of the various codes returned by DPV, DSF2,
LACSLink, and SuiteLink processing.
DPV, SuiteLink, and LACSLink are mandatory for USPS address processing according to CASS guidelines. The
content of the report is based on what is enabled in your job:
• If NCOALink is enabled, report contains a Post- and Pre-NCOALink section.
• If DataSource ID is enabled, report contains:
• Cumulative Summary section.
• For each unique Physical Source ID, separate counts for that ListID.
• Post- and Pre-NCOALink sections for each Physical Source ID (when NCOALink is enabled).
• Basic report contains DPV, SuiteLink, and LACSLink information.
Enabling the report [page 140]
Percent calculation [page 140]
Information in the US Addressing report [page 141]
DPV sections [page 142]
The US Addressing Report contains DPV sections.
Management Console Guide
Data Quality Reports
PUBLIC 139
NCOALink sections [page 143]
When NCOALink is enabled, the US Addressing Report contains post- and pre-NCOALink sections.
Information in the DSF2 sections [page 143]
LACSLink sections [page 144]
SuiteLink sections [page 144]
Related Information
9.11.1Enabling the report
To enable the US Addressing Report with the USA Regulatory Address Cleanse transform, complete the
following options or congure the appropriate substitution variables:
• In the Report and Analysis group, select <Yes> for the Generate Report Data option.
• In the Reference Files group, set the DPV Path, DSF2 Augment Path, LACSLink Path, and SuiteLink Path as
appropriate (you can use substitution variables).
• In the Assignment options group, set Enable DPV, Enable DSF2 Augment, Enable LACSLink, and Enable
SuiteLink to <Yes> as appropriate.
9.11.2Percent calculation
Many areas of the USA Regulatory Address Cleanse transform reports include percentages. The software
calculates the denominator portion of the percentage calculation based on the following for the U.S.
Addressing Report and the Address Validation Summary report:
US Addressing Report: The calculation of the denominator is based on the total of all DPV return codes of Y, D,
S, and the addresses that are not DPV valid.
Address Validation Summary report: The calculation of the denominator is based on the total of all records
processed by the USA Regulatory Address Cleanse transform.
For both reports, the following record types will no longer be factored into the percentage calculation:
• Number of records where all input elds mapped into the transform contain NULL or blank values.
• Number of records that contain Unicode characters.
• Number of records that are not processed because of Z4Change functionality.
Related Information
US Addressing Report [page 139]
140
PUBLIC
Management Console Guide
Data Quality Reports
Address Validation Summary report [page 150]
9.11.3Information in the US Addressing report
The rst section of the US Addressing Report includes the report title, the date of the report, and other general
information about your job as follows:
• The job name
• The run ID, which species a unique identication of an instance of the executed job
• The name of the repository where the job is located
• The ocial transform name
• The path to the transform in this format: <data flow name> / <transform name>
• Audit information, which species how many records were processed during address cleansing, the start
and end time, any idle time, and the amount of active processing time
The remainder of the report includes:
• LACSLink summary
• Counts for the LACSLink return codes encountered during processing
• DPV summary
• Counts for the DPV return codes encountered during processing
• SuiteLink return codes
• DSF2 counts from the Second Generation Delivery Sequence File (DSF2) Summary
• DSF2 Address Delivery Types
Pre and post NCOALink processing sections appear in the report when NCOALink is enabled in the job:
• Pre NCOALink counts exist for DPV, DSF2, LACSLink, and SuiteLink.
• Post NCOALink counts exist for DPV and DSF2 counts/statistics.
Management Console Guide
Data Quality Reports
PUBLIC 141
9.11.4DPV sections
The US Addressing Report contains DPV sections.
DPV sections of the U.S. Addressing Report
Section name
Contents
Delivery Point Validation (DPV) Summary
Number and percent for the following:
• DPV Validated Addresses
• Addresses Not DPV Valid
• CMRA Validated Addresses
• PBSA Validated Addresses
• DPV Vacant Addresses
• DPV NoStats Addresses
• Drop Addresses (including CMRA)
• Throwback Addresses
• DPV Door Not Accessible
• DPV No Secure Location
DPV Return Codes
Separate DPV number and percent for each DPV status indi-
cator: Y, S, and D.
DPV Enhanced Return Codes Count and percentage for the following address types:
• Conrmed for primary/secondary components neces-
sary to determine a valid delivery point (Code Y)
• Conrmed for primary only, secondary present but not
conrmed or single trailing alpha dropped to match and
secondary required (Code S)
• Conrmed for primary only, and secondary was missing
(Code D)
• Conrmed but USPS delivery not provided (Code R)
DPV No Stats Reason Codes
Count and percentage for the following address types:
• Internal Drop Addresses (IDA) (Code 01)
• CDS NoStat addresses that have not yet become deliv-
erable (Code 02)
• CMZ (College, Military, and Other Types) (Code 04)
• Regular NoStat Addresses (Code 05)
• Secondary Required addresses requiring secondary in-
formation (Code 06)
• Other codes: Collisions or invalid codes
142 PUBLIC
Management Console Guide
Data Quality Reports

9.11.5NCOALink sections
When NCOALink is enabled, the US Addressing Report contains post- and pre-NCOALink sections.
Post-NCOALink Processing
Pre-NCOALink Processing
• DPV Validated Addresses
• Addresses Not DPV Valid
• CMRA Validated Addresses
• PBSA Validated Addresses
• DPV Vacant Addresses
• DPV NoStats Addresses
• Drop Addresses (including CMRA)
• Throwback Addresses
• DPV Door Not Accessible
• DPV No Secure Location
• DPV Return Codes (Y, S, and D)
• DPV Enhanced return Codes (Y, S, D, and R)
• DPV No Stats Reason Codes (01, 02, 04, 05, 06, and
other)
• Second Generation Delivery Sequence File (DSF2)
Summary (Business Addresses, Seasonal Addresses,
and Educational Institute Addresses)
• Address Delivery Types (Curb, Central, Door Slot,
Neighborhood Delivery Centralized Box Unit)
• Locatable Address Conversion (LACSLink) Summary
• LACSLink Return Codes (A, 92, 00, 14, and 09)
• SuiteLink Return Codes (A and 00)
• Delivery Point Validation (DPV) Summary
• DPV Return Codes (Y, S, and D)
• DPV Enhanced Return Codes (Y, S, D, and R)
• DPV No Stats Reason Codes (01, 02, 04, 05, 06, and
other)
• Second Generation Delivery Sequence File (DSF2)
Summary (Business Addresses, Seasonal Addresses,
and Educational Institute Addresses)
• Address Delivery Types (Curb, Central, Door Slot,
Neighborhood Delivery Centralized Box Unit)
9.11.6Information in the DSF2 sections
The US Addressing Report contains the following sections for DSF2:
Section name
Contents
Second Generation Delivery
Sequence File (DSF2) Sum-
mary
Number and percentage of addresses in your le that match these DSF2 address catego-
ries:
• Drop addresses (including CMRA)
• Business addresses
• Seasonal addresses
• Educational Institute addresses
When you are processing for NCOALink, the US Addressing Report includes pre-NCOALink
processing information and post-NCOALink processing information for this section.
Management Console Guide
Data Quality Reports
PUBLIC 143
Section name Contents
Address Delivery Types Number and percentage of addresses for these delivery type categories:
• Curb
• Central
• Door Slot
• Neighborhood Delivery Centralized Box Unit
When processing for NCOALink, the US Addressing Report includes pre and post NCOALink
processing information for this section.
9.11.7LACSLink sections
The US Addressing Report contains the following sections for LACSLink:
Section name
Contents
Locatable Address Conversion Sum-
mary
Number and percent of records that were converted and the number and percen-
tages of addresses that were not converted through LACSLink.
LACSLink Return Codes Number and percent of records for each return code type.
When processing for NCOALink, the US Addressing Report includes pre and post NCOALink processing
information for the Locatable Address Conversion Summary and the LACSLink Return Codes sections.
9.11.8SuiteLink sections
The US Addressing Report contains the following section for SuiteLink:
Section name
Contents
SuiteLink Return Codes The number and percent of SuiteLink matches for the following return codes:
• A: Secondary exists and assignment made.
• 00: Lookup was attempted but no assignment.
When processing for NCOALink, the US Address Report includes SuiteLink Return Codes only for pre
NCOALink processing.
144
PUBLIC
Management Console Guide
Data Quality Reports

9.12 DSF2 Augment Statistics Log File
If you create a DSF2 certied mailing list, submit the DSF2 Augment Statistics log le to the USPS.
The USA Regulatory Address Cleanse transform generates and stores the DSF2 Augment Statistics Log File in
your repository. Export the log le using the Data Services Management Console.
SAP Data Services uses the following naming convention for the log le: [DSF2_licensee_ID][mm]
[yy].dat
The USPS regulates the contents of the log le and requires that you e-mail it to them monthly by the third
business day of each month. For details about this process, read the DSF2 Licensee Performance Requirements
document, which is available on the USPS PostalPro Web site at https://postalpro.usps.com/DSF2_LPR
.
Log le retention and automatic deletion
Data Services deletes log les on a periodic basis. The system default setting is 30 days. If 30 days aren't
enough for you, we recommend that you extend the default setting to a longer, such as 50 days.
Additionally, the USPS requires that you keep USPS data around for them to examine for several years.
Therefore, we recommend that you export the log les from your repository to a local directory that you create
specically for USPS data. Consider exporting the les on a monthly basis, before the default delete time
period expires. An additional benet to exporting the log les periodically is that you reduce the space in your
repository for more ecient processing.
Extend the retention period for log les in the Central Management Console (CMC). Go to the Data
Services Application Settings area. The option is History Retention Period. For complete instructions, see the
Administrator Guide.
Consult your USPS DSF2 license agreement for all rules and requirements for retaining USPS information.
9.13 US Regulatory Locking Report
Description
The software generates this report only when it encounters a false positive address during DPV or LACSLink
processing with the USA Regulatory Address Cleanse transform.
The USPS includes false positive addresses with the DPV and LACSLink directories as a security precaution.
Depending on what type of user you are, the behavior varies when the software encounters a false positive
address.
If you use DPV or LACSLink processing for purposes other than NCOALink or if you are an NCOALink end user
without an alternate stop processing agreement, the US Regulatory Locking Report contains the false positive
address record (lock record) and lock code. You need this information in order to retrieve the unlock code from
the SAP Service Marketplace.
Management Console Guide
Data Quality Reports
PUBLIC 145
If you are an NCOALink service provider or end user with an alternate stop processing agreement, the US
Regulatory Locking Report contains the path to the DPV or LACSLink log les. The log les must be submitted
to the USPS.
For more information about DPV and LACSLink locking and unlocking, see the Designer Guide.
To enable this report
To enable this report with the USA Regulatory Address Cleanse transform, verify the following options, or
congure the appropriate substitution parameters:
• In the Report And Analysis options group, ensure Generate Report Data is set to Yes.
• In the Reference Files options group, set the DPV Path or LACSLink Path as appropriate.
• In the Assignment options group, set Enable DPV or Enable LACSLink to Yes.
How to read this report
The rst section of the report includes the report title, the date of the report, and other general information
about your job as follows:
• The job name
• The run ID, which species a unique identication of an instance of the executed job
• The name of the repository where the job is located
• The ocial transform name
• The path to the transform in the form data <ow name>/<transform name>
• Audit information, which species how many records were processed during address cleansing, the start
and end times, any idle time, and the amount of active processing time
Depending on your user type, the second section of the report contains either the lock code as well as the
information related to the record that caused the directory locking or the path to the DPV or LACSLink log les.
Related Information
9.14 Canadian SERP report: Statement of Address Accuracy
Description
The Canadian Software Evaluation and Recognition Program (SERP) Statement of Address Accuracy report
includes statistical information about Canadian address cleanse processing such as the Address Accuracy
Level.
146
PUBLIC
Management Console Guide
Data Quality Reports

To generate the report
To generate this report with the Global Address Cleanse transform, ensure the following options are dened, or
congure the appropriate substitution parameters:
• In the Global Address Cleanse transform, enable Report And Analysis Generate Report Data .
• In the Canada group, complete all applicable options in the Report Options subgroup.
• In the Engines section, set Canada to Yes.
9.15 Australian AMAS report: Address Matching Processing
Summary
Description
The Australian Address Matching Approval System (AMAS) Address Matching Processing Summary report
includes statistical information about Australian address cleanse processing.
To generate the report
To generate this report with the Global Address Cleanse transform, ensure the following options have been
dened, or congure the appropriate substitution parameters:
• In the Global Address Cleanse transform, enable Report And Analysis Generate Report Data .
• In the Australia group, complete all applicable options in the Report Options subgroup.
• In the Engines section, set Australia to Yes.
9.16 New Zealand Statement of Accuracy (SOA) report
Description
The New Zealand Statement of Accuracy (SOA) report includes statistical information about address cleansing
for New Zealand.
Management Console Guide
Data Quality Reports
PUBLIC 147
To enable the report
• In the Global Address Cleanse transform, enable Report And Analysis Generate Report Data .
• In the Global Address Cleanse transform, set Country Options Disable Certication to No.
• Complete all applicable options in the
Global Address Report Options New Zealand subgroup .
• In the Engines section, set Global Address to Yes.
Note
The software does not produce the SOA Report when Global Address certication is disabled or when there
are no New Zealand addresses included in the present job.
Related Information
Exporting New Zealand SOA certication logs [page 28]
9.17 Address Information Codes Sample report
Description
The Address Information Codes Sample report is a sampling of the records that were assigned information
codes (Global Address Cleanse) or fault codes (USA Regulatory Address Cleanse) during processing. The
transform uses these codes to indicate why it was unable to standardize the address. These codes can help you
correct the data in specic records or nd a pattern of incorrect data entry.
The software initially outputs the rst fault record encountered. After that, it outputs every 100th fault record
(for example 1, 101, 201, and so on). There is a maximum of 500 fault records.
Note
Depending on your conguration settings, you might see dierent information/fault records each time the
transform processes a particular set of input records.
How to read this report
The rst section of the report includes the report title, the date of the report, and other general information
about your job as follows:
• Job name
• Run ID, which species a unique identication of an instance of the executed job
148
PUBLIC
Management Console Guide
Data Quality Reports
• Repository name where the job is located
• Full transform name
• Path to the transform in the form <data ow name>/<transform name>
• Engine name. For the Global Address Cleanse transform, it is the name of the global engine that processed
the data, and for the USA Regulatory Address Cleanse transform, it is always USA.
The second section of the report includes a table that species the eld details for each record for which an
information/fault code was found. The table is subdivided by country.
The third section of the report lists a description of each information/fault code.
Related Information
9.18 Address Information Code Summary report
Description
The Address Information Code Summary report provides record counts of each information or fault code of a
specic project.
How to read this report
The rst page of the report is a summary of all the information codes if one of the following is true:
• The job contains more than one USA Regulatory Address Cleanse or Global Address Cleanse transform.
• A single Global Address Cleanse transform processes records from more than one engine.
Subsequent pages will include a report for each transform or engine.
The rst section of the summary page includes the report title, the date of the report, and other general
information about your job as follows:
• Job name
• Run ID, which species a unique identication of an instance of the executed job
• Repository name where the job is located
• Ocial transform name
• Path to the transform in the form <data ow name>/<transform name>
• Audit information, which species how many records were processed during address cleansing, the start
and end time, any idle time, and the amount of active processing time
The second part of the report includes a bar graph that shows how many dierent information/fault codes
were assigned during processing. With this graph, you should be able to see which information/fault code
occurred the most frequently, which could help you detect any consistent problems with your data.
Management Console Guide
Data Quality Reports
PUBLIC 149
The section below the bar graph shows how many dierent information/fault codes occurred along with a
description of each code. For the Global Address Cleanse transform, this section is organized by engine name.
At the end of the listing, the report shows the total number of information/fault codes assigned.
Related Information
9.19 Address Validation Summary report
Description
The Address Validation Summary report provides record validation statistics for each Global Address Cleanse
transform or USA Regulatory Address Cleanse transform of a specic job.
How to read this report
The rst section includes the report title, the date of the report, and other general information about your job
as follows:
• Job name
• Run ID, which species a unique identication of an instance of the executed job
• Repository name where the job is located
• Ocial transform name
• Path to the transform in the form <data flow name> / <transform name>
• Audit information, which species how many records were processed during address cleansing, the start
and end time, any idle time, and the amount of active processing time
The second section of this report includes a bar graph that shows the output elds and how many were
unchanged or corrected during address cleansing.
The third section of this report also shows the same data as in the second section, but in a table.
If NCOALink processing is enabled, this report also displays pre and post NCOALink processing graphs and
statistics.
Related Information
Percent calculation [page 140]
150
PUBLIC
Management Console Guide
Data Quality Reports
9.20 Address Type Summary report
Description
The Address Type Summary report contains record counts of each Assignment_Type eld value used per
Global Address Cleanse transform or Address_Type eld value per USA Regulatory Address Cleanse transform
of a specic job.
How to read this report
The rst section of the report includes the report title, the date of the report, and other general information
about your job as follows:
• Job name
• Run ID, which species a unique identication of an instance of the executed job
• Repository name where the job is located
• Ocial transform name
• Path to the transform in the form <data ow name>/<transform name>
• Audit information, which species how many records were processed during address cleansing, the start
and end time, any idle time, and the amount of active processing time
The second section includes a pie chart that shows the percentage for the values of the Assignment_Type eld
(Global Address Cleanse) and the Address_Type eld (USA Regulatory Address Cleanse) used in the transform.
The third section of this report also shows this same data as in the second section, but in a table.
If NCOALink processing is enabled, this report also displays pre and post NCOALink processing graphs and
statistics.
9.21 Address Standardization Sample report
Description
The Address Standardization Sample report shows records where elds changed during processing. The elds
displayed are your input elds and the associated output elds. Status codes are on the report to indicate why
the change was necessary. This information helps you to determine which elds are frequently incorrect. You
can also use this report to verify that your addresses are standardized correctly.
Management Console Guide
Data Quality Reports
PUBLIC 151
How to read this report
The rst section of the report includes the report title, the date of the report, and other general information
about your job as follows:
• Job name
• Run ID, which species a unique identication of an instance of the executed job
• Repository name where the job is located
• Full transform name
• Path to the transform in the form <data ow name>/<transform name>
• Engine name. For the Global Address Cleanse transform, it is the name of the global engine that processed
the data, and for the USA Regulatory Address Cleanse transform, it is always USA.
The second section of the report includes the table that shows which records had elds that were standardized
along with the status code that explains why the change was necessary. The section also shows the country
and the input source taken from the Physical Source eld.
The nal page of the report has a description of the status codes.
Related Information
9.22 Address Quality Code Summary report
Description
The Address Quality Code Summary report provides record counts of each quality code assigned per Global
Address CleanseAddress Quality Code transform for a specic job. This report is not available for the USA
Regulatory Address Cleanse transform.
How to read this report
Address Quality Code SummaryThe rst page of the report is a summary of all the information codes if:
• The job contains more than one Global Address Cleanse transform.
• A single Global Address Cleanse transform processes records from more than one engine.
In these cases, subsequent pages will include a report for each transform or engine.
The rst section of the report includes the report title, the date of the report, and other general information
about your job as follows:
152
PUBLIC
Management Console Guide
Data Quality Reports
• Job name
• Run ID, which species a unique identication of an instance of the executed job
• Repository name where the job is located
• Ocial transform name
• Path to the transform in the form <data ow name>/<transform name>
• Audit information, which species how many records were processed during address cleansing, the start
and end time, any idle time, and the amount of active processing time
The second section of the report includes a pie chart that shows the percentage of the quality codes that were
assigned during processing. This chart illustrates the level of quality of your data.
The third section of the report shows, in a table format, the quality codes that were assigned, the record count,
and a description of each quality code. This section is also divided by engine name and the country.
Related Information
9.23 Data Cleanse Information Code Summary report
Description
The Data Cleanse Information Code Summary report provides record counts of each information code for a
specic job. The information codes identify characteristics about the data. For example:
• some data went to the Extra output elds
• some person data has a family name, but not a given name
• a date's year was converted from 2-digits to 4-digits
How to read this report
The rst section of the summary page includes the report title, date, and other general information about your
job as follows:
• Job name
• Run ID, which species a unique identication of an instance of the executed job
• Repository name where the job is located
• Ocial transform name
• Path to the transform <dataow name>/<transform name>
• Audit information, which species how many records were processed during data cleansing, the start and
end time, any idle time, and the amount of active processing time.
Management Console Guide
Data Quality Reports
PUBLIC 153

The report begins with a summary of the frequency of information codes. The rest of the charts show the
information codes per parser such as Date, Person, Firm, Phone, and so on. With the information in this report,
you should be able to see which information codes occurred most frequently. This information could help you
detect any consistent problems with the data.
To enable the report
In the Designer, choose
Tools Substitution Parameter Congurations and congure the Generate Report
Data option to [$$ReportsDataCleanse]. This is a parameter that can be congured to either Yes or No for
report generation.
Then, in the Data Cleanse transform, enable
Report And Analysis Generate Report Data
Related Information
9.24 Data Cleanse Status Code Summary report
Description
The Data Cleanse Status Code Summary report provides record counts for each generated status code. The
status codes describe the standards applied in the Data Cleanse transform.
How to read this report
The rst section of the summary page includes the report title, date, and other general information about your
job as follows:
• Job name
• Run ID, which species a unique identication of an instance of the executed job
• Data Cleanse Status CodeRepository name where the job is located
• Ocial transform name
• Path to the transform <dataow name>/<transform name>
• Audit information, which species how many records were processed during data cleansing, the start and
end time, any idle time, and the amount of active processing time.
The charts include a list of status code names, descriptions, and the number of records that used each status
code. The report includes a chart and data for each parser, for example, Date, Phone, Firm, Person, and so on.
154
PUBLIC
Management Console Guide
Data Quality Reports

With this report, you should have a better understanding of the generated status codes that show how the data
is standardized and can be used for better matching results with the Match transform.
To enable the report
In the Designer, choose Tools Substitution Parameter Congurations and congure the Generate Report
Data option to [$$ReportsDataCleanse]. This is a parameter that can be congured to either Yes or No for
report generation.
Then, in the Data Cleanse transform, enable Report And Analysis Generate Report Data
Related Information
9.25 Geocoder Summary report
Description
The Geocoder Summary report includes statistical information about geocoding.
To enable the report
In the Geocoder transform, enable
Report And Analysis Generate Report Data .
9.26 Overview of match reports
Setting up match reports
To set up the Physical Source Field, Logical Source Field, and matching process transforms, refer to the
Designer Guide: Data Quality, Match section. Verify the appropriate substitution parameter congurations.
Management Console Guide
Data Quality Reports
PUBLIC 155

Common match report information
The rst section includes general information about your job such as:
• The job name
• The run ID, which species a unique identication of an instance of the executed job
• The repository where the job is located
• The ocial transform name
• The path to the transform in the form <data flow name> / <transform name>
9.27 Best Record Summary report
Description
The purpose of best record post-processing is to salvage data from matching records—that is, members of
match groups—and consolidate, or post, that data to a best record or to all matching records. The Best Record
Summary report shows statistics about the best record process used in the match. It indicates what settings
were selected and the results of the posting.
If your results show any trends that could be improved by adjustments to your settings, then change those
settings and re-process the step.
How to read this report
The Best Record Contribution table shows the overall results of the posting. The report columns are as follows.
Report column
Description
Best Record Name The name of the Best Record operation you specied in the Match transform.
Posting Destination The destination (either Master, Subordinate, or ALL) for the post.
Post Only Once Per Des-
tination
Setting shows Yes or No to indicate whether more than one posting will be attempted for each
record.
Post Attempts The number of Best Record operations that were attempted. This is the total of the protected
drops, destination eld drops, lter drops, and posts completes.
Protect Drops The number of operations that were cancelled because a posting destination was protected.
Destination Field Drops Operations that were canceled because the Best Record operation was set to allow posting only
once per destination record.
Strategy Drops Operations that were canceled because the Best Record strategy returned False.
Post Completes The number of Best Record operations that successfully completed.
The next section of the report contains audit information such as:
156
PUBLIC
Management Console Guide
Data Quality Reports

• How many records were processed during the match
• The start and end time
• Any idle time
• The total amount of time it took to run the Match transform
The Best Record Strategy section shows:
• The name of the best record strategy eld containing the statistics
• The source and destination elds used in the best record action.
Related Information
9.28 Match Contribution report
Description
The Match Contribution report provides you with information on the eect of the individual break groups and
individual criteria on the total matching process. By studying the largest and smallest break groups and their
break keys, you can determine whether they must be realigned for more accurate distribution in the matching
process. The software generates one report for each match set.
You can also look at the criteria that are making the highest percentage of match/no-match decisions to verify
the accuracy as well as the eectiveness of the criteria settings.
The size of the break groups has a signicant impact on the speed of the matching process. If you have many
large break groups (break groups with large numbers of records), the matching process slows down because
it has to do so many comparisons. If that is the case, you might want to adjust your break group formation
strategy so the resulting break groups are smaller.
Results showing break groups with only a single record could indicate criteria that is too restrictive. Because
data in one break group is never compared with data in another break group, the restrictive criteria could be
isolating data that would otherwise match.
Use this report in conjunction with the Match Criteria Summary report to understand the contributions of the
various criteria and to view the detailed criteria denitions.
Break Group Contribution
The Break Group Contribution table lists the smallest and largest break group contributors. This section
contains data only if you create break groups in your job.
Other information includes:
Total number of break groups
The number of break groups created based on your break
group settings.
Management Console Guide
Data Quality Reports
PUBLIC 157
Theoretical maximum comparisons The number of comparisons that would be made without
using any break group strategy (or putting all records in a
single break group).
Break group comparisons The number of actual comparisons made because of break-
ing.
Comparisons per hour The number of comparisons made per hour.
Hours saved by breaking The amount of time saved because of breaking.
Max records in compare buer The maximum number of records that can t in the mem-
ory buer used for comparison. This value, in conjunction
with the largest break group size, can be used to ne-tune
performance of match process. If the largest break group
size is smaller than the number of records that can t in the
compare buer, then the records will be stored and accessed
from memory. This makes the process go faster. However, if
the largest break group is bigger, then some caching will be
involved and it may slow down processing. In order to x it,
you can either change the breaking strategy to make smaller
break groups or you can increase the buer size by doing the
following:
1. In the Designer, Choose
Tools Options Job
Server General .
2. In the Section box, type MatchSettings.
3. In the Key box, type
MemoryInKBForComparisons.
4. In the Value box, type the number of kilobytes of mem-
ory you want as your buer. The default value is 4096
KB.
5. Click OK.
Audit Information
The Audit Information section species how many records were processed during the match, the start and end
time, any idle time, and the total amount of time it took to run the Match transform.
The audit section is followed by the Match Set Name and the Match Level Name(s) if the match set has
multiple levels.
Match Criteria Contribution
The last section shows the Match Criteria Contribution listed by criteria name and in order of the criteria
execution. Focus on the criteria that are the most productive—that is, the criteria making the most decisions.
The criteria that make the most decisions should be the rst to be evaluated, so order your criteria
appropriately in your Match transform. This will help with performance.
Related Information
Match Criteria Summary report [page 159]
158
PUBLIC
Management Console Guide
Data Quality Reports

9.29 Match Criteria Summary report
Description
The software generates one Match Criteria Summary report per match set. Use the report to obtain a
consolidated view of all key settings and the criteria settings. Using this report can help you determine whether
the values you set for each criteria are giving you the results you require.
After reading this report in conjunction with the Match Contribution report, which shows the break group
contributions, you might decide to adjust eld compare lengths or settings like match/no match score. The
Match Criteria Summary report gives you the necessary information to ne-tune the settings and to compare
multiple match criteria for consistency.
In the audit information section of the report, you will nd information such as:
• How many records were processed during the match
• The start and end time
• Any idle time
• The total amount of time it took to run the Match transform.
The audit section is followed by the Match Set Name and the Match Level Name(s) if the match set has
multiple levels.
The Match Input Fields table shows settings for the input elds used for this match including the criteria name,
match criteria, eld compare length, and any preprocessing options such as punctuation and casing.
The Detailed Criteria Denition table gives you a more detailed breakdown of the match criteria denitions
listed by criteria in the order of execution. A list of the Match Level Options displays below the table so you can
verify your settings.
Note
In cases where the Blank Field Operation is set to EVAL, the evaluation score appears as a number instead
of the word IGNORE.
Related Information
Match Contribution report [page 157]
Management Console Guide
Data Quality Reports
PUBLIC 159

9.30 Match Duplicate Sample report
Description
The Match Duplicate Sample report provides some duplicate records as a sample of the match results. One
report is generated for each Match transform in the job. If a given transform results in no matches, the software
does not generate a report for that transform.
The samples are taken from a maximum of 500 records per transform starting from group number 1, using
every 10th match group, and up to 20 records from the selected match groups.
The Physical Source Field table displays the data sources used in the job, including the number of records
sampled for that data source.
The Match Duplicate Results table displays the Match duplicate results including record number, group
number, score, match type, logical source ID, and input eld(s). The records are listed by group number in
ascending order. If you do not see data in the Logical Source Field column, be sure that you have included an
Input Sources operation in the Match transform, or dened the eld that contains the logical source value.
Note
Depending on your congurations settings, you might see dierent information/fault records each time the
transform processes a particular set of input records.
Related Information
9.31 Match Input Source Output Select report
Description
The Match Input Source Output Select report shows you which types of records and the number of records
that were agged to be kept or dropped per source.
• Keeps: Records you selected in the Output Flag Selection operation of the Match transform (Match Editor).
• Drops: Records you did not select in the Output Flag Selection operation of the Match transform (Match
Editor).
160
PUBLIC
Management Console Guide
Data Quality Reports
Report columns
Column Description
Net Input The number of records in the source.
Single Source Masters Highest ranking member of a match group whose members all came from the same source. Can
be from Normal or Special sources.
Single Source Subordi-
nate
A record that is a subordinate member of a match group whose members all came from the same
source. Can be from Normal or Special sources.
Multiple Source Mas-
ters
Highest ranking member of a match group whose members came from more than one source.
Can be from Normal or Special sources.
Multiple Source Subor-
dinate
A record that is a subordinate member of a match group whose members came from more than
one source. Can be from Normal or Special sources.
Suppress Masters A record that came from a Suppress source and is the highest ranking member of a match group.
Suppress Subordinate A record that came from a Suppress source and is a subordinate member of a match group.
Suppress Matches Subordinate member of a match group that includes a higher-priority record that came from a
Suppress source. Can be from Normal or Special type sources.
Suppress Uniques Records that came from a Suppress source for which no matching records were found.
Uniques Records that are not members of any match group. No matching records were found. These can
be from sources with a Normal or Special source type.
Net Output The number of records in the source minus the number of records dropped.
% Kept The percentage of records that were not dropped from the original input source.
Related Information
9.32 Match Multi-source Frequency report
Description
The Multi-source Frequency report shows, for each input source, how many of its records were found to match
records in other sources.
The format of the Multi-source Frequency report is always the same. There is a row for each of the input
sources of the job. The columns show, rst, the name of the source, then the total number of the source’s
records that appeared in more than one source. The remaining columns show how many records in that source
were found in 2 sources, 3 sources, 4 sources, and so on.
If you created source groups, multi-source matches for the source groups are included in a separate table in
the report.
Management Console Guide
Data Quality Reports
PUBLIC 161
• If a record from source1 matches a record from source2, then that record is included in the number in the
2 source column. If a record from source1 matches a record from source2 and also a record from source4,
then that record is included in the number in the 3 source column.
• The entry in each column shows the number of multi-source instances—that is, how many records
appeared on more than one source, not how many times they appeared. For example, if a record from
source1 matches three records from source2, then that record adds one to the this source’s total in the 2
source column—it’s not added to the 4 source column, nor is three added to the 2 source column.
• When determining the number of sources on which a record appeared, the software does not count
single-source matches, or any matches to records from special or suppression sources.
9.33 Match Source Statistics Summary report
Description
The Match Source Statistics report provides information about the distribution of the duplicates found in
various input source records including how the duplicates were distributed as master records and subordinate
records. The duplicates could be distributed within one logical source (intrasource matches) or across multiple
logical sources (intersource matches). This report shows the distribution of the duplicates in general and then
the results for each source. The software generates one report per match set.
To generate a meaningful Match Source Statistics report, you must have a Group Statistics operation in your
Match or Associate transform. You must also generate basic statistics in those Group Statistics operations.
If you also add an Input Source operation and generate input source statistics in the Group Statistics
operations, you will nd additional columns related to suppression records
How to read this report
A pie chart shows what percentage of the duplicates were multiple source masters, multiple source
subordinates, single source masters, and single source subordinates.
The source percentages are also detailed in a key list, indicating the distribution of the master and subordinate
records.
Match Statistics table
The Match Statistics table lists the statistics for each source, enabling you to understand the impact of
statistics such as total record counts and individual source counts. You can compare the number of master and
subordinate records generated to the source record counts.
The columns list how many master records came from a single source or from multiple sources. Statistics are
also given for the number of subordinate records derived from a single source and from multiple sources.
162
PUBLIC
Management Console Guide
Data Quality Reports

Additional columns for input source statistics
If you chose to count input source statistics in the Group Statistics operation, you will also nd the following
columns.
Column
Description
Suppress Matches The number of records that match a record in a Suppress-type source.
Total Non Dupes The number of master records and uniques in the input source.
Suppress Uniques The number of unique records in the Suppress-type source.
Suppress Masters The number of master records in the Suppress-type source.
Suppress Subordinate The number of subordinate records in the Suppress-type source.
Source by Source Statistics table
The Source by Source Statistics table details the information by source, generating statistics for the number of
duplicates that are both intersource (between distinct sources) and intrasource (within a single source).
The Source Name and Comparison Source Name columns display how many times a subordinate record in the
specied comparison source was found when the master record was from the named source. The other two
columns (Number of Inter-Source Matches and Number of Intra-Source Matches) display how many matches
were found with the master record in one source and the subordinate record in another source (intersource)
and how many matches were found with the master and subordinate record in the same source (intrasource).
For example, you can compare data from two sources: Source 1 lists people who have in-ground swimming
pools and Source 2 lists people who have children under the age of two. Your goal is to nd the people that t in
both categories. With this report, you can now send your Swimming Pool Safety pamphlet to pool owners who
have children under the age of two.
Related Information
Management Console Guide
Data Quality Reports
PUBLIC 163

Important Disclaimers and Legal Information
Hyperlinks
Some links are classied by an icon and/or a mouseover text. These links provide additional information.
About the icons:
• Links with the icon
: You are entering a Web site that is not hosted by SAP. By using such links, you agree (unless expressly stated otherwise in your
agreements with SAP) to this:
• The content of the linked-to site is not SAP documentation. You may not infer any product claims against SAP based on this information.
• SAP does not agree or disagree with the content on the linked-to site, nor does SAP warrant the availability and correctness. SAP shall not be liable for any
damages caused by the use of such content unless damages have been caused by SAP's gross negligence or willful misconduct.
• Links with the icon : You are leaving the documentation for that particular SAP product or service and are entering an SAP-hosted Web site. By using
such links, you agree that (unless expressly stated otherwise in your agreements with SAP) you may not infer any product claims against SAP based on this
information.
Videos Hosted on External Platforms
Some videos may point to third-party video hosting platforms. SAP cannot guarantee the future availability of videos stored on these platforms. Furthermore, any
advertisements or other content hosted on these platforms (for example, suggested videos or by navigating to other videos hosted on the same site), are not within
the control or responsibility of SAP.
Beta and Other Experimental Features
Experimental features are not part of the ocially delivered scope that SAP guarantees for future releases. This means that experimental features may be changed by
SAP at any time for any reason without notice. Experimental features are not for productive use. You may not demonstrate, test, examine, evaluate or otherwise use
the experimental features in a live operating environment or with data that has not been suciently backed up.
The purpose of experimental features is to get feedback early on, allowing customers and partners to inuence the future product accordingly. By providing your
feedback (e.g. in the SAP Community), you accept that intellectual property rights of the contributions or derivative works shall remain the exclusive property of SAP.
Example Code
Any software coding and/or code snippets are examples. They are not for productive use. The example code is only intended to better explain and visualize the syntax
and phrasing rules. SAP does not warrant the correctness and completeness of the example code. SAP shall not be liable for errors or damages caused by the use of
example code unless damages have been caused by SAP's gross negligence or willful misconduct.
Bias-Free Language
SAP supports a culture of diversity and inclusion. Whenever possible, we use unbiased language in our documentation to refer to people of all cultures, ethnicities,
genders, and abilities.
164
PUBLIC
Management Console Guide
Important Disclaimers and Legal Information
Management Console Guide
Important Disclaimers and Legal Information
PUBLIC 165

www.sap.com/contactsap
© 2024 SAP SE or an SAP aliate company. All rights reserved.
No part of this publication may be reproduced or transmitted in any form
or for any purpose without the express permission of SAP SE or an SAP
aliate company. The information contained herein may be changed
without prior notice.
Some software products marketed by SAP SE and its distributors
contain proprietary software components of other software vendors.
National product specications may vary.
These materials are provided by SAP SE or an SAP aliate company for
informational purposes only, without representation or warranty of any
kind, and SAP or its aliated companies shall not be liable for errors or
omissions with respect to the materials. The only warranties for SAP or
SAP aliate company products and services are those that are set forth
in the express warranty statements accompanying such products and
services, if any. Nothing herein should be construed as constituting an
additional warranty.
SAP and other SAP products and services mentioned herein as well as
their respective logos are trademarks or registered trademarks of SAP
SE (or an SAP aliate company) in Germany and other countries. All
other product and service names mentioned are the trademarks of their
respective companies.
Please see https://www.sap.com/about/legal/trademark.html for
additional trademark information and notices.
THE BEST RUN
