
1
METHODS TO CALCULATE THE DIRECT
COSTS OF MEDICAL CARE FOR
PEDESTRIAN AND BICYCLIST INJURIES DUE
TO TRAFFIC COLLISIONS IN THE COUNTY
OF LOS ANGELES, 2014
PURPOSE OF THIS ANALYSIS
Motor vehicle traffic crashes (MVTCs) result in devastating health outcomes. However, the economic impacts
are also vast. In 2010, the economic costs of motor vehicle crashes totaled $242 billion for the United
States, with $23.4 billion related to medical costs.
1
Addressing the root causes of crashes requires
extensive investment and reallocation of government resources in infrastructure, communication, education,
and systems changes that involve multi-stakeholder collaboration. Local governments often lack information
about the extent of MVTCs and their associated costs, which makes decision making on important resource
investment tradeoffs challenging. To address this need in planning and practice, the Los Angeles County
Department of Public Health (DPH) calculated the minimum direct costs of medical care for pedestrian and
bicyclist motor vehicle traffic collision victims in Los Angeles County. A high-level summary of the approach
to the analysis follows. A more detailed version of this analysis can be found in the technical appendix on
page 4.
This document is an accompaniment to the brief: Porter K et al. Los Angeles County Department of Public
Health, Division of Chronic Disease and Injury Prevention, PLACE Program. Direct Costs of Medical Care for
Pedestrians and Bicyclists Hit by a Vehicle in Los Angeles County. Issue Brief. October 2018.
TYPES OF COLLISION COSTS
The overall costs of collisions come in many forms and accrue to both the individual and society at large.
The National Highway Traffic Safety Administration summarizes economic costs into the categories of:
property damage; medical costs; emergency services; travel delay; administrative costs; legal costs; lost
earnings; lost household production; vocational rehabilitation; workplace costs; and pain and lost quality of
life.
2
These costs can be further categorized into direct and indirect costs. Direct costs are those that an
individual incurs due to a collision, whereas indirect costs do not directly relate to the collision itself but are
an eventual result of the collision, such as lost wages due to taking sick leave.
3
Figure 1 (next page)
visualizes the potential range of costs and highlights direct cost components included in our calculation of
medical costs.
2
FIGURE 1. Summary of Collision Costs
Although other agencies have produced estimates of the economic costs of crashes, their conceptual nature
can make it difficult for these values to be interpreted by the public. Although medical costs are just one of
many economic impacts of crashes, they are one of the most tangible costs that could be averted with
prevention.
Collision Costs
Direct Costs
Emergency
Response
Medical
Health
Services
Medical
Property
Damage
Travel Delay
& Pollution
Short-term
Productivity
Miscellaneous
Indirect Costs
Loss of
Productivity
Pain &
Suffering
Quality of
Life
Diagram modified from: Capital Region Intersection Safety Partnership (CRISP). Cost collision study: Report summary.
February 2010.
Portion of overall costs
included in this analysis

3
APPROACH
A high-level overview of the methodology used for this analysis is described below. The detailed
methodology can be found in the Technical Appendix on page 4. The calculations employed numerous
assumptions that are intended to approximate the minimum direct costs of medical care. They are
projections only.
Each cost component calculation (ambulance fees, hospital costs, and professional fees) is derived from a
different 2014 population of pedestrian and bicyclists who were motor vehicle traffic collision victims.
Data about all victims may not be available due to the complexity the response to a collision and how a
collision is reported or documented.
DPH modified an approach
2
developed by the University of
California, San Francisco:
1) Assign a cost for each
ambulance transport to a
medical facility
2) Convert inpatient hospital
charges to hospital cost
3) Assign a cost for each
emergency room service
provided to address injury
Direct costs of medical care were
calculated by summing costs
associated with transport by first
responders to a facility,
hospitalization, and treat-and-
release emergency department
visits.
Data was not available to calculate
emergency department costs for
patients treated-and-released or
professional fees for patients
admitted.
For more detailed information, visit:
http://publichealth.lacounty.gov/pl
ace/
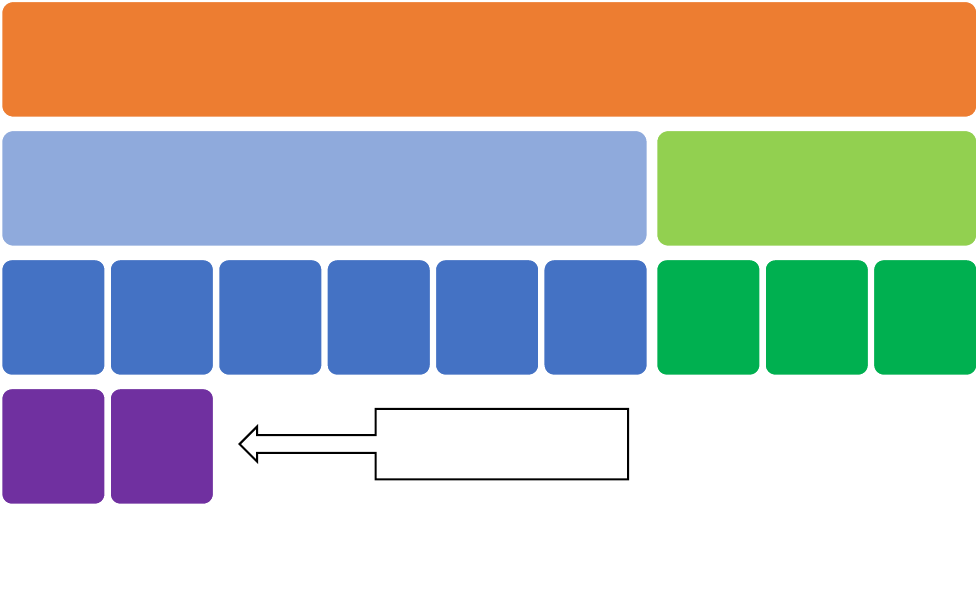
FIGURE 2: Basic Formula for Calculating Direct Costs
of
Medical Care
Ambulance fees are the allowable
maximum rates chargeable to the public
for transport by Emergency Medical
Responders to a hospital.
Hospital costs are expenses incurred by a
hospital in providing care during a
hospital stay, such as wages, utility costs,
and supplies, as opposed to the amount
the hospital charged a patient.
Professional fees are prices charged by
physicians and other healthcare providers
for services rendered during a treat-and-
release emergency department visit.
Direct costs include costs related to
emergency transport, inpatient services,
outpatient services.
Ambulance
Fees
Hospital
Costs
Professional
Fees
Direct Cost of
Medical
Care
4
Technical Appendix
In this appendix, we provide a more complete set of the details on the data and methods
we used to produce the estimates presented above. As mentioned, we made several assumptions to arrive
at our estimated minimum direct costs. However, other sets of assumptions and approaches could be used
that generate different findings. These calculations are intended to be suggestive and only describe our
approach. All analyses were performed using SAS version 9.4 and ArcMap version 10.3.
CALCULATING DIRECT COSTS OF MEDICAL CARE
The figure below is a visual representation of the overall process to calculate direct medical costs using a
modified University of California San Francisco Approach.
4
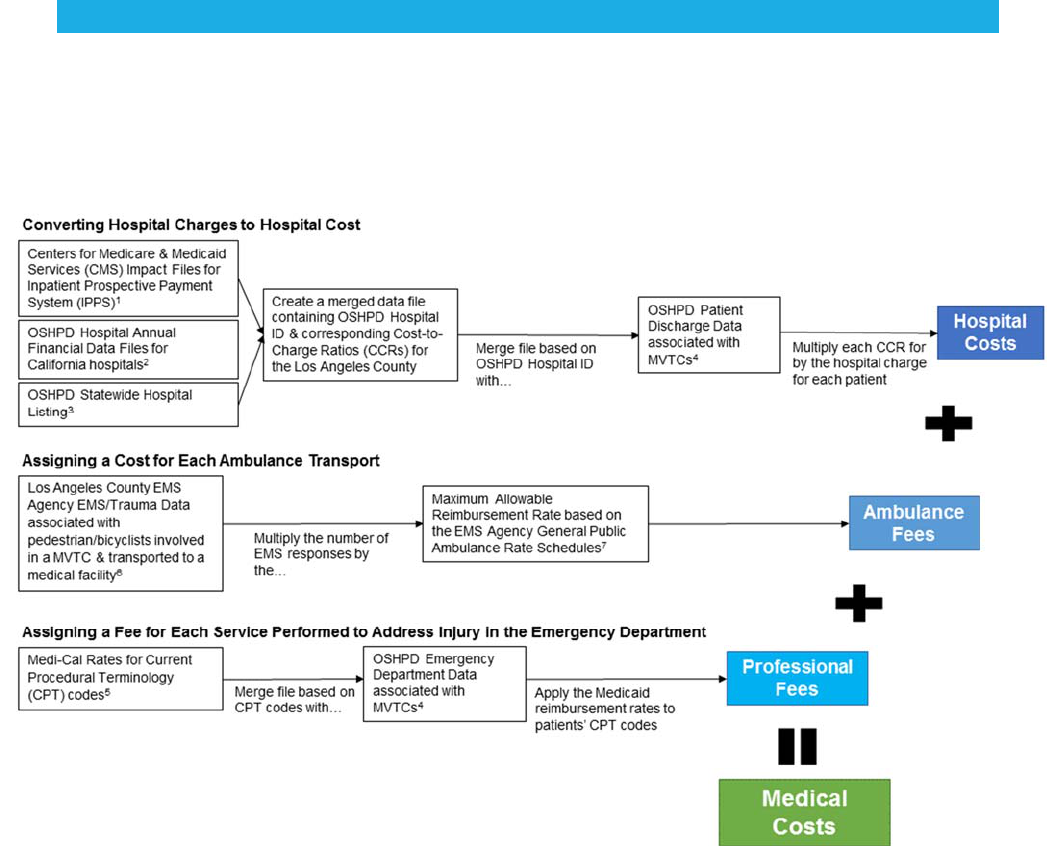
FIGURE 3. Process for Calculating Direct Medical Costs of Collisions Using a Modified University of
California San Francisco Approach

5
DATA SOURCES
We used:
Federal-level Cost-to-Charge Ratios (CCRs) from the Centers for Medicare and Medicaid Services
(CMS), where CCRs equals the total amount of money required to operate a hospital, divided by
the sum of the revenues from patient care and other operating revenues
5
;
State-level hospital data (financial
6
, hospital listing
7
, discharge and emergency department
8
) and
Medicaid reimbursement
9
and;
County-level Emergency Medical Services (EMS) and Trauma data
10
, and ambulance rate
schedules.
11
METHODS
Each cost component is derived from a different 2014 population of motor vehicle traffic crash (MVTC)
victims. These are described further below.
HOSPITALIZED AND EMERGENCY DEPARTMENT VICTIMS
DEFINING COLLISION VICTIMS
We used California's Office of Statewide Health Planning and Development (OSHPD) datasets for
California licensed local health departments to identify pedestrian and bicyclist collision victims treated in
a County medical facility. OSHPD patient discharge data was used to identify collision victims who were
admitted in the hospital. OSHPD Emergency Department (ED) data were used to identify victims who were
treated-and-released from the ED. A MVTC was defined as a hospital visit with a primary external cause
of injury code (E-code) of E810-E819 from the International Classification of Diseases, ninth revision.
Specific sub-categories of E-codes were selected to identify the injured party; for pedestrians (X.7) and
bicyclists (X.6).
IDENTIFYING INCIDENT LOCATION
Assumptions were made to identify where MVTC injuries occurred in the county versus the city of Los
Angeles. The OSHPD data for local public health departments cannot identify incident location because it
only contains geographic information on patient residence location and hospital location. As a proxy, we
used hospital location to assign incident location. The Los Angeles County hospital Geographic Information
Systems (GIS) shapefile
12
was used to map hospital locations and the county and city boundary shapefiles
were overlaid to assign boundary locations. We assumed that if the hospital was in the city of Los Angeles,
then the MVT injury occurred within the city. Likewise, we assumed that if the hospital was in the county then
the MVT injury occurred in the county.

6
AMBULANCE TRANSPORT VICTIMS
DEFINING COLLISION VICTIMS
A subset of the EMS/Trauma data from the Los Angeles County Department of Health Services EMS
Agency was used to identify victims who were transported to a medical facility from the incident (collision)
site. Our EMS dataset contains select indicators from the assessment of patient encounters with EMS
responders at the scene of an incident that is likely related to a MVTC and transported to a Los Angeles
County non-trauma center. Our Trauma dataset contains select information on patients involved in a MVTC
and transported to a Los Angeles County trauma center. Depending on the data source, collision victims
were identified in two ways:
1) For victims transported to a Los Angeles County trauma center (Trauma data), we selected (E-
codes) (E810 -E819) and subcategories occupants (X.0, X.1), motorcyclist (X.2, X.3), pedestrians
(X.7) and bicyclists (X.6) and other/unspecified (X.4, X.5, X.8, X.9) to identify those injured in a
MVTC.
2) For victims transported to a non-trauma center in Los Angeles County (EMS data), the identification
of MVTC-related incidents had to be estimated, because EMS data lacks E-codes.
We used the Trauma database to obtain the number and percent of collision victims for each mode of
travel (ex: occupant, motorcyclist, pedestrian, bicyclist, other/unspecified) that were transported to a
trauma center.
To estimate the number of pedestrian and collisions victims that were transported to a non-trauma center,
we used both the Trauma and EMS databases. Both the EMS and Trauma databases contain a variable
called the “Mechanism of Injury (MOI),” which describes the mechanism of the patients’ injury. This variable
has multiple field values, two which are associated with pedestrians/bicyclists/motorcyclists. They are: PB
(NOT thrown or run over at <20 MPH) and RT (Thrown or run over at >=20 MPH). Using the EMS and
trauma databases, we created two data subsets each containing only PB or RT field values.
To obtain the estimated number of pedestrian or bicyclist collision victims that were transported to a non-
trauma center and had a PB or RT field value, we applied the proportion of pedestrian or bicyclist
collision victims that had a PB or RT field value in the Trauma database to the number of patients with a PB
or RT field value that were transported to a non-trauma center.
To obtain the estimated number of pedestrian or bicyclist collision victims that were transported to a non-
trauma center without a PB or RT field value, we then applied that non-trauma value to the proportion of
the proportion of trauma center patients that were without a PB or RT field value.
Finally, to obtain a combined estimate of pedestrian and bicyclist collision victims that were transported to
trauma and non-trauma centers, we added the number of pedestrian and bicyclist collision victims in the
trauma database to the estimated number of pedestrian and bicyclist collision victims in the EMS database.
IDENTIFYING INCIDENT LOCATION
The EMS/Trauma datasets contain geographic data fields (ex: Global Positioning System (GPS)
coordinates, city, zip code) which, when data are available, provide information on incident location. For
collision victims with GPS data, we determined incident location based on county and city boundary GIS
shapefiles. In the absence of GPS coordinates, we assigned incident location based on city and zip code
combination, city alone, or zip code alone. Because political boundaries do not align with zip code
boundaries, we relied on the City of Los Angeles Housing Department’s map listing of zip codes
13
to assign
those incidents to the city of Los Angeles. Data without any geographic information were omitted, since
geography could not be determined.

7
CAVEATS
Data limitations necessitated the development of assumptions and approaches that may impact the
estimates, and our estimates are likely to be conservative. Challenges included:
Underestimation of hospital costs: Our hospital costs are based on hospital discharge data only,
and thus do not include hospital costs related to patients treated and released in the emergency
department.
Calculating ambulance fees: We used the most likely base ambulance fee for caring for a
pedestrian or bicyclist and applied this average fee to all incidents. However, special charges
such as an oxygen mask, bandages, cervical collar, mileage, etc., would be considered additional
fees and would be added to the ambulance fee. These special charges were not available by
incident.
Underestimation of professional fees: Our professional fee estimates are based on pricing rates
for Medicaid reimbursement for services rendered to outpatients in the emergency department,
and do not account for instances where the patient was hospitalized, has Medicare, or private
insurance. Reimbursement amounts vary widely across payers and both Medicaid and Medicare
set a much lower rate than private insurers for the same procedure
14
; in one example (treating a
broken leg), we found a difference of up to $584.00.
,15
Procedures not eligible for Medicaid
reimbursement were assigned a reimbursement of $0 by Medi-Cal, California’s Medicaid
program.
Estimation of MVTC victims transported by an ambulance to a non-trauma center: Information
on patients transported to non-trauma centers is in the EMS database. While the EMS data
contains geographic information related to an incident, it lacks identifying information on whether
the victim was involved in a MVTC versus some other incident. Our approach to estimating the
probable number of MVTC victims in the EMS data was to take the proportion of pedestrian and
bicyclist MVTC victims in the Trauma Data and apply this to the EMS data; this may have biased
the ambulance fee estimates.
Possible misclassification of victims injured in the county vs. city: We assumed that victims
were injured in the same general area as the medical facility they were transported to because
neither the hospital nor emergency department data (OSHPD) contained information on incident
location. Using the location of the treating facility as a proxy for the location of the incident may
have skewed the identification of victims injured in the county versus the city, and subsequently the
distribution of hospital costs and professional fees between the two regions.
Missing values: We imputed observations/values in the databases using corresponding county
and city costs averages when these missing values prevented the calculation of hospital costs and
professional fees.
Los Angeles County Department of Public Health
Division of Chronic Disease and Injury Prevention
Tony Kuo, MD, MSHS, Director
Jean Armbruster, MA, Director, PLACE Program
Chandini Singh, MA, Policy Analyst, PLACE Program
Kimberly Porter, PhD, MPH, Epidemiologist, PLACE Program
Isabelle Sternfeld, MSPH, Epidemiologist, IVPP
Los Angeles County Chief Executive Office
Ricardo Basurto-Davila, PhD, MSc
Suggested Citation:
Porter K, Singh C, Sternfeld I, Basurto-Davila R,
Armbruster J. Los Angeles County Department of Public
Health, Division of Chronic Disease and Injury Prevention,
PLACE Program. Methods to Calculate the Direct Costs
of Medical Care for Pedestrian and Bicyclist Injuries Due
to Traffic Collisions in the County of Los Angeles, 2014.
October 2018.

8
REFERENCES
1
Blincoe, L.J., Miller, T.R., Zaloshnja, E., & Lawrence, B.A. The economic and societal impact of motor vehicle crashes,
2010. (Revised) May 2015. (Report No. DOT HS 812 013). Washington, DC: National Highway Traffic Safety
Administration.
2
Cambridge Systematics, Inc. Crashes vs. congestion – What’s the cost to society? November 2011. Retrieved
November 30, 2017. http://newsroom.aaa.com/wp-content/uploads/2011/11/2011_AAA_CrashvCongUpd.pdf
3
Churdar Law Firm. What is the difference between direct and indirect damages? [Accessed 23 January 2018].
4
Lopez, D.S., Sunjaya, D.B., Chan, S., Dobbins, S. & Dicker, R.A. Using trauma center data to identify missed bicycle
injuries and their associated costs. Journal of Trauma and Acute Care Surgery. 2012; 73(6):1602-1606.
5
The Centers for Medicare & Medicaid Services (CMS) Impact Files for Inpatient Prospective Payment System (IPPS)
2013-2014 [CCR Files]. [2013] Retrieved December 6, 2017. https://www.cms.gov/Medicare/Medicare-Fee-for-
Service-Payment/AcuteInpatientPPS/Historical-Impact-Files-for-FY-1994-through-Present-Items/Impact-File-for-IPPS-
FY2013-Final-Rule.html. https://www.cms.gov/Medicare/Medicare-Fee-for-Service-Payment/AcuteinpatientPPS/FY-
2014-IPPS-Final-Rule-Home-Page-Items/FY-2014-IPPS-Final-Rule-CMS-1599-F-Data-Files.html
6
Office of Statewide Health Planning and Development (OSHPD). Hospital Annual Financial Data Files for California
Hospitals 2013-2014. Retrieved December 17, 2017.
https://www.oshpd.ca.gov/HID/Hospital-Financial-Selected.asp
7
Office of Statewide Health Planning and Development (OSHPD). Statewide Hospital Listing as of Dec 2015.
Retrieved February 2016. http://www.oshpd.ca.gov/HID/Facility-Listing.html#Hospital
8
Office of Statewide Health Planning and Development (OSHPD) – (1) Emergency Department Data and (2) Patient
Discharge Data. 2013-2014. Data request to Los Angeles County Department of Public Health, Injury and Violence
Prevention Program
9
Medi-Cal Rates (Reimbursement Rates through the California Medicaid Program)
Most up-to-date rates at: https://files.medi-cal.ca.gov/pubsdoco/rates/rateshome.asp
Archived rates for years 2013-2014: Data request to California Department of Health Care Services, Fee-For-
Service Rate Development Division.
10
Los Angeles County Emergency Medical Services (EMS) & Trauma Data. 2013-2014. DatarequesttoCounty
DepartmentofLosAngelesDepartmentofHealthServices,EMSAgencyDataManagementDivision.
11
Los Angeles County EMS Agency General Public Ambulance Rate Schedules. 2013-2014. Data Request to Los
Angeles County Department of Health Services, EMS Ambulance Licensing.
12
Los Angeles County Hospitals (2011). Retrieved November 2016. https://egis3.lacounty.gov/eGIS/get-gis-data/
13
Los Angeles Housing Department (LAHD). Zip codes within the City of Los Angeles. (September 2007). Retrieved
May 2016. https://media.metro.net/about_us/pla/images/lazipcodes.pdf
14
Krause, T.M., Ukhanova, M. and Revere, F.L. Private carriers' physician payment rates compared with Medicare
and Medicaid. Texas Medicine. 2016; 112(6):e1.
15
FIND-A-CODE. Retrieved January 3, 2018. https://www.findacode.com/code.php?set=CPT&c=27750
