Breath Test Refusals in DWI Enforcement
An Interim Report
DOT HS 809 876
July 2005
Nat i o na l H i g h way Tr a f f i c Safet y A d m i n i s t r at ion
This publication is distributed by the U.S. Department of Transportation, National Highway Traffic Safety
Administration, in the interest of information exchange. The opinions, findings and conclusions expressed
in this publication are those of the author(s) and not necessarily those of the Department of Transportation
or the National Highway Traffic Safety Administration. The United States Government assumes no liability
for its content or use thereof. If trade or manufacturers’ names or products are mentioned, it is because they
are considered essential to the object of the publication and should not be construed as an endorsement. The
United States Government does not endorse products or manufacturers.

i
Technical Report Documentation Page
1. Report No.
DOT HS 809 876
2. Government Accession No. 3. Recipient's Catalog No.
5. Report Date
August 2005
4. Title and Subtitle
Breath Test Refusals in DWI Enforcement: An Interim Report
6. Performing Organization Code
7. Author(s)
T.J. Zwicker, J. Hedlund, and V.S. Northrup
8. Performing Organization Report No.
9. Performing Organization Name and Address
Preusser Research Group, Inc.
10. Work Unit No. (TRAIS)
7100 Main Street
Trumbull, CT 06611
11. Contract or Grant No.
DTNH22-98-D-45079
Task Order 11
13. Type of Report and Period Covered
Interim Report
October 2002 – April 2004
12. Sponsoring Agency Name and Address
U.S. Department of Transportation
National Highway Traffic Safety Administration
Office of Research and Technology
400 Seventh Street, SW.
Washington, DC 20590
14. Sponsoring Agency Code
15. Supplementary Notes
The Contracting Officer's Technical Representative for this project was Amy Berning.
16. Abstract
Breath test refusal rates nationwide have remained stable at about one-quarter of all drivers arrested for
DWI from 1996 to 2001. States with statistically significant changes in refusal rates are split evenly between
those with increases and those with decreases. In five case-study States, first-time offenders generally constitute
the majority of those arrested for DWI and a majority of those refusing the breath test, even in those States
where it is to their advantage to take the test. First-time offenders often do not understand the consequences of
taking or refusing the test. In many States, repeat offenders refuse the test more frequently than first-time
offenders. In all 5 case-study States, consequences of refusal are less for repeat offenders than the consequences
of taking and failing the test. In Connecticut and Maryland, submitting to the breath test is usually beneficial for
first-time offenders. The report discusses possible strategies States and jurisdictions can implement to decrease
breath test refusals.
17. Key Words
Alcohol Impaired-driving countermeasures
Breath test refusal Administrative sanctions
DWI BAC testing
DWI Enforcement
18. Distribution Statement
Document is available through the
National Technical Information Service
Springfield, VA 22161 and free of charge at
www.nhtsa.dot.gov
19. Security Classif. (of this report)
Unclassified
20. Security Classif. (of this page)
Unclassified
21. No. of Pages
22. Price
Form
DOT F 1700.7 (8-72) Reproduction of completed page authorized
ii

iii
DEPARTMENT OF TRANSPORTATION
NATIONAL HIGHWAY TRAFFIC SAFETY ADMINISTRATION
TECHNICAL SUMMARY
CONTRACTOR
Preusser Research Group, Inc.
CONTRACT NUMBER
DTNH22-98-D-45079
Task Order 11
REPORT TITLE
Breath Test Refusals in DWI Enforcement
REPORT DATE
August 2005
REPORT AUTHOR(S)
T.J. Zwicker, J. Hedlund, and V.S. Northrup
This is an interim report for the study titled “Determine Whether There Is an Increase
in Breath Test Refusals and Develop and Evaluate a Promising Program to Deter Refusals.”
The project is being conducted by Preusser Research Group under contract number
DTNH22-98-D-45079 Task Order 11.
Background
The number of alcohol-related fatalities decreased 37 percent from 25,165 in 1982 to
15,935 in 1998. However, recent numbers of alcohol-related fatalities for 2000 (16,653),
2001 (17,400), 2002 (17,419), and 2003 (17,013) indicate that fatalities continue to exceed
the numbers seen in the mid-1990’s. It appears that new initiatives are required to achieve
additional reductions.
New initiatives to achieve additional reductions in alcohol-related fatalities require an
understanding of the problem and efforts to affect it so far. In two recent studies, researchers
have identified States that achieved the largest reductions in alcohol-related fatalities from
1982 to 1996 (Ulmer, Hedlund, and Preusser, under review) and examined the reductions as
a function of driver age, with a particular emphasis on youth (Hedlund, Ulmer and Preusser,
2000). It appears that stronger laws have been effective in reducing the number of people
who choose to drink and drive, but some believe that these same laws have produced an
unwanted consequence of higher breath test refusal rates in some States. Offenders receive
implied consent penalties for refusal in most States, but refusals may help offenders avoid a
DWI conviction, which carries more severe penalties.
A reduction in the number of test refusals will increase the effectiveness of the
administrative and criminal systems so offenders can no longer avoid penalties, may help to
identify more problem drinkers, and may help identified problem drinkers get some help.
iv
Objective
The three goals of this study are (1) to document the extent of the breath test refusal
problem, (2) to investigate the reasons for breath test refusals or lack of a significant
percentage of refusals in selected States, and (3) to develop, implement, and evaluate
effective and efficient countermeasures to deal with the problem. The first and second goals
are covered in this report. A later report will detail the results of the program implementation
and evaluation.
Method
A review of the administrative sanctions and criminal penalties for breath test refusal
in each State, DC, and Puerto Rico was conducted. After the review, each State, the District
of Columbia, and Puerto Rico were contacted to obtain breath test refusal data for the period
from 1996 to 2001. Five case-study States were selected to learn more about the causes for
refusals. Connecticut, Maryland, Florida, Louisiana, and Oklahoma were selected because
they all had rates above the national average and provided a mix in terms of the magnitude of
refusal rates and variations in impaired driving laws and practices. Refusal rates ranged from
slightly above average to far above the national average. Laws pertaining to test refusals
ranged from moderately weak to good. The case studies consisted of interviews with
prosecutors, judges, defense attorneys, police officers, police supervisors, and administrative
unit officers to (1) evaluate the arrest, breath test, administrative, and judicial processes, and
(2) identify refusal problems, barriers, and potential solutions.
Results
State laws vary widely with regard to administrative and criminal penalties for
refusal. All States but one have administrative sanctions for refusal. Depending upon the
State, the administrative sanctions are sometimes more stringent than those for failing a
breath test. Most States do not criminalize refusal, but many admit refusals in criminal cases.
Most of those that admit refusals in criminal cases do not permit refusals to be used as
evidence of guilt. Some States have provisions to force a blood alcohol concentration (BAC)
test after a refusal.
The distribution of refusal rates amongst States is depicted below in figure 1. The
rates shown for 2001 are somewhat higher than rates reported for 1987 in an earlier study
(Jones, Joksch, and Wiliszowski, 1991).
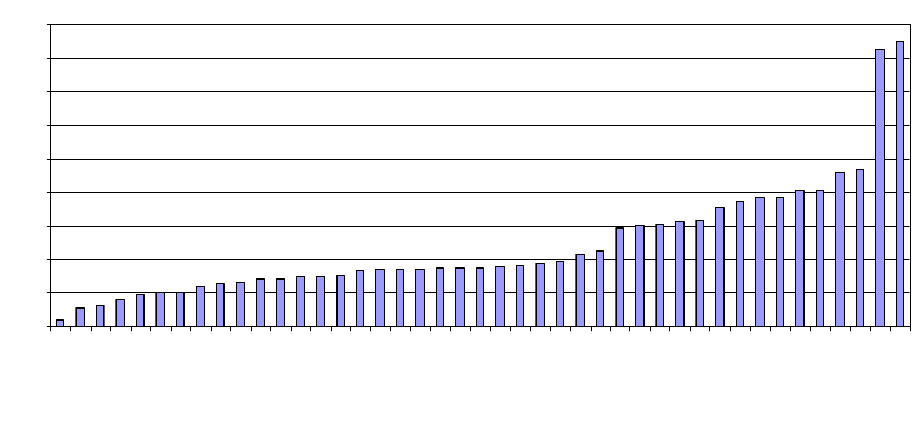
0%
10%
20%
30%
40%
50%
60%
70%
80%
90%
Puerto Rico
California
Nebraska
Maine
Hawaii
Kentucky
Pennsylvania
DC
Michigan
Oregon
West Virginia
North Dakota
Delaware
Minnesota
Kansas
New Jersey
Wisconsin
Georgia
Iowa
Mississippi
Utah
Alaska
North Carolina
Washington
Connecticut
New Mexico
Arkansas
Indiana
Maryland
South Carolina
Montana
Alabama
Idaho
Tennessee
Florida
Illinois
Oklahoma
Ohio
Texas
Louisiana
Massachusetts
New Hampshire
Rhode Island
*2000 data were used for Massachusetts and New Jersey.
**Complete data was not available from AZ, CO, MO, NV, NY, SD, VA, VT, or WY
v
Figure 1. 2001* Breath Test Refusal Percents by State**
Refusal rates for some individual States differ markedly from 1987 to 2001, which
may be due to real differences or due to real differences combined with differences produced
by different data collection methods used by these States for assessing refusal rates in 1987
and in 2001. Refusal rates nationwide remained stable at about one-quarter of all drivers
arrested for DWI from 1996 to 2001. States with statistically significant changes in refusal
rates during this period were split evenly between those with increases and those with
decreases. In general, the States where refusal rates decreased already had low rates, and
States where rates increased already had high refusal rates. No State with a significant
increase in refusals criminalizes refusal. Six of the eight States with statistically significant
decreases in refusals have hard license suspensions in which no hardship or work permits are
available during the suspension period.
Case Study Results
In Connecticut, 75 percent of those refusing the test are first-time offenders who
would receive much less severe administrative penalties and the same criminal penalties for
taking and failing a breath test. They become eligible immediately for a work permit during
the entire administrative suspension period if they fail a BAC test and almost always receive
the Pretrial Alcohol Education program, which results in dismissal of their criminal cases
after one year. First-time offenders reportedly often refused based on a lack of understanding
of these consequences.
In Maryland, the majority of the refusals are reportedly from first-time offenders.
First-time offenders who fail breath tests can receive permission to drive during their entire
administrative suspensions, while those who refuse and want to continue driving must have
an interlock device installed for one year. First-time offenders almost always have their cases
vi
pled down to a lesser impaired driving charge and receive Probation Before Judgment (PBJ),
which results in the dismissal of their criminal cases and no record of a DWI, regardless of
whether they take or refuse the test. The consensus advice for first-time offenders was to take
the breath test because of the reduced administrative penalties and the same PBJ outcome for
their criminal cases. As in Connecticut, many first-time offenders in Maryland do not
understand these consequences.
In Florida, refusal benefits all offenders arrested for DUI. The increased severity of
the administrative suspension for refusal is mitigated by the availability of hardship permits
that can be obtained if the person does not have a prior BAC test refusal. Both defense
attorneys and prosecutors agreed that the consequences for refusal are less severe than the
consequences of conviction, even for a first offense. A new law in Florida criminalizing the
second refusal may lead to a reduction in refusals by repeat offenders, but the law has not
been in effect long enough for State officials to determine its impact.
In Louisiana, first-time offenders have a high rate of breath test refusal. Refusing the
breath test benefits the criminal cases of all offenders arrested for DWI. Without a test result,
district attorneys have a much more difficult time getting a DWI conviction and usually
reduce the charges to obtain a guilty plea. Refusal has the added benefit of avoiding the
sanctions contained in Louisiana’s high-BAC law if the offender’s test result would have
been .15 or higher. In at least one jurisdiction, a judge has issued warrants to order blood
tests for those who refuse. The strategy may be the best solution to reduce refusals without
new legislation.
In Oklahoma, repeat offenders usually refuse the breath test, but most first-time
offenders reportedly take it. All those interviewed agreed that it is to the advantage of any
offender to refuse the test. The administrative penalties are essentially the same for those
who fail and those who refuse a breath test, which means that the criminal case outcome
affects refusal more than the administrative sanctions. First-time offenders almost always
have their charges pled down regardless of whether they refuse or fail the test.
Conclusions
In many States across the country officers are instructed to read verbatim to suspects
from an Administrative License Revocation (ALR) card - the information on this card is read
to the suspect when the officer requests a breath sample, and this provides the suspect with
information regarding the consequences of refusing to provide the sample. Officers are often
instructed to read this information verbatim to ensure that each suspect receives the same
information in a uniform manner that limits any possible coercion on the part of the officer.
In Connecticut and Maryland first-time offenders typically receive less severe
penalties for failing the test, even with a high BAC, than for refusing the test. It is believed
that many first-time offenders refuse the test because they do not understand these
vii
consequences. For States such as these, State officials may want to review their process for
notifying suspects of both the administrative and criminal consequences of refusing to
provide a breath sample. However, States such as Connecticut and Maryland must then
consider the consequences of these offenders receiving less severe sanctions. In addition, if
these offenders are not convicted of an alcohol-related offense and are later stopped for DWI,
they will not be considered repeat offenders.
Louisiana, and 11 other States with similar laws or case law (e.g., Arizona,
California, and Wisconsin), could reduce breath test refusals by encouraging officers to
obtain a warrant, when needed, to draw blood for a chemical test. Warrants could be obtained
for as many types of DWI arrests as judges would be willing to issue warrants, such as cases
in which the arrested driver had a minor in the vehicle, cases where the driver is suspected of
having a BAC above .15, or in cases of driver involvement in an injury crash. Judges who
may not be willing to issue warrants to draw blood for a chemical test for the standard first-
time DWI offenders may be more willing to issue a warrant for more egregious offenders.
Warrants are already used in at least one jurisdiction in Louisiana. The extent of their use is
not known, but they have reportedly eliminated the problem of refusals in cases where they
are issued.
It is believed that Oklahoma and Florida are unlikely to reduce refusal rates
substantially without new legislation. In each State, the administrative and criminal penalties
for refusal are less severe than those for taking and failing the breath test.
viii
Table of Contents
I.
Introduction................................................................................................................. 1
A. Background ............................................................................................................................................1
B. Study Goals............................................................................................................................................2
II. State Law Review................................................................................................2
A. Administrative Sanctions and Criminal Penalties for Refusal.........................................................2
B. Refusal as a Criminal Offense.............................................................................................................3
C. Refusal Admissibility in Court..............................................................................................................3
D. Forcing a BAC Test...............................................................................................................................3
E. Additional Criminal Penalties for Drivers with a High BAC..............................................................3
F. Circumstances That May Reduce Penalties and Affect Refusal Rates ........................................4
1. Administrative License Action for Failing a BAC Test.......................................................4
2. Penalties for DWI Conviction
....................................................................................................4
III. State Breath Test Refusal Rates..................................................... 5
A. Analyses of 2001 Breath Test Refusal Data .....................................................................................7
B. Comparison of 2001 and 1987 Breath Test Refusal Rates ..........................................................10
C. Trend Analyses of 1996-2001 Breath Test Refusal Data..............................................................10
IV. Case Study of Five States..................................................................... 13
1. Characteristics of the 5 Selected States................................................................................13
a) Connecticut.......................................................................................................................................... 13
b) Maryland................................................................................................................................................ 13
c) Florida...................................................................................................................................................... 14
d) Louisiana............................................................................................................................................... 14
e) Oklahoma.............................................................................................................................................. 14
B. Case Study Data Collection Method.................................................................................................14
C. Case Study Results.............................................................................................................................17
1. Connecticut....................................................................................................................................18
2. Maryland........................................................................................................................................24
3. Florida
............................................................................................................................................29
4. Louisiana........................................................................................................................................36
5. Oklahoma
.......................................................................................................................................42
V. Conclusions.............................................................................................................. 48
A. Connecticut and Maryland .................................................................................................................48
B. Louisiana...............................................................................................................................................49
C. Oklahoma and Florida ........................................................................................................................49
ix
VI. References..................................................................................................................50
Appendix A: Criminal Provisions and Penalties for BAC Test Refusal........................................51
Appendix B: Provisions and Penalties for Failing a BAC Test and DWI Conviction................... 60
Appendix C: Connecticut Implied Consent Form A-44...................................................................68
Appendix D: Facsimile of Maryland Form DR-15: Advice of Rights ............................................. 71
Appendix E: Florida Implied Consent Warning............................................................................... 73
x
Tables and Figures
TABLE 1. Breath Test Refusal Percents by State.................................................6
TABLE 2. 2001 Average Reported Refusal Rate by State....................................8
FIGURE 1. 2001 Breath Test Refusal Percents by State......................................9
TABLE 3. Comparison of 1987 and 2001 Breath Test Refusal Distributions ......10
TABLE 4. Trend Analysis of Breath Test Refusal Data by State.........................12
TABLE 5. Connecticut Administrative Driver’s License Sanctions......................19
TABLE 6. Connecticut Criminal Penalties...........................................................20
TABLE 7. Maryland Administrative Driver’s License Sanctions ..........................25
TABLE 8. Maryland Criminal Penalties...............................................................25
TABLE 9. Florida Administrative Driver’s License Sanctions..............................30
TABLE 10. Florida Criminal Penalties.................................................................30
TABLE 11. Louisiana administrative Driver’s License Sanctions........................37
TABLE 12. Louisiana Criminal Penalties for those 21 or older. ..........................38
TABLE 13. Louisiana Criminal Penalties for those under 21 ..............................39
TABLE 14. Oklahoma Administrative Driver’s License Sanctions.......................43
TABLE 15. Oklahoma Criminal Penalties ...........................................................43

1
I. Introduction
This interim report is organized into five chapters that contain the results to date
for the breath test refusal study. Chapter I consists of the background information about
breath test refusal rates in the Unites States over the past 20 years and describes the
extent known about the breath test refusal problem resulting from recent changes in laws.
Chapter II includes a review of the refusal and DWI laws for each State, breath test
refusal rates for the past five available years for States, and information about trends
found in breath test refusal rates. Chapter III contains the rationale for selecting each
case-study State and describes the method used for the case study. Chapter IV includes a
detailed description of the systems in five case-study States and identifies the problems
and potential reasons for breath test refusal in those case-study States. Chapter V consists
of a discussion of two recommended strategies for reducing breath test refusals.
A. Background
From 1982 to 1996, the population of the United States increased by 15 percent,
the number of licensed drivers increased by 20 percent, vehicle miles driven increased by
56 percent, and the number of non-alcohol traffic fatalities increased by 32 percent. Yet,
remarkably, the number of alcohol-related fatalities decreased 37 percent from 25,165 in
1982 to 15,935 in 1998. This decrease has variously been attributed to: broad societal
influences such as overall attitudes toward drinking and driving and the work of
advocacy groups; legal initiatives including minimum age 21, illegal per se and
administrative per se; enforcement including the use of well-publicized sobriety
checkpoints; and public information and education (Ulmer, Hedlund and Preusser, 2000).
Further reductions in the number of alcohol-related fatalities have been difficult
to achieve. Before the decline in alcohol-related crashes from 2002 (17,524) to 2003
(17,013), the number of alcohol-related fatalities increased from 2000 (16,653) to 2001
(17,400) and from 2001 to 2002 (17,524). The most recent reduction may represent some
success for renewed efforts to combat drinking and driving, but fatalities continue to
remain well above the reductions achieved over a 14-year period ending in 1996. The
continued high number of fatalities compared to the lows seen in the mid-1990s
highlights the difficulties faced in renewing the downward trend in alcohol-related
fatalities. New initiatives are required to achieve additional reductions in alcohol-related
fatalities.
Identifying new initiatives to achieve additional reductions in alcohol-related
fatalities must begin with an understanding of the current state of knowledge.
Understanding current knowledge requires understanding whether the problem has
changed over time and how it has been affected by efforts to reduce it. There are two
recent studies in which researchers have identified States that achieved the largest
reductions in alcohol-related fatalities from 1982 to 1996 (Ulmer, Hedlund and Preusser,
under review) and examined the reductions as a function of driver age, with a particular
emphasis on youth (Hedlund, Ulmer and Preusser, 2000).

2
One of the conclusions appears to be that stronger laws have been effective in
reducing the number of people who choose to drink and drive. Unfortunately, strong laws
can sometimes have unwanted consequences. Some States have believed that one such
consequence has been an increase in the number of people who refuse the breath test.
While such a decision may subject these people to serious implied consent penalties, it
may also have the effect of avoiding a DWI conviction, which carries its own serious
penalties.
B. Study Goals
The three goals of this study are (1) to document the extent of the breath test
refusal problem, (2) to investigate the reasons for breath test refusals, and (3) to develop,
implement, and evaluate effective and efficient countermeasures to deal with the
problem.
II. State Law Review
A review of the administrative sanctions and criminal penalties for breath test
refusal in each State, the District of Columbia, and Puerto Rico was conducted using the
Digest of State Alcohol-Highway Safety Related Legislation (National Highway Traffic
Safety Administration, 2002) and the Implied Consent Laws (American Prosecutor
Research Institute, 2002). For each State, the following were determined: (1) the
administrative sanctions and criminal penalties for test refusal, (2) whether test refusal is
a criminal offense, (3) whether a refusal is admissible in court, (4) whether a BAC test
can be forced under certain circumstances, (5) whether drivers with a high BAC are
subject to additional criminal penalties, and (6) the circumstances that may reduce these
penalties.
The administrative and criminal provisions and penalties for breath test refusals
for each State are summarized in Appendix A. The provisions and penalties for failing a
BAC test and for DWI convictions are summarized in Appendix B. These summaries
include what must, should, or may happen following a breath test refusal or DWI
conviction. The summaries can best be considered as the upper limits for penalties that
can be imposed for administrative and criminal systems. During efforts to obtain refusal
data for each State, discussions with personnel from each State’s legal and administrative
systems confirmed that “mandatory” actions may often be reduced or ignored.
A. Administrative Sanctions and Criminal Penalties for Refusal
All but one State, Nevada, have administrative license sanctions for refusing an
alcohol test. State administrative sanctions include license suspensions and revocations
for varying periods of time. The suspensions and revocations include restrictions varying

3
from a “hard” suspension period in which no driving is allowed for a specified period (in
38 States and the District of Columbia) to a “soft” suspension period in which drivers can
obtain a temporary driving permit for purposes such as work and church (available in 9
States). Louisiana, Maryland, and West Virginia have provisions for hard license
suspension, but allow for restricted licenses/temporary driving permits in cases where an
ignition interlock is installed in the car.
B. Refusal as a Criminal Offense
Eight States consider a test refusal as a criminal offense. The manner in which
refusal is criminalized varies among the 8 States. Refusal is considered a misdemeanor in
Alaska, Minnesota, Nebraska, and Ohio. It is considered an infraction in Indiana. In
California, refusal becomes a criminal offense if the driver is convicted of DWI after
refusal. In Vermont, refusal is criminalized for drivers with a prior DWI. In New Jersey,
traffic law violations, including violations of the implied consent law, are considered
“quasi-criminal.” All 8 States impose a fine and/or a jail sentence for the crime of
refusing a breath test.
C. Refusal Admissibility in Court
Thirteen States and the District of Columbia admit a test refusal in civil and
criminal cases. Thirty-four States admit a test refusal in criminal cases only. Michigan
admits a refusal, but the refusal cannot be used as evidence of guilt. Hawaii considers a
test refusal only during an administrative license revocation hearing. Rhode Island and
Massachusetts do not admit a test refusal in either a civil or criminal case.
D. Forcing a BAC Test
Ten States have laws that either prohibit or do not address the issue of forcing a
test when a driver refuses to submit to a test. Eleven States allow for a mandatory or a
forceful submission to a test via a court order or search warrant. The remaining States and
the District of Columbia specify circumstances under which a test becomes mandatory.
For example, a test can be forced in 33 States if a driver is involved in a collision that
resulted in a serious injury or a fatality. Some of the States permitting forced tests for
serious injury and fatal crashes require evidence of probable cause/reasonable grounds
that alcohol or another substance was involved or that a driver had a prior impaired
driving offense.
E. Additional Criminal Penalties for Drivers with a High BAC
As of January 2002, 31 States and the District of Columbia had a law or a
regulation that provides for enhanced sanctions for drivers with high BACs. The high-
BAC threshold ranges from .15 - .20%. The enhanced sanctions include longer and more

4
intensive education and/or treatment; limitations on deferred judgment provisions or
deferred prosecution; limitations on plea reductions; enhanced driver sanctions, such as
jail sentence, driver license suspension, community service, electronic home monitoring,
and fine; enhanced vehicle sanctions, such as ignition interlock device (IID) and
administrative plate impoundment; and court consideration of high BAC as an
aggravating factor at sentencing. At least theoretically, the availability of additional
sanctions for high-BAC offenders should negatively influence a suspect’s willingness to
submit to a BAC test. However, this was not the case in Minnesota. Minnesota enacted its
“high-BAC” law in 1998, and defines a high BAC as .20 or higher. An evaluation of the
effects of this law indicated that the rate of refusals actually declined significantly among
first-time offenders and was essentially unchanged for those with a prior conviction. This
may be due to Minnesota’s strong law regarding test refusals (McCartt and Shabanova,
2003).
F. Circumstances That May Reduce Penalties and Affect Refusal Rates
There are several factors that may affect refusal rates. For example, if the penalty
for a refusal is less than a penalty for failing an alcohol test, more drivers may refuse to
submit to a test. Each State’s administrative sanctions, criminal penalties for failing a
BAC test for first time, and subsequent offenses were reviewed to identify common
factors that may affect refusal rates. The administrative and criminal penalty information
from each State is presented in Appendix B.
1. Administrative License Action for Failing a BAC Test
Forty-two States either administratively suspend or revoke the driver’s license of
an offender who fails an alcohol test. State provisions for administrative license actions
vary in terms of revocation and suspension periods, as well as whether a driving permit or
a restricted license is available immediately (“soft” suspension or revocation period) or
after a specified period of time (“hard” suspension or revocation period). Eight States
(Kentucky, Michigan, Montana, New Jersey, Pennsylvania, Rhode Island, South Dakota,
and Tennessee) do not have any administrative license actions for failing an alcohol test.
In South Carolina, an administrative license action provision is not applicable to
offenders with BACs < .15.
2. Penalties for DWI Conviction
Court-ordered license suspensions or revocations following a DWI conviction can
also be “hard” or “soft”. In addition to a license action, post-conviction court penalties
may also include fines (substantial in some States, for example, up to $2,500 for a first
DWI conviction in Illinois); jail terms up to two years for a first DWI conviction in some
States (e.g., Washington and Vermont); and community service which can be served in
5
lieu of a certain number of hours of a jail term or in addition to a jail term. Judges may
impose additional sanctions as well.
III. State Breath Test Refusal Rates
In October and November 2002, each of the 50 States, the District of Columbia,
and Puerto Rico were contacted to obtain their breath test refusal information. The
information included the number of breath tests requested and the number refused for
each of the six prior years, 1996-2001. Additional information gathered included whether
test refusal was considered a crime, whether licensing actions for refusal were “hard”
(mandatory) or “soft” (hardship licenses could be granted under certain circumstances),
whether refusals were reported to insurance companies, and a relative comparison of
DWI and refusal sanctions. Five States that did not have 2001 breath test refusal data
available in November were contacted in July 2003 to obtain the 2001 data. Three of the
five States were then able to provide 2001 data. Massachusetts and New Jersey were only
able to provide 2000 data.
Table 1 presents a summary of results. When possible, each State provided data
from a “central,” responsible authority in charge of collecting test refusal data. The
central authorities in many States depended upon the completeness and consistency of
reporting from other agencies in the State, so the breath test request and refusal data, at
least in some States, represent best estimates of breath test refusal rates. Three States
(Colorado, New York, and Wyoming) were unable to provide any data on refusals.
Nevada had refusal data only on drivers involved in fatal crashes. Five States (Arizona,
Missouri, South Dakota, Virginia, and Vermont) were able to provide the number of
refusals but not the number of tests requested.
The remaining 41 States, the District of Columbia, and Puerto Rico provided both
tests refused and tests requested for at least one year. In four of these States (Delaware,
Maryland, Pennsylvania, and Texas) the highway patrol served as the only data source.
The Maryland highway patrol covers the entire State, so its data represents a central
source. For the three other States, the highway patrol was responsible for a substantial
portion of DWI arrests statewide, so their test request and refusal data served as the best
statewide estimates.

6
Table 1.
Breath Test Refusal Percents by State
State 2001 2000 1999 1998 1997 1996
Alabama* 31.1%
Alaska* 17.4% 18.0% 15.9% 15.6% 15.9%
Arkansas* 21.2%
California* 5.3% 5.5% 5.4% 5.5% 6.3% 6.7%
Connecticut* 18.7% 18.2% 17.4% 17.1%
DC* 12.0% 13.2% 14.0% 13.5%
Delaware
HP
14.7%
Florida* 37.1% 37.1% 35.9% 36.7% 36.1%
Georgia* 17.0% 17.5% 18.8% 19.3% 23.2% 23.2%
Hawaii* 9.4%
Idaho* 31.6% 31.0% 30.0% 27.0% 28.3% 25.7%
Illinois* 38.3% 38.1% 38.0% 37.5% 39.1% 39.2%
Indiana* 22.5% 21.5%
Iowa* 17.0% 16.2% 16.6% 17.7% 18.6%
Kansas* 15.2% 15.2% 15.4% 16.0% 15.6% 15.8%
Kentucky* 10.2% 9.7% 8.1% 7.7% 7.6% 8.1%
Louisiana* 45.9% 42.4% 40.6% 39.6% 40.8% 41.3%
Maine* 7.8% 7.8% 9.2% 9.0% 9.6% 10.1%
Maryland* 29.1% 28.4% 26.7% 25.3% 25.6% 26.0%
Massachusetts*
46.5% 49.9% 63.0% 60.8% 54.9%
Michigan* 12.8% 13.2% 14.2% 15.5% 14.8%
Minnesota* 14.8% 14.4% 14.4% 15.3% 16.5% 17.6%
Mississippi* 17.3% 18.3% 17.6% 18.4% 21.7% 22.8%
Montana* 30.3% 35.0% 36.0% NA 33.1% 29.4%
Nebraska* 6.2% 7.0% 6.7% 6.8%
New Hampshire* 82.3% 81.9% 81.7% 79.5% 74.7% 71.6%
New Jersey*
16.7%
New Mexico* 19.0% 19.0% 19.0% 21.0% 22.0% 22.0%
North Carolina* 17.8% 18.6%
North Dakota* 14.2% 14.2% 14.5% 15.7% 14.7% 14.0%
Ohio* 40.4% 34.0% 32.9% 31.3%
Oklahoma* 38.3% 38.3% 37.6% 35.0% 35.5% 35.2%
Oregon* 13.0% 12.2% 13.1% 13.8% 16.3% 17.8%
Pennsylvania
HP
10.2% 9.2%
Rhode Island* 84.9% 96.4% 91.7% 92.2% 89.9%
South Carolina* 29.9% 28.3% 26.2% 25.5%
Tennessee* 35.5%
Texas
HP
40.6% 40.2% 42.5% 42.0%
Utah* 17.3% 18.9% 19.8% 22.0% 18.1% 51.8%
Washington* 17.9% 18.4% 18.2% 18.4% 17.8% 19.1%
West Virginia* 14.0% 12.8% 14.3%
Wisconsin* 18.9% 14.2% 14.5% 13.8%
Puerto Rico* 1.9% 1.8% 1.8% 2.4% 1.2% 1.4%
Source: * = Central
HP = Highway Patrol

7
A. Analyses of 2001 Breath Test Refusal Data
Using the last year of available data (2001 for most States, but 2000 for
Massachusetts and New Jersey), the average refusal rate, with each State counted equally,
but excluding Puerto Rico, is 25 percent. As indicated in table 2, when the States are
weighted by their populations, the average refusal rate is 24 percent. The distribution of
2001 breath test refusal rates (using 2000 data for two States) is skewed, due to a few
States with very high refusal rates. California had the lowest refusal rate for 2001 at 5
percent, while Rhode Island had the highest at 85 percent. Figure 1 shows this
distribution graphically. For such a skewed distribution, the quartiles and the median are
more descriptive than either the weighted or unweighted means:
• First quartile 14%
• Median 18%
• Third quartile 32%.
Several comparisons between States were made to determine if any differences
existed in their average refusal rates related to differences in their administrative and
criminal sanctions. First, States that have high-BAC laws had higher average refusal rates
(M=26%) than those without high-BAC laws (M=22%), but the independent samples t-
test indicated that the differences were not significant t(40)=.785, p>.45. Second, States
with soft license suspension periods had higher average refusal rates (M=28.46%) than
those with hard suspension periods (M=23%), but again the independent samples t-test
indicated that the difference was not significant t(40)=.785, p>.45. Third, States that
criminalize refusal had a lower average refusal rate (M=17.61%) than those that do not
criminalize refusal (M=26%), but the difference was not significant according to the
results of the independent samples t-test t(40)=-1.178, p.>.20. Overall, results from
comparisons of these three types of laws showed differences in the average refusal rate
that were consistent with the intent of the laws, but not large enough to approach
significance.

8
Table 2.
2001* Average Reported Refusal Rate by State and
2001 Average Refusal Rate Weighted by 2001 Population Size
State Reported Population Population Weight Weighted
Alabama 31.1% 4,464,356 0.019 0.6%
Alaska 17.4% 634,892 0.003 0.0%
Arkansas 21.2% 2,692,090 0.011 0.2%
California 5.3% 34,501,130 0.144 0.8%
Connecticut 18.7% 3,425,074 0.014 0.3%
DC 12.0% 571,822 0.002 0.0%
Delaware 14.7% 796,165 0.003 0.0%
Florida 37.1% 16,396,515 0.069 2.5%
Georgia 17.0% 8,383,915 0.035 0.6%
Hawaii 9.4% 1,224,398 0.005 0.0%
Idaho 31.6% 1,321,006 0.006 0.2%
Illinois 38.3% 12,482,301 0.052 2.0%
Indiana 22.5% 6,114,745 0.026 0.6%
Iowa 17.0% 2,923,179 0.012 0.2%
Kansas 15.2% 2,694,641 0.011 0.2%
Kentucky 10.2% 4,065,556 0.017 0.2%
Louisiana 45.9% 4,465,430 0.019 0.9%
Maine 7.8% 1,286,670 0.005 0.0%
Maryland 29.1% 5,375,156 0.022 0.7%
Massachusetts 46.5% 9,990,817 0.042 1.9%
Michigan 12.8% 6,379,304 0.027 0.3%
Minnesota 14.8% 4,972,294 0.021 0.3%
Mississippi 17.3% 2,858,029 0.012 0.2%
Montana 30.3% 904,433 0.004 0.1%
Nebraska 6.2% 1,713,235 0.007 0.0%
New Hampshire 82.3% 1,259,181 0.005 0.4%
New Jersey 16.7% 8,484,431 0.035 0.6%
New Mexico 19.0% 1,829,146 0.008 0.1%
North Carolina 17.8% 8,186,268 0.034 0.6%
North Dakota 14.2% 634,488 0.003 0.0%
Ohio 40.4% 11,373,541 0.048 1.9%
Oklahoma 38.3% 3,460,097 0.014 0.6%
Oregon 13.0% 3,472,867 0.015 0.2%
Pennsylvania 10.2% 12,287,150 0.051 0.5%
Rhode Island 84.9% 1,058,920 0.004 0.4%
South Carolina 29.9% 4,063,011 0.017 0.5%
Tennessee 35.5% 5,740,021 0.024 0.9%
Texas 40.6% 21,325,018 0.089 3.6%
Utah 17.3% 2,269,789 0.009 0.2%
Washington 17.9% 5,987,973 0.025 0.4%
West Virginia 14.0% 1,801,916 0.008 0.1%
Wisconsin 16.9% 5,401,906 0.023 0.4%
Total Average 25.32% 239,272,876 1.000 24.4%
*2000 data were used for Massachusetts and New Jersey
9
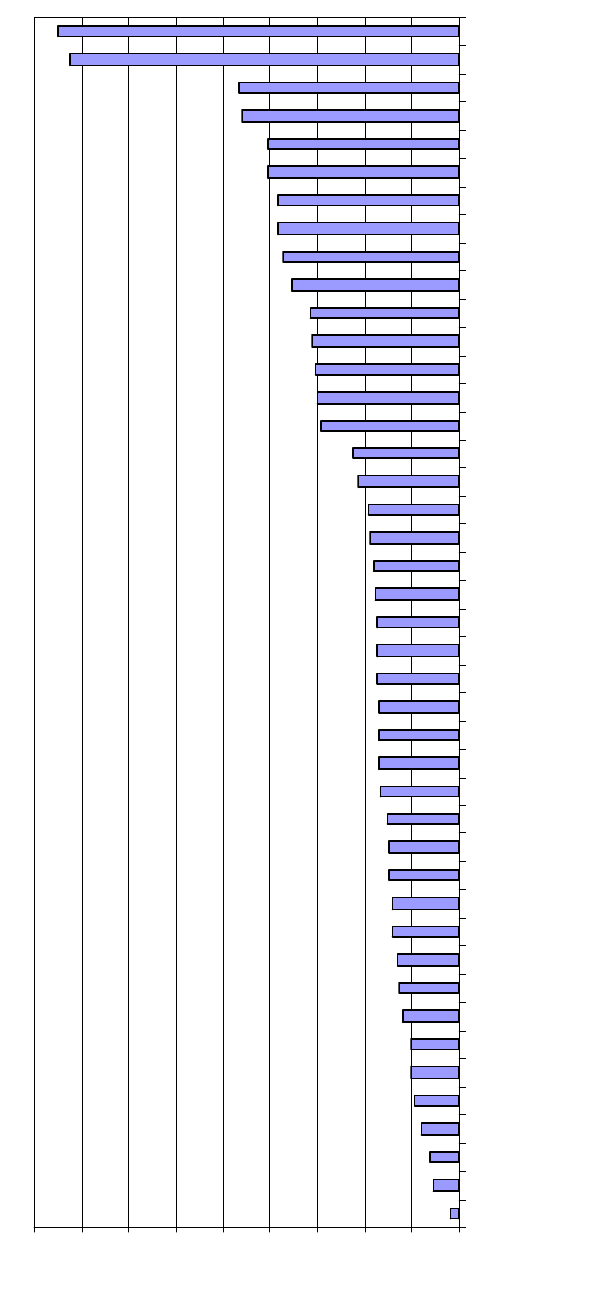
Figure 1.
2001
*
Breath Test Refusal Percents by State**
0%
10%
20%
30%
40%
50%
60%
70%
80%
90%
Puerto Rico
California
Nebraska
Maine
Hawaii
Kentucky
Pennsylvania
DC
Michigan
Oregon
West Virginia
North Dakota
Delaware
Minnesota
Kansas
New Jersey
Wisconsin
Georgia
Iowa
Mississippi
Utah
Alaska
North Carolina
Washington
Connecticut
New Mexico
Arkansas
Indiana
Maryland
South Carolina
Montana
Alabama
Idaho
Tennessee
Florida
Illinois
Oklahoma
Ohio
Texas
Louisiana
Massachusetts
New Hampshire
Rhode Island
*2000 data were used for Massachusetts and New Jersey.
**Complete data was not available from AZ, CO, MO, NV, NY, SD, VA, VT, or WY.

10
B. Comparison of 2001 and 1987 Breath Test Refusal Rates
A previous survey of State refusal rates, with 1987 data, obtained data from 40
States (Jones and Wiliszowski, 1991). As indicated in table 3, the lowest refusal rate was
4 percent lower in 1987 than 2001 and the highest refusal rate was 13 percent lower in
1987 as compared to 2001. The State at the highest end of the range was the same, Rhode
Island, for both comparison years. The table also indicates that the median refusal rate for
2001 was 4 percent higher than the median refusal rate for 1987. The first and fourth
quartiles also indicate that the refusal rates were higher for 2001 as compared to 1987.
There were also fewer States with refusal rates above 40 percent in 1987 as compared to
2001. The 2001 distribution appears very similar to the 1987 distribution, but with
slightly higher refusal rates and more States at the high end of the distribution. Refusal
rates for some individual States differ markedly from 1987 to 2001, suggesting
potentially serious limitations on any comparisons of the data from these two studies.
Table 3.
Comparison of 1987 and 2001 Breath Test Refusal Distributions
1987 2001
Number of States Reporting 40 42
Range of Rates 1% - 72% 5% - 85%
Mean Refusal Rate 19% 25%
Median Refusal Rate 14% 18%
First Quartile 11% 14%
Third Quartile 22% 32%
Number of States over 40% Refusal Rate 3 6
Highest Refusal Rate among States 71% 85%
C. Trend Analyses of 1996-2001 Breath Test Refusal Data
To analyze refusal rate changes in recent years, simple linear regressions were
calculated for each of the 32 States with at least three years of refusal rate data. Table 4
presents the results.
Refusal rates increased in 13 States. Seven States had statistically significant
increases (p < 0.05). Rates decreased in 18 States and the District of Columbia. Eight of
the 13 States had statistically significant decreases (p < 0.05).
The States that had significant decreases in refusal rates had low rates to begin
with, and the States where rates increased began with high refusal rates. For example,
eight States that reduced their rates had a mean rate of 13 percent and a median of 14
11
percent in the last available year, while the seven States whose rates increased had a
mean of 34 percent and median of 30 percent.
Among States with significant decreases in test refusals, two (California and
Minnesota) criminalize test refusals. Six out of 8 States with significant decreases have
hard license suspension periods. Two of the 8 States (Michigan and New Mexico) allow
for a court order or a search warrant to force a test. Mississippi and Georgia prohibit a
forceful test. The remaining States with significant decreases allow force to be used to
obtain a BAC test result if a driver was involved in a serious/fatal injury crash (in some
States, reasonable grounds/probable cause of driver impairment is required).
None of the States with significant increases in test refusals criminalize test
refusals. Five out of these 7 States have hard license suspension periods. South Carolina
does not have ALR for offenders with BAC < .15%. None of the States in this group have
statutory provisions for a court order or a search warrant to force a test. Connecticut is the
only State in the group that allows for blood to be drawn to the extent provided by law
while the other States allow for a forced BAC test if a driver was involved in a crash that
resulted in a serious/fatal injury (in some States, reasonable grounds/probable cause of
driver impairment is required).
According to the results of the simple linear regressions, there is no recent
increasing or decreasing trend for refusal rates across all States combined. The 15 States
with significant trends are split evenly between increases and decreases. The reduction in
refusal rate is less than 2 percent for these States. New Hampshire experienced a 10
percent increase, which added to its already high refusal rate compared to other States.
The greatest change across the remaining States was 6 percentage points or about 1
percentage point each year.

12
Table 4.
Trend Analysis of Breath Test Refusal Data by State
Trend State reg +/- std err t-stat p value
New Hampshire 0.0221 0.0044 4.9657 0.0077
South Carolina 0.0153 0.0020 7.8179 0.0160
Idaho 0.0116 0.0023 5.1399 0.0068
Oklahoma 0.0076 0.0019 4.0365 0.0156
Maryland 0.0072 0.0021 3.4739 0.0255
Connecticut 0.0056 0.0006 8.6410 0.0131
Statistically
Significant
Increase
Kentucky 0.0049 0.0016 3.0253 0.0390
Ohio 0.0284 0.0086 3.2921 0.0812
Louisiana 0.0082 0.0043 1.9210 0.1271
Alaska 0.0054 0.0023 2.2984 0.1051
Montana 0.0033 0.0069 0.4797 0.6565
Florida 0.0024 0.0015 1.6036 0.2071
Increase
Wisconsin 0.0090 0.0091 2.1330 0.1660
California -0.0027 0.0007 -3.7899 0.0193
Maine -0.0048 0.0008 -5.8593 0.0042
Minnesota -0.0061 0.0017 -3.6390 0.0220
Michigan -0.0063 0.0018 -3.4663 0.0405
New Mexico -0.0070 0.0065 -4.8010 0.0090
Oregon -0.0106 0.0025 -4.1899 0.0138
Mississippi -0.0110 0.0028 -3.9172 0.0173
Statistically
Significant
Decrease
Georgia -0.0139 0.0023 -5.9985 0.0039
North Dakota -0.0005 0.0016 -0.2985 0.7802
Washington -0.0013 0.0011 -1.1734 0.3057
Kansas -0.0014 0.0005 -2.5392 0.0640
Nebraska -0.0015 0.0015 -0.9785 0.4310
West Virginia -0.0015 0.0078 -0.1925 0.8790
Illinois -0.0020 0.0061 -1.3690 0.2430
Iowa -0.0047 0.0022 -2.1765 0.1177
DC -0.0053 0.0028 -1.9187 0.1950
Rhode Island -0.0058 0.0148 -0.3906 0.7222
Texas -0.0065 0.0039 -1.6700 0.2369
Decrease
Utah -0.0492 0.0260 -1.8927 0.1313
13
IV. Case Study of Five States
Another objective of the study was to learn as much as possible about the causes
for low refusal rates in some States and high refusal rates in other States. Five States were
selected for case study to determine the likely causes for their refusal rates. The case
studies involved in-depth evaluation of the arrest, breath test, administrative, and judicial
processes to identify refusal problems, barriers, and potential solutions.
1. Characteristics of the 5 Selected States
The 5 States selected all had refusal rates above the national average and provided
a mix in terms of the magnitude of refusal rates and variations in impaired driving laws
and practices. Refusal rates ranged from slightly above the national average to far above
the national average. Laws pertaining to test refusals ranged from moderately weak to
good. The impaired driving laws in these States reflected a mix of the following: none
have criminalized refusal; 2 States have hard suspension periods for a test refusal and 2
States have hard suspension periods without an ignition interlock device; 4 States have
.08 BAC per se laws, 4 States have a high BAC law, and all States have Administrative
License Revocation provisions and with test refusal admissible in court.
a) Connecticut
Connecticut’s 2001 test refusal rate of 19 percent is near the national median
point of 18 percent and has risen slightly from 17 percent in 1998. Review of Connecticut
law, as well as discussions with State representatives, revealed that test refusal is not a
crime; it is admissible in court; and administrative penalties for refusal are more severe
than those for DUI. For example, for a first-time refusal, the license suspension period is
hard for 90 days, whereas for a first-time alcohol test failure a temporary driving permit
is available to the offender immediately. The State has ALR provisions, a .08 BAC per se
law, and a high-BAC (.16) law.
b) Maryland
Maryland’s 2001 test refusal rate of 29 percent is well above the 18 percent of the
national median. The rate has risen gradually from 26 percent in 1996. Maryland’s law
has a longer hard license suspension period for a test refusal than for failing a breath test,
but a hardship license is available immediately if an ignition interlock is installed for one
year. Test refusal is not criminalized. The State has ALR provisions and a .08 BAC per se

14
law. Interviews with the State representatives revealed that penalties for refusal
frequently are not applied and that test refusal is a problem.
c) Florida
Florida’s 2001 refusal rate of 37 percent ranks tenth highest of the 46 States with
known rates. The State’s refusal rate has remained at this level since 1997. Florida has a
hard license suspension period for a test refusal, though test refusal is not criminalized.
Florida has ALR provisions, .08 BAC per se law, and a high-BAC law (.20). Interviews
indicated that test refusal is a known major problem in Florida and the State has been
trying to find a solution.
d) Louisiana
Louisiana’s 2001 test refusal rate of 46 percent ranks it fourth highest among
States with known rates. The rate has risen from 41 percent in 1996. Louisiana has a
shorter soft license suspension period if an ignition interlock is installed. Test refusal is
not criminalized. Interviews with the State representatives revealed that offenders are
willing to accept the administrative penalty for a test refusal in order to avoid the criminal
DWI charge. Louisiana has ALR provisions and a high-BAC law (.15) and has a .08 per
se law effective September 30, 2003.
e) Oklahoma
Oklahoma’s 2001 test refusal rate of 38 percent is high, considering its low rate of
.61 persons fatally injured per 100 million vehicle miles traveled for alcohol-related
crashes. The refusal rate has risen from 35 percent in 1996. Oklahoma has a soft license
suspension period and similar penalties for a test refusal and DUI. Test refusal is not
criminalized. Oklahoma has ALR provisions, .08 BAC per se law, and a high-BAC law
(.15).
B. Case Study Data Collection Method
The first goal of data collection for the case studies was to understand the entire
system, from arrest to conviction. To collect data on the system, interview protocols for
prosecutors, judges, defense attorneys, police officers, police supervisors, and
administrative unit officers were developed. The purpose of the interviews was to ask
about the system, how the system operated in practice, discover problems with the
system, and identify potential solutions for improving breath test submission rates. Each
set of questions asked for specific types of information.
15
The following lists identify the types of information sought during interviews
with each specialty.
Prosecutors:
• Typically imposed penalties for first and subsequent DWIs
• Typical administrative sanctions for first and subsequent DWIs
• The factors affecting how refusal cases are prosecuted
• Evidence needed to prosecute refusal cases
• Success rates for prosecuting refusals
• Characteristics of those refusing breath tests
• Differences in court jurisdictions with regard to how breath test refusal cases are
adjudicated
• Training prosecutors receive for DWI cases
• Suggestions, within existing legislation, to decrease the number of drivers who
refuse the breath test.
Judges:
• Typically imposed penalties for first and subsequent DWIs
• Typical administrative sanctions for first and subsequent DWIs
• Impact of particulars on a case and penalties
• The factors affecting how and when refusal cases are prosecuted
• Evidence needed to prosecute refusal cases
• Prospects of prosecutors bringing more refusal cases to court
• Additional evidence police need to collect for successful prosecution of refusal
cases
• Characteristics of those refusing breath tests
• Differences in court jurisdictions with regard to how breath test refusal cases are
adjudicated
• Training that prosecutors receive for DWI cases and the judge’s experience with
DWI cases
• Suggestions, within existing legislation, to decrease the number of drivers who
refuse the breath test.
Defense Attorney:
• Typical penalties imposed for first and subsequent DWIs
• Typical administrative sanctions for first and subsequent DWIs
• The factors affecting how refusal cases are prosecuted
• Advice given to clients concerning breath test refusal
• Success rate for defending cases with a BAC test refusal
• Differences in court jurisdictions with regard to how breath test refusal cases are
adjudicated
16
• Training defense attorneys receive for DWI cases
• Suggestions, within existing legislation, to decrease the number of drivers who
refuse the breath test.
• Suggestions, excluding legislative changes, that would make it more likely for
defense attorneys to encourage clients to take rather than refuse the breath test
Police Officer/State Trooper:
• Describe the arrest process
• Number of DWI arrests made by the officer/trooper each year
• Number of individuals who consent to take the breath test
• Process for administering breath tests
• Typically imposed penalties for first and subsequent DWIs
• Typical administrative sanctions for first and subsequent DWIs
• The factors affecting how refusal cases are prosecuted
• Defense community advise concerning test refusal
• Differences in collecting evidence for refusal cases
• Success rates for prosecuting refusals
• Characteristics of those refusing breath tests
• Differences in court jurisdictions with regard to how breath test refusal cases are
adjudicated
• Training police officers receive for implied consent and gaps that need to be filled
• Suggestions, within existing legislation, to decrease the number of drivers who
refuse the breath test.
Police Supervisor:
• Describe the arrest process
• Number of DWI arrests made under the person’s command each year
• Number of individuals who consent to take the breath test
• Process for administering breath tests
• Typically imposed penalties for first and subsequent DWIs
• Typical administrative sanctions for first and subsequent DWIs
• The factors affecting how refusal cases are prosecuted
• Defense community advice concerning test refusal
• Differences in collecting evidence for refusal cases
• Success rates for prosecuting refusals
• Characteristics of those refusing breath tests
• Differences in court jurisdictions with regard to how breath test refusal cases are
adjudicated
• Training police officers receive for implied consent and gaps that need to be filled
• Suggestions, within existing legislation, to decrease the number of drivers who
refuse the breath test.

17
Administrative Unit Officers/DMV
• Administrative Consequences for DWI/DWI arrest
• Factors affecting refusal rates
• Description of what happens at the administrative hearings
• Description of how administrative license suspensions are applied.
• Suggestions, within existing legislation, to decrease the number of drivers who
refuse the breath test.
C. Case Study Results
Breath Test Refusal System, Problems, and Barriers
The interview results are organized into the following sections for each of the 5
case study States: (1) the system, (2) how the system works, (3) how BAC tests are
requested and administered, (4) advantages of taking or not taking a breath test, (5) who
takes and who refuses the BAC test, (6) benefits of BAC test results, and (7) potential
strategies to reduce BAC test refusals.
18
1. Connecticut
Connecticut’s breath test refusal rate was 18.7 percent for 2001.
1) The System
Connecticut’s impaired driving legislation identifies two methods for determining
that a person committed the offense of operating a motor vehicle under the influence of
intoxicating liquor, any drug, or both (DUI). The first method specifies that a person can
be considered to be operating a vehicle under the influence if the person is found to be
under the influence of intoxicating liquor, any drug, or both. This method does not
identify any criteria for making the determination. The second method specifies that a
person can be considered operating a motor vehicle under the influence if found to have
an “elevated blood alcohol content,” which means a BAC ≥ .08 percent.
After arrest, the person must submit to a BAC test within two hours of operating
the motor vehicle. The BAC test consists of two tests of the same type, done no less than
30 minutes apart. The second test is used to determine whether the first test was an
accurate measurement of BAC. The person under arrest must have an opportunity to
contact a lawyer during a 15-minute period before deciding whether to submit to the
BAC test. Refusing either test constitutes a refusal. If the person does not provide an
adequate breath or urine sample when requested and refuses to submit to a blood test, the
officer or trooper records it as a refusal.
Connecticut offers a Pretrial Alcohol Education Program for first-time offenders.
Those with a DUI arrest in the previous 10 years are not eligible. If the offender
completes the program, the court dismisses the DUI charges. The record of participation
in the program remains as part of the person’s driving record for 7 years.
Connecticut has an administrative “per se” license suspension for anyone with a
BAC ≥.08 percent. Offenders who want a hearing at the Department of Motor Vehicles
(DMV) administrative “per se” unit to get their licenses back must schedule one and have
it within 30 days of arrest. If the offender does not schedule a hearing, the administrative
“per se” unit issues the appropriate license suspension. If there is a hearing, the
administrative hearing officer uses the hearing to gather information necessary to decide
whether the preponderance of evidence establishes the following four points: (1) the
officer had probable cause to arrest the person for operating a motor vehicle under the
influence, (2) the person was placed under arrest, (3) the BAC test was administered
properly, and (4) the person was operating the motor vehicle.
If the four points are met, the person’s license is suspended. The suspension
period is 90 days if the person submitted to a BAC test and six months if the person
refused to submit to a BAC test.

19
First-time offenders who submit to a BAC test are immediately eligible for a work
permit, which means they can continue driving during the entire administrative
suspension period. First-time offenders who refuse the test must wait 90 days of their six-
month administrative suspension period before they can get a work permit.
Administrative license suspensions are separate from those that are court-determined or
mandated after a conviction. If a person is caught operating a motor vehicle under the
influence while using the permit, the person can be jailed for a period of one month to
one year and fined $500.
Connecticut has criminal penalties and administrative sanctions that increase with
the number of offenses and vary for those under 21 (zero tolerance law), those with a
BAC ≥.16, and those with a BAC greater than .08 but less than .16.
Tables 5 and 6 summarize the administrative sanctions and criminal penalties.
Table 5.
Connecticut Administrative Driver’s License Sanctions
Blood Alcohol Level First Offense
Second
Offense
Third
Offense
Refusal to submit to a blood,
breath or urine test 6 month suspension
1.5 year
suspension
1.5 year
suspension
Test results of .02 or higher
and you are under 21 years of
age
180 day
suspension
9 month
suspension
2 year
suspension
Test results of .08 or higher;
up to, but not including, .15
90 day
suspension
9 month
suspension
2 year
suspension
Test results of .15 or higher
120 day
suspension
10 month
suspension
2.5 year
suspension

20
Table 6.
Connecticut Criminal Penalties
Type of
Penalty
First Offense
Test results of .08 or
higher
Second Offense
(within 10 years)
Test results of .08 or
higher
Third Offense
(within 10 years)
Test results of .08 or
higher
Fine
$500 to $1,000 $1,000 to $4,000 $2,000 to $8,000
Jail
6 months; 48 hrs.
minimum
mandatory or 6
months suspended
with 100 hrs.
community service
2 years; 120 days
minimum mandatory
and 100 hrs. of
community service
3 years; 1 year
minimum mandatory
and 100 hrs. of
community service
Driver’s
License
Suspension
One year Three years
(or until you are 21,
whichever is longer)
Permanent
2) How the System Works
The administrative sanctions are fairly certain and do not vary much across the
State because all administrative sanctions are controlled by the Administrative Per Se
Unit of the Department of Motor Vehicles. The head of the Administrative Per Se Unit
reported that half of all offenders do not request an administrative hearing, which means
that the applicable license suspension penalty is automatically applied. For those who do
request hearings, many do not show up. In such cases, the suspension is automatically
applied as well. Administrative sanctions are also generally applied to those few who
schedule and show up for an administrative hearing.
Defense attorneys use the administrative hearings to find out the strength of the
case against their clients, which often puts the arresting officers and troopers on the spot
without much preparation.
The certainty of criminal penalties varies with different judges and prosecutors. If
prosecutors have heavy caseloads, or lack police reports with detailed behavioral
descriptions supporting a strong case, they often permit the offender to plea the charges
down to reckless driving or simply “nolle” the case, which means that the State chooses
to end prosecution of the case, or go no further with the case. Some jurisdictions are
much harder on DUI cases than others.
Many repeat offenders fight their cases vigorously because the penalties can be
severe. Judges in many jurisdictions do not impose the maximum penalties for the first or
repeat offenses. They may take the administrative penalties into account when
considering criminal penalties by running court-imposed license suspensions
21
concurrently with administrative license suspensions instead of consecutively. Most
repeat offenders receive longer license suspensions, but no jail time.
Generally, if a person refuses the BAC test, that person is more likely to contest
the case. The lack of BAC test results clouds the case just enough to give the defense an
advantage it does not have when there are test results. Defense attorneys usually attack
the police reports and the behavioral cues reported by the officer or trooper. Without a
BAC test, these reported cues are the only evidence the State has of the person’s
intoxication at the time of arrest.
3) How BAC Tests are Requested and Administered
Officers and troopers use a standard form called the A-44, located in Appendix C,
to inform those under arrest of their implied consent to take the BAC test. The form
explains the request for the BAC test and their right to refuse the test. After reading the
form to the individual, the person must be allowed to try contacting a lawyer for advice
on whether to take the test. Most are not able to get in touch with a lawyer before
deciding whether to take the test.
In addition to reading the A-44, some officers and troopers try to calm offenders
before sitting them down in front of the Intoxilyzer 5000 so the individuals are not as
defensive. It is believed that these officers have much lower refusal rates because officer
rapport with the driver helps. Those interviewed indicated that refusals are likely higher
in cases where an officer is not experienced at developing rapport with offenders or are in
a hurry to get through all the paperwork involved in the arrest process.
Offenders must take two BAC tests of the same type. The first test must be
administered within two hours of the person operating a motor vehicle. The breath test
must be administered by a certified officer or trooper. Almost all officers and troopers in
the State are trained and certified on the Intoxilyzer 5000. Thus, the arresting officer most
often administers the test.
4) Advantages of Taking or Not Taking a Breath Test
From the vantage point of the offender, first-time offenders benefit by taking the
test because it benefits them more than refusing, but repeat offenders benefit more by
refusing the BAC test because they benefit more from refusing than taking and failing a
BAC test. First-time offenders are eligible for the Pretrial Alcohol Education Program
through the courts and a work permit from the DMV, so they can keep driving, on a
restricted basis, throughout their suspension period and get the charges dismissed when
they complete the alcohol education program. First-time offenders definitely benefit more
by agreeing to take the BAC test than refusing it. Repeat offenders gain a slight
advantage by refusing to take the test. If an offender has already gotten a work permit and
taken the alcohol education class for a prior arrest, the offender is not eligible for either.
Repeat offenders cannot avoid the administrative suspension unless they contest the
arrest at the administrative hearing. The focus of most repeat offenders is on improving
22
their chances at a successful criminal defense. Refusing the test provides an advantage to
their case and increases the likelihood of a plea bargain, nolle, or reduced criminal
penalty.
Repeat offenders often benefit from refusing the BAC test because it clouds the
case just enough to give them a slight advantage in court proceedings. The administrative
penalties are not severe enough to deter refusals by repeat offenders.
5) Who Takes and Who Refuses a BAC Test
First-time offenders constitute 75 percent of those who refuse to submit to the
BAC test. According to the DMV’s Administrative Per Se Unit’s data 2,731 (75 percent)
of the total 3,622 individuals who refused the BAC test in 2002 were first-time offenders.
Assuming the ratio of first-time offenders to repeat offenders arrested remains the same
each year and that the proportion of first-time refusers among all refusals remains
consistent as well, data from 2001 DUI arrest records indicate that first-time offenders
refuse the breath test 28 percent of the time while repeat offenders refuse the BAC test a
slightly higher rate of 35 percent of the time. First-time offenders reportedly refuse often
because they tend to be defensive at the time of their arrest and they are generally
uninformed of the administrative consequences for refusal. Officers and defense
attorneys as well as prosecutors report that first-time offenders generally do not know
that the alcohol education program is available. They also do not know that after a first-
time offender completes the alcohol education program, the court will dismiss the
criminal case a year later.
6) Benefits of BAC Test Results
The BAC test results remove any doubt about the person’s intoxication while
operating a motor vehicle. Cases with BAC test results are far less likely to be contested.
When contested, cases with BAC test results are more likely to result in conviction than
those without BAC test results. As several interviewees noted, it is easier to challenge
testimony than the test. Obtaining BAC test results helps convict intoxicated drivers.
7) Potential Strategies to Reduce BAC Test Refusals in Connecticut
• Reduce the paperwork involved in DUI arrests as the current lengthiness of the
process, which often takes two to three hours, encourages officers to rush through
the BAC testing process so they can finish their paperwork.
• It may also be possible to revise the A-44 form to include a description of the
administrative sanctions for first-time offenders who take and refuse the BAC test
and the option for the alcohol education program that results in dismissal of the
charges.
• Make refusal more severe for a repeat offender than taking the BAC test. The
additional three months of administrative suspension for refusal for a repeat
23
offender is not enough to deter refusals. The repeat offender stands a better
chance against the criminal penalties by refusing the test, which currently
outweighs any difference in sanctions imposed by the DMV.
• Train and encourage officers to gather a broader set of evidence to support their
DUI cases with the knowledge that the person could refuse the test. This includes
getting more behavior indicators and following up the arrest with a more in-depth
investigation. For example, officers could go to the locations where the person
may have been drinking and interview bartenders and hosts of parties for
information on how many drinks the person had and what they looked like when
leaving. In addition, videotape the breath testing process to provide judges and
prosecutors with supporting evidence of the person’s behavior. Better evidence
will mean that BAC test refusal provides no advantage to the defendant in court.
24
2. Maryland
Maryland’s breath test refusal rate was 29.1 percent for 2001.
1) The System
Maryland has a two-tier system for impaired driving offenses: driving under the
influence (BAC ≥.08; called “A” offenses) and driving while impaired (BAC <.08; called
“B” offenses).
Maryland allows Probation Before Judgment (PBJ), under which offenders may
be given one year of probation with alcohol education; upon successful completion the
driver’s record is cleared so there is no record of a prior alcohol offense.
Cases are prosecuted and adjudicated at the county level. Practices vary
substantially by county and sometimes by individual judges and prosecutors within a
county.
Maryland has administrative per se with license suspension for BAC ≥.08.
Offenders have the right to a hearing before an Administrative Law Judge (ALJ). The
ALJ can dismiss the suspension or can modify the suspension to allow driving to work,
school, alcohol treatment, or other purposes.
Test refusal results in administrative license suspension for 120 days for first-time
offenders and 1 year for repeat offenders, which again can be appealed to an ALJ.
Driving to work or other purposes may be allowed under the condition that the driver
uses an alcohol interlock. Test refusal suspensions are in addition to any criminal
penalties that may be applied.
Penalties increase for repeat offenders (defined as a second or subsequent offense
within 5 years) and for drivers transporting a minor. Penalties are not increased for
drivers with high BAC levels -- Maryland does not have a high-BAC aggravated DWI
law.
Tables 7 and 8 summarize the administrative and criminal penalties. The only
“mandatory” minimum penalty is 5 days in jail or 30 days community service for a
second “A” offense within 5 years.

25
Table 7.
Maryland Administrative Driver’s License Sanctions
Blood Alcohol Level
First Offense
Second
Offense
Third
Offense
Refusal to submit to a blood,
breath or urine test
120 days or 1 year
interlock
1 year 1 year
Test results under .08
(B)
None None None
Test results of .08 or higher
(A)
45 days; may get
modification for
work, etc.
90 days; may
get
modification
for work, etc.
90 days; may
get
modification
for work, etc.
Table 8.
Maryland Criminal Penalties
Type of
Penalty
First Offense Second Offense Third Offense
Fine
Under .08(B) - $500
.08 or over(A)-$1,000
Under .08(B) - $500
.08 or over(A) - $2,000
Under .08(B) - $500
.08 or over(A)-$2,000
Jail
Under .08(B)-60 days
.08 or over(A)-1 year
Under .08(B)- 1 year
(5 days and, if within 5
years of first, or
community service)
.08 or over(A) - 2 years
Under .08(B)- 1 year
.08 or over(A) – (10
days mand. If within
5 years or community
service) 3 years
Driver’s
License
Suspension
Under .08(B) – 60
days suspension
.08 or over(A) –
6-month revocation
Under .08(B) - 120
days suspension
.08 or over(A) –
1-year revocation
Under .08(B) – 120
days suspension
.08 or over(A) –
1-year revocation
Probation
Before
Judgment
Yes No No
Community
Service
None 30 days in lieu of jail 60 days in lieu of jail
2) How the System Works
Both criminal and administrative consequences of a DWI arrest vary considerably
by jurisdiction. It is believed that drivers generally receive more severe sanctions in rural
counties.
First offenders almost always have their criminal charges pled to “B” regardless
of whether or not they took a BAC test or what their BAC level was. They then almost
26
always receive PBJ. This means they will have no DWI prior record if they complete
their probation satisfactorily, only a record of the PBJ. Administratively, first time
offenders receive no suspensions with a BAC < .08 (unless they have 4 or more points on
their driving records already); a 45-day suspension with a work modification with a BAC
≥ .08. If a first-time offender refuses the breath test, they receive either a 120-day
suspension or a 1-year interlock requirement.
Since PBJs are not recorded as DWI priors, a second offense within 5 years of a
PBJ is thus considered a first DWI offense. In theory, drivers cannot receive a second
PBJ, but some do. Usually, though, these second offenses are pled down to a “B” and
receive a fine and probation. Only with a third offense are jail or community service
typically imposed. Administratively, the second offense will in fact be identified as a
second offense. Drivers over .08 will receive a 90-day suspension, perhaps with a work
permit modification and perhaps not. Drivers who refuse will receive a 1-year
suspension, perhaps with the option of driving with an interlock, perhaps not.
The administrative portion of the system appears to work well, with fairly certain
penalties. The criminal portion is driven by the PBJ option. Some believe that PBJ is
applied far too frequently. PBJ’s most contentious feature is that the offender has no
record of this “first” offense. This feature of PBJ would be far more acceptable to its
critics if it was permanently recorded as a prior alcohol-related offense, so that a
subsequent arrest could be charged as a second offense.
3) How BAC Tests are Requested and Administered
Drivers arrested on an impaired driving charge are taken to a police station or
equivalent facility where they are asked to provide a breath test. A breath test is used
unless the driver is injured and unable to provide a breath test or unless breath test
equipment is not available. The driver must take the test within two hours of the request.
A driver who fails to take the test within the two-hour period is considered to have
refused. A driver who fails to cooperate with testing procedures, such as by not providing
a satisfactory breath sample, also is considered to have refused. A driver has the right to
consult with an attorney before deciding whether or not to take the test.
Maryland has a form DR-15, Advice of Rights, located in Appendix D, which
attempts to explain the implied consent law and the consequences of taking or refusing
the test. Arresting officers must read or explain the form to arrested drivers when they
request the test, and both the officer and the driver must sign the form. The form is a full
page of about 9-point type and is difficult to understand; it is detested by almost
everyone. However, if officers attempt to explain the form and the possible consequences
of taking or refusing the test in their own words, they can be attacked in court, so many
officers just read the form.
27
4) Advantages of Taking or Not Taking a Breath Test
From their vantage point, first-time offenders benefit from taking the breath test
because of the relative outcomes. Even if they fail the test, they almost always will
receive a PBJ with at most a 45-day suspension and a work permit compared to the 120-
day suspension they would receive if they refuse. In addition, their insurance companies
will find out about refusals and will raise insurance rates about $2,000 a year for three
years. PBJs have no effect on insurance rates because insurance companies do not learn
about them. Many defense attorneys advise first offenders to take the test.
Second offenders benefit from refusing the test unless they are sure they are under
.08. If they refuse, they typically will be pled to a B (under .08) and charged as though
they were a first offender. They cannot (in theory) receive a PBJ, but they will receive
relatively light B-level penalties. If they take and fail the test, they may face the more
severe A-level penalties.
5) Who Takes and Who Refuses a BAC Test
It is believed that many first-time offenders are scared, confused, not thinking
straight (they have been drinking, perhaps quite a lot), perhaps intimidated by law
enforcement, and do not clearly understand the consequences of refusing or taking the
test. The DR-15 form doesn’t help. Most first-time offenders do not have an attorney they
can call in the two-hour window after they’ve been asked for a test. As a result, some
first-offenders refuse the test out of confusion or general suspicion of authority. Repeat
offenders have more knowledge of the system, the possible consequences of taking or
refusing the test, and the likelihood that the penalties will in fact be applied. Repeat
offenders are more likely to get an attorney’s advice. Repeat offenders also face more
severe criminal penalties and may have learned that license suspensions for refusal are
difficult to enforce. So many repeat offenders refuse the test.
Attorneys’ advice varies. Some will advise first offenders to take the test and
repeat offenders to refuse. Some will advise everyone to refuse on the grounds that
drivers should not cooperate in any way with the arresting officer. Others may advise
everyone to take the test and then attack the testing process (chain of custody, breath test
instrument calibration and function, etc.).
6) Benefits of BAC Test Results
BAC test results assist in obtaining DWI convictions and may help to identify
problem drinkers. Many, perhaps most, prosecutors will plea a DWI down to a “B”
offense if there is no BAC result: conviction is far easier with a high BAC test result in
evidence. High BACs also allow judges to include alcohol problem screening and
treatment as part of the driver’s sentence. Some judges assume that repeat offenders are
likely to have an alcohol problem and should be screened, but first offenders with alcohol
problems likely are not identified without a BAC test and a high BAC reading.
28
7) Potential Strategies to Reduce BAC Test Refusals in Maryland
• Provide better information to drivers, especially first-time offenders and drivers
under the age of 21, on the consequences of refusing or taking the test.
First-time offenders are almost always better off taking the test than refusing it,
even if they have a high BAC. If first-time offenders knew that refusal likely
would result in a 120-day suspension and $6,000 additional insurance costs, while
taking the test probably would result only in a 45-day suspension with a work
permit, no criminal record after PBJ, and no insurance costs, then virtually all
first-time offenders would take the test.
The issue is how to convey this information accurately since it describes “what
usually happens,” not “what the law allows,” and might be interpreted as saying
that “first offenders always get off with PBJ and escape any meaningful
penalties.” To avoid this, the message could emphasize the penalties for refusal.
Some possible methods for publicizing these penalties include:
a. Revise the DR-15 form so it is clear, understandable, and written in plain
English.
b. Advise newly-licensed drivers in driver education classes, driver licensing
ceremonies, and perhaps even on the driver’s license itself, that they have
consented to a BAC test if requested and that refusal will result in a long
license suspension.
• Provide incentives and training to law enforcement to encourage more tests.
• Strengthen the DWI code to increase test refusal penalties for repeat offenders.
First offenders face, and typically receive, substantially greater penalties for
refusal than for taking and failing the test. But second and subsequent offenders
do not, which is why most repeat offenders refuse the test. This is unlikely to
change unless the penalties are increased.
29
3. Florida
Florida’s breath test refusal rate was 37.1 percent for 2001.
1) The System
In Florida, DUI is punished by both pre-conviction administrative and post-
conviction criminal sanctions.
Pre-conviction licensing actions for DUI are 6 months’ mandatory minimum
suspension for a first offense and 12 months for second and subsequent offenses. There
are no post-conviction minimum revocation periods for a first offense, but drivers receive
12 months for a second conviction within five years, 24 months for a third conviction
within 10 years, and permanent revocation for the fourth conviction. A hardship license is
available following mandatory minimum suspensions. A DWI offender's vehicle is
subject to forfeiture if, at the time of the offense, the person is driving on a suspended or
revoked license for a prior DUI offense.
Florida has no diversion programs for DWI first offenders nor does it have
anything like probation before judgment (PBJ).
At the time of conviction, there are mandatory minimum fines of $250 for a first,
$500 for a second and $1,000 for third and subsequent DUIs. There is no mandatory
minimum period of incarceration for a first offense, but it is 10 days (with 48 consecutive
hours) for a second offense within 5 years, and 30 days for a third within 10 years (also
with 48 consecutive hours). Enhanced penalties are available for high-BAC offenders
(.20 or higher), although mandatory minimums are the same as for regular offenders.
Additional sanctions include community service (50 hours minimum, although the court
may substitute a fine of $10 an hour), substance assessment and treatment, victim impact
panel (at the judge’s discretion), DWI school, and other assessments and surcharges.
Until July 2001, the only penalties for breath test refusal were administrative
license suspensions. BAC test refusal now carries an administrative license suspension of
12 months for a first refusal (instead of 6 months for the DUI) and 18 months for second
and subsequent refusals. Since July 2001, second refusals are a class 1 misdemeanor, and
offenders can receive additional court-ordered sanctions upon conviction. It is difficult to
predict what the penalties will be for misdemeanor refusal because there are no
mandatory minimums and very little case law.
Tables 9 and 10 summarize the administrative and criminal penalties.

30
Table 9.
Florida Administrative Driver’s License Sanctions
Blood Alcohol Level First Offense
Second
Offense
Third Offense
Refusal to submit to a blood,
breath, or urine test
12 month
suspension
(same for under 21)
18 month
suspension
(misdemeanor)
18 month
suspension
(misdemeanor)
Test results of .08 or higher 6 months 1 year 1 year
Table 10.
Florida Criminal Penalties
Type of
Penalty
First Offense Second Offense Third Offense
Fourth
Offense
Fine
$250-$500
$500-$1,000;
BAC .20 or
higher up to
$5,000
$1,000 -$2,500;
BAC .20 or
higher up to
$5,000
$1,000;
mandatory.
BAC .20 or
higher up to
$5,000
Jail
Up to 6
months;
BAC of .20 or
higher, up to 9
months
10 days
mandatory (with
48 consecutive
hours)-9 months
if BAC .20 or
higher, up to 12
months
30 days
mandatory
(with 48
consecutive
hours)
30 days
minimum;
BAC .20 or
higher, up to 1
year
Driver’s
License
Suspension
None;
Can receive
10-day vehicle
impoundment
1 year
revocation; 30-
day vehicle
impoundment
2 year
revocation;
90-day vehicle
impoundment
Permanent
revocation;
90-day
vehicle
impoundment
Community
Service, etc.
Up to 50 hours
or fine of $10 an
hour), substance
assessment and
treatment, etc.
If BAC .20 or
higher, above
mandatory
Up to 50 hours
or fine of $10 an
hour), substance
assessment and
treatment, etc.
If BAC .20 or
higher, above
mandatory
Up to 50
hours or fine of
$10 an hour),
substance
assessment and
treatment, etc.
If BAC .20 or
higher, above
mandatory
Up to 50
hours or fine of
$10 an hour),
substance
assessment and
treatment, etc.
If BAC .20 or
higher, above
mandatory
2) How the System Works
31
The administrative suspension process starts when the law enforcement officer
lifts the suspect's license after the suspect either refuses a breath test or takes it and fails.
The case is then classified either as a Refusal or DUBAL (Driving with Unlawful Blood
or Breath Alcohol) and is entered into the Department of Highway Safety and Motor
Vehicles (DHSMV) system as one or the other. Before offenders are released by police,
they are given a packet that contains a citation and suspension (including a 10-day
driving permit), a Probable Cause Affidavit, and a Refusal Affidavit. The packet instructs
the subjects that they may request a review of the license suspension, but must make the
request within 10 days. The offender is given a choice of either an informal or formal
review.
Offenders represent themselves at informal reviews. The offender and the hearing
officer examine the paperwork submitted by police for errors in fact, and the hearing
officer decides whether to sustain or overturn the suspension. Informal reviews, by law,
must be completed within 20 days of the arrest. Generally, the reviews are scheduled
within 10 days because the driver cannot legally drive after that period.
Formal reviews are more intense, and must be completed within 30 days of the
arrest. The offender may be (and usually is) represented by an attorney. The offender is
allowed to request subpoenas of material witnesses, who can be cross-examined at the
hearing by the defense attorney. One defense attorney says he always advises clients to
request a formal review, because he is able to overturn the suspension in 7 of every 10
cases and he gets "free discovery" of the case police have against the client. The DHSMV
estimates that 25 to 30 percent of suspended drivers request formal reviews and that
about 35 percent of the formal reviews result in the overturn of the suspension. The
overall impact is that 10 to 12 percent of DUI-related suspensions are overturned. The
DHSMV generally grants a hardship permit allowing the subject to drive until 12 days
past the date of review. If there has been a prior breath test refusal, however, the subject
is not entitled to a hardship permit under any circumstance.
While the administrative suspension process proceeds, the DUI prosecution takes
an independent course through the courts. The administrative hearing has no bearing on
the criminal process.
Because the volume of DUI cases is huge, a high proportion of cases are resolved
pretrial. There is general agreement that almost all cases charged by police are
prosecuted. Most are resolved by guilty pleas, some are pled down to reckless driving, a
few are tried in court and very few are dismissed. (Statistics were not available.)
Prosecutors and defenders agree that the overall strength of the State's case is the primary
factor that determines pretrial disposition. The skill and level of effort by defense counsel
also are acknowledged by both prosecutors and defenders as major factors. There also is
agreement that presence or absence of breath test evidence is not very important in the
pretrial phase, because there are many other factors that can weaken a case. In Miami,
which is not necessarily representative of the rest of the State, there is a powerful
32
incentive for first-time offenders to plead guilty, since a 30-day jail sentence is generally
imposed at trial and it is suspended if the defendant pleads guilty.
Misdemeanor refusal for repeat offenders is charged separately from DUI. In the
year since the law became effective, few second refusal cases have come to trial. At
present, no statistics are available on how many people have been charged with a second
refusal. Police may miss some repeat offenders who qualify for the charge, because the
driving record information the police routinely access does not show prior refusals.
However, prosecutors do get the information that would identify prior refusals and the
charges could be initiated by prosecutors if they chose to do so. At the time of this report,
the state attorney who drafted the law was trying a case in which motions had been filed
citing fourth, fifth, and sixth amendment issues as well as Miranda problems. All of these
issues had been researched prior to the passage of the legislation. The original intent of
the bill's sponsors was that the law should apply to all refusals. It was amended in the
legislative process to cover only second and subsequent refusals.
3) How BAC Tests are Requested and Administered.
Breath tests are administered only after the suspect has been placed under arrest
for DUI. Usually the suspect is asked to take the test after having performed a roadside
Field Sobriety Test and having been transported to a central testing facility. There are
exceptions when a mobile breath testing facility is available for checkpoints, or when
there has been a crash that caused serious injuries to the suspect and/or someone else. In
an injury crash involving others, police may force a blood test.
Breath tests may be administered only by operators certified by the Florida
Department of Law Enforcement. In many cases the breath test operator is not the
arresting officer, and in a few cases, the breath test operator is a civilian. Either the
arresting officer or the breath test operator can request the breath test. In most places, the
implied consent warning is read to the suspect only if the offender refuses. After being
read the warning statement, the offender is asked again. The offender and the police
officer who read it must sign the form to acknowledge that the warning was read. At least
one county court requires that the implied consent warning be read before asking the
suspect to agree to the test. The law enforcement officers in that jurisdiction, as well as
State troopers, read the implied consent form first as a matter of standard procedure.
Some officers feel they would get fewer refusals by just asking. The language of the
warning is about as simple and clear as a legal document can be. It emphasizes the
license suspension penalties for refusing and advises that a second refusal is a crime.
4) Advantages of Taking or Not Taking a Breath Test
From the vantage point of the offender, the only circumstance in which it is
certain that it will be to an adult driver's advantage to submit to a BAC test is when the
driver is sure that the BAC is under .08. A first-time offender that agrees to the test and
fails it will, upon conviction, be suspended for 6 fewer months, but will usually need to
pay fines and fees, be put on probation, required to perform community service, sent to
33
DUI school, and required to pay for alcohol assessment and perhaps treatment. The
severity of the longer refusal suspension is diminished by the possibility that it can be
overturned and that a hardship permit will be granted. (Hardship permits are available
only when there is no prior refusal in the record.) Both prosecutors and defense attorneys
agree that the consequences of refusal are less severe than the consequences of
conviction, even for a first offense.
Addition of a misdemeanor refusal charge for defendants with a prior refusal
could possibly equalize the penalties somewhat for repeat offenders, but it is too early to
tell whether the penalties actually imposed upon conviction will approach those for repeat
DWI convictions.
Minors who take the breath test and fail get a 6-month suspension while refusals
result in a 1-year suspension, making it relatively more attractive to take a breath test.
Also, suspension might be viewed as being a more important consequence relative to
other sanctions by youthful drivers than by adults. The significantly reduced penalties for
taking and failing a BAC test compared to refusal may be the reason why refusals are
significantly lower among minors than adults.
5) Who Takes and Who Refuses BAC Tests?
As noted, there is a vast difference in the refusal rate between minors and adults.
In 2002, the refusal rate was only 6 percent for minors versus 38 percent for adults.
There are no statistics on demographic or economic characteristics of people who
refuse versus people who submit to the test. Some experts venture that people who refuse
tend to be upscale economically and generally more educated and sophisticated. Others
say you just can't predict who will submit and who will refuse. Everyone seems to agree
that most of the people who refuse have been advised to do so by a defense lawyer or the
advice has passed on by someone they know who has been arrested for a DUI.
Defense attorneys complain that the implied consent statement does not give
defendants the full information they need to make an informed decision, saying nothing
about the consequences of a DWI conviction, concentrating only on the sanctions for
refusal.
6) Benefits of BAC Test Results
With the exception of defense attorneys, everyone involved in the DUI
sanctioning process agrees that a higher rate of breath test submittal would have great
benefit. Law enforcement officials feel that more breath tests will assure that a higher
percentage of offenders are punished. Prosecutors would like a higher proportion of
defendants to be tested because it probably will increase the proportion of guilty pleas as
it is more difficult for defenders to win at trial when the level of intoxication is known.
That means fewer trials, and prosecutor's offices are always overworked and
understaffed. It is believed that alcohol tests also help judges to make the right sentencing
34
decisions upon conviction, helping to identify problem drinkers and mandate the most
appropriate combination of sanctions and treatment.
7) Potential Strategies to Reduce BAC Test Refusals in Florida
Increase the public’s perception that the relative penalties for refusing a BAC test
are more severe than the penalties for taking and failing a BAC test. If the public has the
view that administrative license suspensions are easy to beat, the deterrent value of the
increased administrative sanctions for refusal is greatly diminished.
Therefore, the recommendations are to:
• Upgrade the knowledge and confidence of suspension hearing officers. Florida’s
DUI Technical Advisory Committee has discussed the administrative hearing
process in the past. Part of the problem appears to be that many hearing officers
are non-lawyers, and some may be intimidated by highly qualified defense
attorneys. The only educational qualification for the position is a high school
diploma. DHSMV has made an increased effort to train hearing officers in the
relevant law to ameliorate the situation, but it has a way to go. Perhaps increasing
funding and revising the requirements for hearing officers to hire attorneys as
hearing officers and increased resources or more legal training for current hearing
officers would be money well spent. Some States hire qualified attorneys to
become hearing officers on an hourly basis. That solution may work in Florida.
• Increase police training to effectively represent DUI and refusal cases in
suspension hearings. The arresting officers are the only individuals allowed in
DHSMV license suspension reviews who represent the State's interest. Although
Institute of Police Technology and Management has made an effort to train police
officers on how to represent their cases in administrative license suspension
hearings, not enough officers are trained. Increased funding to make the training
more widespread might also be a good investment. The added training could be
more specialized, along the lines of trial advocacy training for new prosecutors.
Added training could turn arresting officers into “police prosecutors" when they
appear in formal license suspension hearings.
There is some hope that the recently passed law making second refusals a
misdemeanor will evolve into an effective deterrent to breath test refusal among repeat
offenders, who probably are more likely to refuse than first offenders. Certainly, when
the constitutional issues have been tested, a misdemeanor refusal case will be much easier
to prosecute than a DUI. If the courts impose penalties for second refusals that are as
severe as the penalties imposed by the court for an actual DUI conviction, the increase in
the relative benefits of taking and failing the test as compared to refusing the test will
likely lead to defense attorneys advising their clients to take the test.
35
Police and prosecutors should make special efforts to bring as many misdemeanor
refusal cases to trial as possible to reinforce its effect as an effective penalty and
deterrent. Changing the driving record information system to make it easier for police to
identify and charge offenders with second refusals would also increase the efficacy of the
new law.
36
4. Louisiana
Louisiana’s breath test refusal rate was 45.9 percent for 2001.
1) The System
After arrest, the person must submit to a BAC test within a reasonable amount of
time after operating the motor vehicle. There is a 15-minute observation period before
administering the breath test. The person has no right to contact a lawyer before either
submitting or refusing to take the breath test. The arresting officer is required to inform
the person of the consequences of refusing to submit to a BAC test. The offender is
permitted to refuse the test unless the offender was involved in a crash where a fatality or
bodily injury occurred. If the person does not provide an adequate breath or urine sample
when requested and refuses to submit to a blood test, the officer or trooper records it as a
refusal. Refusals are admissible in court, but not criminalized. There was a bill
introduced, but not passed, in 2003 at the State legislature to criminalize BAC test
refusal. It will reportedly continue to be introduced each year during regular sessions
until passage.
Louisiana had an administrative per se license suspension for anyone with a BAC
≥ .10. As of September 30, 2003, the per se BAC decreased to ≥.08. Offenders must
schedule a hearing with the Department of Motor Vehicles (DMV) regarding
administrative license suspension within 15 days of arrest. If the offender does not
schedule a hearing, the DMV issues the appropriate license suspension.
Louisiana offers a pretrial diversion program for those arrested for DWI. The law
relating to pretrial diversion programs does not restrict pretrial diversion to first-time
offenders. Entrance into the program is at the discretion of the district attorney and the
court. There are 35 pretrial diversion programs operating in Louisiana. The Grant parish
district attorney-run program includes a 1-year probation and requires activities such as
community service, counseling (e.g., anger management, alcohol, drug counseling, going
to talk to a victim impact panel put together by MADD), and/or restitution. If the
offender completes the program, the prosecuting authority maintains a record for five
years of the person’s successful participation in the program and makes that record
publicly available.
First-time offenders who submit to a BAC test are eligible for a work permit
within 30 days of their 90-day administrative suspension. First-time offenders who refuse
the BAC test must wait 90 days of their 6-month administrative suspension before they
can get a work permit. The court has no jurisdiction over mandatory license suspensions
in Louisiana resulting from convictions, but it does issue recommendations regarding
suspensions. All suspensions, whether administrative or criminal, are under the control of
the DMV. The courts can recommend actions regarding suspensions mandated by law
that accompany convictions. In addition, the court can make violation of a suspension a
violation of probation, which makes the suspension carry more weight.

37
Louisiana has criminal penalties and administrative sanctions that increase with
the number of offenses and vary for those under 21 (zero tolerance law), and those with a
BAC ≥.15. First- and second-time offenders fall under the jurisdiction of local courts
while third- and subsequent offenders fall under the jurisdiction of State courts.
Tables 11 and 12 summarize the administrative and criminal penalties and table 13
summarizes the criminal penalties for those under 21.
Table 11.
Louisiana Administrative Driver’s License Sanctions
Blood Alcohol Level
First
Offense
Second
Offense
Third
Offense
Fourth
Offense
Refusal to submit to a blood,
breath, or urine test
6-month
suspension
1-year
suspension
1.5-year
suspension
1.5-year
suspension
Refuse to submit and you are
under 21
180-day
suspension
1.5-year
suspension
1.5-year
suspension
1.5-year
suspension
Test results of .02 or higher
and you are under 21
180-day
suspension
1-year
suspension
1-year
suspension
1-year
suspension
Test results of .10 or higher (.08
as of September 30, 2003)
90-day
suspension
1-year
suspension
1-year
suspension
1-year
suspension

38
Table 12.
Louisiana Criminal Penalties for those 21 or older
Type of Penalty First Offense
Second Offense
(within 10
years)
Third Offense
(within 10 years
of last
conviction)
Fourth
Offense
(within 10
years of last
conviction)
Fine
$300 - $1,000 $750 - $1,000 $2,000 $5,000
Jail
10 days - 6
months;
suspension if
probation with
minimum 2 days
in jail (If .15 or
higher,
mandatory 48
hours in jail)
48 hrs
mandatory jail
of a 1-6 month
jail term
1-5 years with or
without hard
labor (6 months
mandatory)
2 years
mandatory
Driver’s License
Suspension
90 days
(hardship
provision)
90 days
(hardship
provision)
24 months (no
hardship
provision)
2 years (no
hardship
provision)
Substance abuse
Program
Yes Yes Yes Yes
Driver
Improvement
Program
Yes Yes Yes Yes
Community
Service Program
4 8-hr. days
(minimum)
30 8-hr. days
Auto may be
seized and sold
Auto may be
seized and sold

39
Table 13.
Louisiana Criminal Penalties for those under 21
Type of Penalty
First Offense
Test results of .02 or higher
Second Offense
Test results of .02 or higher
Fine
$100-250 $150-$500
Jail/Community Service
No
10 days – 3 months (48 hours
mandatory)
Driver’s License Suspension
No No
Substance abuse Program
Yes Yes
Driver Improvement
Program
Yes Yes
2) How the System Works
The administrative sanctions are fairly certain when the Department of Motor
Vehicles (DMV) gets the arrest information from a parish and the paperwork is complete
and accurate. Parishes do not always send DWI arrest information to the DMV, which
means that administrative license suspension may not always occur. Local courts often do
not share arrest and conviction information with each other or the DMV, so some first
offense administrative suspensions could be the person’s second or third suspension.
The criminal penalties vary widely, with those cases where the person has refused
the BAC test most frequently resulting in a reduction of the DWI charges and a plea to
lesser charges. Most district attorneys want to get a guilty plea to at least one charge
when a DWI arrest is made, so in cases where the offender has refused the BAC test, they
often reduce the DWI charges to reckless driving or a first DWI offense for someone
facing a second or third DWI offense.
Parish courts do not share information on DWI convictions, so some individuals
can be convicted in several counties for a first offense. In addition, because local courts
keep the fines for the first and second DWI convictions but do not have jurisdiction over
third DWI offenses, they have an incentive to charge offenders with a first or second
offense multiple times rather than charging the person with a third or subsequent offense
and sending the person to a State court.
3) How BAC tests are Requested and Administered
Officers and troopers use a standard form to inform those under arrest of their
implied consent to take the BAC test. They explain the person’s right to refuse the test.
40
They use a form to provide the information, but the form has changed quite a few times
recently, which makes it difficult for officers to accurately communicate the implications
of implied consent to offenders.
The BAC test must be administered in a reasonable amount of time after the
operation of the motor vehicle. Although there are no requirements that the person
administering the breath test be certified on the machine, most officers and troopers in the
State are trained and certified on the Intoxilyzer 5000. The arresting officer usually
administers the test unless a blood test is requested.
In one parish, the judge has reportedly issued warrants in some cases to force
offenders refusing to submit to the breath test to either submit to the breath test or have
blood drawn for BAC testing.
4) Advantages of Taking or Not Taking a Breath Test
From the vantage point of an offender, all offenders, regardless of whether it is
their first time, benefit from refusing the BAC test. Without test results, the district
attorney has a much more difficult time getting a conviction for DWI. Police often rely
upon the test results and do not always write reports that provide district attorneys with a
good case without the BAC test results.
When an offender submits to a test and “fails,” prosecution is automatic in most
cases. Refusals are sometimes reduced to reckless driving or careless driving if there is
little behavioral evidence of DWI. Prosecutors rarely dismiss cases completely, but they
are far more likely to agree to guilty pleas to lesser offenses.
Repeat offenders often benefit from refusing the BAC test because it clouds the
case just enough to give them a slight advantage in court proceedings. The administrative
penalties are not severe enough to deter refusals by repeat offenders and their refusal
greatly increases the likelihood of the charges being reduced in order to obtain a guilty
plea.
Those who believe their BAC will be above .15 also stand to benefit from
refusing because they cannot be convicted of DWI with a high BAC without the test
results. Such convictions mean 48 hours of mandatory jail time on first and second DWI
convictions.
5) Who Takes and Who Refuses a BAC Test
Repeat offenders are somewhat more likely to refuse the BAC test, but first-time
offenders refuse at a high rate as well. First-time offenders refuse the test 31 percent of
the time and second offenders refuse 36 percent of the time. However, some offenders
charged with a first-time offense in a parish may be repeat offenders who have a prior
arrest, BAC test refusal, and DWI conviction in another parish. The lack of information
sharing between parishes regarding DWI arrests, test refusals, and convictions means that
41
when a person is arrested for DWI in a parish, that parish may not know of the offender’s
DWI arrest, test refusal, and conviction history in other parishes. Affluent individuals and
those over 29 are also more likely to refuse to submit to a BAC test.
6) Benefits of BAC Test Results
BAC test results make prosecution much easier and are far less likely to be pled
down to lesser offenses. Judges want to know the BAC results because it helps inform
their rulings and makes the case easier to decide.
7) Potential Strategies to Reduce BAC Test Refusals in Louisiana
• Issue a standing warrant in each jurisdiction for a blood sample for BAC testing
for anyone who refuses to submit to the breath test. One judge has issued warrants
frequently enough that the parish has a standard standing warrant template that
they use for requesting forced BAC tests when necessary. The approach could be
systematized and expanded to serve as a standing warrant for use when needed to
force a BAC test.
• Provide officers with more training on what to observe with regard to behavioral
cues and require officers to write more extensive reports identifying all the
behavioral cues that indicated intoxication at the time of arrest. Currently, officers
rely largely on the BAC test results for their cases and do not submit complete
behavioral descriptions.
• Criminalize the BAC test refusal. There is currently a bill in the State legislature
to criminalize the third refusal.
• Take refusal cases to trial and publicize the case instead of reducing the DWI
charges in cases of refusals in return for a plea of guilty to a lesser charge. Many
district attorneys and judges do not take refusal cases to court because they stand
less chance of a conviction.
• Standardize the arrest paperwork involving the information that officers must
provide to offenders before requesting the BAC test. The information varies
across parishes and changes frequently.
• Train district attorneys and judges on the subtleties of clinical cases of
intoxication, those with BACs that are not high, but can involve impairment. The
subtle behavioral cues in these cases make district attorneys less likely to try them
and judges less likely to convict when a case is tried.
42
5. Oklahoma
Oklahoma’s breath test refusal rate was 38.3 percent in 2001.
1) The System
Oklahoma has a three-tier system for impaired driving offenses. Driving under the
influence (DUI), with a BAC of .06-.07 is often used to plea down DWI charges to some
lesser charge such as reckless driving. Drivers with BACs < .06 are not charged unless
they are under 21 or drugs other than alcohol are involved. Driving while intoxicated
(DWI), with a BAC ≥.08 is called an “A” offenses. Finally, there is aggravated DWI,
with a BAC ≥ .15. All DWI charges and first-time DWI charges are misdemeanors. A
second-time DWI offense is a felony, permitting more severe penalties.
Oklahoma has 77 district courts and almost 400 municipal courts. District courts
and Oklahoma City, Tulsa, and Lawton municipal courts are courts of record; the other
municipal courts are not. The two systems operate independently and do not share
records. Non-record municipal courts hear only misdemeanors. This means that for all
practical purposes, any impaired driving arrest heard in a non-record court is considered a
first offense regardless of whether the driver has been arrested or convicted of previous
impaired driving offenses. Some drivers have accumulated more than 10 DUI convictions
in one or more non-record courts without being charged with a second offense in a court
of record. The arresting officer decides where to file charges. Municipal courts keep
driver records for three years, while district courts keep them indefinitely.
Oklahoma has administrative per se with license suspension for BAC ≥.08.
Offenders have the right to a hearing before a Department of Public Safety (DPS)
attorney. The DPS attorney can dismiss the suspension or in some instances can modify
the suspension to allow driving to work, school, alcohol treatment, or other purposes with
the requirement that the driver use an interlock.
Test refusal results in administrative license suspension, which can be appealed to
a DPS attorney. Again, the suspension may be modified in some instances to allow
driving to work or other purposes if the driver uses an interlock. Test refusal suspensions
are in addition to any criminal penalties that may be applied.
Tables 14 and 15 summarize the administrative and criminal penalties available in law
for DWI and DUI.

43
Table 14.
Oklahoma Administrative Driver’s License Sanctions
Blood Alcohol Level First Offense Second Offense Third Offense
Refusal to submit to a
blood, breath, or urine test
180-day
suspension
1-year suspension
3-year suspension.
Work permit allowed
after 1 year with
interlock
Test results under .08
(DUI)
None None None
Test results of .08 or
higher (DWI)
180-day
suspension; work
permit allowed
with interlock
1-year revocation;
work permits not
allowed
3-year revocation;
work permit allowed
after 1 year with
interlock
Table 15.
Oklahoma Criminal Penalties
Type of Penalty First Offense Second Offense Third Offense
High BAC-
Aggravated
Driving Under
the Influence
Fine
Under .08 -$500
.08 or higher -
$1,000
Under .08 -$500
.08 or higher -
$2,500
Under .08 -
$500
.08 or higher -
$5,000
No additional
fines
Jail
Under .08 – 6
months
.08 or higher- 10
days – 1 year
Under .08 – 6
months
.08 or higher- 1-5
years
Under .08 – 6
months
.08 or higher-
1-7 years
None
Driver’s License
Suspension
Under .08- 30
days
.08 or higher-
180 days
Under .08 –
6-month
suspension
.08 or over –
1-year revocation
Under .08 –
6-month
suspension
.08 or over –
3-year
revocation
30-day interlock
Substance abuse
Program
None
28-day treatment;
30-day aftercare
28-day
treatment; 90-
day aftercare
28-day inpatient
treatment; 1-year
aftercare and
periodic testing
Community
Service Program
None None
.08 or higher –
240+ hours
480 hours
following
aftercare
44
2) How the System Works
The administrative consequences of an impaired driving arrest are fairly uniform
across the State and are essentially the same for drivers who refuse and drivers who fail
(BAC ≥ .08) the test: 180 days suspension for the first offense, with work permits
possible if the driver uses an interlock; 1 year for the second offense with no work
permits; and 3 years for the third with an interlock work permit allowed after 1 year.
Previously the suspension for first-offense test failure was 90 days compared to 180 days
for refusal. Now, the results of failing a BAC test are the same as those for refusing to
take the test.
About 25 percent of the drivers whose licenses are suspended or revoked for
refusing or failing the BAC test request an administrative hearing. The suspensions or
revocations are upheld about 80 percent of the time a hearing is requested. Work permits
are granted in about half of the hearings, which results in many drivers with suspended or
revoked licenses receiving a work permit. Interlocks are required for most, but not all,
drivers who receive work permits.
Administrative hearings have become an opportunity for defense attorneys to
gather information from the arresting officer that can be used to defend the driver in the
criminal action. Hearings are only authorized to explore specified subjects relevant to the
administrative action, such as establishing that the driver was in fact driving the car and
that law enforcement had appropriate justification to stop the car. But many of the DPS
attorneys who run the administrative hearings often allow questioning outside these areas.
Criminal charges and penalties vary considerably depending on whether the case
is heard in a municipal or district court or in a rural or urban area. In some rural areas,
impaired drivers may routinely be charged only with reckless driving rather than DUI or
DWI.
First-offenses are almost always pled down. Test failures are often pled to
reckless driving, which is not recorded as an alcohol-related offense so it does not count
as a prior. However, the DWI arrest is recorded. Thus, if the driver is arrested again, a
good arrest record search may lead to the discovery of the previous DWI arrest and allow
a repeat offense charge to be placed. First-time offenders who refuse the test often have
their cases pled to DUI or to reckless driving. Penalties typically involve a fine, perhaps
with an alcohol assessment and possible additional requirements such as community
service or victim impact panel sessions.
Second and subsequent offenses also frequently are pled down in municipal
courts. For example, in Tulsa City Court, refusals are pled to reckless and test failures are
pled from DWI to DUI. In district courts, impaired driving is a low-level offense
compared to other cases, so may be pled down or even dismissed. Some prosecutors are
said to dismiss all test refusal cases.
45
Impaired-driving cases rarely go to trial. Experienced law enforcement officers
report testifying in impaired driving cases “twice in 32 years” or “never in 13 years.”
Officers testify in administrative hearings fairly frequently.
3) The BAC Testing Process
After a driver has been placed under arrest, the arresting officer requests a breath
test. Requesting the breath test usually happens in the field, in the arresting officer's
patrol car, but the breath test is not given until the person reaches the police station or
jail. While in their vehicles, officers read an implied consent card to a driver after the
drivers have been placed under arrest. The card informs the driver that a test is required
and describes the penalties for refusing and for failing the test. The officer chooses
whether to request a breath or blood test. In practice, officers request a breath test unless
the driver has been taken to a hospital or emergency room and a blood test is more
convenient. A test can be obtained by force from drivers involved in crashes with a
serious injury or fatality, but this appears to be applied very rarely. The driver has the
right to request an independent test.
The breath test is given in the police station or jail if the offender agreed to submit
when asked at the scene of arrest. Most patrol officers are certified to operate the breath
test equipment. If a driver refuses a test when first requested at the arrest scene, officers
often will ask again at the station, and if the driver agrees at that point, the test is
conducted. The test requires two separate breath test samples taken three minutes apart. If
the driver gives the first sample but refuses the second, this is considered a refusal.
Failure to cooperate with the test, for example by not providing a satisfactory breath
sample, also is considered a refusal. Courts generally accept the officer’s word that the
driver refused the test or was uncooperative during the test.
If an injured driver is taken to an emergency room or hospital, a law enforcement
officer will go to the facility. Unless the driver is to be released immediately, the officer
usually requests a blood sample. Hospitals routinely provide the sample.
A recent policy in Oklahoma jails requires a medical evaluation before admitting
a person with a BAC over .25. This can be a substantial problem at night if medical
personnel are not available. Even if they are, it adds another step and more time to the
impaired driving arrest. To avoid it, some officers may not request a test if they suspect
the driver is over .25.
4) Advantages of Taking or Not Taking a Breath Test
From the vantage point of the offender, the administrative penalties are essentially
the same for drivers who refuse and drivers who fail the BAC test. This means that a
rational decision on whether or not to take the test depends on how the test result or the
refusal may affect criminal proceedings.
46
Properly-licensed drivers over age 21 with a BAC less than .06 definitely benefit
more by taking the test. With the BAC evidence to show that they are below the .06 limit,
they will not be charged. If they refuse the test, their driver’s license almost certainly will
be suspended.
First-time offenders with a relatively “low” BAC that is above .06 may benefit
more if they take the test. If their BAC is less than .08 their license will not be suspended
administratively. They may get a better deal in court since they have been cooperative
and have demonstrated that they are “not too drunk,” while refusers may be seen as
uncooperative and perhaps high-BAC. However, in jurisdictions where first offenders are
routinely pled to reckless or to DWI, the results of taking or refusing the test may be
about the same.
Drivers over the BAC limit of .08 probably would likely benefit by refusing. First
offenders almost always will have their charges pled down, whether they refuse or fail.
For drivers with a prior offense in a court of record, who face a second-offense felony
charge, some prosecutors will plea down refusals more readily than cases with BAC
evidence. Other prosecutors will proceed with refusal cases (one noted that about 70
percent of impaired driving cases that go to trial have no BAC results). They note that the
cases are harder to present without BAC evidence, especially if the arresting officer has
not carefully recorded other evidence of impairment. Judges will treat refusal and BAC
cases similarly, but juries will convict more easily with BAC data than with a refusal.
Finally, refusals do not face aggravated DUI charges (BAC ≥ .15), which some
jurisdictions use. (Many jurisdictions apply the aggravated DWI rarely or never.)
When asked for their personal advice if they or a friend were arrested for impaired
driving, the law enforcement officers, prosecutors, and judges interviewed were virtually
unanimous in advising anyone whose BAC might exceed .08 to refuse the test. Defense
attorney advice was mixed. Some, probably the majority, would advise everyone to
refuse, for the reasons noted above. Others would advise taking the test because the
process of requesting and administering the test provides many opportunities to attack the
prosecution: the “attack the breath test machine” strategy.
5) Who Takes and Who Refuses a BAC test
It is believed that most first-time offenders take the test and most repeat-offenders
refuse. Beyond this generalization, drivers who refuse the test tend to fall into one or
more of the following categories:
• Drivers with high BAC levels who fear the aggravated DUI penalties;
• Unlicensed drivers or illegal aliens, for whom a license suspension is irrelevant;
• Drivers who have been advised by an attorney to refuse the test, or who are
suspicious of law enforcement;
• Drivers who are confused, uncooperative, or too impaired to function properly.
47
6) Benefits of BAC Test Results
BAC test results help in charging drivers properly, in obtaining convictions, and
identifying problem drinkers who should be assigned to treatment. In particular, BAC test
results are essential to charging a driver with aggravated DUI.
However, BAC test results do not appear to be critical to Oklahoma’s impaired-
driver control system. They appear to influence plea bargains and court verdicts
somewhat, but not substantially. Many prosecutors and judges dislike the aggravated DUI
statute and will not apply it. The general feeling is that a higher testing rate would not
change Oklahoma’s DUI prosecution, adjudication, or sentencing much. Unlicensed
driving -- drivers with a suspended or revoked license, or illegal aliens who have never
been licensed -- is seen as a substantially greater problem than BAC test refusals.
7) Potential Strategies to Reduce BAC Test Refusals in Oklahoma
Law enforcement, prosecutors, judges, and defense attorneys alike had two main
recommendations.
• Reduce the amount of time required to process a DUI arrest. One officer noted
that “DUI is the most labor-intensive misdemeanor, all the way from the arrest to
the court.” The new Intoxilyzer machines being introduced statewide may reduce
processing time somewhat as they will check for errors and print affidavits.
One specific obstacle to BAC tests for high-BAC drivers is the requirement for a
medical evaluation before admitting a person with a BAC over .25 to jail. Law
enforcement officers need to know where to go for this evaluation at any time of
the day or night.
• Change Oklahoma’s laws so that the penalties for refusing the test are again
greater than the penalties for taking and failing the test.
Most people interviewed pointed out that test failure penalties are now “the same”
as test refusal penalties -- 180 days’ suspension for a first offense -- while
previously the penalties for failure were less -- 90 days’ suspension. The standard
comment was “There’s now no incentive to take the test.” Everyone’s first
recommendation to reduce refusals was to change the law so that refusal penalties
are again more severe than failure penalties. If law changes are considered, they
should be examined very carefully to avoid unintended consequences. Many
people interviewed felt that the current one-year hard suspension or revocation
(no work permits allowed) for second-felony offenders was unreasonably harsh:
it prevents offenders from driving to work and consequently encourages driving
with a suspended license.

48
V. Conclusions
It is believed that many first-time offenders refuse the test because they do not
understand the consequences – State officials may want to review their process for
notifying suspects of both the administrative and criminal consequences of refusing to
provide a breath sample to ensure that suspects fully understand the implications of not
providing a breath sample.
There are three States, Maryland, Connecticut, and Louisiana, for which specific
recommended strategies are likely to reduce the breath test refusal problem within
existing legislation. There are no specific recommendations for Oklahoma and Florida
likely to reduce refusal rates without new legislation.
A. Connecticut and Maryland
The administrative benefit of submitting to a breath test in each State is getting a
work permit during the entire license suspension period instead of waiting 90 days in
Connecticut or 120 days in Maryland, after which the offender must install and use an
ignition interlock device for a year. Both States offer alcohol education programs and
probationary periods after which the criminal cases are dismissed for first-time offenders.
First-time offenders get much easier treatment from the administrative system if they
submit to a breath test. With a hardship permit, they can continue driving throughout their
suspensions. In addition, they receive the same, minimal criminal penalties as those who
refuse.
First-time offenders constitute 75 percent of all those who refuse the breath test in
Connecticut and reportedly constitute a large proportion of those who refuse the breath
test in Maryland. Decreasing refusals for this population would have a major impact on
breath test refusal rates in the State. Some small number of individuals with BACs well
under .08 would be identified if submission rates increase because they likely constitute a
small proportion of those refusing the breath test. Thus, the number of individuals
released from custody after a breath test may increase slightly when refusals decrease.
Explaining the benefits of submitting to the breath test to those impaired by drugs
other than alcohol is not likely to decrease their refusal rates. Officers generally ask for a
urine test if an offender appears impaired but the person does not produce breath test
results close to or over .08. In such cases, officers immediately suspect non-alcohol drug
impairment.
When first-time offenders submit to the breath test, they receive fewer penalties
than those who refuse. Reducing the refusal rates raises the consideration of whether it is
better that they receive less severe penalties for submitting than for refusing the test.
There certainly are several benefits of knowing the BAC results for those arrested for
drinking and driving. The benefits include: 1) more efficient and effective prosecution of

49
cases, 2) a better understanding of the drinking and driving problem both locally and
statewide to inform legislation and public policy, and 3) possible identification of
problem drinkers so they can be helped.
B. Louisiana
The solution most likely to reduce breath test refusals for Louisiana, and any other
States with similar laws permitting forced blood tests, is obtaining a warrant from a
judge, when needed, to draw blood for a BAC test. Warrants could be obtained for as
many types of DWI arrests as judges would be willing to issue a warrant. Such types of
cases could include cases where the driver had a minor in the vehicle, cases where the
driver is suspected of having a BAC above .15, or cases where a driver under arrest was
in a crash in which there was a possible injury. Warrants are already used in at least one
jurisdiction in Louisiana. The extent of their use within that jurisdiction is not known, but
they have the potential for more widespread use in cases where they were issued.
Louisiana has a very high refusal rate and many cases without breath test results do not
result in first and subsequent DWI convictions.
The criminal cases of all offenders, whether first-time offenders or repeat
offenders, currently benefit greatly from refusing to submit to a breath test. Therefore, the
solution most likely to effectively reduce refusal rates for at least some portion of those
refusing the test is to obtain a warrant to force a BAC test if the person refuses.
C. Oklahoma and Florida
There do not appear to be any specific, viable strategies to reduce breath test
refusal rates in Oklahoma and Florida without new legislation. Both States have less-
severe combined administrative and criminal penalties for refusal than for those who
submit to a breath test and fail. The parity of the administrative sanctions for those who
submit and those who refuse, combined with the increased likelihood that refusals lead to
plea bargains, makes refusal the more beneficial option for any offender in Oklahoma and
Florida.
The current refusal rate would most likely change with a legislative change with
new legislation that increases the severity of administrative and criminal penalties for
refusing as compared to the penalties for taking and failing a BAC test. Such changes
would tip the balance of benefits to the side of those taking the BAC test rather than those
who refuse the test. For now, offenders in Florida and Oklahoma currently benefit far
more by refusing a BAC test.
50
VI. REFERENCES
Hedlund, J.H., Ulmer, R.G. and Preusser, D.F. (2001). Determine Why There Are Fewer
Young Alcohol Impaired Drivers. Final Report, contract no. DTNH22-97-D-05018.
National Highway Traffic Safety Administration, Report Number DOT-HS-809
348. Washington, DC.
Implied Consent Laws. American Prosecutor Research Institute, National Traffic Law
Center. (2002). Retrieved July 2002 from
http://www.ndaa.org/apri/programs/traffic/ntlc_home.html
Jones, RK; Joksch, HC; and Wiliszowski, CH. (1991). Implied consent refusal impact.
Final Report, contract no. DTNH22-89-C-07008. National Highway Traffic
Safety Administration, Report Number DOT-HS-807-765. Washington, DC.
McCartt, A.T., and Shabanova, V. (2003). Evaluation of Minnesota’s High-BAC Law.
Final Report, Contract No. DTNH22-98-D-45079. National Highway Traffic
Safety Administration, Report Number DOT HS 809 677. Washington, DC.
National Highway Traffic Safety Administration. (2002). Digest of State Alcohol-
Highway Safety Related Legislation (20th Edition). Washington, DC.
Ulmer, R.G., Hedlund, J.H. and Preusser, D.F. (under review). Determine Why Alcohol-
Related Fatalities Decreased in Five States. Final Report, contract no. DTNH22-
97-D-05018. National Highway Traffic Safety Administration. Washington, DC.
51
APPENDIX A
Criminal Provisions and Penalties for BAC Test
Refusal

25
sn
oisi
v
o
r
P
la
s
u
f
e
R
t
se
T
rof
n
oit
a
cov
e
R-R/
n
oi
sne
p
s
uS
-S
e
sn
e
c
iL
e
t
at
S
e
b
t
seT
naC
?
de
cro
F
la
s
uf
e
R
t
s
eT
sI
?
e
mir
C
a
t
s
e
T
s
I
l
a
s
u
f
e
R
sa e
l
b
i
ss
im
d
A
?ec
ned
iv
E
e
v
ita
r
tsini
m
d
A
ts
e
T rof n
oit
cA
l
a
sufeR
es
n
ec
iL
sI
/
dekov
e
R
de
d
n
e
psu
S
?lasuf
eR
rof
t
ruoC
r
o
mdA
;
n
o
i
sn
e
p
su
S
tfoS r
o
d
r
a
H
la
s
ufeR
d
n2
l
asufeR ts
1
)
lasufeR ts
1
(
+d
r
3
la
s
ufeR
a
m
a
b
alA
re
drO
tr
u
oC
:
s
e
Y
yr
u
jn
I
/h
t
a
eD
+
hsarc
o
N
l
a
nim
i
r
C
&
liv
i
C
d
ra
H/md
A
d
edn
e
psuS
s
eY s
esaC
syad 09
-
S
)
dnam
(
r
y
1
-
S
)
d
n
am
(
ry
1-S
)
dn
a
m
(
A
/a
k
s
a
l
r
of
r
ac tie
fr
o
f
y
aM
slas
u
fer tneuqe
s
bus
/ht
a
eD
+
IWD
:
seY
hs
a
rC
yr
u
j
nI
A
s
s
al
C
ro
n
a
emedsiM
l
a
ni
mir
C &
l
iv
i
C
s
e
s
aC
sy
ad 09
:
s
e
Y
dr
a
H
/
t
r
uoC
d
ek
o
veR )
ts
1(
sy
a
d
0
9-
R
)dnam(
ry
1
-R
)dn
a
m(
s
ry
3-R
5 - )dnam(
sry
a
nozirA
h
cra
eS
:
s
e
Y
tn
arra
W
o
N
l
a
nim
i
r
C
&
l
iviC
d
raH
/m
dA
d
ednepsuS
s
eY s
esaC
shtn
o
m
21
-
S
)
d
n
a
m(
sr
y
2
-S
)
d
na
m
(
s
r
y 2-S
)dn
a
m(
s
a
sn
a
k
r
A
/
h
t
a
eD
+
I
WD
:
s
e
Y
h
s
arC
yr
uj
n
I
dra
H/
mdA d
e
dne
ps
u
S
s
e
Y
s
es
aC
lani
mirC
o
N
syad 09-
S
)dn
a
m(
sr
y
2-S
)
d
na
m
(
sry
3
-R
ot )dnam(
emitefil
ai
nr
ofi
l
aC
t
p
m
o
r
p
+I
WD
:
s
e
Y
g
nit
s
et
fo
de
t
civ
noc
fI
e
h
t
n
e
h
t
I
W
D
a
si l
asu
fer
es
neff
o
l
an
im
i
r
c
l
a
n
i
m
i
r
C &
l
ivi
C
s
e
s
a
C
)ts1( ry 1 :se
Y
/dednepsuS
d
eko
veR
draH/mdA
ry 1-S
)
d
n
a
m(
ry 2-S
)
d
n
am
(
ry 3-S
)
d
n
am
(
o
d
ar
o
l
oC
/
h
t
a
eD
+
I
WD
:s
eY
h
s
arC
yr
u
j
nI
eY
s
e
s
aC
l
a
n
im
i
r
C
oN d
r
aH/m
dA
d
e
k
o
v
e
R s
r
y 1-
R
)
d
n
am
(
sry
2
-R
)dnam(
s
ry 3-
R
)d
n
am(
t
u
c
it
c
en
n
oC
/
ht
a
eD
+
I
WD :s
eY
h
s
arC
yr
u
j
nI
d
r
aH/
m
dA
ded
n
eps
u
S
seY
s
es
a
C l
a
n
i
m
irC oN
syad
09
6
-
)d
nam
(
sht
n
om
l
aic
eps
(
ti
m
r
ep
)elb
al
iava
ry 1-S
)dnam(
ry 3-S
)dnam(
/
er
aw
a
l
eD
k
c
olret
nI
n
o
it
i
n
gI
I
WD
t
s
1
r
o
f
n
o
i
s
re
viD
+
I
WD
:
s
eY
yr
u
j
nI
/
h
t
a
eD
o
N
l
a
ni
m
i
r
C
&
liv
i
C
draH
/md
A de
k
oveR
s
e
Y s
e
sa
C
sh
tn
om
6-
R
ry
1
-
)dn
a
m(
shtno
m
81-R
)
dnam
(
shtno
m
42-R
)d
n
am(
C
D
/ht
a
eD
+
IWD
:
seY
h
s
arC
yr
u
j
nI
o
N
l
a
ni
m
i
r
C
&
liviC
dr
a
H/m
d
A
de
dn
e
p
s
uS seY s
esa
C
s
htn
om 2
1-
S
)
d
n
am
(
s
htno
m
2
1
-
S
)dn
a
m(
sh
tn
om 2
1
-S
)
d
n
am
(
a
d
ir
o
l
F
/
ht
aeD
+I
WD
:
seY
h
s
arC
yr
ujnI
dra
H/
m
d
A d
e
dne
ps
u
S
seY
s
es
aC
lani
m
i
rC
oN
sy
a
d 0
9
-
S
)
d
na
m
(
shtnom 8
1
-
S
)dn
a
m(
sh
tn
om 8
1
-S
)
d
n
am
(
oN
a
i
gr
oeG
d
r
aH/mdA ded
n
epsuS seY
s
esaC
l
a
n
i
m
ir
C
oN
ry 1-
S
)
dnam
(
r
y
1
-S
)dnam(
r
y 1-S
)
d
na
m
(
/
ii
aw
aH
n
o
it
art
s
i
g
er
el
c
i
h
eV
l
a
sufeR rof
de
ko
v
er
/
ht
a
eD
+
I
WD :s
eY
h
s
arC
yr
ujnI o
N
g
n
i
r
a
e
h
m
dA
dr
aH/mdA
de
koveR
se
Y
n
oi
t
a
c
o
v
e
r
t
b
a
syad
03-R
r
y
1
-
)
dn
a
m(
sry
2
-R
)dnam(
sry
4 -R
ef
il ot )dnam(

35
sn
oisi
v
o
r
P
la
s
u
f
e
R
t
se
T
rof
n
oit
a
cov
e
R-R/
n
oi
sne
p
s
uS
-S
e
sn
e
c
iL
e
t
at
S
e
b
t
seT
naC
?
de
cro
F
la
s
uf
e
R
t
s
eT
sI
?
e
mir
C
a
t
s
e
T
s
I
l
a
s
u
f
e
R
sa e
l
b
i
ss
im
d
A
?ec
ned
iv
E
e
v
ita
r
tsini
m
d
A
ts
e
T rof n
oit
cA
l
a
sufeR
es
n
ec
iL
sI
/
dekov
e
R
de
d
n
e
psu
S
?lasuf
eR
rof
t
ruoC
r
o
mdA
;
n
o
i
sn
e
p
su
S
tfoS r
o
d
r
a
H
la
s
ufeR
d
n2
l
asufeR ts
1
)
lasufeR ts
1
(
+d
r
3
la
s
ufeR
o
hadI
/
ht
a
eD
+
I
WD :s
eY
h
s
arC
yr
u
j
nI
draH
/
mdA dedne
ps
u
S
seY
s
es
aC
l
a
ni
m
i
rC
oN
syad
081-S
)dnam(
ry
1-S
)
dn
a
m
(
s
io
nil
lI
/
ht
a
eD
+
I
WD :s
e
Y
h
s
arC
y
ruj
n
I
o
N
l
a
ni
m
i
rC &
l
ivi
C
tfoS/mdA dednepsuS seY
s
esa
C
s
h
tno
m
6
-
S
l
a
i
cid
uj(
ti
m
re
p
)elba
lia
va
s
ry 2-S
3
-
)
d
nam
(
sr
y
s
r
y 2-S
3 - )dnam(
sry
anaidnI
/
ht
a
eD
+
I
W
D
:s
eY
h
s
arC
yr
u
j
nI
C
ss
alC
fi no
itca
rfni
su
oir
es/yl
d
a
e
d
hsa
rc
y
r
ujni
tfoS/mdA d
e
dnep
s
uS seY s
esaC
l
a
n
i
mi
r
C
ya
m
( ry 1
-
S
fi
d
n
epsu
s
)vnoc IWD
yam( ry 1
-
S
fi dnepsus
)vnoc IWD
yam
(
r
y
1
-S
fi dnepsus
)vnoc IWD
aw
o
I
h
cra
eS
:
s
e
Y
,
t
narraw
yr
u
j
nI
/
h
t
a
eD+I
WD
oN
l
a
nim
i
r
C
&
liviC
dra
H/md
A
de
ko
veR
seY s
e
sa
C
syad
09-R
1
-
)dna
m(
r
y
ry
1-R
2
-
)dna
m
(
sr
y
ry 1-
R
2
- )dnam
(
sry
s
a
s
n
aK
/
h
t
a
eD
+
I
WD
:
s
e
Y
h
sa
rC
yr
ujnI
dra
H
/m
d
A d
e
dnep
s
u
S
seY
se
s
aC
lani
m
i
rC
oN
r
y
1-S
)
d
n
am
(
sr
y
2
-
S
)
dn
a
m
(
)
d
na
m
( sry 3
e
f
i
l -
yk
cut
neK
h
c
r
a
eS
:
s
e
Y
,
t
n
a
rr
a
w
yr
uj
n
I
/
h
t
a
e
D
+I
WD
d
e
dneps
u
S
seY
s
es
a
C
l
a
n
im
i
rC oN
o
t
desufer
dna
esn
ef
f
o
IWD
a
f
o detci
vno
c
t
on
si
nosr
e
p a
f
I
e
h
t
o
t
tce
j
bus si
ehs
/
eh
,
wal
e
h
t
rednu
tse
t
lacim
eh
c
a
o
t t
imbus
ro
f
de
tcivno
c
n
e
e
b
dah
f
i
sa
s
no
itca
g
nisne
c
il ev
it
ar
t
s
in
i
md
a
e
mas
.
es
n
effo
e
ht
an
ai
si
u
o
L
/
ht
a
eD
+
I
WD
:
s
e
Y
h
s
arC
y
ruj
n
I
dnepsuS
s
e
Y
s
e
s
a
C
l
a
n
i
mi
r
C
o
N
ro
d
raH/mdA
tfoS
syad
09
o
n
fi
d
nam(
- )kcolretni
sy
a
d
0
81
kc
o
l
r
e
t
ni htiw
syad
5
45
on
fi
dn
a
m(
-
)k
c
olretni
e
vi
rd
nac
k
c
olr
e
t
n
i
h
t
iw
sy
a
d
545
on
fi d
n
am
(
-
)
k
colr
e
tni
evi
r
d
n
ac
k
c
ol
r
e
tni
htiw
e
l
ci
h
e
v
/e
n
iaM
e
b
y
a
m
n
oi
t
art
s
i
g
er
l
a
s
u
f
er r
of
d
e
d
n
e
p
s
u
s
/
h
taeD
+
I
WD
:
s
e
Y
h
s
arC
yr
u
j
nI
tfoS/m
dA
ded
n
eps
u
S
s
eY
s
esaC
la
n
im
i
rC oN
syad
572-S
e
va
h
ya
m
(
p
i
h
s
drah
)es
ne
cil
sh
tn
om 81-
S
)
dnam
(
sr
y 4
-S
)
dn
a
m
(
d
n
al
yr
a
M
yr
u
j
nI/
ht
a
eD
:
s
e
Y
h
sarC
d
e
dn
e
psu
S
s
eY
s
esaC
l
a
ni
mir
C
oN
ro
dra
H/mdA
tf
o
S
syad 021-S
detcirtser(
htiw esnecil
)
kcolretni
ry 1-S
ci
l
detcirtser
(
hti
w
)kcolretni
ry 1-S
cil det
ci
rt
s
er(
h
tiw
)
k
col
r
etni
o
N
stte
s
u
h
ca
s
s
a
M
mdA
/
dra
H
dednepsuS seY
oN
oN
syad
021-S
)dnam
(
s
yad 081
-S
1
,
dn
am
(
)IW
D
ro
i
rP
sr
y
1-S
+
2
,
d
n
am
(
)
I
W
D roi
r
P

45
sn
oisi
v
o
r
P
la
s
u
f
e
R
t
se
T
rof
n
oit
a
cov
e
R-R/
n
oi
sne
p
s
uS
-S
e
sn
e
c
iL
e
t
at
S
e
b
t
seT
naC
?
de
cro
F
la
s
uf
e
R
t
s
eT
sI
?
e
mir
C
a
t
s
e
T
s
I
l
a
s
u
f
e
R
sa e
l
b
i
ss
im
d
A
?ec
ned
iv
E
e
v
ita
r
tsini
m
d
A
ts
e
T rof n
oit
cA
l
a
sufeR
es
n
ec
iL
sI
/
dekov
e
R
de
d
n
e
psu
S
?lasuf
eR
rof
t
ruoC
r
o
mdA
;
n
o
i
sn
e
p
su
S
tfoS r
o
d
r
a
H
la
s
ufeR
d
n2
l
asufeR ts
1
)
lasufeR ts
1
(
+d
r
3
la
s
ufeR
r
e
d
rO
t
r
u
oC
:
s
eY
n
a
g
ihciM
o
N
,s
e
s
a
c
l
a
nimi
r
C
t
on t
u
b
fo
ec
n
ed
iv
e
tl
iu
g
t
foS/md
A ded
nepsu
S
se
Y
shtnom
6
cil
pi
h
sdrah(
)e
l
baliava
r
y
1
-S
)dnam(
r
y 1-S
)
d
na
m
(
atosenn
i
M
yr
u
j
n
I/
ht
a
eD :seY
h
sa
r
C
mdA
/d
raH dekoveR seY ses
aC
l
a
nimir
C
r
o
n
a
em
e
dsiM
syad 51-R
- )dnam(
ry 1
syad 081-R
r
y
1 -
)
dnam(
syad 081-R
ry 1
-
)dnam(
o
N
ip
pis
s
is
si
M
draH
/
mdA dedne
ps
u
S
seY
s
es
aC
l
a
n
i
m
i
rC
o
N
syad 09-S
)dn
a
m(
sy
a
d 09-S
1
,d
nam
(
)
IWD
roi
rp
syad
09-
S
1
,
d
nam(
)IWD ro
i
rp
i
r
u
os
s
iM
/
ht
ae
D
+
I
WD
:
s
e
Y
h
s
arC
y
ruj
n
I
o
N
,
s
es
a
c
l
animi
r
C
y
ra
tn
u
lovn
i
r
eth
gu
alsn
am
tluassa
r
o
mdA/draH dekove
R
seY
syad 09-R
ry 1 - )dnam(
ry 1-R
)dnam(
ry 1-R
)dnam(
oN
a
n
a
t
n
oM
s
eY
s
e
s
aC
l
a
nimirC
o
N
/dedne
p
suS
mdA
/
draH
d
ekoveR
shtnom 6-S
)dnam
(
ry
1-
R
)dnam(
ry
1-R
)
dnam
(
a
ks
a
r
b
eN
:
eB
y
a
M
yr
ujnI
/
h
t
aeD
+
I
WD
h
sarC
W
s
s
al
C
s
esaC
la
n
i
m
i
r
C
r
on
a
em
e
ds
iM
shtnom 6
:s
eY
dekov
e
R
)t
s
1
(
;t
r
u
o
C/d
r
aH
ry
1
:m
dA
+
ts1 rof
)dnam
(
slas
u
feR
sh
tn
om
6-
R
o
n
fi
(
)noit
a
borp
no( syad
06
)noit
a
borp
ry
1
-R
)
d
nam( 4-R )
d
n
a
m(
a
d
aveN
r
o
I
WD
:
s
e
Y
yr
uj
n
I
/
h
t
a
eD
+
I
WD
h
sarC
oN
s
es
aC
l
a
n
i
m
i
r
C
oN
0
9
-
R
:
o
N
del
a
e
p
er
sy
ad
599
1
ni
er
i
hs
pm
aH
w
eN
yr
u
j
nI/
ht
a
eD
:
s
e
Y
h
sa
r
C
oN
l
a
nim
i
r
C
&
l
ivi
C
d
raH
/m
dA dednepsuS seY
s
esaC
syad
081-S
)dnam(
s
r
y
2-S
)
d
n
am
(
y
e
sr
e
J
w
eN
;w
a
L
e
s
aC
:
s
e
Y
h
s
arC
l
at
a
F
:w
a
L es
aC(
s
eY
d
r
aH
/m
d
A
d
eko
ve
R
seY ses
aC
l
a
n
im
i
rC )l
a
n
imi
rc
isa
u
q
s
ht
n
om
6-
R
)
d
n
a
m(
s
ry
2
-
R
)
d
n
am
(
sry
0
1
)dn
a
m(
o
c
i
xe
M
w
eN
h
c
r
a
eS
:
s
e
Y
,
t
n
a
rr
a
w
yr
uj
n
I
/
h
t
a
e
D
+I
WD
eY
s
e
s
aC
l
a
n
i
m
i
r
C
oN draH/mdA
de
k
o
v
e
R s
r
y 1-R
)
dnam
(
ry
1
-R
)dn
a
m(
ry 1-
R
)d
n
am(
kr
o
Y
w
eN
,r
e
drO
tr
u
oC
:
s
e
Y
y
r
u
j
nI
/
h
t
a
eD+I
WD
o
N
l
a
ni
m
i
r
C
&
liviC
dra
H/md
A de
ko
veR
s
e
Y s
e
sa
C
sh
tn
om
6-
R
)
d
n
am
(
ry 1
-R
)
dnam
(
r
y
1-R
)
dnam
(

55
sn
oisi
v
o
r
P
la
s
u
f
e
R
t
se
T
rof
n
oit
a
cov
e
R-R/
n
oi
sne
p
s
uS
-S
e
sn
e
c
iL
e
t
at
S
e
b
t
seT
naC
?
de
cro
F
la
s
uf
e
R
t
s
eT
sI
?
e
mir
C
a
t
s
e
T
s
I
l
a
s
u
f
e
R
sa e
l
b
i
ss
im
d
A
?ec
ned
iv
E
e
v
ita
r
tsini
m
d
A
ts
e
T rof n
oit
cA
l
a
sufeR
es
n
ec
iL
sI
/
dekov
e
R
de
d
n
e
psu
S
?lasuf
eR
rof
t
ruoC
r
o
mdA
;
n
o
i
sn
e
p
su
S
tfoS r
o
d
r
a
H
la
s
ufeR
d
n2
l
asufeR ts
1
)
lasufeR ts
1
(
+d
r
3
la
s
ufeR
/
ani
l
oraC
htr
oN
d
etcirts
eR
-C
A
B
el
b
ali
a
vA
e
s
n
ec
i
L
el
ba
cil
p
pA :
eb
y
a
M
w
a
L
f
o
s
e
rude
c
orP
eY
s
e
s
aC
l
a
n
i
m
i
r
C
oN draH/mdA
de
k
o
v
eR s
0
3
ot
01
-
R
+
syad
ecn
ats
buS
21 -
g
niniar
T
sht
n
om
sy
a
d
0
3-
R
2
1 -
)d
na
m(
sh
tn
o
m
s
yad
0
3
-R
21
-
)
dn
am(
s
htn
o
m
a
t
okaD htroN
:
seY
yr
uj
nI/
h
t
a
eD
+I
W
D
h
s
arC
o
N
l
a
n
i
m
i
r
C &
liv
i
C
draH/mdA dekoveR se
Y
s
es
a
C
r
y 1-R
on
,d
n
am(
)IWD roirp
sry
2-R
)dn
a
m(
s
ry
3-
R
)dnam(
o
i
hO
n
o
d
e
s
a
b(
e
b
y
a
M
)wa
L
e
s
aC
r
o
n
i
M
ro
n
aem
e
dsi
M
d
raH
/
m
dA
ded
n
e
p
s
uS s
eY s
esaC
la
n
im
i
r
C
s
ya
d 0
3
-
S
ry 1 - )
d
nam
(
s
ya
d 09-S
2
-
)
d
nam
(
sr
y
r
y
1
-S
5
-
)
dn
am(
sr
y
a
m
o
h
alkO
/ht
a
eD
+
IWD
:
seY
h
s
a
rC
yr
u
j
nI
t
fo
S/
m
d
A de
koveR
se
Y s
e
s
a
C lanimirC oN
syad
081
-S
p
ihsdrah(
es
n
eci
l
)
e
l
balia
v
a
ry 1
-
R
)dnam(
s
ry
3-R
)d
n
am(
n
o
gerO
/
h
t
a
eD
+
I
WD
:
s
e
Y
h
sa
rC
yr
ujnI
oN
l
a
n
i
m
i
r
C &
l
ivi
C
s
e
s
a
C
d
raH
/m
dA ded
n
epsu
S se
Y
syad 09-S
ry 1 -
)
dna
m
(
ry 1-S
3
-
)
dna
m
(
sr
y
oN
ai
n
a
vly
s
nn
e
P
d
r
aH/
m
d
A d
e
dn
eps
u
S
s
eY
s
es
a
C
la
n
i
m
irC oN
shtn
o
m
21-
S
)
d
n
am
(
s
htn
om 21
-
S
)dn
a
m(
s
htn
om
21-
S
)
d
n
am
(
/
d
n
a
l
sI
e
d
o
hR
n
o
it
a
r
t
si
g
er
e
l
ci
h
e
V
rof
d
ed
n
e
p
s
u
s
e
b
y
a
m
l
a
s
ufeR
o
N
d
ra
H
/
m
dA
d
ed
ne
psuS
s
eY
o
N
s
eY
sh
t
nom
3-
S
6
-
)dn
am
(
shtnom
ry 1-S
2
- )dna
m
(
sry
sry
2
-S
3 - )dnam(
sry
a
ni
l
o
r
a
C
ht
u
oS
/
h
t
a
eD
+
I
WD
:
s
e
Y
h
s
a
rC
yr
u
j
n
I
t
f
oS/
mdA
d
ed
n
eps
u
S
s
eY
s
esaC
lanim
i
rC oN
s
y
ad 09-
S
r
d
pmet
(
)egelivirp
syad 081-
S
r
d
pm
e
t(
)e
g
el
i
v
i
r
p
syad 081
-S
rd
p
met
(
)
e
geli
v
i
r
p
at
o
k
a
D
ht
u
oS
r
o
I
WD
dr
3
:
s
e
Y
yr
u
j
nI/
h
t
a
eD
w
a
L
e
s
aC
:
s
e
Y
t
fo
S/
m
d
A de
k
o
veR
se
Y
s
e
s
a
C
l
a
nimi
r
C
o
N
t
e
g
na
c
(
ry
-
1
)p
i
hsdrah
teg n
ac
(
ry-
1
)pihsdrah
teg nac( ry-1
)p
i
hsd
rah
e
e
s
s
e
n
n
eT
l
at
a
F
ni
e
b
y
a
M
hs
arC
s
es
aC
l
a
n
i
m
i
r
C
oN
gnid
n
ep
e
d
,s
eY
IWD roirp
n
o
t
fo
S
/md
A
d
ekoveR
ry
1-
R
o
n ,dnam
(
)
IWD
ro
i
rp
sry
2-R
r
oi
rp
,
d
nam
(
)
I
W
D
s
ry 2
-R
r
o
ir
p ,d
na
m(
)
IWD
/
s
a
xeT
o
N
=
l
att
i
u
q
c
a
IWD
p
su
S
l
a
suf
e
R
/
h
t
a
eD
+
I
W
D
:s
e
Y
h
sa
rC
yr
ujnI tfoS/m
dA
d
n
e
psuS
s
e
Y ses
a
C
l
a
nimir
C
o
N
s
yad
081-
S
p
ihsd
rah
(
es
n
eci
l
syad
09
-S
2
-
)
d
n
a
m(
sr
y

65
sn
oisi
v
o
r
P
la
s
u
f
e
R
t
se
T
rof
n
oit
a
cov
e
R-R/
n
oi
sne
p
s
uS
-S
e
sn
e
c
iL
e
t
at
S
e
b
t
seT
naC
?
de
cro
F
la
s
uf
e
R
t
s
eT
sI
?
e
mir
C
a
t
s
e
T
s
I
l
a
s
u
f
e
R
sa e
l
b
i
ss
im
d
A
?ec
ned
iv
E
e
v
ita
r
tsini
m
d
A
ts
e
T rof n
oit
cA
l
a
sufeR
es
n
ec
iL
sI
/
dekov
e
R
de
d
n
e
psu
S
?lasuf
eR
rof
t
ruoC
r
o
mdA
;
n
o
i
sn
e
p
su
S
tfoS r
o
d
r
a
H
la
s
ufeR
d
n2
l
asufeR ts
1
)
lasufeR ts
1
(
+d
r
3
la
s
ufeR
)
e
lbalia
va
oN
h
at
U
o
N
l
a
n
i
m
i
r
C
&
l
ivi
C
s
e
s
a
C
draH/
md
A d
ek
o
ve
R
se
Y
sh
tno
m
81
-R
)dnam(
shtnom 42-R
r
o
ir
p
,
dn
am
(
)IWD
tnomr
e
V
hcra
eS
:s
e
Y
,
tn
ar
r
a
w
yr
u
j
n
I
/
h
t
a
eD+I
WD
r
oir
P s
a
h
fi
:
s
e
Y
ro
I
W
D
y
ru
j
n
i/
h
t
aed
e
m
as
s
n
oi
tcn
as
(
)
I
WD s
a
m
dA
/dr
aH
de
d
n
e
ps
u
S
s
e
Y
s
es
a
C l
a
n
i
mirC
shtnom 6-
S
)
d
n
am
(
s
htn
om 8
1-
S
)
d
n
am
(
s
r
y
3
-S
e
fiL
-
)d
n
am(
deri
u
q
e
r
e
b
y
a
M
ainig
r
iV
mdA/d
r
aH
dednepsuS seY
s
es
aC
l
a
n
i
m
irC
oN
ry 1-
S
)dnam
(
r
y
1
-S
)dnam(
ry 1-S
)dnam(
/
n
ot
g
nihsaW
n
ur
s
n
oi
t
ca
esne
c
iL
v
n
o
c
I
WD r
o
f qesnoc
l
a
s
uf
e
R
;
lasuf
e
R
dna
r
of
ema
s
s
n
oit
c
n
a
s
s
n
oit
c
n
a
s
C
AB
h
g
i
h
/ht
a
eD
+
IWD
:
seY
h
s
a
rC
yr
u
j
nI
eY
s
es
aC
l
a
n
i
m
i
r
C
oN d
ra
H
/mdA de
k
o
v
eR
s
ry
1-
R
)dnam(
sry
2
-
R
)dnam(
s
ry 2
-R
)dnam(
riV t
s
eW
g
/
a
i
n
i
,
y
r
a
d
no
c
e
s
r
of
l
a
s
u
feR
g
nit
s
et
y
r
a
it
n
e
di
v
e
y
r
ani
m
il
er
p
t
o
n
,
yl
n
o
o
N
g
ni
t
s
et
deko
ve
R
s
eY
se
s
aC
l
a
nimi
rC oN
ro
dr
aH/mdA
tf
o
S
s
ya
d
03
-
R
hti
w
(
1
-
)
kc
ol
retni
on
(
ry
)kcolre
tni
shtnom 81-R
htiw(
5 - )kcolretni
d
n
am( s
ry
on
h
ti
w
-
)kcolretni
sry 01
shtnom 81-R
htiw
(
- )kcolretni
dnam(
sry 01
on
h
tiw
- )
k
col
re
t
ni
efi
L
/
n
i
s
n
o
c
s
i
W
s
i
el
c
i
h
e
v
-
l
a
s
uf
e
R
d
n
2
)
d
n
a
m
t
o
n(
d
e
z
il
i
b
o
m
mi
1(
d
er
i
u
q
e
r
kc
olr
e
t
ni
r
o
dr3 ;)co
v
e
r
r
e
tfa
r
y
t
o
n(
er
ut
i
e
fr
of
-
l
a
s
uf
e
R
s
na
e
m
l
u
f
w
a
l
:
s
eY
)
d
n
a
m
eY
s
e
s
aC
l
a
n
im
i
r
C
oN d
r
aH/m
dA
d
e
k
o
v
e
R s
syad 03-R
r
y
1
-
)
dnam(
ry
1
-R
2
-
)
dnam
(
sr
y
ry 1-
R
3
-
)dn
a
m(
sr
y
gnimo
y
W
/
ht
a
eD
+
I
WD
:
s
e
Y
h
s
arC
y
ruj
n
I
o
N
l
a
ni
m
i
rC &
liv
i
C
s
e
s
a
C
d
ra
H/m
d
A
ded
n
epsu
S se
Y
sh
tno
m 6-
S
)
dnam
(
sh
tno
m
8
1-S
)dn
a
m(
sh
tno
m
8
1
-S
)d
n
am(

75
la
s
u
f
e
R
tseT
r
of
)$
(
eni
F
l
asu
fe
R
tseT
ro
f
t
ne
m
nosir
p
m
I
ts
e
T
rof ecivre
S
yti
num
m
oC
la
s
u
fe
R
rof
seitla
ne
P ecudeR
ya
M
ta
h
t
se
cn
at
smu
cri
C
l
as
uf
e
R
t
se
T
e
t
atS
ts1
/l
as
uf
e
R
ro
i
r
P
oN
ro
i
r
P
1
.
vno
C
roirP +
2
.
vno
C
ts
1
/l
a
suf
e
R
ro
i
r
P
oN
ro
i
r
P
1
.
vno
C
.vnoC
r
o
i
r
P
+
2
t
s
1
/
l
as
u
fe
R
roirP
o
N
roirP
1
.vnoC
roirP
+2
.vnoC
I
WD dnettA
/ssalC
tn
e
mtaerT
noitingI
kc
o
l
r
etnI
dellatsni
yt
l
iuG
s
daelP
ts1
ta
t
nem
ngi
a
rr
A
a
m
abalA
o
N
oN
o
N
oN
o
N o
N
oN
oN o
N o
N
o
N oN
A
/aksal
27
q
es
n
oc
1
-sruoh
ry
0
2
qe
s
n
oc
-
syad
ry
1
0
63-06
sy
a
d
q
e
s
n
oc
ot
0
5
2$
+ 0
0
0
,
5$
f
o
t
s
o
c
n
o
s
i
rpmi
ot
0
0
5$
+
0
0
0
,
5
$
f
o
t
s
o
c
n
o
s
i
rpmi
ot 0
0
0,
1
$
fo
t
s
oc +00
0
,2$
tn
em
n
osi
rp
mi
s
rh
42
061
sruoh
e
c
uder
ya
M
f
o
t
r
a
p
ecnetnes
e
c
uder
ya
M
senif fo
t
soc
anozirA
o
N
o
N
oN
o
N
o
N
oN
o
N
oN o
N
oN oN
o
N
sasnakrA
o
N
o
N
oN
12 red
n
U
00
1
$ :
o
/y
0
0
5$
ot
12 rednU
00
2
$ :
o
/y
000,
1
$
ot
:o/y
12
red
n
U
000,
2
$
-0
05$
12 rednU
06 :o/y
s
yad
12
r
ednU
0
6
:o/y
s
yad
12
r
ednU
0
6
:o/y
s
yad
o
N
:e
s
u
feR
ts1
ot
ec
u
d
e
r
ya
d
-09
noisnepsus
o
N
a
inr
o
fila
C
fi
d
etci
vn
oc
IW
D
f
o
o
N
oN
f
I
d
etci
vn
oc
IWD f
o
o
N
oN
e
lbi
ss
o
P
f
o
ueil
ni
mre
t
lia
j
o
N
oN o
N o
N
-0
9
ot
d
ec
ud
eR
no
isn
epsu
s
yad
o
d
ar
o
l
oC
o
N
o
N
oN
o
N
oN oN
o
N o
N
oN o
N
-3 ot
ecudeR
-
6 ,
s
h
t
nom
-9 ,shtn
o
m
s
htn
o
m
noisnepsus
oN
t
u
cit
c
e
n
n
o
C
o
N
o
N
oN
o
N
o
N
o
N
oN oN oN oN oN oN
er
aw
a
leD
o
N
o
N
o
N
o
N
o
N
oN
o
N oN
o
N oN oN oN
CD
o
N
o
N
o
N
o
N
o
N
o
N
o
N oN
o
N oN oN oN
a
d
ir
ol
F
o
N
oN
o
N
o
N
o
N
oN
oN o
N
o
N oN
o
N oN
a
i
gr
oeG
o
N
oN
o
N
o
N
o
N
oN
oN o
N
o
N oN
o
N oN
ii
aw
aH
o
N
oN
o
N
o
N
o
N
oN
oN o
N
o
N oN
o
N oN
o
h
a
d
I
o
N
oN
o
N
oN
o
N
oN oN o
N o
N o
N
oN oN
s
i
onillI
o
N
oN
oN
oN
oN
oN oN
o
N oN
o
N o
N
oN
a
n
ai
d
nI
oN
o
N o
N
ni
0
0
5$
l
iaj
f
o
ue
il
m
r
e
t
o
N oN
o
N oN oN
o
N
o
N
o
N
awoI
o
N
o
N
o
N
o
N
o
N
o
N
o
N oN
o
N oN oN oN
sa
s
n
aK
o
N
o
N
o
N
o
N
o
N
o
N
o
N oN
o
N oN oN oN
y
k
cut
neK
o
N
o
N
oN
o
N
o
N o
N
oN
oN oN
o
N o
N
oN

85
la
s
u
fe
R
tseT
ro
f
)
$
( eniF
l
as
ufe
R
tseT rof
t
nemnosirpmI
tseT rof
e
civreS yt
i
num
m
oC
lasufeR
r
of
seitlaneP ecudeR
yaM taht
s
ecnatsmucriC
l
a
sufeR
tseT
e
t
atS
t
s1
/l
a
suf
e
R
r
oirP
oN
roirP 1
.
v
noC
roirP +2
.
v
noC
ts
1
/
l
a
s
u
f
e
R
r
oirP
oN
ro
i
r
P
1
.
vno
C
.v
noC
r
o
i
r
P
+2
ts1
/l
a
sufeR
r
o
irP oN
roirP 1
.
vn
oC
r
oir
P +2
.
vn
oC
IWD d
n
et
t
A
/
s
s
al
C
tn
em
t
a
er
T
n
oiti
ngI
kco
l
re
t
n
I
d
el
la
ts
n
i
yt
li
uG
sdae
l
P
ts1 ta
tnemng
i
arrA
a
n
ai
si
uo
L
oN
o
N
oN
o
N o
N
o
N o
N o
N
o
N o
N
oN
yrotadnam
g
n
isneci
l
noitc
a
oN
en
i
a
M
f
i
s
rh
69
+
desufe
r
v
n
oc
I
WD
2
1
fi
sy
a
d
d
esufe
r
I
W
D
+
v
n
oc
f
i
sy
a
d
04
+
de
su
f
e
r
v
n
oc
I
W
D
f
i
0
0
5
$
+
de
s
u
f
e
r
v
n
oc
I
WD
f
i
0
08
$
+ d
e
sufe
r
v
n
oc
IWD
f
i
00
3,
1$
I
WD +
de
s
ufer
v
n
oc
oN
o
N o
N
y
r
ot
adnaM
noisnepsu
s
eb nac
r
o
f de
c
u
d
e
r
e
sufeR
ts1
oN oN
dnal
yr
a
M
oN
o
N
oN
o
N
oN o
N o
N o
N
o
N o
N
n
o
isne
ps
uS
&
no
i
tcu
d
er
de
tcir
t
ser
esn
e
c
i
l
oN
s
t
t
es
u
hc
a
ss
a
M
o
N
oN
o
N
oN
o
N
oN
oN o
N o
N o
N o
N o
N
n
agihciM
o
N
o
N
oN oN
o
N o
N
oN
oN o
N o
N o
N o
N
ato
s
e
n
ni
M
o
N oN
o
N oN oN
o
N
o
N
oN 0
0
7
o
N
o
N
sy
a
d
0
9
ip
p
i
ss
i
s
si
M
o
N
o
N
oN oN
o
N o
N
oN
oN o
N o
N o
N o
N
i
r
uo
s
si
M
o
N
o
N
o
N
o
N
o
N o
N
o
N
oN o
N
oN o
N o
N
a
n
atnoM
o
N
o
N
o
N
o
N
o
N o
N
o
N
oN o
N
oN o
N o
N
a
k
s
ar
b
eN
sy
a
d
7
-
)
dn
a
m(
s
y
a
d
06
0
3
sy
a
d
)d
n
am
(
09
-
sy
a
d
sy
a
d 0
1
ry
1
- )
d
na
m(
-
0
0
4
$
0
0
5
$
o
N
oN
000
,
01$-00
6
$
0
05
$
s
rh 084
fo uei
l
ni
dna li
a
j
e
n
if
oN
o
N oN
a
d
a
v
eN
o
N
oN
o
N
o
N
o
N
o
N
o
N
o
N o
N
oN o
N o
N
weN
e
r
i
h
s
pm
aH
o
N
oN oN
o
N
o
N
oN
oN o
N
oN oN oN oN
y
e
sr
e
J
w
eN
oN
o
N
o
N
-052
$
0
0
5
$
o
N
o
N
oN o
N o
N o
N
o
N
o
N
o
c
i
x
e
M
w
e
N
o
N
oN
o
N
oN
o
N
oN
oN o
N o
N o
N o
N o
N
kr
o
Y
w
eN
oN oN oN oN oN
o
N 057
$
0
57$
0
0
3$ o
N
o
N
o
N
a
n
ilor
a
C
h
tr
oN
o
N
oN
o
N
oN
o
N
oN
oN o
N o
N o
N o
N o
N
a
t
o
k
a
D
h
t
r
oN
o
N
o
N
oN
o
N
o
N
oN oN o
N
oN
oN oN oN

95
la
s
u
fe
R
tseT
ro
f
)
$
( eniF
l
as
ufe
R
tseT rof
t
nemnosirpmI
tseT rof
e
civreS yt
i
num
m
oC
lasufeR
r
of
seitlaneP ecudeR
yaM taht
s
ecnatsmucriC
l
a
sufeR
tseT
e
t
atS
t
s1
/l
a
suf
e
R
r
oirP
oN
roirP 1
.
v
noC
roirP +2
.
v
noC
ts
1
/
l
a
s
u
f
e
R
r
oirP
oN
ro
i
r
P
1
.
vno
C
.v
noC
r
o
i
r
P
+2
ts1
/l
a
sufeR
r
o
irP oN
roirP 1
.
vn
oC
r
oir
P +2
.
vn
oC
IWD d
n
et
t
A
/
s
s
al
C
tn
em
t
a
er
T
n
oiti
ngI
kco
l
re
t
n
I
d
el
la
ts
n
i
yt
li
uG
sdae
l
P
ts1 ta
tnemng
i
arrA
o
i
hO
oN
ot pu
0
3
sy
a
d
0
6 ot
p
u
s
y
ad
oN
oN oN
5
24$ 5
24$ 5
24$
ni
t
n
e
mt
aerT
rof li
a
j f
o
u
e
i
l
l
asu
f
eR
ts1
oN
noi
s
neps
uS
la
s
u
fe
R
ot
eu
d
d
et
anim
r
et
si
amohalkO
o
N
o
N
o
N
o
N
o
N
o
N
o
N oN
o
N oN oN
oN
nogerO
o
N
o
N
o
N
o
N
o
N
o
N
o
N oN
o
N oN oN
oN
ainav
l
ys
n
n
eP
o
N
oN
o
N
o
N oN oN
oN o
N
oN oN
o
N oN
dnalsI edohR
o
N
o
N
oN
-
0
0
2
$
005
$
0
0
5
$
+
(
ems
s
ess
a
)
e
e
f
t
n
-
0
0
3$
0
0
5
$
0
0
5$
+
(
emss
essa
)
e
e
f
t
n
00
5$
-
0
0
4$
0
05
$+(
tn
emss
e
ss
a
)eef
o
N
o
N
o
N
o
N
o
N sr
h
0
6
-
0
1
aniloraC htuoS
o
N
o
N
oN
o
N
o
N
o
N
o
N oN oN oN oN
o
N
a
tokaD htuoS
oN
oN
oN
oN
oN
o
N
oN oN oN oN oN
r
o IWD ot ytliuG
e
g
r
a
hc IWD
to
n
- dessimsid
rof
d
e
ko
v
er
l
a
su
fe
r
e
e
s
s
e
n
n
eT
o
N
o
N
o
N
o
N
o
N o
N
o
N
oN o
N
oN o
N o
N
s
a
x
e
T
o
N
o
N
o
N
o
N
o
N o
N
o
N
oN o
N
oN o
N o
N
h
atU
o
N
o
N
oN
o
N
o
N o
N
o
N oN oN
oN o
N
oN
t
no
mr
e
V
sa snoi
tcnas
emas
( l
asu
f
e
R la
n
imi
r
C
yr
uj
n
i(
s
ry
51-
1
r
o
s
ry
2-0
:)I
WD r
of
e
e
f
tnemss
e
ssa
0
61$
;
)htae
d
ro
r
o
f
s
a
sn
oi
tcn
as
em
a
s
( l
as
ufe
R l
a
n
imirC
ro
y
r
uj
ni(
000
,
0
1$
-
0
00,
5
$
r
o 057$ :)
I
WD
)ht
aed
e
mas
era snoi
t
cn
as
l
as
uf
eR lanim
i
rC
v
noc
IWD
r
of
snoi
tcna
s
sa
o
N
oN oN
ai
ni
g
ri
V
oN
oN
oN
oN
oN
oN oN
o
N
oN o
N o
N
ro
I
WD ot
yt
li
u
G
,e
gra
hc IW
D
to
n
-
dessims
id
r
o
f
d
ednep
s
us
l
asufer
nih
s
aW
g
n
o
t
o
N
o
N
o
N
o
N
o
N
o
N oN oN oN oN oN oN
ai
ni
g
r
iV t
s
e
W
o
N
o
N
o
N
o
N
o
N o
N o
N
oN o
N oN
d
ed
i
v
orP
no
it
i
n
g
i
kc
ol
re
t
ni
del
l
atsni
o
N
n
i
s
n
o
c
s
i
W
o
N
o
N
o
N
oN
o
N
o
N
oN
oN o
N o
N
o
N oN
g
ni
m
o
y
W
o
N
o
N
o
N
oN
o
N
o
N
oN
oN o
N o
N
o
N oN
60
APPENDIX B
Provisions and Penalties for Failing a BAC Test
and for DWI Conviction

61
Provisions For Failing a BAC Test & Administrative Sanctions & DWI Fines
S-Suspension/R-Revoke- Administrative Per Se Fine ($) - DWI Conv
State
Is there a High
BAC provision?
1st Offense
2nd
Offense
3rd Offense
1st DWI 2nd DWI 3rd DWI
Alabama
No S-90 days S-1 yr S-3 yrs
$600 -
$2,100
$1,100 -
$5,100
$2,100 -
$10,100
Alaska
No R-30 days R-1yr R-3 yrs $250
$500 -
$5,000
$1,000 -
$50,000
Arizona
Yes: .15 (per
se)/ no tiered
sanctions
S-30 days S-90 days S-90 days
$250 -
$2,500
$500 -
$2,500
$500 -
$2,500
Arkansas
Yes: .15 adm.
tiered sanctions
120 days/
hardship
license
available
S-24
months/ 1yr
with interlock
S-30 months/ 1
yr with interlock
$150 -
$1,000
$400 -
$3,000
$900 -
$5,000
California
Yes: .20 (court
sanctions)
S-30 days S-1 yr S-1 yr
$390 -
$1,000
$390 -
$1,000
$390 -
$1,000
Colorado*
Yes: .20 (court
sanctions)
R-3 months/ 1
month with
interlock
R-1yr/ 3
months with
interlock
R-1yr/ 3
months with
interlock
$300- 1,000
$450 -
$1,500
$500 -
$1,500
Connecticut*
Yes: .16 adm.
tiered sanctions
90 days/
special permit
available
S-9 months S-2.5 yrs $500 - 1,000
$1,000 -
$4,000
$2,000 -
$8,000
Delaware/
Interlock
Diversion for 1st
DWI
Yes: .16/.20 (1st
DWI diversion)
R-3 months R-1 yr R-18 months
$230 -
$1,150
$575 -
$2,300
$1,000 -
$3,000
DC*
Yes: .20 & .25
(court sanctions)
Under the Influence of Intoxicating Liquor or Drugs:
1st - S 2 to 90 days or R 6 months; sub - S 2 to 90
days or R (varies)
$300
$1,000 -
$5,000
$2,000 -
$10,000
Florida
Yes: .20 (fine,
jail, no lesser
plea)
S-30 days
(mand) - 6
months
S-11months
to 1 yr
S-11 months to
1 yr
$250 -$500
$500 -
$1,000
$1,000 -
$2,500
Georgia
Yes: .15 (no nolo
contendere)
S-30 days
(mand) - 1 yr
S-12 months
(mand) - 3
yrs
S-2 yrs (mand)
- 5 yrs
$300 –
$1,000
$600 -
$1,000
$1,000 -
$5,000
Hawaii
No
R-30 days
(mand) - 1
yr
R-1 yr
(mand) - 2
yrs
R-2 yrs (mand)
- 4 yrs
$150 –
$1,000
$500 -
$1,500
$500 -
$2,500
Idaho
Yes: .20 (court
sanctions)
S-30 days
(mand) - 90
days
S-1 yr S-1 yr $1,000 $2,000 $5,000
Illinois
Yes: .15/.20 (risk
category for
treatment)
S-3 months
(not mand)
S-1 yr S-1 yr up to $2500
up to
$2500
up to
$25,000
Indiana
Yes: .15 (per
se)/ tiered
sanctions
S-180 days S-180 days S-180 days up to $500
up to
$10,000
up to
$10,000
Iowa
Yes: <.15
(eligible for
deferred
judgment)
R-30 days
(mand) - 180
days
R-1 yr R-1 yr
$500 -
$1,000
$1,500 -
$5,000
$2,500 -
$7,500
Kansas
No
S-30 days
(mand) - 330
days
S-1 yr + 1yr
interlock
S-1 yr + 1yr
interlock
$500 -
$1,000
$1,000 -
$1,500
$1,500 -
2,500
Kentucky
Yes: .18 (jail &
fine)
No administrative per se law sanctions, but court
shall suspend those who refused, have a prior DWI
conv or refusal, or involved in serious-injury crash.
$200 -$ 500
$350 -
$500
$500 -
$1,000

62
Provisions For Failing a BAC Test & Administrative Sanctions & DWI Fines
S-Suspension/R-Revoke- Administrative Per Se Fine ($) - DWI Conv
State
Is there a High
BAC provision?
1st Offense
2nd
Offense
3rd Offense
1st DWI 2nd DWI 3rd DWI
Louisiana
Yes: .15 (court
jail term)
S-30 days
(mand if no
interlock) - 90
days can drive
with interlock
S-365 days
(mand if no
interlock) -
365 days
can drive
with interlock
S-365 days
(mand if no
interlock) - 365
days can drive
with interlock
$300 -
$1,000
$750 -
$1,000
up to $2,000
Maine
Yes: .15 (jail
term)
S-60 days (no
mand period)
S-18 months S-4 yrs
$400 -
$2,000
$600 -
$2,000
$1,000 -
$2,000
Maryland**
No
S-45 days (no
mand period)
S-90 days
(less with 1
yr interlock)
S-90 days (less
with 1 yr
interlock)
up to $1,000
up to
$2,000
up to $2,000
Massachusetts
No S<90 days S<90 days S<90 days $500-$5,000
$600-
$10,000
$1,000-
$15,000
Michigan*
No
If refused or submitted and BAC is illegal, police
confiscate & destroy license; drive on temp permit
until end of DWI criminal proceedings
$100 - $500
$200 -
$1,000
$500 -
$5,000
Minnesota
Yes: .20 (tiered
sanctions)
R-15 days
(mand) - 90
days
R-90
days(mand)
- 180 days
R-90 days
(mand) - 180
days
$210 - $700
$900 -
$3,000
$900 -
$3,000
Mississippi
No
License is not taken at arrest; offender schedules a
trial: if BAC is illegal, license is seized and sent to
DMV; offender is issued a 30-day driving permit
until court proceedings
$250 -
$1,000
$600 -
$1,500
$2,000 -
$5,000
Missouri
Yes: .15
(substance
abuse program)
S-30 days
(mand) - 60
days
R-1 yr R-1yr up to $500
up to
$1,000
up to $5,000
Montana
Yes: .18 ignition
interlock cannot
be waived
None $100 - $500
$300 -
$500
500 - $1,000
Nebraska
No
R-30 days
(mand) -90
days
R-1 yr R-1 yr $400 - $500 $500 $600
Nevada
Yes: .18
(alcohol/drug
abuse eval)
R-90 days/
cancelled with
DWI conv
R-90 days/
cancelled
with DWI
conv
R-90 days/
cancelled with
DWI conv
$400 -
$1,000
$750 -
$1,000
$2,000 -
$5,000
New Hampshire
Yes: .16 (tiered
sanctions)
S-6 months S-2 yrs S-2 yrs
$350 -
$1,000
500 -
2,000
$500 -
$2,000
New Jersey
No DMV issues preliminary suspension without hearing $250 - $400
500 -
1,000
$1,000
New Mexico
Yes: .16 (jail
term)
R-30 days
(mand) - 90
days
R-30 days
(mand) - 1 yr
R-30 days
(mand) - 1 yr
up to $500
$500 -
$1,000
$750 -
$5,000
New York***
No
License is suspended by the court at the time of
arraignment - hardship license available
immediately
$500 -
$1,000
$1,000 -
$5,000
$1,000 -
$5,000
North Carolina/
BAC Restricted
License Available
Yes: .15/.16
(subst abuse
program,
aggravating
factor at
sentencing)
R-10 days
(mand) - 30
days
R-10 days
(mand) - 30
days
R-10 days
(mand) - 30
days
up to $1,000
up to
$2,000
up to 5,000
North Dakota
No
S-30 days
(mand) - 90
days
S-365 days S-2 yrs
$250 -
$1,000
$500 -
$1,000
$1,000

63
Provisions For Failing a BAC Test & Administrative Sanctions & DWI Fines
S-Suspension/R-Revoke- Administrative Per Se Fine ($) - DWI Conv
State
Is there a High
BAC provision?
1st Offense
2nd
Offense
3rd Offense
1st DWI 2nd DWI 3rd DWI
Ohio
Yes: .17 (tiered
sanctions)
S-15 days
(mand) - 90
days
S-30 days
(mand) - 1 yr
S-180 days
(mand) - 2 yrs
$250 -
$1,000
$350 -
$1,500
$550 -
$2,500
Oklahoma*
Yes: .15
(inpatient treat.,
interlock)
up to 180 days
(less with
interlock)
R-1 yr R-1 yr - 3 yrs up to $1,000
up to
$2,500
up to $5,000
Oregon
No
S-30 days
(mand) - 90
days
S-1 yr S-1 yr
$1,000 -
$5,000
$1,500 -
$5,000
$2,000 -
$5,000
Pennsylvania
No None
$300 -
$5,000
(+surcharge
$50)
$300 -
$5,000 (+
surcharge
$100)
$300 -
$10,000
(+surcharge
$200)
Rhode Island
Yes: .15 (tiered
sanctions)
License may be suspended for up to 1 yr, if
committed offense that requires court license
suspension/revocation (e.g., DWI)
$100 - $500
$400 -
$1,000
$400 -
$5,000
South Carolina
No
BAC >
.15 : 30
days (soft)
BAC >
.15 :
60 days
(soft)
BAC >
.15 : 60
days (soft)
$300
$1,000 -
$5,000
$3,500 -
$6,000
South Dakota
Yes: .17 (alcohol
evaluation)
None up to $1,000
up to
$1,000
up to $2,000
Tennessee
Yes: .20 (jail
term)
None
$350 -
$1,500
$600 -
$3,500
$1,100 -
$10,000
Texas
No
S-90 days (can
get occup
license)
S-90 days
(mand) - 1 yr
No up to $2,000
up to
$4,000
up to
$10,000
Utah
Yes: .16
(Electronic
Home
Monitoring)
S-90 days S-1 yr S-1 yr
$700 -
$1,000
$800 -
$1,000
$1,500 -
$5,000
Vermont
No S-90 days S-18 months
S-3 yrs (mand)
- Life
up to $750
up to
$1,500
up to $2,500
Virginia
Yes: .20 (Alcohol
Safety Action
Program)
S-7 days S-7 days S-7 days up to $2,500
up to
$2,500
up to $2,500
Washington
Yes: .15 (tiered
sanctions)
S-30 days
(mandatory) -
90 days
R-2 yrs R-2 yrs
$350 -
$5,000
$500 –
5,000
$1,000 -
$5,000
West Virginia
No
R-30 days
(mand with
interlock) - 90
days (mand
with no
interlock) - 6
months
R-9 months
(mand with
interlock) - 5
yr (mand
with no
interlock) -
10 yrs
R-1 yr (mand
with interlock) -
10 yrs (mand
with no
interlock) - Life
$100 - $500
$1,000 -
$3,000
$3,000 -
$5,000
Wisconsin
Yes: .17, .20, .25
(Subsequent
Offenses - fines
& jail term)
S- 6 months
(not mand)
S-6 months
(not mand)
S-6 months
(not mand)
$150 - $300
$350 -
$1,100
$600 -
$2,000
Wyoming
No
S-90 days (can
get occup
license)
S-90 days
(mand)
S-90 days
(mand)
up to $750 $200-750 $750-$3,000
* Mandatory sanctions for the offenses of driving while under the influence and illegal per se
** Mandatory sanctions for the offenses for driving while under the influence of alcohol/illegal per se
*** Mandatory sanctions for the offenses of driving while intoxicated and illegal per se

64
Penalties for DWI Conviction
Imprisonment - DWI Conv Community Service - DWI Conv
Licensing Action - DWI Conv
R-Revoked/S-Suspended
State
1st DWI 2nd DWI 3rd DWI 1st DWI 2nd DWI 3rd DWI 1st DWI 2nd DWI 3rd DWI
Alabama
0 days-
1yr
5 days-
1yr
60
days-
1 yr
None
30 days - in
lieu of jail
None S-90 days R-1 yr R-3 yrs
Alaska
72 hours-
1 yr
20 days -
1 yr
60 days
- 5 yrs
24 hours +
jail term
160 hours +
jail term
discretionary
with court
R-30 days
& interlock
R-1 yr R-3 yrs
Arizona
24 hours -
6 months
30 days -
6 months
4
months
- 6
months
discretionary
with court
discretionary
with court
not eligible S-90 days R-1 yr R-3 yrs
Arkansas
24 hours -
1 yr
7 days -
1 yr
90 days
- 1 yr
discretionary
with court - in
lieu of jail
30 days in
lieu of jail
90 days in
lieu of jail
via administrative per se law; plus add 6
month-suspension via court DWI
conviction
California
0 to 6
months
96 hours -
1 yr
30 days
- 1 yr
10 days + 48
hours of jail
10 days +
48 hours of
jail
10 days +
48 hours of
jail
restricted
driving
restricted
driving
R-18
months
Colorado*
5 days -
1yr
48hrs - 10
days com
service
48hrs -
10 days
com
service
48 hours +
jail term
60 hours +
jail term
60 hours +
jail term
R-3
months
R-1 yr R-1 yr
Connecticut*
48 hours -
6 months
120 days -
2 yrs
1 yr -
3yrs
100 hours in
lieu of 48
hours of jail
100 hours +
jail term
100 hours +
jail term
S-1 yr S-3 yr
R-
permanent
Delaware/
Interlock
Diversion for 1st
DWI
60 days
(may
suspend)
to 6
months
60 days -
18 months
1 yr
(may
suspend
aft 3
mo) to 2
yrs
discretionary
to court
discretionary
to court
discretionary
to court
R-1y R-1 yr
R-18
months
DC*
5 days -
90 days
10 days -
1 yr
10 days
- 1yr
none
30 days +
jail term
60 days +
jail term
R-6
months
R-1 yr R-2 yrs
Florida
0 - 6
months
10 days -
9 months
30 days
- 12
months
50 hours +jail
term + fine
None None
R -180
days
R-12
months
R-24
months
Georgia
24 hours -
12
months
72 hours -
12 months
15 days
- 12
months
40 hours +jail
term
30 days +
jail term
30 days +
jail term
S-12
S-12
months
R-2 yrs
Hawaii
48 hours -
5 days
5 days -
14 days
10 days
- 30
days
72 hours +
jail term
240 hours in
lieu of jail
None
S-30 days
(mand) -
90 days
S-1 yr
R-1 yr
(mand) - 5
yrs
Idaho
0 - 6
months
10 days -
1 yr
30 days
- 5 yrs
condition of probation
S-30 days
(mand) -
150 days
S-1 yr
S-1 yr
(mand) - 5
yrs
Illinois
0- 1 yr
5 days - 1
yr
10 days
- 3 yrs
None
30 days in
lieu of 5
days of jail
60 days in
lieu of 10
days of jail
R-1 yr R-1 yr
Indiana
0 to 60
days
5 days - 2
yrs
10 days
- 4 yrs
None
30 days in
lieu of jail
60 days in
lieu of jail
S-30 days
(mand) - 2
yrs
S-1 yr
(mand) -
2 yrs
S-1 yr
(mand) - 2
yrs
Iowa
48 hours -
1 yr
7 days - 1
yr
30 days
- 5 yrs
in lieu of fine in lieu of fine None
R-30 days
(mand) - 1
yr
R-1 yr
(mand) -
2 yrs
R-1 yr
(mand) - 6
yrs
Kansas
48 hours -
6 months
5 days - 1
yr
90 days
- 1 yr
100 hours in
lieu of jail
in lieu of fine None
S-30 days
(mand) -
330 days
S-1 yr S-1 yr

65
Penalties for DWI Conviction
Imprisonment - DWI Conv Community Service - DWI Conv
Licensing Action - DWI Conv
R-Revoked/S-Suspended
State
1st DWI 2nd DWI 3rd DWI 1st DWI 2nd DWI 3rd DWI 1st DWI 2nd DWI 3rd DWI
Kentucky
48 hours -
30 days
7 days - 6
months
30 days
- 12
months
48 hours +
jail term
10 days - 6
months + jail
terms
10 days - 12
months + jail
term
S-30 days
(mand) -
120 days
R-12
months
(mand)
18
months
R-24
months
(mand) - 36
months
Louisiana
0 to 6
months
48 hours -
6 months
30 days
- 5 yrs
4 days as
terms of
probation
None None
90 days
(no
mandatory
with
interlock)
12
months
(mand
without
interlock)
- can
drive with
interlock
S-12 months
(mand
without
interlock) -
24 months
can drive
with
interlock
Maine
48 hours -
1 yr
7 days - 1
yr
30 days
- 1 yr
as a
condition of
probation
as a
condition of
probation
as a
condition of
probation
S-60 days
(mand) -
90 days
S-18
months
S-4 yrs
Maryland**
0 to 1 yr
5 days–
2 yrs
10 days
- 3 yrs
none
30 days in
lieu of 5
days of jail
60 days in
lieu of 10
days of jail
R-6
months
(no any
prior revs)
R-1 yr (1
any prior
revoc)
R-1 yr (2
any prior
revoc)
Massachusetts
0- 2.5 yrs
30 days -
2.5 yrs
150
days -
2.5 yrs
min 30 hrs via court order + jail term
S-45 days
(mand) -
1 yr
R-6
months -
2 yrs
R-2 yrs - 8
yrs
Michigan*
0- 93
days
5 days -
1yr
30 days
- 1 yr
0-45 days in
lieu of jail
30 days
(mand) to 90
days in lieu
of jail
60 days
(mand) to
180 days
+jail term
S-30 days R-1 yr S-5 yrs
Minnesota
48 hrs -
90 days
48 hours -
1 yr
60 days
- 1 yr
8 hrs for
each of 30
days of jail
80 hours +
jail term
80 hours +
jail term
R-15 days
(mand) -
30 days
R-90
days
(mand ) -
180 days
R-90 days
(mand) -
180 days
Mississippi
0-48
hours
5 days -
1 yr
1 yr - 5
yrs
victim impact
panel in lieu
of jail
10 days to 1
yr + jail term
S-30 days
- 1yr
S-1 yr - 2
yrs
S-3 yrs - 5
yrs
Missouri
0- 6
months
5 days -
1yr
10 days
- 5 yrs
None
30 days in
lieu of jail
60 days in
lieu of jail
S-30 days
(mand) -
60 days
R-2 yrs R-3 yrs
Montana
24 hours -
10 days
3 days - 6
months
10 days
- 1yr
As part of deferred sentencing. However, not
in lieu of mandatory jail term.
S- 0 to 6
months
R-3
months -
1 yr
R-3 months
- 1 yr
Nebraska
7 days (if
no
probation)
- 60 days
30 days (if
no
probation),
5 days (on
probation)
- 90 days
10 days
- 1 yr
none
240 hours in
lieu of jail
480 hours in
lieu of jail
R-6
months (if
no
probation),
60 days
(on
probation)
R-1 yr
R-7 yrs (if
no
probation),
1 yr (on
probation)
Nevada
2 days - 6
months
10 days -
6 months
1 yr - 6
yrs
48 hours
(mand) - 96
hrs in lieu of
jail
100 hours +
jail term
None
R-45 days
(mand) -
90 days
R-1 yr
R-1.5 yrs
(mand) - 3
yrs
New Hampshire
10 days
(mand) - 1
yr
10 days
(mand) -
1 yr
For a felony or Class A misdemeanor. -
conditional discharge and 50 hrs
R-90 days
(mand) - 2
yrs
R-3 yrs
R-3 yrs - 5
yrs

66
Penalties for DWI Conviction
Imprisonment - DWI Conv Community Service - DWI Conv
Licensing Action - DWI Conv
R-Revoked/S-Suspended
State
1st DWI 2nd DWI 3rd DWI 1st DWI 2nd DWI 3rd DWI 1st DWI 2nd DWI 3rd DWI
New Jersey
30 days
(12-48 hrs
mand
treatment)
48 hours -
90 days
90 days
- 180
days
none
30 days+ jail
term
90 days +
jail term
R-6
months
(mand) - 1
yr
R-2 yrs R-10 yrs
New Mexico
0-90 days
72 hours -
1 yr
30 days
- 1 yr
48 hrs in lieu
of fine
48 hrs + jail
term
R- up to 1
yr
R-30
days
(mand) -
1 yr
R-30 days
(mand) - 10
yrs
New York***
up to 1 yr up to 4 yrs
up to 7
yrs
As a condition of probation
R- up to 6
months
R-1 yr R-1 yr
North Carolina/
BAC Restricted
License
Available
72 hrs - 6
months
7 days -
12 months
30 days
- 24
months
up to 72 hrs None None
R- up to 1
yr
R-2 yrs
(mand) -
4 yrs
R-3 yrs
(mand) -
Permanent
North Dakota
0-30 days
5 days -
30 days
60 days
- 1 yr
None
30 days in
lieu of jail
None
S-30 days
- 91 days
S-365
days
S-2 yrs
Ohio
3 days - 6
months
10 days -
6 mnths
30 days
- 1 yr
Possible, as a condition of probation
S-15 days
(mand) - 3
yrs
S-30
days
(mand) -
5 yrs
S-180 days
(mand) - 10
yrs
Oklahoma*
10 days -
1 yr
5 days - 5
yrs
10 days
- 7 yrs
None None
240 hrs +
jail
up to 180
days
R-1 yr
R-1 yr
(mand) – 3
yrs
Oregon
48 hours -
1 yr
48 hours -
1 yr
48
hours -
1 yr
80 hours in
lieu of jail
80 hours in
lieu of jail
80 hours in
lieu of jail
up to 1 yr
S-90
days
(mand) -
3 yrs
S-1 yr
(mand) - 3
yrs
Pennsylvania
48 hours -
2 yrs
30 days -
2 yrs
90 days
- 5 yrs
Possible
under pretrial
diversion
program-
Accelerated
Rehabilitative
Disposition
(ARD)
None None
S-1 month
(ARD) - 1
yr
S-12
months
S-12 months
Rhode Island
up to 1 yr
(high
BAC)
10 days -
1 yr
1 yr - 3
yrs
10 hours
(mand) - 60
hours
10 hours
(mand) - 60
hours
S-3
months
(high
BAC)
S-1 yr
(mand) -
2 yrs
S-2 yrs
(mand) - 3
yrs
South Carolina
48 hours -
30 days
48 hours -
1 yr
60 days
- 3 yrs
48 hours in
lie of jail
10 days in
lieu of jail
S-6
months
(can get
hardship)
S-1 yr
(mand) -
2 yrs
S-2 yrs
(mand) - 4
yrs
South Dakota
Limited to subs offender and not
having license at the time of DWI
arrest
May be condition of probation
R-30 days
- 1 yr (can
get
hardship)
R-1 yr
(mand)
R-1 yr
(mand)
Tennessee
48 hours -
11
months
29 days
45 days -
11 months
29 days
120
days -
11
months
29 days
200 hrs in
lieu of jail
(Population
>100,000)
R-1 yr (not
mand)
R-2 yrs R-3 yrs

67
Penalties for DWI Conviction
Imprisonment - DWI Conv Community Service - DWI Conv
Licensing Action - DWI Conv
R-Revoked/S-Suspended
State
1st DWI 2nd DWI 3rd DWI 1st DWI 2nd DWI 3rd DWI 1st DWI 2nd DWI 3rd DWI
Texas
72 hrs -
180 days
5 days -
1yr
10 days
- 10 yrs
24 - 100
hours + jail
term
80-200
hours + jail
term
160-600
hours + jail
term
S-90 days
- 1 yr (can
get
interlock +
license)
S-1 yr
(mand) -
2 yrs
(interlock)
S-1 yr
(mand) - 2
yrs
(interlock)
Utah
48 hours -
6 months
240 hours
- 6 months
1,500
hours -
5 yrs
24 hours in
lieu of jail
240 hours
lieu of jail
S-90 days R-1 yr R-1 yr
Vermont
0- 2yrs
60 hours -
2 yrs
100
hours -
5 yrs
Possible
200 hours in
lieu of jail
400 hours in
lieu of jail
S-90 days
S-18
months
R-3 yrs
(mand) -
Permanent
Virginia
0-12
months
5 days - 1
yr
30 days
- 1 yr
None
S-1 yr
(can get
hardship
license)
R-1 yr
(mand) -
3 yrs
R-3 yrs
(mand) - 10
yrs
Washington
24 hours -
1 yr
30 days -
1 yr
90 days
- 1 yr
Possible
S-30 days
(mand) -
90 days
(R -1 yr for
high BAC)
R-2 yrs
(R-900
days for
high
BAC)
R-3 yrs (R-4
yrs for high
BAC)
West Virginia
24 hours -
6 months
6 months -
1 yr
1 yr - 3
yrs
When there is no injury
R-30 days
(mand
with
interlock) -
90 days
(mand
with no
interlock) -
6 months
R-9
months
(mand
with
interlock)
- 5 yr
(mand
with no
interlock)
- 10 yrs
R-1 yr
(mand with
interlock) -
10 yrs
(mand with
no interlock)
- Life
Wisconsin
none
5 days - 6
months
30 days
- 1 yr
30 days in
lieu of jail
R-6 - 9
months
(not
mand)
R-60
days
(mand) -
18
months
R-90 days
(mand) - 3
yrs
Wyoming
0-6
months
7 days - 6
months
30 days
- 6
months
Possible, as a condition of probation
S-90 days
(can get
hardship)
S-1 yr
(mand)
R-3 yrs
(mand)
68
APPENDIX C
Connecticut Implied Consent Form A-44
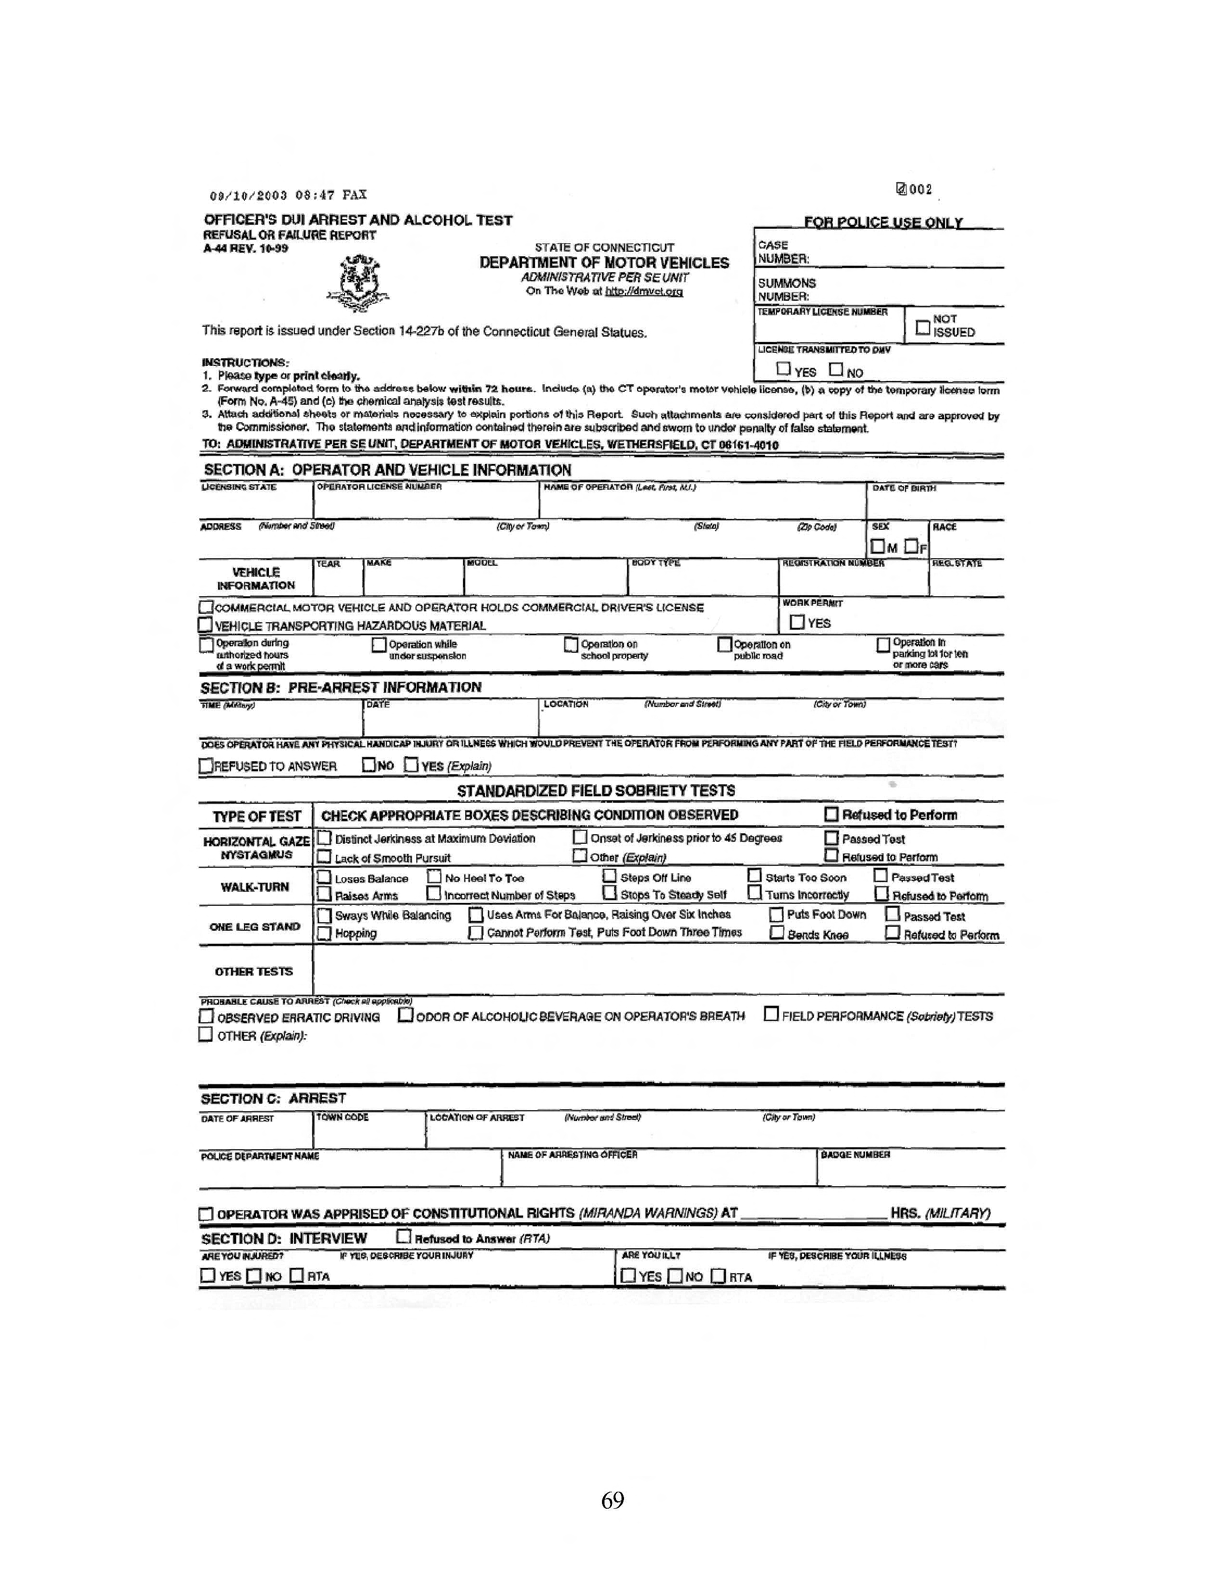
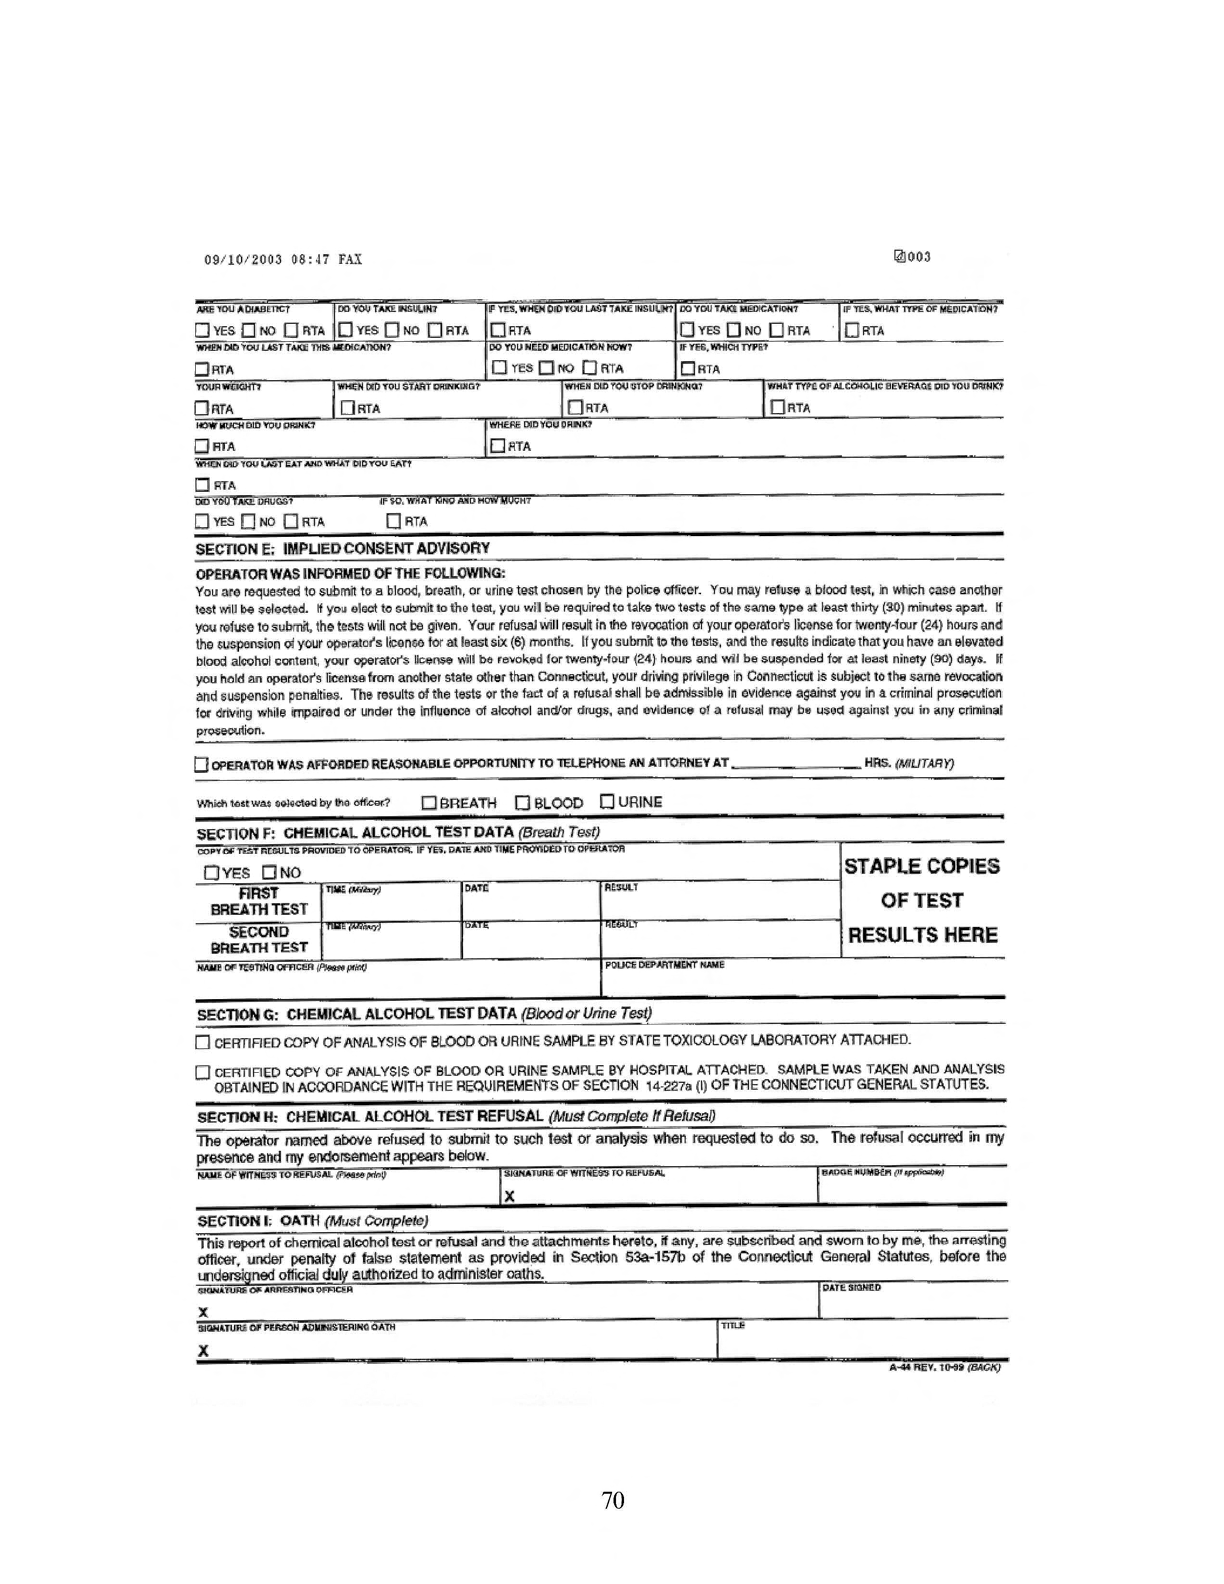
71
APPENDIX D
Facsimile of Maryland Form DR-15:
ADVICE OF RIGHTS

72
ADVICE OF RIGHTS -(§16-205.1 of the Maryland Vehicle Law)
You have been stopped or detained and reasonable grounds exist to believe that you have been driving or attempting to drive a motor vehicle while under
the influence of alcohol; impaired by alcohol; so far impaired by any drug, any combination of drugs, or a combination of one or more drugs and alcohol;
or impaired by a controlled substance that you could not drive a vehicle safely; in violation of an Alcohol Restriction, or in violation of §16-813 of
Maryland Transportation Article.
In this state, any person who drives or attempts to drive a motor vehicle, including a commercial motor vehicle, on a highway or on any private property
that is used by the public in general, is deemed to have consented to take a test to determine the alcohol concentration, or test to determine the drug or
controlled dangerous substance content of the person. The test shall be at no cost to you. The test to determine alcohol concentration shall be a breath test.
However, a test of blood shall be administered if the breath test equipment is unavailable. A test is required to determine the drug or controlled dangerous
substance content, or if your injuries require medical attention. The results of such test or tests, or a refusal of any such test, may be admissible as evidence
in any criminal prosecution.
• Mandatory Test:
If you are involved in a motor vehicle accident resulting in the death of, or life threatening injuries to, another person, you must take a test.
• Submission to the test. If your test results in an alcohol concentration of 0.08 or more:
The MVA will be notified of your test results; your Maryland driver’s license shall be confiscated; an Order of Suspension issued: and if eligible, a
temporary license issued valid for 45 days. An Administrative suspension shall be imposed by the MVA against your Maryland driver’s license or
privilege. The suspension shall be 45 days for a first offense and 90 days for a second or subsequent offense. Modification of the suspension may
occur in certain circumstances.
• You have the right to refuse to submit to the test. If you refuse:
The Motor Vehicle Administration (VMA) will be notified of your test refusal; your Maryland (MD) driver’s license shall be confiscated; an Order of
Suspension issues, and if eligible, a temporary license issued, valid for 45 days. The MVA shall suspend your MD driver’s license or driving
privilege if you are a non-resident. The suspension shall be 120 days for a first offense and 1 year for a second or subsequent offense. You will be
ineligible for a modification of the suspension or issuance of a restrictive license, except in certain circumstances, a test refusal suspension may be
modified at a hearing if you agree to participate in the Ignition Interlock Program for at least 1 year.
• Administrative Hearings:
You may request an Administrative Hearing, at any time within 30 days of the date of the Order of Suspension, to show cause why your driver’s
license or privilege should not be suspended. You may request a hearing within 10 days of the date of the Order of Suspension to insure that your
privilege to drive is not suspended prior to your hearing. Your request for a hearing must be made in writing. You may use the “Hearing Request”
form if available. Send your request to the Office of Administrative Hearings at 11101 Gilroy Rd., Hunt Valley, MD 21031-1301. You must include
a check or Money Order for $15.00, which is the required filing fee, made payable to the “Maryland State Treasurer.” Your request for a hearing will
be invalid if submitted without the required $15.00 filing fee.
• Violation of Restriction: The MVA may also suspend or revoke your license upon satisfactory evidence of a violation of an alcohol restriction.
• Disqualification of CDL: In addition to any suspension for a test failure or refusal, your Commercial Driver’s License (CDL) may be disqualified.
If you were operating a commercial motor vehicle and you refuse to submit to a test, or your test result indicates an alcohol concentration of 0.04 or
more, your CDL or privilege will be disqualified for 1 year for a first offense; 3 years for a first offense while transporting hazardous materials
required to be placarded; and lifetime for a second or subsequent offense.
• Your driver’s license or privilege will be suspended on the 46th day after the date of the Order of Suspension if:
(1) You do not request a hearing with 10 days of the date of the Order of Suspension; (2) You fail to appear for a hearing; (3) At the conclusion of the
hearing, a decision is rendered against you. Your request for a hearing will be invalid if submitted without the required $15.00 filing fee.
• Certification:
I, the undersigned police officer, certify that I have advised the driver of the above stated Advice of Rights. This included advising the driver of the
sanction to be imposed for 1) A refusal to take a test; (2) A test resulting in an alcohol concentration of 0.08 or more, and (3) Advising of sanction for a
test refusal or a test resulting in an alcohol concentration of 0.04 or more while operating a commercial motor vehicle.
Read Before Signing:
I, the undersigned driver, acknowledge that I have been read or have read the above stated Advise of Rights as certified by the police officer. I understand
that this requested test is in addition to any preliminary tests that were taken.
Having been advised, do you now agree to submit to a test? (This is not an admission of guilt.)
(Officer check reply)
Yes-Agree to submit to an alcohol concentration test Yes-Agree to submit to a test for drug or controlled dangerous substance (CDS)
No-alcohol concentration test refused No-drug or CDS test refused (DRE must complete & submit DRE Certification Form)
Driver Signature ________________________ Date __________ Time _________ Dr-15 control # _____________
Signature of Officer __________________________ I.D. No. ______________ Police Agency _____________
73
APPENDIX E
Florida Implied Consent Warning

74
IMPLIED CONSENT WARNING
STATE OF FLORIDA
DEFENDANT’S NAME
AGENCY CASE NUMBER
BREATH TEST
I am now requesting that you submit to an approved test of your breath for the purpose of determining the
alcoholic content of your breath.
OR
URINE TEST
I am now requesting that you submit to a test of your urine for the purpose of determining
the presence of any chemical or controlled substance.
OR
BLOOD TEST
I am now requesting that you submit to an approved test of your blood for the purpose of determining its
alcoholic content and/or the presence of any chemical or controlled substance.
Will you take the test? YES NO
If you fail to submit to the test I have requested of you, your privilege to operate a motor vehicle will be suspended
for a period of one (1) year for a first refusal, or eighteen (18) months if your privilege has been previously
suspended as a result of a refusal to submit to a lawful test of your breath, urine or blood. Additionally, if you refuse
to submit to the test I have requested of you and if your driving privilege has been previously suspended for a prior
refusal to submit to a lawful test of your breath, urine or blood, you will be committing a misdemeanor. Refusal to
submit to the test I have requested of you is admissible into evidence in any criminal proceeding.
Do you still refuse to submit to this test knowing that your driving privilege will be suspended for a period of at least
one year and that you will be charged criminally for a subsequent refusal?
YES NO
DATE
TIME DEFENDANT’S SIGNATURE (YOUR SIGNATURE IS NOT AN
ADMISSION OF GUILT)
ARRESTING OFFICER (PRINT NAME AND
ID#)
BREATH TEST OPERATOR (PRINT NAME
AND ID#)
This publication is distributed by the U.S. Department of Transportation, National Highway Traffic Safety
Administration, in the interest of information exchange. The opinions, findings and conclusions expressed
in this publication are those of the author(s) and not necessarily those of the Department of Transportation
or the National Highway Traffic Safety Administration. The United States Government assumes no liability
for its content or use thereof. If trade or manufacturers’ names or products are mentioned, it is because they
are considered essential to the object of the publication and should not be construed as an endorsement. The
United States Government does not endorse products or manufacturers.
Breath Test Refusals in DWI Enforcement
An Interim Report
DOT HS 809 876
August 2005
Nat i o n a l H i g h way Tr a f f i c S a f e t y A d m i n i s t r at i o n
