
How Toxic Mercury
Contaminates Fish in
U.S. Waterways
October 2004
Research & Policy Center
Environment Colorado

Fishing for Trouble 1
Fishing for Trouble
How Toxic Mercury Contaminates Fish in U.S. Waterways
October 2004

Fishing for Trouble 2
Acknowledgements
Written for Clear The Air by Zachary Corrigan, Staff Attorney and Clean Air Advocate with
Environment Colorado Research & Policy Center. Clear The Air is a joint project of the Clean
Air Task Force, National Environmental Trust, and the National Association of State PIRGs and
affiliated organizations.
© 2004, Environment Colorado Research & Policy Center
Cover photo courtesy of the Recreational Boating and Fishing Foundation, www.rbff.org.
The author would like to thank the Environmental Protection Agency for providing the data
used in this report; Michael Bender with the Mercury Policy Project for his great work on this
issue throughout the years, including earlier versions of this report; Martha Keating with the
Clean Air Task Force, John Stanton and Jennifer Choe with National Environmental Trust,
Angela Ledford and Jonathan Banks with Clear The Air, and Holly Binns with Florida PIRG for
their suggestions; and Alison Cassady for her insightful research assistance and editing.
This report is made possible with funding from The Pew Charitable Trusts. The opinions
expressed in this report are those of the author and do not necessarily reflect the views of The
Pew Charitable Trusts.
To receive a copy of this report, visit our website or send a check for $30 made payable to
Environment Colorado Research & Policy Center to the following address:
Environment Colorado Research & Policy Center
1530 Blake Street, Suite 220
Denver, CO 80202
(303) 573-3871
www.environmentcolorado.org

Fishing for Trouble 3
Table of Contents
Executive Summary ....................................................................................................................4
Mercury Contamination of Fish ..................................................................................................7
Health Effects of Mercury Exposure...........................................................................................................7
Mercury in Commercially-Caught Fish .......................................................................................................8
Mercury in Recreationally-Caught Fish......................................................................................................9
Report Findings: A Growing Number of Waterways Under Advisory .....................................10
Statewide Advisories.................................................................................................................................. 10
Advisories on Our Lakes............................................................................................................................ 10
Advisories on Our Rivers............................................................................................................................ 12
Coasts under Advisory............................................................................................................................... 15
Public Lands under Advisory..................................................................................................................... 15
Safe Eating Guidelines .............................................................................................................................. 17
Mercury Contamination Threatens Recreational Fishing..........................................................18
Addressing the Problem at the Source......................................................................................20
The Bush Administration’s Flawed Plan ................................................................................................... 21
Conclusion and Recommendations ..........................................................................................22
Methodology ............................................................................................................................23
Appendices
Appendix A. High Mercury Levels in Commercial Fish and Seafood Not Covered by FDA’s
2004 Consumption Advisory, 1978-2003................................................................................................. 25
Appendix B. State-by-State Mercury Advisory Totals and Money Spent on Recreational
Fishing ............................................................................................................................................................... 26
Appendix C. Mercury Air Emissions from Power Plants by State or Territory, 2002....................... 28
Appendix D. Mercury Air Emissions by Power Plant, 2002 ..................................................................29
Appendix E. Detailed Breakdown of Advisories by State .................................................................... 43
End Notes ....................................................................................................................................i

Fishing for Trouble 4
Executive Summary
oxic mercury, largely emitted from coal-
burning power plants, is polluting
waterways, contaminating the fish we eat,
and posing a serious threat to public health.
State and tribal health departments issue fish
consumption advisories in order to warn
people to limit or avoid consumption of
contaminated fish species from local rivers,
lakes, and other waterbodies. This report
details the active fish consumption advisories
issued by the states in 2003 due to mercury
pollution in local waterways and finds that
fish in a large percentage of America’s
lakes, rivers, and coastal waters are not safe
for unlimited consumption.
Mercury is a dangerous toxic metal,
especially for children. Exposure to mercury
can cause attention and language deficits,
impaired memory, and impaired visual and
motor function in children. Scientists at the
U.S. Environmental Protection Agency (EPA)
estimate that one in six women of
childbearing age in the U.S. has levels of
mercury in her blood sufficiently high to put
630,000 of the four million babies born each
year at risk of health problems due to
mercury exposure.
Our analysis of EPA data on state fish
consumption advisories reveals that mercury
advisories cover a greater area than ever
before. In 2003, 44 states had active
mercury consumption advisories for local
waterways compared with only 27 states in
1993 and 39 states in 1997. This is a 63%
increase in 11 years. The precipitous
increase in mercury advisories over the last
decade demonstrates that mercury is
pervasive in our environment. As EPA
Administrator Mike Leavitt has said, “The
more waters we monitor, the more we find
mercury....”
a
Statewide Advisories
More and more states are issuing statewide
advisories, or advisories covering all of their
inland freshwater lakes and/or rivers for at
least one species of fish. In 2003, 21 states
issued statewide advisories for their inland
lakes and/or rivers (Connecticut, Florida,
Illinois, Indiana, Kentucky, Maine, Maryland,
Massachusetts, Michigan, Minnesota, Missouri,
Montana, North Dakota, New Hampshire,
New Jersey, Ohio, Pennsylvania, Rhode
Island, Vermont, Washington, and
Wisconsin). New to this list are Montana and
Washington, which for the first time in 2003
issued statewide advisories for all inland
waterways, and Wisconsin, which added a
statewide advisory on all of its rivers.
Advisories on Our Lakes
A growing number of our nation’s lakes are
under mercury advisory. In 2003:
• Active mercury advisories covered at least
13.1 million acres of lakes (including
statewide advisories), or 32% of all lake
acres. The number of lake acres under
advisory for mercury increased by 6%, up
from at least 12.4 million acres in 2002.
• Ten states (Arizona, California, Idaho,
Indiana, Louisiana, Montana, Nebraska, New
York, South Dakota, and Washington)
increased the extent of their lakes under
advisory.
• Nine states (Arizona, California, Idaho,
Illinois, Kentucky, Minnesota, Mississippi,
North Dakota, and South Carolina) issued
a
Michael Janofsky, “E.P.A. Says Mercury Taints Fish
Across U.S.,” New York Times, 25 August 2004.
T
Fishing for Trouble 5
additional consumption restrictions for their
lakes, strengthening advisories already in
place by adding a new fish to the advisory,
warning more people to limit their fish
consumption, or advising people to eat less
of the fish under advisory.
• Indiana, Michigan, and Pennsylvania have
mercury advisories covering the Great Lakes
and connecting waterways. These advisories
cover 2,334 miles of Great Lake coasts and
connecting rivers and estuaries on Lake Erie,
Lake Superior, Lake Huron and Lake
Michigan.
Advisories on Our Rivers
States are issuing advisories covering more
and more miles of our rivers. In 2003:
• Active mercury advisories covered at least
767,000 miles of river (including statewide
advisories), or 22% of all river miles. The
number of river miles under advisory for
mercury increased by 67%, up from at least
458,000 miles in 2002.
• Nine states (California, Louisiana, Michigan,
Minnesota, Montana, Nebraska, South
Carolina, Washington, and Wisconsin)
increased the extent of their rivers under
advisory.
• Eight states (Illinois, Indiana, Kentucky,
Louisiana, Mississippi, North Dakota, Ohio,
and South Carolina) issued additional
consumption restrictions for their rivers,
strengthening advisories already in place.
Advisories on Our Coasts
Much of our nation’s coastline is covered by
fish consumption advisories for mercury. In
2003:
• Hawaii issued a statewide advisory
covering all 930 miles of its coast; in total,
16,569 miles of our nation’s coastlines were
covered by mercury advisories in 2003.
• Fish consumption advisories for mercury
and other contaminants cover more than
70% of the coastal waters of the contiguous
48 states. EPA estimates that 92% of the
Atlantic coast and 100% of the Gulf coast
was under advisory in 2003.
• Twelve states (Alabama, Florida, Georgia,
Hawaii, Louisiana, Maine, Massachusetts,
Mississippi, North Carolina, Rhode Island,
South Carolina, and Texas) have issued
statewide mercury advisories for their entire
coastal areas for at least one species of fish.
In Maine, a tribal advisory for mercury
covers all fish and lobster along the state’s
coast.
• Six states (California, Delaware, Florida,
Georgia, South Carolina, and Washington)
have issued specific estuarine advisories for
mercury.
Public Lands under Advisory
A number of our country’s public lands, which
include some of the most scenic and wild
places in the U.S., also have fish consumption
advisories for mercury. Not including
waterways under statewide advisories on
publicly protected lands, Arkansas, New
Jersey, and Florida have specific fish
consumption advisories that apply to waters
in national parks, wildlife refuges, and
reserves. Massachusetts has a fishing
advisory that applies to a river in a national
heritage corridor. Florida and Kentucky also
have advisories on state-protected lands.
Threat to Recreational Fishing
Mercury contamination threatens recreational
fishing, a time-honored American pastime
that is vital to our national and state
economies. Studies indicate that fish
consumption advisories cause many anglers
to reduce the number of days they fish,
choose other locations to fish, and take fewer
overall fishing trips. Even a small dent in the
recreational fishing industry could mean
large economic losses. According to the
American Sportfishing Association and the
National Fish and Wildlife Service,
Fishing for Trouble 6
recreational fishing generated more than
$35.6 billion in expenditures in 2001. Of all
the money spent on fishing, close to $28
billion was spent in states that have active
fish consumption advisories for mercury.
Addressing the Problem at the Source
To protect public health, preserve a critical
part of our diet, and ensure the survival of
an important American pastime, we need to
dramatically cut the amount of mercury
released into our environment by reducing
mercury emissions from coal-fired power
plants. Power plants are the only major
mercury polluters yet to be regulated under
federal clean air standards. As a result,
they are responsible for the lion’s share of
U.S. mercury emissions.
The Clean Air Act requires each and every
power plant, within three years, to reduce
mercury and other hazardous air pollutants
to levels attainable under a “maximum
achievable control technology” (MACT)
standard – requiring reductions to levels
currently achieved by the best performing
plants. Using existing technologies, power
plants can reduce mercury emissions by at
least 90%. This would bring power plant
mercury emissions down from nearly 50 tons
per year to roughly five tons per year by
2008.
Unfortunately, in January 2004, the Bush
administration issued a proposal that would
not come close to achieving the maximum
reductions in mercury emissions required by
the Clean Air Act and necessary to protect
public health. The Bush administration’s
proposal abandons the MACT approach,
enabling power plants to emit six to seven
times more mercury emissions than allowed
under the Clean Air Act over the next
decade. This means that the Bush
administration’s plan postpones meaningful
mercury reductions until 2018, at the earliest.
Moreover, the proposal allows facilities to
buy mercury pollution credits from facilities
located far away instead of reducing their
own emissions, thus increasing the risk of
creating and exacerbating “toxic hotspots,”
or areas with high levels of mercury
deposition.
The Bush administration should abandon its
mercury-trading proposal and faithfully
implement the Clean Air Act by finalizing a
MACT rule that reduces mercury emissions
from power plants by at least 90% from
existing levels by 2008.

Fishing for Trouble 7
Mercury Contamination of Fish
hen power plants and other industries
burn coal or wastes containing mercury,
they emit mercury from their smokestacks into
the air. Rain, snow, and dust particles
“wash” some of this mercury out of the air
onto land and into waterways, where
microorganisms convert it into methylmercury,
a form that is especially toxic to humans and
wildlife.
1, b
Mercury is a persistent bioaccumulative toxin.
Fish absorb mercury as it passes over their
gills and as they feed on plants and small
organisms. As larger fish eat smaller fish,
mercury concentrations increase, or
bioaccumulate.
2
As a result, larger, older
predator fish tend to have the highest
concentrations of mercury. Fish at the top of
the aquatic food chain can have mercury
levels approximately 1 to 10 million times
greater than the levels in the surrounding
waters.
3
Mercury from smokestacks not only
contaminates nearby waterbodies, but also
those far from the source. Once emitted,
some mercury can remain circulating in the
atmosphere for up to one year. When the
mercury comes into contact with oxidizing
chemicals such as ozone, it becomes water-
soluble. It is in this form that it is deposited
via rain or snow. It can then be re-emitted
(volatilized) from waterbodies and
deposited elsewhere. This cyclical process
makes mercury pollution a local, regional,
and global problem.
4
The principal way that people are exposed
to mercury is through fish consumption.
Mercury also can pass through the placenta
b
When this report discusses the “mercury” that builds
up in fish, it is referring to methylmercury.
and expose developing fetuses. In addition,
infants can ingest mercury from breast milk
when mothers have eaten contaminated fish.
5
Mercury is found in the filet portion of the
fish (the muscle). Thus, skinning or trimming
the fat from the fish does not reduce the
mercury content.
6
The only way to avoid
mercury when eating fish is to avoid
mercury-contaminated fish all together.
Health Effects of Mercury Exposure
The mercury that builds up in fish tissues is
highly toxic and can cause neurological and
developmental problems to those exposed
at sufficient levels.
c
Children and infants are at higher risk of
problems associated with mercury exposure
because their nervous systems continue to
develop until about age 14.
7
Mercury’s
effects on the central nervous system are
comparable to those of lead.
8
Health
effects linked to prenatal mercury exposure
include attention and language deficits,
impaired memory, and impaired visual and
motor function.
9,10
In 2004, EPA indicated that as many as one
in six U.S. women has levels of mercury in her
blood sufficiently high to pose a risk to a
developing fetus. This means that as many
as 630,000 children are born each year at
risk of neurological and developmental
problems due to mercury exposure in utero.
11
It is not simply children who are at risk of
c
At high levels of exposure, such as through
occupational exposure, mercury can result in other
problems such as central nervous system damage,
kidney damage and failure, cardiovascular collapse,
shock, and even death.
W

Fishing for Trouble 8
health problems due to mercury exposure. In
adults, mercury exposure can adversely
affect fertility and blood pressure regulation
and contribute to heart-rate changes and
cardiovascular disease.
12
Mercury in Commercially-Caught
Fish
In 2004, EPA and the Food and Drug
Administration (FDA) issued a joint national
fish consumption advisory. The joint advisory
advises women who may become pregnant,
pregnant women, nursing mothers, and young
children not to eat shark, swordfish, king
mackerel, or tilefish because they contain
high levels of mercury. The advisory warns
the same populations to limit their
consumption of albacore “white tuna” or tuna
steaks to six ounces or less per week and fish
that have lower levels of mercury, such as
shrimp, canned light tuna, salmon, pollock,
and catfish, to 12 ounces or less per week.
13
Six ounces of fish is an average cooked
meal, about the size of a can of tuna.
EPA and FDA advise consumers to check local
advisories about the safety of fish caught in
local lakes, rivers, and coastal areas. If no
advice is available, people are advised to
eat up to six ounces (one meal, cooked) per
week of fish caught from local waters and
not to eat any other fish during that week.
EPA and FDA recommend that people follow
these same recommendations when feeding
fish and shellfish to young children, but to
serve smaller portions.
In 2004, FDA also released data from the
late 1970s to 2003 showing unsafe levels of
mercury in several species of fish not
included in EPA and FDA’s advisory.
Specifically, as detailed in Appendix A, 22
species of fish contained mercury at levels
suggesting people limit their consumption to
two meals per week or less.
d,14
d
Based on the EPA’s recommended formula for
calculating consumption limits. The consumption limit
The Fish Consumption Advisory Approach
To address the public health threat posed by
mercury pollution, state and tribal health
departments, the Environmental Protection
Agency (EPA), and the Food and Drug
Administration (FDA), which has federal
jurisdiction over commercially bought and sold
fish, issue fish consumption advisories.
Advisories involve a complex assessment of the
level of contamination in a fish species, the size
of the fish, how often an individual eats that
particular species, and the health risk posed by
consumption. Fish advisories are issued for
contaminants other than mercury, such as PCBs
and dioxins; in 2003, however, 76% of all
advisories on waterways were issued at least in
part because of mercury contamination.
15
EPA provides states with guidance on issuing fish
consumption advisories. The states have the
responsibility for issuing specific fish consumption
advisories for fish caught within state borders.
e
(measured in kilograms/day) is equal to the EPA
reference dose (measured in micrograms/ kilograms/
day) multiplied by the average body weight
(measured in kilograms) and divided by the fish
mercury level (measured in micrograms/kilogram).
This formula assumes an average body weight of 70
kilograms, 0.1 microgram/kilogram/day as the
reference dose, 30.44 as the number of days per
month, and 8 ounces (or .23 kilograms, wet weight) as
average meal size.
e
State systems for issuing fish consumption advisories
vary widely from state to state, resulting in a situation
that is confusing for consumers and often inadequate
to protect public health. Some states do not routinely
monitor their waterbodies. Some states use extremely
high thresholds to determine whether an advisory
should be issued. In addition, the advice that states
give their consumers about how much fish should be
consumed varies widely. Recent surveys have shown
that nearly all states inadequately protect the health
of sensitive subpopulations from mercury exposure.
See Environmental Working Group and U.S. PIRG
Education Fund, Brain Food: What Women Should
Know About Mercury Contamination of Fish, 2001.

Fishing for Trouble 9
Mercury in Recreationally-Caught
Fish
Data released in 2004 also indicate that
mercury levels in many non-commercial fish
species can be high enough to warrant
limiting consumption, and in some cases high
enough to make the fish unsafe to eat at all.
A recent report analyzed the first available
data from EPA’s ongoing National Study of
Chemical Residues in Lake Fish Tissue. The
report found that 55% of the fish samples
from inland lakes were contaminated with
mercury at levels that exceed EPA’s “safe”
limit for women of average weight who eat
fish twice a week.
f
In 29 states, mercury
levels in at least half of the fish samples
exceeded this limit.
16
For recreationally-caught fish along our
coasts, FDA data indicate that some of most
the popular sport fish species have high
levels of mercury contamination. As shown in
Table A, of the most popular recreationally-
caught species, six species not included in
FDA’s 2004 consumption advisory (Spanish
mackerel, bluefish, bass, snapper,
sheepshead, and weakfish) contained
mercury at levels suggesting people should
limit their consumption to two meals or less
per week.
For the 69% of anglers who consume their
catch,
17
eating mercury-contaminated fish
can expose them to unsafe levels of mercury.
While not all recreational anglers consume
fish contaminated with mercury at unhealthy
levels, some fall into patterns of fish
consumption that increase their risk of
exposure.
g
These include:
18
f
Based on EPA’s reference dose, which represents the
amount of mercury that can be ingested over the
course of a lifetime without adverse health effects.
The “safe” limit for U.S. women of average weight
who eat two meals of fish per week is .13 parts per
million (ppm).
g
Studies estimate the percentage of anglers that
exceed recommended consumption limits ranges from
• Daily fish consumption over a short period of
time. Recreational anglers who spend their
vacation fishing over a relatively short
period of time and eat fish daily have higher
mercury exposure;
• Relatively continuous exposure. Subsistence
anglers who rely on the catch as a primary
food source may be continuously exposed to
mercury depending on the type of fish and
where it is caught; or
• Regular and frequent consumption. Frequent
consumption of fish can add up to high
exposure levels because the body excretes
mercury slowly.
Table A. Mercury Levels in Popular Recreationally-
Caught Fish (1978-2003) and Safe Consumption
Limits
Species
Average
(ppm)
Min
(ppm)
Max
(ppm)
Consumption
Limit (Meals
Per Month)
Spanish
mackerel
(Gulf Of
Mexico)
0.45 0.07 1.56 2
Bluefish 0.31 0.14 0.63 3
Bass
(Saltwater)
0.27 0.06 0.96 3
Weakfish
(sea trout)
0.25 ND* 0.74 3
Snapper 0.19 ND* 1.37 4
Sheepshead 0.13 0.02 0.63 7
Note: One part per million (ppm) is equal to one
milligram per kilogram of weight.
* ND signifies “non-detectable”
Source: Analysis of U.S. FDA, “Mercury Levels in
Seafood Species,” 19 March 2004, downloaded from
http://www.cfsan.fda.gov/~frf/sea-mehg.html
, 27
September 2004.
0% to 57%. See Paul Jakus et al, “The Benefits and
Costs of Fish Consumption Advisories for Mercury,”
October 2002.

Fishing for Trouble 10
Report Findings: A Growing Number
of Waterways Under Advisory
his report analyzes all active fish
consumption advisories issued by states in
2003 for local waterways due to mercury
contamination and reveals that mercury
advisories cover a greater area than ever
before.
In 2003, 44 states issued advisories for
mercury-contaminated fish, warning the
general population or sensitive
subpopulations to reduce or avoid
consumption of at least one species of fish
from local waterways. This is a 63%
increase over the 27 states with active
advisories in 1993. Since 2002, the number
of river miles reported under advisory for
mercury has increased by 67% (up from
458,000 river miles in 2002), and the
number of lake acres reported under
advisory for mercury has increased by 6%
(up from 12.4 million lake acres in 2002).
Refer to Appendices B and E for a detailed
breakdown of advisories by state.
Statewide Advisories
States are issuing an increasing number of
statewide advisories. These advisories cover
all inland freshwater lakes and/or rivers for
at least one species of fish. In 2003, 21
states (Connecticut, Florida, Illinois, Indiana,
Kentucky, Maine, Maryland, Massachusetts,
Michigan, Minnesota, Missouri, Montana,
North Dakota, New Hampshire, New Jersey,
Ohio, Pennsylvania, Rhode Island, Vermont,
Washington, and Wisconsin) issued statewide
advisories for their inland lakes and/or
rivers. The newest states to this list are
Montana and Washington, which added
statewide advisories for inland waterways,
and Wisconsin, which added a statewide
advisory on all of its rivers.
Advisories on Our Lakes
Advisories cover an ever-greater extent of
our lakes. In 2003, active mercury
advisories covered at least 13.1 million acres
of lakes (including statewide advisories), or
32% of all lake acres. As shown in Table B,
the 10 states with the most lake acres under
advisory in 2003 were Minnesota, Florida,
Maine, Wisconsin, Michigan, Montana, North
Dakota, Washington, Texas, and Illinois.
The number of lake acres reported under
advisory for mercury increased by 6% in
2003 (up from at least 12.4 million acres in
2002).
Table B. States with the Most Lake Acres Under
Mercury Advisory, 2003
State
Total Lake
Acres Under
Advisory
Percentage
Under
Advisory
Minnesota 3,290,101 100
Florida 2,085,120 100
Maine 986,776 100
Wisconsin 982,163 100
Michigan 887,019 100
Montana 844,802 100
North Dakota 632,016 100
Washington 466,296 100
Texas 329,784 11
Illinois 309,340 100
Source: Analysis of data provided by U.S. EPA, 2003
As detailed in Table C, 10 states increased
the total amount of lake acres covered by
mercury advisories in 2003; all but one
T

Fishing for Trouble 11
experienced a double-digit or more
percentage increase.
Table C. States Increasing the Number of Lake Acres
Under Advisory, 2002 to 2003
State
Total Increase
in Lake Acres
Total
Percentage
Increase
h
Arizona 1,887 117
California 6,192 10
Idaho 30,863 172
Indiana 5,754 12
Louisiana 5,294 28
Montana 202,206
Issued
Statewide
Advisory
Nebraska 1,513 48
New York 9,494 15
South Dakota 106 1
Washington 464,103
Issued
Statewide
Advisory
Source: Analysis of data provided by U.S. EPA, 2003
In addition to their inland lakes, Indiana,
Michigan, and Pennsylvania have mercury
advisories covering the Great Lakes and
connecting waterways. These advisories
cover 2,334 miles of Great Lake coast,
estuaries, and connecting rivers on Lake Erie,
Lake Superior, Lake Huron and Lake
Michigan.
In 2003, several states issued additional
consumption restrictions for their lakes,
strengthening advisories already in place by
adding a new fish to the advisory, warning
more people to limit their fish consumption, or
advising people to eat less of the fish under
advisory.
As shown in Table D, in 2003, four states
h
The increase in lake acres does not include any
increases due to states that, for the first time in 2003,
reported to EPA the extent of advisories that they
had issued in previous years.
added new advisories to at least 50,605
acres of lakes already covered by statewide
fish consumption advisories.
For example, since 2000, Kentucky has had
a statewide advisory covering every single
inland lake, warning women of childbearing
age and children six years and younger to
eat no more than one meal per week of
freshwater fish from Kentucky’s rivers,
streams, and lakes. In 2003, Kentucky
extended this advisory to all members of the
general population for Metropolis Lake.
As shown in Table E, in 2003, five states
further strengthened existing advisories by
issuing additional restrictions to at least
19,235 acres of lakes already under
advisory. For example, since 1996, Arizona
has had an advisory covering 90 acres of
Arivaca Lake warning the general
population to avoid consuming all fish from
the lake. In 2003, Arizona strengthened this
advisory, warning the general population to
avoid consuming all other aquatic organisms
from Arivaca Lake as well.
Table D. New Restrictions Added in 2003 to Lakes
Already Under Statewide Advisory
State
Lakes with New
Consumption
Restrictions
Acres Covered
by Additional
Restrictions
Illinois
1,005
Arrowhead Lake
Devil’s Kitchen Lake
Lake in the Hills
Midlothian Reservoir
Monee Reservoir
Kentucky Metropolis Lake 34
Minnesota Numerous Lakes Not available*
North Dakota
49,566
Lake Sakakawea
Devils Lake
Total
50,605
* Did not report extent of lake advisories issued in 2003.
Source: Analysis of data provided by U.S. EPA, 2003

Fishing for Trouble 12
Table E. New Restrictions Added in 2003 to Lakes
Already Under Specific Advisory
State
Lakes with New
Consumption
Restrictions
Acres Covered
by Additional
Restrictions
Arizona 140
Arivaca Lake
Pena Blanca Lake
California Black Butte Reservoir 23
Idaho Salmon Falls Creek
Reservoir
3,400
Mississippi 15,371
Enid Lake
Archusa Creek Water
Park
South
Carolina 301
Lake HB Robinson
Langley Pond
Total 19,235
Source: Analysis of data provided by U.S. EPA, 2003
Advisories on Our Rivers
States are issuing advisories covering an
increasing number of miles of our rivers.
Active mercury advisories were in effect for
at least 767,000 miles of river (including
statewide advisories) in 2003, or 22% of all
river miles. As shown in Table F, the states
with the most river miles under advisory were
Montana, Kentucky, Washington, Wisconsin,
Pennsylvania, Florida, Missouri, Indiana,
Illinois, and Maine.
In the last year, the number of river miles
reported under advisory for mercury
increased by 67% (up from 458,000 miles in
2002). As detailed in Table G, six of the
nine states that increased the percentage of
river miles under advisory in 2003 did so by
at least a double-digit percentage increase.
Table F. States with Most River Miles Under Mercury
Advisory, 2003
State
Total River
Miles Under
Advisory
Percentage
Under
Advisory
Montana 176,750 100
Kentucky 89,431 100
Washington 73,886 100
Wisconsin 57,698 100
Pennsylvania 53,962 100
Florida 51,858 100
Missouri 51,015 100
Indiana 35,673 100
Illinois 32,190 100
Maine 31,672 100
Source: Analysis of data provided by U.S. EPA, 2003
Table G. States Increasing Number of River Miles
Under Advisory, 2002 to 2003
State
Total Increase
in River Miles
Total
Percentage
Increase
i
California 30 75
Louisiana 157 21
Michigan* not available not available
Minnesota* not available not available
Montana 176,716
Added
statewide
advisory
Nebraska 82 132
South Carolina 17 1
Washington 73,886
Added
statewide
advisory
Wisconsin 57,492
Added
statewide
advisory
* Michigan and Minnesota increased the extent of
their rivers under advisory in 2003 but did not report
the number of miles that the new advisories covered.
Source: Analysis of data provided by U.S. EPA, 2003
i
The increase in river miles does not include any
increases due to states that, for the first time in 2003,
reported to EPA the extent of advisories that they
had issued in previous years.

Fishing for Trouble 13
As detailed in Table H and Table I, eight
states (Illinois, Indiana, Kentucky, Louisiana,
Mississippi, North Dakota, Ohio, and South
Carolina) strengthened existing advisories
for rivers in 2003. These new advisories
apply to 1,340 miles of rivers already
covered by statewide advisories and 968
miles already covered by individual
advisories issued in previous years.
Table H. New Restrictions Added in 2003 to Rivers
Already Under Statewide Advisory
State
Rivers with New
Consumption
Restrictions
Miles Covered
by Additional
Restrictions
Illinois Chicago River 41
Indiana
381
Anderson River
Eel River
Greens Fork
Indian Creek
Laughery Creek
Little Blue River
Richland Creek
South Fork Blue
River
Kentucky Ohio River 674
North Dakota
10
Missouri River
Red River
Ohio Ashtabula River 234
Grand River
Great Miami River
Sandusky River
Scioto River
St. Mary's River
Total 1,340
Source: Analysis of data provided by U.S. EPA, 2003
Table I. New Restrictions Added in 2003 to Rivers
Already Under Specific Advisory
State
Rivers with New
Consumption
Restrictions
Miles Covered
by Additional
Restrictions
Louisiana Ouachita River 142
Mississippi 246
Bogue Chitto River
Escatawpa River
Pascagoula River
Pearl River
Yockanookany River
Yocona River
South Carolina 580
Black River
Lumber River
Lynches River
New River
North Fork Edisto
River
North Santee River
Savannah River
South Fork Edisto
River
Total 968
Source: Analysis of data provided by U.S. EPA, 2003
Fishing for Trouble 14
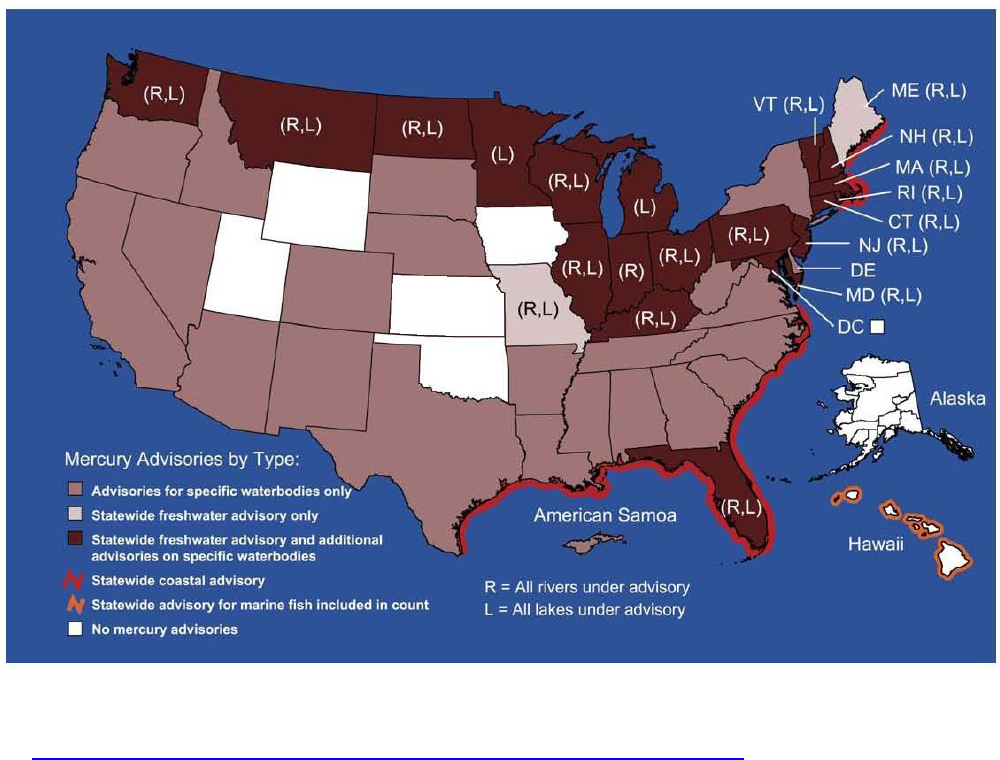
Figure 1. Map of Fish Consumption Advisories for Mercury Pollution, 2003
Source: U.S. EPA, National Maps and Graphics, downloaded 27 September 2004 from
http://epa.gov/waterscience/presentations/fishslides/2003_files/frame.htm. This map was modified
from the version obtained from EPA; EPA had erroneously portrayed Kansas as having active fish
consumption advisories for mercury.

Fishing for Trouble 15
Coasts under Advisory
Our nation’s coastal waters, including
estuaries, coastal wetlands, coral reefs,
mangrove forests, and upwelling areas, also
face threats from mercury pollution. These
areas are vitally important for fish and
fishing. They are the home of spawning
grounds, nurseries, and fisheries and provide
shelter and food for fish.
19
Fish consumption advisories for mercury and
other contaminants cover more than 70% of
the coastline miles of the contiguous 48
states.
20
EPA estimates that 92% of the
Atlantic coast and 100% of the Gulf coast
was under advisory in 2003.
21
As detailed in Table J, in 2003 12 states
issued statewide advisories for their entire
coastal areas for at least one species of fish.
These advisories cover 16,569 miles of our
nation’s coastline, an increase of 930 miles
over 2002 due to Hawaii placing all of its
coasts under advisory in 2003.
Table J. U.S. Coasts Covered by Mercury Advisories,
2003
State
Coastal Miles
Under Advisory
Alabama 254
Florida 5,161
Georgia 255
Hawaii 930
Louisiana 1,784
Massachusetts 1,116
Maine 2,064
Mississippi 220
North Carolina 1,877
Rhode Island 247
South Carolina 476
Texas 2,185
Total 16,569
Source: U.S. EPA, 2003
In Maine, a tribal advisory for mercury
covers all fish and lobster along the state’s
coast. California, Delaware, Florida,
Georgia, South Carolina, and Washington
all have additional mercury advisories
specifically for estuarine waters.
In its draft Coastline Condition Report, EPA
studied 90 specific contaminants from 653
sites throughout the estuarine waters of the
United States (except Louisiana, Florida, and
Puerto Rico), finding that 42% of the testing
sites had fish with mercury contaminant levels
above 0.12 parts per million (ppm).
j
This
level falls only slightly below what EPA
considers a “safe” limit for U.S. women of
average weight who consume two average-
sized meals of fish per week (0.13 ppm).
EPA found fish at 18% of the sites with
mercury concentrations close to twice this
level.
22
Public Lands under Advisory
Our public lands, many of which have been
specifically protected for recreational uses,
are also at risk due to mercury pollution.
Arkansas has issued a fish consumption
advisory for the Saline River, located in the
65,000 acre Felsenthal Wildlife Refuge. The
refuge is “crisscrossed by an intricate system
of rivers, creeks, sloughs and lakes
meandering through extensive bottomland
hardwood forests with the adjoining higher
elevations occupied by pine and upland
hardwoods.”
23
Tissue samples suggest that
birds and mammals living in the refuge,
particularly strict fish eaters, may be at risk
of high mercury exposure.
24
j
These levels existed in at least one composite fish
sample (made up of 5 to 10 fish of a target species
per site). While composite sampling provides a good
indication of average mercury concentrations of
different fish species, it levels out peak concentrations
in individual fish. Researchers have found that a
pregnant woman who eats just one serving containing
very high levels of mercury (2.0 ppm or higher) could
expose her baby to dangerous levels of mercury.

Fishing for Trouble 16
Florida has issued fish consumption advisories
in the Arthur Marshal Loxahatchee National
Wildlife Refuge, Crystal River National
Wildlife Refuge, St. Marks National Wildlife
Refuge, and St. Vincent National Wildlife
Refuge. The state also has issued advisories
in the Everglades National Park - Shark
River Slough, Everglades Water
Conservation Areas 2 and 3, Holeyland
Wildlife Management Area, and the
Santiago Fish Management Area.
New Jersey has issued a mercury fish
consumption advisory that covers
waterbodies in the Pinelands National
Reserve, which includes portions of seven
southern New Jersey counties and
encompasses more than one million acres of
farms, forests and wetlands. In 1978,
Congress established this area as the
country’s first national reserve, or an area of
nationally significant resources that is
protected through local land use
management and supported by federal
financial and technical assistance.
25
Massachusetts has issued an advisory
covering the Holland Pond and East Brimfield
Reservoir in the Quinebaug and Shetucket
Rivers Valley National Heritage Corridor.
This largely rural area has been called “the
last green valley” in the Boston-to-
Washington corridor.
26
Kentucky has issued a fish advisory for
waters in the state-protected West Kentucky
Wildlife Management Area. According to a
local tourism website, this area is known for
its “tupelo swamp, riverside cottonwood
trees where eagles perch, native prairie
vegetation, and a variety of wildflowers.”
27
Regrettably, officials warn anglers not to eat
the largemouth bass in 152 acres of this
management area.
National Park Service employees also have
flagged mercury as a concern in many other
nationally protected lands, even though the
waterways may not be under fish
consumption advisory. A 2003 informal
National Park Service survey found that
officials at several national parks and
protected areas were informing visitors of
potential mercury concerns due to
contaminated fish and mercury deposition
(Table K).
28
Table K. National Parks with Mercury Problems, as
Identified by National Park Service Employees, 2003
National Park
Service Area
Identified Mercury Concerns
Acadia, ME
Elevated mercury concentrations in
wet deposition, elevated mercury
levels in fish. Acadia included in
statewide fish consumption advisory.
Big Bend, TX
Elevated mercury concentrations in
wet deposition.
Catoctin Mountain
Park, MD
Mercury deposition at park.
Isle Royale, MI
Elevated mercury levels found in fish.
Concern about elevated mercury in
wildlife, water, and sediment.
Concern about mercury in food web.
Lake Meredith Natl
Recreation Area
(NRA), TX
Elevated mercury levels found in fish
(walleye). Lake Meredith NRA included
in state fish consumption advisory.
Mount Rainier, WA
Elevated levels of mercury were
found in lake samples collected at
park; did not exceed health
standards.
North Cascades,
WA
Elevated levels of mercury found in
lake samples collected at park; did
not exceed health standards.
Olympic, WA Mercury levels in wet deposition.
Rocky Mountain,
CO
Concern for elevated mercury levels
in precipitation and possibly in fish
tissue.
Shenandoah, VA
Elevated mercury concentrations in
wet deposition.
Source: National Park Service, Park Unit Overview,
May 2003, downloaded 27 September 2004 from
http://www2.nature.nps.gov/air/Studies/air_toxics/me
rcury.htm. Personal communication with Darwin Morse,
National Park Service, 14 September 2004.

Fishing for Trouble 17
Safe Eating Guidelines
Increasingly, states are issuing “no restriction”
advisories, or “Safe Eating Guidelines.”
States issue these advisories to let people
know that some fish species, or sizes of
species, are safe to eat for some or all
segments of the population.
k
Safe Eating
Guidelines for mercury now cover at least
1.1 million acres of lakes and 65,000 miles
of rivers. Connecticut and Wisconsin have
issued statewide “no restriction” advisories
for trout and yellow perch, respectively.
l
In
2003, states added “no restriction”
advisories on at least 854 miles of rivers and
4,534 acres of lakes.
k
This report’s measure of waterways “under
advisory” does not include these advisories.
l
For the most part, “no restriction” advisories coexist
with active advisories, as each applies to different
populations, certain species, and/or species of
varying sizes.
This is good news for people’s health and
recreational fishing, as it indicates that states
have deemed certain fish safe for
consumption. Unfortunately, “no restriction”
advisories only make up about 8% of all
lake and river areas under advisory.
Further, in 2003, states issued additional
consumption restrictions on four times more
lake acres than they issued “no restriction”
advisories.

Fishing for Trouble 18
Mercury Contamination Threatens
Recreational Fishing
ercury contamination is a threat to
recreational fishing, a multi-billion dollar
industry that is critical to our national and
state economies. In 2001, the most recent
year for which data are available,
approximately 34.1 million Americans took a
total of 437 million fishing trips and spent
557 million days fishing.
29
In 2001,
recreational fishing in America:
30,31
• Generated more than $35.6 billion in
spending on food, lodging, and
transportation for fishing trips; fishing and
auxiliary equipment; and other items;
• Generated more than $116 billion in total
economic output;
• Supported more than one million jobs;
• Created more than $30.1 billion in
household income (salaries and wages);
• Added more than $1.9 billion in sales tax
revenues;
• Added more than $470 million in state
income tax revenues; and
• Generated $4.88 billion in federal income
tax revenues.
Mercury advisories could hurt this important
industry. Studies indicate that due to existing
fish consumption advisories, 37% of those
polled in one area took fewer fishing trips,
30% in another area fished for fewer days,
and between 26% and 31% changed fishing
sites. Another study indicates that 36% of the
anglers polled would change their fishing site
if it had a fish consumption advisory.
32
Even a small dent in the recreational fishing
industry could mean large economic losses.
Of all the money spent on recreational
fishing in 2001, nearly $28 billion – or close
to 80% – was spent in states that have
issued fish consumption advisories due to
mercury.
Six of the 10 states with the most lake acres
under mercury advisory, including Florida
Michigan, Minnesota, Texas, Washington,
and Wisconsin, are in the top 10 for the
amount of money spent on recreational
fishing. Florida, Washington, and Wisconsin
also are three of the 10 states with the
largest number of river miles under advisory.
In fact, 11 of the 21 states with statewide
mercury advisories covering all of their
inland lakes and/or rivers, including Florida,
Illinois, Kentucky, Michigan, Minnesota,
Missouri, New Jersey, Ohio, Pennsylvania,
Washington, and Wisconsin, also fall in the
top 20 states for expenditures on
recreational fishing (Table L).
33
See
Appendix B for total spending on
recreational fishing in 2001 for each state.
Anglers spend considerable sums of money
fishing on our Great Lakes, along our coasts,
and in public lands. In 2001, anglers fishing
the Great Lakes spent $1.3 billion alone on
trip and equipment related expenditures.
m,34
In Michigan and New York, more than a
quarter of the money spent on fishing is
spent on fishing the Great Lakes (Table M).
In 2001, anglers spent $8.4 billion fishing
the salt waters off our coasts.
35
Millions of
visitors also fish on our public lands every
year. In 1999, people took six million fishing
trips to National Wildlife Refuges alone.
36
m
The U.S Fish and Wildlife Service does not include
money spent on items such as magazine subscriptions
and membership dues in its data on expenditures for
fishing on the Great Lakes.
M

Fishing for Trouble 19
Table L. 20 States Receiving Most Economic Value
from Recreational Fishing, 2001
State
Money Spent on
Recreational
Fishing, 2001
Statewide
Mercury
Advisory for
Rivers and/or
Lakes?
Florida $4,083,409,000 Yes
California $2,029,581,000
Texas $1,950,902,000
Minnesota $1,284,522,000 Yes
North Carolina $1,118,028,000
New York $1,073,019,000
Wisconsin $1,005,149,000 Yes
Washington $853,761,000 Yes
Michigan $838,558,000 Yes
Ohio $761,619,000 Yes
Missouri $745,514,000 Yes
Alabama $723,467,000
Louisiana $703,373,000
New Jersey $699,826,000 Yes
Colorado $645,891,000
Oregon $601,780,000
Illinois $598,376,000 Yes
Pennsylvania $580,351,000 Yes
South Carolina $558,731,000
Kentucky $544,660,000 Yes
Source: United States Fish and Wildlife Service, 2001
National Survey of Fishing, Hunting and Wildlife
Associated Recreation, downloaded from
http://www.census.gov/prod/2002pubs/FHW01.pdf
,
27 September 2004.
Table M. Money Spent Fishing the Great Lakes, 2001
State
$$ Spent on
Great Lakes
Fishing
Total $$ Spent
On Fishing
% Spent
on Great
Lakes
Fishing
Michigan $321,750,000 $838,558,000 38%
New York $298,310,000 $1,073,019,000 28%
Ohio $144,791,000 $761,619,000 19%
Wisconsin $61,228,000 $1,005,149,000 6%
Indiana* $47,454,000 $518,863,000 9%
Minnesota* $25,303,000 $1,284,522,000 2%
Illinois $21,142,000 $598,376,000 4%
Pennsylvania* $17,414,000 $580,351,000 3%
*based on small sample size
Source: United States Fish and Wildlife Service, 2001
National Survey of Fishing, Hunting and Wildlife
Associated Recreation, downloaded from
www.census.gov/prod/2002pubs/FHW01.pdf
and
www.census.gov/prod/www/abs/fishing.html
, 27
September 2004.

Fishing for Trouble 20
Addressing the Problem at the
Source
s an element of the earth’s crust, mercury
is emitted by natural sources such as
volcanoes and forest fires. It also is released
from manmade activities such as the
combustion of fossil fuels and mercury-
containing wastes, manufacturing, and the
roasting and smelting of ore. Because
mercury never degrades, the amount of
mercury in the environment results from the
combination of past and current mercury
disposal and emissions.
37
Power plants are the largest source of
mercury in the U.S., accounting for more than
41% of all U.S. manmade emissions.
38
Coal-
fired power plants emitted 48 tons of
mercury in 1999.
39
Power plants are the
only major mercury polluters yet to be
regulated under federal clean air standards.
EPA estimates that roughly 60% of the
mercury deposited domestically comes from
U.S. industrial sources.
40
More specifically,
EPA estimates that 33% of the mercury
deposited in U.S. waterways is from U.S.
power plants, though deposition rates are
much higher in some areas.
41
Texas, Ohio, Pennsylvania, Indiana, and
Illinois led the nation for the most mercury air
emissions from power plants in 2002, the
most recent year for which data are
available. Table N shows the 10 states with
the highest mercury air emissions from power
plants.
42
Table O shows the 10 power
plants in the country with the highest mercury
air emissions.
43
See Appendix C for total
mercury emissions to air from power plants
by state. See Appendix D for air emissions
by individual power plant.
Table N. States with the Most Mercury Emissions to
Air from Power Plants, 2002
State
Emissions
(lbs)
Texas 9815
Ohio 7358
Pennsylvania 7002
Indiana 4927
Illinois 4318
Alabama 3931
West Virginia 3680
Kentucky 3540
North Carolina 3434
Missouri 3084
Source: U.S. EPA, 2002 Toxics Release Inventory,
downloaded from www.epa.gov/triexplorer, 27
September 2004.
Table O. Power Plants Emitting the Most Mercury
Pollution to Air, 2002
Facility State City
Air
Emissions
(lbs)
Limestone TX Jewett 1,800
TXU Monticello TX Mt. Pleasant 1,324
AEP Conesville OH Conesville 1,300
Reliant Keystone PA Shelocta 1,235
Jeffrey Energy Center KS Saint Marys 1,216
W.A. Parish TX Thompsons 1,100
Alabama Power Miller AL Quinton 1,077
Martin Lake TX Tatum 1,027
AEP H.W. Pirkey Plant TX Hallsville 1,000
Georgia Power Scherer GA Juliette 943
Source: U.S. EPA, 2002 Toxics Release Inventory,
downloaded from www.epa.gov/triexplorer
, 27
September 2004.
A

Fishing for Trouble 21
The Bush Administration’s Flawed
Plan
The solution is simple. Protecting public
health and recreational fishing demands that
we reduce mercury emissions from all
sources, starting with the largest, uncontrolled
source—coal-burning power plants. The
Clean Air Act is designed to provide these
reductions. Under Section 112 of the Clean
Air Act, toxic substances such as mercury must
be reduced as much as is technologically
feasible, meeting a “maximum achievable
control technology” (MACT) standard within
three years. Two years ago, EPA estimated
that under a MACT standard, power plants
could reduce mercury emissions by 90%
using existing technologies, bringing mercury
emissions down to roughly five tons per year
by 2008.
44
Unfortunately, in January 2004, the Bush
administration issued a proposal that would
not come close to achieving the maximum
reductions in mercury emissions required by
the Clean Air Act and necessary to protect
public health. The Bush administration’s
proposal abandons the MACT approach;
instead, the proposal treats toxic mercury
from power plants as if it were a
conventional air pollutant, like soot and
smog.
The proposal would cap power plant
mercury emissions at 34 tons in 2010 and 15
tons in 2018, which represent 29% and 69%
reductions, respectively.
45
This means that
instead of being required to reduce mercury
emissions to five tons by 2008 – as would be
accomplished by faithful implementation of
the Clean Air Act – the Bush plan proposes to
allow power plants to emit six to seven times
more mercury for more than a decade
longer.
n
n
EPA’s proposal also would relieve the power sector
of any obligation to control other hazardous air
pollutants such as lead, arsenic, chromium, dioxin, acid
gases, and organic compounds, among others. See
National Environmental Trust, Beyond Mercury, August
Further, the administration’s own analysis
shows that even these weak targets would
not be met on EPA’s timeline, if ever.
46
In addition, the Bush administration’s plan
does not require each and every power
plant to make emissions reductions. Instead,
some plants would be able to avoid making
reductions by buying or trading mercury
pollution credits from other plants. Mercury
trading substantially increases the likelihood
and severity of “hotspots,” or communities
with high levels of mercury deposition.
47
This
is particularly troubling due to mercury’s
persistent, bio-accumulative properties.
Requiring plant-specific controls that
dramatically reduce mercury emissions, on
the other hand, would go a long way
towards solving local mercury problems. The
state of Florida, EPA, and the U.S.
Geological Survey recently issued a study
that concluded that the levels of mercury
found in largemouth bass and other wildlife
in the Everglades has declined by 80% since
state and federal agencies required
municipal and medical-waste incinerators to
cut their mercury emissions.
48
2004. State authorities cite some of these pollutants,
such as dioxin, arsenic and lead, as the reason for
issuing non-mercury fish consumption advisories.

Fishing for Trouble 22
Conclusion and Recommendations
nce mercury is in the food supply, it puts
all of our health at risk, but especially
sensitive subpopulations such as children and
recreational anglers who consume large
amounts of fish. The increasing number and
breadth of mercury advisories indicates the
vast extent of the mercury contamination
problem. In addition to compromising public
health, this pollution is a threat to
recreational fishing, a treasured American
pastime and multi-billion dollar industry that
is vital to our national and state economies.
The Bush administration’s proposal for
dealing with mercury emissions from power
plants is severely flawed. The Bush
administration should abandon its current
mercury plan and faithfully implement the
Clean Air Act to reduce mercury emissions
from power plants by at least 90% from
existing levels by 2008.
O

Fishing for Trouble 23
Methodology
his report analyzes data reported to EPA
by the states in 2003. While the EPA
examines state advisory data nationally, it
does not provide analysis by state; in
addition, we have attempted to correct a
number of problems with EPA’s data. For the
most recent information on fish consumption
advisories for local waterways, refer to
EPA’s searchable database at
www.epa.gov/ost/fish/.
The data in this report do not necessarily
mirror similar data calculations by the states,
which may use different data and
methodologies. These data are intended to
be a general reference for the extent of
mercury contamination and should not be
relied upon for advice on fish consumption.
People should consult their state departments
of health to receive the most recent
information on how much locally-caught fish,
if any, can be safely consumed.
Data Source and Parameters: EPA provided
us with data on active mercury fish
consumption advisories for specific species in
all waterbodies between December 31,
2002 and December 31, 2003. Excluded
from the summary data in Appendix B, but
provided by EPA, are advisories issued by
territories.
Geographic Area of Waterbodies Under
Fish Consumption Advisory by State: This
report follows EPA’s methodology of using
the geographic area for each mercury
advisory as a proxy for extent of mercury
contamination. To determine the number of
miles/acres/square miles under advisory for
each type of waterbody in each state, we
grouped the data by state and waterbody
type, as classified by EPA, and totaled the
area covered by fish consumption advisory
for each waterbody type. Often a fish
consumption advisory for a specific
waterbody contains consumption advice for
different fish species of varying sizes. To
avoid double counting the acreage or
mileage of a waterbody under advisory, we
only included a specific waterbody or
segment of waterbody once in our
calculations, regardless of the number of
species or variations under advisory for that
particular waterbody. We also did not
include “no restriction” advisories in our
calculations for the extent of advisory
coverage.
Number of Advisories by State: We
followed EPA’s methodology of counting the
number of waterbodies or segments of
waterbodies, or in some cases waterbody
types (e.g., all lakes), covered by advisories.
While EPA continues to calculate this number,
it no longer uses it as the primary measure of
the geographic extent of mercury
contamination. Because a state can issue an
advisory for as little as a single portion of a
small waterbody and as much every
waterbody of a particular type in a state
(e.g., all lakes), an “advisory” is not useful as
a proxy for the geographic extent of
contamination.
Statewide Advisories: Statewide advisories
are issued for specific waterbody types
(e.g., all lakes) or apply to the entire state
for specific fish species and species for
specific sizes. For states with lakes and/or
rivers under statewide advisory, EPA
provided us with data for each state’s total
lake acres and/or river miles under
advisory.
Increases in River Miles and Lake Acres
Under Advisory in Each State: To calculate
T
Fishing for Trouble 24
the total increase in lake acres and/or river
miles under advisory between 2002 and
2003, we looked only at advisories issued
for new waterbodies or new parts of
waterbodies in 2003. In previous years, a
state may have failed to report the extent of
a waterbody under advisory; if the state
reported that extent for the first time in
2003, we did not include this in our totals
when calculating the extent of the advisories
issued in 2003.
We did, however, ensure that we included
these completed advisories in the total river
miles and lake acres covered by advisories
in 2002 in order to accurately calculate the
percent increase in 2003.
New Restrictions Added to Old Advisories:
In addition, we analyzed new advisories
issued in 2003 that strengthened advisories
already in place. We defined “new
restrictions” on advisories already in place
as those adding a new fish to the advisory,
warning more people to limit their fish
consumption, or advising people to eat less
of the fish under advisory.
Data Gaps and Limitations: There are
several important gaps in the data EPA
provided.
• For a number of advisories, states failed to
include data on the acreage or number of
miles of a waterbody under advisory. Thus,
the calculation for geographic area under
advisory by state is likely an underestimate
of the true geographic area under advisory.
• Some of the EPA data for advisories is
missing units (e.g., acres or miles). For
purposes of the summary data in this report,
we assumed that if a state listed its other
advisories for a specific waterbody type
(e.g., lakes) using specific units (e.g., acres),
that the state used the same unit for that
type of waterbody across the state.
Comparing States: Because of the lack of
uniform procedures for testing for mercury
contamination across states or uniform
standards for issuing advisories, it is not
possible to say that the top ranked states for
the number of fish advisories correspond to
the states with the most mercury
contamination. Some states are far more
precautionary than others for the standard
they use for fish contamination, the amount of
monitoring of fish within waterbodies, and
the amount of testing done before a fish
advisory is issued.

Fishing for Trouble 25
Appendix A. High Mercury Levels in Commercial Fish
and Seafood Not Covered by FDA’s 2004 Consumption
Advisory, 1978-2003
o
Species
Mean
(ppm)
Minimum
(ppm)
Maximum
(ppm)
Consumption
Limit (Meals
Per Month)
GROUPER 0.55 0.07 1.21 1
ORANGE ROUGHY 0.54 0.30 0.80 1
MARLIN 0.49 0.10 0.92 1
MACKEREL SPANISH (Gulf of Mexico) 0.45 0.07 1.56 2
BLUEFISH 0.31 0.14 0.63 3
LOBSTER (Northern/American) 0.31 0.05 1.31 3
CROAKER WHITE (Pacific) 0.29 0.18 0.41 3
SCORPIONFISH 0.29 0.02 1.35 3
BASS (Saltwater) 0.27 0.06 0.96 3
HALIBUT 0.26 ND 1.52 3
WEAKFISH (Sea Trout) 0.25 ND 0.74 3
SABLEFISH 0.22 ND 0.70 4
BUFFALO FISH 0.19 0.05 0.43 4
SNAPPER 0.19 ND 1.37 4
MACKEREL SPANISH (S. Atlantic) 0.18 0.05 0.73 5
MONKFISH 0.18 0.02 1.02 5
CARP 0.14 0.01 0.27 6
PERCH (Freshwater) 0.14 ND 0.31 6
SKATE 0.14 0.04 0.36 6
SHEEPSHEAD 0.13 0.02 0.63 7
TUNA (LIGHT CANNED) 0.12 ND 0.85 7
JACKSMELT 0.11 0.04 0.05 8
COD 0.11 ND 0.42 8
ND = Non-detectable
Source: Analysis of data provided by U.S. FDA, “Mercury Levels in Seafood Species,” 19 March
2004, downloaded from http://www.cfsan.fda.gov/~frf/sea-mehg.html, 27 September 2004.
o
This list does not include albacore tuna, shark, swordfish, tilefish, or king mackerel, which are included in FDA’s
2004 consumption advisory. FDA advises women who may become pregnant, pregnant women, nursing mothers,
and young children not to eat shark, swordfish, king mackerel, or tilefish because they contain high levels of
mercury.

Fishing for Trouble 26
Appendix B. State-by-State Mercury Advisory Totals
and Money Spent on Recreational Fishing
State
# of
Mercury
Advisories
Lake
Acres
Under
Specific
Advisory
Lake
Acres
Under
Statewide
Advisory
Total
Lake
Acres
River Miles
Under
Specific
Advisory
River
Miles
Under
Statewide
Advisory
Total
River
Miles
Total Spent on
Recreational
Fishing in State,
2001
AL 17 6 0 6 271 0 271 $723,467,000
AR 20 3,659 0 3,659 260 0 260 $445,778,000
AZ 10 3,504 0 3,504 0 0 0 $336,293,000
CA 23 70,216 0 70,216 70 0 70 $2,029,581,000
CO 5 17,105 0 17,105 0 0 0 $645,891,000
CT 11 Statewide 64,973 64,973 Statewide 5,830 5,830 $224,139,000
DE 3 79 0 79 0 0 0 $69,956,000
FL 65 Statewide 2,085,120 2,085,120 Statewide 51,858 51,858 $4,083,409,000
GA 123 41,079 0 41,079 2,587 0 2,587 $543,504,000
HI 1* 0 0 0 0 0 0 $107,002,000
ID 7 48,846 0 48,846 0 0 0 $310,872,000
IL 10 Statewide 309,340 309,340 Statewide 32,190 32,190 $598,376,000
IN 172 54,038 0 54,038 Statewide 35,673 35,673 $518,863,000
KY 6 Statewide 228,385 228,385 Statewide 89,431 89,431 $544,660,000
LA 36 24,460 0 24,460 915 0 915 $703,373,000
MA 99 Statewide 151,173 151,173 Statewide 8,229 8,229 $464,991,000
MD 1 Statewide 77,965 77,965 Statewide 17,000 17,000 $480,185,000
ME 4 Statewide 986,776 986,776 Statewide 31,672 31,672 $250,939,000
MI 91 Statewide 887,019 887,019 521 0 521 $838,558,000
MN 1,110 Statewide 3,290,101 3,290,101 4,144 0 4,144 $1,284,522,000
MO 1 Statewide 288,315 288,315 Statewide 51,015 51,015 $745,514,000
MS 11 35,324 0 35,324 264 0 264 $210,697,000
MT 28 Statewide 844,802 844,802 Statewide 176,750 176,750 $292,050,000
NC 2 227,164 0 227,164 4,361 0 4,361 $1,118,028,000
ND 5 Statewide 632,016 632,016 Statewide 11,868 11,868 $159,023,000
NE 20 4,666 0 4,666 144 0 144 $146,359,000
NH 7 Statewide 163,012 163,012 Statewide 10,881 10,881 $164,634,000
NJ 85 Statewide 24,000 24,000 Statewide 6,450 6,450 $699,826,000
NM 26 29,519 0 29,519 93 0 93 $176,476,000
NV 2 23 0 23 549 0 549 $216,721,000
NY 39 74,875 0 74,875 155 0 155 $1,073,019,000
OH 40 Statewide 188,461 188,461 Statewide 29,113 29,113 $761,619,000
OR 12 16,058 0 16,058 460 0 460 $601,780,000
PA 77 Statewide 161,445 161,445 Statewide 53,962 53,962 $580,351,000
RI 9 Statewide 17,328 17,328 Statewide 1,106 1,106 $105,649,000
SC 62 45,804 0 45,804 1,749 0 1,749 $558,731,000
SD 4 10,219 0 10,219 0 0 0 $182,480,000
TN 2 0 0 0 6 0 6 $480,221,000
TX 12 329,784 0 329,784 2 0 2 $1,950,902,000
VA 6 0 0 0 134 0 134 $517,802,000

Fishing for Trouble 27
State
# of
Mercury
Advisories
Lake
Acres
Under
Specific
Advisory
Lake
Acres
Under
Statewide
Advisory
Total
Lake
Acres
River Miles
Under
Specific
Advisory
River
Miles
Under
Statewide
Advisory
Total
River
Miles
Total Spent on
Recreational
Fishing in State,
2001
VT 10 Statewide 228,383 228,383 Statewide 5,264 5,264 $92,536,000
WA 4 Statewide 466,296 466,296 Statewide 73,886 73,886 $853,761,000
WI 85 Statewide 982,163 982,163 Statewide 57,698 57,698 $1,005,149,000
WV 1 0 0 0 310 0 310 $102,281,000
Total Active Advisories in U.S. in 2003 2,364
Total Lake Acres (Including Statewide Advisories) 13,113,501
Total River Miles (Including Statewide Advisories) 766,871
Total Dollars Spent on Recreational Fishing in States with Mercury Advisories, 2001 $27,999,968,000
* Hawaii’s only advisory is a statewide advisory for its 930 miles of coastline.

Fishing for Trouble 28
Appendix C. Mercury Air Emissions from Power Plants
by State or Territory, 2002
State
Emissions
(lbs)
State
Emissions
(lbs)
Texas 9815
New Mexico 1210
Ohio 7358
New York 1182
Pennsylvania 7002
Montana 875
Indiana 4927
Arkansas 820
Illinois 4318
South Carolina 674
Alabama 3931
Mississippi 651
West Virginia 3680
Nevada 524
Kentucky 3540
New Jersey 477
North Carolina 3434
Utah 454
Missouri 3084
Nebraska 414
Georgia 2749
Colorado 356
Wisconsin 2615
Hawaii 280
Michigan 2589
Delaware 266
Florida 2411
Washington 265
North Dakota 2365
South Dakota 263
Iowa 2132
Puerto Rico 212
Tennessee 2130
Massachusetts 190
Kansas 2048
Virgin Islands 171
Maryland 1900
Oregon 143
Wyoming 1762
Connecticut 100
Minnesota 1572
California 16
Arizona 1561
New Hampshire 16
Virginia 1290
Alaska 11
Louisiana 1262
Oklahoma 1255
Total 90,300
Source: U.S. EPA, 2002 Toxics Release Inventory, downloaded from www.epa.gov/triexplorer
27 September 2004.

Fishing for Trouble 29
Appendix D. Mercury Air Emissions by Power Plant,
2002
Facility State City
County or County
Equivalent
Air
Emissions
(lbs)
LIMESTONE ELECTRIC GENERATING STATION TX JEWETT LIMESTONE 1,800
TXU MONTICELLO STEAM ELECTRIC STATION &
LIGNITE MINE
TX MOUNT PLEASANT TITUS 1,324
AMERICAN ELECTRIC POWER CONESVILLE
PLANT OH CONESVILLE COSHOCTON 1,300
RELIANT ENERGY KEYSTONE POWER PLANT PA SHELOCTA ARMSTRONG 1,235
JEFFREY ENERGY CENTER KS SAINT MARYS POTTAWATOMIE 1,216
W.A. PARISH ELECTRIC GENERATING STATION TX THOMPSONS FORT BEND 1,100
ALABAMA POWER CO MILLER STEAM PLANT AL QUINTON JEFFERSON 1,077
MARTIN LAKE STEAM ELECTRIC STATION &
LIGNITE MINE
TX TATUM RUSK 1,027
AMERICAN ELECTRIC POWER H.W. PIRKEY
POWER PLANT TX HALLSVILLE HARRISON 1,000
GEORGIA POWER SCHERER STEAM ELECTRIC
GENERATING PLANT
GA JULIETTE MONROE 943
BIG CAJUN 2 LA NEW ROADS POINTE COUPEE 880
NORTHERN STATES POWER CO. MN BECKER SHERBURNE 876
J. M. STUART STATION OH MANCHESTER ADAMS 845
PLEASANT PRAIRIE POWER PLANT WI KENOSHA KENOSHA 838
GREAT RIVER ENERGY COAL CREEK STATION ND UNDERWOOD MC LEAN 833
L.C.R.A. FAYETTE POWER PROJECT TX LA GRANGE FAYETTE 811
ALABAMA POWER CO GASTON STEAM PLANT AL WILSONVILLE SHELBY 807
AMERICAN ELECTIC POWER ROCKPORT PLANT IN ROCKPORT SPENCER 800
AMERICAN ELECTRIC POWER AMOS PLANT WV WINFIELD PUTNAM 790
BRUCE MANSFIELD PA SHIPPINGPORT BEAVER 790
AMERENUE LABADIE POWER PLANT MO LABADIE FRANKLIN 763
COLSTRIP STEAM ELECTRIC STATION MT COLSTRIP ROSEBUD 760
DUKE ENERGY BELEWS CREEK STEAM STATION NC BELEWS CREEK STOKES 730
BRANDON SHORES & WAGNER COMPLEX MD BALTIMORE BALTIMORE CITY 709
U.S. TVA PARADISE FOSSIL PLANT KY DRAKESBORO MUHLENBERG 700
GEORGIA POWER BOWEN STEAM ELECTRIC
GENERATING PLANT GA CARTERSVILLE BARTOW 697
PROGRESS ENERGY CAROLINAS INC ROXBORO
STEAM ELECTRIC PLANT
NC SEMORA PERSON 670
WHITE BLUFF GENERATING PLANT AR REDFIELD JEFFERSON 670
AMERICAN ELECTRIC POWER GAVIN PLANT OH CHESHIRE GALLIA 660
O.W. SOMMERS /J.T. DEELY/J.K. SPRUCE
GENERATING COMPLEX
TX SAN ANTONIO BEXAR 636

Fishing for Trouble 30
Facility State City
County or County
Equivalent
Air
Emissions
(lbs)
RELIANT ENERGY SHAWVILLE STATION PA SHAWVILLE CLEARFIELD 632
DUKE ENERGY MARSHALL STEAM STATION NC TERRELL CATAWBA 621
DETROIT EDISON MONROE POWER PLANT MI MONROE MONROE 618
CINERGY GIBSON GENERATING STATION IN PRINCETON GIBSON 595
TUCSON ELECTRIC POWER SPRINGERVILLE
GENERATING STATION AZ SPRINGERVILLE APACHE 592
SAN JUAN GENERATING STATION NM WATERFLOW SAN JUAN 591
FOUR CORNERS STEAM ELECTRIC STATION NM FRUITLAND SAN JUAN 591
AMERICAN ELECTRIC POWER CARDINAL PLANT OH BRILLIANT JEFFERSON 560
EME HOMER CITY GENERATION L P PA HOMER CITY INDIANA 545
W. H. SAMMIS PLANT OH STRATTON JEFFERSON 540
EDISON INTL. POWERTON GENERATING
STATION
IL PEKIN TAZEWELL 527
MILTON R YOUNG STATION ND CENTER OLIVER 502
AMERENUE RUSH ISLAND POWER PLANT MO FESTUS JEFFERSON 502
PACIFICORP DAVE JOHNSTON PLANT WY GLENROCK CONVERSE 498
RELIANT ENERGY CONEMAUGH POWER PLANT PA NEW FLORENCE INDIANA 496
IPL PETERSBURG IN PETERSBURG PIKE 493
WP & L COLUMBIA ENERGY CENTER WI PARDEEVILLE COLUMBIA 491
PROGRESS ENERGY CRYSTAL RIVER ENERGY
COMPLEX
FL CRYSTAL RIVER CITRUS 491
U.S. TVA KINGSTON FOSSIL PLANT TN HARRIMAN ROANE 480
SOUTHERN CO BARRY STEAM PLANT AL BUCKS MOBILE 476
R.M. SCHAHFER GENERATING STATION IN WHEATFIELD JASPER 470
ST. JOHNS RIVER POWER PARK/NORTHSIDE
GENERATING STATION
FL JACKSONVILLE DUVAL 465
PACIFICORP JIM BRIDGER PLANT & BRIDGER
COAL CO WY POINT OF ROCKS SWEETWATER 461
AMERICAN ELECTRIC POWER WELSH POWER
PLANT TX PITTSBURG CAMP 450
JOLIET GENERATING STATION (#9 & #29) IL JOLIET WILL 431
MIRANT CHALK POINT GENERATING STATION MD AQUASCO PRINCE GEORGES 428
DYNEGY MIDWEST GENERATION INC BALDWIN
ENERGY COMPLEX IL BALDWIN RANDOLPH 427
BIG BROWN STEAM ELECTRIC STATION &
LIGNITE MINE
TX FAIRFIELD FREESTONE 424
FORT MARTIN POWER STATION WV MAIDSVILLE MONONGALIA 421
ALLEGHENY ENERGY INC HATFIELD POWER
STATION
PA MASONTOWN GREENE 421
BASIN ELECTRIC POWER CO-OP ANTELOPE
VALLEY STATION ND BEULAH MERCER 420
ALABAMA POWER CO GORGAS STEAM PLANT AL PARRISH WALKER 417
U.S. TVA CUMBERLAND FOSSIL PLANT TN CUMBERLAND CITY STEWART 410
BASIN ELECTRIC POWER CO-OP LARAMIE RIVER
STATION WY WHEATLAND PLATTE 410
LACYGNE GENERATING STATION KS LA CYGNE LINN 400

Fishing for Trouble 31
Facility State City
County or County
Equivalent
Air
Emissions
(lbs)
RELIANT ENERGY AVON LAKE POWER PLANT OH AVON LAKE LORAIN 398
KENTUCKY UTILITIES CO GHENT STATION KY GHENT CARROLL 393
DOMINION MOUNT STORM POWER STATION WV MOUNT STORM GRANT 390
AMERICAN ELECTRIC POWER MOUNTAINEER
PLANT WV NEW HAVEN MASON 390
KYGER CREEK STATION OH CHESHIRE GALLIA 390
MIRANT MORGANTOWN GENERATING
STATION MD NEWBURG CHARLES 387
EDISON MOHAVE GENERATING STATION NV LAUGHLIN CLARK 386
AMEREN ENERGY GENERATING NEWTON
POWER STATION
IL NEWTON JASPER 377
J H CAMPBELL GENERATING PLANT MI WEST OLIVE OTTAWA 370
DOMINION KINCAID GENERATION LLC IL KINCAID CHRISTIAN 369
AN ELECTRIC POWER MUSKINGUM RIVER PLANT OH BEVERLY WASHINGTON 360
CINERGY ZIMMER GENERATING STATION OH MOSCOW CLERMONT 359
CHESTERFIELD POWER STATION VA CHESTER CHESTERFIELD 359
CINERGY MIAMI FORT GENERATING STATION OH NORTH BEND HAMILTON 356
WILL COUNTY GENERATING STATION IL ROMEOVILLE WILL 353
ELECTRIC ENERGY INC IL JOPPA MASSAC 351
U.S. TVA WIDOWS CREEK FOSSIL PLANT AL STEVENSON JACKSON 350
MIDAMERICAN ENERGY CO GEORGE NEAL
NORTH IA SERGEANT BLUFF WOODBURY 350
GEORGIA POWER WANSLEY STEAM ELECTRIC
GENERATING PLANT
GA ROOPVILLE HEARD 349
DAIRYLAND POWER COOPERATIVE ALMA SITE WI ALMA BUFFALO 349
GIBBONS CREEK STEAM ELECTRIC STATION TX CARLOS GRIMES 348
NAVAJO GENERATING STATION AZ PAGE COCONINO 348
CINERGY BECKJORD GENERATING STATION OH NEW RICHMOND CLERMONT 347
MOUNT CARMEL COGEN FACILITY PA MARION HEIGHTS NORTHUMBERLAND 327
LOUISVILLE GAS & ELECTRIC CO MILL CREEK
STATION KY LOUISVILLE JEFFERSON 327
AMERICAN ELECTRIC POWER TANNERS CREEK
PLANT
IN LAWRENCEBURG DEARBORN 320
EASTLAKE PLANT OH EASTLAKE LAKE 320
MIDAMERICAN ENERGY CO COUNCIL BLUFFS
ENERGY CENTER
IA COUNCIL BLUFFS POTTAWATTAMIE 320
OG&E MUSKOGEE GENERATING STATION OK FORT GIBSON MUSKOGEE 320
ALABAMA POWER CO GREENE COUNTY STEAM
PLANT
AL FORKLAND GREENE 317
SPURLOCK POWER STATION KY MAYSVILLE MASON 316
DETROIT EDISON CO BELLE RIVER POWER
PLANT MI CHINA TOWNSHIP ST CLAIR 311
OTTER TAIL POWER CO COYOTE STATION ND BEULAH MERCER 310
SUNBURY GENERATION LLC PA SHAMOKIN DAM SNYDER 309
GEORGIA POWER BRANCH STEAM ELECTRIC
GENERATING PLANT GA MILLEDGEVILLE PUTNAM 303
CLIFTY CREEK STATION IN MADISON JEFFERSON 300

Fishing for Trouble 32
Facility State City
County or County
Equivalent
Air
Emissions
(lbs)
U.S. TVA JOHN SEVIER FOSSIL PLANT TN ROGERSVILLE HAWKINS 300
PPL BRUNNER ISLAND STEAM ELECTRIC STATION PA YORK HAVEN YORK 298
ALLEGHENY ENERGY INC HARRISON POWER
STATION
WV HAYWOOD HARRISON 298
BOSWELL ENERGY CENTER MN COHASSET ITASCA 297
AMERICAN ELECTRIC POWER MITCHELL PLANT WV MOUNDSVILLE MARSHALL 290
MIDAMERICAN ENERGY GEORGE NEAL SOUTH IA SALIX WOODBURY 290
TWIN OAKS POWER L.P. TX BREMOND ROBERTSON 282
AMERICAN ELECTRIC POWER BIG SANDY PLANT KY LOUISA LAWRENCE 280
U.S. TVA BULL RUN FOSSIL PLANT TN CLINTON ANDERSON 280
ALCOA INC WARRICK OPERATIONS IN NEWBURGH WARRICK 280
MIDAMERICAN ENERGY CO LOUISA
GENERATING STATION
IA MUSCATINE LOUISA 280
NEW MADRID POWER PLANT MO MARSTON NEW MADRID 280
MONTOUR STEAM ELECTRIC STATION PA DANVILLE MONTOUR 277
LAWRENCE ENERGY CENTER KS LAWRENCE DOUGLAS 270
U.S. TVA JOHNSONVILLE FOSSIL PLANT TN NEW JOHNSONVILLE HUMPHREYS 270
TRANSALTA CENTRALIA GENERATION MINING WA CENTRALIA LEWIS 265
THOMAS HILL ENERGY CENTER - POWER DIV MO CLIFTON HILL RANDOLPH 263
AMERICAN ELECTRIC POWER PHILIP SPORN
PLANT
WV NEW HAVEN MASON 260
MAYO ELECTRIC GENERATING PLANT
PROGRESS ENERGY CAROLINA - NC ROXBORO PERSON 260
F.J. GANNON STATION FL TAMPA HILLSBOROUGH 260
DICKERSON GENERATING STATION MD DICKERSON MONTGOMERY 259
WAUKEGAN GENERATING STATION IL WAUKEGAN LAKE 257
DETROIT EDISON CO SAINT CLAIR POWER
PLANT MI
EAST CHINA
TOWNSHIP ST CLAIR 252
BIG STONE PLANT SD BIG STONE CITY GRANT 250
DUNKIRK STEAM STATION NY DUNKIRK CHAUTAUQUA 250
ALLEGHENY ENERGY INC ARMSTRONG POWER
STATION PA KITTANNING ARMSTRONG 247
NEW CASTLE POWER PLANT PA WEST PITTSBURG LAWRENCE 240
CONSUMER ENERGY DE KARN JC WEADOCK
GENERATING PLANT MI ESSEXVILLE BAY 240
HUNTLEY GENERATING STATION NY TONAWANDA ERIE 240
DOLET HILLS POWER STATION LA MANSFIELD DE SOTO 238
DUKE ENERY PLANT ALLEN NC BELMONT GASTON 238
OTTUMWA GENERATING STATION IA OTTUMWA WAPELLO 237
CORONADO GENERATING STATION AZ SAINT JOHNS APACHE 233
SANDOW STEAM ELECTRIC STATION TX ROCKDALE MILAM 230
GERALD GENTLEMAN STATION NE SUTHERLAND LINCOLN 230
U.S. TVA GALLATIN FOSSIL PLANT TN GALLATIN SUMNER 230
AMERICAN ELECTRIC POWER NORTHEASTERN
STATION OK OOLOGAH ROGERS 230
EDGEWATER GENERATING STATION WI SHEBOYGAN SHEBOYGAN 222

Fishing for Trouble 33
Facility State City
County or County
Equivalent
Air
Emissions
(lbs)
AMERICAN ELECTRIC POWER KAMMER PLANT WV MOUNDSVILLE MARSHALL 220
TRACTEBEL POWER INC. RED HILLS POWER
PLANT
MS ACKERMAN CHOCTAW 220
INTERMOUNTAIN POWER GENERATING
STATION
UT DELTA MILLARD 219
GRAND RIVER DAM AUTHORITY COAL FIRED
COMPLEX OK CHOUTEAU MAYES 218
AMERENUE SIOUX POWER PLANT MO WEST ALTON ST CHARLES 217
CHOLLA POWER PLANT AZ JOSEPH CITY NAVAJO 213
CINERGY CAYUGA GENERATING STATION IN CAYUGA VERMILLION 211
OKLAHOMA GAS & ELECTRIC CO SOONER
GENERATING STATION OK RED ROCK NOBLE 210
MEROM GENERATING STATION IN SULLIVAN SULLIVAN 210
RELIANT ENERGY NILES POWER PLANT OH NILES TRUMBULL 204
LOUISVILLE GAS & ELECTRIC CO TRIMBLE
COUNTY STATION KY BEDFORD TRIMBLE 204
DETROIT EDISON-TRENTON CHANNEL POWER
PLANT MI TRENTON WAYNE 202
REID/GREEN/HMP&L STATION II KY ROBARDS HENDERSON 199
STANTON ENERGY CENTER FL ORLANDO ORANGE 196
R. D. MORROW SR. GENERATING PLANT MS PURVIS LAMAR 193
SIKESTON POWER STATION MO SIKESTON SCOTT 191
U.S. TVA COLBERT FOSSIL PLANT AL TUSCUMBIA COLBERT 190
CHARLES R. LOWMAN POWER PLANT AL LEROY WASHINGTON 190
IATAN GENERATING STATION MO WESTON PLATTE 190
KENTUCKY UTILITIES CO E. W. BROWN
STATION
KY HARRODSBURG MERCER 188
CHESWICK POWER PLANT PA SPRINGDALE ALLEGHENY 187
GULF POWER CO PLANT CRIST FL PENSACOLA ESCAMBIA 186
OAK CREEK POWER PLANT WI OAK CREEK MILWAUKEE 185
WESTERN FARMERS ELECTRIC COOP OK HUGO CHOCTAW 183
BLACK RIVER POWER ELECTRIC GENERATING
FACILITY NY FORT DRUM JEFFERSON 181
WILLIAMS STATION - GENCO SC GOOSE CREEK BERKELEY 180
U.S. TVA SHAWNEE FOSSIL PLANT KY WEST PADUCAH MC CRACKEN 180
PACIFICORP WYODAK PLANT WY GILLETTE CAMPBELL 178
ALLEGHENY ENERGY INC PLEASANTS/WILLOW
ISLAND POWER STATIONS WV WILLOW ISLAND PLEASANTS 176
DAYTON POWER & LIGHT CO KILLEN STATION OH MANCHESTER ADAMS 175
AMEREN ENERGY GENERATING COFFEEN
POWER STATION IL COFFEEN MONTGOMERY 174
MORGANTOWN ENERGY ASSOCIATES WV MORGANTOWN MONONGALIA 172
BASIN ELECTRIC POWER CO-OP LELAND OLDS
STATION ND STANTON MERCER 170
CINERGY WABASH RIVER GENERATING
STATION
IN WEST TERRE HAUTE VIGO 169
AMERENUE MERAMEC POWER PLANT MO SAINT LOUIS SAINT LOUIS CITY 168

Fishing for Trouble 34
Facility State City
County or County
Equivalent
Air
Emissions
(lbs)
BREMO POWER STATION VA BREMO BLUFF FLUVANNA 168
GEORGIA POWER YATES STEAM ELECTRIC
GENERATING PLANT
GA NEWNAN COWETA 167
IPL HARDING STREET STATION IN INDIANAPOLIS MARION 163
CHESAPEAKE ENERGY CENTER VA CHESAPEAKE CHESAPEAKE CITY 160
AMERICAN ELECTRIC POWER CLINCH RIVER
PLANT
VA CLEVELAND RUSSELL 160
U.S. TVA ALLEN FOSSIL PLANT TN MEMPHIS SHELBY 160
AMERICAN ELECTRIC POWER OKLAUNION
POWER STATION
TX VERNON WILBARGER 160
RELIANT ENERGY SEWARD POWER PLANT PA NEW FLORENCE INDIANA 156
CRAWFORD GENERATING STATION IL CHICAGO COOK 153
ARIZONA ELECTRIC POWER COOPERATIVE INC AZ COCHISE COCHISE 151
HAWAIIAN ELECTRIC CO INC KAHE
GENERATING STATION
HI KAPOLEI HONOLULU 151
BIG BEND STATION FL APOLLO BEACH HILLSBOROUGH 150
AMERICAN ELECTRIC POWER FLINT CREEK
POWER PLANT
AR GENTRY BENTON 150
EDGE MOOR/HAY ROAD POWER PLANTS DE WILMINGTON NEW CASTLE 148
PSEG POWER LLC HUDSON GENERATING
STATION
NJ JERSEY CITY HUDSON 145
RODEMACHER POWER STATION LA LENA RAPIDES 144
MICHIGAN CITY GENERATING STATION IN MICHIGAN CITY LA PORTE 143
WATEREE STATION - S C E & G SC EASTOVER RICHLAND 143
EXELON FAIRLESS HILLS STEAM GENERATING
STATION
PA FAIRLESS HILLS BUCKS 141
PACIFICORP NAUGHTON PLANT WY KEMMERER LINCOLN 139
AMEREN ENERGY RESOURCES GENERATING
CO.
IL BARTONVILLE PEORIA 139
STATE LINE GENERATING LLC IN HAMMOND LAKE 138
BOARDMAN PLANT OR BOARDMAN MORROW 137
COOPER POWER STATION KY BURNSIDE PULASKI 137
CLIFFSIDE STEAM STATION NC MOORESBORO RUTHERFORD 137
ADM COGEN DECATUR IL DECATUR MACON 135
C.D. MCINTOSH JR. POWER PLANT FL LAKELAND POLK 131
PSEG POWER LLC MERCER GENERATING
STATION NJ
HAMILTON
TOWNSHIP MERCER 131
TRI-STATE GENERATION & TRANSMISSION
CRAIG STATION
CO CRAIG MOFFAT 130
MUSCATINE POWER & WATER GENERATION IA MUSCATINE MUSCATINE 130
AMERICAN ELECTRIC POWER COLETO CREEK
POWER PLANT
TX FANNIN GOLIAD 130
CP&L-L. V. SUTTON STEAM ELECTRIC PLANT NC WILMINGTON NEW HANOVER 130
PROGRESS ENERGY CAROLINAS INC ASHEVILLE
PLANT
NC ARDEN BUNCOMBE 129
B.L. ENGLAND GENERATING STATION NJ BEESLEYS POINT CAPE MAY 129
REID GARDNER GENERATING STATION NV MOAPA CLARK 128

Fishing for Trouble 35
Facility State City
County or County
Equivalent
Air
Emissions
(lbs)
ALLEGHENY ENERGY INC ALBRIGHT POWER
STATION
WV ALBRIGHT PRESTON 126
HAWTHORN GENERATING FACILITY MO KANSAS CITY JACKSON 125
USGEN NEW ENGLAND INC MA SOMERSET BRISTOL 124
PACIFICORP HUNTER PLANT UT CASTLE DALE EMERY 124
DETROIT EDISON RIVER ROUGE POWER PLANT MI RIVER ROUGE WAYNE 123
CINERGY EAST BEND GENERATING STATION KY UNION BOONE 122
MISSISSIPPI POWER CO PLANT DANIEL MS ESCATAWPA JACKSON 121
BAYSHORE PLANT OH OREGON LUCAS 120
MISSISSIPPI POWER CO PLANT WATSON MS GULFPORT HARRISON 117
RELIANT ENERGY PORTLAND POWER PLANT PA PORTLAND NORTHAMPTON 115
SIGECO A. B. BROWN GENERATING STATION IN MOUNT VERNON POSEY 114
COLEMAN KY HAWESVILLE HANCOCK 112
DUKE ENERGY RIVERBEND STEAM STATION NC MOUNT HOLLY GASTON 110
PROGRESS ENERGY CAROLINAS H. F. LEE
STEAM ELECTRIC PLANT NC GOLDSBORO WAYNE 110
R. E. BURGER PLANT OH SHADYSIDE BELMONT 110
MONTROSE GENERATING STATION MO CLINTON HENRY 110
CINERGY GALLAGHER GENERATING STATION IN NEW ALBANY FLOYD 109
GEORGIA POWER HAMMOND STEAM ELECTRIC
GENERATING PLANT
GA ROME FLOYD 109
EDDYSTONE GENERATING STATION PA EDDYSTONE DELAWARE 106
LGE ENERGY WILSON STATION KY CENTERTOWN OHIO 104
EXCEL ENERGY RIVERSIDE GENERATING PLANT MN MINNEAPOLIS HENNEPIN 104
LANSING BOARD OF WATER & LIGHT ECKERT MI LANSING INGHAM 102
SIGECO F B CULLEY GENERATING STATION IN NEWBURGH WARRICK 100
DOMINION RESOURCES INC YORKTOWN
POWER STATION
VA YORKTOWN YORK 100
POSSUM POINT POWER STATION VA DUMFRIES PRINCE WILLIAM 100
GREAT RIVER ENERGY STANTON STATION ND STANTON MERCER 100
SAMUEL CARLSON GENERATING STATION NY JAMESTOWN CHAUTAUQUA 99
AMERICAN ELECTRIC POWER KANAWHA RIVER
PLANT WV GLASGOW KANAWHA 99
WP & L NELSON DEWEY GENERATING
STATION
WI CASSVILLE GRANT 99
DAIRYLAND POWER CO-OP GENOA SITE WI GENOA VERNON 97
RAWHIDE ENERGY STATION CO WELLINGTON LARIMER 96
RICHARD H GORSUCH STATION OH MARIETTA WASHINGTON 95
MCDONOUGH/ATKINSON STEAM ELECTRIC
GENERATING PLANT GA SMYRNA COBB 95
AES SHADY POINT LLC OK PANAMA LE FLORE 94
IP&L - BURLINGTON GENERATING STATION IA BURLINGTON DES MOINES 93
TAMPA ELECTRIC CO POLK POWER STATION FL MULBERRY POLK 91
RUSSELL STATION NY ROCHESTER MONROE 91
PRESQUE ISLE POWER PLANT MI MARQUETTE MARQUETTE 90
BAILLY GENERATING STATION IN CHESTERTON PORTER 90

Fishing for Trouble 36
Facility State City
County or County
Equivalent
Air
Emissions
(lbs)
DUKE ENERGY BUCK STEAM STATION NC SALISBURY ROWAN 89
TECUMSEH ENERGY CENTER KS TECUMSEH SHAWNEE 88
WPS WESTON POWER PLANT WI ROTHSCHILD MARATHON 88
VIRGIN ISLANDS WATER AND POWER
AUTHORITY VI SAINT THOMAS ST THOMAS 86
ALABAMA POWER CO GADSDEN STEAM PLANT AL GADSDEN ETOWAH 85
ADM CORN PROCESSING IA CEDAR RAPIDS LINN 85
VIRGIN ISLANDS WATER AND POWER
AUTHORITY VI CHRISTIANSTED ST CROIX 85
BC COBB GENERATING PLANT MI MUSKEGON MUSKEGON 85
DYNERGY HAVANA POWER STATION IL HAVANA MASON 85
GAINESVILLE REGIONAL UTILITIES DEERHAVEN
GENERATING STATION FL GAINESVILLE ALACHUA 84
CANADYS STATION SC CANADYS COLLETON 84
C.P. CRANE GENERATING STATION MD BALTIMORE BALTIMORE CITY 82
SEMINOLE GENERATING STATION FL PALATKA PUTNAM 82
DYNEGY WOOD RIVER POWER STATION IL ALTON MADISON 81
LOUISVILLE GAS & ELECTRIC CO CANE RUN
STATION
KY LOUISVILLE JEFFERSON 81
WPS PULLIAM POWER PLANT WI GREEN BAY BROWN 81
JR WHITING GENERATING PLANT MI ERIE MONROE 80
FISK GENERATING STATION IL CHICAGO COOK 80
PROGRESS ENERGY CAROLINAS CAPE FEAR
STEAM ELECTRIC PLANT
NC MONCURE CHATHAM 79
SIBLEY GENERATING STATION MO SIBLEY JACKSON 79
DALE POWER STATION KY WINCHESTER CLARK 79
HOOSIER ENERGY FRANK E. RATTS
GENERATING STATION
IN PETERSBURG PIKE 78
IPL EAGLE VALLEY IN MARTINSVILLE MORGAN 77
NRG ENERGY INC INDIAN RIVER GENERATING
STATION
DE MILLSBORO SUSSEX 73
RELIANT ENERGY TITUS POWER PLANT PA BIRDSBORO BERKS 72
DYNEGY HENNEPIN POWER STATION IL HENNEPIN PUTNAM 72
JAMES RIVER POWER STATION MO SPRINGFIELD GREENE 71
POTOMAC RIVER GENERATING STATION VA ALEXANDRIA ALEXANDRIA CITY 71
EXCEL ENERGY A. S. KING GENERATING PLANT MN BAYPORT WASHINGTON 70
PREPA AGUIRRE POWER GENERATION
COMPLEX PR AGUIRRE SALINAS 69
DANSKAMMER GENERATING FACILITY NY NEWBURGH ORANGE 69
LANSING POWER STATION IA LANSING ALLAMAKEE 69
AES SOMERSET LLC NY BARKER NIAGARA 67
EXCEL ENERGY HIGH BRIDGE GENERATING
PLANT MN SAINT PAUL RAMSEY 67
HAWAIIAN ELECTRIC CO INC WAIAU
GENERATING STATION HI PEARL CITY HONOLULU 67
SOUTHWEST POWER STATION MO BROOKLINE STATION GREENE 66
AMERICAN ELECTRIC POWER GLEN LYN PLANT VA GLEN LYN GILES 65

Fishing for Trouble 37
Facility State City
County or County
Equivalent
Air
Emissions
(lbs)
LEE STEAM STATION SC PELZER ANDERSON 64
ASHTABULA OH ASHTABULA ASHTABULA 63
GULF POWER CO PLANT LANSING SMITH FL SOUTHPORT BAY 62
M. L. KAPP GENERATING STATION IA CLINTON CLINTON 62
HOLCOMB UNIT 1 KS HOLCOMB FINNEY 62
AMEREN ENERGY GENERATING MEREDOSIA
POWER STATION
IL MEREDOSIA MORGAN 62
OWENSBORO MUNICIPAL UTILITIES ELMER
SMITH STATION KY OWENSBORO DAVIESS 61
RELIANT ENERGY INC ELRAMA POWER PLANT PA ELRAMA WASHINGTON 61
PPL J.E. CORETTE STEAM ELECTRIC STATION MT BILLINGS YELLOWSTONE 59
SOUTHERN ILLINOIS POWER COOPERATIVE IL MARION WILLIAMSON 56
AMEREN ENERGY RESOURCES GENERATING CO IL CANTON FULTON 55
VALLEY POWER PLANT WI MILWAUKEE MILWAUKEE 55
PLATTE GENERATING STATION NE GRAND ISLAND HALL 55
PRAIRIE CREEK GENERATING STATION IA CEDAR RAPIDS LINN 54
PROGRESS ENERGY CAROLINA'S INC H B
ROBINON S. E. P.
SC HARTSVILLE DARLINGTON 54
AES-CAYUGA LLC NY LANSING TOMPKINS 54
AES - PUERTO RICO COGENERATION PLANT PR GUAYAMA GUAYAMA 53
BLACK HILLS CORP NEIL SIMPSON COMPLEX WY GILLETTE CAMPBELL 52
SOUTHWESTERN PUBLIC SERVICE CO
HARRINGTON STATION TX AMARILLO POTTER 52
DYNEGY VERMILION POWER STATION IL OAKWOOD VERMILION 51
KENTUCKY UTILITIES CO GREEN RIVER STATION KY CENTRAL CITY MUHLENBERG 50
AES THAMES LLC CT UNCASVILLE NEW LONDON 50
PPL MARTINS CREEK STEAM ELECTRIC STATION PA BANGOR NORTHAMPTON 50
INTERSTATE POWER & LIGHT CO SUTHERLAND
STATION
IA MARSHALLTOWN MARSHALL 49
EXCEL ENERGY BLACK DOG GENERATING
PLANT MN BURNSVILLE DAKOTA 48
O. H. HUTCHINGS STATION OH MIAMISBURG MONTGOMERY 47
TACONITE HARBOR ENERGY CENTER MN SCHROEDER COOK 46
OMAHA PUBLIC POWER DISTRICT NEBRASKA
CITY STATION NE NEBRASKA CITY OTOE 45
AES BEAVER VALLEY LLC PA MONACA BEAVER 45
NRG ENERGY CENTER DOVER DE DOVER KENT 45
MITCHELL POWER STATION PA COURTNEY WASHINGTON 44
AES WESTOVER NY JOHNSON CITY BROOME 44
PORT WASHINGTON POWER PLANT WI PORT WASHINGTON OZAUKEE 43
LEWIS & CLARK STATION MT SIDNEY RICHLAND 43
LAKESHORE PLANT OH CLEVELAND CUYAHOGA 43
MIDAMERICAN ENERGY RIVERSIDE GENERATING
STATION IA BETTENDORF SCOTT 42
PACIFICORP CARBON PLANT UT HELPER CARBON 42

Fishing for Trouble 38
Facility State City
County or County
Equivalent
Air
Emissions
(lbs)
SOUTH CAROLINA ELECTRIC & GAS CO COPE
STATION
SC COPE ORANGEBURG 40
PROGRESS ENERGY CAROLINAS INC W.H.
WEATHERSPOON ELECTRIC NC LUMBERTON ROBESON 40
OMAHA PUBLIC POWER DISTRICT NORTH
OMAHA STATION
NE OMAHA DOUGLAS 39
AMEREN ENERGY GENERATING HUTSONVILLE
POWER STATION
IL HUTSONVILLE CRAWFORD 39
HUNLOCK CREEK ENERGY VENTURES
(FORMERLY UGI DEVELOPMENTCO.) PA HUNLOCK CREEK LUZERNE 39
SOUTHWESTERN PUBLIC SERVICE CO TOLK
STATION
TX SUDAN LAMB 38
PSEG POWER CONNECTICUT LLC BRIDGEPORT
HARBOR STATION
CT BRIDGEPORT FAIRFIELD 38
WPS WESTWOOD GENERATION LLC PA TREMONT SCHUYLKILL 37
AES-GREENIDGE LLC NY DRESDEN YATES 36
PACIFICORP HUNTINGTON PLANT UT HUNTINGTON EMERY 36
R. PAUL SMITH POWER STATION MD WILLIAMSPORT WASHINGTON 36
PREPA - SOUTH COAST POWER PLANT PR GUAYANILLA GUAYANILLA 35
RELIANT ENERGY WARREN STATION PA WARREN WARREN 35
SAVANNAH ELECTRIC PLANT KRAFT GA PORT WENTWORTH CHATHAM 34
COGENTRIX OF ROCKY MOUNT NC BATTLEBORO EDGECOMBE 33
SALEM HARBOR STATION/USGEN NEW
ENGLAND INC
MA SALEM ESSEX 33
WHITEWATER VALLEY GENERATING STATION IN RICHMOND WAYNE 33
CEDAR BAY GENERATING CO FL JACKSONVILLE DUVAL 32
OTTER TAIL POWER CO HOOT LAKE PLANT MN FERGUS FALLS OTTER TAIL 32
DEEPWATER GENERATING STATION NJ PENNSVILLE SALEM 31
CROMBY GENERATING STATION PA PHOENIXVILLE CHESTER 31
R.M. HESKETT STATION ND MANDAN MORTON 30
MAALAEA GENERATING STATION HI KIHEI MAUI 30
PREPA PALO SECO STEAM PLANT PR TOA BAJA TOA BAJA 29
TRI-STATE GENERATION & TRANSMISSION
ESCALANTE STATION
NM PREWITT MC KINLEY 29
SAVANNAH ELECTRIC PLANT MCINTOSH GA RINCON EFFINGHAM 28
ALLEGHENY ENERGY INC RIVESVILLE POWER
STATION
WV RIVESVILLE MARION 28
DUKE ENERGY DAN RIVER STEAM STATION NC EDEN ROCKINGHAM 28
LANSING BOARD OF WATER & LIGHT
ERICKSON MI LANSING INGHAM 28
INDIANTOWN COGENERATION LP FL INDIANTOWN MARTIN 27
EBENSBURG POWER CO PA EBENSBURG CAMBRIA 26
CITY WATER LIGHT & POWER CITY OF
SPRINGFIELD IL SPRINGFIELD SANGAMON 26
CINERGY EDWARDSPORT GENERATING
STATION IN EDWARDSPORT KNOX 25

Fishing for Trouble 39
Facility State City
County or County
Equivalent
Air
Emissions
(lbs)
JAMES RIVER COGENERATION CO INC VA HOPEWELL HOPEWELL CITY 25
CITY OF PAINESVILLE POWER PLANT OH PAINESVILLE LAKE 25
AMERICAN ELECTRIC POWER PICWAY PLANT OH LOCKBOURNE PICKAWAY 25
URQUHART STATION SC BEECH ISLAND AIKEN 25
MIRANT LOVETT GENERATING STATION NY TOMKINS COVE ROCKLAND 25
IRVINGTON GENERATING STATION AZ TUCSON PIMA 24
FLORIDA POWER & LIGHT CO MARTIN POWER
PLANT
FL INDIANTOWN MARTIN 24
BONANZA POWER PLANT UT VERNAL UINTAH 24
MITCHELL STEAM ELECTRIC GENERATING PLANT GA ALBANY DOUGHERTY 24
BLACK HILLS CORP OSAGE POWER PLANT WY OSAGE WESTON 24
CITY OF FREMONT DEPARTMENT OF UTILITIES
LON D. WRIGHT POWER
NE FREMONT DODGE 23
COMMONWEALTH CHESAPEAKE POWER
STATION
VA NEW CHURCH ACCOMACK 22
FLORIDA CRUSHED STONE CO. CPL FL BROOKSVILLE HERNANDO 22
XCEL ENERGY - WISCONSIN (FRENCH ISLAND) WI LA CROSSE LA CROSSE 22
MOBILE ENERGY SERVICES LLC AL MOBILE MOBILE 22
MIRANT CANAL LLC MA SANDWICH BARNSTABLE 22
PUBLIC SERVICE CO OF COLORADO
COMANCHE STATION
CO PUEBLO PUEBLO 21
ASBURY GENERATING STATION MO ASBURY JASPER 21
ALLIANT ENERGY INTERSTATE POWER LIGHT
6TH ST. GENERATING STA
IA CEDAR RAPIDS LINN 21
AMERICAN BITUMINOUS POWER PARTNERS LP WV GRANT TOWN MARION 20
CITY OF AMES IA AMES STORY 19
PUBLIC SERVICE CO OF COLORADO PAWNEE
STATION
CO BRUSH MORGAN 19
LASKIN ENERGY CENTER MN HOYT LAKES ST LOUIS 19
PROGRESS ENERGY FLORIDA INC ANCLOTE
POWER PLANT
FL HOLIDAY PASCO 19
RAY D. NIXON POWER PLANT CO FOUNTAIN EL PASO 18
MANITOWOC PUBLIC UTILITIES WI MANITOWOC MANITOWOC 18
TUSCOLA GENERATING FACILITY IL TUSCOLA DOUGLAS 18
COGENTRIX OF NORTH CAROLINA SOUTHPORT NC SOUTHPORT BRUNSWICK 18
MARQUETTE BOARD OF LIGHT & POWER MI MARQUETTE MARQUETTE 18
SCANA D-AREA SAVANNAH RIVER FACILITY SC AIKEN BARNWELL 18
COLORADO SPRINGS UTILTITIES MARTIN DRAKE
POWER PLANT CO COLORADO SPRINGS EL PASO 17
SOUTH CAROLINA ELECTRIC & GAS CO
MCMEEKIN STATION
SC COLUMBIA LEXINGTON 17
DUBUQUE POWER PLANT IA DUBUQUE DUBUQUE 16
AQUILA LAKE ROAD STATION MO SAINT JOSEPH BUCHANAN 16
GRAND HAVEN BOARD OF LIGHT & POWER MI GRAND HAVEN OTTAWA 16
NORTHERN STATES POWER CO. - WISCONSIN
(BAY FRONT) WI ASHLAND ASHLAND 16

Fishing for Trouble 40
Facility State City
County or County
Equivalent
Air
Emissions
(lbs)
BERGEN GENERATING STATION NJ RIDGEFIELD BERGEN 15
CROSS GENERATING STATION SC PINEVILLE BERKELEY 15
MAUI ELECTRIC CO. LTD. KAHULUI GENERATING
STATION
HI KAHULUI MAUI 15
PREPA SAN JUAN STEAM PLANT PR PUERTO NUEVO SAN JUAN 15
HOPEWELL COGENERATION FACILITY VA HOPEWELL PRINCE GEORGE 15
CAMBRIA COGEN CO PA EBENSBURG CAMBRIA 14
CHAMOIS POWER PLANT MO CHAMOIS OSAGE 14
RELIANT ENERGY ASTORIA GENERATING
STATION NY ASTORIA QUEENS 14
FPL FORT LAUDERDALE POWER PLANT FL FORT LAUDERDALE BROWARD 14
CENTRAL IOWA POWER COOPERATIVE (CIPCO)
- FAIR STATION IA MUSCATINE MUSCATINE 14
PG&E INTL ENERGY GROUP NORTHAMPTON
GENERATING PLANT
PA NORTHAMPTON NORTHAMPTON 13
JEFFERIES GENERATING STATION SC MONCKS CORNER BERKELEY 13
DOMINION CLOVER POWER STATION VA CLOVER HALIFAX 13
WINYAH GENERATING STATION SC GEORGETOWN GEORGETOWN 13
PUBLIC SERVICE CO OF COLORADO ARAPAHOE
STATION CO DENVER DENVER 13
TRI-STATE GENERATION & TRANSMISSION -
NUCLA STATION
CO NUCLA MONTROSE 13
COLSTRIP ENERGY LP ROSEBUD POWER PLANT MT COLSTRIP ROSEBUD 13
EAGLE POINT COGENERATION PARTN ERSHIP
(EPCP)
NJ WESTVILLE GLOUCESTER 13
HAWAII ELECTRIC LIGHT CO INC HILL
GENERATING STATION HI HILO HAWAII 13
MICHIGAN SOUTH CENTRAL POWER AGENCY MI LITCHFIELD HILLSDALE 13
BLACK HILLS CORP BEN FRENCH POWER PLANT SD RAPID CITY PENNINGTON 13
GULF POWER CO PLANT SCHOLZ FL SNEADS JACKSON 13
POSDEF POWER CO LP CA STOCKTON SAN JOAQUIN 12
NEBRASKA PUBLIC POWER DISTRICT SHELDON
STATION
NE HALLAM LANCASTER 12
VANDOLAH POWER PROJECT FL WAUCHULA HARDEE 12
NEW HAVEN HARBOR STATION CT NEW HAVEN NEW HAVEN 12
FLORIDA POWER & LIGHT CO FORT MYERS
POWER PLANT
FL FORT MYERS LEE 12
COGENTRIX OF RICHMOND INC VA RICHMOND RICHMOND CITY 12
COGENTRIX VIRGINIA LEASING CORP VA PORTSMOUTH PORTSMOUTH CITY 12
WYANDOTTE DEPARTMENT OF MUNICIPAL
SERVICES-POWER PLANT
MI WYANDOTTE WAYNE 11
GOLDEN VALLEY ELECTRIC ASSOCIATES INC
HEALY POWER PLANT AK HEALY DENALI 11
MADISON GAS & ELECTRIC CO WI MADISON DANE 11
MERRIMACK STATION NH BOW MERRIMACK 11
HARDEE POWER STATION FL BOWLING GREEN HARDEE 11

Fishing for Trouble 41
Facility State City
County or County
Equivalent
Air
Emissions
(lbs)
CINERGY NOBLESVILLE GENERATING STATION IN NOBLESVILLE HAMILTON 10
SUNNYSIDE COGENERATION ASSOCIATES UT SUNNYSIDE CARBON 10
NORTH VALMY STATION NV VALMY HUMBOLDT 10
RIVERTON GENERATING STATION KS RIVERTON CHEROKEE 10
PREPA CAMBALACHE COMBUSTION TURBINE
PLANT PR ARECIBO ARECIBO 10
KEYSPAN ENERGY NORTHPORT POWER
STATION NY NORTHPORT SUFFOLK 10
FLORIDA POWER & LIGHT CO SANFORD
POWER PLANT
FL DE BARY VOLUSIA 10
WHELAN ENERGY CENTER NE HASTINGS ADAMS 10
PROGRESS ENERGY FLORIDA INC PL BARTOW
PLANT
FL SAINT PETERSBURG PINELLAS 9
PSEG-BURLINGTON GENERATING STATION NJ BURLINGTON BURLINGTON 9
PUBLIC SERVICE CO OF COLORADO CHEROKEE
STATION CO DENVER ADAMS 9
ESCANABA GENERATING STATION MI ESCANABA DELTA 9
DETROIT EDISON CO HARBOR BEACH POWER
PLANT MI HARBOR BEACH HURON 9
PUBLIC SERVICE CO OF COLORADO HAYDEN
STATION
CO HAYDEN ROUTT 8
INDIAN RIVER POWER PLANT FL TITUSVILLE BREVARD 8
SHELBY MUNICIPAL LIGHT PLANT OH SHELBY RICHLAND 8
AUSTIN UTILITIES NORTHEAST POWER STATION MN AUSTIN MOWER 7
HOLLAND BPW JAMES DE YOUNG
GENERATION STATION MI HOLLAND OTTAWA 7
COGENTRIX OF NORTH CAROLINA ROXBORO NC ROXBORO PERSON 7
COLVER POWER PROJECT PA COLVER CAMBRIA 7
KENTUCKY UTILITIES CO TYRONE STATION KY VERSAILLES WOODFORD 7
MT TOM STATION MA HOLYOKE HAMPDEN 7
CITY OF INDEPENDENCE MO INDEPENDENCE JACKSON 6
U.S. DOE BONNEVILLE POWER ADMIN. CELILO
CONVERTER STATION
OR THE DALLES WASCO 6
HIBBING PUBLIC UTILITIES COMMISSION MN HIBBING ST LOUIS 6
T.E.S. FILER CITY STATION MI FILER CITY MANISTEE 5
TRIGEN-NATIONS ENERGY CO LLLP CO GOLDEN JEFFERSON 5
MEADWESTVACO NORTH CHARLESTON
OPERATIONS
SC NORTH CHARLESTON CHARLESTON 5
CITY OF ORRVILLE DEPT OF PUBLIC UTILITIES
ELECTRIC DEPT OH ORRVILLE WAYNE 5
SOMERSET POWER LLC MA SOMERSET BRISTOL 5
BIRCHWOOD POWER FACILITY VA KING GEORGE KING GEORGE 4
GRAINGER GENERATING STATION SC CONWAY HORRY 4
AES HAWAII INC. HI KAPOLEI HONOLULU 4
AQUILA INC WN CLARK STATION CO CANON CITY FREMONT 3
COLUMBIA MUNICIPAL POWER PLANT MO COLUMBIA BOONE 3

Fishing for Trouble 42
Facility State City
County or County
Equivalent
Air
Emissions
(lbs)
V.H. BRAUNIG A. VON ROSENBERG POWER
PLANTS
TX SAN ANTONIO BEXAR 3
CHAMBERS COGENERATION LP NJ CARNEYS POINT SALEM 3
TRIGEN-SYRACUSE ENERGY CORP NY SYRACUSE ONONDAGA 3
CITY OF HAMILTON POWER PLANT OH HAMILTON BUTLER 3
GREEN POWER KENANSVILLE LLC NC KENANSVILLE DUPLIN 2
PG&E SCRUBGRASS GENERATING PLANT PA KENNERDELL VENANGO 2
NEWINGTON STATION NH NEWINGTON ROCKINGHAM 2
ACE COGENERATION FACILITY CA TRONA SAN BERNARDINO 2
ROANOKE VALLEY ENERGY FACILITY NC WELDON HALIFAX 2
SCHILLER STATION NH PORTSMOUTH ROCKINGHAM 2
CROYDON GENERATING STATION PA CROYDON BUCKS 2
SOUTHAMPTON POWER STATION VA FRANKLIN SOUTHAMPTON 2
PUBLIC SERVICE CO OF COLORADO VALMONT
STATION CO BOULDER BOULDER 2
PACIFIC GAS & ELECTRIC CO. HUNTERS POINT
POWER PLANT
CA SAN FRANCISCO SAN FRANCISCO 1
NORTHEASTERN POWER CO PA MC ADOO SCHUYLKILL 1
LOGAN GENERATING CO LP NJ SWEDESBORO GLOUCESTER 1
QUINDARO POWER STATION KS KANSAS CITY WYANDOTTE 1
UAE MECKLENBURG COGENERATION LP VA CLARKSVILLE MECKLENBURG 1
ALTAVISTA POWER STATION VA ALTAVISTA CAMPBELL 1
PUBLIC SERVICE CO OF COLORADO CAMEO
STATION CO PALISADE MESA 1
MAYAGUEZ GAS TURBINES POWER PLANT PR MAYAGUEZ MAYAGUEZ 1
NEARMAN CREEK POWER STATION KS KANSAS CITY WYANDOTTE 1
PANTHER CREEK PARTNERS PA NESQUEHONING CARBON 1
Total 90,300
Source: U.S. EPA, 2002 Toxics Release Inventory, downloaded from www.epa.gov/triexplorer, 27 September 2004.

Appendix E. Detailed Breakdown of Advisories (2003): Colorado
Colorado
5
17,105
$645,891,000
Statewide Advisories
None
Specific Advisories
Advisory Extent Type
Advisory
size
Year
Issued
Species
Species
size
Restriction/Population Covered
Mcphee Reservoir Entire reservoir Lake
1493
acres 1993
bass-
largemouth 12-18"
No Consumption - Sub
Population(s)
Mcphee Reservoir Entire reservoir Lake
1493
acres 1993
bass-
largemouth 12-18"
Restricted Consumption - General
Population
Mcphee Reservoir Entire reservoir Lake
1493
acres 1993
bass-
smallmouth 1-6"
Restricted Consumption - General
Population
Mcphee Reservoir Entire reservoir Lake
1493
acres 1993
bass-
smallmouth 6-12"
Restricted Consumption - General
Population
Mcphee Reservoir Entire reservoir Lake
1493
acres 1993
bass-
smallmouth 1-6"
Restricted Consumption - Sub
Population(s)
Mcphee Reservoir Entire reservoir Lake
1493
acres 1993
bass-
smallmouth 6-12"
Restricted Consumption - Sub
Population(s)
Mcphee Reservoir Entire reservoir Lake
1493
acres 1993 crappie-black 6-12"
Restricted Consumption - General
Population
Mcphee Reservoir Entire reservoir Lake
1493
acres 1993 crappie-black 6-12"
Restricted Consumption - Sub
Population(s)
Mcphee Reservoir Entire reservoir Lake
1493
acres 1993 perch-yellow 1-6"
Restricted Consumption - General
Population
Mcphee Reservoir Entire reservoir Lake
1493
acres 1993 perch-yellow 6-12"
Restricted Consumption - General
Population
Mcphee Reservoir Entire reservoir Lake
1493
acres 1993 perch-yellow 1-6"
Restricted Consumption - Sub
Population(s)
Number of advisories:
Lake acres under advisory:
$$ Spent on Recreational Fishing (2001):
Fishing for Trouble 43

Appendix E. Detailed Breakdown of Advisories (2003): Colorado
Advisory Extent Type
Advisory
size
Year
Issued
Species
Species
size
Restriction/Population Covered
Mcphee Reservoir Entire reservoir Lake
1493
acres 1993 perch-yellow 6-12"
Restricted Consumption - Sub
Population(s)
Mcphee Reservoir Entire reservoir Lake
1493
acres 1993
salmon-
kokanee 12-18"
Restricted Consumption - General
Population
Mcphee Reservoir Entire reservoir Lake
1493
acres 1993
salmon-
kokanee 12-18"
Restricted Consumption - Sub
Population(s)
Mcphee Reservoir Entire reservoir Lake
1493
acres 1993 trout-rainbow 12-18"
Restricted Consumption - General
Population
Mcphee Reservoir Entire reservoir Lake
1493
acres 1993 trout-rainbow 6-12"
Restricted Consumption - General
Population
Mcphee Reservoir Entire reservoir Lake
1493
acres 1993 trout-rainbow 12-18"
Restricted Consumption - Sub
Population(s)
Mcphee Reservoir Entire reservoir Lake
1493
acres 1993 trout-rainbow 6-12"
Restricted Consumption - Sub
Population(s)
Narraguinnep Reservoir Entire reservoir Lake 577 acres 1993 catfish-channel 18-24"
Restricted Consumption - General
Population
Narraguinnep Reservoir Entire reservoir Lake 577 acres 1993 catfish-channel 18-24"
Restricted Consumption - Sub
Population(s)
Narraguinnep Reservoir Entire reservoir Lake 577 acres 1993 perch-yellow 1-6"
Restricted Consumption - General
Population
Narraguinnep Reservoir Entire reservoir Lake 577 acres 1993 perch-yellow 6-12"
Restricted Consumption - General
Population
Narraguinnep Reservoir Entire reservoir Lake 577 acres 1993 perch-yellow 1-6"
Restricted Consumption - Sub
Population(s)
Narraguinnep Reservoir Entire reservoir Lake 577 acres 1993 perch-yellow 6-12"
Restricted Consumption - Sub
Population(s)
Narraguinnep Reservoir Entire reservoir Lake 577 acres 1993 pike-northern 30-36"
No Consumption - Sub
Population(s)
Narraguinnep Reservoir Entire reservoir Lake 577 acres 1993 pike-northern 12-18"
Restricted Consumption - General
Population
Narraguinnep Reservoir Entire reservoir Lake 577 acres 1993 pike-northern 18-24"
Restricted Consumption - General
Population
Narraguinnep Reservoir Entire reservoir Lake 577 acres 1993 pike-northern 24-30"
Restricted Consumption - General
Population
Fishing for Trouble 44

Appendix E. Detailed Breakdown of Advisories (2003): Colorado
Advisory Extent Type
Advisory
size
Year
Issued
Species
Species
size
Restriction/Population Covered
Narraguinnep Reservoir Entire reservoir Lake 577 acres 1993 pike-northern 30-36"
Restricted Consumption - General
Population
Narraguinnep Reservoir Entire reservoir Lake 577 acres 1993 pike-northern 12-18"
Restricted Consumption - Sub
Population(s)
Narraguinnep Reservoir Entire reservoir Lake 577 acres 1993 pike-northern 18-24"
Restricted Consumption - Sub
Population(s)
Narraguinnep Reservoir Entire reservoir Lake 577 acres 1993 pike-northern 24-30"
Restricted Consumption - Sub
Population(s)
Narraguinnep Reservoir Entire reservoir Lake 577 acres 1993 walleye 18-24"
No Consumption - Sub
Population(s)
Narraguinnep Reservoir Entire reservoir Lake 577 acres 1993 walleye 12-18"
Restricted Consumption - General
Population
Narraguinnep Reservoir Entire reservoir Lake 577 acres 1993 walleye 18-24"
Restricted Consumption - General
Population
Narraguinnep Reservoir Entire reservoir Lake 577 acres 1993 walleye 6-12"
Restricted Consumption - General
Population
Narraguinnep Reservoir Entire reservoir Lake 577 acres 1993 walleye 12-18"
Restricted Consumption - Sub
Population(s)
Narraguinnep Reservoir Entire reservoir Lake 577 acres 1993 walleye 6-12"
Restricted Consumption - Sub
Population(s)
Navajo Reservoir San Juan and Piedra arms Lake
14934
acres 1993
bass-
smallmouth 12-18"
Restricted Consumption - General
Population
Navajo Reservoir San Juan and Piedra arms Lake
14934
acres 1993
bass-
smallmouth 12-18"
Restricted Consumption - Sub
Population(s)
Navajo Reservoir San Juan and Piedra arms Lake
14934
acres 1993 catfish-channel 12-18"
Restricted Consumption - General
Population
Navajo Reservoir San Juan and Piedra arms Lake
14934
acres 1993 catfish-channel 12-18"
Restricted Consumption - Sub
Population(s)
Navajo Reservoir San Juan and Piedra arms Lake
14934
acres 1993 pike-northern 36-42"
No Consumption - Sub
Population(s)
Navajo Reservoir San Juan and Piedra arms Lake
14934
acres 1993 pike-northern 30-36"
Restricted Consumption - General
Population
Navajo Reservoir San Juan and Piedra arms Lake
14934
acres 1993 pike-northern 36-42"
Restricted Consumption - General
Population
Fishing for Trouble 45

Appendix E. Detailed Breakdown of Advisories (2003): Colorado
Advisory Extent Type
Advisory
size
Year
Issued
Species
Species
size
Restriction/Population Covered
Navajo Reservoir San Juan and Piedra arms Lake
14934
acres 1993 pike-northern 30-36"
Restricted Consumption - Sub
Population(s)
Sanchez Reservoir Entire reservoir Lake 4 acres 1994 carp-common 24-30"
Restricted Consumption - General
Population
Sanchez Reservoir Entire reservoir Lake 4 acres 1994 carp-common 24-30"
Restricted Consumption - Sub
Population(s)
Sanchez Reservoir Entire reservoir Lake 4 acres 1994 perch-yellow > 6"
Restricted Consumption - General
Population
Sanchez Reservoir Entire reservoir Lake 4 acres 1994 perch-yellow > 6"
Restricted Consumption - Sub
Population(s)
Sanchez Reservoir Entire reservoir Lake 4 acres 1994 pike-northern > 24"
No Consumption - Sub
Population(s)
Sanchez Reservoir Entire reservoir Lake 4 acres 1994 pike-northern > 12"
Restricted Consumption - General
Population
Sanchez Reservoir Entire reservoir Lake 4 acres 1994 pike-northern 12-18"
Restricted Consumption - Sub
Population(s)
Sanchez Reservoir Entire reservoir Lake 4 acres 1994 trout-brown 18-24"
No Consumption - Sub
Population(s)
Sanchez Reservoir Entire reservoir Lake 4 acres 1994 trout-brown 18-24"
Restricted Consumption - General
Population
Sanchez Reservoir Entire reservoir Lake 4 acres 1994 walleye > 12"
No Consumption - Sub
Population(s)
Sanchez Reservoir Entire reservoir Lake 4 acres 1994 walleye > 12"
Restricted Consumption - General
Population
Teller Reservoir Entire reservoir Lake 97 acres 1994 bullhead > 10"
No Consumption - Sub
Population(s)
Teller Reservoir Entire reservoir Lake 97 acres 1994 bullhead > 10"
Restricted Consumption - General
Population
Teller Reservoir Entire reservoir Lake 97 acres 1994 catfish-channel > 23"
No Consumption - Sub
Population(s)
Teller Reservoir Entire reservoir Lake 97 acres 1994 catfish-channel > 23"
Restricted Consumption - General
Population
Teller Reservoir Entire reservoir Lake 97 acres 1994 crappie
No Consumption - Sub
Population(s)
Fishing for Trouble 46

Appendix E. Detailed Breakdown of Advisories (2003): Colorado
Advisory Extent Type
Advisory
size
Year
Issued
Species
Species
size
Restriction/Population Covered
Teller Reservoir Entire reservoir Lake 97 acres 1994 crappie
Restricted Consumption - General
Population
None
No-restriction advisories
Fishing for Trouble 47

Fishing for Trouble i
End Notes
1
U.S. EPA, Mercury Study Report to Congress, Volume VII: Characterization of Human Health and Wildlife Risks
from Mercury Exposure in the United States, 1997.
2
U.S. EPA, Mercury Study Report to Congress, Volume III: Fate and Transport of Mercury in the Environment,
1997.
3
U.S. EPA, “Mercury Update. Impact on Fish Advisories,” June 2001, downloaded from
http://www.epa.gov/ost/fishadvice/mercupd.pdf
, 27 September 2004.
4
See U.S. EPA, supra, note 2.
5
See U.S. EPA, supra, note 1.
6
See U.S. EPA, supra, note 3.
7
See U.S. EPA, supra, note 1.
8
U.S. EPA, Mercury Study Report to Congress, Volume V: Health Effects of Mercury and Mercury Compounds,
1997.
9
Id.
10
National Research Council, Toxicological Effects of Methylmercury, National Academy Press, 2000,
downloaded from from http://www.nap.edu/books/0309071402/html/
, 27 September 2004.
11
Kathryn Mahaffey, Robert P. Cliffner, and Catherine Bodurow, “Blood Organic Mercury and Dietary Mercury
Intake: National Health and Nutrition Examination Survey, 1999 and 2000,” Environmental Health Perspectives,
112(5) 562-570, April 2004; Kathryn R. Mahaffey, U.S. EPA, “Methylmercury Epidemiology Update,” Slide
presentation given at the National Forum on Contaminants in Fish, San Diego, January 2004. Available at
http://www.epa.gov/waterscience/fish/forum/2004/presentations/monday/mahaffey.pdf
.
12
See National Research Council, supra, note 10.
13
U.S. EPA, “What You Need to Know about Mercury in Fish and Shellfish,” 19 March 2004, downloaded from
http://www.epa.gov/waterscience/fishadvice/advice.html
, 27 September 2004.
14
U.S. FDA, “Mercury Levels in Seafood Species,” 19 March 2004 downloaded from
http://www.cfsan.fda.gov/~frf/sea-mehg.html
, 27 September 2004.
15
U.S. EPA, “Factsheet: National Listing of Fish Advisories, August 2004,” downloaded from
http://www.epa.gov/waterscience/fish/advisories/factsheet.pdf
, 27 September 2004.
16
U.S. PIRG Education Fund, Reel Danger: Power Plant Mercury Pollution and the Fish We Eat, August 2004,
available at http://www.uspirg.org/reports/ReelDanger7_04.pdf
.
17
Paul Jakus, Meghan McGuinness, and Alan Krupnick, “The Benefits and Costs of Fish Consumption Advisories
for Mercury.” October 2002, downloaded from http://www.rff.org/Documents/RFF-DP-02-55.pdf
, 27
September 2004.
18
M.R. Round; M.H. Keating, J.M. Chaisson, D.R. Brown, “Assessing the Potential Exposure of the Recreational
Angler to Methylmercury. Mercury in the Environment.” Proceedings of a Specialty Conference, Air and Waste
Management Association, Minneapolis, MN, September 15-17, 1999.
19
U.S. EPA, Draft National Coastal Condition Report II, September 2004, downloaded from
http://www.epa.gov/owow/oceans/nccr2/index.html
27 September 2004.
20
Id.
21
U.S. EPA, “Factsheet: National Listing of Fish Advisories, August 2004,” downloaded from
http://www.epa.gov/waterscience/fish/advisories/factsheet.pdf
, September 27, 204.
22
U.S. EPA, supra, note 19.
23
U.S. Fish and Wildlife Service, “Final Contaminant Assessment Process Report for Felsenthal NWR,” 18
December 2002.
24
Id.
25
National Park Service website at http://www.nps.gov/pine/
26
Quinebaug-Shetucket Heritage Corridor, Inc., http://www.thelastgreenvalley.org/welcome.html.
27
West Kentucky Corporation, http://www.thinkwestkentucky.com/ecotourism/wildlife/westky_areas/.
28
National Park Service, Park Unit Overview, May 2003, downloaded 27 September 2004 from
http://www2.nature.nps.gov/air/Studies/air_toxics/mercury.htm
.
29
United States Fish and Wildlife Service, National Survey of Fishing, Hunting and Wildlife Associated Recreation,
2001, downloaded from http://www.census.gov/prod/2002pubs/FHW01.pdf
, 27 September 2004.
30
Id.
31
American Sportfishing Association, Sportfishing in America: Values of Our Traditional Pastime, 2001,
downloaded from http://www.asafishing.org/asa/statistics/economic_impact/economic_impact_table.html
, 27
September 2004.
32
See Paul Jakus, et al., note 17.

Fishing for Trouble ii
33
U.S. Fish and Wildlife Service, supra, note 29.
34
Id.
35
Id.
36
U.S. Fish and Wildlife Service, “America’s National Wildlife Refuge System, Hunting and Fishing,” downloaded
from http://refuges100.fws.gov/facts/Hunting%20FACT%20SHEET.pdf
, 27 September 2004.
37
U.S. EPA, Mercury Study Report to Congress, Volume II: An Inventory of Anthropogenic Mercury Emissions in the
United States, 1997.
38
Analysis of U.S. EPA’s 1999 National Emissions Inventory as cited in the Northeast States for Coordinated Air
Use Management (NESCAUM), Mercury Emissions from Coal-Fired Power Plants: The Case for Regulatory Action,
October 2003.
39
Id.
40
U.S. EPA, Study of Hazardous Air Pollutant Emissions from Electric Utility Steam Generating Units -- Final
Report to Congress, 1998.
41
Id.
42
U.S. EPA, 2002 Toxics Release Inventory, downloaded from www.epa.gov/triexplorer, 27 September 2004.
43
Id.
44
U.S. EPA, December 4, 2001 (supplementary presentation for Edison Electric Institute on mercury), page 6,
located at http://cta.policy.net/epamercury.pdf.
45
69 Fed. Reg. 4652-4752, 30 January 2004.
46
Energy Information Administration, Analysis of Clear Skies, Clean Air Planning, and Power Act of 2003, Report
SR/OIAF/2004-05, May 2004. Available at http://www.eia.doe.gov/oiaf/servicerpt/csa/index.html
.
47
Hubbard Brook Research Foundation, “Mercury Science Briefing, presentation for the U.S. EPA,” 23 June 2004.
48
Florida Department of Environmental Protection, Integrating Atmospheric Mercury Deposition with Aquatic
Cycling in South Florida: An Approach for Conducting a Total Maximum Daily Load Analysis for An
Atmospherically Derived Pollutant, November 2003, downloaded from
www.floridadep.org/labs/mercury/index.htm
, 27 September 2004.
