
Universal Literacy
Year 2 Evaluation Summary Report
SY 2017–18
Submitted by
Research & Policy Support Group

TABLE OF CONTENTS
TABLE OF CONTENTS ..............................................................................................................
................................................................................................................................
........................................................................................................................................
..........................................................................................................................
...........................................................................................
.........................................
................................................................
..........................................................................................................
................................................................................................................................
...............................................................................................................................
.....................................................................................................
.................................................................................
ii
Introduction 1
Reach 2
Implementation 3
Implementation: Coach Time Use 4
Implementation Perspectives: Teacher, Administrator, and Coach 5
Implementation Perspectives: Portraits of Practice 11
Early Indicators of Impact 12
Conclusion 14
References 17
APPENDIX A: Data Sources 19
APPENDIX B: GMRT – Technical Report 20

Introduction
The ultimate goal of the Universal Literacy initiative is to have all students reading on grade level by
the end of the second grade, by 2026. The initiative takes a research-based, capacity-building
approach by training educators to become Reading Coaches, who work with K–2 teachers
individually and in groups on how to effectively teach children to read.
Researchers from the New York City Department of Education’s Research & Policy Support Group
(RPSG) conduct evaluation activities for the initiative, working in partnership with the Early Literacy
team. In addition to the evaluation activities described in this report, RPSG researchers respond to
requests by policymakers for data and analytics; support the team in the development and
implementation of the Digital Daily Coaching Log; present to the Reading Coaches and staff on a
variety of research-related topics; and keep abreast of the empirical literature on literacy coaching.
In Year 1 (Y1), School Year (SY) 2016–17, RPSG collaborated with the Early Literacy team to collect
data to serve as a baseline for the initiative; provided formative findings to help inform program
implementation; and piloted instruments, data collection, and analysis.
The main purposes of the SY 2017–18 Year 2 (Y2) evaluation were to:
• Track metrics about the initiative’s reach;
• Learn about the initiative’s implementation, in order to:
○ Provide formative results that the program team can use to inform planning and
improvement;
○ Document successes and challenges related to implementation and sustainability;
and
• Analyze early impacts, including the extent to which the presence of a reading coach
influences the reading scores of Grade 2 students.
The Universal Literacy initiative (ULit) is informed by bodies of research
1
related to how children
learn to read and how teachers learn to teach children to read. Its organization and deployment
were influenced by research on literacy coaching and by past New York City Department of
Education (NYCDOE) coaching initiatives. The evaluation used these sources to develop research
1
See, for instance: National Institute of Child Health and Human Development (NICHD) (2000), National Research Council
(1998), Foorman, et al. (2016).
Universal Literacy Year 2 Summary Report | 1
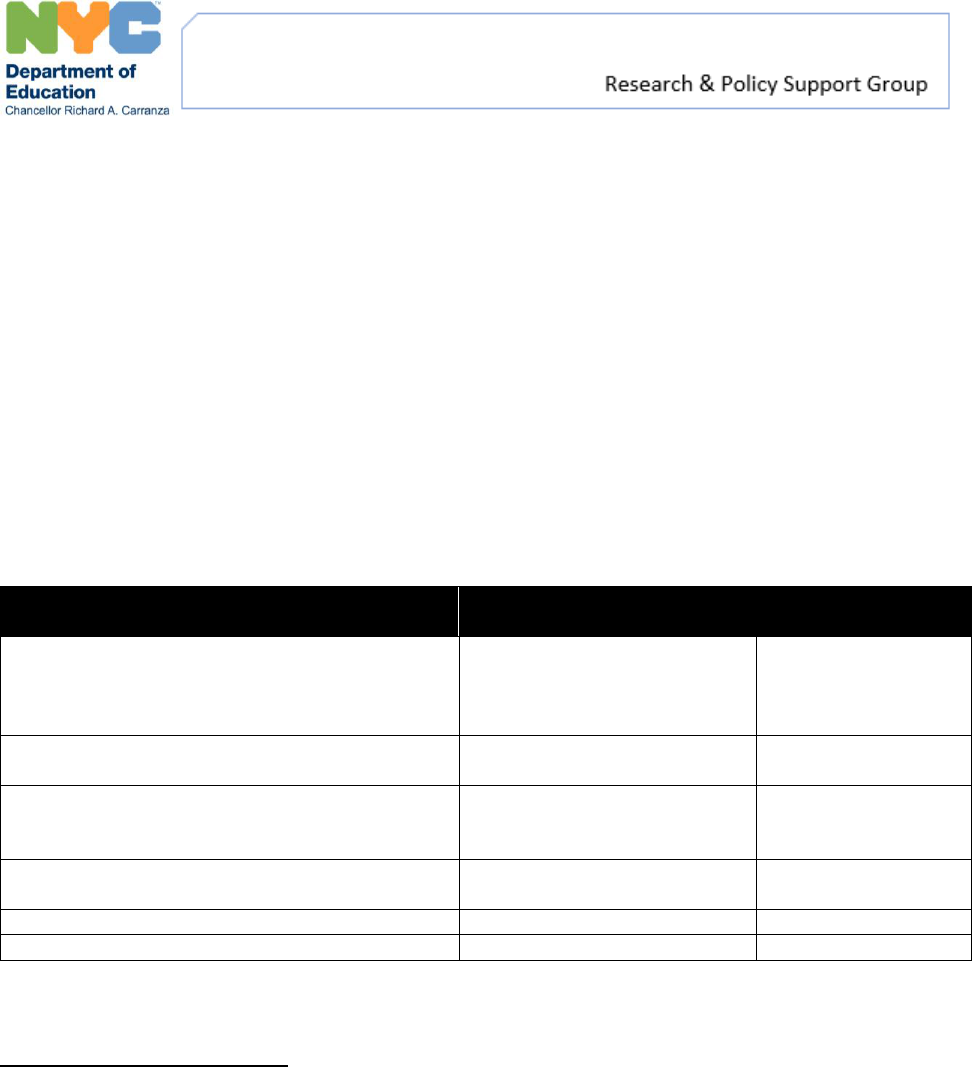
questions and data collection protocols. The research questions described in Table 1 guided RPSG’s
work in Year 2.
Table 1. Year 2 Evaluation: Research Questions
Research Question
Data Sources
➊ What is the reach of Universal Literacy?
Program team data; DOE institutional
data; coach logs
➋ How is the initiative being implemented
in schools?
Group and individual interviews; site
visits/portraits of practice; surveys; coach
logs
➌ What is the impact of the Universal
Literacy initiative on student learning?
Gates-MacGinitie Reading Test (GMRT),
Level 2
Reading coaches must navigate complex school ecosystems in order to fulfill their mission of
providing job-embedded coaching to K–2 classroom teachers. They report to central district office
staff while working onsite in schools. They need to gain the trust of school-based educators.
Because they are not reading interventionists who work one-on-one with students, but rather
instructional coaches there to build the capacity of K–2 classroom teachers to teach students to
read, they need to clearly communicate the purposes and boundaries of their roles to school
building leaders and staff.
Reach
To answer the first research question, about the initiative’s reach, we used program data and DOE
institutional data.
In SY 2017–18, the Universal Literacy initiative scaled to 14 districts from its original four districts. It
conducted an intensive three-week summer training course on reading acquisition, instructional
coaching, and adult learning for them along with bi-monthly sessions during the school year for
new coaches; returning coaches attended a week-long summer session and monthly trainings to
deepen their knowledge about literacy coaching. Additionally, coaches received optional training
on curricular materials used in their schools, such as Fundations.
Universal Literacy Year 2 Summary Report | 2
The initiative recruited 150 Reading Coaches for SY 2017–18, who joined the 86 Reading Coaches
who began in SY 2016–17 for a total of 236 coaches.
2
In total, these coaches served 298 schools,
with 168 Reading Coaches serving one school and 68 Reading Coaches serving two schools. In all,
these schools served approximately 70,000 K–2 students. The average Economic Need Index
3
of
schools was 84.1%.
Based on coach log data, 3,343 K–2 teachers received individual coaching.
4
On average, coaches
spent a total of 287 class periods coaching individual teachers during the time frame the log was
active, with an average of just over 20 periods with each teacher and a range of 0 to 175 periods.
Coaches split their time fairly evenly coaching teachers of each grade, on average (37% of time with
K teachers, 34% with Grade 1 teachers, and 35% with Grade 2 teachers).
5
Implementation
To answer the question about the initiative’s implementation, we used program data as well as
data that RPSG collected via surveys, interviews, and site visits. A review of the empirical literature
and policy literature on reading acquisition, reading instruction, and instructional coaching
informed our approach.
6
2
Data taken from Spring 2018 coach roster; numbers fluctuated slightly throughout the year due to rolling hiring and
resignations. In SY 2017–18, ULit had 242 coach positions and 6 vacancies. A small number of large schools had two
Reading Coaches.
3
The Economic Need Index (ENI) estimates the percentage of students facing economic hardship. The metric includes
eligibility for public assistance from the NYC Human Resources Administration (HRA), temporary housing status, and
census tract data. The school’s Economic Need Index score is the average of its students’ Economic Need Values; The
highest possible ENI value is 100.
4
All data are from the period of December 2017 to June 2018, when the Digital Daily Coaching Log was active. Coaches
record their coaching activities for each period (approximately 45 minutes) that they are in a school. Digital Daily
Coaching Log. See footnote 8 below for more detail.
5
Teachers can be associated with multiple grades and coaches may work with two co-teachers in a single class period;
thus, percent of time use with different grades does not add up to 100.
6
See, for example: Coburn & Woulfin (2012), Deussen, Coskie, Robinson, & Autio (2007), Elish-Piper & L’Allier (2010, 2011),
L’Allier, Elish-Piper, & Bean (2010), Mangin & Dunsmore (2015), Matsumura, Sartoris, Bickel, & Garnier (2009), Phillips et al.
(2016), Scott, Cortina & Carlisle (2012), and Zigmond, et al. (2011).
Universal Literacy Year 2 Summary Report | 3
Implementation: Coach Time Use
An analysis of coach log data showed that coaches spent, on average, 42.4% of their work time in
schools with teachers.
7
This number includes time coaching individual teachers (34.1%), working
with groups of teachers such as in grade team meetings or peer observations (5.3%), and doing
formal professional learning sessions for educators (3.0%). See Table 2 for details. Table 3
describes how coaches spent their time in schools in SY 2017–18, disaggregated by class and
teacher types. The total number of periods coaches spent with individual teachers was fairly evenly
distributed across grades.
8
Coaches spent 59% of their time with teachers whose classrooms
contain students with disabilities (42% with teachers in integrated co-teaching (ICT) classrooms and
17% in self-contained classrooms). Comparatively, coaches spent the least amount of time with
brand-new teachers.
Table 2. Coach time use, averages for Dec. 2017 – Jun. 2018
Activity
Total Number of Periods
Percent of Total Time
(average)
Working with teachers 79,805
42.4%
Coaching individual teachers 64,169 34.1%
Coach
ing groups of teachers 10,030
5.3%
Pro
fessional learning sessions 5,606
3.0%
Planning (includes planning PD sessions, planning for
work with teachers, communications)
48,354
25.7%
Other (includes data analysis and assessment work;
work with Instructional Specialists, school literacy
consultants, and parents; and special ULit projects)
26,564
14.1%
Clinical application/practice
(Reading Rescue tutoring)
14,860
7.9%
Working with school leaders
12,876
6.9%
Time unrelated to coaching work
5,537
3.0%
7
Note that Reading Coaches are scheduled to work 7 hours and 30 minutes a day, excluding a 30-minute lunch break, as they
serve in a “teacher assigned” role; a typical teacher workday is 6 hours and 20 minutes, inclusive of a lunch period.
8
Reading coaches complete the Digital Daily Coaching Log for each day they work in a school. Reading coaches report how
they spent the majority of each period; although the length of a “period” and the number of periods varies slightly from school
to school, this approach provides a high-level look at how coaches spend their time. They reported a total of 64,194 periods
with individual teachers in the period December 2017 –June 2018. Coaches may spend time with more than one teacher in a
period. In addition, teachers can be associated with multiple classroom types; thus, percent of time use with different
classroom types does not add up to 100%.
Universal Literacy Year 2 Summary Report | 4
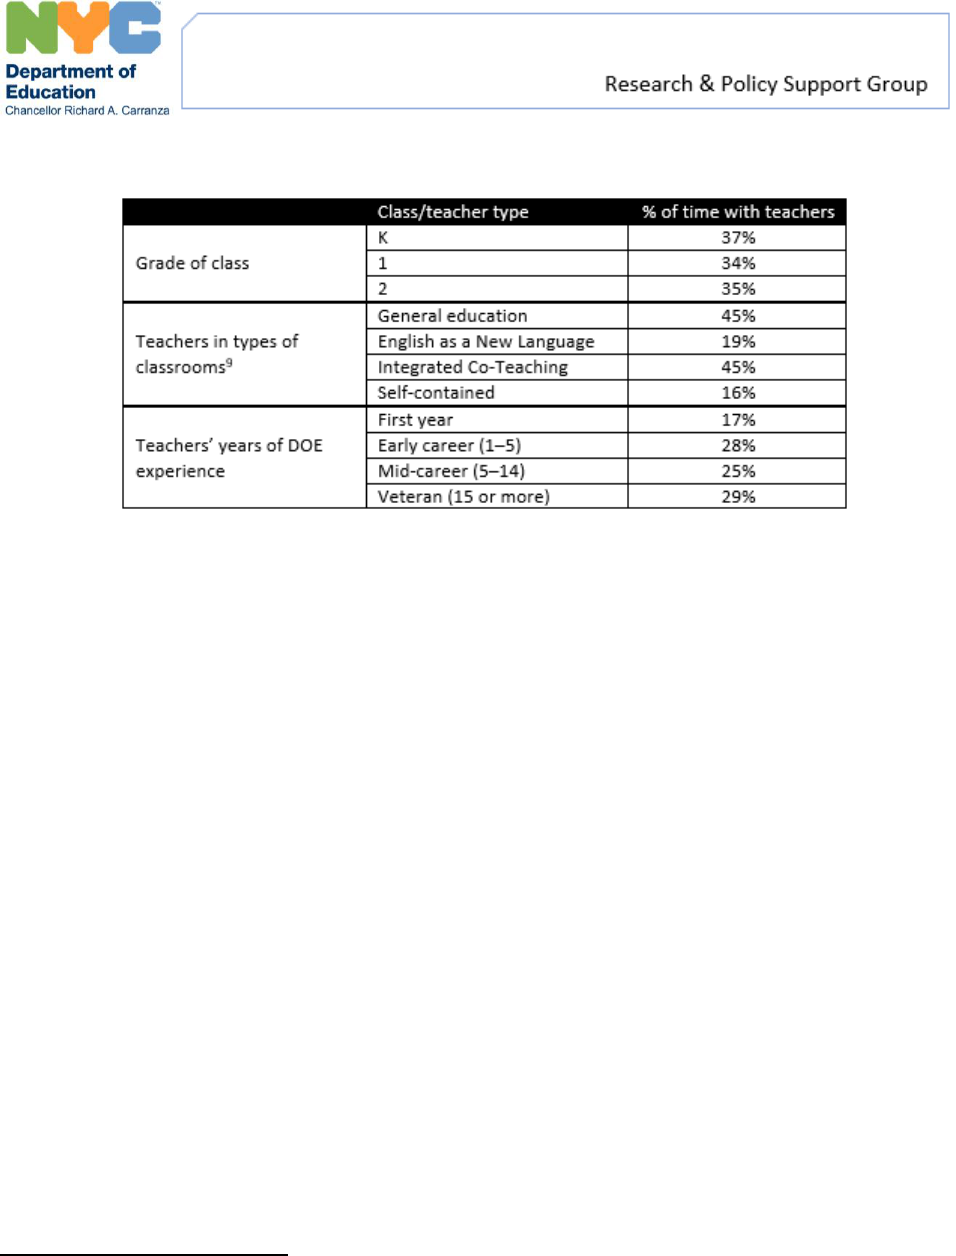
Table 3. Coach time, disaggregated by grade, class type, and years of DOE experience
Implementation Perspectives: Teacher, Administrator, and Coach
RPSG administered end-of-year surveys
9
for K–2 teachers, school building leaders, and Reading
Coaches. More details about the surveys and their response rates can be found in Appendix A.
Teachers
Over 90% of teacher respondents reported that their coach had worked w ith them during SY 2017–
18. Forty percent indicated t hat the coach worked with them “on an ongoing basis,” while 31% said
their coach worked with them in one or more coaching cycles and 16.8% reported t he coach
worked with them “from time to time.” Of the teacher respondents who worked with a coach, the
majority indicated that they incorporate more phonics, phonemic awareness, fluency, and
vocabulary instruction into their class as a result of working with the reading coach. See Table 4
below for details.
When asked how they would most like to work with their reading coach the following year, almost
half (47.2%) of teacher respondents indicated that they would like the reading coach to work with
them one-on-one. When asked about the areas in which they would like support in the future, a
similar number (48.3%) expressed a desire for support around working with struggling readers; the
second area that teachers would like support in is literacy content areas (39.8%).
9
Response rates were as follows: Reading Coaches, 86%; School Building Leaders, 39%; and Teachers, 25%.
Universal Literacy Year 2 Summary Report | 5
Table 4. Extent to which teachers say their teaching has changed as a result of working with their ULit coach
Not at all
To a small
extent
To a moderate
extent
To a great
extent
I incorporate more phonics and phonemic awareness
instruction in my class.
14.2%
13.5%
30.2%
42.0%
I incorporate more fluency instruction in my class.
15.0%
18.0%
30.9%
36.0%
I incorporate more vocabulary instruction in my class.
15.0%
18.5%
31.7%
34.7%
The ways I group students has changed.
18.2%
17.1%
32.8%
31.9%
The ways I assess students has changed.
16.5%
18.8%
33.1%
31.6%
School Building Leaders (SBL)
When asked how satisfied they were with the Universal Literacy initiative at their school on a scale
of 0–10, school building leaders expressed a variety of views, with a majority (59.0%) satisfied or
highly satisfied (e.g., chose 7–10 on the scale). Of SBL respondents, 18.8% were unsatisfied or
highly unsatisfied (chose 0–3 on the scale) and the rest (22.2%) in the middle (chose 4-6 on the
scale). Administrators whose schools were in the second year of the initiative reported much
higher satisfaction rates and lower overall dissatisfaction, with 69.2% of Cohort 1 administrators in
the “satisfied/highly satisfied” versus 52.6% for Cohort 2 administrators, leading us to speculate
that perhaps schools in their first year experience an adjustment period. Another hypothesis is that
because response rates for administrators were low, the ones who took the time to complete an
optional survey were disproportionately highly satisfied or highly dissatisfied.
The optional open-ended responses help to triangulate these responses. A number of school
building leaders wrote about the transformative work of the reading coach.
Having a Universal Literacy Coach in our building has helped us to support our K–2 teachers in a more
equitable way.
Our ULIT Coach has been an essential part of our literacy team. She has become an active participant in
the professional lives of our staff members. She has gained their professional trust and has created an
environment of support and mutual respect.
Teachers who were struggling in the area of instruction: Domain 3-Danielson Rubric are now effective and
highly effective in that domain. Teachers are willing to take the initiative and try new strategies.
A small number of school building leaders wrote about their negative experiences.
If the Universal Literacy Coach is not allowed to be flexible to adjust when administration truly needs
support, then the Universal Literacy Coach can't really be a member of the school community and thus a
disconnect … will limit the impact of this position.
Universal Literacy Year 2 Summary Report | 6

The most frequently cited implementation challenge, selected by just over a third of respondents
(36%), was that the coach was out of the building too often for professional learning. The next most
frequent challenge, selected by almost a quarter of respondents (24%), was that teachers in the
building were resistant to working with the reading coach. Some administrators felt that coaches
did not have sufficient time to work in the school (21%) or that they did not have enough
autonomy over the coach’s work (20%). About 30% of administrators reported no implementation
challenges.
Reading Coaches
Across survey items that asked coaches to share their perspectives on their work with teachers, the
majority of coaches believed they had helped teachers to a “moderate extent” or “great extent.”
The greatest challenge they named by far was teachers who were reluctant to working with the
coach. Because working with the coach is not mandatory, coaches need to gain the trust of
teachers in order to be invited in to their classrooms to work together.
Coaches were asked ab out their overall opinion of the Professional Learning Series (PLS) as well as
the extent to which the PLS helped them with specific k nowledge, skills, and coaching practices.
Coaches’ responses were generally positive, with Cohort 2 coaches providing much stronger
positive responses.
Comparative Responses from Teachers, Administrators, and Coaches
The survey asked respondents from all three groups—teachers, administrators, and coaches—their
perceptions about the extent to which the ULit Reading Coach helped K–2 teachers in a variety of
key areas: developing their content knowledge about reading and writing and instruction;
familiarizing them with resources for effective delivery of reading and writing instruction;
developing their understanding of reading assessments and how to use the data to inform
instruction; and supporting implementation of the school’s literacy curriculum. The majority of
respondents (two-thirds or more, on average) indicated that the ULit Reading Coach helped to a
moderate or great extent. Figure 1, below, shows the percent of respondents who felt the coach
helped “to a great extent” for each item. See Table 5 for details.
Universal Literacy Year 2 Summary Report | 7
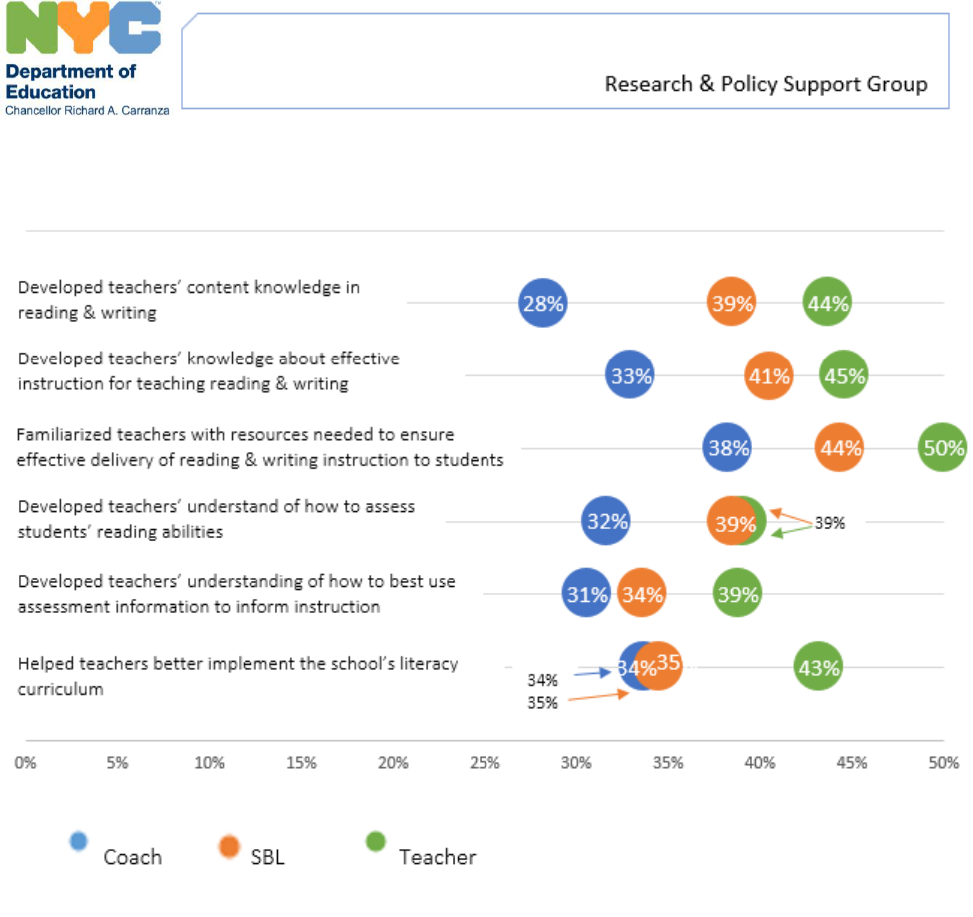
Figure 1. Responses to item about how ULit Reading Coach helped teachers “to a great extent,” by respondent group
(Reading Coach, School Building Leader, Teacher)
The survey asked c oaches and school building leaders about their perceptions of what
administrators did to support coaches. Survey results show gaps between coach and administrator
perceptions. Fo r example, 55% of administrator respondents reported speaking to their coaches
about their work with teachers on a weekly b asis, versus only 3 5% of coach respondents. Similarly,
17% of administrators reported n ever helping the reading coach deal with reluctant teachers,
versus 51% of coaches. A n important part of administrator support of coaches is setting the tone at
the beginning of the year. Figure 2 shows c oach versus SBL perceptions of what support actions
administrators took at the beginning of the school year.
Universal Literacy Year 2 Summary Report | 8
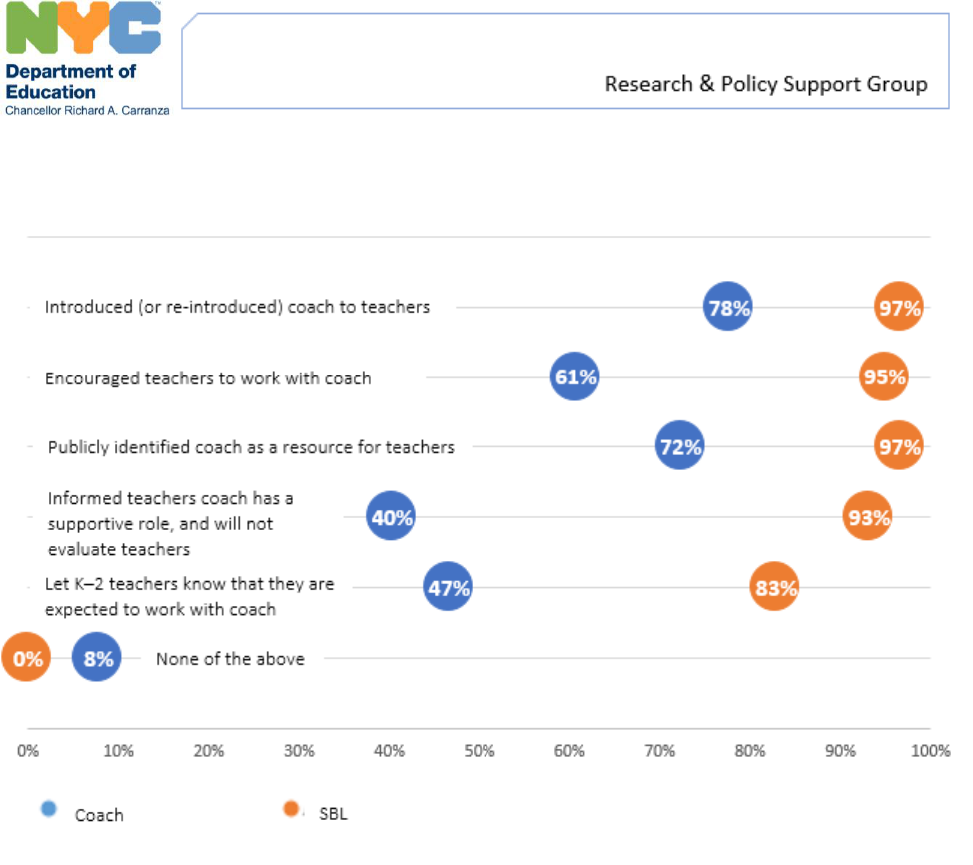
Figure 2. Responses to item, “At the beginning of the year, [administrator] did the following…,” by respondent group
(Reading Coach vs. School Building Leader/SBL)
Universal Literacy Year 2 Summary Report | 9
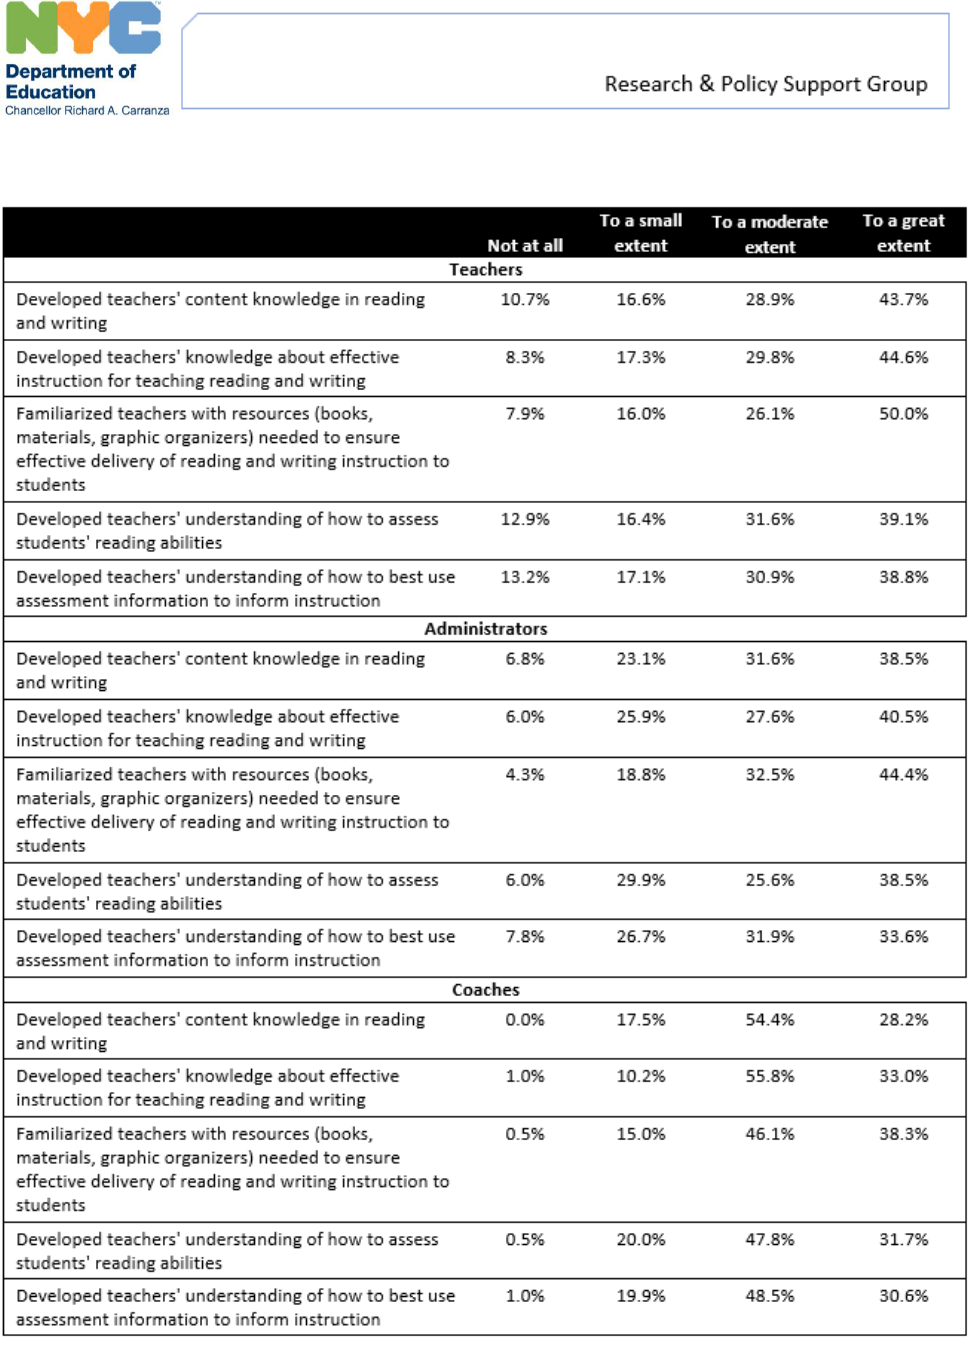
Table 5. Extent to which teachers, administrators, and coaches say ULit coaching helped in them/their school
Universal Literacy Year 2 Summary Report | 10

Implementation Perspectives: Portraits of Practice
In order to better understand the implementation of the coaching cycle, RPSG conducted
qualitative research to understand coach-teacher interactions in five Universal Literacy schools in a
case-study approach we call Portraits of Practice. The research team interviewed coaches,
teachers, and school building leaders, and closely observed coach interactions with one focal
teacher. Highlights of the “portraits of practice” findings included:
• Coaches believed that building relationships with teachers is essential for coaching to be
successful and consequently put efforts into forging those relationships.
• The focus of coaching cycles was highly dependent on the school’s literacy ecosystem as well as
coaches’ individual perspectives on coaching.
• There was more variation than consistency in terms of what constituted a coaching cycle.
○ Coaches articulated a need t o individualize their coaching for different teachers and "be
flexible" because teachers do not always p rogress as planned.
○ All coaches had routines for starting the cycle and working in the middle of the cycle (co-
planning, modeling, side-by-side coaching); most also collected student data at some point
during the cycle.
○ There was inconsistency around why and how a cycle ended.
• All coaches made purposeful coaching moves.
○ They actively engaged t eachers, using questioning strategies to elicit next steps and help
teachers name their own practices, and enacted a "think aloud" technique to help t eachers
understand lesson decision points in the moment.
○ Coaches were also skilled in altering initial plans for coaching sessions when n ecessary,
combining more than one coaching move.
• Attention to five essential components of effective reading instruction (“pillars”)—phonics,
phonemic awareness, vocabulary, fluency, and comprehension—was embedded in cycles as
opposed t o being the explicit focus of cycles; programs, curriculum, or strategies (e.g., guided
reading, Fundations) were frequently t he cycle focus and most coaches believe that teachers
were learning the components of reading acquisition while they are learning to teach those
programs, curricula, or strategies.
• Most c oaches worked in schools where other literacy coaches, staff developers, or consultants
were also working with teachers on literacy practices, curriculum, and/or content. Each school
engaged literacy partners differently.
Universal Literacy Year 2 Summary Report | 11

• All coaches participating in this study reported principals were supportive of the initiative and
their work; coaches had varying levels of autonomy regarding literacy decision-making in the
schools they support.
Early Indicators of Impact
To answer research question 3, about the impact of the initiative, we used data collected by the
initiative on the Gates-MacGinitie Reading Test (GMRT), Level 2. Universal Literacy offered the
GMRT to second graders in a sample of schools in the original ULit districts (Cohort 1) and a
matched comparison sample of schools that joined the initiative in SY 2017–18 (Cohort 2), as well
as schools that joined the initiative in SY 2018–19 (future-ULit). Highlights of findings about early
indicators of impact include:
• Overall average GMRT scores, as well as scores on each of the subtests (word decoding, word
knowledge, and comprehension), of students at 110 schools with access to a Universal Literacy
coach grew more than those of their peers in the 57 future-ULit comparison schools. The
difference in change scores in the comprehension subsection was statistically significant.
• Students of teachers who received ULit coaching grew more than students of teachers who did
not. Moreover, the more coaching a teacher received, the more growth the students had, on
average. The difference between students whose teachers had more coaching and those who
did not was statistically significant.
These results are small but encouraging indicators of impact.
Given that sampling occurred on the school level, we looked at change scores across schools,
grouped by ULit cohort. Overall average scores, as well as scores on each of the subtests (word
decoding, word knowledge, and comprehension), grew sligh tly mo re at the 110 schools with access
to a Universal Literacy coach than at the 57 future-ULit comparison schools (which were slated t o
receive a ULit coach in SY 2018–19). The difference in change scores in the comprehension su btest
(22.5 for ULit schools versus 18.9 for future-ULit schools) was statistically significant. There was a
similar trend across the other subtests, but no statistically significant difference. Despite purposeful
sampling of comparison schools, school demographic c haracteristics varied slightly acros s sample
groups, because ULit prioritized giving coaching access to the districts most in need of early literacy
support (see Appendix B for more detail). In order to account for this variation, as well as any
changes that occurred between sampling and analysis, we controlled for ELL status, poverty,
students with disabilities, and ethnicity. Even with these controls, the greater growth of schools
with ULit coaching was statistically significant on the comprehension su btest. See Table 6, page 16
for details.
Universal Literacy Year 2 Summary Report | 12

In addition to looking at the differences between schools in each cohort, we looked across all the
classrooms tested, to see if there was a relationship between the number of periods that teachers
were coached and their students’ achievement. When looking across these classrooms, students of
teachers who received coaching grew more than students of teachers who did not; the more
periods of coaching the teachers received, the more students’ scores grew, on average (p <
0.001). This relationship held true when looking across teachers
10
in all three cohorts, and when
looking at cohort 1 and 2 schools only. In order to account for the differences in classrooms and
teachers, we controlled for classroom type (ICT, self-contained, and ENL), student characteristics
(ELL status, disability status, poverty status, and ethnicity) and teacher characteristics (years of
experience). These findings persisted even when we included controls.
For each period of coaching, students had a 0.079 point higher Fall-Spring change score, on
average. An average student whose teacher received no coaching grew 20.8 points overall from
spring to fall administrations. Based on the relationship between periods coached and student
change scores on the GMRT, an average student whose teacher had 20 periods of coaching would
grow 22.37 points, roughly equivalent to half a month of instruction more than their peers whose
teachers had no coaching. 50 periods of coaching would equate to an extra month of growth
compared to their peers whose teachers had no coaching, while a student whose teacher received
130 periods of coaching would equate to two extra months of growth compared to their peers
whose teachers had no coaching. See Figure 3 below for an illustration of the linear relationship
between student growth scores and periods of teacher coaching.
For more information about our analytic methods, please see Appendix B.
10
The analysis included teachers who did not receive coaching, both those in schools that did not have a ULit Reading
Coach and those in ULit schools who did not receive coaching. The results were the same when we looked at the whole
sample and when we looked just at Cohort 1 and 2 schools.
Universal Literacy Year 2 Summary Report | 13
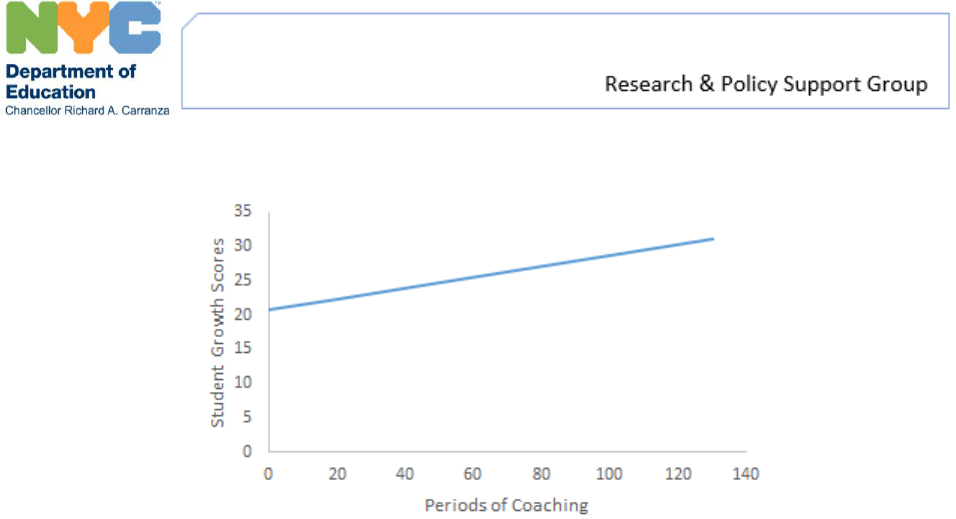
Figure 3. Illustration of relationship between average student growth scores and periods of teacher coaching
Conclusion
At the end of its second year, the overall evidence on the Universal Literacy initiative is largely
positive. It is meeting its objectives in terms of reach and it is showing positive early trends related
to impact.
That findings on the Universal Literacy initiative show early trends of improving student
achievement is noteworthy. A large body of empirical research in education points to multiple
factors that influence improvement, such as principal leadership, teacher quality, instructional
improvement approaches, and external support from district, state, and federal sources. This
research shows t hat improvement is incremental, occurs over years, and involves a complex
interplay of these components. A study on the Comprehensive School Reform Program
implementation and outcomes suggests, for example, that “implementation for at least three to
five years is typically the time necessary to see student achievement improve” (Aladjem et al.,
2006; Borman et al., 2003; Desimone, 2000; Zhang et al., 2006, as cited in Aladjem, et al., 2010,
p. 4).
In addition, there is a consensus in the research literature that elementary teachers enter the
profession lacking adequate preparation for effectively teaching students to read, and that
intensive support and learning is necessary for them to acquire the requisite knowledge (Moats,
1999, 2009; Snow, Griffin & Burns, 2007). By hiring and training a cadre of Reading Coaches and
deploying them to schools, the Universal Literacy initiative is building the capacity of the NYC
Department of Education to teach all children to read on grade level by the end of Grade 2. The
hundreds of educators who become ULit Reading Coaches not only apply their knowledge to
Universal Literacy Year 2 Summary Report | 14

supporting the educators they currently work with, but they will also take that knowledge to future
positions, whether as school building leaders, master teachers, or central office staff.
Finally, research shows t hat the role of principals is critical for instructional coaching to be
successful (Matsumura, Sartoris, Bickel & Garnier, 2009). Because the supervisory structure of ULit
has coaches reporting to the central office, ongoing efforts are needed t o communicate about and
support school building leaders’ understandings of reading acquisition and the role of the reading
coach.
Universal Literacy Year 2 Summary Report | 15
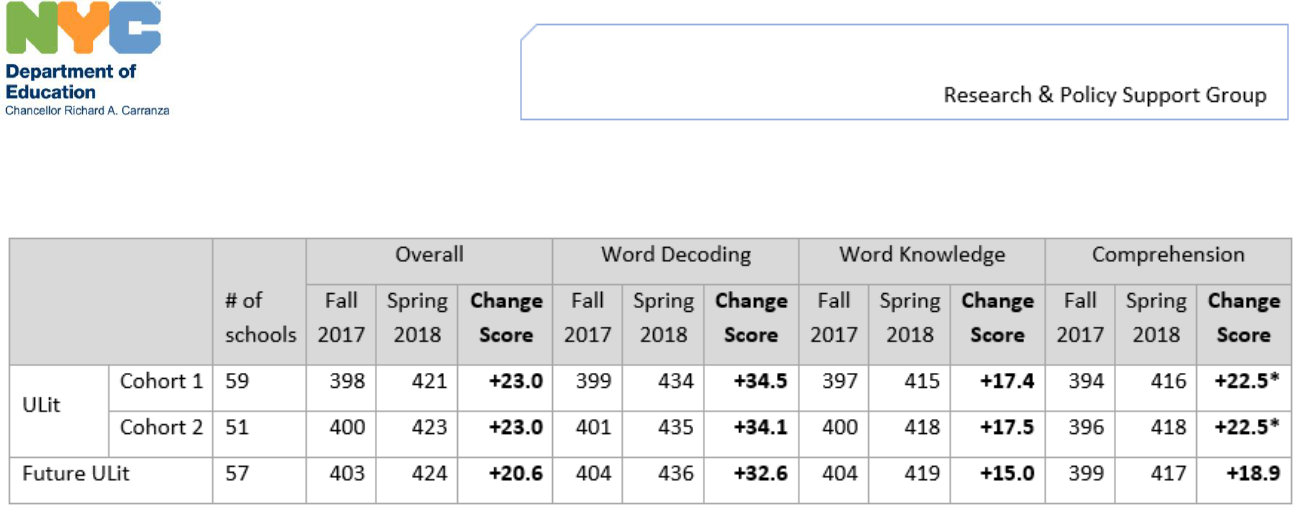
Table 6. GMRT Grade 2 scale scores, 2017–18
*Difference in change scores between ULit cohorts and the future-ULit cohort are statistically significant at p < 0.05.
Note: Cohort 1 are schools that received a Reading Coach in SY 2016–17; Cohort 2 are schools that received a Reading Coach in SY 2017–18; Future ULit are
schools slated to receive a Reading Coach in SY 2018–19.
Universal Literacy Year 2 Summary Report | 16
References
Aladjem, D. K., Birman, B. F., Orland, M., Harr-Robins, J., Heredia, A., Parrish, T. B., & Ruffini, S. J. (2010).
Achieving Dramatic School Improvement: An Exploratory Study. A Cross-Site Analysis from the Evaluation of
Comprehensive School Reform Program Implementation and Outcomes Study. Office of Planning, Evaluation
and Policy Development, US Department of Education. Retrieved from:
https://www2.ed.gov/rschstat/eval/other/dramatic-school-improvement/exploratory-study.pdf
Coburn, C. E., & Woulfin, S. L. (2012). Reading coaches and the relationship between policy and practice.
Reading Research Quarterly, 47(1), 5–30.
Deussen, T., Coskie, T., Robinson, L., & Autio, E; (2007); “Coach” can mean many things: five categories of
literacy coaches in Reading First (Issues & Answers Report, REL 2007–No. 005). Washington, DC: U.S.
Department of Education, Institute of Education Sciences, National Center for Education Evaluation and
Regional Assistance, Regional Educational Laboratory Northwest. Retrieved from
http://files.eric.ed.gov/fulltext/ED497517.pdf
Elish-Piper, L., & L'Allier, S. K. (2010). Exploring the relationship between literacy coaching and student
reading achievement in grades K-1. Literacy Research and Instruction, 49(2), 162–174.
Foorman, B., Beyler, N., Borradaile, K., Coyne, M., Denton, C. A., Dimino, J., Furgeson, J., Hayes, L., Henke, J.,
Justice, L., Keating, B., Lewis, W., Sattar, S., Streke, A., Wagner, R., & Wissel, S. (2016). Foundational skills to
support reading for understanding in kindergarten through 3rd grade (NCEE 2016-4008). Washington, DC:
National Center for Education Evaluation and Regional Assistance (NCEE), Institute of Education Sciences, U.S.
Department of Education. Retrieved from https://ies.ed.gov/ncee/wwc/PracticeGuide/21
Gibbons, L. K. & Cobb, P. (2017). Focusing on teacher learning opportunities to identify potentially productive
coaching activities. Journal of Teacher Education, 68(4), 411–425.
Heineke, S. (2013). Coaching discourse: Supporting teachers' professional learning. The Elementary School
Journal, 113(3), 409–433. DOI:10.1086/668767
L'Allier, S., Elish-Piper, L. and Bean, R. M. (2010), What matters for elementary literacy coaching? Guiding
principles for instructional improvement and student achievement. The Reading Teacher, 63(544–554).
doi: 10.1598/RT.63.7.2
Mangin, M. M., & Dunsmore, K. (2015). How the framing of instructional coaching as a lever for systemic or
individual reform influences the enactment of coaching. Educational Administration Quarterly, 51(2), 179–
213.
Matsumura, L. C., Sartoris, M., Bickel, D. D., & Garnier, H. E. (2009). Leadership for literacy coaching: The
principal’s role in launching a new coaching program. Educational Administration Quarterly, 45(5), 655–693.
Moats, L. C. (1999). Teaching reading is rocket science: What expert teachers of reading should know and be
able to do. (AFT Position Paper.) Washington, DC: American Federation of Teachers.
Moats, L. C. (2009). Knowledge foundations for teaching reading and spelling. Reading and Writing, 22(4),
379–399.
National Institute of Child Health and Human Development (NICHD). (2000). Report of the National Reading
Panel. Teaching children to read: An evidence-based assessment of the scientific research literature on reading
and its implications for reading instruction: Reports of the subgroups (NIH Publication No. 00-4754).
Universal Literacy Year 2 Summary Report | 17
Washington, DC: U.S. Government Printing Office. Retrieved from
https://www.nichd.nih.gov/sites/default/files/publications/pubs/nrp/Documents/report.pdf
National Research Council. (1998). Preventing Reading Difficulties in Young Children. Washington, DC: The
National Academies Press. https://doi.org/10.17226/6023.
Phillips, D., Nichols, W. D., Rupley, W. H., Paige, D., & Rasinski, T. V. (2016). Efficacy of professional
development: Extended use of focused coaching on guided reading instruction for teachers of grades one,
two, and three. International Research in Higher Education, 1(2). doi:10.5430/irhe.v1n2p12
Scott, S.E., Cortina, K.S., & Carlisle, J.F. (2012). Understanding coach-based professional development in
Reading First: How do coaches spend their time and how do teachers perceive coaches’ work? Literacy
Research and Instruction, 51(1), 68–85.
Snow, C., Griffin, P., & Burns, M. S. (Eds.). (2007). Knowledge to support the teaching of reading: Preparing
teachers for a changing world. John Wiley & Sons.
Zigmond, N., Bean, R., Kloo, A., & Brydon, M. (2011). Policy, research, and Reading First. In A. McGill-Franzen
& R.L. Allington (Eds.). Handbook of Reading Disability Research (pp. 464–476). New York: Routledge
Publishing.
Universal Literacy Year 2 Summary Report | 18

APPENDIX A: Data Sources
The evaluation used the following data sources:
• DOE institutional data – administrative data on district schools that contain grades K–2,
such as schools’ Economic N eed Index, ELA scores, school and student demographic
information, and numbers of students and teachers in K–2 classes.
• Program data – data collected b y the Universal Literacy initiative, including Digital Daily
Coach Log data and GMRT assessment data. The Digital Daily Coach Log data runs from
December 2017
– June 2018 and contains coaches’ self-reported responses about how they
spent their time in schools, measured b y how they spent the majority of each period in
school including which classrooms they worked in .
• Survey data – data from end-of-year online surveys sent to Reading Coaches, teachers, and
principals. Surveys focused on perceptions of the ULit initiative. Additionally, school
building leaders were asked about their desired communication channels and
communication quantity and their perceptions of coach responsibilities. Surveys w ere
anonymous and voluntary. Response rates for each group were:
○ Reading Coaches: 86% (206 out of 239 sent)—one-third of them Cohort 1 coaches
(72 out of 86 sent; 84% response rate) and two-thirds Cohort 2 (134 out of 150 sent;
89% response rate);
○ School building leaders: 39% (117 out of 303 sent); and
○ Teachers: 25% (1,026 out of 4,149 sent).
• Ethnographic data – data from site visits in SY 2017–18 to learn more about coach-teacher
dyads in five schools with Cohort 1 coaches. Sites were purposefully selected to be
representative of Cohort 1 district schools, with varied school sizes, ELL/SPED demographic
characteristics, and geographical locations in the Bronx and Brooklyn, and coaches who
planned their work with teachers in coaching cycles. Data collection activities included
observations, interviews, and artifact reviews.
Universal Literacy Year 2 Summary Report | 19

APPENDIX B: GMRT – Technical Report
This appendix provides technical information about the processing and analysis of Gates-MacGinitie Reading
Test (GMRT) data from the Universal Literacy (ULit) initiative.
ULit administered the GMRT in order to learn more about students’ reading abilities, since there are no city-
or state-wide reading tests administered in Grades K–2. Literacy leaders selected the GMRT Level 2 because
the assessment could be administered to an entire class at once, as opposed to each student individually.
School-based educators receive scores directly from the test vendor, Houghton-Mifflin Harcourt (HMH), via
an interactive online reporting system. The designated educator, usually the ULit Reading Coach or the
school’s testing coordinator, receives an email with login information that teachers can use to access their
students’ scores. Information from the GMRT about individual students can be used along with other
sources of information as the basis for organizing students into instructional groups, identifying students
who are ready for more advanced instruction, and selecting students for individual instruction. The
designated school-based educators also receive training in terms of implementing the GMRT and
interpreting the results and using them for instruction. Selected schools administer the GMRT in the fall and
spring of each year.
About the GMRT, Level 2
The Gates-MacGinitie Reading Tests are timed, norm-referenced assessments that measure reading
achievement from pre-reading to adult levels.
11
From Level 2 (corresponding to Grade 2) and above, the
tests are administered in group settings. The GMRT, Level 2 provides information about reading
achievement in three domains:
• Word Decoding — Student must accurately identify isolated words in grade word lists that
correspond to an illustration; “the test format and tested words measure primarily decoding skills
and word identification, rather than knowledge of word meanings” (MacGinitie, et al., 2002, p. 6).
• Comprehension — Student must read a passage of text and correctly answer relevant
comprehension questions, which in Level 2 are in the form of illustrations.
• Word Knowledge — Student must select an appropriate word based on given cues in a simple
illustration; vocabulary words are those GMRT authors judged as “likely to be known in speech and
print by Grade 2 students who possess good reading vocabularies” (MacGinitie, et al., 2002, p. 9).
The GMRT, Level 2 takes 75 minutes in total; students are given 20 minutes to complete the Word Decoding
and Word Knowledge subtests and 35 minutes for the Comprehension subtest. Universal Literacy
recommended that teachers administer the GMRT on three different days at their convenience, within a
two-week window. The GMRT, Level 2 comes in two parallel forms, S and T. Students received one version in
the fall and the other in the spring. Students mark their answers directly in the test booklet.
11
Source: GMRT test administration materials and https://usny.nysed.gov/rttt/teachers-leaders/assessments/docs/hmh-
gmrt-forms-c-and-g.pdf
Universal Literacy Year 2 Summary Report | 20

A designated person at the school shipped completed GMRT booklets to the vendor’s scoring center. HMH
machine-scored each box as it arrived and sent an email with information about how to access results to the
school’s designated GRMT coordinator, typically the ULit Reading Coach or school’s testing coordinator. The
DOE received a roll-up file with results after all test booklets were processed.
School Selection
School selection occurred in SY 2016–17, when schools were sampled from the original four districts.
Universal Literacy offered the GMRT to a random sample of schools in the original ULit districts (Cohort 1).
Each of those schools was then matched to a school that was slated to join the initiative in SY 2017–18
(Cohort 2), as well as a school that joined the initiative in SY 2018–19 (Future ULit). The matched schools
were offered the GMRT in advance of receiving coaching. The variables used for the matching included the
SY 2014–15 Grade 3 ELA proficiency rate; the trend in the Grade 3 ELA proficiency rate, 2013–2015; and a
neighborhood disadvantage index. A few schools were added in SY 2017–18 in order to ensure equal
representation among the three cohorts of ULit schools. Note: the selected schools are not representative of
schools across the city; ULit cohorts differ in terms of size, student demographics, and student achievement.
In addition, though the GMRT sample was created by matching schools, variation still exists between schools
across cohorts.
GMRT Scores
The GMRT reports student scores in a variety of ways, and in this report we use extended scale scores. In
previous reporting, we used grade equivalent scores. Scale scores refer to the continuous scale on which
GMRT results are measured, from Pre-Reading to Adult Reading. While grade equivalents are more easily
understandable, scale scores are more precise and are used for analyses. Scale scores on the GMRT capture
students’ reading ability on a linear scale that is useful for both comparison across grades and for analysis.
GMRT SY 2017–18 Administration
In SY 2017–18, 171 schools administered the GMRT to students in the Fall and Spring. A total of 14,255
Grade 2 students took the GMRT in SY 2017–18, defined as completing a minimum of one section. Of the
11,758 students completing both the Fall and Spring GMRT tests, 10,215 students attempted at least 90
percent of the items in both administrations. The analyses in this report use the growth scores of this latter
population, although results are similar when analyses are run with the former. Student characteristics were
similar for this analytic sample, when compared with the original universe of students (see Table below).
Universal Literacy Year 2 Summary Report | 21
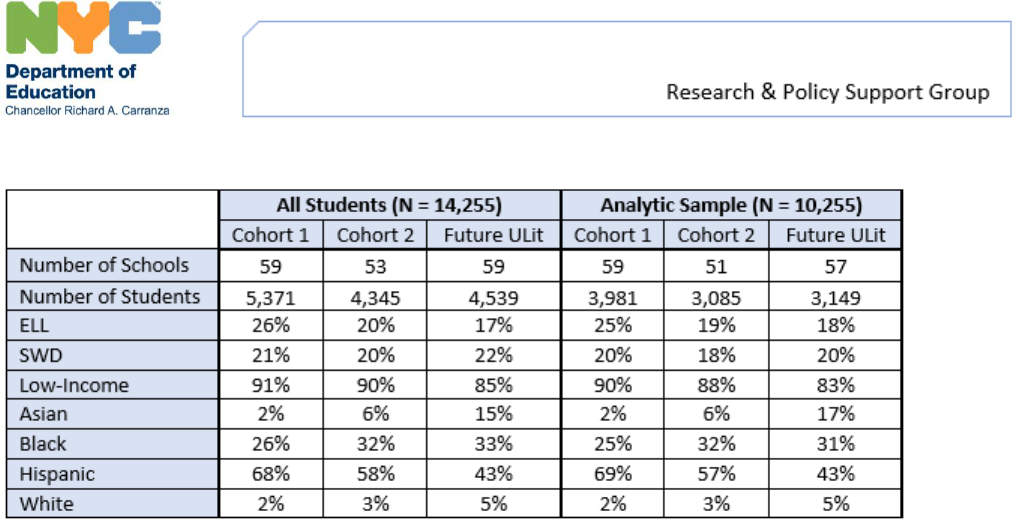
Table B1. GMRT sample characteristics SY 2017–18 – All students vs. analytic sample
Multilevel Models
Our GMRT analyses rely primarily on multi-level models, which are used in many education studies. Multi-
level models account for the fact that the many students who took the GMRT are grouped together in a
smaller number of schools. We determined that this approach was appropriate because we did not sample
students randomly from across the city. Rather, ULit sampled schools from the initial cohort of Universal
Literacy and offered access to the GMRT to matched comparison schools across the city; Grade 2 students in
those comparison schools then took the GMRT. One effect of using these multi-level models is that the
results of schools with larger numbers of students do not outweigh those of other schools with smaller
numbers of students.
These multilevel models allowed us flexibility in controlling for student characteristics. We ran models
without controls, as well as models with student-level controls for poverty, ELL status, disability status, and
ethnicity. The outcome for these models was Fall-to-Spring Growth in GMRT scale scores, both overall and
for each of the three GMRT subtests. The predictor of interest was ULit cohort membership, whether a
school was in Year 1 of ULit, in Year 2 of ULit, or not yet part of ULit.
We ran teacher-level models in addition to the school-level models to learn more about the effect of
coaching. Using data from coach logs, we were able to determine how many periods of coaching each
teacher received. We used this variable as our predictor of interest in a multi-level model wherein students
were clustered by classroom teachers, instead of schools. Similar to the school-level models, we controlled
for student characteristics as well as teacher characteristics and classroom type.
References for Appendix B
MacGinitie, W. H., MacGinitie, R. K., Maria, K., Dreyer, L. G. (2002). Gates-MacGinitie Reading Tests
Technical Report – Forms S and T. Riverside Publishing, Rolling Meadows, IL.
Universal Literacy Year 2 Summary Report | 22

Acrobat Accessibility Report
Accessibility Report
Filename: ulit_y2evalsummaryreport_sy2017-18_final_ADA.pdf
Report created by: [Enter personal and organization information through the Preferences > Identity dialog.]
Organization:
Summary
The checker found no problems in this document.
Needs manual check: 2
Passed manually: 0
Failed manually: 0
Skipped: 1
Passed: 29
Failed: 0
