KEY FISCAL AND POLICY ISSUES FACING
CALIFORNIA
LEGISLATIVE ANALYST’S OFFICE
2
LEGISLATIVE ANALYST’S OFFICE
Legislative Analyst
Gabriel Petek
Chief Deputy Legislative Analyst
Carolyn Chu
LEGISLATIVE ANALYST’S OFFICE
www.lao.ca.gov | (916) 445-4656
K-12 Education
Edgar Cabral, Deputy
Michael Alferes
Jackie Barocio
Sara Cortez
Kenneth Kapphahn
Higher Education
Jennifer Pacella, Deputy
Ian Klein
Lisa Qing
Paul Steenhausen
Economy, Taxes, and Labor
Brian Uhler, Deputy
Chas Alamo
Ross Brown*
Seth Kerstein
State Budget Condition
Ann Hollingshead
Environment and
Transportation
Rachel Ehlers, Deputy
Sarah Cornett
Frank Jimenez
Helen Kerstein
Luke Koushmaro
Sonja Petek
Public Safety and
Business Regulation
Drew Soderborg, Deputy
Anita Lee
Caitlin O’Neil
Orlando Sanchez Zavala
Jared Sippel
Health, Developmental
Services, and Technology
Mark Newton, Deputy
Jason Constantouros
Karina Hendren
Brian Metzker
Ryan Miller
Will Owens
Human Services and
Governance
Ginni Bella Navarre*, Deputy
Sonia Schrager Russo
Nick Schroeder
Angela Short
Juwan Trot ter
Administration and Support
Kelley Sammarcelli, Administrative Officer
Sarah Barkman
Karla Belmonte
Tamara Lockhart
Anthony Lucero
Sarah Scanlon
Information Services
Michael Greer, Manager
Vu Chu**
Linda Le
Mohammed Mohammed Saeed
*Coordinators of Key Issues.
**Key Issues creative and design lead.
3
LEGISLATIVE ANALYST’S OFFICE
TABLE OF CONTENTS
INTRODUCTION ..................................................5
Chapter1: Economic Growth and Opportunity ............................8
Economic Mobility and Inequality ................................................. 10
Competitive Business Environment ................................................ 13
Educational Access and Outcomes ................................................ 16
Working in California .......................................................... 19
State Infrastructure Needs ......................................................22
Transportation Mobility .........................................................25
Chapter2: Health, Safety, and Well-Being ..............................28
Housing and Homelessness .....................................................30
Poverty Alleviation and Prevention ................................................33
Public Health ................................................................36
Access to Quality Health Care ...................................................38
Criminal Justice System Outcomes ................................................ 41
Climate Change ..............................................................44
Emergency Response and Preparedness ........................................... 47
Chapter3: Fiscal Health, Governance, and Oversight .....................50
Structuring the Budget ......................................................... 52
Intergovernmental Relations .....................................................55
The State’s Role in Technology ...................................................58
Conclusion .....................................................61
4
LEGISLATIVE ANALYST’S OFFICE

5
LEGISLATIVE ANALYST’S OFFICE
INTRODUCTION
The Role of the LAO. The LAO has provided nonpartisan fiscal and policy advice to the
Legislature for over 80 years. The office serves as the “eyes and ears” for the Legislature to
ensure that the executive branch and other program administrators are implementing legislative
policy in an efficient, effective, and equitable manner. Some of our key functionsinclude:
• Bringing important fiscal and policy issues to the attention of the Legislature, including
analyzing the Governor’s budget proposals and making recommendations to the Legislature.
• Undertaking self-directed research projects analyzing these issues and making
recommendations intended to help the Legislature address them.
Development of This Document. To assist in our ongoing effort to serve the Legislature
in this capacity, we undertook an officewide process to develop a list of the most important
long-term fiscal and policy issues facing California. The list of issues was developed over
time with input and feedback from across the office. As our work progressed, these topics
were further defined, organized, and shared with members of the Joint Legislative Budget
Committee—the committee that oversees our office—in an effort to seek additional feedback.
Throughout this process, we thought about the key factors affecting the current and future
well-being of Californians with an eye towards possible legislative actions. Importantly, although
this list reflects our office’s attempt to identify the most important issues, it is not meant to be
an exhaustive list of issues facing the state, nor does it necessarily reflect the priorities of the
Legislature as a whole. That said, the Legislature has taken actionin recent years to adopt
policies that attempt to address many of the issues we raise in this report.
How Can This Document Be Used? First, we hope this document can serve as a resource
to the Legislature as it (1)determines where to focus its policy, budget, and oversight efforts
and (2)evaluates various policy and budget options. Second, this document will serve as an
internal guide when we select our self-directed research projects. By identifying these important
longer-term issues, we are better positioned to connect our work towards the most critical and
crosscutting policy issues facing the state.
LAO Reports Will Continue to Provide More Detailed Analysis. Notably, this document does
not include recommendations. For many aspects of the key issues identified here, our office
has already issued reports with specific findings and recommendations. However, future LAO
reports will attempt to expand on these past efforts and fill in gaps where additional analysis
could help inform legislative decisions. When analyzing policies and developing reports, our
office will continue to consider several different lenses. These include:
• Effectiveness. Does a policy result in the intended outcomes?
• Efficiency and Cost-Effectiveness. Do the benefits of a policy outweigh the costs? Are the
policy goals achieved at the lowest possible cost?
• Equity. How does a policy or existing condition affect specific populations or
groups differently?
6
LEGISLATIVE ANALYST’S OFFICE
Key Issues Are Longer Term, Office Remains Nimble and Responsive. This document is
meant to focus on longer-term issues facing the state that do not typically change from year
to year. However, the list of key issues should be considered to be dynamic and subject to
periodic revision. As the policy challenges facing the state evolve, so too will the list of major
issues identified on this list. Unanticipated events will arise that will require us to change our
course and focus. These unanticipated events may not always fit neatly into this list of key fiscal
and policy issues as it is constructed today. As an organization, we will continue to attempt to
prioritize the most important issues and respond to the needs of the Legislature. Additionally,
since this list will be updated periodically, to the extent these unanticipated events result in
longer-term policy considerations, they could potentially be included in future iterations of our
list of key fiscal and policy issues facing California.
A Roadmap for This Document. The rest of this document is organized into three chapters—
each representing a major category of issues facing the state. The major categories are:
• Economic Growth and Opportunity.
• Health, Safety, and Well-Being.
• Fiscal Health, Governance, and Oversight.
Each major category includes several long-term policy issues facing the state. For each issue,
we discuss (1)why it is important and (2)key legislative considerations. Although we identify and
describe each issue separately in this document, in reality, there is a lot of overlap. For example,
many aspects of health and safety can be important direct and indirect drivers of economic
growth and opportunity, and vice versa. Similarly, effective governance and oversight are
tools to ensure public policy supports economic growth and opportunity, as well as the overall
well-being of Californians.
7
LEGISLATIVE ANALYST’S OFFICE

8
LEGISLATIVE ANALYST’S OFFICE
8
CHAPTER 1 ECONOMIC GROWTH AND OPPORTUNITY
LEGISLATIVE ANALYST’S OFFICE
9
LEGISLATIVE ANALYST’S OFFICE
9
LEGISLATIVE ANALYST’S OFFICE
CHAPTER 1 ECONOMIC GROWTH AND OPPORTUNITY
CHAPTER1
ECONOMIC GROWTH AND
OPPORTUNITY
Economic growth is a major driver of improved living standards and creates opportunities for
Californians to flourish. Importantly, however, not all households and workers benefit equally
from economic growth, and many Californians still struggle to climb the economic ladder.
The Legislature can play a role in supporting long-term statewide economic growth while also
ensuring the gains from such growth are widespread. In this chapter, we discuss many of the
key factors that are likely to drive long-term economic growth and opportunity, including an
educated and productive workforce, a business environment where companies can innovate
and compete in a global marketplace, and infrastructure that can support these activities.
10
LEGISLATIVE ANALYST’S OFFICE
10
CHAPTER 1 ECONOMIC GROWTH AND OPPORTUNITY
LEGISLATIVE ANALYST’S OFFICE
ECONOMIC MOBILITY AND INEQUALITY
Economic well-being varies dramatically among Californians. California is home to some of the
richest people in the world, while at the same time over 10percent of the state’s population
lives in poverty. Economic inequality refers to how much economic well-being differs among
members of a population. Relatedly, economic mobility refers to the ability of individuals or
families to improve their economic status—their level of economic well-being compared to
others—over time.
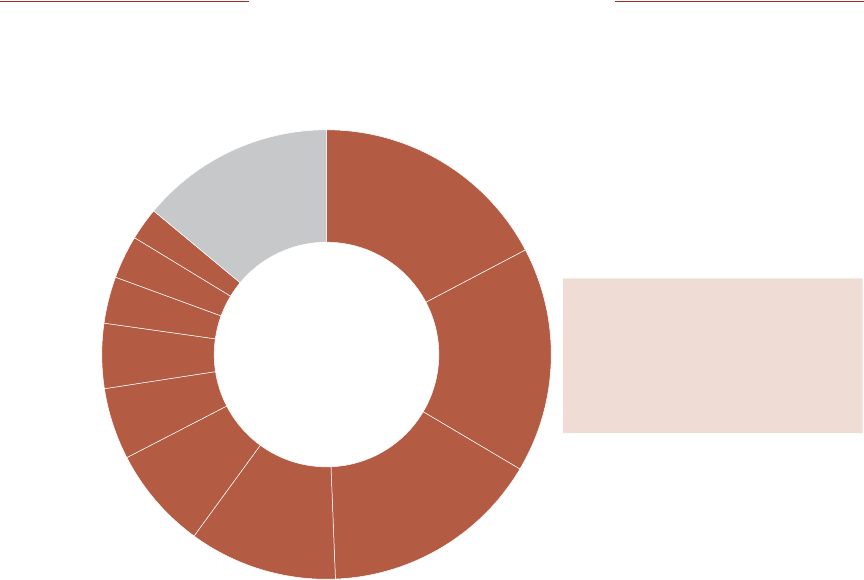
Small Share of Households Earn Most of the Income
Taxable Income, 2021
Share of California Households
Share of Income
The richest 1 percent
earn about one-quarter
of all income
WHY IS IT IMPORTANT?
Economic Mobility Underlies a Functioning Economy. The idea that an individual’s hard
work, innovation, and talent will be rewarded with improved economic status is fundamental to
the functioning of our market economy. Workers, businesses, investors, and entrepreneurs all
operate under this assumption.
Some Groups Face Greater Barriers to Mobility. Ideally, no person or group would face
greater barriers to economic mobility than others. Evidence suggests, however, that some
groups—such as Black and Native American men—have faced and continue to face greater
barriers to economicmobility.
Source: Chetty et al. (2018).
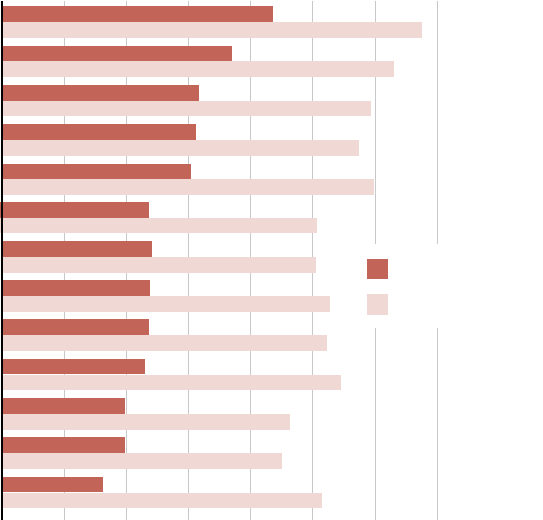
Economic Mobility Differs Across Groups
This chart shows where the incomes of people born in California to low-income parents between 1978 and 1983 rank in the national income
distribution. All groups experienced upward mobility, but some less than others.
Parents Child at Age 35
25 50 75%
Men
Asian
White
Hispanic/Latino
Black
25 50 75%
Women
Asian
White
Hispanic/Latino
Black
Native American
Native American
11
LEGISLATIVE ANALYST’S OFFICE
11
LEGISLATIVE ANALYST’S OFFICE
CHAPTER 1 ECONOMIC GROWTH AND OPPORTUNITY
Lack of Mobility Can Give Rise to Inequality. Some differences in economic outcomes
across people are inevitable. Persistent and substantial economic inequality, however, can raise
concerns. This is especially true if inequality arises from economically disadvantaged children
having fewer opportunities for mobility.
State Has Many Efforts Aimed at Improving Mobility. Many public programs aim to
promote economic mobility. These include education and rehabilitation programs, as well
as various types of assistance to working families. Similarly, the state also often seeks to
promote mobilitythrough laws and policies, such as labor standards, housing policies, and
antidiscrimination laws.
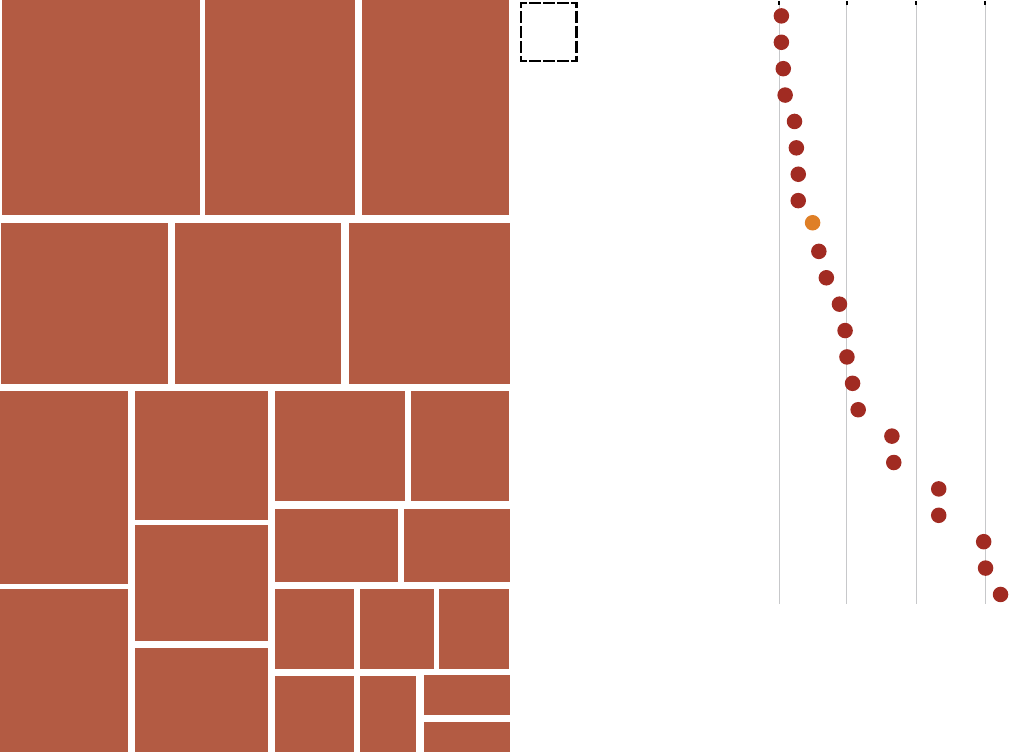
Source: Chetty et al. (2018).
Children From High-Income Families Are
Twice as Likely to Become High Income Themselves
Share of People Born in California Between 1978 and 1983 That Are High Income as Adults
5 10 15 20 25 30 35%
Fresno
Riverside
San Bernardino
Kern
Los Angeles
San Diego
Sacramento
Contra Costa
Orange
Alameda
Santa Clara
San Francisco
Low-Income Parents
High-Income Parents
Statewide

12
LEGISLATIVE ANALYST’S OFFICE
12
CHAPTER 1 ECONOMIC GROWTH AND OPPORTUNITY
LEGISLATIVE ANALYST’S OFFICE
WHAT ARE KEY LEGISLATIVE CONSIDERATIONS?
Î What Factors Explain Differences in Mobility? The underlying causes of economic
mobility are complex and uncertain. Existing research provides suggestive evidence that
links certain factors to higher or lower economic mobility. Examples of factors that are
linked to higher mobility are access to quality education, two-parent households, and social
connections across economic classes. Examples of factors that are linked to lower mobility
are poverty, racial segregation, and involvement with the criminal justice system.
Î Which Factors Can Be Influenced by the State? Some factors associated with economic
mobility are more readily influenced by state policy than others. In some cases, direct
interventions may improve mobility. For example, cash assistance to families could promote
mobility by keeping children from growing up in deep poverty, thereby improving their
chances. In many cases, however, the connection is less direct. An example is a policy
that facilitates home building in communities with low crime and high-performing schools.
Considering these potential indirect effects is important because many factors are not
amenable to direct intervention.
Î What Role Do State Programs Play in Promoting Mobility? Carefully considering
whether public programs are appropriately structured to promote mobility is a key avenue
through which the state can pursue this objective. For example: does a program target the
correct populations, do economically disadvantaged groups have sufficient access, and are
the most appropriate and effective avenues of intervention being pursued?
13
LEGISLATIVE ANALYST’S OFFICE
13
LEGISLATIVE ANALYST’S OFFICE
CHAPTER 1 ECONOMIC GROWTH AND OPPORTUNITY
COMPETITIVE BUSINESS ENVIRONMENT
Future economic growth depends, in part, on California’s ability to be an attractive place for
businesses. Every year, some businesses move into California or expand their operations
here, while others leave the state or shrink their operations. Businesses consider many factors
when deciding where to invest and operate, and a wide variety of state policies can affect
thesedecisions.
WHY IS IT IMPORTANT?
California’s Business Environment Has Both Strengths and Challenges. Various
organizations publish rankings of states according to their business and tax policies. Many of
these reports conclude that California has a poor business climate. However, measuring overall
competitiveness is difficult and multifaceted. On some measures, such as venture capital
funding and innovation, California ranks towards the top of country. On other measures, such as
overall taxation and cost of doing business, California ranks near thebottom.
Private Businesses Provide Most of the Jobs in California
Employment by Industry, 2022
Trade, Transportation,
and Utilities
Health Services
and Private
Education
Professional and
Business Services
Leisure and
Hospitality
Manufacturing
Mining, Logging,
and Construction
Financial Activities
Information
Other Services
Farming
Government
Total Jobs
18.1 Million
(not including self-employed)
California's large, diverse economy
is sustained by the activities of private
sector companies.
Over 85 percent of California's 18 million
jobs are in the private sector, providing
valuable goods and services.
14
LEGISLATIVE ANALYST’S OFFICE
14
CHAPTER 1 ECONOMIC GROWTH AND OPPORTUNITY
LEGISLATIVE ANALYST’S OFFICE
State and Local Tax Base Relies on a Healthy Private Sector Economy. Public spending on
education, public safety, infrastructure, and other programs are funded by taxes on the state’s
diverse private sector economy.
WHAT ARE KEY LEGISLATIVE CONSIDERATIONS?
Î How Can State Policies Improve California’s Competitiveness? Commonly cited
concerns about the state’s business environment include high income taxes and overly
burdensome regulations that affect business costs. The Legislature can make California a
more attractive place for business investment by ensuring that the system of taxation and
regulation is not unduly burdensome. In addition, California’s high cost of living—driven
primarily by housing costs—may affect firms’ ability to hire and retain employees. Policies to
reduce the costs of housing can enhance firms’ ability to attract employees. Finally, policies
to promote a reliable public infrastructure and a highly skilled workforce can also help
ensure California is attractive to businesses.
Î How to Balance Policy Actions With Other Goals? Sometimes actions the state can
take to attract businesses are aligned with other state policy goals. For example, actions
to address the high cost of living through increasing the supply of new housing also may
help to reduce homelessness. Other times, however, the state must balance the goal of
attracting businesses with competing objectives. For example, a broad-based tax cut to
address concerns about high taxes also would necessitate reduced spending on public
programs. Also, many existing regulations that increase the cost of doing business in
California are intended to improve environmental quality or provide protections for workers.
In such cases, the state must balance the goal of attracting businesses with these
competing objectives.
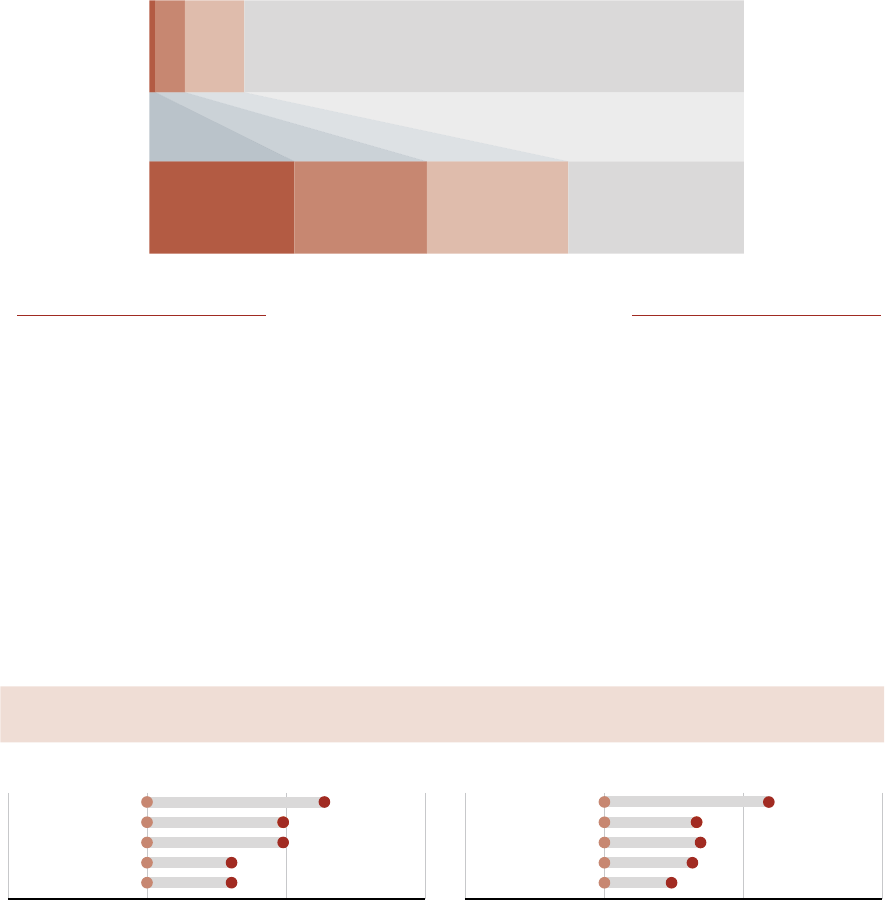
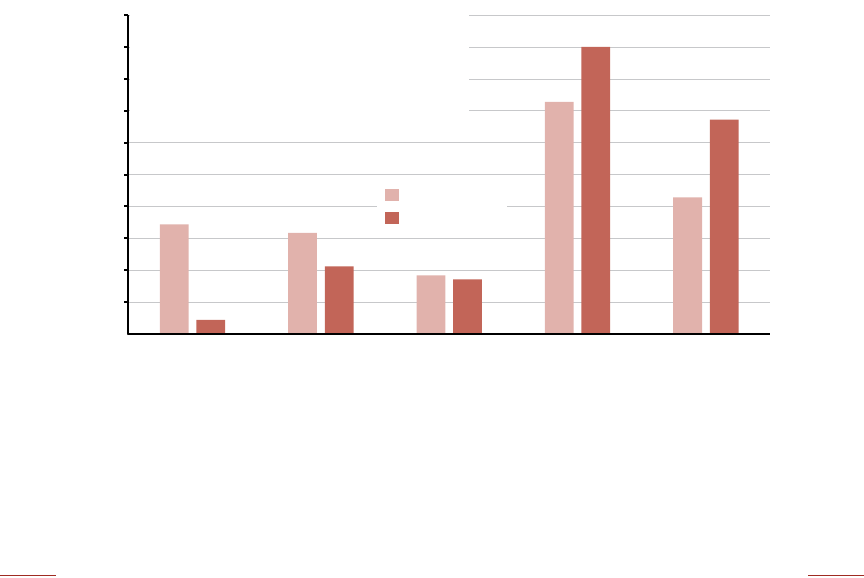
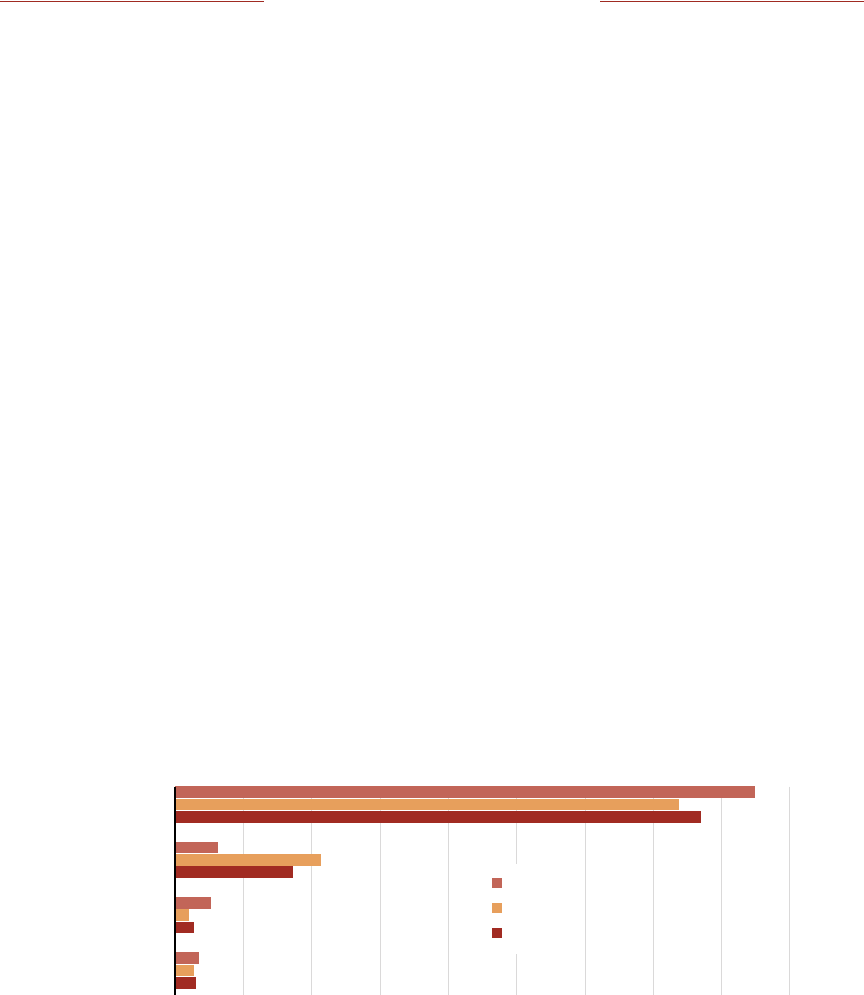
Most Jobs Are at Older Businesses,
But New Businesses Are an Important Driver of Job Creation
Percent of Total Employment and Gross Annual Job Creation by Firm Age, 2019
Although most jobs come from older businesses,
new businesses account for a disproportionate
share of job creation. New businesses are also
more sensitive to swings in economic conditions
and the rate of new business creation can be a
leading indicator of changes in unemployment.
5
10
15
20
25
30
35
40
45
50%
0 Years 1-5 Years 6-10 Years 11+ Years Firms Created
Before 1977
Job Creation
Employment
15
LEGISLATIVE ANALYST’S OFFICE
15
LEGISLATIVE ANALYST’S OFFICE
CHAPTER 1 ECONOMIC GROWTH AND OPPORTUNITY
Î How Effective Are Business Hiring or Investment Incentives? The Legislature
has established various programs that address specific business climate concerns.
For example, the state’s motion picture production tax credit subsidizes the film and
television industry and the California Competes grant and tax credit programs seek to retain
or attract businesses to the state. Consistent evaluation of these programs could determine
whether they are achieving their intended goals and help make them more effective, and the
Legislature can apply lessons learned to new business incentive programs. Additionally, any
potential benefits from business incentives must be balanced against the forgone revenue
that could have been used for other public programs.

16
LEGISLATIVE ANALYST’S OFFICE
16
CHAPTER 1 ECONOMIC GROWTH AND OPPORTUNITY
LEGISLATIVE ANALYST’S OFFICE
EDUCATIONAL ACCESS AND OUTCOMES
California’s education system consists of early education centers, K-12 schools, community
colleges, the California State University (CSU), the University of California (UC), and various
other public and private education institutions. The California Constitution gives individuals a
right to access a public education system. Two major education issues facing the state are:
• Promoting Access. The state seeks to ensure students have access to an array of high-
quality academic courses; career training programs; and other services, such as special
education and counseling. At public colleges and universities, the state also regularly
assesses enrollment levels and the availability of student financial aid.
• Improving Outcomes. Across all education segments, the state aims to provide education
that is personally, socially, and economically valuable, while having students of all groups
complete their intended academic pathways in a timely manner.
WHY IS IT IMPORTANT?
Education Is Largest Component of State Budget. Almost half of state General Fund
spending is for education programs. More General Fund is spent on education programs
collectively than any other area of the state budget.
Education Provides Statewide and Individual Benefits. Having an educated public can
contribute to an informed citizenry and produce the skills needed for California’s economy.
Students with higher levels of educational attainment also tend to benefit individually through
higher lifetime earnings, greater economic mobility, and other improved lifeoutcomes.
17
LEGISLATIVE ANALYST’S OFFICE
17
LEGISLATIVE ANALYST’S OFFICE
CHAPTER 1 ECONOMIC GROWTH AND OPPORTUNITY
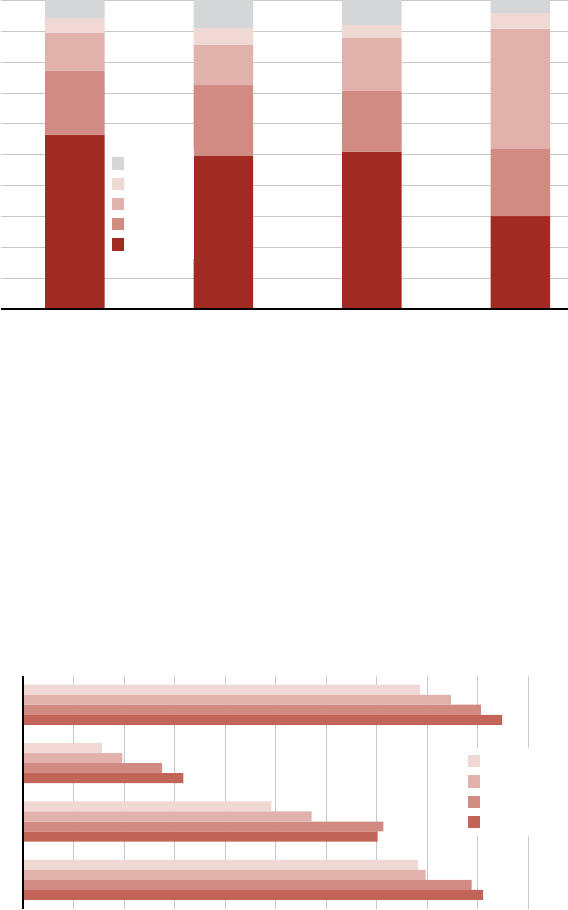
Some Student Groups Access UC at Lower Rates. Hispanic/Latino students comprise
55percent of the state’s high school population but 30percent of the resident undergraduate
population at UC (which is the state’s most selective public university system). Similar access
issues exist for other student groups, including low-income students, which also have lower
enrollment rates at UC compared to their share of the high school population.
Note: CSU and UC data reflect resident undergraduate students only.
10
20
30
40
50
60
70
80
90
100%
9-12 CCC CSU UC
Latino Students Make Up Much Larger Share of
Student Body at High Schools Than UC
Fall 2022
Black
White
Hispanic/
Latino
Other
Asian
Note: Reflects four-year high school graduation rate, four-year CCC graduation or transfer rate, and six-year CSU and
UC graduation rates for students entering as freshmen. Reflects most recent cohort data available (the high school
cohort starting in 2018-19 and the higher education cohort starting in 2016-17).
Some Student Groups Graduate at
Notably Lower Rates
10 20 30 40 50 60 70 80 90 100%
UC
CSU
CCC
High School
Black
Hispanic/Latino
White
Asian
Outcomes Are Worse for Some Student Groups and at Some Segments. Graduation rates
tend to be lower for Hispanic/Latino and Black students than other student groups. Graduation
rates also tend to be lower at some segments, particularly the community colleges, than at
other segments. Gaps in graduation rates exist by socioeconomic status, gender, and various
other student factorstoo.

18
LEGISLATIVE ANALYST’S OFFICE
18
CHAPTER 1 ECONOMIC GROWTH AND OPPORTUNITY
LEGISLATIVE ANALYST’S OFFICE
WHAT ARE KEY LEGISLATIVE CONSIDERATIONS?
Î How Will the Legislature Prioritize Among Its Educational Objectives? The Legislature
will continue to face trade-offs between promoting greater access (such as funding more
enrollment or more financial aid) and improving outcomes (such as enhancing student
support programs). Moreover, some options will be costlier than others. For example,
funding an additional enrollment slot at UC costs more than an additional slot at CSU.
Î How Will the Legislature Align Its Fiscal and Policy Decisions With Its Educational
Objectives? Each year, the Legislature makes important decisions about how to allocate
education funding. In particular, as part of the annual budget process, the Legislature
regularly considers how best to align its education funding formulas, categorical programs,
staff recruitment and retention initiatives, higher education enrollment targets, and capital
priorities with its access and outcome goals. The Legislature also regularly makes important
policy decisions involving educational access and outcomes. In particular, it faces key
decisions around eligibility for education programs and services, academic standards,
educator qualifications, facility utilization, and program improvement.
Î How Could the Legislature Improve the Ways It Measures Educational Access and
Outcomes? The Legislature puts testing, data, and reporting requirements in place to
track educational access and outcomes, with the overarching goal of conducting effective
oversight and improving educational programs. The Legislature may want to continue
looking for ways to make these assessment tools and data as reliable and meaningful as
possible. The Legislature might also want to continue exploring ways to make longitudinal
and cross-segment data more consistent and readily available.
19
LEGISLATIVE ANALYST’S OFFICE
19
LEGISLATIVE ANALYST’S OFFICE
CHAPTER 1 ECONOMIC GROWTH AND OPPORTUNITY
WORKING IN CALIFORNIA
California’s roughly 20million workers work in a variety of occupations, in different
environments, and earn a range of wages. The state’s labor market is constantly evolving.
Theskills required of workers change over time, as does the nature of their work. Each month,
about 500,000 workers switch jobs, often seeking higher pay, improved working conditions, or
a better match to their skills.
Categories shown are from the U.S. Bureau of Labor Statistics' Occupational
Employment and Wage Statistics program.
Some titles abbreviated for simplicity.
What Do Californians Do for Work?
2022
Office Support Staff Sales Staff
Truck Drivers
and Warehouse
Workers
100K
Workers
Doctors, Nurses,
and Medical Techs
Restaurant
Workers
Managers
Business
Operations
Workers
Manufacturing
Software
Developers
Installation
and
Repair
Workers
Teachers
Home
Health Aids
Janitors and
Landscapers
Public Safety
and
Private Security
Engineers
Art and
Media
Workers
Personal
Services
Workers
Construction
Social
Workers
Farmers
Scientists
Lawyers
Californians Earn a Range of Wages
Agricultural Workers
Home Health Aids
Restaurants Workers
Personal Services
Sales Staff
Janitors and Landscapers
Manufacturing
Drivers and Warehouse Staff
Office Support Staff
Public Safety/Private Security
Installation and Repair Workers
Social Workers
Construction
Teachers
Art and Media Workers
Business Operations Workers
Scientists
Engineers
Doctors, Nurses, and Medical Techs
Lawyers
Software Developers
Managers
15 30 45 $60
Median Hourly Wage 2022
Statewide Average
20
LEGISLATIVE ANALYST’S OFFICE
20
CHAPTER 1 ECONOMIC GROWTH AND OPPORTUNITY
LEGISLATIVE ANALYST’S OFFICE
WHY IS IT IMPORTANT?
Work Is Central to Well-Being of California’s 20Million Workers. California’s economy
provides most workers with stable jobs that create economic security for themselves and their
families. The Legislature oversees the state’s labor market with an eye toward balancing the
needs of businesses and workers. For example, the state sets the minimum wage, rest break
requirements, and workplace safety laws that employers must follow. Yet, for some workers—
disproportionately women and workers of color—wages alone are insufficient to meet the high
cost of living in California. Further, difficult working conditions—such as inconsistent scheduling
or job insecurity—can lead to stress and fragile household budgets.
State Programs Can Help Californians Acquire Job Skills. The state oversees schools,
community colleges and universities, and career technical education programs which, among
other things, help Californians acquire workplace skills. Businesses and governments thrive
when they can attract skilled and dependable workers. These workers deliver valued goods and
services and help drive innovation, which is at the center of a growing economy.
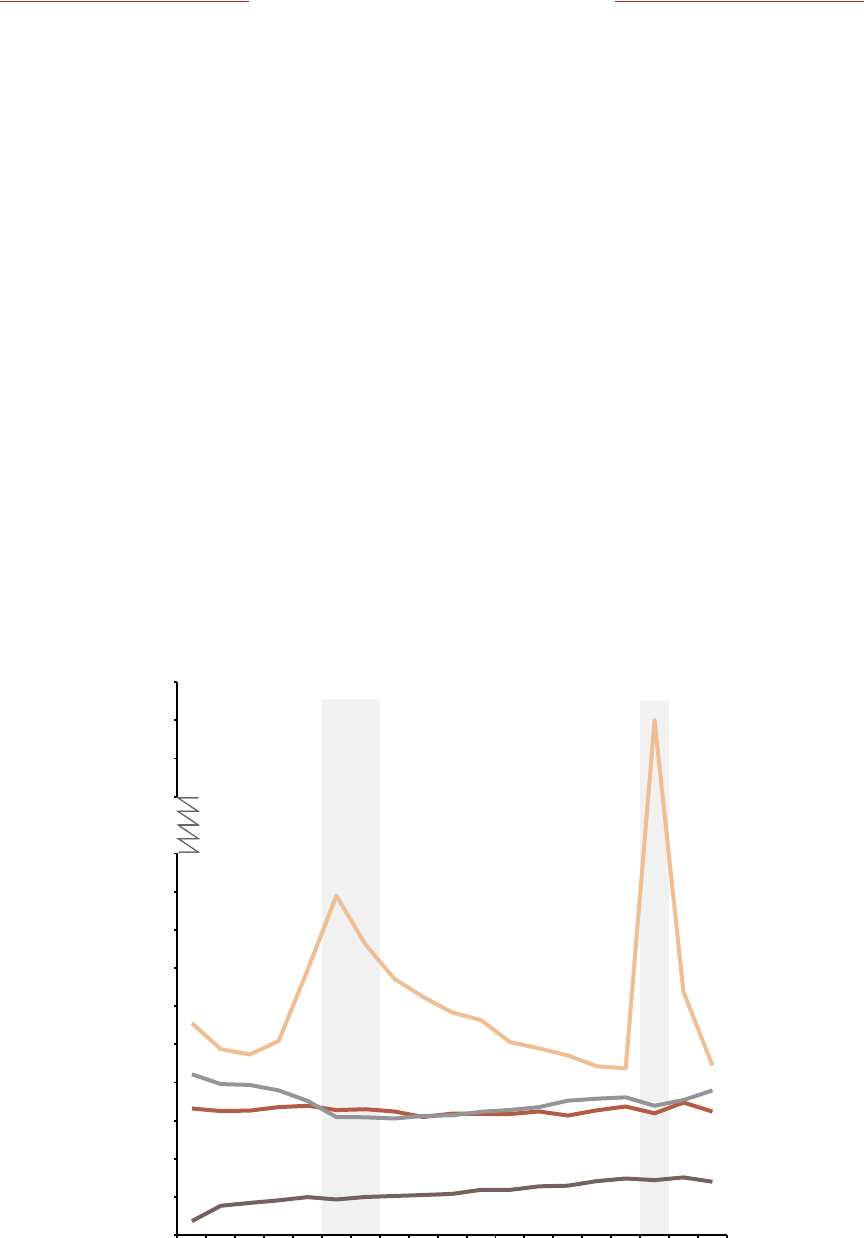
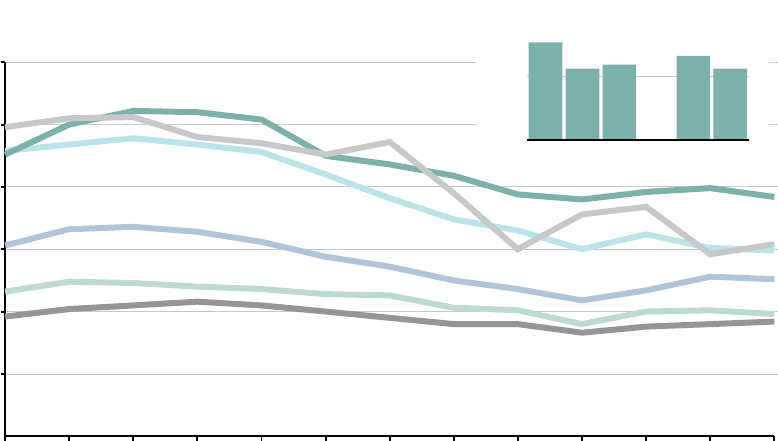
State Also Supports Workers in Transition. The state runs work insurance programs to
support workers during labor market transitions, injuries, and life changes. For instance,
the state provides temporary benefits to workers who leave work to bond with a new child
or care for an ill relative. Each year, about one in seven workers uses one of the state’s work
insuranceprograms.
-
200,000
400,000
600,000
800,000
1,000,000
1,200,000
1,400,000
1,600,000
1,800,000
2,000,000
2004 2006 2008 2010 2012 2014 2016 2018 2020 2022
4,600,000
4,800,000
5,000,000
5,200,000
Annual Claims for Major State Work Insurance Programs
Paid Family Leave
Disability Insurance
Workers' Compensation Insurance
Unemployment Insurance

21
LEGISLATIVE ANALYST’S OFFICE
21
LEGISLATIVE ANALYST’S OFFICE
CHAPTER 1 ECONOMIC GROWTH AND OPPORTUNITY
WHAT ARE KEY LEGISLATIVE CONSIDERATIONS?
Î Is the State Running Its Work Insurance Programs Effectively? Some workers find the
state’s longstanding work insurance programs are difficult to navigate and often delayed.
The Legislature could consider what steps would improve the state’s work insurance
programs and update the programs to match changes in the state’s labor market.
For example, the Legislature could consider ways to streamline applications and ongoing
paperwork so receiving benefits is easier and faster for workers.
Î Does the Legislature Have Tools to Improve Job Quality? Many workers could benefit
from more stable jobs, with higher wages, and improved working conditions. In what
direct or indirect ways can the Legislature improve job quality for these workers? And how
should the Legislature weigh the benefits of these changes against the potential costs
to businesses?
Î Can the Legislature Expand Access to Good Jobs for Workers Who Face Barriers?
Some groups of workers—notably Black and Hispanic/Latino workers, as well as many
immigrant workers—are less likely to work in high-wage, stable fields that provide economic
security and an opportunity for wealth building. The underlying causes of these inequities
are complex but can be tied to factors such as poverty, limited access to quality education,
fewer networking connections, and involvement with the justice system. In what ways, and
to what extent, can the Legislature orient programs and policies to expand access to good
jobs for these workers?
Î What Role Should the State Play in Supporting New Technologies and Preparing for
Upcoming Changes? Many changes to the state’s economy and labor market are on the
horizon—including climate change adaptation, the role that artificial intelligence will play
across all sectors, and an increasingly digital labor marketplace. Even though some of these
changes have the potential to increase overall productivity—such as the rapid development
of artificial intelligence—they could still lead to significant shifts in the types of jobs available
and worker skills needed. What role and capacity does the state have to help workers
navigate these changes? Possibilities might include steps to retrain workers whose jobs
are disrupted by new technology, funding local efforts to prepare for a changing climate, or
charting career pipelines to emerging but uncertain labor fields.
22
LEGISLATIVE ANALYST’S OFFICE
22
CHAPTER 1 ECONOMIC GROWTH AND OPPORTUNITY
LEGISLATIVE ANALYST’S OFFICE
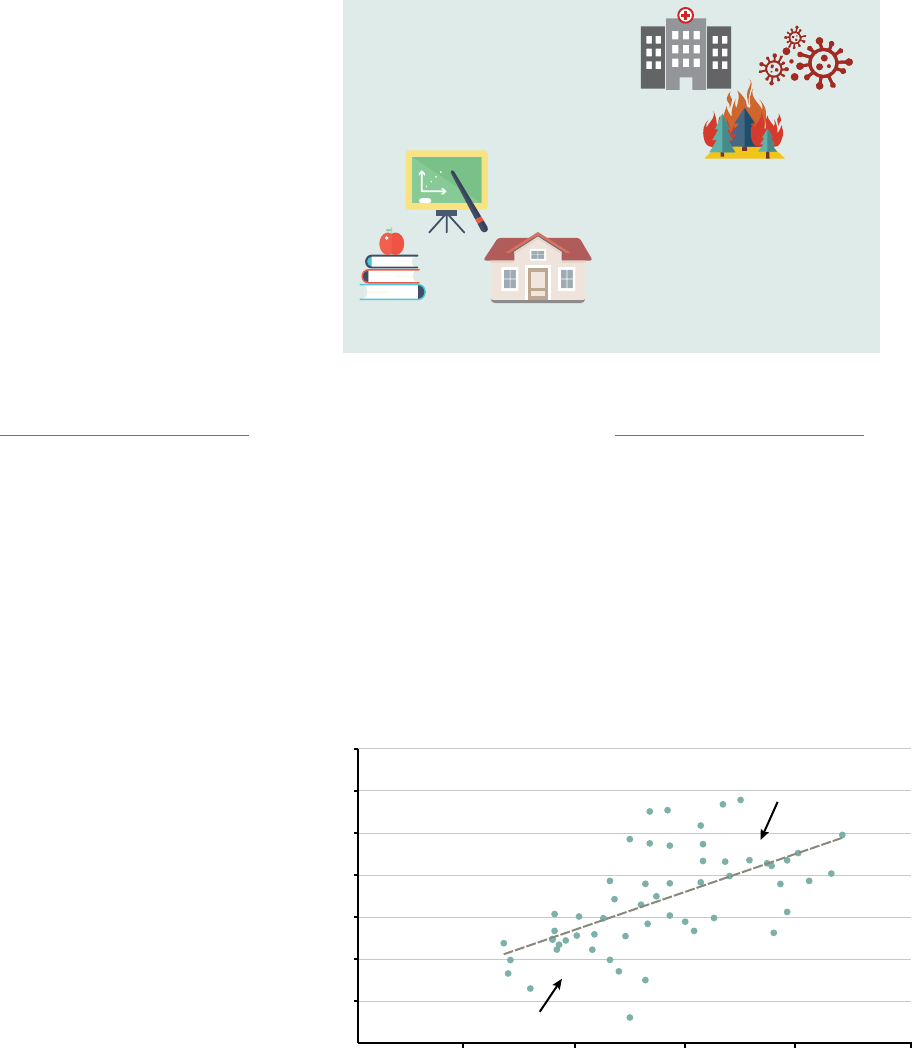
STATE INFRASTRUCTURE NEEDS
California has a vast array of infrastructure in sectors such as transportation, health services,
education, criminal justice, water and other natural resources, broadband, and electric utilities.
California’s infrastructure is owned, operated, and maintained by various levels of government
and private entities. The state has a direct and primary role in ensuring the adequacy of the
infrastructure it owns. In some cases, the state also provides regulatory oversight and financial
support for infrastructure owned by other entities.
WHY IS IT IMPORTANT?
Effective Infrastructure Is Integral to Economic Activity and Quality of Life. Effective
infrastructure—such as for electricity and transportation—can facilitate goods production and
trade as well as improve productivity. In addition, infrastructure can facilitate the delivery of
programs and services that impact the quality of life for residents, such as providing access to
clean drinking water, education, and recreational spaces.
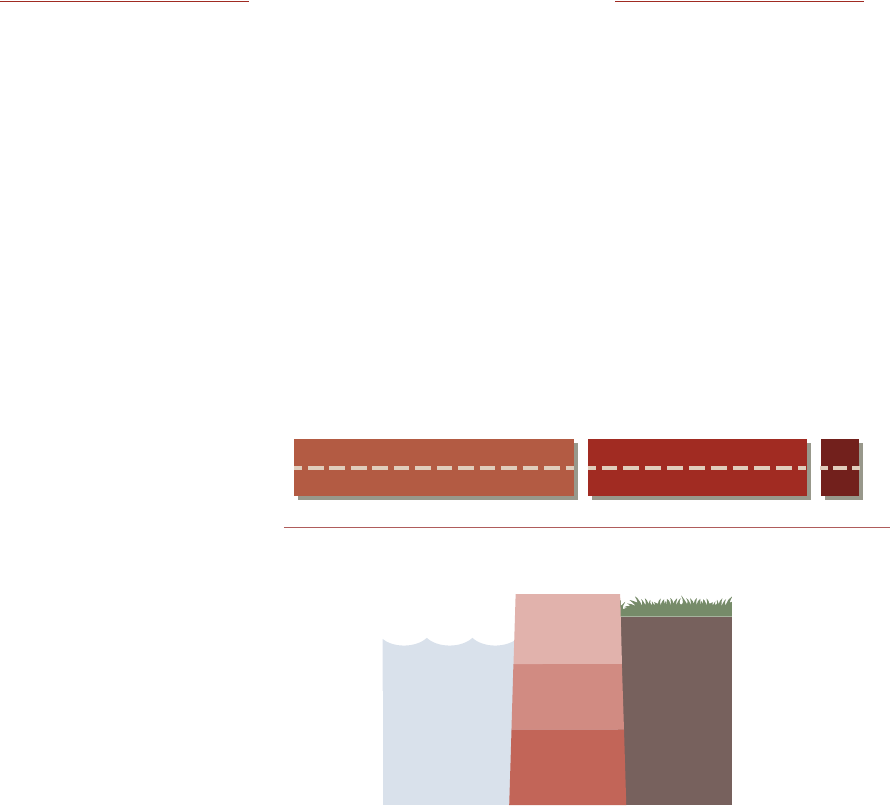
Existing Infrastructure
Is Aging and in Need of
Repair or Replacement.
Many components of
California’s infrastructure—
such as much of its levee
system, highway system,
and electricity transmission
and distribution
infrastructure—were
built decades ago and
may require substantial
upgrades to enable them
to continue to provide
safe, efficient, and reliable
service. Additionally,
aging infrastructure may
require modifications
to comply with newer
construction standards
related to earthquake
safety, energy efficiency, or
disabilityaccess.
Levee Areas = unique geographical areas maintained and operated by local public agencies.
Infrastructure in California Is in Need of
Maintenance and Repair
State Highways
50,000 Lane Miles, 2023
Roughly Half of State Highways Are in Poor or Fair Condition
Good 53% Fair 46%
More Than One-Third of Levee Areas Have Unacceptable Maintenance Ratings
Acceptable
33%
Minimally
Acceptable
31%
Unacceptable
36%
Poor 1%
Sources: California Department of Transportation (2023) and California Department of Water Resources (2022).

23
LEGISLATIVE ANALYST’S OFFICE
23
LEGISLATIVE ANALYST’S OFFICE
CHAPTER 1 ECONOMIC GROWTH AND OPPORTUNITY
Statewide Infrastructure Needs Are Changing Due to Various Factors. These include:
• Climate change impacts (including rising temperatures, extreme weather events,
and sea-level rise) may require new or modified infrastructure. For example, more
frequent and intense droughts may necessitate development of more water storage and
recycling facilities.
• Advancements in technology can drive changes in infrastructure needs, such as increased
demand for electric vehicle infrastructure and broadband connectivity.
• Policy changes can also impact infrastructure needs. For example, changes to sentencing
laws contributed to a decline in the prison population and, consequently, a reduced need for
prison infrastructure.
• Shifting demographics and lifestyles—including the location and age of the population—
can drive demand for infrastructure such as schools. In addition, changing work patterns
and lifestyle preferences can affect infrastructure needs such as transportation facilities and
office space.
WHAT ARE KEY LEGISLATIVE CONSIDERATIONS?
Î How Should the State Prioritize Across Various Infrastructure Needs? Given the
magnitude of statewide infrastructure needs across multiple jurisdictions, departments,
and policy areas, the Legislature may need to consider how to target state funding. Factors
the Legislature could consider in prioritizing infrastructure expenditures include whether
projects are owned by the state or other entities, protect health and safety, fulfill legal
requirements, prevent higher future state costs, address historic inequities in infrastructure
investments and siting, or help achieve legislative goals and priorities.
Î How Should the State Pay for Its Infrastructure Priorities? The Legislature also may
need to consider how to fund its infrastructure priorities. This includes whether to pay
for projects up front with cash or through borrowing, and which fund sources to use—
such as the General Fund or special funds. The Legislature may want to consider how
to support not only one-time construction costs but also ongoing costs to maintain and
operate infrastructure.
Î How Should the Legislature Consider Infrastructure Impacts on Equity? The
Legislature may want to ensure its future infrastructure decisions both avoid exacerbating
and help address existing disparities. For example, as a result of having adequate and well-
maintained infrastructure, some communities have better access to clean, reliable water
supplies. Additionally, the way infrastructure is sited can benefit some communities at the
expense of others. For example, some of the state’s freeways currently disadvantage certain
communities by bifurcating them and subjecting them to higher levels of pollution.
24
LEGISLATIVE ANALYST’S OFFICE
24
CHAPTER 1 ECONOMIC GROWTH AND OPPORTUNITY
LEGISLATIVE ANALYST’S OFFICE
Î How Should the Legislature Balance Trade-Offs in Overseeing and Regulating
Infrastructure? The Legislature faces important choices—often involving difficult trade-
offs—related to how it oversees and regulates local, state, and private infrastructure. For
example, the state has a strong interest in ensuring that infrastructure is built, maintained,
and operated safely (which, in some cases, can be costly), while balancing other goals
such as preserving the affordability of services. Similarly, the Legislature may want to make
certain that entities appropriately evaluate and mitigate potential project impacts on the
environment and local communities while also seeking to avoid lengthy and costly delays.
Î How Should the State Plan for and Address Changing Infrastructure Needs?
Infrastructure projects typically are costly and require several years to plan, develop, fund,
and implement. As such, the Legislature may want to anticipate and plan for how the state’s
infrastructure needs will change in the future. For example, while many of the most intense
effects of sea-level rise may not be experienced for years or even decades, both state
and local planning efforts must happen expeditiously in order to ensure projects can be
strategically sequenced and put in place in time to be most impactful.
25
LEGISLATIVE ANALYST’S OFFICE
25
LEGISLATIVE ANALYST’S OFFICE
CHAPTER 1 ECONOMIC GROWTH AND OPPORTUNITY
TRANSPORTATION MOBILITY
California’s transportation system supports the movement of people and goods around the
state. The system is made up of over 50,000 lane miles of highways and 300,000 lane miles
of local streets and roads, as well as transit and rail systems that are operated by over 200
agencies across the state. A major goal of the state’s transportation system is to support
mobility—the ability of people and goods to reach their desired destinations in a reliable and
efficient manner.
a
Driving includes cars, trucks, vans, motorcycles, and taxis.
Californians' Work Commutes Have Been Shifting Some in Recent Years
Note: 2020 data omitted due to the effects of the COVID-19 pandemic on data collection and quality.
10 20 30 40 50 60 70 80 90%
Active Transportation
Public Transit
Work From Home
Driving
ª
2019
2021
2022
WHY IS IT IMPORTANT?
Transportation Mobility Provides Economic and Social Benefits. Mobility ensures that
people in California can complete travel via a wide range of reliable and efficient transportation
options that suit multiple needs and preferences. This provides widespread economic and
social benefits to people and businesses. For instance, mobility allows people to access jobs,
essential services, and social and recreational activities. Robust mobility also allows goods to
reach their desired destinations morequickly.
Certain Regions and Communities Are Disparately Impacted by Mobility Challenges.
Despite the state’s extensive transportation system, many regions and communities face issues
that limit mobility. In the state’s urban areas, roadway congestion delays people and goods from
reaching their desired destinations. Additionally, lower-income and rural communities often
lack adequate access to multiple transportation options, which can make it difficult to reach
economic opportunities and essential services.
Statewide Mobility Needs Are Shifting. Statewide mobility needs are shifting due to several
factors that will influence the ways in which people and goods move. For instance, increased
telecommuting and the high cost of housing have impacted where people choose to live, where
and how often they travel, and what transportation modes they choose. Furthermore, changing
consumer preferences, such as an increased use of online shopping, likely will continue to
change how goods are transported across the state and within communities. In addition,
innovations in the transportation sector could impact mobility in varying ways. For example,
some developments (such as bike sharing and on-demand public transportation) could reduce
congestion by encouraging people to reduce their use of private vehicles. Incontrast, other
innovations (such as zero-emission and autonomous vehicles) could increase congestion by
incentivizing people to travel more miles in private vehicles, resulting in more cars on the road.
26
LEGISLATIVE ANALYST’S OFFICE
26
CHAPTER 1 ECONOMIC GROWTH AND OPPORTUNITY
LEGISLATIVE ANALYST’S OFFICE
WHAT ARE KEY LEGISLATIVE CONSIDERATIONS?
Î What Actions Should the State Take to Improve Mobility? Improving mobility
likely will require a mix of policies, such as both improving the efficiency of the state’s
current transportation system and increasing access to transit and alternative modes of
transportation. These efforts likely will need to be undertaken in coordination with local
governments given that they
own much of the state’s
overall transportation system,
such as transit systems and
local roads. In addition, the
Legislature might want to
consider ways in which it
can encourage and support
local governments in
implementing projects and
policies that align with the
goal of improving mobility—
such as locating more
housing and businesses near
transit centers.
Î How Should the Legislature Balance Mobility Improvements With Its Other Goals?
Because transportation mobility touches on so many aspects of life in California, the
Legislature may want to consider how to make improvements in a way that aligns with
its other goals. For instance, this means encouraging projects that improve mobility
and advance legislative climate goals by decreasing—or, at a minimum, not significantly
increasing—greenhouse gas emissions. In addition, coordinating housing policies (such as
pursuing denser infill development) with transportation goals could help reduce the need for
people to commute long distances—which would address both mobility and climate goals.
Focusing on improving mobility for certain target groups can also meet multiple objectives,
such as increasing access to economic opportunities and addressing existing inequities in
transportation options. Notably, one of the strategies in the state’s Master Plan for Aging is
to strengthen the ability of transportation networks to meet the needs of the state’s aging
population and persons with disabilities.
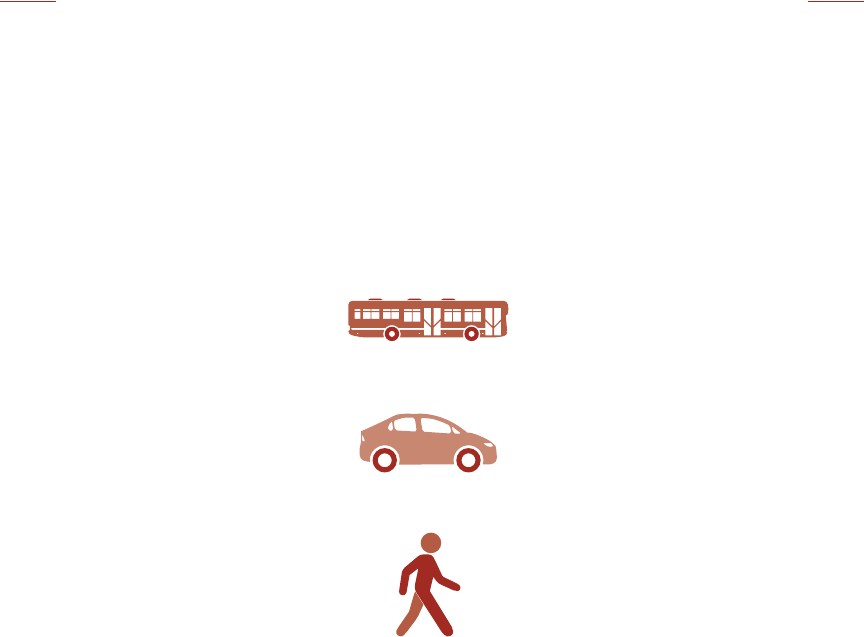
Various Improvements to the State’s
Transportation Systems Could Enhance Mobility
Transit
Increase frequency and reliability, expand service,
improve connectivity between systems, and prioritize
transit such as by increasing prevalence of bus-only
lanes.
Driving
Improve connectivity of roadways, reduce congestion
and bottlenecks, and improve traffic flow management.
Walking and Biking
Increase availability and safety of walking and biking
infrastructure, such as by establishing dedicated bike
lanes and improving crosswalks.
27
LEGISLATIVE ANALYST’S OFFICE
27
LEGISLATIVE ANALYST’S OFFICE
CHAPTER 1 ECONOMIC GROWTH AND OPPORTUNITY
Î How Should Mobility Improvements Be Funded Over the Long Run? Currently, a large
portion of the state’s transportation funding comes from fuel taxes. As more drivers switch
to zero-emission vehicles over the coming years, corresponding fuel tax revenues are
expected to decline. In order to continue supporting improvements to statewide mobility,
the Legislature may need to identify alternative funding sources to make up for these lost
revenues. For instance, the Legislature could consider increasing existing transportation
taxes and fees or shifting costs to other existing funding sources. The state could also
implement alternative methods to charge beneficiaries of the state’s transportation system
and generate revenue—such as a mileage-based road charge.

28
LEGISLATIVE ANALYST’S OFFICE
28
CHAPTER 2 HEALTH, SAFETY, AND WELL-BEING
LEGISLATIVE ANALYST’S OFFICE
29
LEGISLATIVE ANALYST’S OFFICE
29
LEGISLATIVE ANALYST’S OFFICE
CHAPTER 2 HEALTH, SAFETY, AND WELL-BEING
CHAPTER2
HEALTH, SAFETY, AND WELL-BEING
Quality of life is based on more than simply economic growth. A thriving California must have
a healthy and safe environment, including adequate and affordable housing, access to quality
health care, and an equitable and effective criminal justice system. In addition, limiting near-term
and long-term risks from catastrophic events—including those amplified by climate change—is
critical to ensuring long-term prosperity. In this chapter, we identify and discuss key long-term
issues affecting the health, safety, and overall well-being of Californians.

30
LEGISLATIVE ANALYST’S OFFICE
30
CHAPTER 2 HEALTH, SAFETY, AND WELL-BEING
LEGISLATIVE ANALYST’S OFFICE
HOUSING AND HOMELESSNESS
California’s cities and counties make most decisions about when, where, and to what extent
housing will be built. Starting in 2017, the state has increased its role in addressing housing
affordability and homelessness by providing significant, albeit one-time and temporary, funding
towards housing infrastructure and flexible homelessness aid to local governments. Additionally,
the state has enacted laws that aim to spur housingdevelopment.
WHY IS IT IMPORTANT?
Building Less Housing Than People Demand Drives High Housing Costs. Housing in
California has long been more expensive than most of the rest of the country. While many
factors have a role in driving California’s high housing costs, the most important is the
significant shortage of housing, particularly within urban coastal communities. A shortage
of housing in these community means households wishing to live there compete for limited
housing. This competition increases home prices and rents. Some people who find these
communities unaffordable turn instead to other, generally inland, communities that may be
relatively affordable, causing prices there to rise as well.
a
Prices reflect Zillow data,
August 2023.
San Diego
San Francisco
San Jose
Home Price
California
Rent
Housing Is Very Expensive in California
Typical Housing Costs in 40 Largest U.S. Cities, 2023
ª
United States
Riverside
Sacramento
Los Angeles
San Jose
San Diego
San Francisco
California
Los Angeles
Riverside
Sacramento
United States
200,000 400,000 600,000 800,000 1,000,000 1,200,000 $1,400,000
500 1,000 1,500 2,000 2,500 3,000 $3,500
31
LEGISLATIVE ANALYST’S OFFICE
31
LEGISLATIVE ANALYST’S OFFICE
CHAPTER 2 HEALTH, SAFETY, AND WELL-BEING
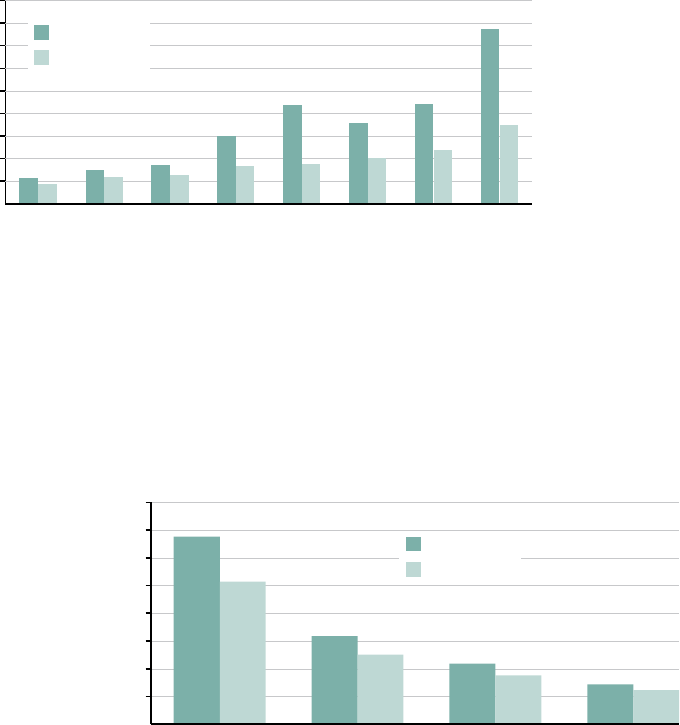
ManyHouseholds Have Difficulty Affording Housing in California. Housing costs are the
largest component of most household’s spending each month. The high cost of housing makes
living in California particularly expensive. Today, an average California home costs 2.3 times the
national average. California’s
average monthly rent is
about 50percent higher than
the rest of the country. In
California, around 2.5million
low-income households
are cost burdened (spend
more than 30percent of
their incomes on housing).
Over 1.5million low-income
renters face even more dire
cost pressures—spending
more than half of their
income on housing.
Housing Affordability
Affects Homelessness.
While homelessness is a complex problem with many causes, the high cost of housing is a
significant contributor. Rising housing costs that have exceeded growth in wages, particularly
for low-income households, put Californians at risk of housing instability and homelessness.
As of January 2023, California had about 181,400 people experiencing homelessness, which
represented about 28percent of the total homeless population in the nation. (California’s overall
population, however, is about 12percent of the nation.) Additionally, nearly half of all people
experiencing unsheltered homelessness reside inCalifornia.
Addressing Housing and Homelessness Challenges Will Take Time and Require
Continued State Engagement. The housing and homelessness crises are a long time
in the making, the culmination of decades of federal, state, and local policy choices that
resulted in housing construction shortfalls and inequities in access to homeownership. This,
in turn, limited opportunities to live in communities with quality schools, well-paying jobs,
and other characteristic that improve quality of life. The scope of theproblemismassive.
Millions of Californians struggle to find housing that is both affordable and suits their needs.
Addressingthese issues is one of the most difficult challenges facing the state’s policy makers.
Inflation-Adjusted Median Home Prices in 2022 Dollars
1950 1960 1970 1980 1990 2000 2010 2022
California
United States
100,000
200,000
300,000
400,000
500,000
600,000
700,000
800,000
$900,000
Median Share of Income
Spent on Housing by Income Quartile
2021
10
20
30
40
50
60
70
80%
Bottom 2
nd
3
rd
Top
United States
California

32
LEGISLATIVE ANALYST’S OFFICE
32
CHAPTER 2 HEALTH, SAFETY, AND WELL-BEING
LEGISLATIVE ANALYST’S OFFICE
The enormity of California’s housing and homelessness challenges suggest that policy makers
will need to engage on a variety of solutions for many years or decades. While the Legislature has
taken important steps to address these issues in recent years by enacting laws that aim to spur
housing development, subsidizing affordable housing development, and providing aid to prevent
and address homelessness, opportunities remain for continued state engagement.
WHAT ARE KEY LEGISLATIVE CONSIDERATIONS?
Î What Is the State’s Role in Addressing the Underlying Causes of the Housing and
Homelessness Crisis Over the Long Term? Addressing housing affordability and
homelessness in the long term will require addressing the underlying housing shortage.
While recent laws aim to increase housing development, the Legislature may wish to monitor
the effectiveness of those changes and whether further changes are warranted. In addition,
the Legislature may wish to consider what role the state should have in supporting housing
construction and addressing homelessness over the long term, including whether the state
should have an ongoing fiscal role.
Î How Can the State Exercise Strong Oversight and Assess Progress Towards
Alleviating High Housing Costs and Homelessness? Even substantial investments in
resources could quickly dissipate without demonstrating much progress if investments are
made without a clear plan and ongoing oversight. Recently, the Legislature enacted an
oversight framework to coordinate local governments’ efforts. Assessing the effectiveness
of that framework and coordination will be an important step in ensuring efforts to address
homelessness are effective.
Î What Steps Can the State Take to Address the Immediate Needs of People Struggling
With Housing Affordability and Experiencing Homelessness? Many people are
experiencing homelessness and many more have unstable housing. For these people, job
loss or an unexpected expense could result in homelessness. The Legislature may wish to
consider what steps the state could take to identify effective short-term solutions to provide
immediate relief and mitigate against more people becoming homeless.
Î How Can the State Equitably Address the Housing Needs of Particular Populations?
Some populations face greater challenges affording housing and remaining housed. For
example, the lowest-income individuals and families, seniors and persons with disabilities
on a fixed income, and people with severe behavioral health needs could have particular
challenges affording housing and navigating out of homelessness. Assessing the particular
needs of key populations could help target state actions.

33
LEGISLATIVE ANALYST’S OFFICE
33
LEGISLATIVE ANALYST’S OFFICE
CHAPTER 2 HEALTH, SAFETY, AND WELL-BEING
POVERTY ALLEVIATION AND PREVENTION
People living in poverty have incomes too low to afford basic needs. The state operates
programs intended to address poverty by providing eligible individuals and families with income
supports and other benefits.
WHY IS IT IMPORTANT?
Poverty Has Both Individual and Social Costs. Research finds individuals living in poverty
experience worse health outcomes (including mental health outcomes) and lower life
expectancy than individuals with more economic resources. Living in poverty also is associated
with disabilities or chronic health issues, rendering some affected individuals unable to work.
Inchildren, poverty is linked to lower levels of learning.
a
Footnote.
California Poverty Rate, by Two Different Measures (2022)
The federal poverty level (FPL) measures the number of people living below a specified level of income
based on their family size. The supplemental poverty measure (SPM) measures the poverty level based on
the cost of living and social safety net benefits.
SPM range across
all 50 states
FPL range
across all
50 states
California has the highest poverty level
among the 50 states when using the
SPM. In fact, California is one of only a
few states where the SPM is higher than
the FPL. This is due to the high cost of
living in the state.
California's has
the 29
th
highest
poverty rate by
this measure.
18.2%
7.1%
11.4% FPL
13.2%
4.6%
California has the
nation's highest
poverty rate by
this measure.
13.2% SPM
34
LEGISLATIVE ANALYST’S OFFICE
34
CHAPTER 2 HEALTH, SAFETY, AND WELL-BEING
LEGISLATIVE ANALYST’S OFFICE
Poverty Disproportionately Affects Different Groups of Californians. Some demographic
groups experience poverty at notably higher rates, disparities which to some extent can be
linked to historical laws and policies with long-lasting, disproportionate impacts, particularly in
terms of wealth accumulation. Poverty rates vary across regions of the state, with Californians in
both rural and urban areas experiencing varying degrees of poverty. Roughly half of families in
poverty have at least one family member who works some portion of the year.
State Plays Significant Role in Poverty Mitigation. State and federal safety net programs
aim to help individuals and families mitigate poverty and address barriers to economic mobility.
These benefits improve the economic well-being of recipients. Although California has the
highest poverty rate under the supplemental poverty measure, absent these programs, the rate
would be nearly double. Reflecting the significant role the state plays in poverty mitigation, over
one-third of the state General Fund is allocated to these programs.
Notes: Data from American Community Survey.
Due to how data are categorized, some individuals are counted in more than one group.
Smaller sample size for American Indian/Alaska Native results in year-to-year changes that may appear larger than for other groups.
Poverty Rates in California Vary Across Groups
Share of Californians Living Below the Federal Poverty Level
10%
< 18 18-64 > 64 Female
Male
2022
Hispanic/Latino
White
Black
Asian
American Indian/Alaska Native
Two or More Races
5
10
15
20
25
30%
2010 2011 2012 2013 2014 2015 2016 2017 2018 2019 2020 2021 2022

35
LEGISLATIVE ANALYST’S OFFICE
35
LEGISLATIVE ANALYST’S OFFICE
CHAPTER 2 HEALTH, SAFETY, AND WELL-BEING
WHAT ARE KEY LEGISLATIVE CONSIDERATIONS?
Î How Should Assistance Be Targeted? Safety net programs primarily assist individuals
already living under or near the federal poverty level. Safety net programs vary from those
with relatively broad eligibility criteria—such as Medi-Cal and the Earned Income Tax
Credit—to those that are much more targeted—like aging programs for low-income seniors.
A key trade-off the Legislature faces is whether to target poverty mitigation programs to
specific populations—potentially making a larger impact on a smaller group—or to provide
broad-based assistance.
Î What Are the Different Approaches That Various Safety Net Programs Take? While
the state’s array of safety net programs all broadly aim to help mitigate poverty, programs’
specific goals differ. For example, some programs directly seek to raise individuals’ incomes
or provide cash-like benefits—like nutrition assistance—while other programs provide
services to vulnerable populations to help improve safety and quality of life—like in-home
support for aging and disabled individuals. Regularly assessing whether these programs are
achieving their specific goals can help the Legislature determine what changes might need
to be made or how to better target assistance.
Î How Does Participation Vary Across Programs and Groups? Participation by eligible
Californians varies across programs. For example, around 95 percent of
Medi-Cal-eligible individuals are enrolled in the program, whereas we estimate only about
60 percent of eligible families enroll in the state’s cash assistance program for families, the
California Work Opportunity and Responsibility to Kids (CalWORKs) program. Moreover,
in some programs, certain populations participate at lower rates or receive lower average
benefits. Identifying what barriers Californians may face to participating in these programs
could help the Legislature understand the efficacy of the state’s various safety net programs
and develop policies to increase participation, access, and benefits where desired.
Î How Can the State Improve Coordination Across Safety Net Programs? There is
significant overlap in the populations that are eligible for various safety net programs. For
example, families that are eligible for CalWORKs typically are eligible for food assistance
and Medi-Cal. Considering policies to coordinate application, eligibility determination, and
administration of these programs could improve overall take up and provide better access to
services for eligible families.
Î How Can the State’s Programs Complement Federal Efforts? A large portion of state
spending on safety net programs reflects the state’s required funding share for federal
programs. In some cases, however, the state spends above federal match requirements for
certain programs. In those cases, considering how state-only programs can complement
federal efforts—for instance by providing services to individuals ineligible for federal
assistance—can help address potential gaps in the state’s safety net.
36
LEGISLATIVE ANALYST’S OFFICE
36
CHAPTER 2 HEALTH, SAFETY, AND WELL-BEING
LEGISLATIVE ANALYST’S OFFICE
WHY IS IT IMPORTANT?
The Overall Health of a Population Has Consequences Beyond Individual Health. Public
health can affect the economy and productivity in a variety of ways. For example, better overall
health can reduce health care costs and utilization, improve educational outcomes, and lead
to more productivity in the workplace. And just as good health can have benefits in health
care delivery systems, economic output, and quality of life, poor health can create costs in
thosedomains.
Public Health Systems Play
a Vital Role in Protecting the
Public, Promoting Healthy
Behaviors, and Addressing
Health Disparities. State and
local public health departments
aim to prevent the spread of
communicable diseases through
statewide testing and monitoring
programs. They also help
address environmental hazards,
coordinate the public health
response to disasters, support
research and epidemiology to
better understand the causes
of disease and health outcome
disparities, and promote
healthybehaviors.
PUBLIC HEALTH
Public health generally refers to
the health of a population, rather
than the health (or health care)
of an individual person. While
the provision of health care to
individuals impacts public health, a
number of factors outside of direct
health care—sometimes referred to
as the social determinants of health
(SDOH)—influence and affect
public health overall.
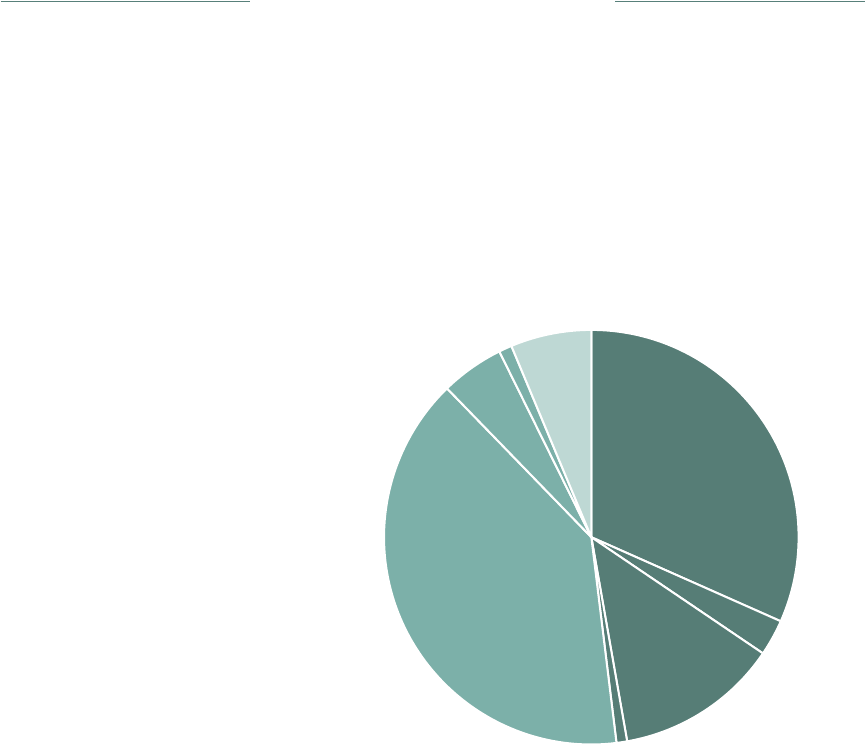
Age-Adjusted Death Rate, Per 100,000 People
Higher rates of preventable
death and poverty
Lower rates of preventable
death and poverty
Note: For the purposes of this figure, preventable deaths include deaths from communicable diseases, childbirth,
and nutritional deficiencies.
Source: California Department of Public Health (2023).
Preventable Deaths Generally Increase With Poverty
20
40
60
80
100
120
140
5 10 15 20 25%
Percent of the County Population in Poverty
SDOH = Social Determinants of Health.
Major Public Health Issues…
Chronic Diseases
Climate Change
Environmental Health
…Disproportionately Impact
Californians Based on SDOH
Infectious Diseases
Mental Health
Substance Misuse
Employment
Environmental Quality
Healthy Food
Housing
Quality Education
Transportation

37
LEGISLATIVE ANALYST’S OFFICE
37
LEGISLATIVE ANALYST’S OFFICE
CHAPTER 2 HEALTH, SAFETY, AND WELL-BEING
Disparate Public Health Outcomes Exacerbated by SDOH. Negative public health outcomes
often are concentrated in historically disadvantaged areas and populations. For example, areas
that historically were subject to “redlining”—discriminatory practices related to housing and
lending—are linked with greater levels of air pollution. These types of environmental health
conditions can have negative consequences for public health. Differing experiences related to
SDOH can be a major contributor to health disparities within and across population groups.
WHAT ARE KEY LEGISLATIVE CONSIDERATIONS?
Î Is the State Public Health System Structured to Address Emerging Issues?
The Legislature may wish to consider whether the state’s public health system is structured
sufficiently to address emerging issues. For example, is the state sufficiently preparing for
the impacts of climate change on Californians’ health? What requirements are there for local
public health entities in this regard? Assessing the state versus local role in preparing and
responding to new challenges is an important consideration in assessing the preparedness
of the state’s public health system.
Î How Can the State Ensure Sufficient Capacity in the Public Health System? Based
upon the evaluation of the public health system’s structure, the Legislature next may
wish to examine the system’s capacity. Historically, most public health funding has been
provided by the federal government, with smaller, issue-specific state programs. After
COVID-19, the state expanded its support to state and local health entities in order to
build greater capacity. The Legislature may wish to monitor whether those resources
are yielding the intended improvements to the public health system and overall health.
Moreover, the Legislature may wish to assess whether the state’s public health laboratories
and information technology systems need to be enhanced or reimagined to provide a more
holistic approach to public health.
Î What Are the Public Health Tools That Are Most Effective in Addressing Disparities
Influenced by SDOH? Addressing SDOH requires coordinating efforts across state
and local programs and departments. While the public health system has specific
responsibilities related to SDOH, the Legislature may wish to consider how to identify
effective interventions that span multiple areas of state and local government in order to
address SDOH impacting disparities in public health more comprehensively.
38
LEGISLATIVE ANALYST’S OFFICE
38
CHAPTER 2 HEALTH, SAFETY, AND WELL-BEING
LEGISLATIVE ANALYST’S OFFICE
ACCESS TO QUALITY HEALTH CARE
Health care includes traditional medical and dental care, behavioral health services, and
long-term services and supports. State policy generally focuses on two key areas of healthcare:
• Access. State policies and programs, such as Medi-Cal and Covered California, aim to
make health care coverage and timely services accessible and affordable for individuals,
regardless of their income, employment, or location.
• Quality. State policies and programs, such as regulation of health insurance plans and
health care providers, aim to ensure that Californians receive consistent delivery of care that
is likely to improve their physical or mental well-being.
WHY IS IT IMPORTANT?
Health Care Impacts Individual and Economic Well-Being. Having access to quality physical
and behavioral health care is a key determinant of an individual’s overall health and well-being.
Overall health, in turn, is associated with other key life outcomes, such as educational and
career attainment.
While Most Californians
Have Health Coverage
and Generally Are in Good
Health... Most Californians—
over 90percent—receive
health coverage through public
programs or private insurance.
Past federal and state actions,
such as the federal Patient
Protection and Affordable
Care Act and California’s
expansion of Medi-Cal
eligibility for undocumented
residents, have increased
this share. Californians also
generally experience equal or
better health outcomes when
compared to residents in
otherstates.
Note: LAO projection uses information from the California Health Interview Survey, the Department of
Health Care Services, Covered California, and the UC Berkeley Labor Center.
Most Californians Have Health Coverage,
From Many Sources
Projected Health Coverage in 2024
Medi-Cal
Medicare
Other Public
Employer
Individual Market
Other Private
Uninsured
Public
Private
Medi-Cal and Medicare

39
LEGISLATIVE ANALYST’S OFFICE
39
LEGISLATIVE ANALYST’S OFFICE
CHAPTER 2 HEALTH, SAFETY, AND WELL-BEING
…Gaps in Access and Quality Remain. For example, California for many years has
experienced a shortage of certain health care providers—such as primary care and behavioral
health providers—and facilities statewide and within certain regions. These shortages can
impact access to timely care, even for residents with health care coverage. Disparities in health
outcomes also exist by race, ethnicity, socioeconomic status, and other factors, likely reflecting,
in part, differences in access and quality of health care for certain groups.
WHAT ARE KEY LEGISLATIVE CONSIDERATINS?
Î How Can the State Address Rising Health Care Costs? Price and utilization growth has
led to higher health care costs over time in California, with inflation-adjusted, per-capita
spending on health care services nearly doubling between 1991 and 2020. High health care
costs can drive Californians to defer needed medical care or even forgo health coverage
altogether. In recent years, the state has enacted programs and initiatives in response to
rising health care costs, such as by establishing the Office of Health Care Affordability.
The Legislature may want to evaluate the impact of these initiatives in the coming years,
as well as explore what other policy options exist to ensure health care is affordable for
most Californians.
Î How Can the State Address the Health Needs of an Aging and Diversifying
Population? Over the next decade, the state’s overall population is expected to become
older and more racially/ethnically diverse. These demographic changes will tend to increase
demand for specialized and costly health care services (such as long-term care), as well as
outreach to help navigate the complex health care system. In recent years, the state has
enacted several policy changes intended to improve services to these populations, such as
by consolidating most long-term care into one Medi-Cal delivery system. Moving forward,
the Legislature likely will continue to face budgetary and policy pressures in preparing the
state’s health care system to respond to the state’s demographic changes.
Legislature Has Four Key Levers to Potentially
Improve Health Outcomes and Reduce Disparities
Financing
Expand funding and change the way
payments to providers are made.
Coordination
Reduce fragmentation and simplify
processes and rules.
Delivery
Encourage new delivery models and reduce
legal barriers to accessing and providing care.
Oversight
Increase access to data and set and enforce
performance expectations.
40
LEGISLATIVE ANALYST’S OFFICE
40
CHAPTER 2 HEALTH, SAFETY, AND WELL-BEING
LEGISLATIVE ANALYST’S OFFICE
Î What Is the Health Care System’s Role in Addressing SDOH? Health outcomes are
affected by more than health care; they are also influenced significantly by SDOH—such
as education, income, and environment. Accordingly, changes in other policy areas impact
Californians’ health outcomes. In recent years, policymakers have expanded the role of
the state’s health care system to address SDOH, such as by allowing funding for housing-
related services through Medi-Cal. What non-health-related services are best delivered
by the state’s health care system, rather than by other areas, will be a key question
going forward.
Î How Can the State Improve the Delivery of Behavioral Health Services? California’s
behavioral health system is fragmented and administered separately from the rest of the
health care delivery system, creating complexity for patients to seek care and providers to
receive payment. Statewide shortages of providers have compounded these challenges,
hindering patients’ ability to access timely care. In response to these issues, the state
recently enacted several initiatives aimed at reducing fragmentation, expanding coverage
of services, and developing the state’s infrastructure and provider workforce. The
effectiveness of these recent changes warrants evaluation. In addition, the Legislature
may wish to consider what additional opportunities exist to improve access and quality for
behavioral health services.

41
LEGISLATIVE ANALYST’S OFFICE
41
LEGISLATIVE ANALYST’S OFFICE
CHAPTER 2 HEALTH, SAFETY, AND WELL-BEING
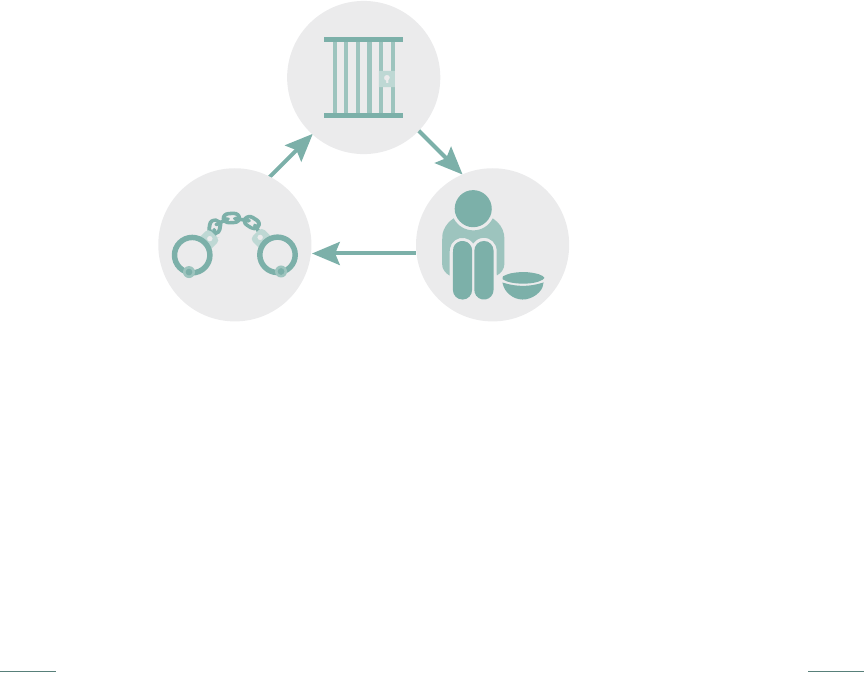
CRIMINAL JUSTICE SYSTEM OUTCOMES
California’s criminal justice system consists of state, local, and nongovernmental agencies who
are responsible for patrolling communities; carrying out judicial proceedings; and housing,
supervising, and providing services to people who are accused or convicted of crimes.
Lawmakers and the public seek various outcomes from the system, including (1)preventing
and punishing crime; (2)upholding the rights of victims, the accused, and convicted; and
(3)reintegrating the convicted back into the community.
WHY IS IT IMPORTANT?
Criminal Justice System Outcomes Are High Stakes in Nature. The prevention of and
response to crime is necessary for communities to flourish, while the failure to do so can result
in significant harm to victims, such as the loss of life and property. In addition, the system’s
outcomes have high stakes for people accused and convicted of crimes. This is because
significant harm (such as loss of freedom or death) can result when the system fails to uphold
their rights. When these outcomes are disproportionate for different groups of people, it raises
equity concerns, further increasing thestakes.
System Outcomes Indicators of Outcomes
Preventing and
Punishing Crime
Upholding Rights of
Victims, Accused, and
Convicted
Reintegrating the
Convicted Back
Into the Community
Crime rates
Law enforcement interactions
Portion of crimes solved
Court process metrics
Victim and accused views on fairness of process
Conditions of incarceration
Recidivism (such as committing a new crime)
Housing
Employment
Behavioral health
Examples of Criminal Justice System Outcomes and Indicators
42
LEGISLATIVE ANALYST’S OFFICE
42
CHAPTER 2 HEALTH, SAFETY, AND WELL-BEING
LEGISLATIVE ANALYST’S OFFICE
Outcomes Can Interact With Other Policy Areas. Criminal justice system outcomes impact
and are impacted by other policy areas. For example, people who commit crimes and are not
reintegrated successfully into the community are more likely to experience homelessness. In
addition, people who are experiencing homelessness can be more likely to come into contact
with law enforcement and become involved in the criminal justicesystem.
System Requires Significant Resources. The state spends roughly $20billion annually on the
judicial and criminal justice system. Cities and counties spend roughly $30billion annually. The
Legislature’s role in defining crimes and what penalties they carry can significantly affect the
cost of the system.
WHAT ARE KEY LEGISLATIVE CONSIDERATIONS?
Î What Outcomes Should Be Prioritized? Sometimes there can be tension between the
different criminal justice system outcomes that are desired. For example, upholding the
rights of people accused of crimes can sometimes make it more difficult to convict, and
therefore punish, those who commit crime. Accordingly, it is important for the Legislature to
identify its preferred balance.
Interactions Between Homelessness and
Criminal Justice System Involvement
Jail or prison stay can cause loss of housing.
Without adequate support for reintegrating
into the community after release, people
may continue to lack housing.
Homelessness exposes people to
difficulties—such as living outside or
challenges accessing behavioral health
treatment or other services—that can
increase their contact with police.
Lower-level charges can sometimes
escalate to incarceration for people
experiencing homelessness due to
various challenges they face, such as
navigating the requirements of probation.
43
LEGISLATIVE ANALYST’S OFFICE
43
LEGISLATIVE ANALYST’S OFFICE
CHAPTER 2 HEALTH, SAFETY, AND WELL-BEING
Î Who Should Be Responsible for Achieving Outcomes? Responsibility for criminal justice
system outcomes is divided between many entities and choices made by one can affect
others. For example, choices made by city police about how strictly to enforce laws impact
the populations of county jails and state prisons. This makes it important to appropriately
divide responsibilities between the criminal justice system and other systems (such as
behavioral health), governmental and nongovernmental entities, as well as the state and
local governments.
Î How Can Outcomes Be Achieved Cost-Effectively and Equitably? It is critical to ensure
the state uses effective and equitable methods of achieving desired outcomes and to
incentivize local government and nongovernmental entities to do so, particularly given the
significant amount of resources required by the criminal justice system and its high stakes.
For example, funding programs found by research to cost-effectively reduce recidivism
can both reduce costs and improve outcomes. In addition, ensuring those programs are
accessible to different groups—such as people living in rural areas or people who do not
speak English—can help improve outcomes in an equitable manner.
Î What Oversight Is Necessary? Oversight is critical as it helps determine how effectively
and equitably outcomes are achieved. However, there are relatively unique challenges to
criminal justice oversight. For example, the system is often not accessible to public view and
is split between many different actors who often have significant discretion in carrying out
their responsibilities, making it hard to collect consistent data and assign responsibility for
outcomes and oversight.
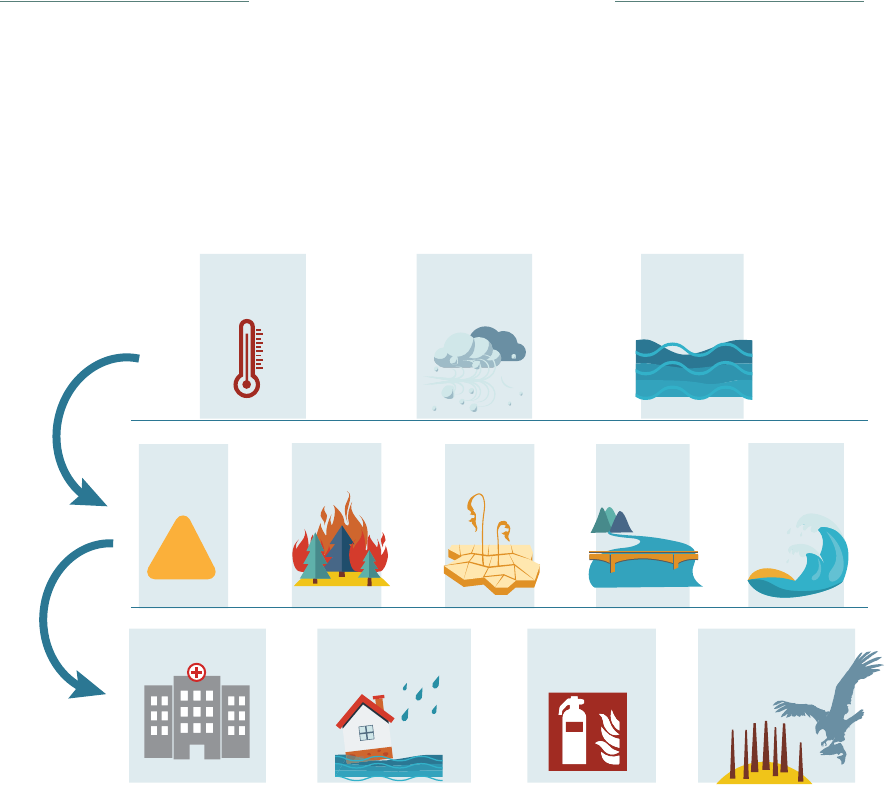
44
LEGISLATIVE ANALYST’S OFFICE
44
CHAPTER 2 HEALTH, SAFETY, AND WELL-BEING
LEGISLATIVE ANALYST’S OFFICE
CLIMATE CHANGE
Climate change is the variation in global or regional climate patterns—including temperature and
precipitation—from human activities that increase greenhouse gases (GHGs) in the atmosphere.
The state’s current policy responses to climate change fall into two broad categories:
• Mitigation. Efforts to reduce GHG emissions, which primarily come from the combustion of
fossil fuels such as gasoline, diesel, and natural gas.
• Adaptation. Efforts to reduce the damages and risks associated with climate change
impacts, such as thinning forests to reduce the severity of wildfires, ensuring adequate
water supplies during droughts, and protecting people from extreme heat events.
WHY IS IT IMPORTANT?
Climate Change Is Having a Wide Variety of Adverse Effects on California. The warming
planet is a global problem, but California will face risks and damages from a changing climate
in the coming decades regardless of whether or not the world—and state—are able to reduce
GHGs. Efforts to prepare for and respond to these impacts will be widespread and costly.
Climate
Stressors
Hazards
Major
Impacts
!
Impacts of Climate Change on Californians
Loss of biodiversity
and impaired
natural resources
Life-threatening
events
Damage to property
and infrastructure
Public health risks
Higher
temperatures
Changing
hydrologic
patterns
Rising sea
levels
Extreme
heat events
Wildfires Droughts Inland
flooding
Coastal
flooding
and erosion
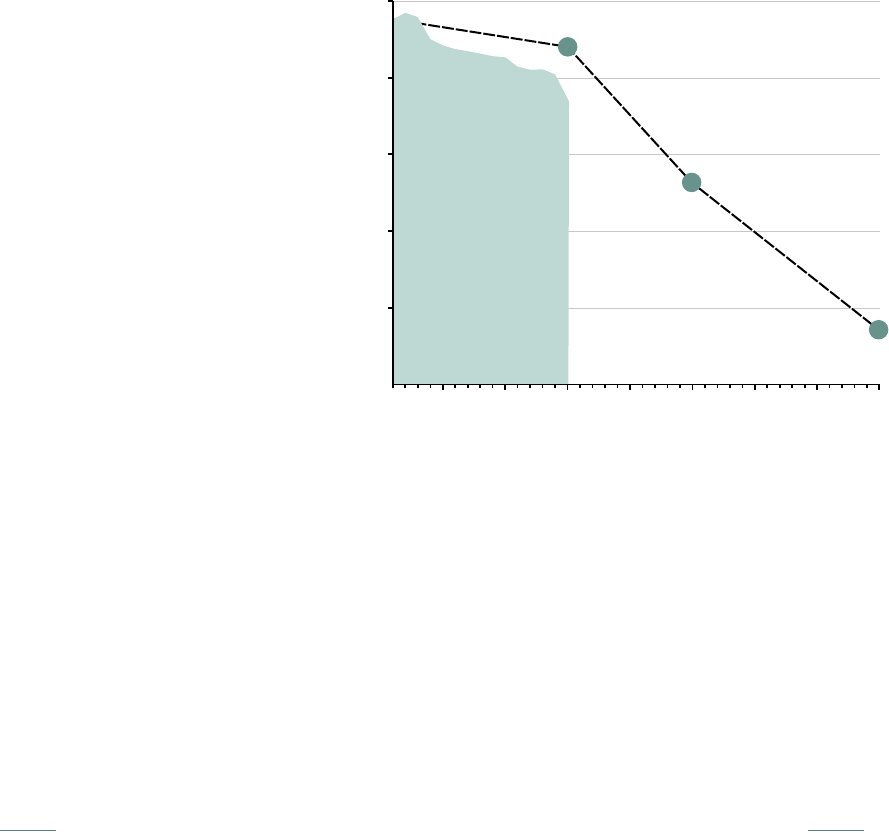
45
LEGISLATIVE ANALYST’S OFFICE
45
LEGISLATIVE ANALYST’S OFFICE
CHAPTER 2 HEALTH, SAFETY, AND WELL-BEING
California Can Be a Global
Leader in Efforts to Reduce
GHG Emissions, but Meeting
Its Ambitious Goals Will Take
Concerted Efforts. While California
contributes only a small portion of
global GHG emissions, it can play
an important role as a model for
other states and countries to help
to stimulate innovation and more
widespread policy changes. For
example, over the past couple of
decades, the state has adopted
vehicle emissions restrictions
which other states subsequently
mirrored. State law has established
aggressive GHG reduction goals—
amounting to a roughly 85percent
reduction from 2020 to 2045—
which will require significant efforts
and funding across multiple sectors
to achieve.
Certain Populations Are Particularly Vulnerable to Climate Change Impacts.
Climatechange impacts will not affect all Californians equally. Certain residents will be more
vulnerable based on their underlying health conditions, where they live, their jobs, and the
level of economic resources upon which they can draw. For example, some of the most
significant climateimpacts—suchas heat and wildfiresmoke—disproportionatelyaffect
certain medically vulnerable groups, including children and the elderly, as well as populations
that spend a lot of time outdoors (such as unhoused populations and outdoor workers). Many
communities facing disproportionate levels of risk from climate impacts such as heat, flood,
and drought-induced water shortages also align with those that experienced historical housing
discriminationpolicies.
WHAT ARE KEY LEGISLATIVE CONSIDERATIONS?
Î What Is the Appropriate Role of the State in Preventing, Preparing for, and
Responding to Climate Change? Effectively reducing and responding to the anticipated
adverse effects of climate change will require a wide range of actions to be taken not only
by the state but also by other actors including households, businesses, local governments,
and the federal government. The Legislature may need to weigh what role state programs
and policies can and should play, as compared to actions by other entities. For example, the
Legislature could consider steps such as (1) adopting statewide guidance and standards,
(2) assessing and addressing data gaps, (3) providing support and coordination, and
(4) providing targeted fiscal support.
California Has Adopted Aggressive
Greenhouse Gas Reduction Goals
Millions of Metric Tons of Carbon Dioxide Equivalent
100
200
300
400
500
2010 2015 2020 2025 2030 2035 2040
Actual Emissions
1990 emissions
by 2020
40 percent below
1990 level by 2030
85 percent below
1990 level by 2045
2045
46
LEGISLATIVE ANALYST’S OFFICE
46
CHAPTER 2 HEALTH, SAFETY, AND WELL-BEING
LEGISLATIVE ANALYST’S OFFICE
Î How Should the State Prioritize Among Potential Climate Mitigation and Adaptation
Efforts? Given the magnitude of climate change goals and challenges, the Legislature
may need to identify the activities upon which to focus state dollars.Prioritization factors
could include (1) demonstrated cost-effectiveness, (2) the urgency of needed action, (3) the
degree to which the state is the primary responsible party (such as for state-owned lands
and infrastructure), (4) the number of Californians that could be affected, (5) how widespread
potential fiscal and economic implications might be, (6) the threat posed to public safety,
and (7) the ability—or inability—of certain communities to adapt without state assistance.
The Legislature also could consider prioritizing efforts in which providing seed money could
help spur development of new climate mitigation technologies or regional-scale adaptation
efforts that might be harder to implement without financial incentives.
Î How Can the State Help Protect the Most Vulnerable Californians? The Legislature
might want to consider which populations, workers, industries, and regions will be
disproportionately affected by climate change and how the state might want to help address
those challenges. This includes weighing the potential distributional considerations for
policies the state adopts (such as which households can and cannot afford to purchase
zero-emission vehicles), as well as focusing state assistance on those who might be
least able to prepare and adapt absent that help (such as communities with lower
property tax revenues). In order to avoid exacerbating existing disparities, the Legislature
may want to ensure that actions prioritize protecting vulnerable and economically
disadvantaged communities.
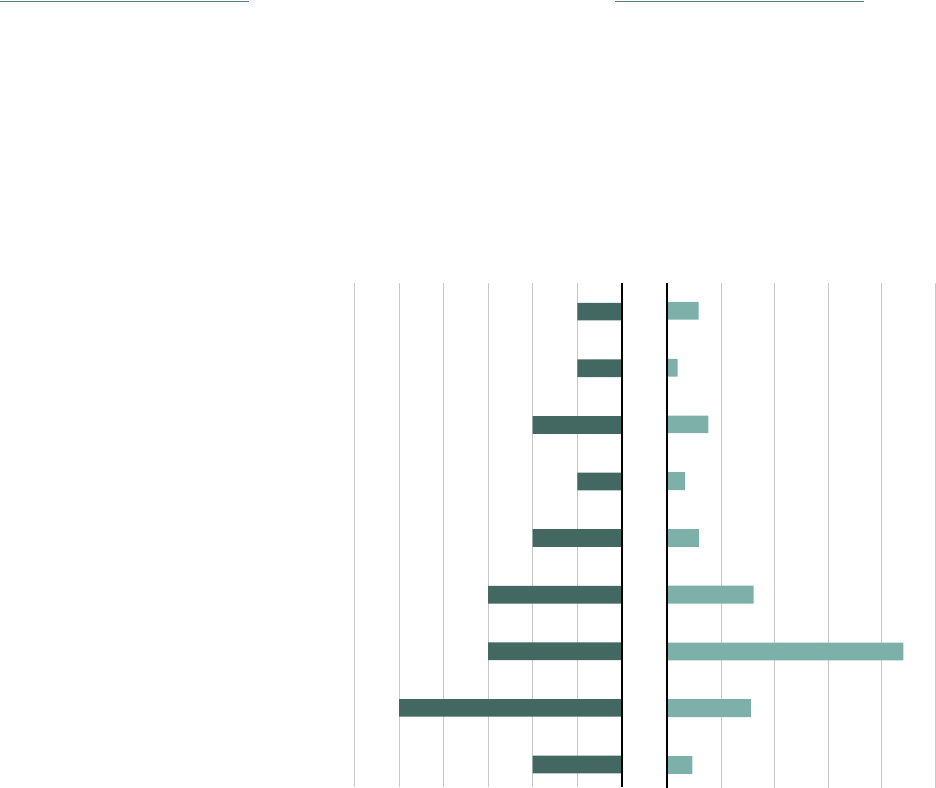
47
LEGISLATIVE ANALYST’S OFFICE
47
LEGISLATIVE ANALYST’S OFFICE
CHAPTER 2 HEALTH, SAFETY, AND WELL-BEING
EMERGENCY RESPONSE AND PREPAREDNESS
Various types of emergencies, such as wildfires, floods, earthquakes, and pandemics, can
threaten Californians’ lives and property. Activities related to emergencies generally fall into
three categories:
• Preparedness. Prevention and mitigation activities that can reduce the likelihood or severity
of emergencies before they occur, such as reducing fuel loads in forests, seismically
retrofitting buildings, prepositioning emergency equipment, and stockpiling supplies.
• Response. Activities that occur during an emergency to save lives and property, such as
wildfire suppression, evacuation efforts, and distribution of vaccines.
• Recovery. Activities that take place following an emergency, such as debris removal and
rebuilding damaged infrastructure.
WHY IS IT IMPORTANT?
Emergencies Have Major Impacts on Communities. During emergencies, communities
can sustain business disruptions, health impacts, damage to property and natural resources,
as well as the loss of lives.
Moreover, emergencies can
disproportionately harm certain
communities, such as coastal
communities vulnerable to
sea-level rise and Central
Valley communities vulnerable
todrought.
Emergencies Have Become
More Prevalent. This trend is
likely to continue with the state
experiencing more emergencies
in the future—including natural
disasters and infectious
diseases—as a result of climate
change and other factors,
such as increased building in
wildfire-prone areas and the
long-run increase in global
airtravel.
Most of the State’s 20 Most Destructive Fires
Occurred in Past Two Decades
Total Structures DestroyedNumber of Fires
5,000 10,000 15,000 20,000 25,000
1991
1999
2003
2007
2015
2017
2018
2020
2021
123456
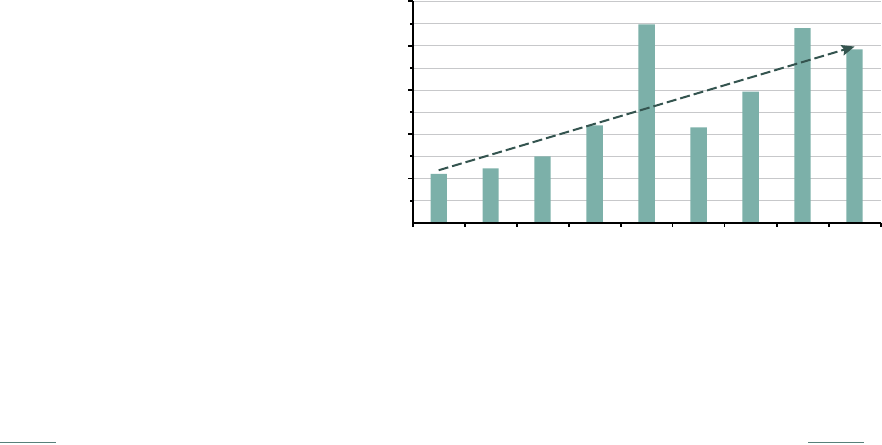
48
LEGISLATIVE ANALYST’S OFFICE
48
CHAPTER 2 HEALTH, SAFETY, AND WELL-BEING
LEGISLATIVE ANALYST’S OFFICE
Emergency-Related Costs Have
Been Significant and Increasing in
Recent Years. Local, state, and federal
governments bear costs associated
with preparing for, responding to, and
recovering from emergencies. For
example, the Office of Emergency
Services—the state entity responsible
for overseeing the state’s response
to emergencies—spends funds on
emergency coordination, logistics,
and communications. In addition,
property losses in disasters are often
borne by victims and their insurance.
Many of these costs have grown over
time aslarge-scale emergencies have
become moreprevalent.
WHAT ARE KEY LEGISLATIVE CONSIDERATIONS?
Î What Is the Appropriate Role of the State? Various levels of government, as well
as private entities and individuals, have a role in emergency preparedness, response,
and recovery. This includes state and local agencies planning for and responding to
emergencies, local agencies determining land use zoning, and private individuals making
decisions about prevention and mitigation efforts for their properties or businesses. Given
the involvement of so many different entities, the Legislature might want to continuously
consider the state’s role and whether the remaining entities’ incentives are appropriately
aligned to ensure emergency planning and programs are effective.
Î What Is the Legislature’s Role in Oversight of the Governor’s Existing Authorities?
Under current law, the Governor has expansive authorities to respond to emergencies,
such as by suspending state laws, implementing new policies or programs, and redirecting
staff and funds to emergency response without legislative approval and with only minimal
reporting. For example, during the COVID-19 pandemic, the Governor shifted funds
budgeted for prison operations to various pandemic-related activities to reduce the spread
of the virus in state prisons. It is important for the Legislature to continuously consider the
appropriateness of the Governor’s broad authorities and the extent to which additional
oversight is needed to ensure emergency response activities are cost-effective, consistent
with other legislative priorities, and achieving desired outcomes.
Î Should the State Have a More Strategic Approach to Emergencies? While the state has
various emergency plans, it often lacks a coordinated strategic approach for setting goals;
assessing capacity; and funding the optimal mix of emergency preparedness, response,
and recovery activities. For example, despite the increased frequency of wildfires, the
state lacks thorough and strategic assessments of its wildfire response capabilities and
an assessment of which combination of prevention, mitigation, and response activities are
the most cost-effective.
Office of Emergency Services Budget
Has Grown Over Time
(In Billions)
1
2
3
4
$5
2015-16 2016-17 2017-18 2018-19 2019-20 2020-21 2021-22 2022-23 2023-24
49
LEGISLATIVE ANALYST’S OFFICE
49
LEGISLATIVE ANALYST’S OFFICE
CHAPTER 2 HEALTH, SAFETY, AND WELL-BEING
Î Are Resources Being Deployed Equitably? Certain communities—whether because of
their economic size or the magnitude of emergencies in their geographic area—might not
have sufficient resources for preparedness, response, and recovery activities. Additionally,
there can be challenges to delivering emergency services to certain communities, such
as language or cultural barriers. It is critical to ensure that the federal, state, and local
governments are providing emergency resources and services in an equitable manner that
accounts for communities’ unique needs.

50
LEGISLATIVE ANALYST’S OFFICE
50
LEGISLATIVE ANALYST’S OFFICE
CHAPTER 3 FISCAL HEALTH, GOVERNANCE, AND OVERSIGHT
51
LEGISLATIVE ANALYST’S OFFICE
51
LEGISLATIVE ANALYST’S OFFICE
CHAPTER 3 FISCAL HEALTH, GOVERNANCE, AND OVERSIGHT
CHAPTER3
FISCAL HEALTH, GOVERNANCE, AND
OVERSIGHT
As shown in Chapters 1 and 2, California faces a range of important issues that deserve
sustained attention from policymakers. However, state government must have the capacity to
address these key issues effectively, efficiently, and equitably. Specifically, in this chapter, we
highlight the importance of ensuring the state is on sound fiscal footing , maintaining effective
intergovernmental relationships, and overseeing the implementation of new technologies—all of
which help improve the quality of public services and promote a more responsive government.

52
LEGISLATIVE ANALYST’S OFFICE
52
LEGISLATIVE ANALYST’S OFFICE
CHAPTER 3 FISCAL HEALTH, GOVERNANCE, AND OVERSIGHT
STRUCTURING THE BUDGET
Through the state budget, the Legislature distributes state resources to deliver services to
Californians. Through the annual budget process, the Legislature must make choices about
how to structure the state budget. These choices revolve around how much revenue to collect
and from what sources, as well as how much to spend and on what purposes.
WHY IS IT IMPORTANT?
Legislature Must Pass a Balanced Budget. Unlike the federal government, the state is
constitutionally required to pass a balanced budget and prohibited from issuing bonds to cover
deficits. In addition, the constitution includes spending requirements for certain programs, like
schools and community colleges.
Budget Condition Can Change Rapidly. State revenues can vary by tens of billions of dollars
from year to year. Given this volatility, revenue projections are inevitably either too high or too
low. This uncertainty can also result in rapid changes to the state’s budget condition—swinging
from large surpluses to significant deficits.
Budget Condition Impacts the Legislature’s Ability to Maintain Core Services. Rapid
changes in the budget’s condition can create challenges for the Legislature to maintain core
spending. We define core spending as the service levels the Legislature has committed to on
an ongoing basis—for example, health care, provided through Medi-Cal, and school funding,
provided through the Local Control Funding Formula. By developing a resilient budget structure,
the Legislature can maintain core services when revenues decline. Moreover, with sufficient
planning, the state could expand support in safety net programs even during economic
contractions, when demand typically increases (at the same time as revenues are declining).
Revenues Projections Are Usually Off by Billions—
Sometimes Tens of Billions—of Dollars Each Year
Actuals Relative to Budget Act Projections (In Billions)
-30
-25
-20
-15
-10
-5
5
10
15
$20
2000-01 02-03 04-05 06-07 08-09 10-11 12-13 14-15 16-17 18-19
$61
billion
$65
billion
20-21
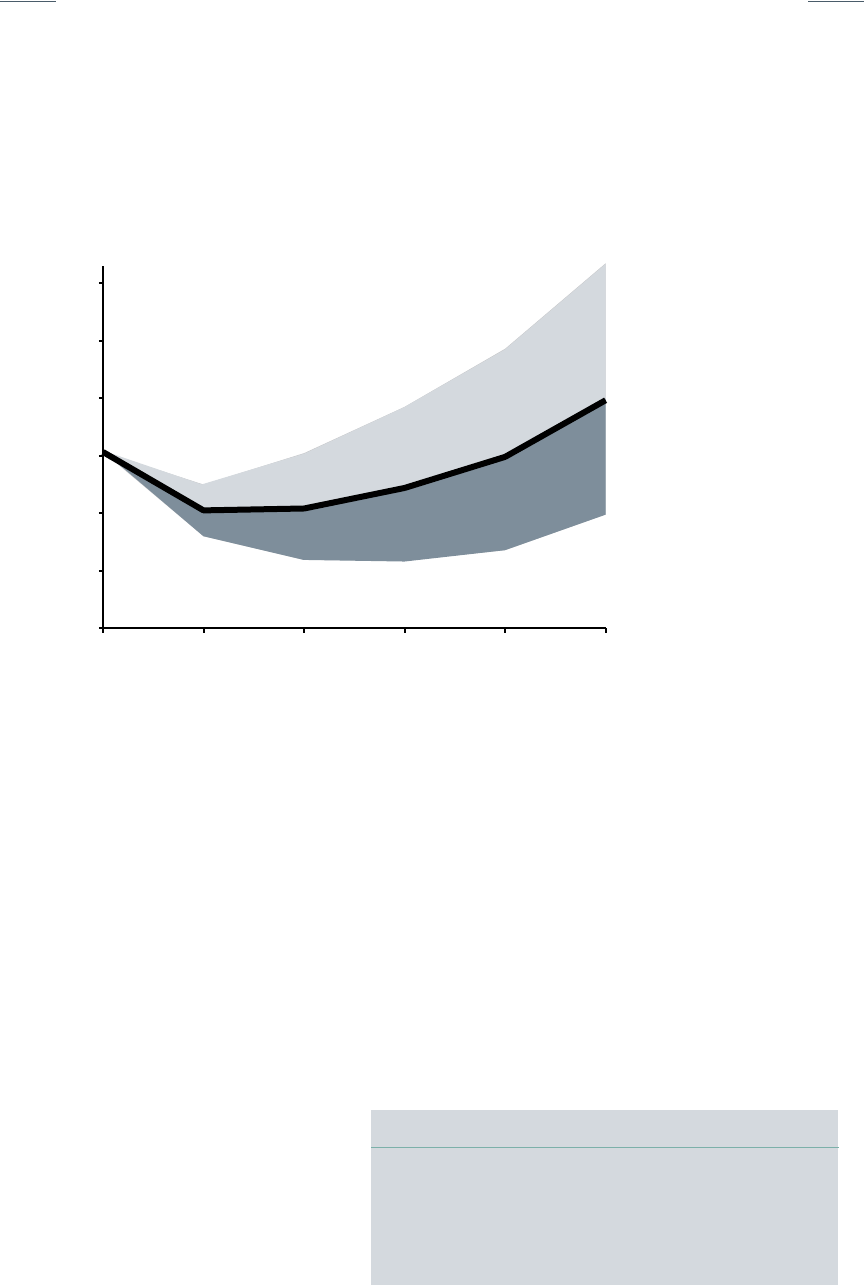
53
LEGISLATIVE ANALYST’S OFFICE
53
LEGISLATIVE ANALYST’S OFFICE
CHAPTER 3 FISCAL HEALTH, GOVERNANCE, AND OVERSIGHT
WHAT ARE KEY LEGISLATIVE CONSIDERATIONS?
Î What Revenue Estimate Should the State Use? We always suggest the Legislature adopt
a budget premised on the median scenario of revenue estimates. This approach strikes a
balance between avoiding deficits and missing opportunities.
Î Are the State’s Existing Commitments Affordable? We often use a breakeven analysis
to assess whether or not the state’s existing commitments are affordable. A breakeven
analysis communicates the chances that the state’s finances will be balanced—that is, that
the state will have neither deficits nor surpluses in the future. If the level of revenue required
for the state to breakeven is significantly higher than the median revenue scenario, the
state’s existing commitments likely are not affordable.
Î How Prepared Is the State for a Downturn? In general, our breakeven analyses do not
assume the state will face a recession. In a recession, budget resilience is necessary to
maintain core services. There are a variety of components—or tools—of budget resilience,
for example: budget reserves, opportunities for cost shifts, and internal borrowing capacity.
In addition, to the extent large prior surpluses have been allocated to one-time or temporary
purposes, the option to scale
back such commitments is a form
of budget resilience. A key first
step of the annual budget process
for the Legislature is to assess
whether there are sufficient
available budget tools given the
level of core services.
Selecting a Revenue Estimate
Figure Shows an Illustrative Range of Potential Revenue Outcomes
(In Billions)
160
180
200
220
240
260
$280
2021-22 2022-23 2023-24 2024-25 2025-26 2026-27
Planning on lower revenue estimates increases the chances the state’s programs are affordable,
but increases the risk of the state missing opportunities to expand services or lower taxes.
Planning on a higher revenue estimate enables higher
program spending, but increases the risk of future deficits.
Planning on the median
scenario balances these risks.
State Has Various Tools for Recessions:
Tools to Prepare Tools to Respond
Save Reserves Raise Revenues
Pay Down Debts Lower Spending
Multiyear Planning Shift Costs
Use Reserves (if Saved in Advance)
54
LEGISLATIVE ANALYST’S OFFICE
54
LEGISLATIVE ANALYST’S OFFICE
CHAPTER 3 FISCAL HEALTH, GOVERNANCE, AND OVERSIGHT
Î What New Commitments—if Any—Could Be Afforded? In some cases, the Legislature
might determine that its existing commitments are affordable and the state has sufficient
budget resilience, meaning that new commitments can also be afforded. The Legislature
has many choices about how to allocate those new commitments, including between:
one-time versus ongoing purposes, spending increases versus revenue reductions, new
programs versus paying down debt and liabilities associated with existing programs, and
using cash for infrastructure versus other program augmentations.
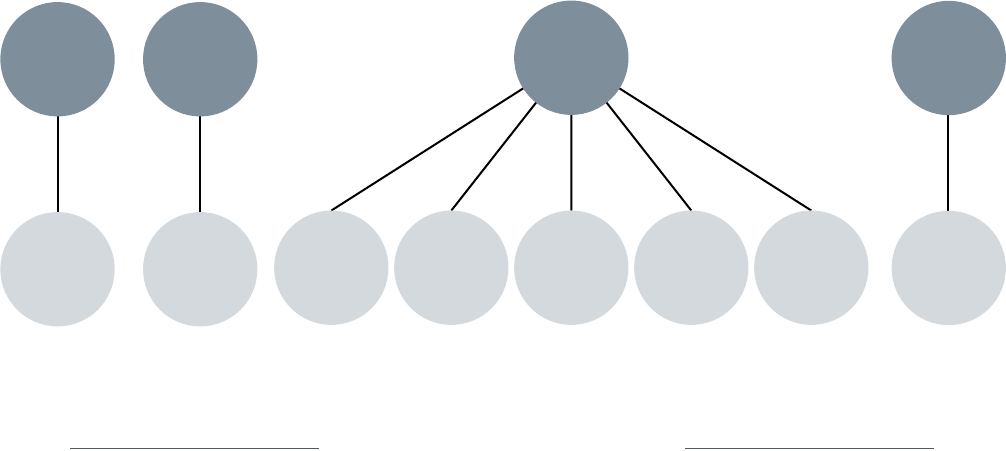
55
LEGISLATIVE ANALYST’S OFFICE
55
LEGISLATIVE ANALYST’S OFFICE
CHAPTER 3 FISCAL HEALTH, GOVERNANCE, AND OVERSIGHT
INTERGOVERNMENTAL RELATIONS
The state interacts with multiple layers of government. These governments have different
responsibilities and obligations to their constituents and different visions and capacities for
meeting those responsibilities.
WHY IS IT IMPORTANT?
Governments Have Distinct and Overlapping Responsibilities. Government have specific
and distinct responsibilities to sometimes overlapping constituencies. This layered and
overlapping structure creates opportunities and challenges. In addition, the federal and state
constitutions impose limits on what different levels of governments can do. Nevertheless,
governments must work together to provide public services.
State Plays Different Roles With Different Types of Governments. The state funds and sets
policies for some local programs directly. In these cases, the state also provides oversight. In
other cases, local governments can exercise significant local control and the state’s role is more
limited. For example, cities can exercise significant control over municipal affairs.
Most Complex Issues Facing the State Will Require Effective Collaboration Across
Governments. California faces a number of complex issues including climate change, wildfires,
housing and homelessness, infrastructure, and health care. Effective collaboration between
governments can help address these challenges effectively, efficiently, and equitably. In recent
years, the state has exercised greater policy direction in matters of statewide concern that
historically were left to local determination, for example, setting housing policies that aim to
spur housingdevelopment.
a
Includes both federally recognized tribes and non-federally recognized tribes.
Governments Serving Californians
Federal State Local Tribes
United States
of America
California
Cities
482
Counties
58
Special Districts
~2,000
Community
Colleges
114
School Districts
944
Tribes
164ª
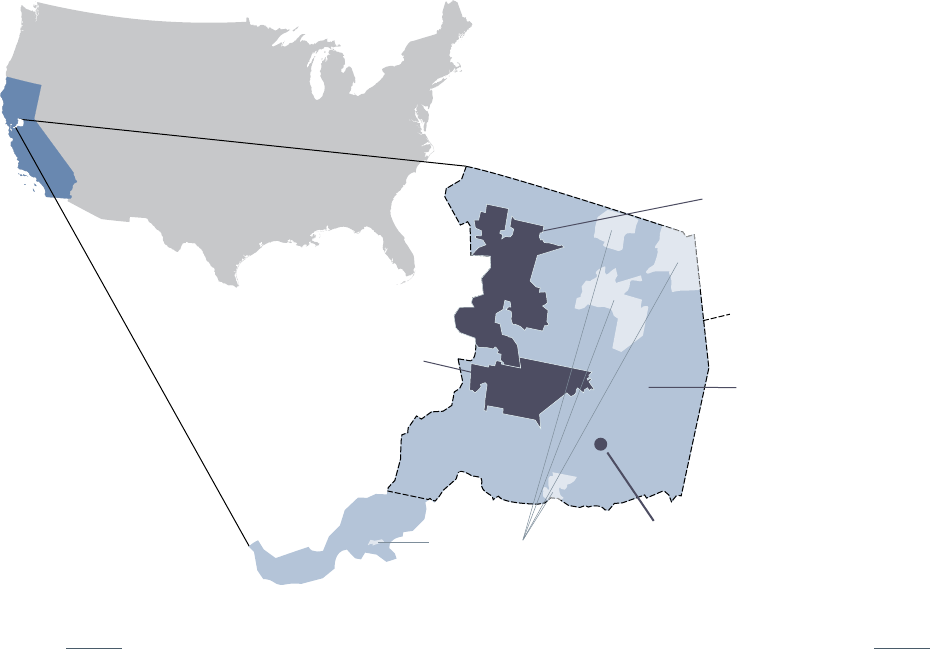
56
LEGISLATIVE ANALYST’S OFFICE
56
LEGISLATIVE ANALYST’S OFFICE
CHAPTER 3 FISCAL HEALTH, GOVERNANCE, AND OVERSIGHT
WHAT ARE KEY LEGISLATIVE CONSIDERATIONS?
Î In What Policy Areas Is Expanding the State Role Warranted? Some programs can
be more effectively administered by the state, for example, when statewide uniformity
is important. Other programs—like those where flexibility to meet diverse needs is
necessary—can be more effectively controlled by local governments. When determining
how responsibilities should be divided between state and local governments, the
Legislature could consider whether and to what extent to limit local control. For instance,
the Legislature can limit local control in matters of statewide interest. The Legislature
also may wish to limit local control in order to promote equitable access and outcomes in
service delivery.
Î What Is the Fiscal Capacity of Local Governments? Local governments have limited
authority to raise revenues relative to the state and federal governments. Given that
limitation, when creating new local requirements, the Legislature may want to consider the
fiscal capacity of local governments to deliver services. While the State Constitution requires
state funding for mandated public programs, some laws impose requirements on local
governments that do not require state funding. In order to promote collaboration among
governments, the Legislature may wish to consider the fiscal constraints local governments
may face.
Service Delivery Across California
Sacramento as an Example
City of Sacramento
The City of Sacramento generally
provides all municipal services to
residents, including police, fire,
and parks.
City of Elk Grove
The City of Elk Grove contracts for many
municipal services. For example, parks and
recreation, fire, and emergency medical
services are provided by the Cosumnes
Community Services District.
Wilton Rancheria
A federally recognized
tribal government, which
operates as a sovereign
nation with its own model
for delivering services.
Unincorporated Sacramento County
In lieu of a city, Sacramento County
provides municipal services to
unincorporated areas of the county.
Sacramento Municipal
Utility District
A special district providing utility
services within its jurisdiction.
Sacramento County
Sacramento County provides a variety of
countywide services for all residents, including,
health and human services, elections, and jails.
All Other Cities
57
LEGISLATIVE ANALYST’S OFFICE
57
LEGISLATIVE ANALYST’S OFFICE
CHAPTER 3 FISCAL HEALTH, GOVERNANCE, AND OVERSIGHT
Î How Can the State Foster and Oversee Effective Collaboration to Address Major
Crosscutting Issues? Successfully addressing the most complex issues facing the state
will require effective collaboration across many levels of government. The Legislature may
want to consider when the state should take the lead in collaborating across governments
versus when regional coordination is warranted (potentially with state-level oversight).
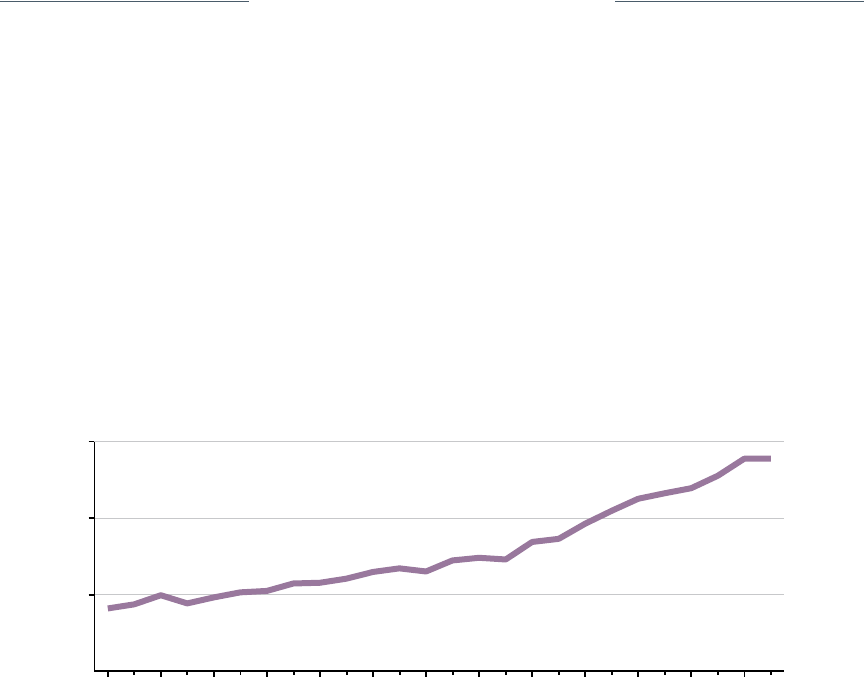
58
LEGISLATIVE ANALYST’S OFFICE
58
LEGISLATIVE ANALYST’S OFFICE
CHAPTER 3 FISCAL HEALTH, GOVERNANCE, AND OVERSIGHT
THE STATE’S ROLE IN TECHNOLOGY
New technological innovations and inventions continue to be developed and deployed across a
wide range of industries and sectors. As technology evolves and iterates over time, it transforms
the state’s economy, government, and society.
WHY IS IT IMPORTANT?
Technology Drives Major Changes in State’s Economy and Society. Real gross domestic
product (GDP) data reflect substantial growth in the state’s technology-driven information
industry over the past few decades, now adding the highest value of any industry to the state’s
GDP. Technological innovation is also transforming other industries, such as clean energy and
life sciences, benefiting state efforts to adapt to and mitigate climate change and improve the
health of its residents. Technological change also shapes the expectations and preferences of
a society. State residents increasingly expect goods and services across different industries
to be convenient, flexible, and responsive to their needs. These preferences extend to state
government operations, programs, and services, and inform state efforts to make government
more effective and efficient.
Effective and Efficient State Government Operations Require Technology. State
government information technology (IT) systems and other technology are critical to the
successful implementation of its laws, policies, and procedures. Often, essential government
program and service functions cannot be executed without performant, secure, and stable
technology. As technology becomes more central to many state government operations, state
departments also spend more on technology. State IT expenditure data show appreciable
growth in technology spending over the last fiveyears. A number of challenges remain,
5
10
15%
1997 1999 2001 2003 2005 2007 2009 2011 2013 2015 2017 2019 2021
Percentage of California Gross Domestic Product
a
Information industry data does not include all technology-related industries (for example, computer and electronics product manufacturing),
and is used for illustrative purposes only.
Increase in Information Industry's Contribution to State's GDP
ª
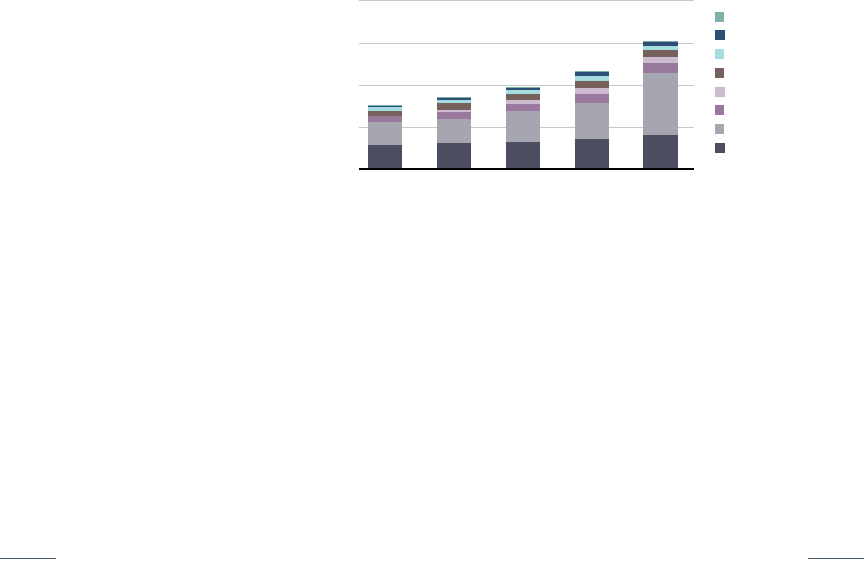
59
LEGISLATIVE ANALYST’S OFFICE
59
LEGISLATIVE ANALYST’S OFFICE
CHAPTER 3 FISCAL HEALTH, GOVERNANCE, AND OVERSIGHT
however, for state government to
effectively develop and maintain
its many IT systems and other
technology. These challenges
include recruiting, hiring, and
retaining IT staff; modernizing
decades-old technology without
any significant disruptions to
critical programs and services;
and securing technology to
avoid increasingly prevalent
cyberattacks and databreaches.
Technology Can Also Cause
Harm and Increase Risk Absent Regulation. Emerging technologies, such as artificial
intelligence, and developed technologies, such as social media, can grow the state’s economy
but they also can heighten information security risks and threaten the privacy of state resident
data and information. State government can pass and implement laws, policies, and regulations
to impact the trajectory of new technologies, including to mitigate potential harms and risks—as
well as possible disparities and inequities—that result from theiradvancement.
WHAT ARE KEY LEGISLATIVE CONSIDERATIONS?
Î How Can the State Advance Technological Innovation While Addressing Disparities?
Technology continues to drive economic growth in the state. How the state chooses to foster
this advancement and innovation in technology, therefore, is an important consideration
for the Legislature. Equitable growth and opportunity from technology may require the
Legislature to invest in and prioritize infrastructure projects, for example, such as the
recent investments in broadband infrastructure across unserved and underserved areas of
the state.
Î How Can the State Effectively Modernize and Stabilize State Government
Technology? IT systems and other technology are becoming more central to state
government operations. How the state plans, develops, and implements technology (with
the performance, security, and stability that meets state residents’ needs) is a key area
for legislative oversight. Achieving the goal of an effective and efficient government that
integrates modern technology into its operations may require the Legislature to evaluate
state processes for planning and procuring its technology, for example, and/or simplify state
laws, policies, and regulations that inform system requirements and technology needs.
(In Billions)
Growth in State IT Expenditures
2
4
6
$8
2018-19 2019-20 2020-21 2021-22 2022-23
a
Personnel
Services/Consulting
Software
Cloud Services
Hardware
Telecommunications
Network
Mobile Phones
a
2022-23 expenditures are estimated, not actual expenditures.
IT = information technology.
60
LEGISLATIVE ANALYST’S OFFICE
Î How Can the State Mitigate Harms and Risks of Technological Change? Technological
change can advance growth and improve society, but also can lead to potential harms and
risks. How the state can mitigate these potential harms and risks through, for example,
new policy and regulation warrants legislative consideration. Deciding on the appropriate
safeguards around certain technologies may require the Legislature to fund research on harms
and risks of new technologies, for example, such as artificial intelligence.

61
LEGISLATIVE ANALYST’S OFFICE
CONCLUSION
California Faces Many Complex, Overlapping Key Issues. As demonstrated by this report,
the key fiscal and policy issues facing California are overlapping and complex. Inaddition,
each issue is unique and raises a variety of different policy considerations for the Legislature
as it continues its work to address them. As a result, efforts to address them will need to be
done thoughtfully, strategically, and with a focus on long-term outcomes. Policy changes and
budget actions will likely range in size from more modest, incremental adjustments to more
significantreforms.
Some Common Considerations Across Multiple Policy Areas. In compiling this report, we
identified several important legislative considerations that are common across many of these
complex issues. Some of the common considerations include:
• What Is the State’s Role? The Legislature may want to identify what, if any, role the state
should play in addressing the problem. The state’s role is often distinct from the role of
federal or local government, or the private sector. What is the most effective mechanism for
state intervention?
• What Are the Policy Trade-Offs? The Legislature will often have to weigh critical trade-
offs when determining the scope of potential solutions and the strategy for addressing
these issues. In some cases, policies to address one of these issues could exacerbate
other problems.
• How Will the Legislature Conduct Oversight? The Legislature likely will want to continue
efforts to ensure its policy actions are meeting their intended goals. This often requires
strong and effective oversight. How will the Legislature determine success and how will it
oversee the administration’s implementation of these policies?
62
LEGISLATIVE ANALYST’S OFFICE
63
LEGISLATIVE ANALYST’S OFFICE
64
LEGISLATIVE ANALYST’S OFFICE
LAO PUBLICATIONS
This report was an office-wide effort with input from many different analysts. The report was coordinated by
GinniBella Navarre and Ross Brown, and reviewed by Carolyn Chu. The Legislative Analyst’s Office (LAO) is a
nonpartisan office that provides fiscal and policy information and advice to the Legislature.
To request publications call (916) 445-4656. This report and others, as well as an e-mail subscription service, are
available on the LAO’s website at www.lao.ca.gov. The LAO is located at 925 L Street, Suite 1000, Sacramento,
California 95814.
