Collection and Use of Total Petroleum
Hydrocarbon Data for the Risk-Based
Evaluation of Petroleum Releases
Example Case Studies
Last Updated: October 2018
Published by
Hawai´i Department of Health
Hazard Evaluation and Emergency Response Office
Honolulu, Hawai´i

TPH Risk - Case Studies (HIDOH, October 2018)
ii
Forward
The case studies presented herein highlight the risk-based use of Total Petroleum Hydrocarbon
(TPH) data for soil, soil vapor, groundwater, surface water and ambient air for investigation,
remediation and long-term management of petroleum releases. The case studies were published
by the Hawai´i Department of Health (HIDOH) in association with input from multiple, outside
state and federal regulators as well as private consultants and experts associated with the
petroleum industry. Matthew Small, Science Liaison and senior geologist with Region 9 of the
U.S. Environmental Protection Agency, is in particular acknowledged for his review and
contribution to the information presented. The primary authors, Roger Brewer with the HIDOH
and Manivannan (Mani) Nagaiah with Langan Engineering & Environmental Services, Inc.,
were also active members of the Interstate Technology & Regulatory Council (ITRC) TPH Risk
Evaluation work group at the time that the case studies were prepared and acknowledge
important contributions to this document from many team members. It is anticipated that the
Case Studies will be referenced in the final, ITRC guidance document (publication early 2019)
for examples of the site-specific use of TPH data. Refer to information in the ITRC document for
additional details on specific topics presented in the case studies, as well as the references
provided herein.
The case studies presented within this document will be periodically updated as additional
insight and experience in the risk-based use of TPH and other petroleum-related data is
gained. Comments, edits and suggestions for future updates are welcome. Contact information
for the authors is provided below. Updates to the document are summarized in Attachment 6.
Reference:
HIDOH. 2018. Collection and Use of Total Petroleum Hydrocarbon Data for the Risk-Based
Evaluation of Petroleum Releases, Example Case Studies (March 2018; updated October 2018):
R. Brewer, M. Nagaiah and R. Keller, authors. Hawai´i Department of Health, Hazard Evaluation
and Emergency Response Office. Honolulu, Hawai´i.
Contacts:
Roger Brewer, PhD
Hawai´i Department of Health
Hazard Evaluation and Emergency Response Office
Honolulu, Hawai´i
Email: [email protected]
Manivannan (Mani) Nagaiah, PE
Langan Engineering & Environmental Services, Inc.
110 East Broward Boulevard, Suite 1500
Fort Lauderdale, FL 33301
Tel: 1-610-554-808
Email: mnagaiah@langan.com
TPH Risk - Case Studies (HIDOH, October 2018)
iii
Contents
1 INTRODUCTION .................................................................................................................... 1
1.1 Tiered Risk Assessment .................................................................................................... 2
1.2 Risk-Based Screening Levels (Backward Risk Assessment) ............................................ 3
1.3 Forward Calculation of Risk (Forward Risk Assessment) ................................................ 4
2 USE OF TPH DATA BY LIFE CYCLE STAGES .................................................................. 8
2.1 Release Detection ............................................................................................................ 10
2.2 Site Characterization ....................................................................................................... 10
2.3 Risk Assessment .............................................................................................................. 11
2.4 Remediation and Monitoring ........................................................................................... 11
2.5 Closure ............................................................................................................................. 11
3 EVALUATION OF EXISTING TPH DATA ........................................................................ 12
4 COMMON RISK ASSESSMENT PROBLEMS AND DATA LAPSES .............................. 13
5 CASE STUDIES OVERVIEW ............................................................................................... 14
Attachments
Attachment 1: Case Studies
Attachment 2: Categories of Petroleum Release Sites
Attachment 3: Potential Environmental Concerns
Attachment 4: Example Carbon Range and TPH Screening Levels
Attachment 5: Metabolite Screening Levels
Attachment 6: Updates
TPH Risk - Case Studies (HIDOH, October 2018)
1
1 INTRODUCTION
This document presents a series of case studies and supporting information that highlight the use Total
Petroleum Hydrocarbon (TPH), carbon range and related data for the investigation, risk assessment and
remediation of petroleum releases. Five release scenarios are presented (Attachment 1): 1) Former Fuel
Tank Farm, 2) Active Gas Station, 3) Tanker Truck Accident, 4) Crude Oil Pipeline Rupture and 5) Oil
and Gas Field. Themes considered in development of the case studies are summarized in Attachment 2.
The case studies reflect examples of investigation and risk assessment activities carried out during
different lifecycle stages of site investigation and remedial actions. The types of releases and conditions
illustrated by the case studies are intended to be generic in nature. The data and release scenarios presented
in large part, however, reflect the collective experience of the authors and the numerous consultants,
regulators and industry experts who provided input during preparation of the document. Refer to the
references provided in individual sections for additional information on specific topics. Refer also to the
document “TPH Risk Evaluation at Petroleum Contaminated Sites”, to be published by the Interstate
Technology and Regulatory Council (ITRC) in 2019 (ITRC 2018).
The case studies highlight environmental concerns commonly encountered at petroleum release sites.
Emphasis is placed on the upfront collection of data that is adequate for decision making in order to
minimize the need for remobilization and collection of additional data. The design of sample collection
work plans should reflect the risk question(s) being asked or the specific needs of corrective actions under
consideration. For example, this might include the collection of data needed to determine mean TPH or
carbon range concentrations in targeted, exposure areas and volumes of soil or air in order to assess
potential health risks and/or the collection of data needed define the extent of TPH contamination above
levels of potential concern in order to optimize remedial actions. This necessitates upfront coordination
of the field team with risk assessors and remediation experts likely to be involved in the project at a later
date as well as the overseeing, regulator agency.
The case studies follow a traditional, sequential approach to site investigation and risk assessment (ITRC
2015) with respect to typical lifecycle stages of petroleum release sites. An advancement on traditional
methods is the use of Decision Unit and Multi Increment Sample investigation methods to more efficiently
and reliably bound and characterize contamination (HIDOH 2016; “Multi Increment” is trademarked by
Envirostat, Inc.). This is referred to as “Incremental Sampling Methodology (ISM)” in ITRC guidance
(ITRC 2012), although some discussions in that document are now out-of-date (e.g., erroneous discussion
of statistical evaluation and representativeness of “ISM” samples). Release sites are classified based on
current/former operations, source basis, investigation/risk/remediation status and the impacted
media/receptor and pathway.
Common environmental concerns associated with petroleum releases include:
Direct exposure;
Vapor intrusion;
Leaching and contamination of groundwater;
Drinking water toxicity;
Aquatic toxicity; and
Gross contamination (“ceiling levels”).
TPH Risk - Case Studies (HIDOH, October 2018)
2
A description of these terms is provided in Table 1 and Attachment 3. Refer also to HIDOH (2017)
additional discussion. Example TPH soil, water, air and soil vapor screening levels for each of these
potential concerns are presented in Attachment 4. Published screening levels for sediment are also
presented, although he risk posed to ecological receptors by a petroleum release must normally be assessed
on a site-specific basis due to the variability and complexity of the habitats and receptors impacted. Section
5 presents an overview of the chemistry and toxicity of degraded, petroleum hydrocarbon-related
compounds in water.
1.1 Tiered Risk Assessment
Tiered approaches for the assessment of petroleum contamination in terms of TPH have been adopted by
many state agencies (e.g., MADEP 1994, 2014; CAEPA 2016, HIDOH 2017). In a general sense, the tiers
can be summarized as follows:
Comparison of site data to published screening levels (“Tier 1”);
Limited, site-specific modification of published screening levels (“Tier 2”); and,
Full, site-specific risk assessment including independent, “forward” quantification of risk and/or
“backward” development of site-specific cleanup levels (“Tier3”).
In practice the distinction between different tiers is often blurred, and steps to assess risk beyond simple
comparison of site data to published screening levels are often simply referred to as an “advanced
assessment.” Examples of progressively more detailed approaches to assessment of risk are presented in
Table 1. Tiered approaches provide for a systematic determination of the level of investigation required,
risk evaluation and remediation appropriate for each individual site. This helps to guide investigations and
facilitate the most efficient use of resources for a subject site.
Pre-approved, generic screening levels published by regulatory agencies expedite site characterization and
risk assessment actions and, although not required, can in some instances serve as final cleanup levels.
Proceeding from generic screening levels to a progressively more site-specific risk assessment, as deemed
appropriate or otherwise required by the overseeing regulatory agency, typically decreases the degree of
conservative assumptions used in decision making and improves the efficiency and effectiveness of
decision making.
The degree of detail and emphasis at each level of risk assessment is left to the individual practitioner,
based on site characteristics and the time- and cost-benefit of proceeding to more a detailed assessment.
Properly developed, comprehensive, screening levels minimize the need to advance to successive levels
of risk assessment for relatively simple release sites. Screening levels can instead be directly used to guide
remedial or risk management actions. A more thorough assessment of risk and development of site-
specific screening and cleanup levels might be desirable for large, complex releases that are likely to
require costly investigation and remediation actions.
A “screening level” risk assessment involves comparison of site data to published, generic screening
levels. These are referred to as “Method 1” or “Tier 1” screening levels in some guidance documents (e.g.,
MADEP 2014; CAEPA 2016, HIDOH 2017). This can achieve the following objectives:
Estimate whether the reported TPH levels exceed benchmark or guideline values for relevant
receptors and media;
Identify specific environmental concerns and allow for the completeness of exposure pathways
between TPH contamination and potential receptors to be evaluated; and/or
Develop an initial remediation action plan.
TPH Risk - Case Studies (HIDOH, October 2018)
3
If contamination above screening levels is identified and remedial actions can be carried out relatively
easily and cost-effectively or if the contamination does not pose a potential risk under current conditions,
then proceeding to a more detailed, site-specific risk assessment is generally not necessary. Direct
calculation of risk or with respect to TPH, “noncancer hazard,” as might be done in a traditional, detailed
risk assessment can be accomplished by simple comparison of site data to risk-based screening levels.
The method to do this is discussed under “Forward Calculation of Risk” below.
When necessary, progression to a more site-specific but still limited risk assessment allows targeted
adjustment of individual parameters used to generate generic screening levels without the need for a
lengthy and time consuming, traditional risk assessment. Justification for changes of select parameter
values should be included in the risk assessment report. This might include consideration of alternative
toxicity factors, alternative fate and transport parameter values (e.g., solubility, sorption coefficient, etc.),
alternative target risk, exclusion of incomplete exposure pathways, consideration of site-specific thickness
of contaminated soil, depth to groundwater and indoor air exchange rates among other factors. Limited
modification of generic screening levels, with most default assumptions and approaches still employed,
allows for expedited review of the risk assessment by the overseeing, regulatory agency. If the modified
screening levels are acceptable to all parties for final decision making, then the risk assessment process is
considered complete and a more rigorous, advanced evaluation is not necessary.
An advanced, traditional risk assessment involves the development of more rigorous models supported by
a much more thorough investigation of TPH sources, pathways and receptor characteristics. This process
is discussed in HIDOH (2017). The intention at this stage is to further customize the site-specific criteria
developed under screening level approaches and achieve a more accurate representation of the risk posed
by exposure of receptors to TPH in the affected media. Such methods typically start with an independent
assessment of each potential, environmental concern identified during the screening level assessment and
can include the use of alternative models and approaches, depending on the specific concern of interest.
A hybrid mix of tiered approaches to risk assessment is common, with generic screening levels used to
address relatively simple concerns and more detailed assessments prepared for complex releases or
assessment of risks less amenable to generic screening levels. This include direct testing of soil vapor or
indoor air for TPH or TPH carbon ranges in order to assess vapor intrusion risk, rather than initial
comparison of soil or groundwater data to screening level for this exposure pathway.
1.2 Risk-Based Screening Levels (Backward Risk Assessment)
Generic carbon range or carbon range-weighted, TPH screening levels for the environmental concerns
noted above have been published by several regulatory agencies, as referenced throughout this section.
Example TPH and carbon range screening levels used in the case studies are summarized in Attachment
4. The screening levels presented are for example only and should not be used without consultation with
the overseeing, environmental agency.
As described in Attachment 4, the screening levels presented incorporate commonly used assumptions
regarding the mobility and toxicity of TPH compounds in the environment and potential exposure of
human and ecological receptors. These criteria can be either very specific (e.g. daily residential exposure
to TPH in soil or air through ingestion, dermal absorption and/or inhalation) or more generic (e.g., water
quality guidelines for the protection of specific aquatic species, regardless of whether these receptors are
in fact present in the receiving waters).
Examples and utilization of generic screening levels for TPH and site-specific screening levels for carbon
ranges are included in the case studies presented in Attachment 1. Although the TPH screening levels
TPH Risk - Case Studies (HIDOH, October 2018)
4
presented are based on guidance published by the state of Hawaii (HIDOH 2017), they reflect a
compilation of guidance published by California (CAEPA 2016), Massachusetts (MADEP 2014) and a
host of other states, as well as USEPA’s Regional Screening Level guidance (USEPA 2017).
Several states rely on the use of pre-approved, agency-published, generic screening levels for site
characterization and remediation, with minimal need for development of site-specific screening levels or
quantitative calculation of risk (e.g., MADEP 2014, CAEPA 2016, HIDOH 2017). Screening levels
published by the noted agencies are intended to comprehensively address the most common types of
potential, environmental concerns associated with petroleum-contaminated soil and groundwater. More
detailed assessments are generally reserved for a relatively small number of large, complex sites. Some
states focus on the use of default models for development of site-specific screening levels or calculation
of risk (e.g., Montana, Utah etc.). The models typically focus on direct exposure, however, and the
resulting screening levels might not be adequately protective of leaching, vapor intrusion and/or gross
contamination concerns. Other entities use a hybrid approach, with screening levels that focus on a small
subset of environmental concerns anticipated to drive the need for cleanup or long-term management
specific to their location, such as leaching and potential impacts to groundwater in areas that overlie a
highly vulnerable and irreplaceable drinking water aquifer. Evaluation of other potential concerns, such
as direct exposure or vapor intrusion, is carried out on a site-specific basis as warranted.
An advanced, detailed site-specific evaluation may not necessarily involve the use of quantitative models.
Assessment of potential leaching concerns can, for example, sometimes be more directly evaluated by the
collection of groundwater samples at sites where the soil in question is already in contact with groundwater
or otherwise exposed and reflective of long-term, leaching conditions. The direct collection of soil vapor
data is recommended for assessment of potential vapor intrusion risks when contaminated soil or
groundwater is present within 15-30 feet of the base of an overlying building, rather than reliance on soil
or groundwater vapor intrusion models (ITRC 2014; HIDOH 2017). Published, “gross contamination”
screening levels for short-term vapor emission and other risks posed by the disturbance of heavily-
contaminated soil or groundwater are very useful during the initial stages of an investigation, but actual
risks are best assessed based on observations in the field.
1.3 Forward Calculation of Risk (Forward Risk Assessment)
Models for calculation of generic soil, drinking water and air screening levels that pertain to direct-
exposure risk include the incorporation of a target, noncancer “Hazard Quotient” (USEPA 2017; see
Attachment 4). A Hazard Quotient or “HQ” of “1” reflects an exposure where no adverse health effects
are anticipated. An HQ of greater than “1” does not necessarily indicate that adverse impacts to exposed
receptors is occurring, only that additional evaluation is warranted. Note that cancer risk is typically
assessed in terms of individual, well-studied, known or suspected carcinogenic constituents of petroleum
such as benzene, ethylbenzene, naphthalene and other polyaromatic hydrocarbon (PAH) compounds,
rather than TPH mixtures as whole.
The direct-exposure models for soil, water and air and exposure assumptions used to calculate risk-based
screening levels can be modified to directly calculate risk. In this case the representative exposure
concentration of individual carbon ranges (or total TPH, iif a carbon range-weighted approach is used) is
input into the model and a noncancer HQ that reflects the input concentration and exposure assumptions
is calculated. This approach is often used for complex sites where exposure concerns and remediation
costs warrant the additional time and resources required to prepare a detailed, quantitative assessment of

TPH Risk - Case Studies (HIDOH, October 2018)
5
health risk. Refer to the USEPA RSL guidance for additional information on the quantitative calculation
of risk from input, site-specific sample data (USEPA 2017).
A quick, “forward” calculation of risk can also be carried out by simply dividing site data representative
of “reasonable maximum” exposure conditions by the target carbon range screening level (or carbon
range-weighted TPH screening level) and adjusting with respect to the target risk, in this case the target
HQ, used to develop the screening level:
Where “EAC” is the exposure area concentration, “RBSL” is the risk-based screening level, and “THQ”
is the target HQ used to develop the RBSL.
If a target HQ of “1” was used to calculate the screening level, then the ratio of the site-specific
concentration to the screening level directly reflects the site-specific risk or HQ. The screening level will
otherwise need to be adjusted to reflect a target HQ of “1” for comparison. For example, an exposure area
concentration 500 mg/kg for a contaminant in soil with a risk-based screening level based on an HQ of
“1” of 1,000 mg/kg would yield a site-specific, noncancer Hazard Quotient of 0.5. This suggests an
absence of significant, health risk under the assumed exposure conditions. Similarly, a concentration of a
contaminant in air of 500 µg/m
3
compared to a risk-based screening level of 100 µg/m
3
yields an HQ of
5.0 and suggests that additional evaluation of potential adverse health risks is warranted. This might
include a closer review of actual exposure conditions with respect to assumptions used in the generic
screening level models or even a more detailed review of the toxicity factors incorporated into the models.
Risk assessors use such forward calculations of risk in conjunction with actual site conditions to better
understand health concerns posed to exposed workers or residents. Examples of this approach are included
in Case Study #1. In practice, the results often do not differ significantly from conclusions drawn from
detailed, quantitative risk assessments based on a “reasonable worst-case exposure” scenario, since the
same set of default, exposure assumptions used to develop the screening levels are likely to be considered.
Direct comparison of representative site data to well-thought-out, risk-based screening levels allows for a
more rapid identification of high-risk conditions and expedited actions to reduce or remove exposure, if
warranted.
Cumulative risk or in the case of noncancer concerns a “Hazard Index (HI)” must be calculated and
considered if multiple chemicals with the same target health effect are being evaluated (refer to HIDOH
2017). This will be the case for evaluation of individual carbon ranges. An HI is calculated by simply
adding Hazard Quotients calculated for individual carbon ranges:
…
Where HQ
1
, HQ
2
, HQ
3
, etc., represent the Hazard Quotient calculated for individual carbon ranges. The
calculated HI is evaluated in the same manner as an individual HQ, with a value equal to or less than “1”
indicating that no further assessment is required and a value greater than “1” indicating that further
evaluation of potentially adverse health risks is warranted. Note that it is entirely possible for
concentrations of individual carbon ranges to fall below respective risk-based screening levels and/or meet
a target Hazard Quotient of “1” (i.e., not pose an adverse risk on an individual basis) but the cumulative
Hazard Index to exceed “1” and indicate that further actions are needed.

TPH Risk - Case Studies (HIDOH, October 2018)
6
Table 1. Example tiered approaches for assessment of potential environmental concerns associated with TPH and TPH-related contaminants (refer to
HIDOH 2017).
1
Example
Environmental
Concern
2
Description
3
Tier 1: Generic
Screening
Levels?
4
Tier 2: Example Limited
Modifications to Tier 1
Screening Levels
5
Tier 3: Example Advanced Risk
Assessment Approaches
Soil (including exposed sediment)
Direct Exposure
Incidental ingestion, dermal absorption,
inhalation
Yes
Modification of target risk,
toxicity factors and/or
exposure assumptions
Site-specific use of risk calculators, with option
for alternative exposure models (e.g.,
alternative vapor flux model)
Vapor Intrusion Intrusion of vapors into overlying buildings
6
Not
Recommende
d
-
6
Collection of soil vapor data (including subslab
vapor) and/or indoor air data
Leaching
Leaching of TPH or related degradation
products from soil and subsequent impacts
to
g
roundwate
r
7
Yes
7
Limited
Direct assessment of groundwater conditions
(uncapped site or contamination in contact with
g
roundwater),
7
site-specific models
8
Gross Contamination
Presence of free product (NAPL), short-
term vapor emissions, sheens in runoff, etc.
Yes Use of site-specific data
Field evaluation of potential vapor emission and
free product concerns
9
Terrestrial
Ecotoxicit
y
Impacts to terrestrial flora and fauna Limited -
Site-specific ecological risk assessment if
sensitive habitat impacted
Groundwater/Surface Water
10
Direct Exposure
(drinking water
toxicit
y
)
Ingestion of impacted groundwater (+/-
inhalation of vapors and dermal
absorption).
Yes
Modification of target risk,
toxicity factors and/or
exposure assumptions
Site-specific use of risk calculators, with option
for alternative exposure models
Vapor Intrusion Intrusion of vapors into overlying buildings
6
Not
Recommende
d
-
6
Collection of soil vapor data (including subslab
vapor) and/or indoor air data
Aquatic Ecotoxicity
Discharges of impacted groundwater to
aquatic habitats
Yes Limited
Monitoring of plume stability, bioassay tests
usin
g
site-specific samples of
g
roundwate
r
10
Gross Contamination
Presence of free product (NAPL), sheens,
short-term vapor emissions, taste and odors,
etc.
Yes Limited
Field evaluation of free product, sheens, odor
concerns
Soil Vapor
11
Vapor Intrusion Intrusion of vapors into overlying buildings Yes
Modification of target risk,
toxicity factors, exposure
assumptions, vapor entry
rate, air exchan
g
e rate, etc.
Direct testing of indoor air, with concurrent soil
vapor data to verify source, site-specific models
Indoor/Ambient Air
Direct Exposure
Inhalation exposure to indoor air impacted
by intrusion of subsurface vapors.
Yes
Modification of target risk,
toxicity factors and/or
exposure assumptions
Forensics analysis of data to assess source of
indoor air impacts
TPH Risk - Case Studies (HIDOH, October 2018)
7
Table 1 (cont.). Example tiered approaches for assessment of potential environmental concerns associated with TPH and TPH-
related contaminants.
Notes:
1. Availability of screening levels for specific, environmental concerns varies between agencies. Screening levels published by a local agency might
not be applicable in other areas due to assumed target risks, toxicity factors employed, default exposure assumptions, etc. This includes screening
levels for vapor intrusion, since risk is closely linked to local climate conditions and building designs.
2. Refer to HIDOH 2017 for a more detailed description of the noted environmental concern. Other environmental concerns not listed might also be
applicable on a site-specific basis (e.g., uptake of petroleum into food crops).
3. “Yes” indicates that generic screening levels have been published for the noted environmental concern by some agencies. Presentation of screening
levels for TPH fuel fractions (e.g., TPH as gasoline, diesel or heavy oil) versus screening levels for individual, carbon range fractions varies between
states, as do the specific carbon ranges and toxicity factors considered.
4. Example modifications to risk calculators used to develop published, generic screening levels (not intended to be complete). Note that published
screening levels for some environmental concerns are not based on models amenable to site-specific modification and directly proceeding to
advanced approaches for more site-specific evaluation is required.
5. Example considerations for use of site-specific, risk calculators or other approaches for assessment of risk posed by a specific, environmental
concern (not intended to be complete).
6. Use of models to develop TPH vapor intrusion screening levels for soil and groundwater is not recommended due to poor reliability of models to
predict concentrations of contaminants in vapors away from the source area. Collection of soil vapor (including subslab or near-slab vapor) data is
recommended when contamination is present within 15-30 feet of a building (ITRC 2014; USEPA 2015).
7. Refer to expanded discussion of leaching models in this section. Models most commonly used to develop soil screening levels for leaching
concerns are not directly amenable to site-specific modification.
8. Referred to as “Gross Contamination” in some guidance (e.g., CAEPA 2016; HIDOH 2017) and “Ceiling Levels” in other guidance (e.g., MADEP
2014). These screening levels are intended to identify contaminated soil and groundwater that could result in short-term emission of very high
concentrations of TPH and other volatile chemicals that pose acute, transient health effects if the contamination is disturbed or otherwise exposed in
the future, as well as potential sheens in runoff from excavated soil or sheens in groundwater to be discharged to storm drains during construction-
or subsurface utility-related, dewatering actions.
9. Screening levels for TPH in soil that could pose risks to terrestrial flora and fauna are limited and can vary widely for different species. A site-
specific, ecological risk assessment is recommended in cases where significant risk might be posed to a sensitive, ecological habitat.
10. Applicability of screening levels for TPH-related metabolites in drinking water in terms of toxicity and taste and odor concerns is currently under
review.
11. Refer to HIDOH (2017) and ITRC Petroleum Vapor Intrusion document (ITRC 2015) for additional guidance on this subject.
TPH Risk - Case Studies (HIDOH, October 2018)
8
2 USE OF TPH DATA BY LIFE CYCLE STAGES
This section provides an overview of project life cycle stages for a risk evaluation associated with
a petroleum release under the following five, broad categories:
● Release Detection;
● Site Characterization;
● Risk Assessment;
● Remediation and Monitoring;
● Closure.
Petroleum-release sites can vary in size (refineries, terminals, oil fields) and type (clean-up, re-
development or spill response; see Attachment 2). Other special considerations could include
petroleum or petroleum-based product spills from trains or trucks in urban settings or from
pipelines carrying crude oil or refined products in remote areas. Individual components are
discussed in the following subsections and summarized in Table 2.

TPH Risk - Case Studies (HIDOH, October 2018)
9
Table 2. Project life cycle stages of typical TPH sites.
Project Life Cycle Stage Data Type Use
Release Detection
Conduct preliminary assessment/site
inspection
Overview of site characteristics and
settin
g
s and surroundin
g
areas.
Conduct emergency response/triage As needed and on a case-by-case basis
prior to characterization. Stakeholder and
communit
y
en
g
a
g
ement, as appropriate.
Site Characterization
Soil sample data (consider
1
DU-MIS)
Soil vapor data
Groundwater and surface water data
Sediment data
Ambient indoor or outdoor data
More risk-based representation of
concentrations for targeted, risk-based
area and volume of contaminated soil and
other media
Large Purge Volume (“high purge volume”)
subslab or near-slab vapor data
More risk-based representation of
subslab vapor plume and potential vapor
intrusion concerns
Include gas chromatograms in site
investigation report
Useful for source identification and
applicability of screening levels based on
assumed carbon ran
g
e composition
Risk Assessment
Collect TPH carbon range data for all samples
or a representative subset of samples (soil, soil
vapor, and/or indoor air)
Source identification
Calculation of site-specific, risk-based
TPH screenin
g
levels
Collect groundwater data to assess leaching
concerns if contaminated area uncovered
and/or main mass of contamination in contract
with groundwater
More representative assessment of
leaching concerns
Silica gel cleanup (SGC) data for TPH Separate assessment of risk posed by
p
olar TPH metabolites in
g
roundwate
r
Remediation and Monitoring
LNAPL mobility study Targeted removal of most mobile areas
with LNAPL (for example, high
transmissivit
y
plume).
SGC data for TPH Use SGC data to assess status of
petroleum degradation and identify less-
degraded areas of groundwater for
tar
g
eted treatmen
t
Prepare to-scale maps that identify remaining
contaminated soil, groundwater, soil vapor and
other pertinent media
Include estimate of volume of contaminated
soil and potentially recoverable LNAPL on
groundwater
Ensures visualization of residual
contamination
Assures inclusion of potential
management and disposal costs in future
redevelopment (Brownfield sites)
Incorporate into future site
redevelopment plans (logistics, budget,
design, etc.)
Closure
Prepare a brief “Environmental Hazard
Management Plan” or similar plan that
summarizes specific, potential concerns
associated with residual contamination and
general long-term management requirements
Institutional Controls
Remedial Action Outcome
Regulatory consideration of de minis
contamination for case closure
Site restrictions (environmental
covenants) Closure/post closure long-
term management of residual
contamination.
1. Decision Unit and Multi Increment Sample investigation methods (HIDOH 2016; see also ITRC 2012).
TPH Risk - Case Studies (HIDOH, October 2018)
10
2.1 Release Detection
Background concentrations are typically used to determine whether a petroleum release has
occurred. Depending on the media impacted (soil, groundwater, surface water, soil vapor), several
common screening tools including, but not limited to, flame ionization detector, photoionization
detector or a field gas chromatograph can be used. Special consideration for release discoveries
can include spill responses, during which community air monitoring and public safety measures
are developed and implemented. An important aspect of release detection monitoring is
determining the background concentrations (either natural or anthropogenic) for the appropriate
chemical constituents. Natural background is representative of pristine or pre-industrial conditions.
Anthropogenic background refers to concentrations that may be impacted by human activity, and
unrelated to the release. The initial release discovery data and the understanding of impacts (i.e.,
preliminary Conceptual Site Model (CSM) provide the basis for characterization, screening and
remediation.
2.2 Site Characterization
Site characterization typically occurs in the early stages of petroleum release and builds on the
data obtained during release discovery and emergency response actions, as appropriate. In general,
site characterization describes the physical conditions of the site such as soils, geology, hydrology,
presence of existing contamination, potential for contamination to be released, and the actual and
potential pathways and mechanisms for contamination transport. This stage of the project life cycle
considers the chemical characteristics of the contaminants and their potential to be mobile in the
environment. All of these aspects of site characterization need to be understood to develop a robust
CSM.
Information collected during the characterization phase may support, refute, or provide additional
details for the initial assumptions regarding the petroleum release site. While some information
may not be initially known, information must be collected to support the CSM. Development of
the CSM starts at the beginning of any site remediation/risk evaluation project and continues as
additional information becomes available through site closure.
For example, analytical methods can yield false, elevated levels of dissolved-phase TPH in water
samples due to non-dissolved petroleum (LNAPL) entrained within a sample or polar, non-
hydrocarbon-related compounds associated with organic matter. The toxicity of polar,
hydrocarbon-related, degradation compounds or “metabolites” is considered to be similar to that
of the parent compounds for initial screening purposes (see Attachment 5). As a best practice for
analysis of TPH and TPH-related degradation compounds, first filter sample to remove entrained
soil particles and note the presence or absence of LNAPL droplets. Next, test the water for TPH in
the absence of SGC cleanup to estimate the total, combined concentration of nonpolar, parent
hydrocarbons and potential hydrocarbon-related, polar degradation compounds (“metabolites”).
Apply silica gel cleanup to the sample to remove polar compounds and then retest for TPH and/or
specific carbon range fractions. The resulting non-SGC and SGC data can then be compared to
applicable screening levels (see Attachment 4 and Attachment 5). Samples collected from non-
impacted areas can be used to estimate the background concentration of polar, non-hydrocarbon-
related compounds. This can besubtracted from non-SCG sample data collected in impacted areas
in order to better estimate the concentration of hydrocarbon-related, degradation compounds in the
water and ensure that these compounds are considered in the risk assessment.

TPH Risk - Case Studies (HIDOH, October 2018)
11
2.3 Risk Assessment
Over the past few decades, risk-based decision making has emerged as a powerful basis for
deriving remediation objectives for petroleum release sites. The backbone of a risk-based approach
relies on the essential source–pathway–receptor components of the CSM and the understanding of
the known and plausible mechanisms that govern such interactions.
A TPH ‘mixture’ risk-based evaluation approach, backed by toxicity assessment, ecological risk
assessment, and fate and transport modeling, subject to the significance of exposure pathways, can
be used in the derivation of remedial objectives. When it can be adequately demonstrated that the
potential risk of exposure to human or ecological receptors is acceptable, within agency-specified
limits, then a firm basis for developing risk-based management measures, rather than a prescriptive
approach to remediation, is most appropriate.
2.4 Remediation and Monitoring
Remediation of petroleum release sites is challenging, complex and often accompanied by
indeterminate timelines. The remediation approaches for TPH release sites are further complicated
due to the presence of impacts in multiple media at most sites. A thorough understanding of the
CSM and the results of a robust risk evaluation can assist with arriving at appropriate remedial
management decisions. The development of remediation technologies is beyond the scope of this
document. The case studies used for initial reference in development of when response actions.
Monitoring may be conducted to describe characteristics at a specific location or point in time or
to show how these characteristics change over time or space. This approach is typically used to
evaluate remedial and response actions at petroleum release sites. Monitoring is conducted on a
short-term and long-term basis, and in some instances, even after closure of a site during post-
closure monitoring.
2.5 Closure
Closure is the final stage of the project life cycle and represents the endpoint for response action
at petroleum release sites. At this stage in the process, data planning and collection should have
been managed through a systematic planning process, and remediation is assumed to be complete
for the purposes of making a final determination on whether monitoring may be permanently
discontinued and the site closed. This decision point may be reached at any time during the life
cycle process (for example, during site characterization, remediation, or monitoring). Significant
variation occurs across regulatory programs, but in general, when contaminants are no longer
detected in all media over several monitoring events or over a specified period of time, the remedial
goals are deemed complete.
Due to the significance of achieving closure (no further action), site managers must have a high
degree of confidence that the data fully support closure. Closure should verify that site
contaminants are no longer present in the relevant media or are not present at concentrations that
pose an unacceptable risk to human or ecological receptors. In cases where concentrations of
contaminants are allowed to remain (such as under institutional or engineering control scenarios),
a management plan for residual contamination associated with TPH is key and should be part of
the final remediation documents.
TPH Risk - Case Studies (HIDOH, October 2018)
12
3 EVALUATION OF EXISTING TPH DATA
The case studies include consideration of both historic, bulk TPH data for soil, water and soil vapor
as well as newer, carbon range data. Carbon range data were not routinely collected at petroleum
release sites prior to the mid-2000s in most states and is still uncommon in many areas of the
country. Bulk TPH data based on gas chromatography (e.g., Method 8015; USEPA 2007) have
been collected at petroleum releases since the 1990s. Caution is warranted in the use of older TPH
data, due to lab methods that might have led to the loss of low-range hydrocarbons or might
otherwise bias the data.
Three approaches are available for consideration of existing, bulk TPH data in an environmental
risk assessment: 1) Direct comparison to carbon range-weighed screening levels for TPH based on
the assumed, carbon range composition of the specific type of petroleum present (for example,
gasoline or diesel), 2) Direct comparison to screening levels for the most toxic carbon range
presumed to be present, or 3) Use of site-specific, carbon range data to develop carbon range-
weighted TPH screening levels and/or convert existing TPH data into carbon range fractions. The
first option is typically the most expedient and cost-beneficial for small- to medium-size releases,
especially if published, carbon range-weighted screening levels for TPH are already available. The
second option is possible if only screening levels for individual carbon ranges are available but is
likely to be excessively conservative since the most toxic fractions of petroleum typically only
make up a small proportion of the overall mixture (HIDOH 2017; see also Brewer et al. 2013).
The third option will provide the most accurate picture of potential risks but requires the added
time and expense of additional sample collection for site-specific, carbon range data. Cumulative
risk posed by combined effects of individual carbon ranges that otherwise meet screening levels
must also be considered (see Section 2 above).
Risk-based screening levels based on the assumed carbon range makeup of the specific type of
petroleum released can be used to develop soil, soil vapor, and/or groundwater screening levels
for comparison to existing TPH data (e.g., MADEP 1994, 1996, 2014; CAEPA 2016; HIDOH
2017). Example, carbon range-weighted screening levels included in Attachment 4 and are used
for comparison to hypothetical site data in the case studies. The approximate carbon range makeup
of both fresh petroleum can be estimated within a relatively narrow range of possibilities. The
precise, carbon range composition of weathered TPH can vary both between sites and even within
sites for similar types of fuel. Variability in terms of total TPH toxicity is likely to be minimal in
soil where LNAPL is present, however, given the relatively large groupings of carbon ranges used
to assess risk. The same is true for vapors associated with gasoline, which are predictably
dominated by light-range aliphatics. The carbon range composition of dissolved-phase TPH in
groundwater could vary significantly, however, due differences in the makeup of the original fuel
as well as variability in biological, degradation processes. The composition of vapors associated
with diesel and other middle distillate releases can likewise vary significantly, due to both
biological activity (e.g., anaerobic generation of light-range aliphatics) and due to the original
formulation of the fuel.
Site-specific carbon range data rather than reliance on bulk TPH data and default TPH
compositions are especially useful in these situations. These issues are incorporated into Case
Studies 1 & 2. Consideration should be given to characteristics of the petroleum release, including
differing stages of aging and weathering, and understanding of the CSM. Direct comparison of
TPH Risk - Case Studies (HIDOH, October 2018)
13
TPH data to carbon range-weighted screening levels requires a high level of certainty regarding
the nature of petroleum product(s) released at the site and the reliability of the TPH data. A review
of gas chromatograms for sample data, if available, can greatly assist in this evaluation.
Published data on the carbon range makeup and toxicity of vapors associated with petroleum fuels,
including both gasoline and diesel, are limited (Brewer et al. 2013). Vapors tend to be dominated
by lighter-end aliphatic compounds in comparison to the parent fuel type. Concentrations of TPH
in vapors from gasoline releases tend to be much higher than for diesel release, due to a higher
proportion of light-end compounds in the fuel. Vapors from diesel can, however, include a high
proportion of more toxic, longer-chain aliphatic compounds in comparison to vapors from
gasoline, which are dominated by short-chain aliphatic compounds. In both cases, a significant
vapor intrusion risk is only likely to be present if the source is close enough to an overlying
building (refer to HIDOH 2017; ITRC 2014).
Although not included in the case studies, existing TPH data for soil and groundwater can be
compared to published screening levels for the most toxic hydrocarbon fraction likely to be present
(e.g., MADEP 2014). Example screening levels for individual carbon ranges are included in
Attachment 4. A limited amount of site-specific, carbon range data can be collected from key areas
of a historic release site and used to develop site-specific, carbon range-weighted screening levels.
As an alternative, the data could be used to convert existing, bulk TPH data into carbon range data
for consideration in a more detailed risk assessment. The former is likely to be most cost effective
for small- to medium-size sites, while the latter might be beneficial for a more precise assessment
of contamination associated with large releases and a complex CSM.
The use of default, carbon range-weighted screening levels for bulk TPH in soil, water, air and soil
vapor allows for rapid screening of existing site data. Care should be taken, however, to ensure
that the nature of petroleum-related contamination at the site corresponds reasonably well with
assumptions used to develop the screening levels. This can be carried out in part by review of gas
chromatograms for site-specific sample data and the use of silica gel cleanup or similar methods
to assess the degradation state and makeup of petroleum-related contaminants. Detailed carbon
range analysis of the aliphatic and aromatic makeup of the TPH component of the petroleum and
development of site-specific, TPH screening levels can be carried out as needed. This is not
anticipated to be necessary or cost-beneficial at relatively small sites. Site-specific carbon range
data and bulk TPH toxicity data might, however, be desirable for large releases with potentially
significant, ongoing or near-term risks to human health and the environment.
4 COMMON RISK ASSESSMENT PROBLEMS AND DATA LAPSES
As noted in the case studies, existing TPH data might or might not be adequate for risk-based
assessment of potential environmental concerns at a petroleum-release site. Common types of data
lapses and data usability issues include:
● Reliance on BTEXN and PAH data (i.e., indicator compounds) alone for decision making
in the absence of TPH characterization data for all media (i.e., soil, sediment, water, soil
vapor and/or indoor air);
● Failure to document nature, location and potential environmental concerns posed by
residual contamination;
TPH Risk - Case Studies (HIDOH, October 2018)
14
● Absence of a detailed CSM and consideration of all current or potential sources, pathways
and receptors;
● Focus of initial risk assessment on human direct exposure and lack of data collection and
assessment of other potential concerns, including leaching, vapor intrusion, impacts to
aquatic habitats, gross contamination, and related environmental concerns;
● Inability to assess degradation state of petroleum in groundwater due to lack of silica gel
cleanup data;
● Inability to assess potential environmental concerns posed by polar, TPH-related
metabolites due to lack of groundwater data that excludes silica gel cleanup;
● Bias of existing TPH soil data due to presence of tree sap, pine needles and other non-
petroleum, organic material in samples and inadequate processing and analysis at the
laboratory;
● Bias of existing TPH groundwater or surface water data due to presence of algae, dissolved
organic carbon, fish oils and other non-petroleum, organic material in samples and
inadequate processing and analysis at laboratory;
● Misinterpretation of baseline noise in gas chromatograph signals below 100 µg/L as TPH
in groundwater or surface water samples;
● Use and interpretation of data from different analytical methods (for example, method 8015
vs. state-specific methods); and
● Limitations of data use due to elevated detection limits and laboratory reporting errors.
Additional problems associated with the use of historic data at petroleum release sites are discussed
in individual case studies.
5 CASE STUDIES OVERVIEW
Attachment 1 presents five case studies that highlight the use of TPH and carbon range data for
the investigation, assessment and remediation under different, petroleum-release scenarios. The
case studies are generic in nature but reflect the collective experience of the preparers of the
guidance document and data for sites similar to those discussed. A summary of themes
incorporated into each of the case studies is provided in Table 3.
Case Study #1 involves redevelopment of a former fuel storage terminal impacted with diesel and
gasoline. Shallow groundwater allowed releases to migrate across broad areas. Extensive LNAPL
on the water table poses vapor intrusion risks for new buildings as well as logistical challenges for
management of impacted soil and groundwater during redevelopment. Widespread contamination
of groundwater poses concerns for intentional or inadvertent discharges into a nearby harbor.
Carbon range-weighted screening levels for TPH published by the overseeing regulatory agency
are primarily used to carry out the site investigation and design remedial actions, although site-
specific carbon range data are obtained for vapors in diesel-impacted areas in order to better assess
vapor intrusion risk.
Case Study #2 focuses on the use of TPH data to assess potential risks predicated by past and
recent releases of gasoline at an operating gasoline station. The first release was identified during
removal of a former underground storage tank and was largely remediated, although a small
TPH Risk - Case Studies (HIDOH, October 2018)
15
volume of contaminated soil (<10 cubic yards) had to be left in place due to structural concerns
for an adjacent, maintenance building. Although concentrations of TPH in soil and soil vapor are
relatively high, the amount of LNAPL remaining was considered to be de minimis and no further
action was required, other than proper management and disposal of the soil if disturbed during
future subsurface work at the site. The second release is more extensive and reached groundwater,
at a depth of 25 feet below grade. Soil vapor data suggest potential vapor intrusion concerns for
the overlying store. A shallow water well used by an adjacent school for irrigation is threatened
by a dissolved-phase plume of heavily degraded petroleum emanating from the site. Data for
perimeter monitoring wells are compared to risk-based screening levels for metabolite mixtures in
groundwater to assess risks to workers and students who might inadvertently use the well for
drinking water. The development of example screening levels for metabolites is presented in
Attachment 5.
Case Study #3 considers the release of 3,000 gallons of diesel fuel following a tanker truck
accident in a dense, urban area. Much of the fuel remained ponded in the street, but some fuel
spilled over the curb into a resident’s front yard. Some of the fuel also flowed into a storm drain
and entered a nearby stream. Data for vapor samples collected in front of the home exceeded
screening levels for both TPH and benzene. Impacted soil was excavated from the yard the
following day. Confirmation soil samples collected based on DU-MIS investigation methods
(HIDOH 2016; see also ITRC 2012) identified the need for additional excavation in one area.
Booms were placed in the stream to minimize the spread of fuel. Free phase LNAPL and gross
contamination was removed as practical as part of the emergency response. The acceptability of
allowing the remaining contamination to naturally attenuate over time is under review by the
overseeing, regulatory agency based on the observed magnitude of near-term impairment to the
stream ecology.
Case Study #4 involves the release of a large amount of light-weight oil from a ruptured pipeline
in a remote area. The oil quickly spread into an adjacent marsh area, with significant impacts to
aquatic flora and fauna. Heavy contamination in the area of the rupture was quickly removed and
the pipeline repaired. Soil, sediment and water samples were collected using DU-MIS methods
and used to monitor the subsequent fate and transport of the petroleum over time and assess the
benefit of additional remedial action, versus allowance for the contamination to naturally degrade
over time.
Case Study #5 presents approaches for the assessment and remediation of petroleum-release
impacts, specifically TPH at an upstream oil and gas exploration and production (E&P) Site, within
a 3,000 acre, remote active cattle ranch. Petroleum-releases from buried drilling waste adjacent to
the active crude oil production well location were noted by the site owner. Topics addressed
include site characterization using TPH and carbon range data in conjunction with indicator
compounds to assess and manage risk for source material, comparison to default and development
of site-specific screening levels, remediation of LNAPL impacted soils, and groundwater impacts,
and residual management.

TPH Risk - Case Studies (HIDOH, October 2018)
16
Table 3. Summary of key topics incorporated into case studies.
Topic
#1: Tank
Farm
#2: Gas
Station
#3: Tanker
Truck
#4: Oil
Pipeline
#5: Oil
E&P
Site Status:
Active X X X
Inactive X X
Redevelopmen
t
X
Petroleum Type:
Gasoline (standard) X X
Gasoline (low-
b
enzene) X
Diesel X X X
Crude Oil X X
Impacted Media:
Soil X X X X X
Soil Vapo
r
X X X
Groundwate
r
X X X X
Sediment X X
Surface Wate
r
X X
Environmental Concerns:
Soil
Direct Exposure X X X X
Vapor Intrusion X X
Gross Contamination X X X X X
Leachin
g
X X X X
Groundwater
Drinkin
g
Water (toxicit
y
) X X
Vapor Intrusion X X
Aquatic Toxicit
y
X X X
Gross Contamination X X X X X
Surface Water
Drinkin
g
Water (toxicit
y
)
Aquatic Toxicit
y
(pela
g
ic) X X
Gross Contamination X X X
Sediment
Aquatic Toxicit
y
(benthic) X X
Gross Contamination X X
Screening Levels:
Fractions (
g
eneric) X
Fractions (site-specific) X
Fraction-Wei
g
hted TPH (
g
eneric) X X X X X
Fraction-Wei
g
hted TPH (site-specific) X X X
Drinkin
g
Water Metabolites X X
Other Topics:
Shor
t
-Term Vapor Emissions X X
Silica Gel Cleanup X X X X X
Expanded DU-MIS (ISM) Sample Notes X X
Expanded Fate and Transport Notes X X X
Methane Generation X
Back
g
round Or
g
anic Carbon (water) X
Aquatic Toxicit
y
(site-specific) X
De
M
inimis Ris
k
X X
TPH Risk - Case Studies (HIDOH, October 2018)
17
References
Brewer, R., Nagashima, J., Kelley, M. and M. Rigby. 2013. Risk-Based Evaluation of Total
Petroleum Hydrocarbons in Vapor Intrusion Studies: International Journal of Environmental
Research and Public Health, Volume 10, pp 2441-2467.
CAEPA. 2016. Screening for Environmental Concerns at Sites with Contaminated Soil and
Groundwater: California Environmental Protection Agency, Regional Water Quality Control
Board, San Francisco Bay Area Region.
Gustafson, J.; Tell, J.G. and D. Orem. 1997. Total Petroleum Hydrocarbon Working Group Series,
Volume 3: Selection of Representative TPH Fractions Based on Fate and Transport
Considerations; Association for Environmental Health and Sciences: Amherst, MA, USA.
HIDOH. 2016. Technical Guidance Manual: Hawai′i Department of Health, Hazard Evaluation
and Emergency Response. August 2016.
HIDOH. 2017. Evaluation of Environmental Hazards at Sites with Contaminated Soil and
Groundwater – Tropical Pacific Edition: Hawai‘i Department of Health, Hazard Evaluation
and Emergency Response. Fall 2017.
IDEM. 2010. Risk Integrated System of Closure, Technical Resource Guidance Document:
Indiana Department of Environmental Management, June 2010.
ITRC, 2012, Incremental Sampling Methodology: Interstate Technology Regulatory Council,
February 2012.
ITRC. 2014. Petroleum Vapor Intrusion: Fundamentals of Screening, Investigation, and
Management: Interstate Technology & Regulatory Council. Washington, D.C. October 2014.
ITRC. 2015. Decision Making at Contaminated Sites, Issues and Options in Human Health Risk
Assessment: Interstate Technology & Regulatory Council. January 2015.
ITRC. 2018. TPH Risk Evaluation at Petroleum Contaminated Sites (draft March 2018): Interstate
Technology & Regulatory Council. Anticipated publication 2019.
KDHE. 2016. Total Petroleum Hydrocarbons (TPH) and LNAPL Characterization, Remediation
and Management: Kansas Department of Health and Environment, Bureau of Environmental
Remediation. Policy # BER-041. May 2017.
MADEP. 1994. Background Documentation for the Development of the MCP Numerical
Standards: Massachusetts Department of Environmental Protection, Bureau of Waste Site
Cleanup and Office of Research and Standards. April 1994.
MADEP. 1996. Implementation of the VPH/EPH Approach: Massachusetts Department of
Environmental Protection. May 1996.
MADEP. 2002. Characterizing Risks Posed by Contaminated Sites: Implementation of the
MADEP VPH/EPH Approach: Massachusetts Department of Environmental Protection,
Bureau of Waste Site Cleanup, October 31, 2002.
MADEP. 2014. MCP Numerical Standards Development Spreadsheets: Massachusetts
Department of Environmental Protection, Bureau of Waste Site Cleanup. Updated June 2014.
TPH Risk - Case Studies (HIDOH, October 2018)
18
USEPA 2007. Method 8015C, Nonhalogenated Organics by Gas Chromatography: U.S.
Environmental Protection Agency, Office of Resource Conservation and Recovery, February
2007.
USEPA. 2015. Technical Guide for Addressing Petroleum Vapor Intrusion at Leaking
Underground Storage Tank Sites: U.S. Environmental Protection Agency, Office of
Underground Storage Tanks, June 2015, Washington, D.C., EPA 510-R-15-001.
USEPA. 2017. Screening Levels for Chemical Contaminants: U.S. Environmental Protection
Agency, June 2017 (and updates), prepared by Oak Ridge National Laboratories.
TPH Risk Case Studies (HIDOH, October 2018)
Attachment 1: Example Case Studies
19
Attachment 1
Example Case Studies
Case Study #1: Former Fuel Tank Farm
Case Study #2: Active Gas Station
Case Study #3: Tanker Truck Accident
Case Study #4: Crude Oil Pipeline Rupture
Case Study #5: Exploration and Production
TPH Risk Case Studies (HIDOH, October 2018)
Attachment 1: Example Case Studies
Case Study #1: Former Fuel Tank Farm
20
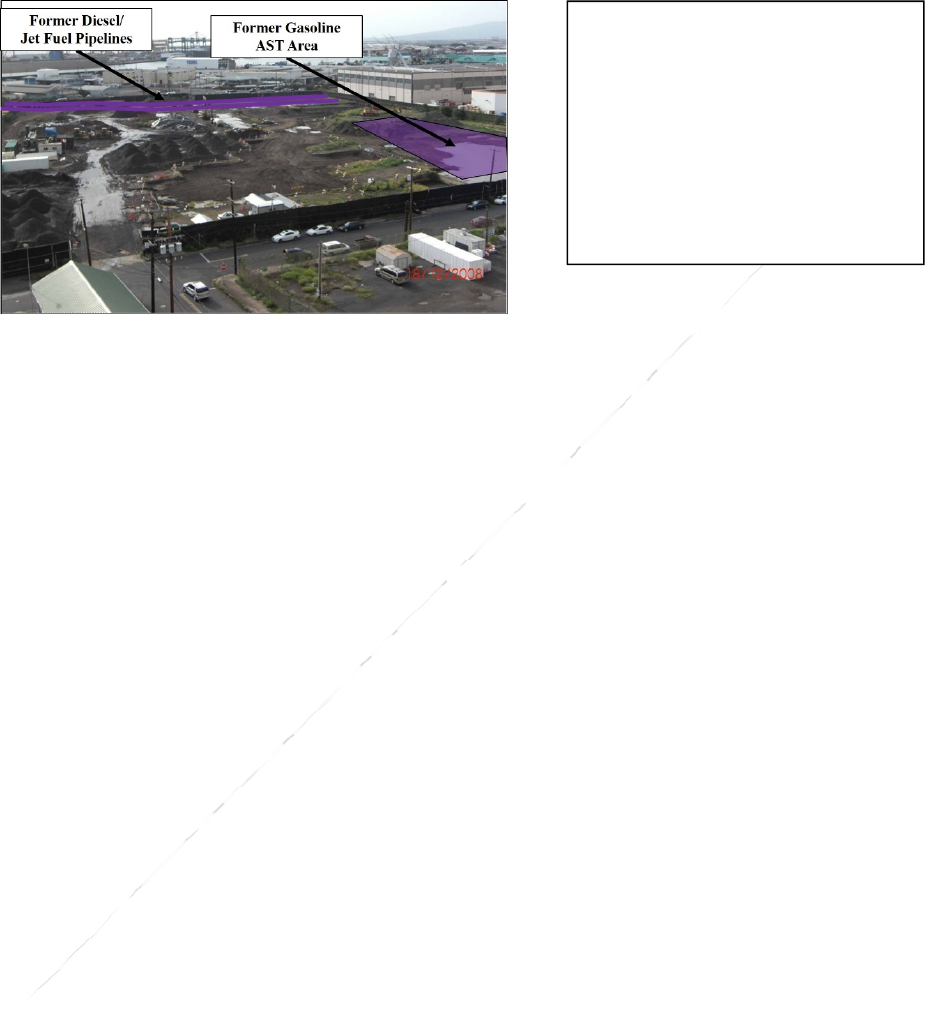
Case Study #1: Former Fuel Tank Farm
Figure 1-1. Former fuel storage terminal to be
redeveloped as a commercial complex.
Summary
This case study presents approaches for assessment of petroleum-related potential environmental
concerns at a ten-acre, decommissioned fuel-tank farm slated for commercial redevelopment.
Topics addressed include removal of “gross contamination” to reduce the mass of petroleum in the
source area, assessment of remaining vapor intrusion risk using Total Petroleum Hydrocarbon
(TPH) and carbon range data for vapor samples and comparison with default as well as site-specific
screening levels, and management of residual contamination during and after redevelopment of
the site.
Groundwater is situated five to ten feet below the ground surface. Two separate areas of petroleum
releases were identified. The first is associated with the former aboveground storage tank (AST)
area used primarily for gasoline but with some diesel contamination present. The second is
associated with historic leaks from a now abandoned, diesel pipeline that borders the southern
perimeter of the property. Total Petroleum Hydrocarbon (TPH) data using USEPA Method 8015M
for soil and water and Method TO-3 for soil vapor were initially obtained for both areas.
Carbon range data were obtained for subslab vapor samples collected from the gasoline-release
area (see Attachment 4; after HIDOH 2017). The data were used to develop site-specific, carbon
range-weighted soil vapor screening levels for TPH for comparison to subsequent soil vapor data
in order to save money on testing and ensure that cumulative vapor intrusion risk was considered.
This allowed the use of somewhat less conservative, soil vapor screening levels to assess risk and
design remedial actions for this area.
Carbon range data were collected up front for soil vapor samples collected from the diesel-release
area. The carbon range makeup of vapors from diesel-type fuels can vary widely (see Brewer et
al. 2013). Standard total TPH tests using “TO” methods can also vary significantly from more
reliable, carbon range test data. This makes the collection of site-specific carbon range data more
desirable at diesel release sites. This allowed for the development of site-specific, carbon-range
Relative Applicability:
- Brownfield re-development
petroleum sites.
- Small to mid-size tank farms
(i.e., gasoline distribution
centers).
- Small ports that handle
petroleum products.

TPH Risk Case Studies (HIDOH, October 2018)
Attachment 1: Example Case Studies
Case Study #1: Former Fuel Tank Farm
21
weighted screening levels to assess potential vapor intrusion risk. Uncertainty in total TPH data
for diesel vapors limited the reliability of this data, however, and carbon range data were collected
for all subsequent soil vapor samples from the diesel area and used to assess cumulative, vapor
intrusion risk.
The main mass of contaminated soil is in direct contact with groundwater. Direct monitoring of
groundwater is therefore appropriate for assessment of leaching concerns in release areas. A
comparison of groundwater data with and without silica gel cleanup (SGC) indicates that the
dissolved-phase plume outside of areas with light, non-aqueous-phase liquid (LNAPL) is heavily
degraded and likely dominated by TPH-related metabolites.
Remediation of the site to address high-risk areas of shallow free product was carried out, with
vented, passive vapor barriers to be installed under future buildings in order to address any
remaining, vapor intrusion risk. Groundwater was re-infiltrated onsite rather than discharged into
a storm sewer in order to protect nearby, aquatic habitats that the sewers drain to. Barriers will be
placed in new sewer lines in order to minimize offsite migration of contamination.
1. Site Setting (Figure 1-1)
Ten-acre, former diesel and gasoline aboveground storage tank (AST) farm that operated
for 50+ years;
Commercial/industrial setting with no residents within ½ mile;
Pipelines for diesel/jet fuel border southern edge of property;
Depth to groundwater = 10 feet (unconfined; not a current or potential source of drinking
water);
No water supply wells within one mile;
Located within ½ mile of a surface water body;
Climate Zone: Cold (mean daily temperature <65°F more than 300 days per year; used for
vapor intrusion assessment);
Geology: Unconsolidated gravel, sand and silt (fill and marine sediments);
Primary Contaminants of Potential Concern (COPCs): TPHgasoline (TPHg), TPHdiesel
(TPHd), benzene, toluene, ethylbenzene, xylenes and naphthalene (BTEXN);
Facility decommissioned, with all aboveground structures removed;
Planned commercial redevelopment;
Status: Investigation and initial remedial actions complete. Site prepped for redevelopment
as a commercial shopping center. “Environmental Hazard Management Plan (EHMP)”
prepared for construction phase of redevelopment, to be updated with “as-built” EHMP
following completion of construction.
2. Site Characterization (Figure 1-2)
Soil and groundwater investigation revealed significant gasoline contamination in vicinity
of former ASTs and diesel and jet fuel contamination adjacent to former fuel pipelines.

TPH Risk Case Studies (HIDOH, October 2018)
Attachment 1: Example Case Studies
Case Study #1: Former Fuel Tank Farm
22
Discrete soil samples collected from borings and exploratory pits;
Groundwater samples collected from temporary monitoring wells screened across the top
of the water table;
Soil vapor samples collected from temporary points to better assess potential vapor
intrusion concerns (former slabs removed; vapor samples collected 3-5ft below ground
surface to minimize leakage to outdoor air);
Samples tested for TPHg and TPHd using Method 8015M for soil and groundwater and
Methods TO-15 (summa, >C5-C12) and TO-17 (sorbent tube, >C12) for soil vapor;
Extent of contamination reasonably well delineated based on data collected and field
observations;
LNAPL present on groundwater over three-acre area under former fuel tanks and half-acre
under former pipeline area;
LNAPL and dissolved-phase plume stable and not migrating offsite above levels of
potential concern (slow but progressive reduction in dissolved-phase concentrations
outside of LNAPL area);
Sub 100 µg/L concentrations of TPH reported in samples collected from un-impacted,
upgradient wells in the absence of SGC assumed to represent background organic material
in groundwater;
TPH carbon range data obtained for soil vapor samples from the gasoline and diesel-release
areas in order to better assess vapor chemistry and develop site-specific vapor intrusion
screening levels (data reasonably consistent between samples).
3. Potential Environmental Concerns (Figure 1-4 and Figure 1-5)
Soil, groundwater and soil vapor data compared to environmental screening levels for
TPHg and TPHd (see example data in Tables 1-1a, 1-2, 1-3a and 1-4a);
Comparison of soil data to screening levels indicate gross contamination (e.g., free product,
heavy staining, high vapors if disturbed, etc.), direct exposure and leaching concerns for
TPHg and TPHd in former AST area and the western area of the former fuel pipelines;
Calculation of a noncancer Hazard Quotient (HI) for individual TPH types and assuming
data in Table 1-1a representative of entire site as a single, commercial/industrial exposure
area indicates a cumulative Hazard Index (HI) of 53, with risk posed primarily by exposure
to TPHd in soil (Table 1-1b);
Comparison of groundwater data (non-SGC) to screening levels suggested gross
contamination concerns in same areas (e.g., LNAPL and/or strong odors, confirmed by
product in some wells) and exceedance of aquatic toxicity screening levels for large area
of site;
Comparison of non-SGC and SGC data for groundwater indicate significant degradation
of petroleum-related compounds outside of areas with LNAPL;

TPH Risk Case Studies (HIDOH, October 2018)
Attachment 1: Example Case Studies
Case Study #1: Former Fuel Tank Farm
23
Review of chromatograms indicate contamination is typical of petroleum compounds with
no evidence of unrelated contaminants, natural or anthropogenic, associated with the site
or with interferences related to sampling or analysis methods;
Concentrations of TPH in vapors exceeds lower explosive limit (LEL) in some areas of
gasoline LNAPL, with small pockets of methane approaching LELs in both gasoline and
diesel areas;
Comparison of soil vapor data to site-specific screening levels for vapor intrusion indicate
significant, potential vapor intrusion concerns for future buildings in areas where LNAPL
is present in soil and/or on shallow groundwater;
Calculation of noncancer HQs for individual carbon ranges assuming data in Table 1-3a
for gasoline vapors and 1-4a for diesel vapors are representative of subslab vapors under
future buildings indicates a high, potential vapor intrusion risk for both areas of the site;
Vapor intrusion risk posed by gasoline vapors is driven by C5-C8 aliphatics (Table 1-3b);
Vapor intrusion risk posed by diesel vapors is driven by C9-C12 aliphatics (Table 1-4b);
Site-specific carbon range vapor data were used to calculate carbon range-weighted
inhalation toxicity factors and corresponding soil vapor screening levels for gasoline and
diesel vapors for use in subsequent investigations (Tables 1-3c and 1-4c));
Soil vapor screening levels for evaluation of total TPH data in the gasoline-release area are
considered reliable for assessment of vapor intrusion risk, but uncertainty in the reliability
total TPH data for diesel vapors limits use of these screening levels;
Comparison of the relative ratios of TPH:Benzene ratios for soil vapor data in gasoline-
contaminated area suggests that vapor intrusion risk posed by TPH will be adequately
addressed by a reduction of benzene to below target screening levels, provided that a target
10
-6
excess cancer risk is adhered to (TPH: Benzene ratio <935:1; Table 1-5);
Additional evaluation of TPH data required if a lower, target excess cancer risk is used to
assess acceptable vapor intrusion risk posed by benzene;
Comparison of TPH: Benzene ratios (TPH measured as sum of carbon ranges) for vapor
data collected from diesel-contaminated area suggests that TPH could still pose a vapor
intrusion risk even in cases where benzene concentrations in vapor meet target screening
levels (TPH: Benzene ratio >452:1; see Table 1-5);
Summary of contaminated media and environmental concerns in the absence of
remediation (Figure 1-2):
o Direct exposure (TPHg & TPHd; subsurface soil));
o Vapor intrusion (TPHg & TPHd; subsurface soil and groundwater);
o Aquatic toxicity (TPHg & TPHd; groundwater);
o Gross contamination (TPHg & TPHd; subsurface soil and groundwater).
Conceptual Site Model (CSM) of potential environmental concerns assuming no
remediation (Figure 1-3):

TPH Risk Case Studies (HIDOH, October 2018)
Attachment 1: Example Case Studies
Case Study #1: Former Fuel Tank Farm
24
o Soil:
Direct exposure (TPHg & TPHd; short-term, high risk for construction workers);
Direct exposure (TPHg & TPHd; long-term, high risk for future workers and
customers);
Leaching (TPHg & TPHd; ongoing contamination of shallow groundwater)
Gross contamination (TPHg & TPHd; potential short-term generation and offsite
migration of high-concentration vapors when disturbed; short-term management
and disposal issues for utility repair and other subsurface activities, spread of
contamination and equipment fouling during construction, etc.);
o Groundwater:
Aquatic toxicity (TPHg & TPHd; migration of contaminated groundwater into
nearby, surface water bodies via natural flow into storm drains not connected to
retention areas or intentional discharge during dewatering activities; no current
impacts identified);
Gross contamination (TPHg & TPHd; same as soil and including leakage of free
product into storm sewers or utility vaults; TPH and methane <10% of LEL in
sewers and vaults);
o Soil Vapors:
Vapor intrusion (TPHg & TPHd; high risk of long-term exposure for future
workers and customers).
4. Site Remediation and Redevelopment
Remedial actions:
o Gross contamination (including LNAPL on groundwater) and high-risk areas with
contaminant concentrations above screening levels for direct-exposure and vapor
intrusion to be removed (Figure 1-4; DU-MIS data used to confirm soil removal);
o Planned remedial actions include on-site, thermal desorption treatment of soil, removal
of LNAPL in open trenches during construction and placement of oxygen-releasing
agents in the trenches before backfilling to enhance natural attenuation (based on
technical evaluation of treatment based on residual mass left in place and cost per mass
of oxygen equivalent delivered).
Construction phase CSM (Figure 1-5):
o Short-term exposure of construction workers to contaminated soil and groundwater;
o Discharge of LNAPL and dissolved-phase contaminants into aquatic habitats;
o Gross contamination and associated sheens, vapors and fouling of equipment, etc.).
Planned Activities Before and During Construction:
o Preparation of construction phase “EHMP” for management of contaminated soil and
groundwater;

TPH Risk Case Studies (HIDOH, October 2018)
Attachment 1: Example Case Studies
Case Study #1: Former Fuel Tank Farm
25
o Identification of potential health and safety concerns for workers;
o Health and safety training for workers who may come in contact with contaminated
soil, groundwater or related vapors;
o Implementation of perimeter air monitoring to mitigate nuisance odors;
o Removal of grossly contaminated soil and soil that poses high, long-term direct
exposure and vapor intrusion risk following construction;
o Designation and preparation of staging area for management of excavated,
contaminated soil;
o Onsite, ex-situ, thermal desorption treatment of soil to meet TPH screening levels for
commercial reuse;
o Collection of Multi Increment soil samples from treated stockpile for confirmation
(HIDOH 2016; see also ITRC 2012);
o Coordination with landfill for additional offsite disposal as needed;
o Use of sorbent pads to remove LNAPL from exposed groundwater;
o Construction of infiltration trenches for re-infiltration of contaminated groundwater
during dewatering for utility installation;
o Use of environmentally acceptable vapor suppressants to control offsite migration of
vapors (guidance on environmental hazards posed by foam suppressants not currently
available);
o Installation of seals in new storm sewer backfill to prevent offsite migration of vapors
and contaminated groundwater;
o Installation of passive vapor barrier and venting system under slab of new commercial
building.
Post-Construction CSM of following remediation and construction (Figure 1-6):
o Soil: Reduced long-term, direct-exposure risk to workers and customers in absence of
engineered and institutional controls;
o Groundwater: Discharge of dissolved-phase contamination into aquatic habitats via
storm drains;
o Soil Vapor: Low to moderate risk of long-term vapor intrusion concerns.
5. Post-Construction Long-Term Management:
Preparation of post-construction, “as built” EHMP:
o Engineered Controls
Pavement in areas with contaminated soil within three feet of surface;
Passive vapor barrier and venting system under buildings.
Institutional Controls:
o Vapor barrier and/or additional vapor intrusion assessment for new construction;

TPH Risk Case Studies (HIDOH, October 2018)
Attachment 1: Example Case Studies
Case Study #1: Former Fuel Tank Farm
26
o Restriction on future groundwater supply wells (including irrigation wells) in the
absence of additional testing and approval of overseeing regulatory agency;
o Establish deed restriction and environmental covenants for site use and associated
activities.
Basic plan for management of contaminated soil and groundwater during future subsurface
activities (e.g., utility installation and repair, new construction, etc.):
o Storage of soil in designated, lined areas;
o On-site reuse or offsite disposal of excavated soil;
o Treatment and/or re-infiltration of contaminated groundwater;
o Control of vapors during excavation.
Monitoring of groundwater for a minimum of two years to assess potential offsite migration
concerns and need for active remediation; and
Monitoring of vapors (including methane) under building slab and other areas of the site
as needed for a minimum of two years to assess potential long-term vapor concerns.
Key Lessons Learned/Considerations:
1. Thorough understanding of site CSM is critical for brownfield re-development projects at
former petroleum release sites;
2. TPH Site characterization and assessment should consider all media and
complete/incomplete pathways;
3. Consider Decision Unit and Multi Increment Sample (DU-MIS) investigation methods for
confirmation of remedial actions based on existing, discrete sample data (HIDOH 2016;
see also ITRC 2012);
4. Total TPH data and carbon range-weighted screening levels for TPH are normally deemed
adequate for the characterization and remediation of contaminated soil, but the use of site-
specific, carbon range data to more accurately assess potential environmental concerns and
optimize remedial actions has not been well studied;
5. Carbon range data for soil vapors can provide a more accurate assessment of vapor
intrusion risk and in particular should always be considered for diesel-release sites, due to
the variability of vapor composition and unreliability of total TPH data for diesel-related
vapors;
6. Total TPH data in the absence of silica gel cleanup are normally used to assess impacts to
groundwater and ensure that TPH-related metabolites are considered, but the accuracy of
the data and the need to assess concerns posed by metabolites separately has come under
questions;
7. Comparison of groundwater data with and without silica gel cleanup can be very useful to
assess the overall state of degradation within a petroleum plume;

TPH Risk Case Studies (HIDOH, October 2018)
Attachment 1: Example Case Studies
Case Study #1: Former Fuel Tank Farm
27
8. Remedial actions should incorporate best management practices to minimize exposure of
construction workers to contamination and control offsite migration of vapors or surface
runoff;
9. Residual site contamination, if present, should be identified on to-scale maps, with
potential environmental concerns noted and appropriate engineering and/or institutional
controls put in place for long-term management of the contamination;
10. Ensure that re-development schedules and costs take into account additional sampling
needs, management and/or disposal of contaminated soil and groundwater, continued
engineered or institutional controls and EHMP implementation before during and after
construction, etc.

TPH Risk Case Studies (HIDOH, October 2018)
Attachment 1: Example Case Studies
Case Study #1: Former Fuel Tank Farm
28
Table 1-1a. Comparison of soil data to example commercial/industrial TPH screening levels.
COPC
Example
Soil Data
(mg/kg)
1
TPH Screening Level
2
Direct
Exposure
(mg/kg)
3
Leaching
(mg/kg)
4
Gross
Contamination
(mg/kg)
TPHg 12,000 2,000 1,200 500 (2,000)
TPHd 48,000 500 1,500 500 (5,000)
TPHrf 17,000 140,000 5,000 2,500 (5,000)
1. For example only. Screening levels assume commercial/industrial land use and groundwater that is not a current or
potential source of drinking water. Based on a target noncaner HQ of 1.
2. Commercial/Industrial land use. Soil saturation limits noted for TPHg and TPHd.
3. Potantial leaching impacts to groundwater above aquatic toxicity screening levels.
4. Commercial/Industrial land use; screening levels for exposed surface soils and (in parentheses) capped, subsurface
soils.
Table 1-1b. Calculation of noncancer Hazard Quotients for individual TPH types
in soil and a cumulative Hazard Index for total TPH.
COPC
1
Exposure Area
Concentration
(mg/kg)
2
Direct Exposure
Screening Level
(mg/kg)
3
Hazard Quotient
TPHg 12,000 2,300 5.2
TPHd 48,000 1,000 48
TPHrf 17,000 140,000 0.12
4
Hazard Index: 53
1. Assumes data reflect representative concentrations in exposed soil for a single exposure area under a
commercial/industrial setting.
2. Direct exposure screening levels based on a target, noncancer HQ of 1.0 (refer to Table 15 in Attachment
4). TPHd screening level based on risk and excludes 2,000 mg/kg and 500 mg/kg, soil saturation cap for
TPHg and TPHd noted in Table 1a.
3. Chemical-specific HQ calculated as ratio of Exposure Area Concentration and Direct Exposure
Screening Level (refer to Forward Risk Calculation in Case Study introductory text).
4. Cumulative HI for hypothetical exposure area calculated as sum of individual HQ s (rounded to single,
significant digit; refer to Forward Risk Calculation in Case Study introductory text).

TPH Risk Case Studies (HIDOH, October 2018)
Attachment 1: Example Case Studies
Case Study #1: Former Fuel Tank Farm
29
Table 1-2. Comparison of groundwater data to example non-drinking
water TPH screening levels (HIDOH 2017).
COPC
Example
Groundwater
Data
(µg/L)
1
TPH Screening Level
Aquatic
Toxicity
(µg/L)
Gross
Contamination
(µg/L)
TPHg 75,000 500 5,000
TPHd 30,000 640 5,000
TPHrf 6,000 640 2,500
1. For example only. Screening levels assume that groundwater is not a current or potential source
of drinking water but could discharge to an aquatic habitat under natural conditions or due to
dewatering during utility or subsurface work.
Table 1-3a. Example TPH carbon range data for soil vapor collected
in gasoline-release area.
Carbon Range
1
Concentration
(mg/m
3
)
Percent
of Total
C5-C8 aliphatics 61,475 98%
C9-C12 aliphatics 901 1.4%
C9-C10 aromatics 345 0.6%
Total: 62,721 100%
1. Based on actual carbon range vapor data from a gasoline-release site.
Table 1-3b. Calculation of noncancer Hazard Quotients for soil vapor, carbon range data
in gasoline-release area and a cumulative Hazard Index for total vapor intrusion risk.
Carbon Range
1
Assumed
Subslab Vapor
Concentration
(mg/m
3
)
2
Subslab Vapor
Screening Level
(mg/m
3
)
3
Hazard
Quotient
C5-C8 aliphatics 61,475 1,600
38
C9-C12 aliphatics 901 275
3.3
C9-C10 aromatics 345 275
1.3
4
Hazard Index: 43
1. Assumes soil vapor data collected from diesel-release area (see Table 1-3a) representative of subslab vapor
concentrations for future buildings.
2. Subslab vapor intrusion screening levels for cold climate zones, based on a target, noncancer HQ of 1.0 and a
commercial/industrial exposure scenario (refer to Table 20 in Attachment 4).
3. Chemical-specific HQ calculated as ratio of subslab vapor concentration and corresponding vapor intrusion
screening level (refer to Forward Risk Calculation in Case Study introductory text).
4. Cumulative HI for hypothetical vapor intrusion scenario calculated as sum of individual HQs (refer to Forward
Risk Calculation in Case Study introductory text).

TPH Risk Case Studies (HIDOH, October 2018)
Attachment 1: Example Case Studies
Case Study #1: Former Fuel Tank Farm
30
Table 1-3c. Carbon range weighted inhalation
toxicity factor and screening levels for gasoline
vapors.
Carbon Range
1
RfC
(mg/m
3
)
C5-C8 aliphatics 0.60
C9-C12+ aliphatics 0.10
C9-C10+ aromatics 0.10
2
Weighted TPH RfC: 0.546
3
Indoor Air
Screening Level:
2.4
4
Subslab Soil Vapor
Screening Level
1,500
1. After USEPA 2009 (see HIDOH 2017).
2. Based on carbon range makeup of vapors noted in Table 1-3a; see equation
for weighted toxicity factors in Attachment 1.
3. Indoor air screen level calculated using USEPA Regional Screening Level
model for ambient, indoor air for commercial workers (Exposure Duration =
25 years, Exposure Frequency = 250 days/year, Exposure Time = 8hrs/day.
4. Subslab vapor screening level based on cold climate zone and indoor air:
subslab attenuation factor (SSAF) of 0.0016 for a commercial/industrial
building (noncancer HQ=1.0), assuming an annual average vapor entry rate
of 4.5 L/min and an indoor air exchange rate of 0.7/hr. or 2,846 L/min for a
1,000 ft
2
structure, twice the default residential rate (Subslab screening level
= Indoor Air Screening Level/SSAF; see Brewer et. al 2014).

TPH Risk Case Studies (HIDOH, October 2018)
Attachment 1: Example Case Studies
Case Study #1: Former Fuel Tank Farm
31
Table 1-4a. Example TPH carbon range data for soil vapor collected
in diesel-release area.
Carbon Range
Example
Concentrations
(mg/m
3
)
Percent
of Total
C5-C8 aliphatics 3,200 36%
C9-C12 aliphatics 5,500 62%
C13-C18 aliphatics 130 1.5%
C9-C10 aromatics 32 0.5%
C11-C16 aromatics ND (<4) 0.0%
Total: 8,862 100%
ND – Non-detect
1. TO-17 sorbent tube data for diesel release site (see Brewer et al. 2013).
Table 1-4b. Calculation of noncancer Hazard Quotients for soil vapor, carbon range data
in diesel-release area and a cumulative Hazard Index for total vapor intrusion risk.
Carbon Range
1
Assumed
Subslab Vapor
Concentration
(mg/m
3
)
2
Subslab Vapor
Screening Level
(mg/m
3
)
3
Hazard
Quotient
C5-C8 aliphatics 3,200 1,600
2.0
C9-C12 aliphatics 5,500 275
20
C13-C18 aliphatics 130 275
0.5
C9-C10 aromatics 32 275
0.1
C11-C16 aromatics ND (<4) 275
-
4
Hazard Index: 23
1. Assumes soil vapor data collected from diesel-release area (see Table 1-4a) representative of subslab vapor
concentrations for future buildings.
2. Subslab vapor intrusion screening levels for cold climate zones, based on a target, noncancer HQ of 1.0 and a
commercial/industrial exposure scenario (refer to Table 20 in Attachment 4).
3. Chemical-specific HQ calculated as ratio of subslab vapor concentration and corresponding vapor intrusion
screening level (refer to Forward Risk Calculation in Case Study introductory text).
4. Cumulative HI for hypothetical vapor intrusion scenario calculated as sum of individual HQs (refer to Forward
Risk Calculation in Case Study introductory text).

TPH Risk Case Studies (HIDOH, October 2018)
Attachment 1: Example Case Studies
Case Study #1: Former Fuel Tank Farm
32
Table 1-4c. Carbon range weighted inhalation
toxicity factor and screening levels for diesel
vapors.
Carbon Range
1
RfC
(mg/m
3
)
C5-C8 aliphatics 0.60
C9-C12+ aliphatics 0.10
C9-C10+ aromatics 0.10
2
Weighted TPH RfC: 0.14
3
Indoor Air
Screening Level:
0.63
4
Subslab Soil Vapor
Screening Level
394
1. After USEPA 2009 (see HIDOH 2017).
2. See equation for weighted toxicity factors in Attachment 1.
3. Indoor air screen level calculated using USEPA Regional Screening Level
model for ambient, indoor air for commercial workers (Exposure Duration =
25 years, Exposure Frequency = 250 days/year, Exposure Time = 8hrs/day.
4. Subslab vapor screening level based on cold climate zone and indoor air:
subslab attenuation factor (SSAF) of 0.0016 for a commercial/industrial
building (noncancer HQ=1.0), assuming an annual average vapor entry rate
of 4.5 L/min and an indoor air exchange rate of 0.7/hr or 2,846 L/min for a
1,000 ft
2
structure, twice the default residential rate (Subslab screening level
= Indoor Air Screening Level/SSAF; see Brewer et. al 2014).

TPH Risk Case Studies (HIDOH, October 2018)
Attachment 1: Example Case Studies
Case Study #1: Former Fuel Tank Farm
33
Table 1-5. Comparison of soil vapor data to example commercial/industrial
TPH screening levels (after HIDOH 2017; see also Brewer et. al 2013, 2014).
:
1. TPH measured as sum of C5-C12 compounds for both gasoline and diesel vapors. Vapors from
gasoline-contaminated areas assumed dominated by lower-toxicity, C5-C12 aliphatics (verified by
reviewing chromatograms). Chromatograms and carbon range data for vapors in diesel-
contaminated areas indicate higher proportion of heavier and more toxic aliphatic compounds and
result in correspondingly lower soil vapor screening level.
2. Based on data from similar site setting. Carbon range data available for diesel vapors only (Table
3a).
3. For example only; assumes commercial/industrial land use and samples collected immediately
beneath building slab. Screening level for diesel vapors based on site-specific, carbon range data
(see Table 3a and 3c). Screening level for gasoline vapors based on default TPH carbon range
makeup (see Attachment 1), adjusted to reflect a cold climate zone and increased vapor intrusion
risk (see Brewer et al 2013, 2014).
4. Average ratio TPH to benzene in soil vapor samples; ratios over 935 for TPHg and 452 for TPHd
suggest that TPH could still pose a vapor intrusion risk even though the concentration of benzene in
vapors is below screening levels based on a 10
-6
excess cancer risk (Brewer et. al 2013).
5. Subsequent comparison of Total TPH laboratory data for diesel vapors reported as the sum of C5-
C12 compounds indicated significant discrepancies with total carbon range data for the same
samples (three times higher). Total TPH data for diesel might not be reliable for assessment of vapor
intrusion risk. Carbon range data preferred for future testing of vapors in diesel area.
1
COPC
2
Shallow/Subslab
Soil Vapor Data
(mg/m
3
)
3
Vapor
Intrusion
Screening Level
(mg/m
3
)
4
TPH:Benzene
Ratio
TPH
C5-C12
(gasoline vapors)
21,202 750 300:1
5
TPH
C5-C12
(diesel vapors)
6,917 199 54,000:1
TPHrf NA NA NA
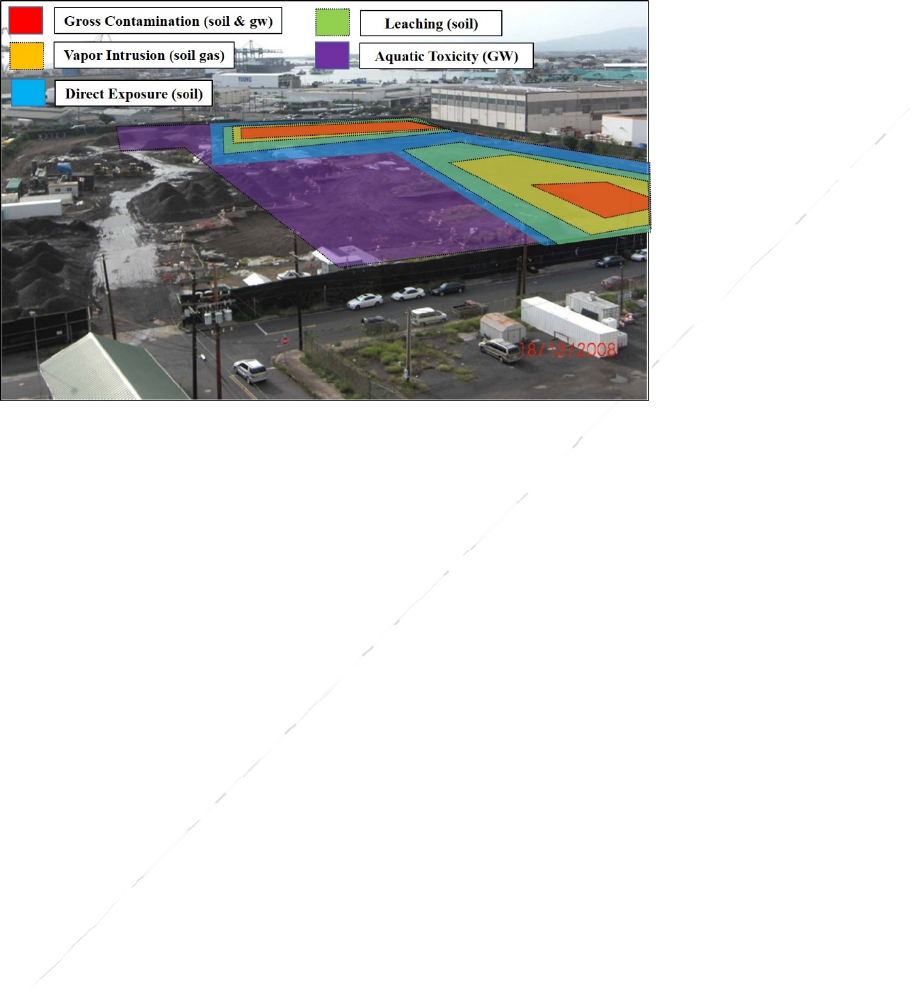
TPH Risk Case Studies (HIDOH, October 2018)
Attachment 1: Example Case Studies
Case Study #1: Former Fuel Tank Farm
34
Figure 1-2. Pre-remediation environmental concerns (current
conditions).
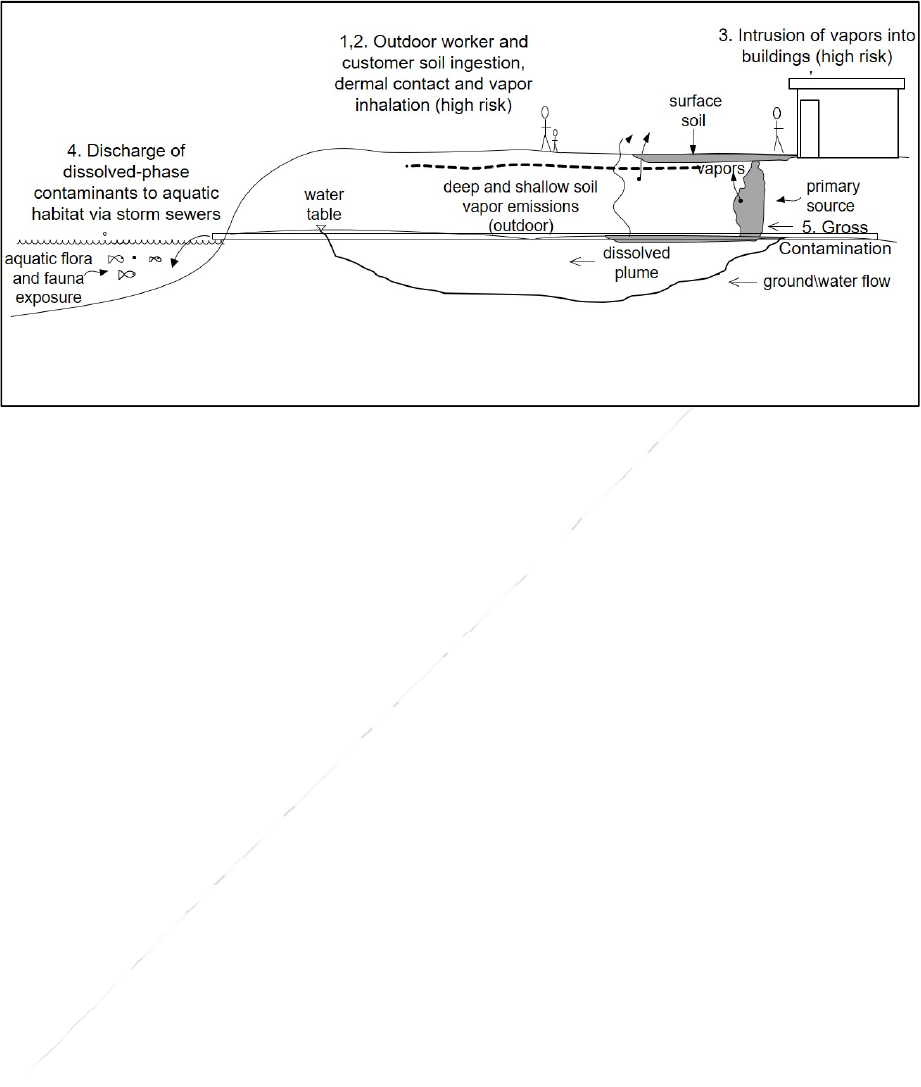
TPH Risk Case Studies (HIDOH, October 2018)
Attachment 1: Example Case Studies
Case Study #1: Former Fuel Tank Farm
35
Figure 1-3. Conceptual Site Model of exposure pathways following redevelopment assuming
no remediation. Potential concerns include: 1) Long-term exposure of store workers and shoppers
to exposed soil and vapors from deeper soil (high risk), 2) Short-term exposure of utility and
construction workers to soil, groundwater, and high levels of vapors, 3) Vapor intrusion into
buildings (high risk), 4) Discharge of LNAPL and dissolved-phase contaminants to aquatic
habitats via storm sewers, and 5) Significant management and disposal of soil and groundwater
issues during future utility and construction work (including short-term risks to workers and
customers).
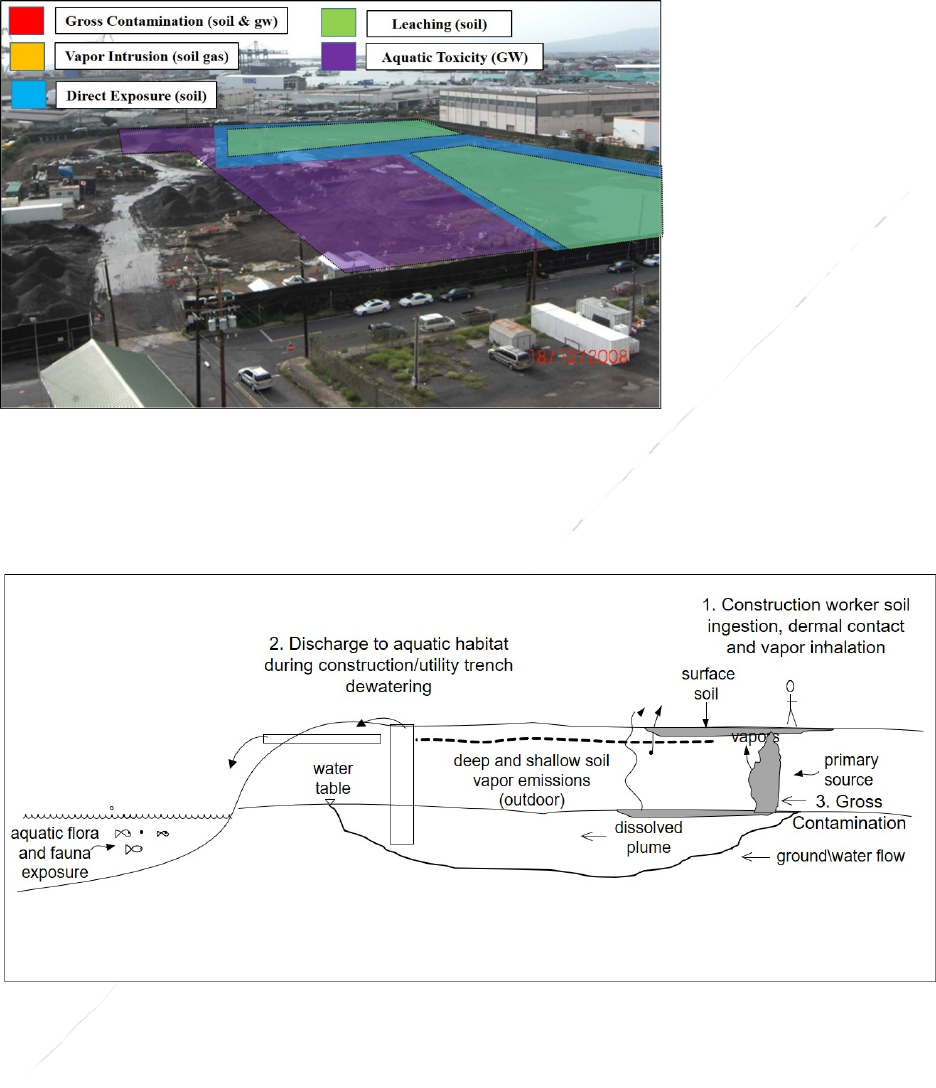
TPH Risk Case Studies (HIDOH, October 2018)
Attachment 1: Example Case Studies
Case Study #1: Former Fuel Tank Farm
36
Figure 1-4. Anticipated remaining environmental concerns
following remediation of most heavily contaminated areas (gross
contamination and high-risk direct-exposure and vapor intrusion
sources removed).
Figure 1-5. Conceptual Site Model of exposure pathways during construction of commercial
complex. Potential concerns include: 1) Short-term exposure of construction workers, 2)
Discharge of contaminated groundwater to aquatic habitats during runoff or dewatering operations
and 3) Gross contamination and associated sheens, strong vapors and fouling of equipment, etc.).
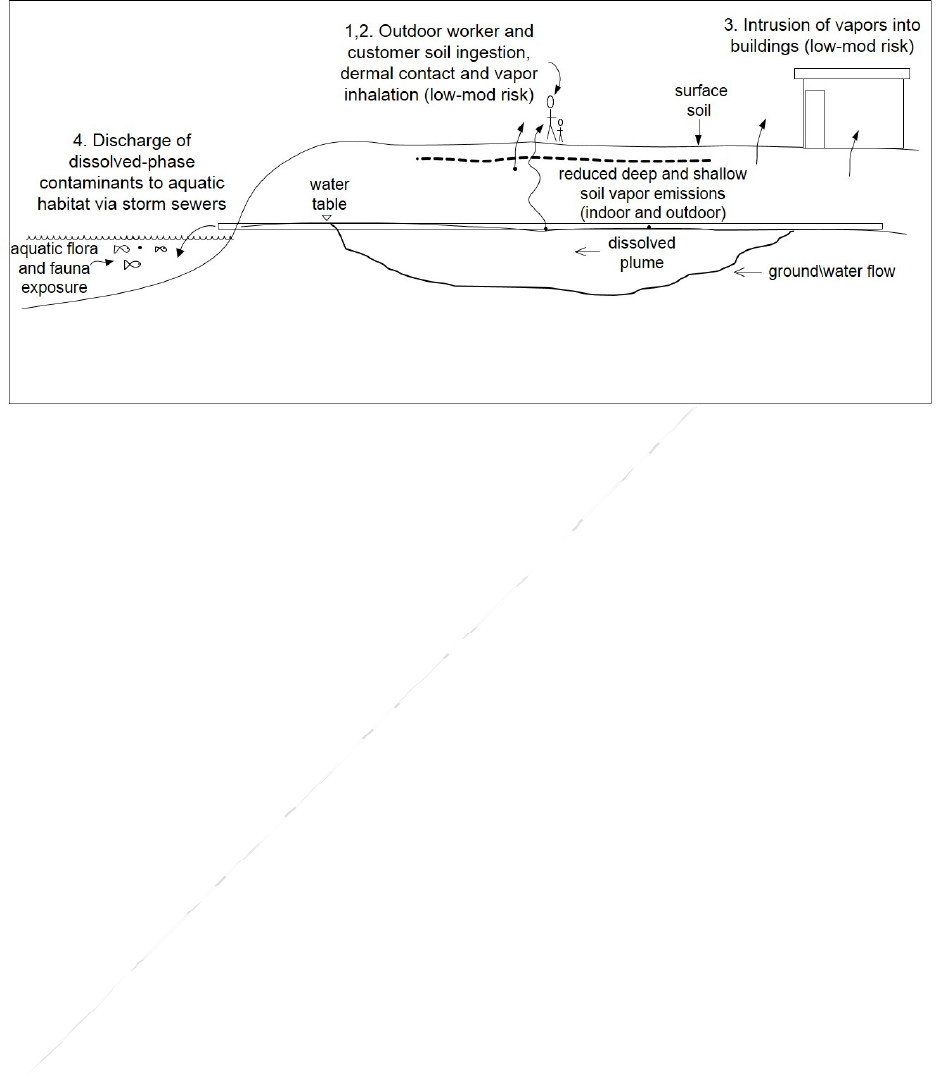
TPH Risk Case Studies (HIDOH, October 2018)
Attachment 1: Example Case Studies
Case Study #1: Former Fuel Tank Farm
37
Figure 1-6. Post-remediation Conceptual Site Model of potential environmental concerns
and exposure pathways after remediation and site redevelopment but in the absence of
controls. Potential concerns include: 1) Long-term exposure of store workers and shoppers to
exposed soil and or vapors from soil (low-moderate risk), 2) Short-term exposure of utility and
construction workers to soil, groundwater, and low levels of vapors, 3) Vapor intrusion into
buildings (low-moderate risk), 4) Discharge of contaminated groundwater to aquatic habitats via
storm sewers, and 5) Reduced management and disposal of soil and groundwater issues during
future utility and construction work (including short-term risks to workers and customers).
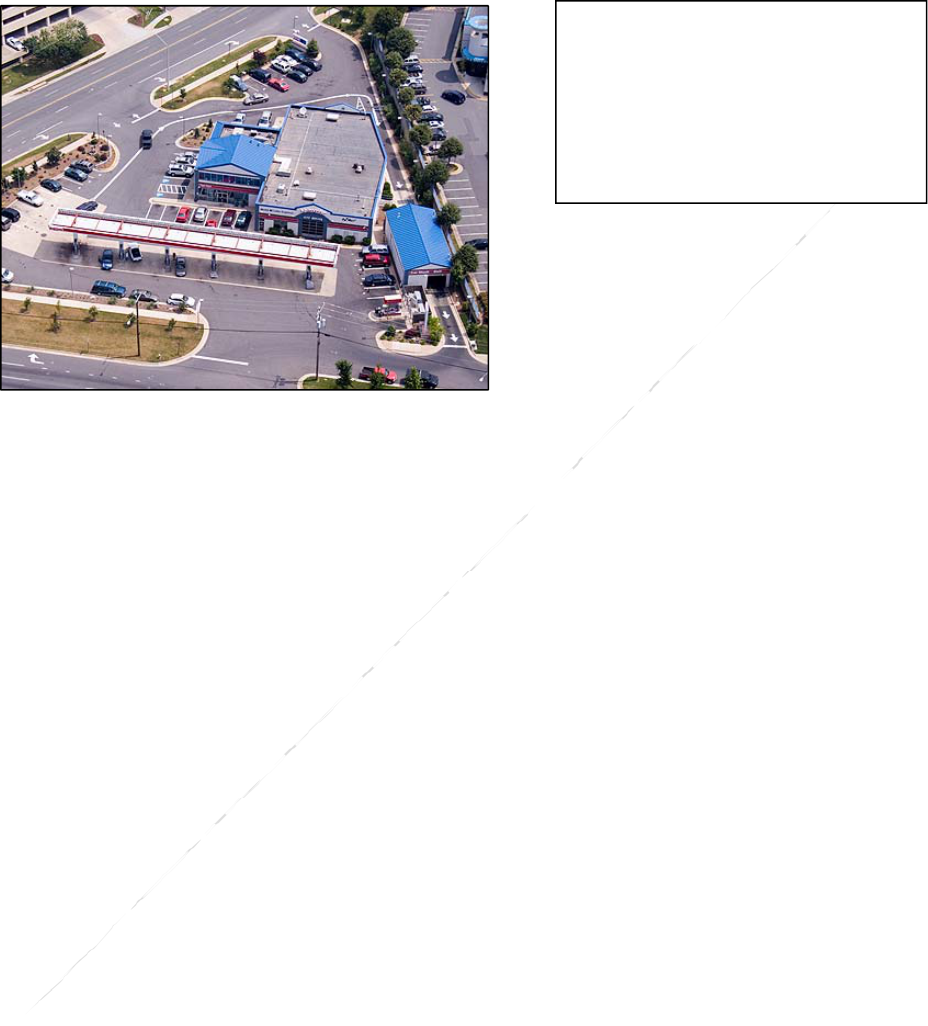
TPH Risk Case Studies (HIDOH, October 2018)
Attachment 1: Example Case Studies
Case Study #2: Active Gas Station
38
Case Study #2: Active Gas Station
Figure 2-1. Example active gas station.
Summary
This case study presents an active gas station scenario with two releases of gasoline from leaking
underground storage tanks (USTs) over time. An early release of high-benzene gasoline (benzene
content >1%; USEPA 2007) was largely remediated following tank replacement activities. This
release also resulted in contamination of soil with lead and various fuel oxygenates, although these
chemicals are not discussed as part of this case study. No impacts to groundwater were identified.
A small volume of shallow, contaminated soil was left in place under a maintenance building due
to structural concerns. TPH data for the sum of C5-C12 hydrocarbons in subslab soil vapor samples
exceeded screening levels for vapor intrusion. The volume of contaminated soil that remained in
place and the mass of petroleum in the soil was considered to be de minimis and too small to pose
long-term risks, however.
A second, larger release of low-benzene gasoline (benzene content <0.62%; USEPA 2007) from
the existing USTs impacted groundwater. LNAPL was removed from high-transmissivity areas in
order to reduce the source area mass and minimize the potential for offsite migration. The carbon
range makeup of gasoline vapors is dominated by C5-C8 aliphatics and relatively consistent
(Brewer et al. 2013). This allows the use of generic, soil vapor screening levels for vapor intrusion
and avoids the need for site-specific, carbon range data (see Attachment 4). This allowed for the
use of less expensive, TPH data from a larger selection of laboratories for subsequent monitoring
and investigation. Comparing data to carbon range-weighted screening levels for TPH also ensures
that cumulative risk posed by multiple carbon range fractions is taken into account. For example,
the individual concentration of carbon range fractions in soil, soil vapor, air or water samples might
be below risk-based screening levels for these fractions. In combination, however, total exposure
exceeds the target noncancer Hazard Index (HI) of 1.0. The same holds true for potential gross
contamination concerns. Individual fractions can be below levels that individually might pose taste
and odor concerns for drinking water, but in combination the water is unpalatable and poses a
Relative Applicability:
- USTs.
- Petroleum product transfer
terminals.
- Additives/Blending Agents
terminals.

TPH Risk Case Studies (HIDOH, October 2018)
Attachment 1: Example Case Studies
Case Study #2: Active Gas Station
39
health risk. The Massachusetts DEP incorporates potential cumulative risk into their screening
levels for individual carbon ranges (default Hazard Quotient (HQ) = 0.2). This is not a common
practice, however, and cumulative risk is oftentimes not considered. The dissolved-phase plume
threatens a shallow, irrigation well at an adjacent school that could be incidentally and
inappropriately be used for drinking water by workers and students (school connected to
municipality water system). Perimeter well monitoring data are compared to hypothetical
screening levels for a Degradation Stage 3 metabolite suite in order to assess risk and monitor
plume advancement (see Attachment 5; after Zemo et. al 2016).
Note that C11-C22 aromatics as reported using the MADEP laboratory method and referenced in
the below tables is not defined in terms of equivalent carbon and can in fact include a much broader
range of compounds.
1. Site Setting (Figure 2-1)
Active gas station in use since the 1960s;
Geology: Sandy silt to 15ft below ground surface (bgs), underlain by sandy gravel to >25ft
bgs;
Depth to groundwater approximately 25 feet (shallow groundwater used for irrigation at
adjacent school);
Nearest surface water body >½ mile;
Climate Zone: Warm (used for vapor intrusion assessment);
Two releases:
o Pre-2011: high-benzene gasoline;
o Post-2011: low-benzene gasoline;
Primary COPCs: TPHg, BTEX;
No near-term change in use planned;
Status: Small release discovered under dispensers during removal and upgrade of two
USTs and distribution system in early 2000s. Majority of contaminated soil excavated and
disposed of at landfill; small volume (<10cyds) of impacted soil left in place due to
concerns regarding structural integrity of maintenance shop. Second, larger release
discovered during routine leak detection monitoring of new system. LNAPL observed on
groundwater. All contamination located under paved areas. Source of second release
repaired as part of a leak detection and repair program.
2. Site Characterization (Figure 2-2)
First Release:
Field observations and photoionization detector (PID) used to remove majority of
contaminated soil (approximately 75 cubic yards (cy) of sandy silt removed);
Small area of contaminated soil in one sidewall could not be excavated due to structural
concerns for adjacent maintenance building;

TPH Risk Case Studies (HIDOH, October 2018)
Attachment 1: Example Case Studies
Case Study #2: Active Gas Station
40
Soil samples (MIS) collected from excavation floor and sidewalls (Table 2-1a);
One soil MIS sample collected each from floor and sidewall plus additional two replicates
from excavation floor;
Thirty-increments collected per sample (10g per increment);
Placed in methanol in the field for a total sample mass of 300 grams (HIDOH 2016; ITRC
2012; note that 5g samples collected in “Encore” type devices cannot reliably be considered
to be representative of site conditions due to the limited mass of soil represented);
Separate MIS sample collected from small area of gasoline-contaminated soil left in place
adjacent to building;
Borings inside building suggest <10cyds of contaminated soil left in-place (Figure 2-2);
Estimated <5 gallons of gasoline remaining in soil;
Soil vapor samples collected under maintenance building indicate small vapor plume under
building characterized by a low TPH: Benzene ratio (<50:1) and supporting the past release
of high-benzene gasoline (Table 2-1c; see Brewer et. al 2013);
Soil vapor data below site-specific screening level for vapor intrusion for both TPH and
individual aromatic compounds.
Second Release:
Soil and groundwater investigation and sample data revealed significant gasoline
contamination beneath one of the USTs (Table 2-2a, Table 2-2b).
MIS-type soil samples from multiple, exploratory borings used to identify approximate
lateral and vertical extent of contamination;
Groundwater samples collected from temporary monitoring wells screened across the top
of the water table;
Samples tested for TPHg and TPHd using Method 8015M to verify absence of diesel in
soil and capture TPH-related breakdown compounds in groundwater;
Negligible concentrations of TPHd-range compounds reported for initial groundwater
samples, implying minimal degradation (see Table 2-2b; refer also to Attachment 5).
LNAPL does not extend offsite;
Extent of dissolved-phase plume of TPH and petroleum-related degradation compounds
not determined;
Initial soil vapor samples collected one and five feet above LNAPL on water table outside
of initial release area and tested for TPH as sum of C5-C12 compounds in order to assess
upward attenuation of vapors (Table 2-2c).

TPH Risk Case Studies (HIDOH, October 2018)
Attachment 1: Example Case Studies
Case Study #2: Active Gas Station
41
3. Potential Environmental Concerns
First Release (Figure 2-3):
Primary Environmental Concerns (see Table 2-1a and Table 2-1b):
o No exposure or concerns under current conditions;
o Direct-exposure (if soil inadvertently exposed or excavated and reused at the surface);
o Gross contamination and risk of short-term but very strong vapor emissions for all areas
of impacted soil tested (e.g., requires short-term management of contaminated soil
during subsurface utility work, including on-site storage and management, disposal,
management of vapors, etc.);
o Soil vapor data below screening levels for vapor intrusion concern under any site-use
scenario (TPH and BTEX);
o Cracks and utility perforations in floor of maintenance building sealed as added
measure of precaution.
Second Release (see Figure 2-3):
Primary environmental concerns (see Table 2-2a, Table 2-2b, Table 2-2c):
o Direct-exposure (all areas tested under an unrestricted land use scenario and localized
areas under a commercial/industrial land use scenario if soil inadvertently excavated in
future and reused at the surface);
o Vapor intrusion (primarily from LNAPL in soil; on-site only);
o Potential leaching of gasoline from soil and contamination of groundwater;
o Gross contamination (e.g., short-term risk to workers during future subsurface UST
system repairs and utility work, including exposure of employees and customers and
offsite migration of vapors, etc.);
o Potential impacts of dissolved-phase to irrigation well used by adjacent school for
watering lawns (inadvertent use of well for drinking water by workers and students);
o No anticipated impacts to aquatic habitats.
The bulk of dissolved-phase compounds reported as “TPH” in groundwater outside of areas
with LNAPL is assumed to be composed of petroleum-related metabolites from the second
release (refer to Zemo et. al 2016);
Concentrations of TPH in groundwater samples <100 µg/L in the absence of silica gel
cleanup assumed to represent background “noise” associated with algae and other organic
matter and not considered to be reliable indicators of petroleum-related compounds
(identified in method blanks and upgradient wells);
High ratio of TPH:Benzene in soil vapor suggests TPH aliphatics drive risk for vapor
intrusion over individual aromatic compounds (see Table 2-2c; Brewer et. al 2013);
Comparison of the subslab, soil vapor data to site-specific screening levels indicated a
potential risk for store employees and customers in the absence of remediation or measures
to mitigate vapor intrusion into the building;

TPH Risk Case Studies (HIDOH, October 2018)
Attachment 1: Example Case Studies
Case Study #2: Active Gas Station
42
Risk-based screening levels for TPH metabolites developed for monitoring of the
dissolved-phase plume in perimeter monitor wells and samples collected from the school
irrigation well, assuming ingestion of water only (see Attachment 5);
Risk-based, drinking water toxicity screening levels for both TPH and TPH metabolites
exceed likely taste and odor thresholds for these compounds (default 500 µg/L), implying
that long-term, unrecognized exposure to contaminated groundwater is unlikely.
4. Site Remediation
First Release:
No further investigation or soil removal or treatment approved;
Cracks and utility perforations in floor sealed as added measure of precaution.
Second Release:
Completed/ongoing remedial actions:
o Removal of LNAPL on groundwater from high-transmissivity areas as practicable in
order to reduce source area mass and potential for offsite migration;
o Soil vapor extraction to reduce potential vapor intrusion risks;
o Sealing of cracks and utility perforations in store and increase in fresh air intake for
heating, ventilation and air conditioning (HVAC) system during heating season; and
o Long-term monitoring of indoor air and subslab vapors to assess the need in install an
active or passive vapor mitigation system.
5. Post Investigation Actions:
First Release:
Environmental Hazard Management Plan (EHMP) prepared to summarize long-term
management actions (e.g., location and approximate volume of contaminated soil,
management of soil if disturbed in future, short-term worker exposure, etc.);
Removal of soil and follow-up soil vapor study recommended to confirm absence of vapor
intrusion concerns if land use changes to residential or other sensitive uses in the future;
and
No Further Action (NFA) granted by regulatory agency due to removal of source and small
amount of contaminated soil and volume of gasoline left in place.
Second Release:
Preparation of an EHMP that:
o Documents the location of contaminated soil and/or groundwater at each release area
(including to-scale maps);
o Summarizes the potential environmental concerns associated with contamination in
each area;
o Recommends health and safety training for workers who may come in contact with
contaminated soil or groundwater or related vapors;

TPH Risk Case Studies (HIDOH, October 2018)
Attachment 1: Example Case Studies
Case Study #2: Active Gas Station
43
o Provides basic discussion of management needs if contaminated soil disturbed in
future;
o Recommends preparation of a more detailed EHMP as a part of scheduled activities
that may necessitate the need to excavate contaminated soil;
Institutional Controls:
o Restriction on future groundwater supply wells;
o Quarterly monitoring of irrigation well at adjacent school, with monitoring schedule to
be re-assessed following initial two-year period; and
o Restrict future use of site to commercial/industrial only in the absence of additional
remediation and investigation.
EHMP for management of contaminated soil and groundwater during future subsurface
activities (e.g., utility installation and repair, new construction, etc.):
o Location and estimated volumes of contaminated soil and water;
o Storage of excavated soil in designated, lined areas;
o Reuse or offsite disposal of excavated soil;
o Treatment and/or re-infiltration of contaminated groundwater;
o Control of vapors during excavation;
Monitoring of groundwater for two years to assess potential offsite migration concerns and
need for active remediation; and
Monitoring of vapors (including methane) under building slab and other areas of the site
as needed for two years to assess potential long-term vapor concerns.
Key Lessons Learned/Considerations:
1. CSM development and periodic updates are critical for legacy sites.
2. Consider using DU-MIS (ISM) methods for Site characterization; consider fractionating
all obtained TPH data for a robust evaluation. Site characterization should evaluate
metabolites (degradation byproducts).
3. Generic soil vapor screening levels for vapor intrusion based on conservative, default
carbon range makeup of gasoline vapors considered adequate for assessment of potential
vapor intrusion risks in absence of site-specific, carbon range data;
4. TPH vapor intrusion pathway and associated risks to gas station employees/visitors should
be addressed.
5. TPH risk evaluation should consider cumulative risks in arriving at remedial management
decisions.
6. Remedial decision framework should incorporate long-term management of ongoing and
future releases.

TPH Risk Case Studies (HIDOH, October 2018)
Attachment 1: Example Case Studies
Case Study #2: Active Gas Station
44
References
Brewer, R., J. Nagashima, M. Kelley, M. Heskett and M. Rigby. 2013. "Evaluation of Total
Petroleum Hydrocarbons in Vapor Intrusion Studies." Int. J. Environ. Res. Public Health 10:
2441-2467.
HIDOH. 2016. Technical Guidance Manual:
Hawai′i Department of Health, Hazard Evaluation
and Emergency Response. August 2016.
HIDOH. 2017. Evaluation of Environmental Hazards at Sites with Contaminated Soil and
Groundwater – Tropical Pacific Edition (Fall 2017): Hawai‘i Department of Health, Hazard
Evaluation and Emergency Response.
ITRC. 2012. Incremental Sampling Methodology: Interstate Technology and Regulatory Council,
February 2012.
ITRC. 2014. Petroleum Vapor Intrusion: Interstate Technology and Regulatory Council, October
2014.
USEPA. 2007. Control of Hazardous Air Pollutants from Mobile Sources. In Federal Register.
Vol. 72, No. 37: February 26, 2005. Washington, DC.
Zemo, D.A., O’Reilly, K.T., Mohler, R.M., Magaw, R.I., Espino Devine, C., Ahn, S., and Tiwary,
A.K. 2016. Life Cycle of Petroleum Biodegradation Metabolite Plumes, and Implications for
Risk Management at Fuel Release Sites. Integrated Environmental Assessment and
Management. DOI: 10.1002/ieam.1848.

TPH Risk Case Studies (HIDOH, October 2018)
Attachment 1: Example Case Studies
Case Study #2: Active Gas Station
45
Table 2-1a. Comparison of soil for first release to screening levels (“X” =
potential environmental concern).
Sample #
TPHg
(mg/kg)
1
TPH Screening Levels (mg/kg)
2
Direct
Exposure
Leaching
3
Gross
Contamination
450 (2,000) 100 100 (500)
1 3,700 X X X
2 1,920 X X X
3 1,400 X X X
4 1,300 X X X
5 1,600 X X X
1. Site data initially compared to screening levels for Unrestricted (Residential) land use in order
minimize future land-use restrictions and identify soil that could require long-term management; for
example only (HIDOH 2017).
2. Direct-exposure screening level for unrestricted land use (commercial/Industrial land use
screening levels noted in parentheses).
2. Gross contamination screening levels reflect potential strong but short-term vapor emission risks
and odor concerns under an unrestricted, land-use scenario if soil disturbed or exposed at the surface
(commercial/Industrial land use screening levels noted in parentheses).
Table 2-1b. Comparison of soil vapor data for first release to
screening levels.
1
Sample #
3
Screening Level (mg/m
3
)
2
TPHg Benzene
TPH:
Benzene
Ratio 750 1.0
SV-1 23,800 343 69:1
SV-2 12,400 315 39:1
SV-3 20,700 451 46:1
SV-4 30,000 981 79:1
SV-5 15,500 196 43:1
1. Samples collected within gasoline contaminated soil.
2. TPH measured as the sum of C5-C12 aliphatic and non-BTEX aromatic
compounds.
3. Screening Levels intended to reflect commercial/industrial exposure and a cold
climate zone (se Attachment 4). TPHg screening level based on a noncancer
Hazard Quotient of 1.0. Benzene screening level based on a target cancer risk of
10
-6
.

TPH Risk Case Studies (HIDOH, October 2018)
Attachment 1: Example Case Studies
Case Study #2: Active Gas Station
46
Table 2-2a. Example potential environmental concerns posed by TPHg in soil
from second release.
Sample #
TPHg
(mg/kg)
1
TPH Screening Levels (mg/kg)
Direct
Exposure
Leaching
2
Gross
Contamination
450 (2,000) 100 100 (500)
1 1,800 X X X
2 4,400 X X X
3 1,100 X X X
4 1,200 X X X
5 3,400 X X X
1. “X” = Screening level exceeded (for example only; after HIDOH 2017).
2. Gross contamination screening levels reflects potential short-term emission of strong vapors if soil
disturbed or exposed at the surface.
Table 2-2b. Example potential environmental concerns posed by TPHg and
TPH-related metabolites in groundwater from second release.
Sample #
2
TPHg
(µg/L)
1
TPHg Groundwater Screening Levels (µg/L)
3,4,5
Toxicity
6
Gross
Contamination
7
Aquatic
Toxicity
300 (600) 500 500
1 16,000 X X X
2 26,000 X X X
3 30,000 X X X
4 15,000 X X X
5 33,000 X X X
1. “X” = Screening level exceeded (for example only; after HIDOH 2017; see Attachment 4).
2. Negligible concentrations of TPHd-range compounds reported, implying minimal degradation.
3. Based on default, carbon range makeup of gasoline fuel noted in Appendix 4. First screening level
considers both drinking water ingestion and inhalation of vapors during showers, etc. Second
screening level based on ingestion only.
4. Calculated using USEPA RSL tapwater model (USEPA 2017) and weighted toxicity factors noted
in Attachment 5.
5. Compare to example, toxicity-based screening levels for TPH-related metabolite suites associated
with different stages of hydrocarbon degradation noted in Attachment 5. Metabolite-based screening
levels are more applicable to compounds that elute in the TPHd C10+ range.
6. Gross contamination screening levels reflects potential strong, short-term vapor emission risks,
sheens, odors, etc.
7. Chronic aquatic toxicity for TPHg.

TPH Risk Case Studies (HIDOH, October 2018)
Attachment 1: Example Case Studies
Case Study #2: Active Gas Station
47
Table 2-2c. Comparison of soil vapor data for second release area to default screening
levels for vapor intrusion concerns.
1
Sample #
2
Screening Level
3,4
TPH
C5-C12
(mg/m
3
)
4
Benzene
(mg/m
3
)
O2
5
TPH:
Benzene
750 1.0 - -
SV-1 (5) 16,000 ND (<2.9) 6.1% >5,517:1
SV-1 (1) 130,000 43 0.9% 3,023:1
SV-2 (5) 90,000 ND (<7.1) 5.2% >12,676:1
SV-2 (1) 280,000 81 0.9% 3,457:1
1. Two multi-depth vapor points. Number in parentheses reflects approximate distance sample
collected above water table source.
2. Default commercial/industrial screening levels for cold climate zone (after HIDOH 2017; see
Attachment 1); indoor air screening level divided by an assumed subslab attenuation factor of
0.0016).
3. TPH measured as the sum of C5-C12aliphatic and non-BTEX aromatic compounds.
4. Assumes commercial/industrial screening level for TPH gasoline vapors in indoor air of 1,200
µg/m
3
(noncancer HQ = 1.0)
5. Assumes commercial/industrial screening level for benzene vapors in indoor air of 1.6 µg/m
3
(10
-6
cancer risk; USEPA 2017).
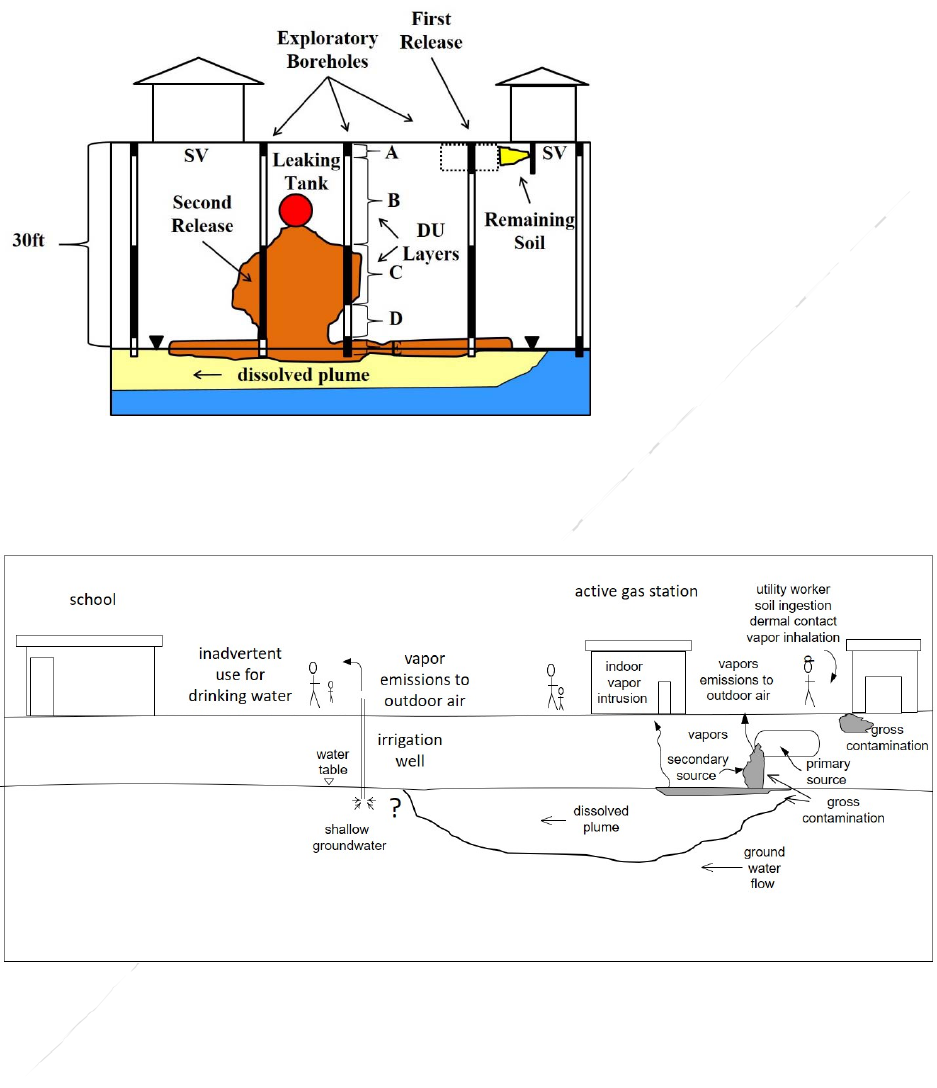
TPH Risk Case Studies (HIDOH, October 2018)
Attachment 1: Example Case Studies
Case Study #2: Active Gas Station
48
Figure 2-2. Schematic drawing of investigations of first and second releases. Borehole core
intervals (“DU” Layers) targeted for collection of MIS-type soil samples noted; soil vapor
samples collected under existing building.
Figure 2-3. Conceptual Site Model of potential environmental concerns.
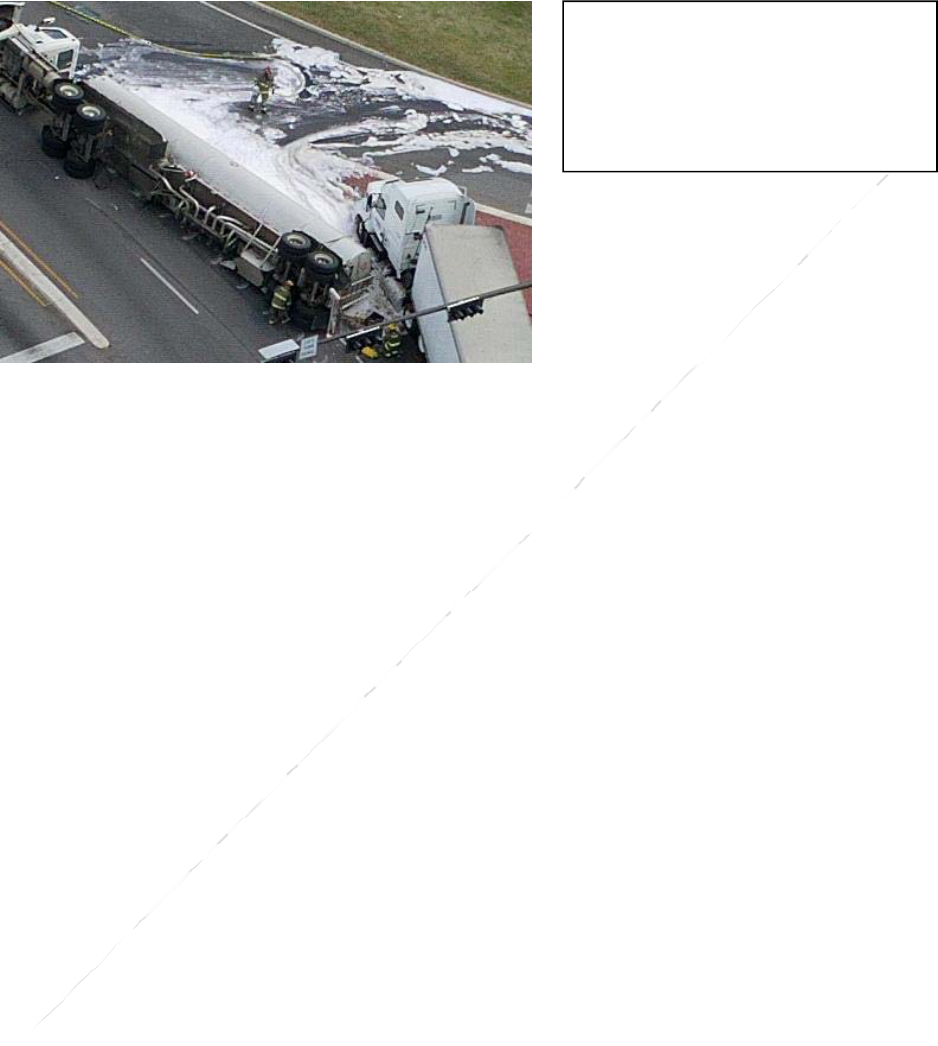
TPH Risk Case Studies (HIDOH, October 2018)
Attachment 1: Example Case Studies
Case Study #3: Diesel Tanker
49
Case Study #3: Diesel Tanker Truck Accident
Figure 3-1. Example tanker truck release in urban area.
Summary
This case study presents the release of approximately 3,000 gallons of diesel fuel from a tanker
truck accident in a densely populated, residential neighborhood. The tanker truck swerved to miss
a car pulling out from a driveway, clips a telephone pole and then tips over a short distance down
the street. A 25-gallon transformer filled with non-PCB mineral oil fell from the telephone pole
and spilled into a yard. A portion of the diesel fuel flowed into the front yard of an apartment
complex. Some of the diesel flowed down the street and entered a storm drain, where it discharged
into a small, slow moving stream that flowed behind the apartment building.
Residents in the immediate neighborhood were temporary evacuated due to strong vapors from the
fuel. Dizziness and nausea caused by short-term exposure to the vapors was transitory (reversible)
and quickly dissipated once affected residents relocated to other areas. Emergency response
workers (HazMat crews) relied on supplied air during initial cleanup efforts. Environmentally
friendly foam suppressants were used to reduce vapor emissions and minimize fire concerns. (Note
that guidance on environmental hazards posed by foam suppressants was not available at the time
this document was being prepared.) Diesel fuel that spread to the stream quickly dispersed as a
sheen and began to evaporate, with strong odors emanating from the impacted area. Booms were
quickly placed downgradient of the plume dispersion. Skimmers and sorbent pads were used to
remove free product. No samples were collected.
Ambient air samples were collected directly over the release area as well as upwind and downwind
of the release. Samples were tested onsite for TPH as the sum of C5-C24 as well as benzene and
naphthalene using a portable, field gas chromatograph (combined Summa samples and sorbent
tubes). Data were compared to Emergency Response Planning Guidelines (AIHA 2016) for
evaluation of short-term exposure (hours) risk to residents and responders as well carbon range-
weighted, TPH screening levels for vapors associated with diesel fuels for assessment of long-term
exposure risk to support cleanup actions (Table 3-1; see also HIDOH 2012; Brewer et. al, 2013).
Air data for the release area confirmed concentrations of TPH above long-term, residential ambient
air screening levels but did not pose a short-term (less than one hour) risk to emergency response
Relative Applicability
- Emergency Spill Response
/Triage
- Refinery/Terminal/AST
Releases

TPH Risk Case Studies (HIDOH, October 2018)
Attachment 1: Example Case Studies
Case Study #3: Diesel Tanker
50
workers (see Table 3-1). Data for upwind samples were indicative of anticipated, urban area
background and assumed to be associated with auto exhaust. Data for downwind samples indicated
TPH above anticipated background and likely reflect a mix of ambient conditions and vapors
associated with the release. The collection of additional air samples to obtain more site-specific,
carbon range data and estimate health risk was deemed to be unnecessary, given the obvious
impacts and pending excavation of the impacted soil.
The petroleum-based, mineral oil from the transformer was determined to have a very low toxicity
(EPRI 1998, Conoco 2004). A screening level of 5,000 mg/kg was determined to be adequate to
address gross contamination concerns. Approximately five cubic yards of impacted soil was
excavated and disposed of (HDOH 2017).
Field observations and a photo ionization detector (PID) were used to guide excavation of
contaminated soil from the residential yard area the following day. (Note that PIDs respond
primarily to aromatic compounds and are less effective for field screening of diesel
contamination.) Approximately 200 cubic yards of soil were excavated and disposed of at a
municipal landfill. Most of the contamination was contained to the upper three to five feet of soil.
Confirmatory MIS (ISM) soil samples were collected from the floor and sidewalls of the
excavation and tested for TPH as diesel, as well as BTEX, naphthalene and methylnaphthalenes
(Figure 3-3; total 11 Decision Units or “DUs”). Samples to be tested for volatile chemicals were
placed in methanol in the field. Replicate (triplicate) samples were collected from the floor of the
excavation under the initially most heavily contaminated area of soil (DU-2). The relative standard
deviation for replicate samples collected from DU-2 was below 35%, suggesting good field
precision and reproducibility of the data.
Resultant analytical data were compared to published screening levels for TPH and individually
targeted compounds (Table 3-2). With the exception of the sample collected from DU-1, data for
samples were below screening levels for direct exposure (260 mg/kg), gross contamination (500
mg/kg) and leaching (100 mg/kg). An additional two feet of soil was removed from DU-1. Data
for the follow-up confirmation sample collected from the floor of the excavation were below
screening levels.
Groundwater was situated forty feet below the ground surface and classified as a drinking water
resource, although it is primarily used for irrigation. Potential impacts to two irrigation wells
located 500 and 1,000 feet from the spill were considered to be negligible due to the observed
depth of infiltration and rapid cleanup of impacted soil to target screening levels intended to be
protective of leaching concerns. It was determined that no testing or monitoring of wells was
required.
Diesel fuel trapped on the stream surface quickly evaporated. Grossly contaminated vegetation
and sediment were removed from easily accessible areas of the shoreline. Initial testing of water
samples immediately following the release indicated concentrations of TPH well above the default
screening level for chronic aquatic toxicity (640 µg/L; see Attachment 1). Comparison of water
data with and without silica gel cleanup suggested minimal degradation of dissolved-phase
hydrocarbons. Additional removal or treatment was considered to pose a greater risk to the stream
ecology than simply allowing the remaining fuel to naturally attenuate. Maintenance of the boom,
removal of sheens with sorbent pads and monitoring of overall stream conditions was carried out
throughout the following rainy season to allow any remaining LNAPL to flush from the storm
drains. Water samples collected three months after the release indicated near complete degradation

TPH Risk Case Studies (HIDOH, October 2018)
Attachment 1: Example Case Studies
Case Study #3: Diesel Tanker
51
and attenuation of hydrocarbons and levels of “TPH” in the absence of silica gel cleanup within
anticipated background for urban area streams.
Key Lessons Learned/Considerations:
1. Rapid response to the release is vital in order to contain LNAPL and prevent migration to
subsurface utilities, storm drains, surface water, etc.
2. Inhalation of TPH vapors (primarily light-range aliphatics) posed acute but transitory
health risks to residents and emergency response workers.
3. Fuel characteristics such as toxicity, density, vapor pressure, biodegradation rates and soil
properties such as soil wetting and clay content should be considered when responding to
an emergency response fuel discharge to the surface, and for making rapid response
decisions regarding prioritizing environmental and human health pathway assessment and
testing.
4. The less complex the hydrocarbon assemblage, or the shorter range of the carbon
compounds can make diesel and other motor fuel releases easier to respond to and cleanup
versus heavier fuel oil releases.
5. Refer to State UST program for guidance on COPC Short List and testing protocols for
different fuel types.
6. The availability of pre-approved, comprehensive, carbon range-weighted screening levels
for TPH in soil, surface water and air expedited characterization and remediation of
contaminated soil without the need for a follow-up, detailed risk assessment.
7. Stream samples tested both with and without silica gel cleanup documented the rapid
degradation of remaining petroleum.
8. Emergency response for fuel release sites should consider OSHA protocols and Permissible
Exposure Limits (PELs) for a target contaminant to immediately mitigate and manage
human health and risk to other receptors. Evaluate potential short-term, exposure risks to
workers and nearby residents.
References
AIHA, 2016. Emergency Response Planning Guidelines: Association of Industrial Hygienists,
AIHA Guideline Foundation, 2016 ERPG/WEEL Handbook, Falls Church, VA.
Brewer, R., J. Nagashima, M. Kelley, M. Heskett and M. Rigby. 2013. "Evaluation of Total
Petroleum Hydrocarbons in Vapor Intrusion Studies." Int. J. Environ. Res. Public Health 10:
2441-2467.
Conoco, 2004, 76 Transformer Oil Material Safety Data Sheet: Conoco Lubricants, MSDS Code:
775852, January 19, 2004.
EPRI, 1998, Chemicals-Physical Characteristics of Mineral Insulating Oils and Environmental
Risk Analysis: Electric Power Research Institute, August 1998, Technical Briefing TB111083,
www.epri.com.

TPH Risk Case Studies (HIDOH, October 2018)
Attachment 1: Example Case Studies
Case Study #3: Diesel Tanker
52
HIDOH. 2012. Field Investigation of the Chemistry and Toxicity of TPH in Petroleum Vapors:
Implications for Potential Vapor Intrusion Hazards; Hawai’i Department of Health, Office of
Hazard Evaluation and Emergency Response, http://eha-web.doh.hawaii.gov/eha-
cma/Leaders/HEER/EALs

TPH Risk Case Studies (HIDOH, October 2018)
Attachment 1: Example Case Studies
Case Study #3: Diesel Tanker
53
Table 3-1. Air sample data compared to short-term and long-term
exposure screening levels.
Sample #
2
TPH
C5-C12
(µg/m
3
)
3
Benzene
(µg/m
3
)
3
Naphthalene
(µg/m
3
)
1
Short-Term Risk: 300,000 163,000 -
Long-Term Risk: 130 3.6 0.83
Release Area 110,000 28 ND
4
Upwind
(back
g
round)
120 3.9 ND
5
Downwin
d
1,000 3.7 ND
1. Emergency Response Planning Guideline ERPG-1: Up to 1hour (acute) exposure
without experiencing more than mild, transient adverse health effects (AIHA 2016); for
example only.
2. HIDOH (2017) long-term (chronic) residential ambient air screening levels for TPH
C5-
C12
associated with diesel vapors; for example only.
3. USEPA (2016) residential ambient air screening level; adjusted to reflect a target excess
cancer risk of 10
-5
(USEPA 2017); for example only.
4. Upwind data assumed to reflect urban area background; note exceedance of risk-based
screening level for benzene.
5. Downwind data assumed to reflect a mix of background and vapors from the release
area.
Table 3-2. Soil MIS (ISM) sample data (post excavation; TPH only).
2
TPHd Screening Level = 100 mg/kg
Sample #
1
TPHd
(mg/kg) Sample #
1
TPHd
(mg/kg)
3
DU-1 400 DU-6 52
4
DU-2 (A) 65 DU-7 ND (<50)
4
DU-2 (B) 75 DU-8 ND (<50)
4
DU-2 (C) 90 DU-9 ND (<50)
DU-3 70 DU-10 ND (<50)
DU-4 ND (<50) DU-11 ND (<50)
DU-5 80 DU-12 ND (<50)
1. Method 8015M data for TPH diesel in soil.
2. HIDOH (2017); default screening level for diesel in residential soil over groundwater that
is a current or potential source of drinking water (for example only; see Attachment 4).
3. Initial sample from DU-1 exceeded target screening level; additional soil removed and
floor retested as DU-12.
4. Triplicate MIS sample data; Relative Standard Deviation = 16%, indicating good
precision (HIDOH 2016). Mean concentration of 77 mg/kg used for decision making.

TPH Risk Case Studies (HIDOH, October 2018)
Attachment 1: Example Case Studies
Case Study #3: Diesel Tanker
54
Table 3-3. Example TPH surface water data (Method
8015M) immediately following the release and three
months after the release.
1
Screening Level = 640 µg/L
Sample #
2
TPH
d
(non-SGC)
(µg/L)
3
TPH
d
(SGC)
(µg/L)
4
Stream #1 2,000 1,600
5
Stream #2 550 40
1. For example only (HIDOH 2017). Sum of TPH plus TPH-related
metabolites. Aquatic toxicity of petroleum-related metabolites assumed
identical to parent compounds for initial screening purposes.
2. Surface water data in absence of silica gel cleanup (SGC).
3. Surface water data including silica gel cleanup (SGC).
4. Reported concentration of TPHd from stream sample collected below
free product immediately following the release.
5. Reported concentration of TPHd from stream sample collected three
months aftert the release (no sheen present); data based on non-SGC
analysis assumed representative of ambient, non-petroleum-related
organic material in the stream.
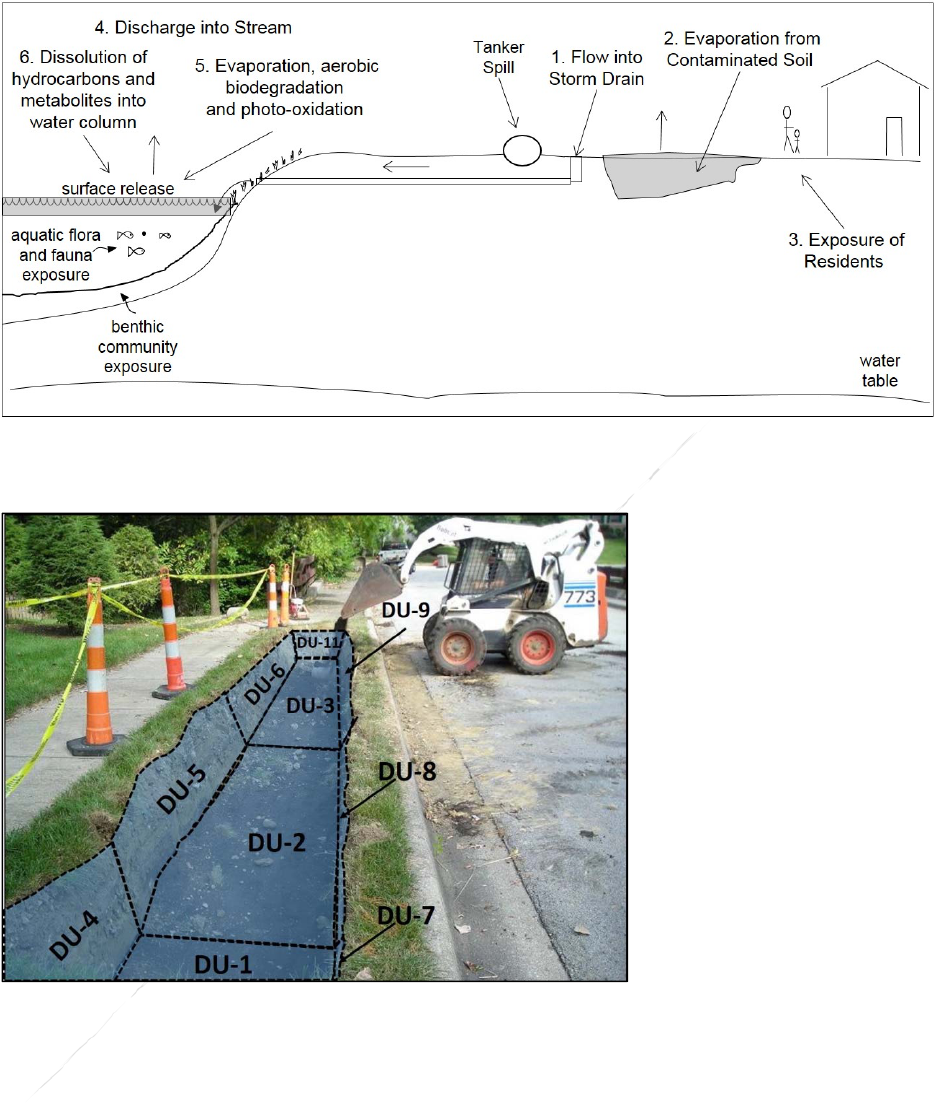
TPH Risk Case Studies (HIDOH, October 2018)
Attachment 1: Example Case Studies
Case Study #3: Diesel Tanker
55
Figure 3-2. Conceptual Site Model of potential environmental concerns.
Figure 3-3. Excavation Decision Units designated for
collection of MIS samples.
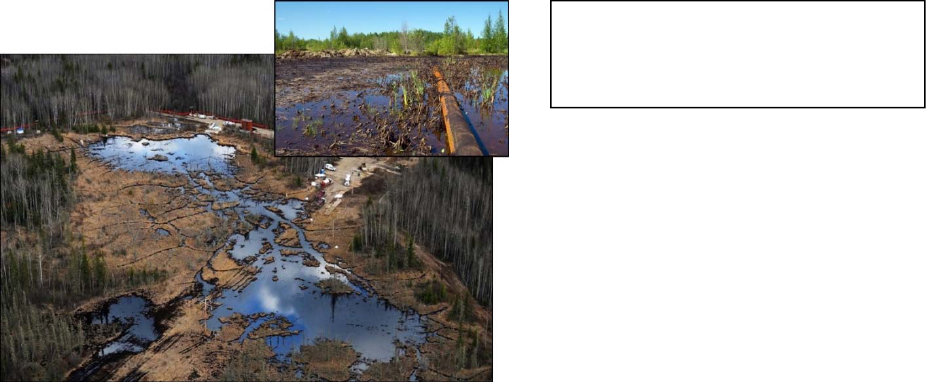
TPH Risk Case Studies (HIDOH, October 2018)
Attachment 1: Example Case Studies
Case Study 4: Crude Oil Pipeline
56
Case Study #4: Crude Oil Pipeline Rupture
Figure 4-1. Release of crude oil from active pipeline.
Summary (modeled in part after Chaplin et. al 2002; Bekins et. al 2016)
This case study presents a pipeline release of an estimated 260,000 gallons (1,000,000 liters) of
light crude oil (API Gravity <20; density <934 kg/m
3
; USGS 2006) into a wetland with no public
access. Easily accessible, gross contamination within in the immediate area of the rupture was
quickly removed by pumping, trenching and excavation.
The crude oil rapidly disseminated throughout the marsh via multiple mechanisms, including
spreading, evaporation, dispersion, dissolution, photo-oxidation, biodegradation, emulsification,
sedimentation and adhesion (NAS 2016). The oil rapidly spread across the surface of the marsh
when it reached the water edge due to interfacial tension. Evaporation (volatilization) was the
primary attenuating mechanism in the initial period following the release. Vapors emanating from
the release were characterized by low molecular weight C5-C12 aliphatic compounds with a minor
amount of aromatic compounds (see also Brewer et al 2013). Air samples were not collected, but
vapors were predicted to be dominated by C5-C12 aliphatic compounds with lesser amounts of
aromatics and only trace amounts of benzene, based on the known, carbon range makeup of the
oil. This led to a progressive enrichment of the residual petroleum in higher weight, less volatile
compounds that caused the petroleum to become more viscous. Oil in upland areas seeped into the
soil and became entrapped as isolated pockets and droplets within the capillary fringe of the water
table. Oil that spread out across the surface of the wetland had immediate, acute effects on aquatic
plants, fish, reptiles, birds and insects caught within the immediate release area as well as benthic
organisms in exposed sediment along the marsh edge.
Some of the oil temporarily dispersed as droplets into the water column due to wind-induced
turbulence, but reformed widespread sheens during calmer periods. A small proportion of oil
dissolved into the water column. This petroleum was dominated by light-weight aliphatic
compounds but included a substantial proportion of more soluble, aromatic compounds as well as
oxidized compounds naturally present in the crude (Potter and Simmons 1998). The dissolved-
Relative Applicability:
- Wetland/Marsh areas
- Ecological receptors.
TPH Risk Case Studies (HIDOH, October 2018)
Attachment 1: Example Case Studies
Case Study 4: Crude Oil Pipeline
57
phase petroleum caused additional acute and chronic toxicity to aquatic organisms. These
compounds at the oil-water interface were quickly degraded by aerobic bacteria, however.
Biodegradation was the primary attenuating mechanism in later stages of the release, as the volatile
component of the crude oil was progressively depleted. This was accompanied by the formation
of an emulsified mixture of water and degraded petroleum at the surface of the marsh and at the
water table (see Harayama 1999). Clumps of degraded oil floating on the surface water drifted to
the shoreline and adhered to plants or sank into the underlying sediment, a process referred to as
“sedimentation,” where they are likely to persist under anaerobic conditions. Degradation products
were initially dominated by ketones and alcohols but progressively altered to esters and acids,
especially at the margins of heavily impacted areas (see Zemo et. al 2016). Photo-oxidation of
petroleum compounds dissolved into the water column and sorbed into shallow sediment enhanced
the production of oxidized compounds and led to a noticeable increase in the mortality of benthic
and pelagic organisms during daylight hours (see Lee 2003). The degradation products caused
additional, acute and chronic effects to aquatic organisms. Acute impacts in these areas of the
release were primarily driven by the depletion of oxygen in the water, however.
Aerobic degradation and increasing enrichment of the petroleum with heavier weight compounds
continued at the surface where the oil was exposed to air. Loss of volatile compounds lead to a
progressive decrease in off gassing, although this was partially offset but the slow release of
volatile ketones, alcohols, aldehydes and other lightweight metabolites. Degradation of petroleum
trapped in soil above the water table progressively became dominated by anaerobic processes as
oxygen was depleted. This lead to the release of methane as well as alkanes generated by the
progressive breakdown of longer-chain hydrocarbons.
Groundwater impacted by the release in areas was dominated by polar metabolites. Studies at crude
oil release sites have found that reported levels of TPH in water based on standard, 8015M
extraction methods can underestimate the total amount of degradation products in water samples
by more than 50% (Bekins et al. 2016). The total concentration of parent compounds and
degradation products in water samples collected at the example site was instead estimated based
on the concentration of nonvolatile dissolved organic carbon (NVDOC) minus anticipated
background (see Bekins et. al 2016). The plume was slowly migrating away from the source area
and toward the marsh, characterized by an increasing proportion of acids and esters with increasing
distance from the source area. Concentrations of NVDOC exceed the screening level for aquatic
toxicity by well over an order of magnitude in the source area. Potential, additional impacts to the
aquatic community due to discharge of impacted groundwater into the marsh, including the
accumulation of hydrocarbon-related compounds in the organic-rich sediment, are being
monitored. The screening level is below natural background of NVDOC in more distal areas of
the plume, however, making tracking of petroleum-related metabolites more challenging.
Easily accessible, heavily contaminated soil, sediment and vegetation was removed. Booms and
sorbent pads were used to reduce further spread of LNAPL throughout the marsh. The short- and
long-term benefit of additional, active remedial measures versus allowing the remaining petroleum
to naturally degrade is currently under review. This includes bench-scale testing of aquatic toxicity
using both surface water and groundwater samples collected from the site.
TPH Risk Case Studies (HIDOH, October 2018)
Attachment 1: Example Case Studies
Case Study 4: Crude Oil Pipeline
58
1. Site Setting (Figure 4-1)
Pipeline transporting light crude to a refinery;
Estimated 260,000 gallons released following equipment malfunction at pump station
(Table 4-1);
Release flowed into a freshwater marsh not connected to other surface water bodies;
Strong vapors in vicinity of release;
Depth to groundwater = 0 to 5 feet;
Geology: Unconsolidated gravel, sand and silt;
No nearby development;
No groundwater supply wells within ½ mile;
Primary Contaminants of Potential Concern: TPH, PAHs, BTEX, naphthalene, petroleum-
related metabolites;
Status: Pipeline repaired and in use.
2. Initial Emergency Remedial Actions
Access road constructed from nearby highway;
Booms and sorbent pads used to recover and control further spread of LNAPL;
Carbon range data obtained for a sample of the released crude oil (see Table 4-1);
Air monitoring confirmed vapors dominated by C5-C12 aliphatics with lesser amounts of
aromatics and only trace amounts of benzene and other commonly targeted, individual
aromatic compounds (see Brewer et. al 2013);Easily accessible, grossly contaminated
vegetation, soil and sediment in the immediate area of the release removed;
Approximate lateral extent of soil, sediment and water contamination estimated based on
drone photographs and visual observations.
3. Initial Site Characterization (Figure 4-2)
Surface oil sheen dissipated within three months due to removal of LNAPL, off gassing
and dissolution of more soluble, degradation products into the marsh water;
Surface water, sediment, sediment pore water and upland groundwater data collected three
months after initial cleanup action confirm remaining contamination with degraded crude
oil (light fraction lost) and associated degradation products;
Surface water sheen dissipated by time of sample collection except at immediate edges of
marsh;
Visible, degraded petroleum adhered to vegetation at water edges;
Dissolved-phase TPH and TPH-related metabolites not detected above background in
surface water samples in absence of silica gel cleanup;
Aquatic toxicity screening level exceeded in some sediment pore water samples (Table 4-
3;
TPH Risk Case Studies (HIDOH, October 2018)
Attachment 1: Example Case Studies
Case Study 4: Crude Oil Pipeline
59
SGC data confirmed near total degradation of hydrocarbons in pore water to polar
metabolites (see Table 4-3);
Decision Units designated for collection of shallow sediment samples at the marsh water
edge and sediment and surface water from deeper marsh areas designated for collection of
samples using Multi Increment Sample investigation methods (see Figure 4-2; HIDOH
2016; see also ITRC 2012 “Incremental Sampling Methodology” guidance);
Carbon range data also collected for sediment samples;
TPH data for shoreline sediment samples exceed screening levels for toxicity to benthic
organisms (Table 4-2; see Figure 4-2);
The use of silica gel cleanup for testing of C9 and higher TPH fractions could have removed
degraded, petroleum-related compounds in the samples and caused the resulting data
biased low in terms of potential, aquatic toxicity;
Sediment sample data confirmed residual contamination with degraded crude oil (samples
tested for TPH carbon ranges);
TPH data for MIS samples for deeper sediment collected away from the shoreline areas
vary widely, with some areas within anticipated background for organic-rich sediment and
other areas significantly exceeding screening levels (Table 4-2; see Figure 4-2);
High Relative Standard Deviations (50-100%) between MIS replicate samples collected
within both shoreline and deep-water Decision Unit (see SS-5 and DS-5 in Figure 4-2)
indicate poor field precision of sample data and high variability of petroleum distribution
in the sediment (Table 4-2);
Sample data were nonetheless suggested ongoing, aquatic toxicity and was deemed
adequate for use in the overall assessment of impacts;
Monitoring well samples indicate contamination of shallow, underlying groundwater
within immediate vicinity if release and under the marsh area (Table 4-4);
Comparison of surface water and groundwater data with and without silica gel cleanup
suggest significant degradation of petroleum-related compounds (see Table 4-3 and Table
4-4);
Groundwater plume slowly migrating toward and discharging into marsh.
4. Potential Environmental Concerns (Figure 4-3)
Aquatic toxicity of degraded, polar compounds in groundwater and sediment pore water
assumed to be similar to parent compounds for initial screening purposes;
Comparison of sediment and groundwater data compared to initial, eco-based screening
levels for TPH and TPH carbon ranges suggests potential toxicity to aquatic flora and fauna
(Table 4-2 and Table 4-4);
Conceptual Site Model of potential environmental concerns (see Figure 4-3; post initial
remediation):
o Sediment:
TPH Risk Case Studies (HIDOH, October 2018)
Attachment 1: Example Case Studies
Case Study 4: Crude Oil Pipeline
60
Ecotoxicity (low concentrations but potential impacts to benthic organisms and
aquatic plants);
o Marsh Edge Vegetation:
Ecotoxicity (high concentrations of degraded oil adhered to plant matter, potential
impacts to aquatic birds, amphibians and insects, continued source for dissolution
of degradation products into shoreline water column and sediments);
o Groundwater (migration into marsh):
Aquatic toxicity (including sorption of TPH and related degradation compounds in
discharging groundwater to organic matter and buildup of contaminants in sediment
over time);
Gross contamination (strong odors or discharge of sheens into shoreline area
considered unlikely).
5. Additional Characterization and Remediation
Continued degradation and depletion of remaining hydrocarbons at marsh surface via
photo-oxidation and biodegradation anticipated;
Additional surface water, groundwater and sediment samples collected one year after
release indicated residual contamination dominated by polar, degradation compounds
Data to be used to assess potential long-term risk to marsh flora and fauna, including
benthic and pelagic organisms and aquatic birds, and need for additional, remedial actions;
Planned additional, near-term actions:
o Remove additional, grossly-contaminated sediment and aquatic plants from easily
accessible edges of the marsh;
o Use NVDOC to monitor groundwater plume boundaries and estimate total
concentration of petroleum-related metabolites;
o Identify and quantify short list of targeted polar compounds for to better assess
degradation state and indirectly assess potential aquatic toxicity (e.g., Method 8270
for acids/esters, alcohols, ketones, phenols from aromatic hydrocarbons and
aldehydes);
o Direct assessment of aquatic toxicity using groundwater from monitoring wells to
develop more site-specific, acute and chronic sediment and water screening levels;
o Use updated screening levels to optimize additional remedial actions.
6. Post Remediation Long-Term Management:
Preparation of Environmental Hazard Management Plan;
Continued, periodic removal of free product that appears along marsh edges;
Potential targeted treatment of impacted groundwater that exceeds acute toxicity screening
levels;
Potential slurry wall to prevent migration of acutely toxic groundwater into marsh; etc.
TPH Risk Case Studies (HIDOH, October 2018)
Attachment 1: Example Case Studies
Case Study 4: Crude Oil Pipeline
61
Semi-annual monitoring of surface water, sediment, groundwater and overall health and
rebound of marsh ecosystem;
Additional remediation in unrecovered areas of marsh to expedite habitat restoration as
needed.
Key Lessons Learned/Considerations:
1. Emergency response to spills in remote areas should consider nearby aquatic and benthic
communities.
2. CSM development should consider receptors and complex migration pathways in wetlands
and sensitive populations.
3. Engagement of Federal, State, Local and Tribal stakeholders is essential in remedial action
planning and management.
4. Alternate considerations beyond TPH (NVDOC etc.) are crucial in dealing with wetlands
and associated sensitive populations.
References
Bekins, B. A., Cozzarelli, I.M., Erickson, M.L., Steenson, R.A. and K.A. Thorn. 2016. Crude Oil
Metabolites in Groundwater at Two Spill Sites: Groundwater. Vol. 54 (5): 681-691.
September-October 2016. DOI: 10.1130/abs/2016AM-282491.
Brewer, R., J. Nagashima, M. Kelley, M. Heskett and M. Rigby. 2013. "Evaluation of Total
Petroleum Hydrocarbons in Vapor Intrusion Studies." Int. J. Environ. Res. Public Health 10:
2441-2467.
Chaplin, B. P., Delin, G. N., Baker, R. J. and Lahvis, M. A. 2002. Long-Term Evolution of
Biodegradation and Volatilization Rates in a Crude Oil-Contaminated Aquifer:
Bioremediation Journal. Vol 6 (3): 237-255. DOI: 10.1080/10889860290777594.
Eganhouse, R.P., Baedecker, M.J., Cozzarelli, I.M., Aiken, G.R., Thorn, K.A. and T.F. Dorsey.
1993. Crude oil in a shallow sand and gravel aquifer-II, Organic geochemistry: Applied
Geochemistry. Vol. 8: 551-567.
HIDOH. 2016. Technical Guidance Manual: Hawai′i Department of Health, Hazard Evaluation
and Emergency Response. August 2016.
HIDOH. 2017. Evaluation of Environmental Hazards at Sites with Contaminated Soil and
Groundwater – Tropical Pacific Edition (Fall 2017): Hawai‘i Department of Health, Hazard
Evaluation and Emergency Response.
ITRC. 2012. Incremental Sampling Methodology: Interstate Technological and Regulatory
Council. May 2012.
Lee. 2003. Photo-oxidation and Photo-toxicity of Crude and Refined Oils: Spill Science &
Technology Bulletin. Vol 8 (2), 157-162.
TPH Risk Case Studies (HIDOH, October 2018)
Attachment 1: Example Case Studies
Case Study 4: Crude Oil Pipeline
62
MADEP. 2007. Sediment Toxicity of Petroleum Hydrocarbon Fractions: Massachusetts
Department of Environmental Protection Office of Research and Standards, September 2007.
NAS. 2016. Spills of Diluted Bitumen from Pipelines: National Academy of Sciences, Division
on Earth and Life Studies. National Academies Press. Washington, DC.
Potter, T.L. and K.E. Simmons. 1998. Composition of Petroleum Mixtures: Total Petroleum
Hydrocarbon Criteria Working Group Series. Volume 2. May 1998.
USGS. 2006. Natural Bitumen Resources of the United States (National Assessment of Oil and
Gas Fact Sheet): U.S. Geological Survey. Fact Sheet 2006–3133. November 2006.
Wang, Z.D., Hollebone, B.P., Fingas, B., Fieldhouse, B., Sigouin, L., Landriault, M., Smith, P.,
Noonan, J. and G. Thouin. 2003. Characteristics of Spilled Oils, Fuels, and Petroleum
Products: 1. Composition and Properties of Selected Oils. United States Environmental
Protection Agency. EPA/600/R-03/072 July 2003.
Zemo, D.A., O’Reilly, K.T., Mohler, R.M., Magaw, R.I., Espino Devine, C., Ahn, S., and Tiwary,
A.K. 2016. Life Cycle of Petroleum Biodegradation Metabolite Plumes, and Implications for
Risk Management at Fuel Release Sites. Integrated Environmental Assessment and
Management. DOI: 10.1002/ieam.1848.

TPH Risk Case Studies (HIDOH, October 2018)
Attachment 1: Example Case Studies
Case Study 4: Crude Oil Pipeline
63
Table 4-1. Estimated carbon range makeup of
released crude oil (Wang et. al 2007).
Carbon Range
1
Percent
of Total
C5-C8 aliphatics
10.5%
C9-C18 aliphatics
22.9%
C18+ aliphatics
53.8%
C9+ aromatics
12.8%
Total: 100%
1. Estimated for fresh West Texas Intermediate, light crude oil (0%
weathered, see Attachment 3). Excludes C5-C8 aromatics (2.2% of
total with <0.5% benzene).

TPH Risk Case Studies (HIDOH, October 2018)
Attachment 1: Example Case Studies
Case Study 4: Crude Oil Pipeline
64
Table 4-2. Example replicate TPH carbon range data for shoreline and open water
(deep) sediment DUs (see Figure 4-2).
Carbon Range
1
Sediment
Screenin
g
Level
(mg/kg)
2
Replicate
3
Shoreline
Sediment DU
(mg/kg)
3
Deep
Sediment DU
(mg/kg)
C5-C8 Aliphatics 160
A ND ND
B ND ND
C ND ND
RSD: - -
4
C9-C18 Aliphatics 413
A 170 25
B 480 72
C 1,100 120
RSD: 81% 66%
C19-C36 Aliphatics 990
A 700 55
B 1,120 97
C 3,900 360
RSD: 91% 97%
5
C9-C10 Aromatics
23
A 90 9
B 120 14
C 480 53
RSD: 94% 95%
6
C11-C22 Aromatics 17
A 50 5
B 70 8
C 220 27
RSD: 82% 89%
Total TPH -
A 960 89
B 1,790 183
C 4,400 385
RSD: 77% 69%
1. Sediment screening levels published by MADEP (2007), adjusted to reflect 10% total organic carbon.
Individual screening levels do not consider potential cumulative effects.
2. Triplicate MIS sediment samples collected from independent increment locations within each DU (0-6”
depth, 30 increments per sample, 1-2kg final bulk sample weight); Student’s T test used to calculate Relative
Standard Deviation (RSD).
3. For example only. Impacts assumed to be heaviest at windblown areas of oil along shorelines. Triplicate
sample data indicated. Carbon range distribution for sediment samples reflects published data for highly
weathered, West Texas Intermediate, light crude oil (after Wang et. al 2017).
4. Average of MADEP (2007) sediment screening levels for C9-C12 and C13-C18 aliphatics indicated.
5. MADEP (2007) sediment screening levels for C9-C12 aromatics indicated.
6. Average of MADEP (2007) sediment screening levels for C13-C15 and C16-C24 aromatics indicated.
Note that the C11-C22 aromatics is not defined in terms of equivalent carbon and the laboratory method in
fact sums a much broader range of compounds.

TPH Risk Case Studies (HIDOH, October 2018)
Attachment 1: Example Case Studies
Case Study 4: Crude Oil Pipeline
65
Table 4-3. Comparison of sediment pore water data one year after
release to TPH aquatic toxicity screening levels (see Figure 4-2).
Chemical
Example Pore Water Data
3
Aquatic
Toxicity
Screening Level
(µg/L)
1
Maximum
(non-SGC)
(µg/L)
2
Maximum
(SGC)
(µg/L)
4
TPH
d
3,200 200 640
5
TDOC 5 ND 640
1. Sediment pore water data in absence of silica gel cleanup (SGC).
2. Sediment pore water data including silica gel cleanup (SGC).
3. For example only (HIDOH 2017). Aquatic toxicity of petroleum-related
metabolites assumed equal to parent compounds for initial screening purposes.
4. Reported concentration of TPHd usng Method 8015M.
5. Total dissolved organic carbon; assumed to reflect total concentration of
petroleum-related metabolites plus natural background. Background assumed
2-10 µg/L.
Table 4-4. Comparison of groundwater data one year after release
to TPH aquatic toxicity screening levels (see Figure 4-2).
COPC
Example Surface Water Data
3
Aquatic
Toxicity
Screening Level
(µg/L)
1
Maximum
(non-SGC)
(µg/L)
2
Maximum
(SGC)
(µg/L)
4
TPH
d
17,000 7,000 640
5,6
TDOC 50,000 21,000 640
1. Surface water data in absence of silica gel cleanup (SGC).
2. Surface water data including silica gel cleanup (SGC).
3. For example only (HIDOH 2017). Aquatic toxicity of petroleum-related
metabolites assumed equal to parent compounds for initial screening purposes.
4. Reported concentration of TPHd using Method 8015M estimated to represent
30% of total, petroleum-related parent compounds and metabolites in
groundwater (see Eganhouse et. al 1993; Bekins et. al 2016).
5. Total dissolved organic carbon; assumed to reflect total concentration of
petroleum-related metabolites plus natural background. Background assumed
2-10 µg/L based on testing of samples from offsite, unimpacted wells in the
absence of silica gel cleanup.
6. Total petroleum-related compounds assumed to be comprised of 58%
metabolites and 42% parent compounds (for example only; see Eganhouse et.
al 1993; Bekins et. al 2016).
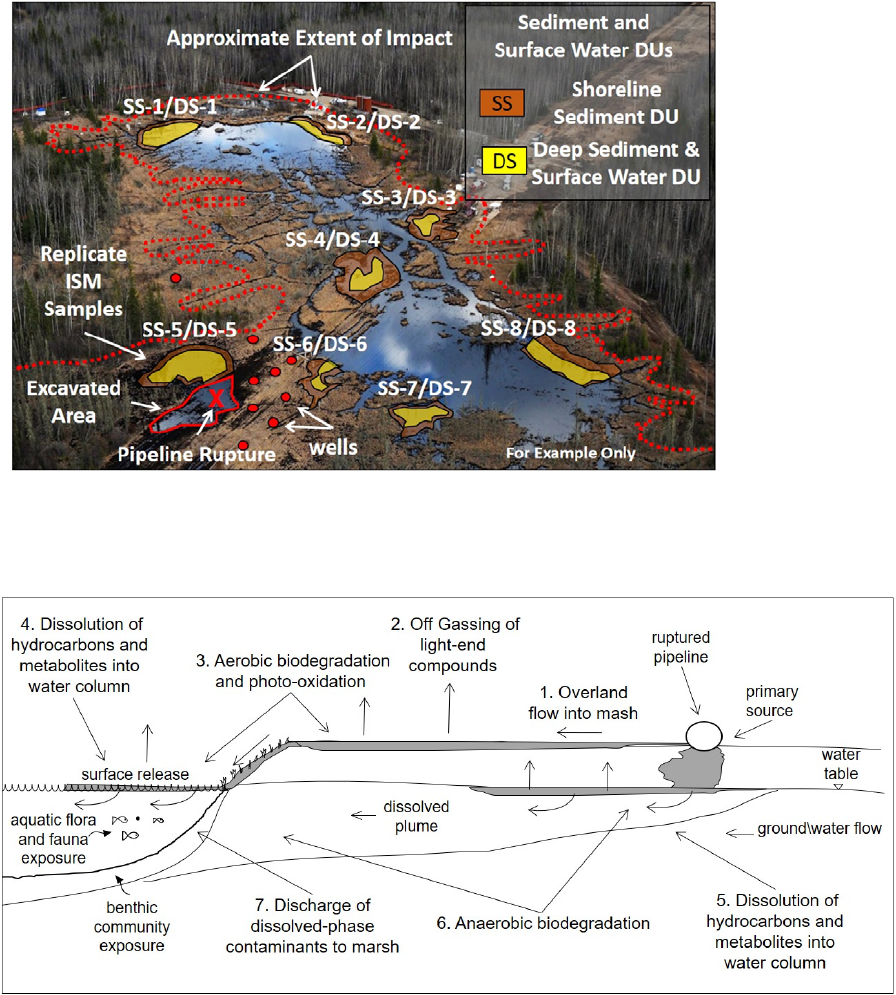
TPH Risk Case Studies (HIDOH, October 2018)
Attachment 1: Example Case Studies
Case Study 4: Crude Oil Pipeline
66
Figure 4-2. Extent of soil, sediment, surface water and groundwater contamination.
Figure 4-3. Conceptual site model of potential environmental concerns.

TPH Risk Case Studies (HIDOH, October 2018)
Attachment 1: Example Case Studies
Case Study 5: Oil and Gas Field
67
Case Study #5: Oil and Gas Field Exploration Site
Figure 5-1. Active oil and gas field.
Summary
This case study presents approaches for the assessment and remediation of petroleum-related
contamination at an oil and gas, exploration and production (E&P) site within a 3,000-acre, remote,
active cattle ranch.
The landowner discovered blackened, oily vegetation and LNAPL in surface soil in the area of the
former reserve pit several months after completion of the oil and gas well. The vertical portion of
the well had been drilled with water-based drilling fluid, while the horizontal portion of the well
had been drilled with oil-based drilling fluid similar to diesel. Solid drilling waste (drill cuttings)
from the well, which was coated with drilling fluids, had been buried in a poorly constructed, clay-
lined pit upon completion of the well. Oily vegetation and areas of LNAPL on the ground surface
around the pit were caused by improper management of the drilling waste during disposal, as well
as settling of the pit contents and degradation of the clay liner and cap.
The contamination was characterized through the development of a preliminary CSM, which was
further refined based on a source-receptor-pathway risk evaluation (Figures 5-2 through 5-4). The
impacts were then remediated to appropriate standards and restored to the satisfaction of the
regulatory agencies and site owner. Normal cattle ranching operations are currently ongoing.
Drill cuttings were consolidated and buried on-site within a clay-lined pit area adjacent to a
recently completed oil and gas well, in accordance with agency guidance. Initial site
characterization of soil and groundwater within the vicinity of the pit indicated the presence of
diesel impacts, crude oil impacts, and high-molecular weight organic compounds. LNAPL
migrated to the surface soils as the pit contents settled, resulting in uptake by vegetation.
and has resumed cattle ranching operations in the area
Topics addressed include site characterization using TPH and carbon range data in conjunction
with indicator compounds to assess and manage risk for source material, comparison to default
and development of site-specific screening levels, remediation of LNAPL impacted soils, and
groundwater impacts, and residual management. Ecological impacts were not quantified but
Relative Applicability:
- Active oil and gas fields;
- Drilling waste pits.
TPH Risk Case Studies (HIDOH, October 2018)
Attachment 1: Example Case Studies
Case Study 5: Oil and Gas Field
68
accounted for based on an evaluation of the CSM through land use, receptors and pathways (i.e.,
cattle operations and wildlife in consideration of surface water bodies).
Remedial actions were completed and the regulatory case closed with long-term management plan
and no future engineering or institutional controls under current operating conditions. Free-phase
LNAPL was removed using a vacuum truck and taken to an oil and gas waste disposal facility.
Lateral and vertical extents of contamination were determined. Localized impacts to groundwater
noted during site characterization but no impacts to surface water bodies identified. In situ
solidification/stabilization was implemented for approximately 1,800 cubic yards of drill cuttings
and contaminated soil. Post-remediation sample data and leachate analysis demonstrated that the
site met all performance criteria required by the state oil and gas agency and was based on ITRC
guidance on solidification/stabilization (ITRC 2011). The landowner was satisfied with the remedy
1. Site Setting
• Recently drilled and completed oil and gas production well located on a cattle ranch;
• Well Depth: 11,000 ft bgs, extending over 7,500 ft;
• Oily waste burial pit area dimensions approximately 80 ft x 40 ft, 10 ft deep;
• Pipelines for crude oil, natural gas and produced water run from the well across the
property;
• No foreseeable change in land use;
• > 10 miles from nearest community / population center;
• Within ½ mile from nearest surface water body;
• Freshwater well located on ranch used for irrigation and cattle;
• Depth to groundwater: 15 ft.;
• Geology: Sandy silt loam with gravel to 20 ft. bgs; underlain by fractured limestone and
shale bedrock to greater than 50 ft bgs;
• Vegetation: Mesquite, cactus, various grasses and shrubs;
• Primary Hydrocarbon Types: Diesel (TPHd) and minor crude oil;
• Primary COPCs: TPHd, BTEX;
• Regulatory jurisdiction: State oil and gas regulatory agency;
• Impacted media: Soil and groundwater.
•
2. Site Characterization
LNAPL extent was horizontally and vertically delineated, prior to pumping and hauling.
Delineation and soil sampling indicated that, due to the flat topography of the land in the
vicinity of the well, the LNAPL plume was contained within 1,000 feet of the burial pit
and had not migrated to any surface water bodies (pathway incomplete);
Default, TPHd soil screening level of 220 mg/kg used to characterize lateral and vertical
extent of contamination (based on lowest screening levels for TPHd under an unrestricted,
future land use; see Attachment 4);
Representative samples of drill cuttings collected to characterize source material;
Representative soil samples were collected to delineate burial pit, lateral extent, and
vertical extent of contamination;
Samples of burial pit liner and cap also collected (see Table 5-1). Vertical extent of
contamination in soil was observed approximately 2 ft. above the groundwater table;
TPH Risk Case Studies (HIDOH, October 2018)
Attachment 1: Example Case Studies
Case Study 5: Oil and Gas Field
69
Groundwater samples were collected from temporary monitoring wells;
Vapor intrusion risk determined to be negligible due to lack of structures and incomplete
pathway based on current and future land use;
Drill cuttings, soil, and groundwater samples were analyzed for TPH (plus BTEX,
chlorides and heavy metals);
TPH was analyzed by mass using Texas Commission for Environmental Quality (TCEQ)
Method 1005 for specific carbon ranges (C6-C12, C12-C28, and C28-C36 aromatic and
aliphatic ranges; see Tables 5-2 and 5-3);
TPH dominated by diesel range (C6-C28) aliphatics, reflecting bulk chemistry of drilling
fluid;
Minor proportion of C28-C36 compounds identified assumed to be associated with crude
oil residue and higher-molecular weight organic additives in both the water-based and oil-
based drilling fluids.
3. Potential Environmental Concerns
Initial CSM and potential environmental concerns:
o Solid drill cuttings leaching into groundwater, resulting in LNAPL migration and
dissolved / emulsified impacts;
o Runoff and contamination of surface water from LNAPL and contaminated surface
soil, impacting aquatic and benthic life;
o Direct exposure to humans and cattle, including dusting of contaminated surface soils
during frequent dry periods;
o Vegetative uptake observed; potential ingestion by cattle.
Cuttings, soil, and groundwater data compared to default agency TPH screening levels for
targeted carbon ranges (C6-C12, C12-C28, C28-C36):
o Reported concentration of TPH (C6-C12) and TPH (C12-C28 TPH) in soil and drill
cuttings exceeded screening levels;
o Groundwater samples for TPH at the temporary monitoring wells were near screening
levels, indicating a slight impact to groundwater in the vicinity of the burial pit.
Comparison of data with and without silica gel cleanup indicated that contamination at
the perimeter of the plume was dominated by TPH-related, polar metabolites;
Analysis of site geology and soil properties indicated leaching pathways to groundwater;
Land use in vicinity of well to remain constant through term of oil and gas lease (30 years);
Vapor intrusion risk not a concern based on current and anticipated land use and not
assessed (i.e., represents an incomplete pathway).
4. Site Remediation and Redevelopment
Remedial objectives:
o Reduce/eliminate TPH risk to humans and cattle, including impacts to vegetation;
o Reduce/eliminate TPH migration to groundwater and surface water.
Risk management alternatives evaluated:
o Pump LNAPL and haul to oil and gas waste disposal facility, and implement monitored
natural attenuation of soil and groundwater;
o Pump LNAPL and haul to oil and gas waste disposal facility, excavate and haul drill
cuttings and contaminated soil to oil and gas disposal facility;
TPH Risk Case Studies (HIDOH, October 2018)
Attachment 1: Example Case Studies
Case Study 5: Oil and Gas Field
70
o Pump LNAPL and haul to oil and gas waste disposal facility, excavate and haul drill
cuttings and contaminated soil to thermal desorption facility, and haul thermally
desorbed solids and fuel material to oil and gas operator for reuse;
o Pump LNAPL and haul to oil and gas waste disposal facility, Immobilize TPH in soil
and drill cuttings with solidification / stabilization;
o Pump LNAPL and haul to oil and gas waste disposal facility, excavate and haul drill
cuttings and contaminated soil to landfarming facility for bioremediation.
The selected remedy was to pump LNAPL and haul to the nearest oil and gas waste disposal
facility and to immobilize TPH and other constituents (e.g., benzene and heavy metals) in
the soil and drill cuttings with solidification/stabilization;
Remedy selection was made to optimize risk reduction, economics and satisfy landowner
concerns;
Remediation construction phase CSM and potential environmental concerns:
o Direct worker exposure (TPHd);
o Dusting of contaminated surface soils (TPHd).
Post-Remediation CSM and potential environmental concerns:
o Negligible post-remediation environmental concerns; no residual TPH impacts (see
Table 5-4);
o TPH (C6-C36) immobilized in stabilization/solidification monolith. Reduced TCEQ
1005 7-day leachate to less than 100 mg/L;
o Leachate testing using Leaching Environmental Assessment Framework (LEAF)
Method 1315 demonstrated anticipated reduction in TPH and benzene mass flux over
time (USEPA 2010, 2012);
o Performance criteria for compaction strength: 7-day: 35 psi, 30-day: 50 psi.
Exposed, surface soils remediated to default, 220 mg/kg TPHd screening level to address
all potential concerns under any future land use scenario;
Site-specific TPH screening level of 1 mg/L developed for drinking water
based on assumed primary use by cattle rather than ranch workers;
Site-specific screening level of 100 mg/L developed for soil leachate, based
on assumptions regarding rainfall, soil permeability, mixing and dilution of
leachate in groundwater, natural biodegradation during plume migration,
distance to existing well and existing groundwater monitoring data;
Site-specific TPH cleanup level for subsurface soil of 10,000 mg/kg developed based on
results of solidification/stabilization efforts and resulting leachate data (soil with >10,000
mg/kg TPH excavated and disposed of at regulated landfill);
Screening levels assume that groundwater is a current or potential source of drinking water
for cattle or irrigation water;
Environmental Hazard Management Plan prepared for long-term management of residual,
contaminated soil and groundwater;
Since the contaminated area is greater than ½ mile from the nearest property boundary, and
greater than 10 miles from the nearest population center, public outreach beyond the
landowner was deemed unnecessary;
Communication and coordination involved the landowner, oil and gas operator, state oil
and gas regulatory agency, consultants and contractors.
TPH Risk Case Studies (HIDOH, October 2018)
Attachment 1: Example Case Studies
Case Study 5: Oil and Gas Field
71
5. Post Construction Long-Term Management:
State oil and gas regulatory agency determined no further action necessary based on criteria
set forth in a memorandum of understanding (MOU) with state environmental regulatory
agency;
Position of stabilization/solidification monolith recorded and filed with state oil and gas
agency;
Future wells or pipelines would be located away from the monolith;
Post-construction samples analyzed at 6 months and 1 year for performance criteria
o All 6-month and 12-month samples met performance criteria. Further long-term
monitoring determined unnecessary;
o TPH levels at temporary monitoring wells attenuated from near screening levels to well
below screening levels.
Key Lessons Learned/Considerations:
1. Releases outside of major urban centers present a different set of challenges and concerns;
2. Initial CSM should consider all media and complete/incomplete pathways. CSM changed
significantly from pre- to post-characterization;
3. Consider use of both TPH and indicator compounds such as BTEX, along with a thorough
understanding of the TPH source;
4. Implement proper drilling waste management/remediation practices;
5. Account for TPH characteristics, including the potential for liner degradation;
6. Pore pressure and settling can lead to the LNAPL presence and downward migration;
7. Consider the potential for eco-risks (site use and discovery of the release indicated a need
to account for potential impacts to cattle and vegetation);
8. Stakeholder engagement critical since landowner discovered and reported the release;
9. Organic additives in drilling fluids often show up as TPH; a thorough understanding of oil-
based and water-based drilling fluids used in oil and gas sites is necessary (i.e., above and
beyond the Material Safety Data Sheets);
10. Biodegradation alone could not be relied on due to the presence and high concentrations of
constituents in drilling fluids that inhibit or retard biodegradation, such as salts and high-
molecular weight, organic compounds, as well as anaerobic conditions;
11. Consider the presence of non-petroleum compounds that are often commingled in drilling
fluids used at oil and gas sites (e.g., presence of heavy metals and other inorganics required
the selection of a stabilization/solidification that allowed for chemical fixation);
12. Representative sampling of all media is critical in site characterization;
13. Select remedies, when feasible, to enable flexibility in future landuse considerations.
14. Pre-established default screening levels can expedite remediation decisions, especially
when incorporated into regulations;
15. Development of site-specific screening levels based on soil and groundwater conditions,
site use, etc., allows for flexible and appropriate remedial decisions.
TPH Risk Case Studies (HIDOH, October 2018)
Attachment 1: Example Case Studies
Case Study 5: Oil and Gas Field
72
References:
ITRC. 2011. Development of Performance Specifications for Solidification/Stabilization:
Interstate Technology and Resource Council. July 2011.
USEPA. 2010. Background Information for the Leaching Environmental Assessment Framework
(LEAF) Test Methods: U.S. Environmental Protection Agency. EPA/600/R-10-170. December
2010. Washington, DC.
USEPA. 2012. Method 1315 - Mass Transfer Rates of Constituents in Monolithic or Compacted
Granular Materials Using a Semi-Dynamic Tank Leaching Procedure. U.S. Environmental
Protection Agency. October 2012.

TPH Risk Case Studies (HIDOH, October 2018)
Attachment 1: Example Case Studies
Case Study 5: Oil and Gas Field
73
Table 5-1. TPH carbon range data for drill cuttings (source material
soil).
Carbon Range
Example
Concentration
(mg/kg)
Percent
of Total TPH
C6-C12 22,500 19%
C12-C28 95,000 81%
C28-C36 460 <1%
Total: 117,960 100%
Table 5-2. Comparison of drill cuttings (source material) and impacted soils to
example soil TPH screening levels.
COPC
Example
Source
Material
Data
(mg/kg)
Example Soil
Data
(mg/kg)
1
Tier 1 TPH
Screenng
Level
(mg/kg)
2
Site-Specific
TPH
Screening
Level
(mg/kg)
TPHd 118,000 38,600 220 10,000
1. Based on lowest screening levels for TPHd under an unrestricted, future land use; applied to exposed soil
(see Attachment 4).
2. Site-specific TPH screening level based on results of soil stabilization and leachate testing; applied to
capped soils. Assume that groundwater is a current or potential source of drinking water for cattle or irrigation
water.

TPH Risk Case Studies (HIDOH, October 2018)
Attachment 1: Example Case Studies
Case Study 5: Oil and Gas Field
74
Table 5-3. Comparison of groundwater data to example drinking water TPH
screening levels.
COPC
1
Example
Groundwater
Data
(without SGC)
(mg/L)
1
Example
Groundwater
Data
(with SGC)
(mg/L)
2
Tier 1
Drinking
Water
Screening
Level
(mg/L)
2
Site-Specific
Drinking
Water
Screening
Level
(mg/L)
TPH 5.0 0.50 0.40 1.0
1. Example groundwater data with and without silica gel cleanup.
2. For example only. Tier 1 screening level based on default, toxicity and taste and odor concerns for
undegraded diesel (see Table 13 in Attachment 4). Site-specific screening level assumes dominarion of
contaminants in groundwater by low-volatility, polar degradation compounds at well head and primary use
by cattle rather than ranch workers.
Table 5-4. Comparison of post-remediation 7-day
leachate test data to post-remediation leachate
standards.
COPC
Example
Leachate
Data
(mg/L)
1
TPH
Leachate
Screening
Level
(mg/L)
TPH 4.35 100
1. For example only. Site-specific leachate screening level
includes assumptions regarding site-specific rainfail, soil
permeability, natural biodegradation, mixing and dilution in
groundwater, distance to well and existing groundwater
monitoring data. Assumes that groundwater is a current or
potential source of drinking or irrigation water.
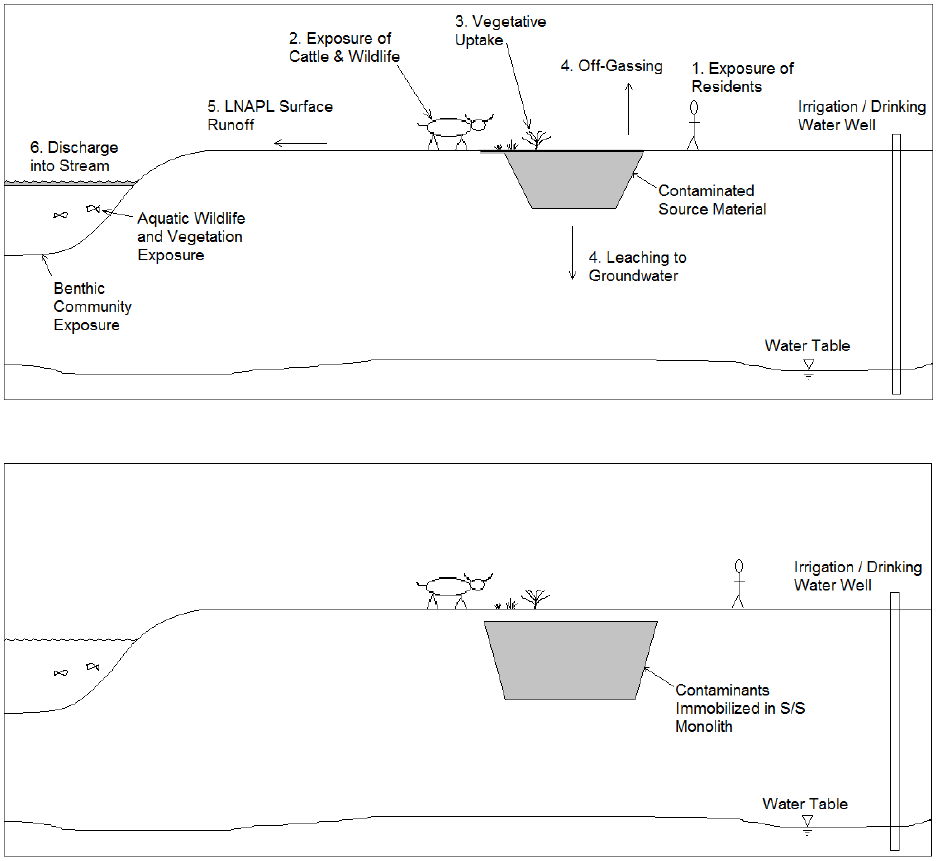
TPH Risk Case Studies (HIDOH, October 2018)
Attachment 1: Example Case Studies
Case Study 5: Oil and Gas Field
75
Figure 5-1. Preliminary Conceptual Site Model.
Figure 5-2. Post- Remediation Conceptual Site Model
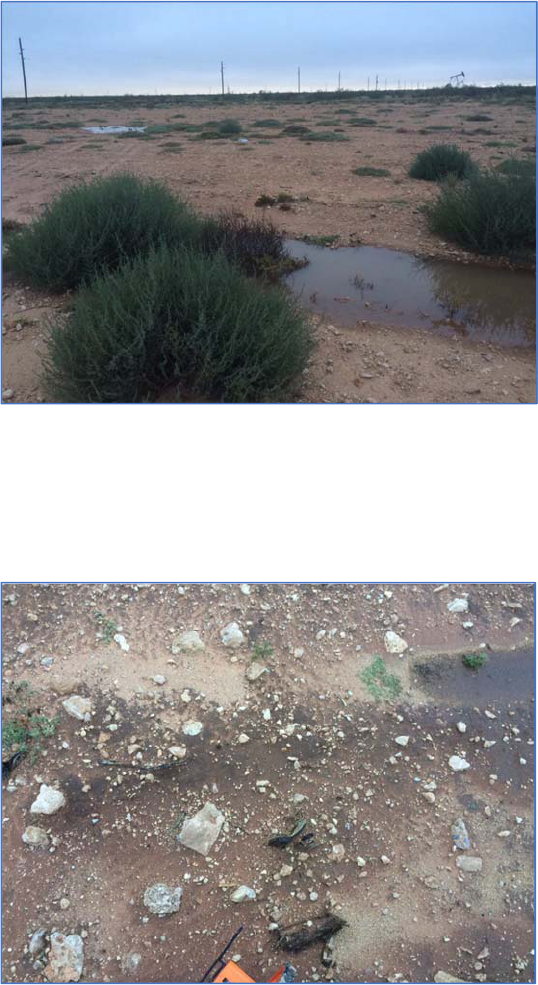
TPH Risk Case Studies (HIDOH, October 2018)
Attachment 1: Example Case Studies
Case Study 5: Oil and Gas Field
76
Figure 5-3. Site Location – Overview (another active
well in the background).
Figure 5-4. TPH impacted soil near clay-lined pit.
TPH Risk Case Studies (HIDOH, October 2018)
Attachment 2 - Release Site Categories
77
Attachment 2
Categories of Petroleum Release Sites
TPH Risk Case Studies (HIDOH, October 2018)
Attachment 2 - Release Site Categories
78
Attachment 2. Categories of Petroleum Release Sites
TPH Assessment/Risk Evaluation and Remediation sites can be broadly classified under the
following categories:
A. Operational Basis:
1 Oil and Gas Production Fields
2 Refineries
3 Fuel Tank Farms (including offsite pipelines)
4 Service Stations
5 Small Industry/Commercial
6 Residential (heating oil etc.)
7 Special cases (environmental covenants, construction sites etc.)
B. Investigation/Remediation Status:
1. Active
a. Assessment/Characterization
b. Risk Evaluation
c. Remediation
2. Closed /Inactive
a. Post-closure
b. Brownfields
3. Other/Special Considerations (sites with no current exposure/risk):
a. Short-Term Disturbance of Contaminated Soil or Groundwater
(e.g., utility installation/repair or property redevelopment)
b. Impacts to Adjacent Properties
c. Methane Buildup
d. Presence of Free Product
C. Source Basis (Fuel Release Type):
1 Crude Oil
2 Gasoline
3 Diesel/Jet Fuel
4 Petroleum Mixtures
5 Special Cases (e.g., commingled releases of TPH and non-TPH)
D. Impacted Media (“pathways”):
1 Soil
2 Sediment
3 Soil Vapor
4 Indoor/Outdoor Air
5 Groundwater
6 Surface Water
TPH Risk Case Studies (HIDOH, October 2018)
Attachment 2 - Release Site Categories
79
E. Potential Environmental Concerns:
1 Soil:
a. Direct Exposure (ingestion, inhalation, dermal contact)
b. Leaching and Contamination of Groundwater
c. Vapor Intrusion (impacts to indoor air)
d. Ecotoxicity (terrestrial flora and fauna)
e. Gross Contamination (short-term strong vapor emissions, odors, sheens, fire hazards,
etc.)
2 Groundwater:
a. Direct Exposure (drinking water toxicity)
b. Vapor Intrusion (indoor air)
c. Aquatic Toxicity (flora and fauna, including impacts to sediment and discharges to
surface water)
d. Gross Contamination (short-term strong vapor emissions, odors, sheens, fire hazards,
etc.)
F. Other Considerations:
1 Petroleum Mixtures
2 Special Cases (e.g., commingled releases of TPH and non-TPH)
TPH Risk Case Studies (HIDOH, October 2018)
Attachment 3 - Potential Environmental Concerns
80
Attachment 3
Potential Environmental Concerns
TPH Risk Case Studies (HIDOH, October 2018)
Attachment 3 - Potential Environmental Concerns
81
1. Introduction
The case studies incorporate multiple, common environmental concerns associated with releases
of petroleum to soil, groundwater and surface water. These potential concerns include (HIDOH
2017; see also MADEP 1994, 1996, 2002, 2014; CAEPA 2016):
Soil:
● Direct-exposure threats to human health;
● Intrusion of subsurface vapors into buildings;
● Leaching and subsequent threats to groundwater resources;
● Threats to terrestrial habitats;
● Gross contamination and general resource degradation concerns;
Groundwater:
● Threats to drinking water resources;
● Threats to aquatic habitats;
● Intrusion of subsurface vapors into buildings;
● Gross contamination and general resource degradation concerns.
An overview of common human health and environmental concerns posed by potential releases of
petroleum to soil, air and water is provided below.
2. Human Direct Exposure
Acute human health risks associated with exposure to petroleum are normally limited to short-
term inhalation of very high concentrations of petroleum-related compounds in air. Screening
levels used to identify potential short-term hazards posed by heavily-contaminated soil and water
are discussed under “Gross Contamination.”
Chronic exposure or regular exposure over many years to petroleum-related contamination in soil,
water and air. Direct exposure for humans can occur through incidental ingestion of small amounts
of soil (for example, from dirty hands), drinking water contaminated with petroleum, inhalation of
vapors or dust emitted from soil or vapors emitted from tapwater, and exposure to chemicals via
absorption through the skin. Refer to the United States Environmental Protection Agency
(USEPA) Regional Screening Levels (RSL) guidance document for an overview of factors
considered in direct exposure models (USEPA 2017). Refer also the discussion of direct-exposure
screening levels presented in Attachment 4.
3. Vapor Intrusion
An in-depth discussion of potential vapor intrusion risks posed by petroleum-contaminated soil
and groundwater is provided in the Interstate Technology and Regulatory Council (ITRC)
document Petroleum Vapor Intrusion (ITRC 2014; see also USEPA 2015, HIDOH 2016, 2017).
The risk-based use of Total Petroleum Hydrocarbon (TPH) and carbon range data in “Petroleum
Vapor Intrusion (PVI)” investigations is not discussed in detail in the 2014 ITRC document,
beyond a brief summary of the chemistry and toxicity of petroleum vapors is provided in in
Appendix C. Members of the group were aware that preparation of a separate, ITRC document on
“TPH Risk” was pending. As previously introduced, publication of this document is anticipated in
2019 and represents a followup to the 2014 document (ITRC 2018).
TPH Risk Case Studies (HIDOH, October 2018)
Attachment 3 - Potential Environmental Concerns
82
Understanding both the chemistry and fate and transport of petroleum vapors is key to assessing
potential risk under a given, release scenario. Refer to Appendix C in the 2014 ITRC document
and Brewer et al. (2013) and the references provided within these documents for a detailed
discussion of the chemistry and toxicity of petroleum vapors. Refer also to example TPH air and
soil vapor screening levels presented in Attachment 4.
Vapors emitted from petroleum fuels are typically grouped into four carbon ranges based on
physiochemical and toxicity characteristics: 1) C2-C4 aliphatic compounds, 2) C5-C8 aliphatic
compounds, 3) C9-C18 aliphatic compounds and 4) C9-C16 aromatic compounds. Vapor
composition varies with respect to the type of the fuel released and subsequent fate and transport
processes within and away from the source area.
Vapors associated with fresh gasoline are normally dominated by C2-C4 and C5-C8 aliphatic
compounds, with only a minor component (<5%) of benzene, toluene, ethylbenzene and xylenes
(BTEX) and non-specific aromatic compounds. Vapors associated with weathered fuel, as is the
case at most gasoline-release sites, are dominated by C5-C8 aliphatics with little to no C2-C4
aliphatics remaining and again a relatively minor component of BTEX and non-specific aromatic
compounds.
Vapors associated with middle distillate-release sites, including diesel, kerosene and jet fuels, are
normally dominated by C5 to C12 aliphatics, again with only a minor component of aromatics.
Although sometimes mistakenly assumed to be “non-volatile,” the volatility of these fuels is
obvious in the field by strong odors emitted from contaminated soil and groundwater. The
proportion of less toxic, C5-C8 aliphatics to more toxic, C9-C12 aliphatics and aromatics can vary
widely between sites, however (refer to Attachment 4; see also Brewer et al. 2013; ITRC 2014).
Although still potentially significant, vapor emissions from middle distillate release sites tends to
be an order of magnitude lower than for gasoline-contaminated for the same volume and
magnitude of contamination (see Brewer et al. 2013).
These compounds are collectively measured in soil vapor as total “TPH” or as individual carbon
ranges. Although less toxic in relative terms than individual, aromatic compounds such as benzene
and naphthalene, it is possible for aliphatic compounds in soil vapor to still pose a potential vapor
intrusion risk even though concentrations of individual, aromatic compounds are below levels of
potential concern (Brewer et al. 2013). This is due to the high proportion of these compounds in
petroleum vapors. This is almost always the case for releases of middle-distillate fuels that contain
initially low proportions of commonly targeted, aromatic compounds. This can also be the case for
more recent (post 2005) releases of gasoline that contained reduced proportions of benzene in
comparison to earlier formulations as well as older releases where aromatic compounds have been
preferentially removed from soil vapors, for example by dissolution into soil moisture.
As utilized in the case study examples, consideration of both TPH data and individually targeted
compounds is therefore important to assess potential vapor risks at petroleum-release sites. Non-
chlorinated, petroleum compounds are, however, highly susceptible to biodegradation. The degree
and predictability of degradation can vary between and even within individual sites. This limits
the use of models to predict the transport and attenuation of petroleum vapors away from source
zones and the ability to develop reliable screening levels for total TPH or specific TPH carbon
ranges in any media other than shallow or subslab soil vapor.
TPH Risk Case Studies (HIDOH, October 2018)
Attachment 3 - Potential Environmental Concerns
83
The consideration of “separation distance” and the subsequent collection and assessment of site-
specific field data, as needed, is therefore critical. Field studies have suggested that fifteen to thirty
feet of clean soil (e.g., TPH <100 mg/kg) is adequate to reduce vapor concentrations to below
levels of concern for potential vapor intrusion hazards, regardless of the mass, concentration or
chemical makeup of petroleum in soil or the presence of free product on groundwater (Abreu et.
al 2009, ITRC 2014; McHugh 2010; USEPA 2013). The USEPA (2015) guidance suggests that a
separation distance of approximately 5 feet for dissolved-phase hydrocarbons and 15 to 30 feet for
free product or “Light, Non-Aqueous-Phase Liquid (LNAPL)” sources, respectively, is adequate
to mitigate significant, vapor intrusion risk at most sites for TPH and individual, aromatic
compounds such as BTEX. The risk of adverse, vapor intrusion significantly increases for
buildings separated from petroleum sources in soil and groundwater by less than these distances.
A recent, expanded review of soil vapor data for TPH carbon range soil vapor data collected at
gasoline-release sites conclude that a separation distance of just 7 feet is adequate to minimize
potential PVI risks associated with these compounds (Lahvis 2018). A review of data for Total
TPH in the same paper, in contrast, compared favorably with studies of the USEPA database that
recommend a separation distance of at least 15 feet. The author speculates that the carbon range
data are more reliable and that, for unstated reasons, standard test methods for Total TPH in air
and soil vapor samples consistently and significantly overestimate the actual, total concentration
of petroleum-related compounds present in comparison to the sum of carbon range data (e.g.,
methods TO-3, TO-15, TO-17). If true, then this has significant implications for continued use of
these lab methods and associated data in PVI investigations. Although preliminary, this
observation does indeed seem to be true for estimation of total TPH in diesel-related vapors at sites
tested by the HIDOH. This is noted in the case studies and recommendations on the use of carbon
range data made for final decision making purposes.
An alternative interpretation, however, is simply that the soil vapor carbon range data available for
review by Lahvis (2018) was inadequate to be representative of actual field conditions and that
additional data would show comparable results with Total TPH and further support at 15-foot
vertical separation distance. Roughly three times more sample data were available for total TPH
than carbon ranges. Past reviews of paired carbon range and Total TPH data have indicated a
reasonable correlation between total carbon range and total TPH data for the same soil vapor
samples, but data are again limited (HIDOH 2012; Brewer et al. 2013). Resolution of this issue
requires a more detailed review of paired carbon range and total TPH data to see if such a persistent
discrepancy does indeed exist.
The collection of soil vapor data is recommended in cases where there is insufficient vertical
separation between a building and vapor source in soil or groundwater. Examples of this approach
are incorporated into Case Studies #1 and #2. Relatively inexpensive and more easily attainable,
Total TPH data can be compared to TPH soil vapor screening levels for specific fuel types for
initial, PVI assessment purposes (see Attachment 4). More detailed, carbon range data are
recommended for final, decision making purposes at sites where potentially adverse, PVI
conditions are initially identified. This is especially true for vapors associated with releases of
middle distillate products such as diesel, kerosene and jet fuels, due to improved quantification
and less certainty in the carbon range makeup and overall toxicity of the vapors. The carbon range
makeup of gasoline-related vapors is, in contrast, more predictably dominated by C5-C8 aliphatics
(see Attachment 4). Consideration of carbon range data is also important for testing of indoor air,
TPH Risk Case Studies (HIDOH, October 2018)
Attachment 3 - Potential Environmental Concerns
84
due to the likely presence of multiple, indoor and outdoor sources of similar vapors that can
confound quantification of potential PVI risks.
4. Terrestrial and Aquatic Ecotoxicity
Risks posed to terrestrial and aquatic flora and fauna by exposure to petroleum impacts occurs in
a similar manner as described above for humans. Ecological risk posed to terrestrial and aquatic
life can vary dramatically, however, due to differences in sensitivities of individual species. An
ecological risk assessment specific to the habitat and flora and fauna of interest is generally
required to determine potential short-term and long-term, detrimental effects posed by exposure to
releases of petroleum.
5. Leaching from Soil
Leaching of petroleum-related contaminants from soil and subsequent impacts to groundwater can
pose significant environmental concerns under some site scenarios. Soil screening levels
developed for potential leaching and groundwater impact concerns are often much lower than
screening levels developed for direct exposure concerns. In this sense, leaching can “drive risk”
for initial screening of petroleum contamination. Models used to derive soil screening levels for
leaching of petroleum-related contaminants from soil can be excessively conservative and should
be used with caution. Direct monitoring of groundwater should be carried out as an alternative
when practical, for example in cases where contamination is present in uncapped soil over shallow
groundwater or the main mass of contaminated soil is in direct contact with the water table.
Overview of Soil Leaching Models
The models most commonly used to assess leaching of chemicals from soil at petroleum
contaminated sites are relatively simple in concept (Anderson 1992, MADEP 1994, ASTM 1998,
USEPA 2002). Equilibrium partitioning equations are used to estimate the dissolved-phase
concentration of a chemical in soil moisture or “leachate” in the source area, based on the input,
total concentration of the chemical soil, the input soil properties (for example, total organic carbon,
soil moisture, etc.) and the physiochemical nature of the target chemical. Temporary resorption of
organic chemicals to organic carbon (and clay) in vadose-zone soils impedes downward migration
of the chemical in comparison to the migration rate of the leachate itself but does not halt its
movement (referred to as the “retardation time”). This controls both the time it takes for the
contaminant to reach the groundwater and the mass of the chemical entering the groundwater over
a given time period. For example, gasoline-derived TPH in leachate can be expected to migrate
faster to groundwater than diesel-derived TPH, due to the decreased tendency of lower-molecular
weight hydrocarbons to sorb to soil particles.
Dilution and a reduction of chemical concentrations take place as the leachate migrates into and
mixes with groundwater. The ultimate concentration of the target chemical in groundwater
immediately beneath the source area is based on the ratio of the volume of infiltrating rainfall to
the volume of groundwater passing beneath the impacted area during a same time period and an
assumed mixing depth of the leachate in groundwater.
Leaching based screening levels for soil are generated by running a leaching model “backwards.”
The target groundwater concentration for a chemical is entered into the model, along with assumed
soil properties and physiochemical parameters for the chemical. The model calculates an
TPH Risk Case Studies (HIDOH, October 2018)
Attachment 3 - Potential Environmental Concerns
85
equivalent concentration of the chemical in leachate within the source area. This is then used to
calculate an equivalent, total concentration of the chemical in source area soil. The leaching models
are typically one-dimensional and do not consider the actual mass of the chemical entering the
groundwater or the size of the plume generated. Only concentration is considered. The models
cannot directly distinguish between the risks posed by leaching of TPH from a handful-size mass
of contaminated soil versus a football field-size mass of contaminated soil.
The most simplistic leaching models do not directly consider the full fate and transport of the
chemical in leachate as the leachate migrates downward through the vadose zone. This includes
the model presented in the original ASTM Risk-Based Corrective Action guidance (ASTM 1998)
as well as the USEPA Soil Screening Levels (SSL) guidance (USEPA 2002). Only dilution of the
leachate upon mixing with groundwater is considered. A default “dilution” factor of twenty is
typically applied to the calculation. This is highly conservative for chemicals that are volatile
and/or susceptible to degradation, including TPH and most other petroleum-related chemicals. For
example, the soil leaching screening level for benzene presented in the USEPA Regional Screening
Level (RSL) guidance is 2.6 µg/kg, based on a target groundwater concentration of 5 µg/L, the
Maximum Contaminant Level (MCL) standard for drinking water. For comparison, the USEPA
screening level for residential, direct exposure to benzene in soil (incidental ingestion, dermal and
vapor emission to outdoor air) is 1.2 mg/kg, 500 times higher. Although site-specific field studies
are not routinely carried out, the USEPA screening level for leaching of benzene (and most
chemicals) is almost certainly excessively conservative and not useful for general screening
purposes. In practice, the “SSLs” in the USEPA RSL guidance are largely ignored. This is not
technically supportable, however, since under some scenarios leaching of TPH and other
petroleum-related contaminants from soil could pose a significant threat to drinking water
resources as well as nearby, aquatic habitats.
A more robust but still relatively simplistic model is used by several states to generate soil
screening levels for leaching concerns. Multiple runs of the leaching model “SESOIL” combined
with the groundwater fate and transport model “AT123D” were used to generate a simple
algorithm that correlates a chemicals sorption coefficient and Henry’s Law constant to a target
groundwater concentration and the total concentration of the chemical in source area soil
(Anderson 1992, MADEP 1994). The SESOIL model considers resorption of compounds to soil
as well as the loss of volatile compounds from leachate during downward migration. The leaching
scenario used to develop the algorithm incorporates a three-meter thick vadose zone characterized
by one meter of impacted soil sandwiched between two one-meter thick layers of clean soil. A
highly permeable, low organic carbon soil was assumed, as was a moderately high, annual rainfall
infiltration rate of 720 mm (28 inches). The AT123D application models mixing of leachate with
groundwater immediately below the impacted area. Mixing with groundwater was modeled over
a ten-meter by ten-meter area, with an assumed mixing depth of two meters.
Several states use the SESOIL-AT123D algorithm to derive soil screening levels for leaching
concerns (for example, MADEP 1994, 2014; CAEPA 2016; HIDOH 2017, NJDEP 2008). The
screening levels are highly conservative for most site scenarios, except perhaps where the soil is
in direct contact with groundwater. The model does not consider adjustment for the depth to
groundwater from the base of the contaminated soil or biodegradation. As the distance between
the base of impacted soil and the top of groundwater increases, there is additional time and area
for chemicals to volatilize out of the leachate, resorb to soil particles or degrade by natural
TPH Risk Case Studies (HIDOH, October 2018)
Attachment 3 - Potential Environmental Concerns
86
biological processes. Modeling by the state of Hawaii suggests an order-of-magnitude or more
increase in screening levels for BTEX is appropriate for a separation distance of contaminated soil
from groundwater of just ten meters, due to the permanent loss of these compounds from leachate
due to volatilization alone (HIDOH 1996). Consideration of biodegradation in the models would
result in an even greater increase in screening levels, although degradation-related metabolites
remaining in the leachate could still pose risks to groundwater. On the other hand, it is also possible
that the model could under predict short-term impacts to groundwater when impacted soil is within
a few meters of groundwater due to the increased solubility of metabolites and other degradation
products.
Site Specific Leaching Evaluation
Site-specific evaluation of the potential for leaching of chemicals from soil is recommended when
screening levels are exceeded. This can be difficult and expensive to carry out in practice, however.
Site-specific evaluations might include the use of more rigorous models, laboratory leaching tests
and/or monitoring of groundwater. The latter is especially important if the main mass of
contaminated soil is already in contact with groundwater. In such cases direct monitoring of
groundwater supersedes the need for leaching based, soil screening levels.
Laboratory-based, soil column leaching tests provide the most accurate assessment of potential
leaching concerns (e.g., USEPA 2010). A detailed review of soil column tests is beyond the scope
of this document. Such methods have not been widely employed for assessment of potential
leaching concerns associated with contaminated soils, although they are widely used in agriculture
to assess the mobility of pesticides.
Site-specific, soil sorption factors (K
d
), chemical concentrations in source area leachate and
subsequent impacts to groundwater can be estimated using the Synthetic Precipitation Leaching
Procedure (SPLP) laboratory batch leaching test (Method 1312; USEPA 1994; HIDOH 2007). In
this test, the total concentration of the chemical in soil is first determined. The soil is them placed
in synthetic rainwater and allowed to equilibrate. The extract solution is then tested. The mass of
the chemical that moved into the solution is then compared to the original mass of the chemical in
the soil sample and a sample-specific, sorption factor is calculated. This can be incorporated into
partitioning and leaching models in order to develop more site-specific screening levels or directly
assess potential impacts to groundwater.
Use of the SPLP approach requires robust, representative soil data collected in accordance with
sampling theory and Incremental Sampling Methodology techniques (ITRC 2012; HIDOH 2016).
Data for discrete soil samples are not considered to be reliable. The presence of free product in
soil can also interfere with the accuracy of the SPLP tests. This can occur for petroleum in soil at
TPH concentrations as low as a few hundred parts-per-million and can limit the use of SPLP data
for petroleum releases. The SPLP approach likewise again does not directly consider the fate and
transport of petroleum-related compounds in leachate as the leachate migrates downward to
groundwater. When reliable, sorption coefficients for TPH generated by SPLP batch tests can,
however, be incorporated into leaching models such as SESOIL that are designed to consider these
factors. Travel time for contaminants to reach groundwater can also be predicted using SESOIL
and similar models.
TPH Risk Case Studies (HIDOH, October 2018)
Attachment 3 - Potential Environmental Concerns
87
6. Gross Contamination
Massachusetts published “Ceiling Levels” for chemicals in air, water and soil, above which
contamination is likely to be noticeable in the field (MADEP 1994, 1996, 2002, 2014). The ceiling
levels are referred to as “Gross Contamination” screening levels in other state guidance (for
example, CAEPA 2016, HIDOH 2017). Soil, water and air screening levels for “gross
contamination” are intended to alert workers at sites to potential short-term health risks associated
with strong vapors, sheens from runoff, potentially mobile LNAPL and related issues if
contamination is disturbed or otherwise exposed at the surface under current or future conditions.
In this sense, the screening levels can be considered to represent an extension to Permissible
Exposure Limits (PELs), Time Weighted Averages (TWAs), Short-Term Exposure Limits
(STELs) and Threshold Limit Values (TLVs) discussed for use in emergency response actions or
by construction and remediation workers who have received training for working with hazardous
waste.
Odor thresholds are intended to reflect the concentration of the chemical in air where more than
50% of the population is likely to identify an odor. Gross contamination screening levels for water
are based on the lowest of the chemicals taste and odor threshold (for example, Secondary
Maximum Contaminant Level), one-half the solubility or a maximum of 50,000 µg/L based on
general resource degradation concerns. Ceiling levels for soil reflect concentrations that would
likely be detectable in the field visually or through odors.
A summary of gross contamination screening levels for carbon ranges and bulk TPH published by
Massachusetts (MADEP 2014) and Hawaii (HIDOH 2017) is included in Attachment 4. Note that
screening levels for gross contamination can be significantly lower than screening levels based on
long-term, chronic health risks. Soil screening levels for chronic, long-term exposure to volatile
chemicals in soil assume a gradual, slow, upward diffusion of vapors and emission at the ground
surface over time. This limits impacts to outdoor air at any given time period. Disturbance of
heavily contaminated soil or groundwater can, however, cause a sudden, significant release of
volatile TPH and related compounds and result in temporary but very high concentrations of
vapors in outdoor. This is obvious at sites where the excavation of petroleum-contaminated soil is
taking place.
Short-term exposure to high concentrations of TPH and other petroleum-related compounds in air
result in significant, but transient health effects (NJDOH 2008, 2010). Inhalation of high
concentrations of petroleum vapors can irritate the nose, throat and lungs and affect the nervous
system, causing headaches, dizziness, nausea and loss of balance and coordination. Health effects
normally dissipate quickly after a short-period of exposure, with no long lasting effects. Odor
thresholds for petroleum fuels, typically <1 ppm, are fortunately well below levels likely to pose
significant, short-term health effects (e.g., 100 to 500 ppm), so exposure is unlikely to occur
without the person’s knowledge.
The Gross Contamination screening levels for soil (and water) are intended to help to identify
contaminated soil that could pose short-term vapor emission concerns if exposed at surface or
subsurface soil and groundwater that could pose, vapor emission risks to workers and occupants
of adjacent properties if disturbed during remediation, construction or utility repair or installation
TPH Risk Case Studies (HIDOH, October 2018)
Attachment 3 - Potential Environmental Concerns
88
activities. Runoff from uncovered, stockpiled soil can also generate sheens and be carried into
nearby storm drains, causing short-term impacts to nearby, aquatic habitats.
The identification of grossly contaminated soil and groundwater after a project is already underway
can likewise lead to significant logistical problems for construction activities and costly project
delays. Grossly contaminated soil and groundwater unexpectedly encountered during excavation
work can foul construction equipment and spread contamination to previously clean areas. The
need to store and manage contaminated soil pending test results can significantly interfere with
operations at active construction sites. Plans to discharge groundwater from dewatering operations
into storm drains that discharge into an aquatic habitat or sewers that lead to a wastewater treatment
plant might not be allowed if the water if the water is found to be heavily contaminated with
petroleum.
Properly addressing these concerns requires identification of potential problem areas ahead of
time. Measures to minimize problems during work anticipated to encounter contamination
include:
● Training of workers to understand potential health risks posed by the contamination
and measures to minimize exposure;
● Notification of adjacent property owners of pending actions and anticipated short-
term vapor emissions from the site;
● Use of environmentally acceptable, vapor suppressants during excavation work;
● Perimeter air monitoring to ensure that concentrations of volatile chemicals do not
exceed levels that could pose short-term health risk to offsite workers or nearby
residents;
● Designation of areas for segregation and storage of heavily contaminated soil, with
stockpiles placed on liners to prevent contamination of underlying soil and covered
to minimize vapor emission and runoff concerns;
● Use of sorbent pads for smaller releases and/or vacuum trucks for larger releases to
absorb and remove free product on exposed groundwater; and,
● Onsite re-infiltration or treatment of groundwater from dewatering operations.
Costs to carry out these and other actions necessary to manage short-term risks during disturbance
of petroleum-contaminated soil and groundwater should be included upfront in the project budget.
A trained, environmental consultant should be on hand to guide actions in the field and adjustment
of workplans as needed. Methane hazards are also sometimes present at sites with significant gross
contamination in soil and groundwater. Refer to HIDOH (2017) for additional information on
methane hazards.
References
Abreu, L.D.V, R. Ettinger, and T. McAlary. 2009. Simulated Soil Vapor Intrusion Attenuation
Factors Including Biodegradation for Petroleum Hydrocarbons: Groundwater Monitoring and
Remediation, 29(1): 105-117.
TPH Risk Case Studies (HIDOH, October 2018)
Attachment 3 - Potential Environmental Concerns
89
Anderson, M. 1992. Development of Generic Soil Clean-up Levels Based on Analysis of Leachate
Pathway: Environmental Clean-up Division, Department of Environmental Quality, State of
Oregon, May, 1992.
ASTM. 1998. Standard Provisional Guide for Risk-Based Corrective Action: Association for
Standards and Testing Materials. ASTM PS 104-98.
Brewer, R., J. Nagashima, M. Kelley, M. Heskett and M. Rigby. 2013. "Evaluation of Total
Petroleum Hydrocarbons in Vapor Intrusion Studies." International Journal of Environmental
Research and Public Health 10: 2441-2467.
CAEPA. 2016. Screening for Environmental Concerns at Sites with Contaminated Soil and
Groundwater: California Environmental Protection Agency, Regional Water Quality Control
Board, San Francisco Bay Area Region.
HIDOH. 1996. Risk Based Corrective Action at Sites with Contaminated Soil and Groundwater
(Appendix F): Hawai‘i Department of Health, Solid and Hazardous Waste Branch. June 1996.
HIDOH. 2007. Use of laboratory batch tests to evaluate potential leaching of contaminants from
soil: Hawai‘i Department of Health, Office of Hazard Evaluation and Emergency Response.
April 2007.
HIDOH. 2016. Technical Guidance Manual: Hawai′i Department of Health, Hazard Evaluation
and Emergency Response. August 2016.
HIDOH. 2017. Evaluation of Environmental Hazards at Sites with Contaminated Soil and
Groundwater – Tropical Pacific Edition (Fall 2017): Hawai‘i Department of Health, Hazard
Evaluation and Emergency Response.
ITRC, 2012. Incremental Sampling Methodology: Interstate Technology Regulatory Council,
February 2012.
ITRC. 2014. Petroleum Vapor Intrusion: The Interstate Technology & Regulatory Council.
October 2014.
ITRC. 2018. TPH Risk Evaluation at Petroleum Contaminated Sites (draft March 2018): Interstate
Technology & Regulatory Council. Anticipated publication 2019.
Lahvis, M. 2018. Vertical screening distances for total petroleum hydrocarbon for vapour intrusion
risk assessment at petroleum underground storage tank sites: Quarterly Journal of Engineering
Geology and Hydrogeology, Vol. 51: 3–12.
MADEP. 1994. Background Documentation for the Development of the MCP Numerical
Standards: Massachusetts Department of Environmental Protection, Bureau of Waste Site
Cleanup and Office of Research and Standards. April 1994.
MADEP. 1996. Implementation of the VPH/EPH Approach: Massachusetts Department of
Environmental Protection. May 1996.
MADEP. 2002. Characterizing Risks Posed by Contaminated Sites: Implementation of the
MADEP VPH/EPH Approach: Massachusetts Department of Environmental Protection,
Bureau of Waste Site Cleanup, October 31, 2002.
MADEP. 2014. MCP Numerical Standards Development Spreadsheets: Massachusetts
Department of Environmental Protection, Bureau of Waste Site Cleanup. Updated June 2014.
TPH Risk Case Studies (HIDOH, October 2018)
Attachment 3 - Potential Environmental Concerns
90
McHugh, T., Davis, R., DeVaull, G., Hopkins, H., Menatti, J. and T. Peargin. Evaluation of Vapor
Attenuation at Petroleum Hydrocarbon Sites: Considerations for Site Screening and
Investigation', Soil and Sediment Contamination, Vol 19- 6, pp725- 745.NJDEP. 2008.
Introduction to Site-Specific Impact to Groundwater Soil Remediation Standards Guidance
Documents: New Jersey Department of Environmental Protection. December 2008.
NJDOH. 2008. Hazardous Substance Fact Sheet – Gasoline: New Jersey Department of Health,
December 2008.
NJDOH. 2010. Hazardous Substance Fact Sheet – Fuel Oils (light): New Jersey Department of
Health, December 2010.
USEPA, 1994, Synthetic Precipitation Leaching Procedure: U.S. Environmental Protection
Agency, Office of Solid Waste, SW-846 Method 1312, September 1994.
USEPA. 2002. Supplemental Guidance for Developing Soil Screening Levels for Superfund Sites:
U.S. Environmental Protection Agency, Solid Waste and Emergency Response, OSWER
9355.4-24, December 2002.USEPA. 2013. Evaluation of Empirical Data to Support Soil
Vapor Intrusion Screening Criteria for Petroleum Hydrocarbon Compounds: U.S.
Environmental Protection Agency, Office of Underground Storage Tanks, EPA 510-R-13-
001. January 2013.
USEPA. 2015. Technical Guide for Addressing Petroleum Vapor Intrusion at Leaking
Underground Storage Tank Sites: .S. Environmental Protection Agency, Office of
Underground Storage Tanks, June 2015, Washington, D.C., EPA 510-R-15-001.
USEPA. 2017. Regional Screening Levels: U.S. Environmental Protection Agency, Superfund,
June 2017.
TPH Risk Case Studies (HIDOH, October 2018)
Attachment 4 – Example TPH Screening Levels
91
Attachment 4
Example Carbon Range and TPH Screening Levels
TPH Risk Case Studies (HIDOH, October 2018)
Attachment 4 – Example TPH Screening Levels
92
1. Overview
This attachment presents example water, soil, indoor air and soil vapor screening levels for: 1)
Total Petroleum Hydrocarbon (TPH) carbon ranges and 2) Default, carbon-range weighted total
TPH. Tables 1 through11 present summarize default parameters and parameter values used to
calculate screening levels. Screening levels for water, soil, sediment and air are then presented in
Tables 12 through 21.
Screening levels are presented for the following, potential environmental concerns:
Surface Water and Groundwater (Tables 12 and 13):
Drinking water toxicity;
Aquatic (pelagic) toxicity;
Gross contamination (include drinking water taste and odors);
Soil (Tables 14 and 15):
Direct exposure;
Leaching;
Gross contamination (vapors, odors, mobile product, etc.);
Sediment (Table 12):
Aquatic (benthic) toxicity
Indoor Air and Soil Vapors (Vapor Intrusion; Tables 16-21):
Indoor Air Toxicity;
Gross Contamination (odors).
The screening levels presented are for example only, but largely reflect those currently in use in
the noted states. Under most state guidance exceeding a screening level for a specific chemical
does not necessarily indicate that the contamination poses significant environmental concerns,
only that additional evaluation is warranted.
The chemistry of petroleum fuels used to derive TPH-based screening levels is summarized in
Tables 1-3. Default physiochemical constants selected to represent individual carbon ranges and
an example partitioning of carbon range compounds in soil are presented in Tables 4-6. Tables 7-
11 present selected toxicity factors and exposure assumptions used to develop screening levels.
Example screening levels for TPH carbon ranges and carbon range-weighted TPH fuel fractions
are summarized in Tables 12-21. Screening levels for carbon ranges primarily reflect guidance
published by the Massachusetts Department of Environmental Protection (MADEP 1996, 2007,
2014), although additional calculations were required to present carbon range screening levels for
leaching and vapor intrusion. Carbon range-weighted screening levels published by the Hawaii
Department of Health are presented for generic mixtures of TPH in gasoline, middle distillates
(e.g., diesel) and residual fuels (HIDOH 2017). The screening levels are based on assumed, carbon
range compositions of petroleum fuels and fuel vapors. The Hawaii guidance reflects similar,
carbon-range weighted screening levels for TPH published by Massachusetts (MADEP 1996) and
the California Environmental Protection Agency (CAEPA 2016). Each of these states as well as
TPH Risk Case Studies (HIDOH, October 2018)
Attachment 4 – Example TPH Screening Levels
93
numerous other states require the inclusion of TPH as a contaminant of potential concern at all
petroleum release sites, in addition to benzene, toluene, ethylbenzene, xylenes and naphthalene
(BTEXN) and other individually targeted and assessed compounds that might be related to a
release (Table 1).
Screening levels for specific carbon ranges versus carbon range-weighted screening levels for total
TPH both offer advantages and disadvantages. The use of carbon range-specific screening levels
and site data allows for a more detailed understanding of the nature and risk posed by the petroleum
contamination. Disadvantages include inability to directly compare with existing, total TPH data,
higher analytical costs, a scarcity of laboratories that offer carbon range testing, the need to
calculate cumulative risk collectively posed by individual carbon ranges, and inability for direct
comparison to existing TPH data.
Advantages in the use of total or “bulk” TPH data (e.g., Method 8015M) and carbon range-
weighted screening levels for total TPH, as described below, include the ability to directly compare
with existing total TPH data, a greater availability of laboratory testing facilities, reduced cost and
upfront consideration of cumulative risk in the data. Screening levels for “gross” or “very heavy”
petroleum contamination in soil or water that could pose short-term vapor emission risks and other
concerns if disturbed are also based on total TPH. Use of total TPH data helps to ensure that
common environmental concerns posed by petroleum contamination are comprehensively
considered. This helps to expedite the review of site investigation and risk assessment reports by
regulatory agencies and decisions for followup actions. Disadvantages include a less detailed
understanding of the carbon range chemistry of the petroleum present and in turn certain aspects
of risk. Standard TPH analytical methods also lack the precision of carbon range methods.
The carbon range composition of TPH in soil, water and air can vary from site to site and even
within a single site. Variability in terms of overall, relative toxicity of the total TPH mixture can
be minimal, however. This is especially true for gasoline-impacted soil, where total TPH can
reasonably be anticipated to be dominated by C4-C8 aliphatic compounds with lesser amounts of
C9-C12 compounds. The composition and overall toxicity of TPH and TPH-related degradation
compounds in groundwater or surface water can vary more significantly, as can the carbon range
makeup of vapors associated with diesel and other middle distillate fuels. Site-specific carbon
range data rather than reliance on bulk TPH data and default TPH compositions are especially
useful in these situations. These issues are incorporated into Case Studies 1 and 2 (see Attachment
1).
2. Petroleum Chemistry and Partitioning
A detailed discussion of the chemistry, fate and transport of petroleum in the environment is
presented in the Interstate Technology and Regulatory Council (ITRC) document Petroleum Vapor
Intrusion (ITRC 2014). Table 2 presents the default, carbon range makeup of gasoline, middle
distillate (e.g., diesel) and residual petroleum fuels used by the State of Hawai′i to develop
weighed, TPH screening levels for soil and groundwater (HIDOH 2017; see also TPHCWG 1998).
Table 3 presents a similar, default carbon range makeup for petroleum vapors published by the
State of Hawai′i e, based on a detailed field study of vapors at known petroleum release sites and
a compilation of available, published data (HIDOH 2012, Brewer et al. 2013).
TPH Risk Case Studies (HIDOH, October 2018)
Attachment 4 – Example TPH Screening Levels
94
Table 4 presents example, physiochemical constants used by MADEP to develop screening levels
for all but one of the targeted, TPH carbon ranges noted in Table 2 (MADEP 2002). Constants for
the C19-C36 aliphatic fraction were published by the TPH Criteria Working Group (Gustafson et
al. 1997; considered immobile and not included in MADEP models). Carbon range-weighted
constants used to develop the HIDOH (2017) TPH screening levels are presented in Table 5.
Table 6 illustrates how individual carbon range groups might be expected to partition out of free
product and into soil based on default, soil characteristics used by the USEPA to develop risk-
based, Regional Screening Levels (USEPA 2017). This is used to illustrate the dispersion of
petroleum in soil, groundwater, surface water and air in the pipeline release case study. The main
mass of aromatic compounds and heavier (C9+), aliphatic compounds can be expected to bind to
organic carbon in the soil. This impedes the initial migration of petroleum-related compounds to
groundwater in the absence of mobile, free product. Biologic degradation of these compounds can,
however, lead to the migration of more soluble metabolites into downward migrating leachate and
exacerbate impacts to groundwater.
Aromatic compounds can be expected to preferentially dissolve into soil moisture. This calls into
question the use of toxicity factors based on the carbon range makeup of parent fuels to generate
risk-based screening levels for drinking water, as discussed below. Doing so could underestimate
the proportion of more toxic, aromatic compounds in groundwater or surface water. Estimation of
the toxicity of dissolved-phase, petroleum-related compounds in groundwater or surface water is
further complicated by a likely dominance of biogenic metabolites and other degradation
compounds soon after release (see Attachment 5).
Vapors can be expected to be dominated by C5-C8 aliphatics, with less proportions of C9-C12
aliphatics and C10-C12 aromatics, depending in part on original makeup of the fuel (see Brewer
et al. 2013). This includes vapors from diesel fuel and other middle distillates, even though C5-C8
aliphatics make up only a small proportion of the parent fuels. This highlights the need to collect
carbon range vapor data at diesel release sites and/or report total TPH as the sum of C5-C12
hydrocarbons in air and soil vapor samples, rather than simply the sum of C10 and higher
hydrocarbons as typically done for diesel product soil (see Brewer et al. 2013). Anaerobic
degradation of longer chain hydrocarbons can also lead to the additional generation of volatile
hydrocarbons and degradation products from heavier fuels over time (Hostettler 2008). This likely
explains in part the persistence of volatile, aliphatic compounds in soil vapors at decades-old diesel
releases (see Brewer et al. 2013).
Lahvis (2018) suggests that total TPH soil vapor data and associated TPH screening levels for
vapor intrusion are not reliable, due to uncertainties in the carbon range makeup and overall
toxicity of petroleum vapors. The author also speculates that laboratory methods for Total TPH
significantly overestimate the actual concentration of non-BTEXN compounds present but does
not provide data to support this conclusion (see discussion in Attachment 3). The paper
recommends instead that only carbon range data be considered for assessment of potential
petroleum vapor intrusion (PVI) risk.
While desirable in terms of overall data quality, this would unnecessarily negate the use of existing
TPH soil vapor data and increase the expense of initial site investigations. Field studies and reviews
TPH Risk Case Studies (HIDOH, October 2018)
Attachment 4 – Example TPH Screening Levels
95
of TPH and carbon range data carried out by HIDOH note a generally good correlation between
total carbon range concentrations and total vapor concentration measured as TPH (Brewer et al.
2013). The carbon range composition of gasoline vapors in terms of overall toxicity is likewise
reasonably predictable, given the persistent dominance of low-toxicity, C5-C8 aliphatics. This
permits the development and use of soil vapor screening levels for total TPH. The carbon range
makeup of vapors associated with diesel and other middle distillate fuels is more variable with
respect to the relative proportions of C5-C8 versus more toxic, C9-C12+ aliphatics. Conservative
assumptions regarding the potential prevalence of the latter in middle distillate-related vapors can
still be used to develop soil vapor screening levels for initial screening purposes, however, and in
many cases quickly screen out potential PVI risks as such sites. Additional, more detailed carbon
range data can be collected as needed to more closely assess the makeup and toxicity of bulk,
petroleum vapors.
3. Toxicity-Based Screening Levels for Drinking Water, Soil and Air
A summary of published, ingestion and inhalation toxicity factors for petroleum aliphatic and
aromatic carbon ranges is presented in Table 7. Toxicity factors published by the Massachusetts
Department of Environmental Protection (MADEP 2003) are reflected in MADEP screening levels
for individual carbon range fractions discussed below. The Hawaii Department of Health (HIDOH
2017) relies on a combination of toxicity factors published by the US Environmental Protection
Agency (USEPA 2009) and Massachusetts for development of carbon range-weighted toxicity
factors and screening levels for generic, TPH fuel types, as summarized in Table 8 and Table 9.
Default exposure parameter values and physiochemical constants for carbon ranges and carbon
range-weighted TPH are presented in Tables 10 and 11. Corresponding, risk-based screening
levels for exposure to individual carbon ranges and carbon range-weighted TPH are then presented
in Tables 12-13 (drinking water), Tables 14-15 (soil) and Tables 16-17 (indoor air and subslab soil
vapor).
Screening levels for drinking water and soil are based on a target, noncancer Hazard Quotient of
0.2, in conformance with both MADEP and HIDOH guidance. This allows potential cumulative
health effects to be taken into account upfront when screening data and helps to ensure that this
important issue is not inadvertently overlooked. A target Hazard Quotient of 1.0 is, in contrast,
applied to carbon range screening levels for indoor air (Table 16a and 16b) and subslab soil vapor
(Table 20), where only three carbon ranges are applicable. This requires site-specific calculation
of cumulative risk, as included in Case Study #1.
While similar overall, the MADEP (2003) toxicity factors for C5-C8 aliphatics, C19-C36
aliphatics and C9-C10 aromatic are slightly more conservative (lower) than toxicity factors
selected for these ranges by HIDOH (2017). For comparison, indoor air screening levels based on
inhalation toxicity factors used by MADEP (2014) versus HIDOH (2017) are presented in Tables
16a and 16b, respectively. This implies lower screening levels and a slightly higher risk for
contamination dominated by light-end hydrocarbons (e.g., gasoline) under MADEP guidance in
comparison to HIDOH. Toxicity factors applied by HIDOH to C9-C18 aliphatics are, in contrast,
lower than those utilized by MADEP (2003). This implies lower screening levels and somewhat
higher risks posed by contamination dominated by diesel and other fuels with a high proportion of
intermediate, aliphatic hydrocarbons.
Default exposure parameter values used to calculate MADEP (2014) and HIDOH (2017) screening
levels are compared in Table 10. Table 11 presents default soil and volatilization factor parameters
TPH Risk Case Studies (HIDOH, October 2018)
Attachment 4 – Example TPH Screening Levels
96
used in screening level models (USEPA 2017). Massachusetts utilizes target risk and exposure
factors specifically develop by that state, while Hawaii largely relies on exposure assumptions
incorporated into the USEPA Regional Screening Levels guidance (USEPA 2017). These
differences are highlighted in the tables and could be reconciled in the development of alternative
sets of screening levels.
For example, the MADEP (2014) direct-exposure screening levels for soil, drinking water and
indoor air are based on a target, noncancer Hazard Quotient of 0.2. This allows consideration of
cumulative risk posed by concurrent exposure to petroleum compounds in multiple carbon range
fractions. Similar screening levels published by HIDOH (2017), in contrast, assume a target
Hazard Quotient of 1.0 and by their nature consider potential cumulative risk posed by exposure
to multiple carbon range fractions up front. This negates the need to calculate cumulative risk on
a site-specific basis.
The MADEP (2014) screening levels for soil also consider a shorter, annual exposure frequency
than do the HIDOH (2017) screening level, for both residential and commercial/industrial
exposure. The MADEP screening levels also assume one-half of the soil ingestion rate reflected
in the HIDOH screening levels. These differences cause the MADEP (2014) screening levels to
be somewhat less conservative, but not necessarily less appropriate, than the HIDOH (2017)
screening levels.
Note that the MADEP (2014) direct exposure screening levels for soil only consider ingestion and
dermal exposure and do not consider the inhalation of vapors emitted from the soil (refer to Table
14). The rationale for omitting this pathway is not clear. Screening levels in parentheses consider
additional exposure via inhalation of vapors in outdoor air, calculated using USEPA Regional
Screening Levels direct exposure model and factors noted in Tables 8, 10 and 11.
4. Surface Water and Sediment Screening Levels for Aquatic Toxicity
Massachusetts guidance includes both acute and chronic aquatic toxicity screening levels for
individual, TPH carbon ranges (MADEP 2007; see Table 12). The aquatic screening levels are
used to develop correlative, sediment screening levels for toxicity to benthic organisms (see Table
12). Hawaii guidance refers to aquatic toxicity screening levels developed by the California EPA
for whole product (HIDOH 2017; see Table 13). Sediment screening levels are not included in the
Hawaii guidance but could be generated from aquatic toxicity screening levels using standard
partitioning models, if needed.
5. Soil Leaching Screening Levels
Hawaii refers to approaches published by Massachusetts for development of screening levels for
leaching and gross contamination. A simplified algorithm based on the models SESOIL and
AT123D is used to develop screening levels for leaching of contaminants from soil by rainfall,
irrigation or leaking water lines and subsequent impacts to groundwater (MADEP 1994; see also
HIDOH 2017):
C
soil
= DAF x C
gw
x 0.001 mg/kg
DAF = (6207 x H) + (0.166 x Koc)
TPH Risk Case Studies (HIDOH, October 2018)
Attachment 4 – Example TPH Screening Levels
97
where: DAF = SESOIL-based dilution/attenuation factor;
H = Henry's Law Constant (atm-m3/mol);
Koc = organic carbon partition coefficient (cm
3
/g);
C
soil
= leaching based soil concentration (mg/kg);
C
gw
= target groundwater action level (µg/L).
The term DAF is defined for the purposes of the model as the concentration of the contaminant in
soil (in mg/kg) divided by the concentration of the contaminant in groundwater (in mg/L). The
algorithm, originally developed by the state of Oregon (Anderson 1992), is based on a combined
use of the computer applications SESOIL and AT123D and was slightly modified for use by the
Massachusetts DEP. These applications model the leaching of chemicals from the vadose zone
and subsequent mixing of leachate to groundwater, respectively. The model assumes a three-meter
thick vadose zone characterized by one meter of impacted soil sandwiched between two one-meter
thick layers of clean soil and a surface water infiltration rate of 720 mm/year (28 inches/year).
The leaching model does not consider biodegradation or adjustment for the depth to groundwater
from the base of the contaminated soil. The screening levels are likely to be overly conservative
for prediction of long-term impacts to groundwater. The screening levels could under predict short-
term impacts to groundwater, however, due to the increased solubility of metabolites and other
degradation products. Modeling by the state of Hawaii suggests an order-of-magnitude increase in
screening levels for BTEX after a separation distance of ten meters from the base of the
contaminated soil to the top of groundwater. This was primarily due to the loss of these compounds
from leachate due to volatilization alone. Consideration of biodegradation in the models would
result in an even greater increase in screening levels, although degradation-related metabolites
remaining in the leachate could still adversely impact groundwater quality. Refer to the discussion
of leaching models in Attachment 3 for addition information. Additional research of this issue is
required.
6. Vapor Intrusion
A detailed discussion of potential vapor intrusion risks posed by petroleum-contaminated soil and
groundwater is provided in the ITRC Petroleum Vapor Intrusion guidance document (ITRC 2014).
Refer also to the discussion of petroleum vapor intrusion provided in Attachment 3. The MADEP
(2014) guidance includes soil screening levels for potential vapor intrusion concerns (Table 14).
The use of soil data to estimate correlative concentrations of a volatile chemical in soil vapors is
not considered reliable, however (USEPA 2015a, 21015b). This is especially true for traditional,
“discrete” soil samples, where only a very small, random mass of soil is tested (e.g., 5 grams for
Encore-type soil samples) and the representativeness of the resulting data with respect to the area
where the same was collected cannot be verified.
The direct collection of soil vapor samples is instead recommended. The MADEP (2014) guidance
includes carbon range screening levels for indoor air but not soil vapor. Vapor intrusion attenuation
factors for residential settings published by Brewer et al. (2014) for different climate zones were
instead used to calculate example screening levels for subslab vapors (Table 19; screening level
TPH Risk Case Studies (HIDOH, October 2018)
Attachment 4 – Example TPH Screening Levels
98
equal to indoor air screening level divided by corresponding attenuation factor). Attenuation
factors for commercial/industrial settings were assumed to be one-half of the residential factor.
This is intended to account for improved ventilation of commercial buildings (see Brewer et al.
2014; HIDOH 2016).
Tables 20 and 21 present carbon range and carbon range-weighted, subslab soil vapor screening
levels for different climate zones, based on attenuation factors considered appropriate for those
regions. The screening levels reflect target indoor air concentrations based on inhalation toxicity
factors noted in Table 16b. Carbon range screening levels for indoor air and subslab soil vapor are
not included in the HIDOH guidance and were calculated for inclusion in Table 20 based on the
model and exposure assumptions used to develop the USEPA (2016) ambient air RSLs.
As indicated in Tables 20 and 21, vapor intrusion risk increases in cold climates, where buildings
are heated for longer periods of the year (increases risk of vapor entry) and indoor air exchange
rates are likely to be lower (reduced attenuation of intruding vapors). Vapor intrusion risk is lowest
in tropical climates, where buildings are rarely heated and indoor air exchange rates are
comparatively much higher. Note that the research published by Brewer et al. (2014) negates the
reliability of attenuation factors incorporated in USEPA’s generic vapor intrusion guidance
(USEPA 2015b) due to the unverifiable nature of the subslab vapor data utilized. The USEPA
(2015) guidance was formally published after publication of the Brewer et al. (2015) but had been
completed prior to a review of the updated study.
7. Gross Contamination Screening Levels
An expanded discussion of “Gross Contamination” concerns is provided in Attachment 3.
Massachusetts guidance for TPH includes screening levels for “gross contamination” that could
pose short-term, vapor emission risks and soil and groundwater management concerns if the
contamination is disturbed (MADEP 1994, 2014). These screening levels are especially useful to
alert field workers to the presence of heavily contaminated, soil and groundwater and potential,
short-term vapor emission risks and runoff concerns prior to excavation and disturbance of
impacted areas. Appropriate plans can then be put in place ahead of time to address such issues
should they arise during work at the site. Screening levels based on these approaches are included
in the tables. The Hawaii TPH guidance adopts screening level approaches developed by MADEP
(1994) for “gross contamination” of soil, water and air (HIDOH 2017).
Air
Odor thresholds are intended to represent the concentration of a chemical in air at which 50% of
the population can detect a chemical odor. Odor recognition thresholds for gasoline and diesel
vapors in general are noted in Table 19. Odor thresholds for individual carbon ranges are not
included in the MADEP (2014) guidance.
Water
Screening levels for TPH in surface water or groundwater that is considered to be a current or
potential source of drinking water are based on the lowest of the chemicals taste and odor threshold
(e.g., Secondary MCLs) and one-half the solubility of the target chemical. Taste and odor and
general gross contamination screening levels for individual carbon ranges are not included in the
TPH Risk Case Studies (HIDOH, October 2018)
Attachment 4 – Example TPH Screening Levels
99
MADEP (2014) guidance. Past Hawaii guidance and current California guidance (CAEPA 2016b)
documents presented a taste and odor threshold for TPH in drinking water of 100 µg/L TPHg. This
was based on a taste and odor threshold or “Suggested No Adverse Response Level (SNARL)” for
kerosene in drinking water published by the USEPA (1980). A review of the original, 1940s era
source documents written in Polish and Russian by Zemo and O’Reilly (2016) identified flaws in
the derivation of this threshold.
A closer review of the original references used to develop the SNARL suggests that this threshold
could be too low for some types of petroleum (Zemo and O’Reilly 2016). Most of the research
was carried out in the 1940s to 1960s. The representativeness of the petroleum formulations in the
studies of more recent fuels is uncertain. McKee and Wolf (1963) reference odor thresholds for
drinking water that range from 10 µg/L to 2,000 µg/L for gasoline, 82 µg/L to 667 µg/L for
kerosene and heating oil, and 500 µg/L to 25,000 µg/L for heavier oil. Additional screening levels
of 100 µg/L to 500 µg/L are referenced for “unrefined petroleum,” with screening levels of 1,000
µg/L to 2,000 µg/L noted for “refined petroleum.” Based on the studies presented, a taste and odor
threshold for refined, low- to mid-range petroleum fuels in the range of 500 µg/L to 1,000 µg/L is
reasonable for general screening purposes (see Table 12 and Table 13; included in updates to
HIDOH 2017). A field check of groundwater conditions should be carried out within this range.
Screening levels for surface water and groundwater that is not considered to be a current or
potential source of drinking water are intended to reflect the concentration at which a chemical in
water poses odor problems or sheens. Carbon range, gross contamination screening levels for
groundwater that is not a source of drinking water are set in Table 12 to one-half of the default
solubility for the range as noted in Table 5 and following MADEP’s approach for other chemicals
(MADEP 1994). Screening levels for TPH are similarly set to one-half of the assumed solubility
of the targeted fuel type (see Table 13). A field check of groundwater conditions should again be
carried out to verify site conditions and address potential concerns as appropriate.
Soil
Gross contamination screening levels published by MADEP (2014) for individual TPH carbon
ranges in soil are included in Table 14 (see also MADEP 2002). Screening levels for carbon range-
weighted TPH mixtures published by HIDOH (2017) are included in Table 15. Selection of the
screening levels is based on the vapor pressure an “odor index” after an approach developed by
MADEP (1994). An “odor index” is calculated as the vapor pressure in Torr (20-30 ºC) divided
by the 50% Odor Recognition Threshold in ppm-v. For example, chemicals with an Odor Index
>100 are assigned a gross contamination screening levels for exposed, surface soils of 100 mg/kg
for residential land-use scenarios and 500 mg/kg for commercial/industrial land use. This is the
case for C5-C8 aliphatics and C9-C10 aromatics (Table 14) and TPH as gasoline (Table 15).
Higher screening levels are applied to less volatile carbon ranges and TPH fuel types.
A second set of gross contamination screening levels is presented for subsurface soils, defined as
soil situated >10 feet below ground surface for residential sites and >3 feet below ground surface
for commercial/industrial sites (see Tables 14, 15 and 21; HIDOH 2017). MADEP (2014)
subsurface screening levels reflect concentrations of petroleum in soil that could lead to significant
vapor emissions if the soil is disturbed (carbon range screening levels 500 mg/kg to 3,000 mg/kg).
TPH Risk Case Studies (HIDOH, October 2018)
Attachment 4 – Example TPH Screening Levels
100
HIDOH (2017) screening levels are in part intended to identify the presence of potentially mobile,
free product in the soil (TPH screening levels set to 5,000 mg/kg).
These screening levels are intended to help identify contamination that could pose potential short-
term risks to construction workers who might encounter subsurface contamination as well as soil
and groundwater management needs during site remediation or redevelopment activities, including
tank or pipeline removal, utility installation, excavation for building foundations, etc. This includes
the generation of sheens in runoff, impacts of vapors (and odors) to workers and adjacent properties
and fouling of equipment being used at the site.
Grossly contaminated soil and groundwater can often be managed in place, provided that offsite
impacts and potential vapor intrusion and methane buildup concerns are addressed. Identification
of grossly contaminated soil and groundwater ahead of subsurface activities for inclusion in work
plans and project budgets is important, however. Actions to manage disturbed contamination might
include worker training to minimize exposure and understand health risks, the use of
environmentally sustainable vapor suppressants during excavation, the use of impermeable liners
under and over temporarily stockpiled soil to prevent runoff, reinjection of contaminated
groundwater during excavation dewatering activities rather than disposal in storm drains and
disposal of contaminated soil and groundwater that might interfere with future use of the property.
TPH Risk Case Studies (HIDOH, October 2018)
Attachment 4 – Example TPH Screening Levels
101
References
Brewer, R., J. Nagashima, M. Kelley, M. Heskett and M. Rigby. 2013. "Evaluation of Total
Petroleum Hydrocarbons in Vapor Intrusion Studies." International Journal of Environmental
Research and Public Health 10: 2441-2467.
Brewer, R., Nagashima, J., Rigby, M., Schmidt, M. and H. O'Neill. 2014. Estimation of Generic
Subslab Attenuation Factors for Vapor Intrusion Investigations. Groundwater Monitoring &
Remediation, 34: 79–92. doi: 10.1111/gwmr.12086.
CAEPA. 1998. Fresh Water Bioassay Study and Development of Freshwater Point-of-Compliance
Concentrations, Presidio of California: California Environmental Protection Agency, Regional
Water Quality Control Board, San Francisco Bay Area Region, Board Order No. 96-070,
Technical Memorandum, October 20, 1998.
CAEPA. 1999. Adoption of Revised Site Cleanup Requirements - San Francisco International
Airport: California Environmental Protection Agency, Regional Water Quality Control Board,
San Francisco Bay Area Region, Board Order No. 99-045.
CAEPA. 2016. Screening for Environmental Concerns at Sites with Contaminated Soil and
Groundwater: California Environmental Protection Agency, Regional Water Quality Control
Board, San Francisco Bay Area Region.
Gustafson, J.; Tell, J.G. and D. Orem. 1997. Total Petroleum Hydrocarbon Working Group Series,
Volume 3: Selection of Representative TPH Fractions Based on Fate and Transport
Considerations; Association for Environmental Health and Sciences: Amherst, MA, USA.
HIDOH. 2012. Field Investigation of the Chemistry and Toxicity of TPH in Petroleum Vapors:
Implications for Potential Vapor Intrusion Hazards; Hawai’i Department of Health, Office of
Hazard Evaluation and Emergency Response, http://eha-web.doh.hawaii.gov/eha-
cma/Leaders/HEER/EALs
HIDOH. 2016. Technical Guidance Manual: Hawai′i Department of Health, Hazard Evaluation
and Emergency Response. August 2016.
HIDOH. 2017. Evaluation of Environmental Hazards at Sites with Contaminated Soil and
Groundwater – Tropical Pacific Edition (Fall 2017): Hawai‘i Department of Health, Hazard
Evaluation and Emergency Response.
Hostettler, F.D., Wang, Y., Huang, Y.S., Cao, W.H, Bekins, B.A., Rostad, C.E., Kulpa, C.F., and
A. Laursen. 2008. Forensic Fingerprinting of Oil-Spill Hydrocarbons in a Methanogenic
Environment-Mandan, ND and Bemidji, MN: Environmental Forensics, 8 (1): 139-153. DOI:
10.1080/15275920601180685.
IDEM. 2010. Risk Integrated System of Closure, Technical Resource Guidance Document:
Indiana Department of Environmental Management, June 2010.
ITRC. 2012. Incremental Sampling Methodology: Interstate Technology Regulatory Council,
February 2012.
ITRC. 2014. Petroleum Vapor Intrusion: The Interstate Technology & Regulatory Council.
October 2014.
TPH Risk Case Studies (HIDOH, October 2018)
Attachment 4 – Example TPH Screening Levels
102
ITRC, 2018 (in preparation). TPH Risk Evaluation at Petroleum Contaminated Sites: Interstate
Technology & Regulatory Council. Washington D.C.
Lahvis, M. 2018. Vertical screening distances for total petroleum hydrocarbon for vapour intrusion
risk assessment at petroleum underground storage tank sites: Quarterly Journal of Engineering
Geology and Hydrogeology, Vol. 51: 3–12.
MADEP. 1994. Background Documentation for the Development of the MCP Numerical
Standards: Massachusetts Department of Environmental Protection, Bureau of Waste Site
Cleanup and Office of Research and Standards. April 1994.
MADEP. 1996. Implementation of the VPH/EPH Approach: Massachusetts Department of
Environmental Protection. May 1996.
MADEP. 1997. Characterizing Risks Posed by Petroleum Contaminated Sites: Implementation of
the MADEP VPH/EPH Approach (and supporting spreadsheet, May 25, 1999): Massachusetts
Department of Environmental Protection.
MADEP. 2002. Characterizing Risks Posed by Petroleum Contaminated Sites (Policy No. WSC-
02-41-1): Massachusetts Department of Environmental Protection. October 2002.
MADEP. 2003. Updated Petroleum Hydrocarbon Fraction Toxicity Values for the VPH/EPH/EPH
Methodology: Massachusetts Department of Environmental Protection, Bureau of Waste Site
Cleanup. November 2003.
MADEP. 2007. Sediment Toxicity of Petroleum Hydrocarbon Fractions: Massachusetts
Department of Environmental Protection, Bureau of Waste Site Cleanup, Office of Research
and Standards. September 2007.
MADEP. 2014. MCP Numerical Standards Development Spreadsheets: Massachusetts
Department of Environmental Protection, Bureau of Waste Site Cleanup. Updated June 2014.
McKee, J.E. and H.W. Wolf. 1963, Water Quality Criteria: California State Water Resources
Control Board, Publication 3-A (reprint June 1, 1974).
TPHCWG. 1998. Analysis of Petroleum Hydrocarbons in Environmental Media: Total Petroleum
Hydrocarbon Criteria Working Group (ed. Wade Weisman), Amherst Scientific Publishers,
Amherst, Massachusetts.
USEPA. 1980. SNARL for Fuel Oil 12 or Kerosene: U.S. Environmental Protection Agency,
Office of Drinking Water. March 19, 1980.
USEPA. 2002. Supplemental Guidance for Developing Soil Screening Levels for Superfund Sites:
U.S. Environmental Protection Agency, Solid Waste and Emergency Response, OSWER
9355.4-24, December 2002.
USEPA. 2009. Provisional Peer-Reviewed Toxicity Values for Complex Mixtures of Aliphatic
and Aromatic Hydrocarbons: U.S. Environmental Protection Agency, Superfund Health Risk
Technical Support Center, National Center for Environmental Assessment, Office of Research
and Development, September 30, 2009.
USEPA. 2013. Evaluation of Empirical Data to Support. Soil Vapor Intrusion Screening Criteria
for Petroleum Hydrocarbon Compounds: U.S. Environmental Protection Agency, Office of
Underground Storage Tanks, EPA 510-R-13-001, OSWER 9355.4-24.
TPH Risk Case Studies (HIDOH, October 2018)
Attachment 4 – Example TPH Screening Levels
103
USEPA. 2015a. Technical Guide for Addressing Petroleum Vapor Intrusion at Leaking
Underground Storage Tank Sites: .S. Environmental Protection Agency, Office of
Underground Storage Tanks, June 2015, Washington, D.C., EPA 510-R-15-001.
USEPA. 2015b. Assessing and Mitigating the Vapor Intrusion Pathway from Subsurface Vapor
Sources to Indoor Air: U.S. Environmental Protection Agency, Office of Solid Waste and
Emergency Response, June 2015, Washington, D.C., OSWER Publication 9200.2-154.
USEPA. 2017. Regional Screening Levels: U.S. Environmental Protection Agency, Superfund,
June 2017.
Zemo, D.A. and K.T. O’Reilly. 2016. On the Basis for the 0.1 mg/L Water Quality Objective for
“Taste and Odor” for Diesel in Groundwater (Letter to the Editor): Groundwater Monitoring
& Remediation 36, No. 3. Summer 2016.

TPH Risk Case Studies (HIDOH, October 2018)
Attachment 4 – Example TPH Screening Levels
104
Table 1. Release Discovery Site or Area Specific Characterization by Type of Petroleum
Release (Soil, Sediment, Groundwater, Surface water, Air).
Petroleum Product
Released
Soil/Sediment/Water Air
1
TPH Analytical
Methods
Additional
Considerations
1
TPH Analytical
Method
Additional
Considerations
Gasoline
TPH (USEPA
8015 B/C) and/or
Carbon Range
Methods
BTEXN (USEPA
Method 8260); test for
oxygenates/
additives based on
CSM
TPH and/or
Carbon Range
Methods (e.g.,
TO-15 and/or
TO-17)
Test for BTEX,
SVOCs/PAHs,
oxygenates/
additives based on
CSM.; silica-lined
canisters are
recommended to
improve recovery
Light Petroleum
Solvents (naphtha,
Stoddard Solvent,
mineral spirits, paint
thinner, etc.)
TPH (USEPA
8015 B/C) and/or
Carbon Range
Methods
Test for BTEXN
(Method 8260),
SVOCs/PAHs
(Method 8270), etc.,
b
ased on CSM
Jet Fuels and
Kerosene
TPH (USEPA
8015 B/C) and/or
Carbon Range
Methods
Test for BTEXN
(Method 8260),
SVOCs/PAHs
(Method 8270), etc.,
based on CSM
#2 Fuel Oil, Diesel
TPH (USEPA
8015 B/C) and/or
Carbon Range
Methods
Test for BTEXN
(Method 8260),
SVOCs/PAHs
(Method 8270), etc.,
b
ased on CSM
#3 - #6 Fuel Oils,
Lubricating Oils,
and Hydraulic Oils
TPH (USEPA
8015 B/C) and/or
Carbon Range
Methods
Test for SVOCs and
targeted PAHs
(Method 8270) based
on CSM
considerations
TPH and/or
Carbon Range
Methods (e.g.,
TO-15 and/or
TO-17) if CSM
suggests volatile
aliphatics
Test for PAHs
(Method TO-17)
based on CSM;
consider using
sorbent methods
Waste Oils, Used
Oils, and Unknown
Petroleum
Substances
TPH (USEPA
8015 B/C) and/or
Carbon Range
Methods based on
CSM
Test for BTEXN and
solvents (Method
8260), oxygenates/
additives,
VOCs/PAHs (Method
8270) and other
compounds (e.g.,
metals, PCBs) based
on CSM
TPH and/or
Carbon Range
Methods (e.g.,
TO-15 and/or
TO-17) if CSM
suggests volatile
aliphatics
Test for BTEX and
solvents,
oxygenates/
additives,
VOCs/PAHs, etc.,
based on CSM
Notes:
1. Lab methods noted for example only. Carbon Range evaluation methods for release discovery
characterization of petroleum releases should be in accordance with appropriate Federal, State, Local and
Tribal stakeholder guidelines. Refer to HIDOH (2016) and HIDOH (2017) for additional information on
general sampling strategies and analytical methods.

TPH Risk Case Studies (HIDOH, October 2018)
Attachment 4 – Example TPH Screening Levels
105
Table 2. Default carbon range makeup of TPH in petroleum fuels used to develop HIDOH
(2017) screening levels.
Carbon Range
1
TPH
gasoline
1
TPH
diesel
2
TPH
resfuels
C5-C8 aliphatics 45% 0.4% 0%
C9-C18 aliphatics 12% 35.2% 0%
C19+ aliphatics 0% 42.6% 75%
C9-C16 aromatics 43% 21.8% 25%
1. Indiana Department of Environmental management (IDEM 2010).
2. Massachusetts DEP (MADEP 1996).
Table 3. Default carbon range makeup of TPH in petroleum fuel vapors
used to develop HIDOH (2017) screening levels.
Carbon Range
1
TPH
gasoline
2
TPH
diesel
C5-C8 aliphatics 77.3% 25%
C9-C18 aliphatics 7.3% 75%
C9-C16 aromatics 15.4% 0%
1. Median carbon range makeup of gasoline vapors in USEPA Petroleum Vapor Intrusion database
(USEPA 2013; see Brewer et al. 2013).
2. HIDOH (2012) soil vapors study and published information (see also Brewer et al. 2013).

TPH Risk Case Studies (HIDOH, October 2018)
Attachment 4 – Example TPH Screening Levels
106
Table 4. Default physiochemical constants for TPH carbon ranges used to develop example
screening levels.
1
Chemical/
Carbon Range
Molecular
Weight
2
Vapor
Pressure
(mmHg)
Solubility
in Water
(µg/L)
Henry’s
Constant
(unitless)
Partition
Coeff, k
oc
(cm
3
/g)
Diffusion
Coefficient
(cm
2
/s)
air water
C5-C8
Aliphatics
93 76 11,000 54 2,265 0.08 1 x 10
-5
C9-C12
Aliphatics
149 0.66 70 65 150,000 0.07 1 x 10
-5
C9-C18
Aliphatics
170 0.11 10 69 680,000 0.07 5.0 x 10
-6
C19-C36
Aliphatics
270 0.0008 0.0015 4,900 6.3x10
8
- -
C9-C10
Aromatics
120 2.2 51,000 0.33 1,778 0.07 1 x 10
-5
C11-C22
Aromatics
150 0.024 5,800 0.03 5,000 0.06 1 x 10
-5
1. Constants from Massachusetts Department of Environmental Protection (MADEP 2002) except constants from C19-
C36 Aliphatics (Gustafson et al., 1997; based on EC>16-35 aliphatics).
2. Converted from atmospheres in original guidance (1atm = 760 mmHg).
Table 5. Default physiochemical constants for carbon range-weighted TPH fractions used to
develop example screening levels.
TPH Type
Molecular
Weight
Vapor
Pressure
(mm
Hg)
Solubility
in Water
(µg/L)
Henry’s
Constant
(unitless)
Partition
Coeff, k
oc
(cm
3
/g)
Diffusion
Coefficient
(cm
2
/s)
air water
TPH
gasolines
119 300 150,000 32.2 5,000 0.07 0.00001
1
TPH
middle
distillates
201 1.0 51,000 23.2 5,000 0.07 0.00001
TPH
residual fuels
236 - 5,000 - - - -
1. Referred to as TPHdiesel (TPHd) for general comparison to site data in case studies. Solubility of weathered diesel
based on solubility of C9-C10 aromatics (MADEP 2002) to reflect increased solubility and mobility of petroleum-
related metabolites (HIDOH 2017).

TPH Risk Case Studies (HIDOH, October 2018)
Attachment 4 – Example TPH Screening Levels
107
Table 6.
1
Theoretical partitioning of TPH carbon range fractions in
vadose-zone soils.
Chemical/
Carbon Range
2
Silty Sand
Sorbed to
Soil Particles
Dissolved in
Soil Moisture
Vapor in
Soil Pore Space
C5-C8 Aliphatics 18.0% 0.8% 81.2%
C9-C12 Aliphatics 92.4% 0.1% 7.6%
C9-C18 Aliphatics 98.1% 0.0% 1.9%
C19-C36 Aliphatics 99.85% 0.00% 0.15%
C9-C10 Aromatics 91.6% 5.2% 3.2%
C11-C22 Aromatics 97.9% 2.0% 0.1%
1. For example only. Based on partitioning equations presented in the USEPA Soil Screening
Levels guidance, (USEPA 2002). Raoult’s Law for partitioning of compounds from fuel
mixtures not considered.
2. Silty Sand: Total Organic Carbon = 0.001, Air-Filled Porosity = 28%, Water-Filled
Porosity = 15%.

TPH Risk Case Studies (HIDOH, October 2018)
Attachment 4 – Example TPH Screening Levels
108
Table 7. Published ingestion and inhalation toxicity factors for petroleum aliphatic and aromatic carbon ranges.
Reference
RfD
(mg/kg-day)
RfC
(mg/m3)
R
eference
RfD
(mg/kg-day)
RfC
(mg/m3)
1
TPH Criteria Working Group (1997)
4
California EPA (2009)
(C5-C8) Aliphatics
5.0 18.4
(C5-C8) Aliphatics
0.04 0.7
(C9-16) Aliphatics
0.1 1.0
(C9-C18) Aliphatics
0.1 0.3
(C17-C35) Aliphatics
2.0 -
(C19-C32) Aliphatics
2.0 -
(C9-C16) Aromatics
0.04 0.2
(C9-16) Aromatics
0.03 0.05
(C17-C35) Aromatics
0.03 -
(C17-C32) Aromatics
0.03 -
2
ATSDR (1999)
5
USEPA/NCEA (2009)
(EC5-EC8) Aliphatics
- 2.2
(C5-C8) Aliphatics (noncancer)
- 0.6
(>EC8-EC16) Aliphatics
- 0.3
(C9-C18) Aliphatics
0.01 0.1
(>EC16-EC35) Aliphatics
- -
(C19-C32) Aliphatics
3.0 -
(EC9-EC16) Aromatics
- 0.01
(C9-C16) Aromatics
0.03 0.1
(>EC16-EC35) Aromatics
- -
(C17-C32) Aromatics
0.04 -
Massachusetts DEP (2003)
6
USEPA (2016)
(C5-C8) Aliphatics
0.04 0.2
(C5-C8) Aliphatics (noncancer)
- 0.6
(C9-C18) Aliphatics
0.1 0.2
(C9-C18) Aliphatics
0.01 0.1
(C19-C36) Aliphatics
2.0 -
(C19-C32) Aliphatics
3.0 -
(C9-C10) Aromatics
0.03 0.05
(C9-C16) Aromatics
0.004 0.03
(C11-C22) Aromatics
0.03 -
(C17-C32) Aromatics
0.04 -
3
Washington DOE (2006)
(EC5-EC8) Aliphatics
1.7 6.0
(>EC8-EC16) Aliphatics
0.03 0.3
(>EC16-C34) Aliphatics
2.0 -
(EC9-EC10) Aromatics
0.1 0.399
(>EC10-EC12) Aromatics
0.02 0.003
(>EC12-EC16) Aromatics
0.05 0.2
(>EC16-EC21) Aromatics
0.03 -
(>EC21-EC34) Aromatics
0.04 -
TPH Risk Case Studies (HIDOH, October 2018)
Attachment 4 – Example TPH Screening Levels
109
Table 7. Published ingestion and inhalation toxicity factors for petroleum aliphatic and aromatic carbon ranges (cont.).
1. TPHCWG. Equivalent carbon number.
2. ATSDR. Equivalent carbon number. Inhalation only; C5-C8 aliphatics RfC converted to 2.2mg/m
3
from 0.6 ppm based on hexane molecular weight of 86; C9-C16
aromatics RfC converted to 0.01mg/m
3
from 0.002 ppm based on naphthalene molecular weight of 128.
3. Washington DOE. Equivalent carbon number. Inhalation Reference Dose presented in units of mg/kg-day. Extrapolated to a Reference Concentration using RfC
(mg/m
3
) = RfD (mg/kg-day) x70kg x (1/20m
3
-day).
4. California EPA toxicity factors currently under review for updates.
5. USEPA National Center for Environmental Assessment (NCEA) toxicity factors selected for calculation of risk-based indoor air and soil vapor screening levels.
Reference includes comparable Equivalent Carbon numbers.
6. USEPA Regional Screening Levels.
References for TPH Toxicity Factors
ATSDR. 1999. Toxicological Profile for Total Petroleum Hydrocarbons; U.S. Department of Health and Human Services, Agency for Toxic
Substances and Disease Registry: Atlanta, GA, USA.
CAEPA. 2009. Evaluating Human Health Risks from Total Petroleum Hydrocarbons; California Department of Toxic Substances Control,
Human and Ecological Risk Division: Sacramento, CA, USA.
MADEP. 2003. Updated Petroleum Hydrocarbon Fraction Toxicity Values for the VPH/EPH/EPH Methodology; Massachusetts Department
of Environmental Protection, Bureau of Waste Site Cleanup: Boston, MA, USA.
Tveit, A., Hayes, L.A., Youngren, S.H. and D.V. Nakles. 1997. Development of Fraction Specific Reference Doses (RfDs) and Reference
Concentrations (RfCs) for Total Petroleum Hydrocarbons. Total Petroleum Hydrocarbon Working Group Series; Association for
Environmental Health and Sciences: Amherst, MA, USA, 1997, Volume 4.
USEPA. 2009. Provisional Peer-Reviewed Toxicity Values for Complex Mixtures of Aliphatic and Aromatic Hydrocarbons; U.S.
Environmental Protection Agency, Superfund Health Risk Technical Support Center, National Center for Environmental Assessment,
Office of Research and Development: Washington, DC, USA.
USEPA. 2016. Regional Screening Levels: U.S. Environmental Protection Agency, Superfund, May 2016.
WADOE. 2006. Cleanup Levels and Risk Calculations Focus Sheets: Reference Doses for Petroleum Mixtures; Washington Department of
Ecology: Lacey, WA, USA.

TPH Risk Case Studies (HIDOH, October 2018)
Attachment 4 – Example TPH Screening Levels
110
Table 8. Carbon range toxicity factors and absorption factors selected by HIDOH (2017)
for development of carbon range-weighted, TPH screening levels.
Carbon Range
RfD
0ral
(mg/kg-day)
RfC
(µg/m
3
)
1
GI
Absorption
Factor
(unitless)
1
Skin
Absorption
Factor
(unitless)
C5-C8 aliphatics
2
0.04
3
600 1 -
C9-C18 aliphatics
3
0.01
3
100
1 -
C19-C36 aliphatics
3
3.0
4
nv 1 -
C9-C10 aromatics
3
0.03
3
100
1 -
C11-C22 aromatics
3
0.03
3
100 1 0.1
1. Absorption factors referenced for carbon ranges in USEPA Regional Screening Levels guidance (USEPA 2017).
Skin absorption factors differ from MADEP (2002) default values but do not significantly affect final soil direct
exposure screening levels (default factors of 1.0, 0.5 and 0.1 applied to C5-C8 aliphatics, C9-C18 aliphatics and C9-
C10 aromatics, and C19-C36 and C11-C22 aromatics, respectively). GI – Gastrointestinal.
2. MADEP 2003.
3. USEPA 2009.
4. Not significantly volatile. C17+ aromatics not considered separately.
Table 9.
1
Weighted TPH toxicity factors for fuels and fuel vapors (HIDOH 2012, 2017).
TPH Category
RfD
0ral
(mg/kg-day)
RfC
(µg/m
3
)
Gastro-Intestinal
Absorption
Factor
(unitless)
Skin
Absorption
Factor
(unitless)
TPH
gasolines
0.03 281 1 -
2
TPH
middle distillates
0.02 126 1 0.1
TPH
residual fuels
0.12 - 1 0.1
Notes:
1.WeightedRfC
μg
m
3
1
FractionC5C8Aliphatics
C5C8AliphaticsRfC
FractionC9C18Aliphatics
C9C18AliphaticsRfC
FractionC9C16Aromatics
C9C16AromaticsRfC
2. Referred to as TPHdiesel (TPHd) for general comparison to site data in case studies.

TPH Risk Case Studies (HIDOH, October 2018)
Attachment 4 – Example TPH Screening Levels
111
Table 10.
1
Human exposure parameter values used to calculate example screening levels.
Symbol Definition (units)
2
MADEP
(2014)
Default
3
HIDOH
(2017)
Default
1
THQ Tar
g
et hazard quotient 0.2 1.0
BWc Bod
y
wei
g
ht, child (k
g
) 17 15
BWa Bod
y
wei
g
ht, adult occupational (k
g
) 61.1 80
SAc Exposed skin area, child (c
m
2
/da
y
) 2,431 3,527
SAaw Exposed skin area, adult occ. (c
m
2
/da
y
) 3,473 2,373
AFc Adherence factor, child (m
g
/c
m
2
) 0.35 0.20
AFaw Adherence factor, adult occ. (m
g
/cm
2
) 0.03 0.12
IRWc Drinkin
g
water in
g
estion – child (L/da
y
) 1 1
IRSc Soil in
g
estion – child (m
g
/da
y
) 100 200
IRSo Soil in
g
estion – adult occ. (m
g
/da
y
) 50 100
EF
r
Exposure frequenc
y
– child (d/
y
) 150 350
EFo Exposure frequenc
y
– occupational (d/
y
) 120 250
EDc Exposure duration – child (
y
ears) 7 6
EDo Exposure duration – occupational (
y
ears) 7 25
THQ Tar
g
et noncancer Hazard Quotient 0.1 1.0
1. Residential exposure scenario for noncancer, exposure focuses on early childhood exposure.
2. Used by MADEP (2014) to develop carbon range-specific screening levels.
3. Used by HIDOH (2017) to develop carbon range-weighted TPH screening levels (after USEPA 2017).
Table 11. Default soil and volatilization factor parameters used in
screening level models (USEPA 2017).
Paramet
er
Definition (units) Default
ρ
b
Dr
y
soil bulk densit
y
(
g
/c
m
3
) 1.50
ρs Soil particle densit
y
(
g
/c
m
3
) 2.65
θn Total soil porosit
y
(Lpore/Lsoil) 0.43 or 1 – (b/s)
θw Wate
r
-filled soil porosit
y
(Lwater/Lsoil) 0.15
θa Air filled soil porosit
y
(Lair/Lsoil) 0.28 or n-w
foc Fraction or
g
anic carbon in soil (
g
/
g
) 0.006 (0.6%)

TPH Risk Case Studies (HIDOH, October 2018)
Attachment 4 – Example TPH Screening Levels
112
Table 12. Example water and sediment screening levels for TPH carbon ranges.
Fraction
1
Drinking Water
Toxicity
(µg/L)
2
Drinking Water
Taste and Odors
(µg/L)
3
Acute
Aquatic Toxicity
(µg/L)
4
Chronic
Aquatic Toxicity
(µg/L)
5
Sediment
(mg/kg oc)
6
Vapor
Intrusion
(µg/L)
C5-C8 Aliphatics 24
Total 500 to
1,000
250 218 1,591 3,000
C9-C18 Aliphatics 43 1,800 0.05 5,543 5,000
C19-C36 Aliphatics 6,800 2,100 0.0001 9,883 N/A
C9-C10 Aromatics 9.7 540 59.4 236 4,000
C11-C22 Aromatics 13 N/A 2.8 92 50,000
1. MADEP (2014). Target Hazard Quotient = 0.2. Calculated screening level referenced final published drinking water screening level based on previously
promulgated standard (not shown in table).
2. HIDOH (2017); drinking water taste and odor thresholds for individual carbon ranges not available. Based on review of data compiled by McKee and Wolf
(1963); see also Zemo and O’Reilly (2016).
3. MADEP (2002).
4. MADEP (2007). Chronic screening level for C13-C18 Aliphatics and C19-C36 Aliphatics exceeds mean aqueous solubility; dissolved-phase compounds
likely not toxic.
5. MADEP (2007). Based on chronic aquatic toxicity screening levels and 100% organic carbon (adjust with respect to site-specific fraction organic carbon
data).
6. Vapor intrusion not considered (use soil vapor data).

TPH Risk Case Studies (HIDOH, October 2018)
Attachment 4 – Example TPH Screening Levels
113
Table 13. Example water and sediment screening levels for carbon range-weighted
1
TPH.
Fraction
1
Drinking Water
Toxicity
(µg/L)
2
Drinking Water
Taste and Odors
(µg/L)
3
Chronic
Aquatic Toxicity
(µg/L)
4
Sediment
(mg/kg)
5
Vapor
Intrusion
(µg/L)
6
Gross
Contamination
(µg/L)
TPH
gasolines
300 (600) 500 to 1,000 500 - - 5,000
7
TPH
middle distillates
400 500 to 1,000 640 - - 5,000
TPH
residual fuels
2,400 500 to 1,000 640 - - 2,500
1. HIDOH (2017). Assumes TPH carbon range makeup of fuels noted in Table 2; considers both an ingestion and inhalation exposure pathway (parentheses = ingestion
only). Compounds included under TPHmiddle distillates assumed to be dominated by nonvolatile, degradation compounds; inhalation pathway assumed to be insignificant.
2. HIDOH (2017); based on review of data compiled by McKee and Wolf (1963); see also Zemo and O’Reilly (2016).
3. CAEPA (1998, 1999) as summarized in HIDOH (2017); freshwater.
4. Sediment screening levels not included in HIDOH (2017).
5. Vapor intrusion not considered (use soil vapor data).
6. HIDOH (2017). Potential free product, sheens and/or heavy odors (after MADEP 1997). Excludes drinking water taste and odor concerns.
7. Referred to as TPHdiesel (TPHd) for general comparison to site data in case studies.

TPH Risk Case Studies (HIDOH, October 2018)
Attachment 4 – Example TPH Screening Levels
114
Table 14. Example
1
soil screening levels for TPH carbon ranges.
Fraction
2,3
Direct
Exposure
Residential
(mg/kg)
2,4
Direct
Exposure
C/I
(mg/kg)
5,6
Leaching
Drinking
Water
(mg/kg)
5,6
Leaching
Aquatic
Toxicity
(mg/kg)
7
Gross
Contamination
- Residential
(mg/kg)
7
Gross
Contamination -
Commercial
(mg/kg)
C5-C8
Aliphatics
1,200 (120) 22,000 (460) 210 1,900 100 (1,000) 500 (1,000)
8
C9-C18
Aliphatics
3,000 (1,300) 54,000 (5,400) NA 6.2 500 (3,000) 1,000 (3,000)
9
C19-C36
Aliphatics
61,000 >1,000,000 NA NA 3,000 (5,000) 5,000 (5,000)
C9-C10
Aromatics
910 (240) 16,000 (1,000) 3.3 20 100 (1,000) 500 (1,000)
C11-C22
Aromatics
2,100 (750) 46,000 (4,800) 11 2.3 500 (3,000) 1,000 (3,000)
Reference: MADEP (2014) unless noted.
1. Vapor intrusion risk not considered; refer to Table 20 for soil vapor screening levels.
2. MADEP (2014) soil screening levels for direct exposure only consider ingestion and dermal exposure (first number). Screening level in parentheses reflects additional
consideration of inhalation exposure to vapors in outdoor air, calculated based on USEPA Regional Screening Level (RSL) models for direct exposure to volatile chemicals
in soil (USEPA 2017). MADEP inhalation toxicity factors in Table 7 and MADEP exposure assumptions noted in Table 10 used in place of USEPA defaults.
3. Target Hazard Quotient = 0.2. Residential direct exposure screening level assumptions include: A) Soil ingestion rate = 100 mg/day, B) Exposure Frequency 5 days/week,
30 weeks/year and C) Exposure duration = 7 years.
4. Target Hazard Quotient = 0.2. Commercial/Industrial direct exposure screening level assumptions include: A) Soil ingestion rate = 50 mg/day, B) Exposure Frequency 4
days/week, 30 weeks/year and C) Exposure duration = 7 years.
5. Soil screening levels for leaching concerns not included in MADEP guidance. Screening levels presented calculated based on toxicity-based drinking water screening level
and chronic aquatic toxicity screening level using MADEP (1994) soil leaching model and default physiochemical constants noted in Table 4.
6. “NA” = Not applicable. Correlative groundwater screening level exceeds solubility limit for noted carbon range (see Table 12).
7. Gross contamination screening levels for exposed or near surface soil and deeper, subsurface soils (latter in parentheses). Based on assumed vapor pressure of individual
carbon ranges in absence of ORT values (refer to Table 18); intended to indicate potential nuisance/odor concerns for surface soils and potential short-term vapor risks,
sheens and runoff concerns, etc., for deeper soils (MADEP 1996, 2014).
8. MADEP (2007) sediment screening level guidance states that solubility of C13-C18 aliphatics likely to be lower than predicted screening level for chronic, aquatic
toxicity. If so then noted leaching based screening level is not valid.
9. C19-C36 aliphatics considered immobile (MADEP 2002).

TPH Risk Case Studies (HIDOH, October 2018)
Attachment 4 – Example TPH Screening Levels
115
Table 15. Example carbon range-weighted
1
TPH screening levels for soil.
Fraction
2,3
Direct
Exposure
Toxicity -
Residential
(mg/kg)
2,4
Direct
Exposure
Toxicity -
Commercial
(mg/kg)
5
Leaching
Drinking
Water
(mg/kg)
5
Leaching
Non-Drinking
Water
(mg/kg)
6
Gross
Contamination
- Residential
(mg/kg)
6
Gross
Contamination -
Commercial
(mg/kg)
TPH
gasolines
450 2,000 (2,300) 700 1,200 100 (2,000) 500 (2,000)
7
TPH
middle distillates
220 500 (1,000) 940 1,500 500 (5,000) 500 (5,000)
TPH
residual fuels
9,400 140,000 5,000 5,000 500 (5,000) 2,500 (5,000)
Reference: HIDOH (2017) unless noted.
1. Vapor intrusion risk not considered; refer Table 21 for soil vapor screening levels.
2. HIDOH (2017). Assumes TPH carbon range makeup of fuels noted in Table 2.
3. Target Hazard Quotient = 1.0. Residential direct exposure screening levels exposure assumptions include: 1) Soil ingestion rate = 200 mg/day, 2)
Exposure Frequency 350 days/year and 3) Exposure duration = 6 years.
4. Target Hazard Quotient = 1.0. Commercial direct exposure screening levels exposure assumptions include: 1) Soil ingestion rate = 100 mg/day, 2)
Exposure Frequency 250 days/year and 3) Exposure duration = 6 years. Soil saturation limits referred to for final Commercial/Industrial TPHg and
TPHmd direct-exposure screening levels. Unadjusted, original, direct-exposure screening levels noted in parentheses.
5. Refer to water screening levels in Table 13. Calculated using soil leaching model published by MADEP (2014) for individual chemicals (see also
MADEP 1994). Soil leaching screening levels for TPH
residual fuels
from CAEPA 1996 and based on profession judgment.
6. Gross contamination screening levels intended to indicate potential short-term vapor risks from disturbance of contaminated soil, sheens and runoff
concerns, etc.; (after MADEP 1994); exposed surface soil and (in parentheses) subsurface soils (>3 feet below ground surface).
7. Referred to as TPHdiesel (TPHd) for general comparison to site data in case studies.

TPH Risk Case Studies (HIDOH, October 2018)
Attachment 4 – Example TPH Screening Levels
116
Table 16a. Example toxicity-based TPH carbon range
screening levels for indoor air based on MADEP (2014)
inhalation toxicity factors.
1
RfC
(µg/m
3
)
2
Indoor Air
Fraction
Residential
Commercial/
Industrial
(µg/m
3
) (µg/m
3
)
C5-C8 aliphatics
200 210 880
C9-C18 aliphatics
200 210 880
C19+ aliphatics
- - -
C9+ aromatics
50 52 220
1. MADEP (2014) inhalation reference concentrations.
2. MADEP (2014). Assumes target noncancer Hazard Quotient = 1.0
(requires site-specific calculation of cumulative risk). Commercial/Industrial
indoor air screening levels not included in MADEP (2014) guidance;
calculated using USEPA (2016) default exposure time, frequency and
duration assumptions and MADEP Reference concentrations for target
carbon ranges.
Table 16b. Example toxicity-based TPH carbon range
screening levels for indoor air based on HIDOH (2017)
inhalation toxicity factors.
1
RfC
(µg/m
3
)
2
Indoor Air
Fraction
Residential
Commercial/
Industrial
(µg/m
3
) (µg/m
3
)
C5-C8 aliphatics
600 630 2,600
C9-C18 aliphatics
100 100 440
C19+ aliphatics
- - -
C9+ aromatics
100 100 440
1. HIDOH (2017) inhalation reference concentrations.
2. Assumes target noncancer Hazard Quotient = 1.0 (requires site-specific
calculation of cumulative risk). Indoor air screening levels for carbon
ranges not included in HIDOH (2017) guidance; calculated using USEPA
(2016) default exposure time, frequency and duration assumptions

TPH Risk Case Studies (HIDOH, October 2018)
Attachment 4 – Example TPH Screening Levels
117
Table 17. Example toxicity-based screening levels for carbon
range-weighted screening levels for
1
TPH in indoor air.
1
RfC
(µg/m
3
)
2
Indoor Air
Fraction
Residential
Commercial/
Industrial
(µg/m
3
) (µg/m
3
)
TPH
gasolines
280 290 1,200
3
TPH
middle distillates
130 130 550
TPH
residual fuels
- - -
1. TPH measured as total C5-C12 hydrocarbons, minus the concentration of
individually evaluated compounds (e.g., benzene).
2. HIDOH (2017). Assumes target noncancer Hazard Quotient = 1.0 and TPH
carbon range makeup of vapors noted in Table 3.
3. Referred to as TPHdiesel (TPHd) for general comparison to site data in
case studies.

TPH Risk Case Studies (HIDOH, October 2018)
Attachment 4 – Example TPH Screening Levels
118
Table 18. Example indoor air background and Odor
Recognition Thresholds for
1
TPH carbon ranges.
Fraction
1
Indoor Air
Background
(µg/m
3
)
2
50% ORT
(µg/m
3
)
C5-C8 Aliphatics 330 NA
C9-C18 Aliphatics 100 NA
C19-C36 Aliphatics - -
C9-C10 Aromatics 44 NA
C11-C22 Aromatics 50 NA
1. MADEP (2014); included in groundwater screening levels spreadsheet.
2. Odor recognition Thresholds for individual carbon ranges not include in
MADEP (2014) guidance.
Table 19. Example indoor air background and Odor
Recognition Thresholds for TPH.
1. After MADEP (2014). Background indoor air data for TPH
gasolines
and
TPH
middle distillates
not available. Total background TPH assumed equal sum of
background for individual carbon ranges noted in Table 18.
2. HIDOH (2017). TPH Odor Recognition Threshold (ORT) after NJDHP
(NJDPH 2008, 2010); ORTs for TPHg (0.25ppm) and TPHd (0.7ppm) adjusted
to µg/m3 based on assumed molecular weights of 119 and 201, respectively.
ORTs not available for individual carbon ranges.
3. Referred to as TPHdiesel (TPHd) for general comparison to site data in case
studies.
Fraction
1
Indoor Air
Background
(µg/m
3
)
2
50% ORT
(µg/m
3
)
1
Total TPH 740 -
TPH
gasolines
- 1,100
3
TPH
middle distillates
- 5,000

TPH Risk Case Studies (HIDOH, October 2018)
Attachment 4 – Example TPH Screening Levels
119
Table 20. Example
1
subslab soil vapor screening levels for carbon range and vapor intrusion (after HIDOH 2017 and Brewer et al.
2014).
2
Climate Zone
C5-C8
Aliphatics
(µg/m
3
)
C9-C12
Aliphatics
(µg/m
3
)
C13-C18
Aliphatics
(µg/m
3
)
3
C19-C36
Aliphatics
(µg/m
3
)
C9-C10
Aromatics
(µg/m
3
)
3
C11-C22
Aromatics
(µg/m
3
)
Cold Climates (R/C-I)
197,000
(1,600,000)
31,000
(275,000)
31,000
(275,000)
(not applicable)
31,000
(275,000)
(not applicable)
Warm Climates (R/C-I)
315,000
(2,600,000)
50,000
(440,000)
50,000
(440,000)
(not applicable)
50,000
(440,000)
(not applicable)
Mediterranean Climates
(R/C-I)
790,000
(6,500,000)
125,000
(1,100,000)
125,000
(1,100,000)
(not applicable)
125,000
(1,100,000)
(not applicable)
Tropical Climates (R/C-I)
1,300,000
(10,000,0000
200,00
(1,800,000)
200,00
(1,800,000)
(not applicable)
200,00
(1,800,000)
(not applicable)
1. Residential screening level; commercial/industrial noted in parentheses. Target noncancer Hazard Quotient = 1.0 (requires site-specific calculation of cumulative risk).
2. Calculated; not included in HIDOH (2017) guidance. Subslab vapor screening levels for vapor intrusion calculated based on division of target indoor air screening level
presented in Table 16b by default, climate-based, subslab attenuation factors published by Brewer et al. (2014): Cold Climate SSAF=0.0032 (0.0016), Warm= Climate
SSAF=0.002 (0.001), Mediterranean Climate SSAF=0.0005 (0.00025), Tropical Climate SSAF=0.0008 (0.0004). Applies to samples collected directly under existing
building slab or 3-5 feet below ground surface in unpaved, open areas (ITRC 2014; HIDOH 2017).
3. C19-C36 aliphatics and C11-C22 aromatics considered insufficiently volatile to pose significant vapor intrusion concerns (MADEP 2002; ITRC 2014).

TPH Risk Case Studies (HIDOH, October 2018)
Attachment 4 – Example TPH Screening Levels
120
Table 21. Example
1
subslab soil vapor screening levels for carbon range-weighted TPH (after
HIDOH 2017 and Brewer et al. 2014).
1. Residential screening level; commercial/industrial noted in parentheses. Target noncancer Hazard Quotient = 1.0.
2. Soil vapor screening levels for vapor intrusion calculated based on target indoor air screening level noted in Table 17
divided by climate-based, subslab attenuation factors published by Brewer et al. (2014); refer to footnote to Table 20.
3. Soil vapor screening levels for tropical climates differ slightly from HIDOH (2017) due to rounding.
4. Residual fuels considered insufficiently volatile to pose significant vapor intrusion concerns (MADEP 2002; ITRC 2014).
2
Climate Zone
TPHg
(µg/m
3
)
TPHd
(µg/m
3
)
4
TPHrf
(µg/m
3
)
Cold Climates (R/C-I)
91,000
(750,000)
41,000
(340,000)
(not applicable)
Warm Climates (R/C-I)
145,000
(1,200,000)
65,000
(550,000)
(not applicable)
Mediterranean Climates (R/C-I)
362,000
(3,000,000)
160,000
(1,400,000)
(not applicable)
3
Tropical Climates (R/C-I)
580,000
(4,800,000)
260,000
(2,200,000)
(not applicable)

TPH Risk Case Studies (HIDOH, October 2018)
Attachment 4 – Example TPH Screening Levels
121
Table 22. Criteria for designation of soil gross contamination screening
levels (HIDOH 2017; after MADEP 1994).
Soil Category Criteria
Gross
Contamination
Screening Level
(mg/kg)
Surface Soils
Unrestricted Land Use
(includes Residential, Schools,
Parkland, etc.)
Odor Index > 100 OR
no Odor Index and Vapor
Pressure > 1 Torr OR
no data
100
0.1 < Odor Index < 100 OR
no Odor Index and Vapor
Pressure < 1 Tor
r
500
Odor Index < 0.1 OR
non-odorous chemical
1000
Industrial/Commercial
Land Use Only
Odor Index > 100 OR
no Odor Index and Vapor
Pressure > 1 Torr OR
no data
500
0.1 < Odor Index < 100 OR
no Odor Index and Vapor
Pressure < 1 Tor
r
1000
Odor Index < 0.1 OR
non-odorous chemical
2500
Subsurface Soils
Unrestricted Land Use
(includes Residential, Schools,
Parkland, etc.)
Odor Index > 100 OR
no Odor Index and Vapor
Pressure > 1 Torr OR
no data
500
0.1 < Odor Index < 100 OR
no Odor Index and Vapor
Pressure < 1 Tor
r
1000
Odor Index < 0.1 OR
non-odorous chemical
2500
Industrial/Commercial
Land Use Only
Odor Index > 100 OR
no Odor Index and Vapor
Pressure > 1 Torr OR
no data
1000
0.1 < Odor Index < 100 OR
no Odor Index and Vapor
Pressure < 1 Tor
r
2500
Odor Index < 0.1 OR
non-odorous chemical
5000
TPH Risk Case Studies (HIDOH, October 2018)
Attachment 5 – Metabolite Screening Levels
122
Attachment 5
Metabolite Screening Levels

TPH Risk Case Studies (HIDOH, October 2018)
Attachment 5 – Metabolite Screening Levels
123
Attachment 5. Example Calculation of Metabolite Suite-Weighted, Screening
Levels for Tapwater
Zemo et al. (2016) evaluate the composition and toxicity of petroleum-related metabolites in
groundwater at different stages of degradation. This offers a refined and more chemical-specific
approach for assessment of health risk posed by petroleum-contaminated groundwater than current
approaches that assume an equivalent toxicity of parent compounds and metabolites (e.g., HIDOH
2017; CAEPA 2016a). The authors place metabolites into five “polar families” or suites of
alcohols, esters/acids, ketones, aldehydes and phenols (Table 1; see also Zemo et al. 2013). These
families are further divided into 22 structural classes of metabolites. Petroleum-contaminated
groundwater is then categorized into four stages of progressive degradation, with Stage 1 (in which
dissolved hydrocarbons are still present within the plume) dominated by alcohols and ketones and
Stage 4 (in which dissolved hydrocarbons are not present) dominated by acids and esters (Figure
1; see Table 1 footnotes for description of each Stage).
The approximate toxicity of each metabolite suite is estimated based on studies for individual
chemicals within that suite and an approach developed by the US Environmental Protection
Agency (USEPA 2002, 2009, 2012) and the United Nations (UNECE 2011) for classification of
chemical toxicity in terms of chronic human health hazard (Table 2). This is similar to the approach
developed for TPH carbon ranges, in which a single toxicity factor is applied to groupings of non-
specific, aliphatic and aromatic hydrocarbons (see Attachment 4). The suitability of the toxicity
classification approach for petroleum-related metabolites is currently being reviewed and debated
(CAEPA 2016a; Hellmann-Blumberg et al. 2016; O’Reilly 2016). Zemo et al. (2016) note that
“…the target analyte list was not expected to be representative of the metabolites mixture as a
whole” and state that that additional justification of the toxicity ranking system will be presented
in future papers. Preliminary recommendations presented in this paper are the most comprehensive
to date, however, and a useful starting point for assessment of the bulk toxicity of metabolites in
comparison to the parent, hydrocarbon compounds.
Zemo et al. (2016) assign a range of oral Reference Dose (RfD) factors to each of the 22 molecular
structural classes within the five “polar families” or suites of metabolites (Table 3). They then
provide an average toxicity ranking profile for each of the 4 stages of biodegradation. Although
not included in the published paper, a logical, next step is to calculate a corresponding range of
weighted toxicity factors for each degradation stage. This can be accomplished in the same manner
as done for aliphatic and aromatic carbon range mixtures discussed in Attachment 4 (see ORDEQ
2003):
WeightedRfD
mg
kgday
1
FractionAlcohols
AlcoholRfDRfC
FractionAcids
AcidsRfD
FractionKetones
KetoneRfD
.
Table 3 presents example, toxicity factors for metabolite mixtures associated with different
degradation stages based on the toxicity ranking for metabolite suites presented in Zemo et al.
(2016). The weighted, oral RfD for the Degradation Stage 1 metabolite suite is estimated to range
TPH Risk Case Studies (HIDOH, October 2018)
Attachment 5 – Metabolite Screening Levels
124
from 0.02 to 0.21 mg/kg-day. The weighted RfD progressively increases (decreasing toxicity)
between subsequent stages to a predicted range of 0.06 to 0.69 mg/kg-day for Stage 4.
The Stage 1 metabolite suite is applicable for plumes in which dissolved hydrocarbons are still
present. The lower range of the RfD for the Degradation Stage 1 metabolite suite of 0.02 mg/kg-
day is identical to the default RfD assigned to diesel-range, Total Petroleum Hydrocarbons (TPHd)
by both Hawaii and California (HIDOH 2017; CAEPA 2016). The RfD is slightly lower (i.e., more
conservative) than the default RfD of 0.03 mg/kg-day assigned to gasoline-range Total Petroleum
Hydrocarbons (TPHg) by these agencies. This implies that, for plumes that still contain dissolved
hydrocarbons, the TPH-related metabolites associated with the initial, ketone- and alcohol-
dominated degradation stages of petroleum hydrocarbons in groundwater could be similar in
toxicity to the parent compounds based on reference to the more conservative end of the
metabolites RfD range. The metabolites in Stage 4 plumes, in which dissolved hydrocarbons are
absent and the plume is downgradient of the smear zone, are estimated to be 2 to 3 times less toxic
than the parent hydrocarbon mixture when using the lower end of the metabolites RfD range.
This comparison can be more directly examined by comparison of published, risk-based screening
levels for TPHg and TPHd to screening levels specific to the noted degradation stage suites of
metabolites. Calculation of risk-based screening levels for parent hydrocarbons requires
consideration of exposure via both ingestion and inhalation, since many of these compounds are
volatile (HIDOH 2017). Oxidized metabolites of hydrocarbons are not considered to be
significantly volatile in comparison to the parent, hydrocarbon compounds (refer to Section 2). A
focus on the ingestion route to assess risk or calculate risk-based screening levels for metabolites
in drinking water (“tapwater”) is therefore appropriate.
Calculation of weighted, risk-based, tapwater screening levels for the metabolite suite associated
with each degradation stage can now be carried out using the USEPA model for tapwater (USEPA
2017). Example tapwater screening levels for metabolites based on the lower- and upper-bound
ranges of toxicity factors noted in Table 3 are presented in Table 4. Focusing the lower-bound
range of toxicity factors generates metabolite-based screening levels of 420 µg/L, 740 µg/L, 1,100
µg/L and 1,400 µg/L for Degradation Stages 1, 2, 3 and 4, respectively. Metabolite screening levels
for Degradation Stages 1 and 2 are somewhat higher than the default, drinking water screening
levels of 300 µg/L and 160 for TPHg and TPHd, respectively, published by Hawaii (HIDOH 2017;
see also CAEPA 2016b). Comparison to a TPHd screening level is most appropriate, since
metabolites generally exhibit a lower volatility than parent, hydrocarbon compounds and can be
expected to elute within this range, based on the use of a diesel-range (extractable) TPH analysis
to measure both hydrocarbons and the metabolites between targeted boiling points. The volatility
of metabolites is anticipated to be too low to pose significant vapor emissions during use of
tapwater. Excluding the inhalation pathway from the Hawaii and California TPH calculations
yields a TPHd screening level of approximately 400 µg/L.
The 420 ug/L screening value implies that, based on ingestion only, the toxicity of metabolite
mixtures associated with the initial stages of petroleum degradation, (i.e., Stage 1, where dissolved
hydrocarbons, high proportion of alcohols and ketones) is for all practical purposes identical to
that of the parent, hydrocarbon mixtures, again assuming use of the most conservative toxicity
factors assigned to each metabolite suite. Zemo et al. (2016) conclude that the metabolites mixture
for the plumes in which dissolved hydrocarbons are absent (Stages 2, 3 and 4) and the plume is
downgradient of the smear zone (Stage 4) are less toxic than the parent hydrocarbons. They suggest
TPH Risk Case Studies (HIDOH, October 2018)
Attachment 5 – Metabolite Screening Levels
125
that dissolved-phase, petroleum-related degradation compounds associated with the less-toxic area
of the plume outside of the smear zone are anticipated to be more representative of the greatest
potential threat to distant, water supply wells, rather than dissolved-phase metabolites associated
with plumes that still contain dissolved hydrocarbons (Stage 1) or are located within the smear
zone source area (Stage 2). This seems reasonable, although the toxicity of the metabolite mixture
in the overall plume that does not contain dissolved hydrocarbons (“Stage 3”) and the area
downgradient of the smear zone (“Stage 4”) require further scrutiny and evaluation.
In each case the screening levels based on the most conservative end of the proposed range of RfD
toxicity factors are likely to be within the range of anticipated taste and odor thresholds for
dissolved-phase TPH in water of 500 µg/L to 1,000 µg/L (see Attachment 4). This implies that the
presence of petroleum-related metabolites in drinking water is likely to be detectable at the point
that the metabolites could pose a significant, long-term health risk.
The metabolite-based toxicity factors and screening levels presented in Table 4 are for example
only and were not carried forward for use in the case studies. A more thorough review of this
promising and potentially more robust approach for assessing the risk posed by petroleum-related
metabolites in water is necessary for full adoption. In the interim, it is reasonable to conservatively
assume that, based on the low end of toxicity ranges, the cumulative toxicity posed by TPH-related
metabolites in drinking water is similar to that of the parent, diesel-range compounds for plumes
in which dissolved hydrocarbons are still present. The cumulative toxicity of TPH-related
metabolites in plumes that do not contain dissolved hydrocarbons is estimated to be less toxic than
the parent compounds by factors of at least 2 to 3. The cumulative risk of both parent compounds
and metabolites would need to be addressed as part of a risk assessment, including both toxicity
and taste and odor concerns.
A more recent review of the Zemo et al. (2016) research and additional data by the Cooperative
Research Centre for Contamination in Australia (CRCC 2018) assigned single, toxicity factors to
individual metabolite groups and degradation stages that are comparable to the uppermost (least
conservative) range of factors proposed in the initial research. If applied, this would lead to
toxicity-based, screening levels for metabolites in drinking water similar to the upper range of
concentrations Table 4. These levels are again likely to be well above acceptable taste and odor
thresholds for drinking water, indicating that additional treatment would be required if the water
were indeed to be utilized as such.
References
CAEPA. 2016a. Petroleum Metabolites Literature Review and Assessment Framework: California
Environmental Protection Agency, Regional Water Quality Control Board, San Francisco Bay
Area Region, June 27, 2016.
CAEPA. 2016b. Screening for Environmental Concerns at Sites with Contaminated Soil and
Groundwater: California Environmental Protection Agency, Regional Water Quality Control
Board, San Francisco Bay Area Region.
CRCC. 2018. Weathered Petroleum Hydrocarbons (Silica Gel Clean-up): Cooperative Research
Centre for Contamination Assessment and Remediation of the Environment, Technical Report
series, no. 40. January 2018.
TPH Risk Case Studies (HIDOH, October 2018)
Attachment 5 – Metabolite Screening Levels
126
Hellmann-Blumberg U, Steenson RA, Brewer RC, Allen E. 2016. Toxicity of polar metabolites
associated with petroleum hydrocarbon biodegradation in groundwater. Environ Toxicol Chem
35:1900–1901.
HIDOH. 2017. Evaluation of Environmental Hazards at Sites with Contaminated Soil and
Groundwater – Tropical Pacific Edition (Fall 2017): Hawai‘i Department of Health, Hazard
Evaluation and Emergency Response, http://eha-web.doh.hawaii.gov/eha-
cma/Leaders/HEER/ehe-guidance---pacific-basin-edition.
McKee, J.E. and H.W. Wolf. 1963, Water Quality Criteria: California State Water Resources
Control Board, Publication 3-A (reprint June 1, 1974).
Oregon DEQ, 2003, Risk-Based Decision Making for the Remediation of Petroleum-Contaminated
Sites: Oregon Department of Environmental Quality, Environmental Cleanup and Tanks
Program, September 2003, http://www.deq.state.or.us/lq/rbdm.htm
O’Reilly, K. 2016. Response to: Toxicity of polar metabolites associated with petroleum
hydrocarbon biodegradation in groundwater. Environ Toxicol Chem 35:1902–1903.
UNECE. 2011. Globally Harmonized System of Classification and Labelling of Chemicals (4
th
ed):
United Nations Economic Commission for Europe. New York (NY) and Geneva (CH)
http://www.unece.org/trans/danger/publi/ghs/ghs_rev02/English/03e_part3.pdf
USEPA. 1980. SNARL for Fuel Oil #2 or Kerosene: U.S. Environmental Protection Agency,
Health Effects Branch, Office of Drinking Water.
USEPA. 1993. Reference Dose (RfD): Description and Use in Health Risk Assessments
(Background Document 1A): U.S. Environmental Protection Agency, Integrated Risk
Information System, March 15, 1993.
USEPA. 2002. A review of the reference dose and reference concentration process: US
Environmental Protection Agency. December 2002. EPA 630-P-02-002F.
https://www.epa.gov/sites/production/files/2014-12/documents/rfd-final.pdf
USEPA. 2004. Preliminary Remediation Goals: U.S. Environmental Protection Agency, Region
IX, October 2004.
USEPA. 2009. Methodology for Risk-Based Prioritization Under ChAMP: US Environmental
Protection Agency, Office of Pollution Prevention and Toxics.
https://ntrl.ntis.gov/NTRL/dashboard/searchResults/titleDetail/PB2010101039.xhtml
USEPA. 2012. TSCA Work Plan Chemicals: Methods Document: U.S. Environmental Protection
Agency, Office of Pollution Prevention and Toxics. February 2012.
USEPA. 2016. Regional Screening Levels: U.S. Environmental Protection Agency, Superfund,
May 2016.
Zemo D.A., O’Reilly K.T., Mohler R.E., Tiwary A.K., Magaw R.I. and K.A., Synowiec. 2013.
Nature and estimated human toxicity of polar metabolite mixtures in groundwater quantified
as TPHd/DRO at biodegrading fuel release sites. Groundwater Monit Remed 33(4):44–56.
TPH Risk Case Studies (HIDOH, October 2018)
Attachment 5 – Metabolite Screening Levels
127
Zemo, D.A., O’Reilly, K.T., Mohler, R.M., Magaw, R.I., Espino Devine, C., Ahn, S. and A.K.
Tiwary. 2016. Life Cycle of Petroleum Biodegradation Metabolite Plumes, and Implications
for Risk Management at Fuel Release Sites. Integrated Environmental Assessment and
Management. DOI: 10.1002/ieam.1848.

TPH Risk Case Studies (HIDOH, October 2018)
Attachment 5 – Metabolite Screening Levels
128
Table 1. Relative degradation stage composition of metabolites-impacted
groundwater in terms of metabolite suites (Zemo et al. 2016).
Groundwater Plume Degradation Stage
Metabolite
Family
1
Stage 1
2
Stage 2
3
Stage 3
4
Stage 4
Alcohols 37% 26% 19% 16%
Acids/Esters 21% 42% 65% 75%
Ketones 32% 25% 12% 6.0%
Aldeh
y
des 7.0% 7.0% 2.0% 1.0%
Phenols 3.0% 1.0% 1.0% 2.0%
1. Degradation Stage 1: Dissolved hydrocarbons present.
2. Degradation Stage 2: Within smear zone, dissolved hydrocarbons not present.
3. Degradation Stage 3: Combination of Stages 2 and 4; provided in case of uncertainty
regarding receptor location relative to smear zone.
4. Degradation Stage 4: Downgradient of smear zone, dissolved hydrocarbons not present.

TPH Risk Case Studies (HIDOH, October 2018)
Attachment 5 – Metabolite Screening Levels
129
Table 2. Summary of structural classes and toxicity for Biodegradation Stages 1 to 4
(modified from Zemo et al. 2016).
Polar Family
Specific Structural Class
Predicted Relative
Chronic Oral
Toxicity to Humans
a
Per-sample average (%)
b
Stage 1 Stage 2 Stage 3 Stage 4
Alcohols (and diols)
n- and alkyl alcohols Low 20 11
9
8
Cycloalkyl alcohols Low 13 10
6
4
Bicyclic alkyl alcohols Low
1
3
3
3
Aromatic alcohols Low
2
2
1
1
Polycyclic aromatic alcohols
Low-to-Moderate
0
0
0
0
Total alcohols: 36 26 19 16
Acids (and esters)
n-and alkyl acids and esters Low 15 30 52 63
Cycloalkyl acids and esters Low
2
5
4
4
Bicyclic alkyl acids and esters Low
0
2
1
0
Aromatic acids and esters Low
4
5
7
8
Polycyclic aromatic acids and esters
Low-to-Moderate
0
0
0
0
Total acids and esters: 21 42 64 75
Ketones
n-and alkyl ketones
Low-to-Moderate
10
8
5
3
Cycloalkyl ketones Low 15
7
3
1
Bicyclic alkyl ketones Low
3
6
2
1
Aromatic ketones
Low-to-Moderate
4
4
2
1
Polycyclic aromatic ketones
Low-to-Moderate
0
0
0
0
Total ketones: 32 25 12
6
Aldehydes
n- and alkyl aldehydes
Low-to-Moderate
4
6
2
1
Cycloalkyl aldehydes
Low-to-Moderate
1
0
0
0
Bicyclic alkyl aldehydes
Low-to-Moderate
0
0
0
0
Aromatic aldehydes
Low-to-Moderate
2
1
0
0
Polycyclic aromatic aldehydes
Low-to-Moderate
0
0
0
0
Total aldehydes:
7
7
2
1
Phenols
Alkyl phenols
Moderate
c
3 (2)
c
1 (0)
c
0
1 (0)
c
Phenol Low 0 (1) 0 (1)
1
1 (2)
Total phenols:
3
1
1
2
d
Total Avg Tox L/L-M/M: 78/20/2
81/19/0
90/10/0
95/5/0
a. Toxicity ranking system and criteria for Expected Chronic Oral Toxicity to Humans are explained in the text and
Supplemental Data. Oral reference dose (RfD) in mg - kg
–1
- d
–1
. Low: RfDs > 0.1; Low-to-Moderate: RfDs <0.1
to 0.01; Moderate: RfDs <0.01 to 0.001.
b. Stage 1 = all service station samples (n = 10); Stage 2 = Terminal site (Ts) 1–4 source-area samples (n = 14); Stage 3 =
Ts 1–4 source-area and all Ts downgradient samples (n = 44); Stage 4 = All Ts downgradient samples (n =30).
c. Where identified, 2,4- and 3,5-ditertbutylphenol (DTBP) are classified as alkylphenols but are assigned a Low
toxicity ranking based on toxicity data for the di- substituted alkyphenol category from USEPA (2009).
Percentage of alkylphenols or phenol class is shown, and percentage of toxicity ranking is shown in
parenthesis.
d. Total Avg Tox L/L-M/M = averages for each toxicity classification for each stage; Low, Low-to-Moderate,
Moderate.
e. Values are rounded and totals may not add to 100% due to rounding.

TPH Risk Case Studies (HIDOH, October 2018)
Attachment 5 – Metabolite Screening Levels
130
Table 3. Toxicity-based composition of metabolite mixtures in groundwater based on
metabolite toxicity ranking applied to each degradation stage (after Zemo et al. 2016).
3
Toxicity-Based Metabolite Composition of
Plume Degradation Stage
1
Metabolite
Suite Toxicity
Ranking
2
Range RfD
(mg/kg-day) Stage 1 Stage 2 Stage 3 Stage 4
Low 0.1 1.0 78% 81% 90% 95%
Low-Moderate 0.01 0.1 20% 19% 10% 5%
Moderate 0.001 0.01 2% 0% 0% 0%
Total: 100% 100% 100% 100%
4
Wei
g
hted Oral RfD (lower ran
g
e): 0.02 0.04 0.05 0.07
4
Wei
g
hted Oral RfD (upper ran
g
e): 0.21 0.37 0.53 0.69
1. Toxicity Rankings assigned to individual, metabolite classes by Zemo et al. (2016).
2. Range of estimated oral Reference Dose (RfD) for Toxicity Ranking assigned to metabolite family (see
Tables 1 and 2). Upper limit of 1.0 mg/kg-day assumed for "low" toxicity groups.
3. Degradation Stage composition (refer to footnotes for Table 1).
4. Weighted RfD = 1/[(Fraction #1 %/Fraction #1 RfD)+ (Fraction #2 %/Fraction #2 RfD), etc.] (ODEQ 2003).

TPH Risk Case Studies (HIDOH, October 2018)
Attachment 5 – Metabolite Screening Levels
131
Table 4. Metabolite mixture drinking water screening levels
based on Metabolite Plume Degradation Stage composition
proposed by Zemo et al. (2016).
2
Tapwater Screening Level (µg/L)
1
Metabolites Plume
Degradation Suite
Lower End
of Toxicity
Range
Upper End
of Toxicity
Range
Sta
g
e 1 420 4,196
Sta
g
e 2 740 7,400
Sta
g
e 3 1,056 10,555
Sta
g
e 4 1,383 13,831
1. Refer to footnotes for Table 1.
2. Calculated using USEPA Region Screening Level model for tapwater.
Ingestion pathway only. Inhalation and dermal exposure route assumed negligible
and not considered. Assumes receptor is exposed to groundwater associated with
noted degradation stage.
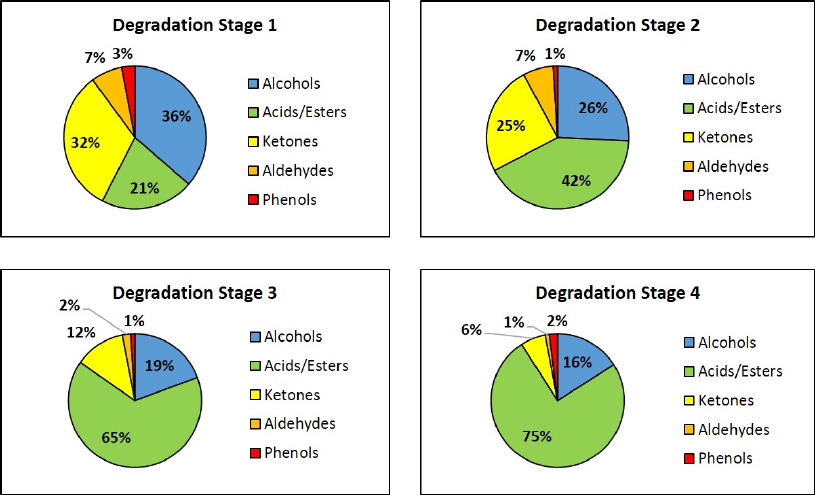
TPH Risk Case Studies (HIDOH, October 2018)
Attachment 5 – Metabolite Screening Levels
132
Figure 1. Relative metabolite suite composition of Zemo et al. (2016) metabolites
plume degradation stages (normalized to 100%).
TPH Risk Case Studies (HIDOH, October 2018)
Attachment 6 – Updates
133
Attachment 6. Updates
October 2018
Case Study #1 was updated in October 2018 to correct the conceptual site
models presented in Figure 1-3 and Figure 1-5 (USTs removed).
