
Page 1/47
Copyright © 2006 by Stephen L. Morgan and Stanley N. Deming. All rights reserved
Guide to Microsoft Excel for calculations, statistics, and plotting data
Topic Page
A. Writing equations and text 2
1. Writing equations with mathematical operations 2
2. Writing equations with functions 3
3. Writing text 4
4. Cell references 4
B. Using functions 5
1. Counting 5
2. Calculating a sum 5
3. Calculating an average 6
4. Calculating a median 6
5. Calculating a standard deviation 7
6. How Excel handles missing values 7
7. Additional statistical functions 8
C. The Analysis Toolpak 10
Installing the Analysis Toolpak 10
Using the Analysis Toolpak 12
Statistical functions in the Analysis Toolpak 12
1. Descriptive Statistics 13
2. F-Test Two-Sample for Variances 14
3. t-Test: Two-Sample Assuming Equal Variances 22
4. t-Test: Two-Sample Assuming Unequal Variances 27
5. t-Test: Paired Two Sample For Means 29
6. Anova: Single Factor 31
7. Correlation, CORREL 35
D. Graphing and fitting models to data 37
1. Creating an XY plot of data 37
2. Using the regression function to fit a straight line 42
E. Frequently asked questions 45
For corrections or suggestions for improvement, contact: Stephen L. Morgan, Department of
Chemistry & Biochemistry, The University of South Carolina, Columbia, SC 29208; Email:
; URL: http://www.chem.sc.edu/faculty/morgan/resources/excel.
Last update: 7 June 2006.
Page 2/47
Copyright © 2006 by Stephen L. Morgan and Stanley N. Deming. All rights reserved
A. Writing equations and text
1. Writing equations with mathematical operations. Position the mouse cursor on any cell and
click the left mouse button. You have now activated a cell and can enter numbers, equations, or
text in the cell. All equations in Excel start with the equals sign (use ‘=’) and are followed by a
mathematical calculation involving numbers and mathematical operators or functions. For
addition (use the plus key, ‘+’), subtraction (use the minus key, ‘-’), multiplication (use the
asterisk key, ‘*’), and/or division (use the forward slash key, ‘/’). For example:
= 4+5 press the Enter key and see the result, 9
= 4-5 press the Enter key and see the result, -1
= 4*5 press the Enter key and see the result, 20
= 4/5 press the Enter key and see the result, 0.8
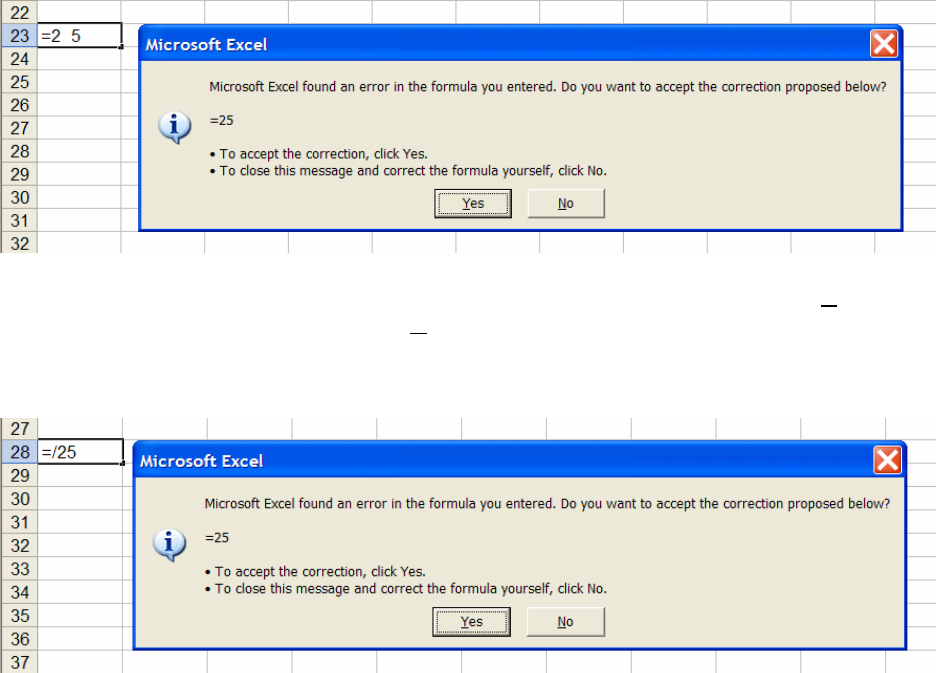
Equations are preceded by the equals sign and are written on a single line exactly as they might
be written on paper. Consider the following:
There is no operation or number defined by two numbers separated by a space. Click Yes to
accept the recommended correction; press No to edit the formula yourself.
A typographical error such as shown below may prompt an error message.
Page 3/47
Copyright © 2006 by Stephen L. Morgan and Stanley N. Deming. All rights reserved
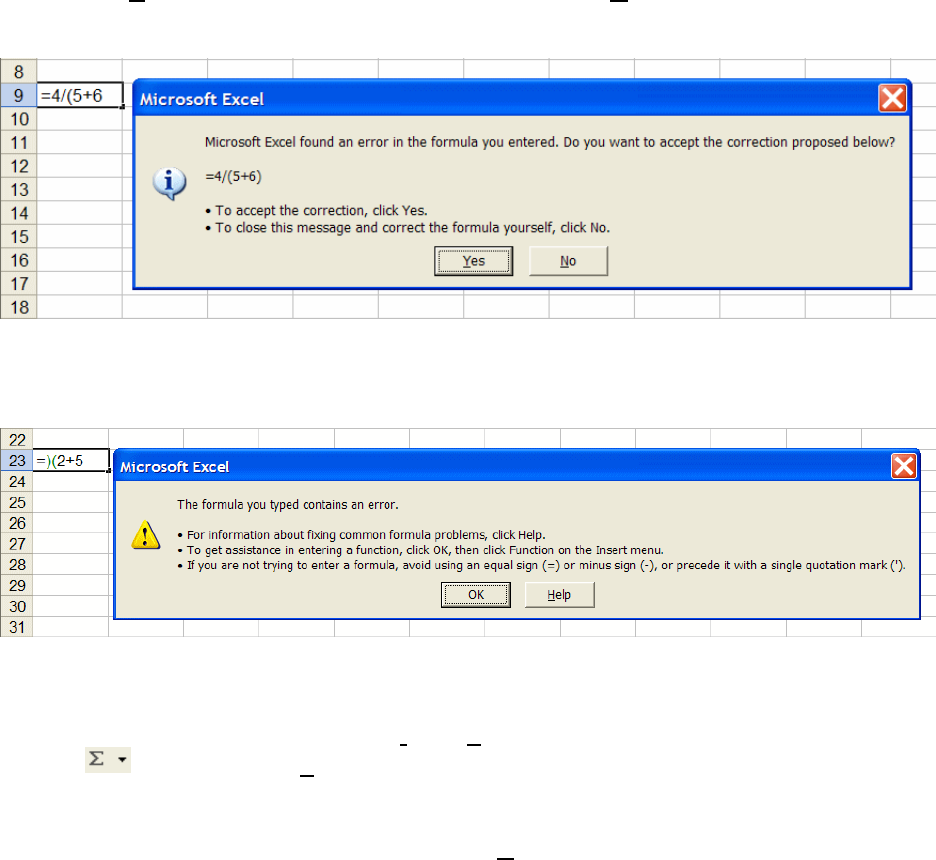
Use parenthesis to control grouping of calculations. For example:
= 4/5+6 press the Enter key and see the result, 6.8
= (4/5)+6 press the Enter key and see the result, 6.8
= 4/(5+6) press the Enter key and see the result, 0.363636
The use of parentheses to group calculations is recommended to avoid error in implementing a
formula and ambiguity in interpreting a formula.
If the formula is entered with mismatched parentheses, an error dialog box will appear as seen
below. Click Yes to accept the recommended correction; press No to edit the formula yourself.
A well-formed formula has an equal number of opening and closing parentheses.
Parentheses must also be placed in a manner that makes logical sense. The following example
also brings up an error dialog when the Enter key is pressed.
2. Writing equations with functions. Functions in Excel are implemented as macro programs that
usually require one or more input values and produce a corresponding output value. To see a list
of functions available in Excel, select the Insert Function menu option, or press the toolbar
function and select More Functions. These actions bring up the ‘Insert function’ dialog
box from which you can select a function to use. When a function is selected, the ‘Function
arguments’ dialog box then provides a description of the function inputs (“arguments”) and use.
For additional information on any function, use the H
elp Microsoft Excel Help menu option or
press the F1 key. When using a function in an equation the function name and arguments in
parenthesis are entered following an equal sign, as shown in the next section.
Page 4/47
Copyright © 2006 by Stephen L. Morgan and Stanley N. Deming. All rights reserved
3. Writing text. Generally, Excel will allow text to be entered in any cell. However, if that cell is
referenced by an equation, an error may result. Depending on the characters entered, Excel may
try to interpret the entry as part of an equation. For example, if an equals sign is entered, Excel
expects a valid equation to follow. One way to over-ride this expectation is to preface your entry
with a single quotation mark. Everything following the single quotation mark will be interpreted
as simple text. Writing text in cells adjacent to a calculation is a good way to document the
operation of a spreadsheet.
4. Cell references. To perform operations on data in a spreadsheet, equations and functions must
be able to refer to the location of the data. Excel can refer to cell locations using two different
numbering schemes.
The A1 cell reference style labels columns by alphabetic letter (A, B, C, etc.) and labels rows by
numbers (1, 2, 3, etc.). For example, the fifth cell in the first column of a spreadsheet would be
designated A5. The notation expands to designate a range of cells using a semicolon between the
starting and ending cell references. For example, the first three rows (rows 1 through 3) of the
first column (A) would be referred to by the notation A1:A3.
The R1C1 reference style labels both rows and columns by number (1, 2, 3, etc.), listing the row
first and column second. For example, the fifth cell in the first column of a spreadsheet would be
designated R5C1. Likewise, the first three rows (rows 1 through 3) of the first column (A)
would be referred to by the notation R1C1:R3C1
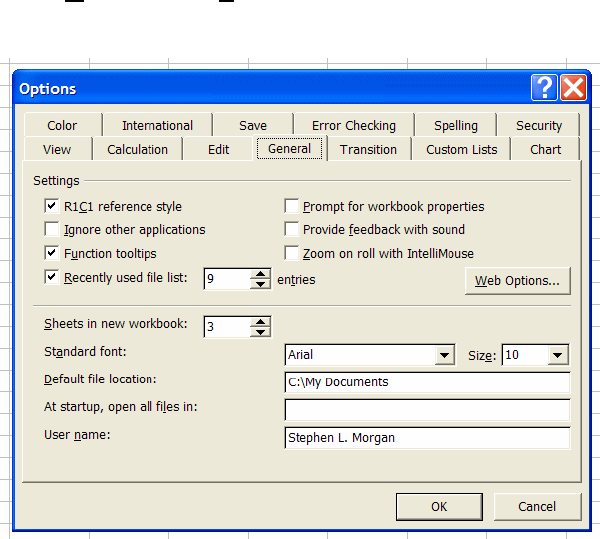
The default installation of Excel activates the A1 cell reference notation. To turn the R1C1
notation on or off, click Options on the Tools menu, click the General tab, and then select or
clear the R1C1 reference style check box under Settings.
Page 5/47
Copyright © 2006 by Stephen L. Morgan and Stanley N. Deming. All rights reserved
B. Using functions
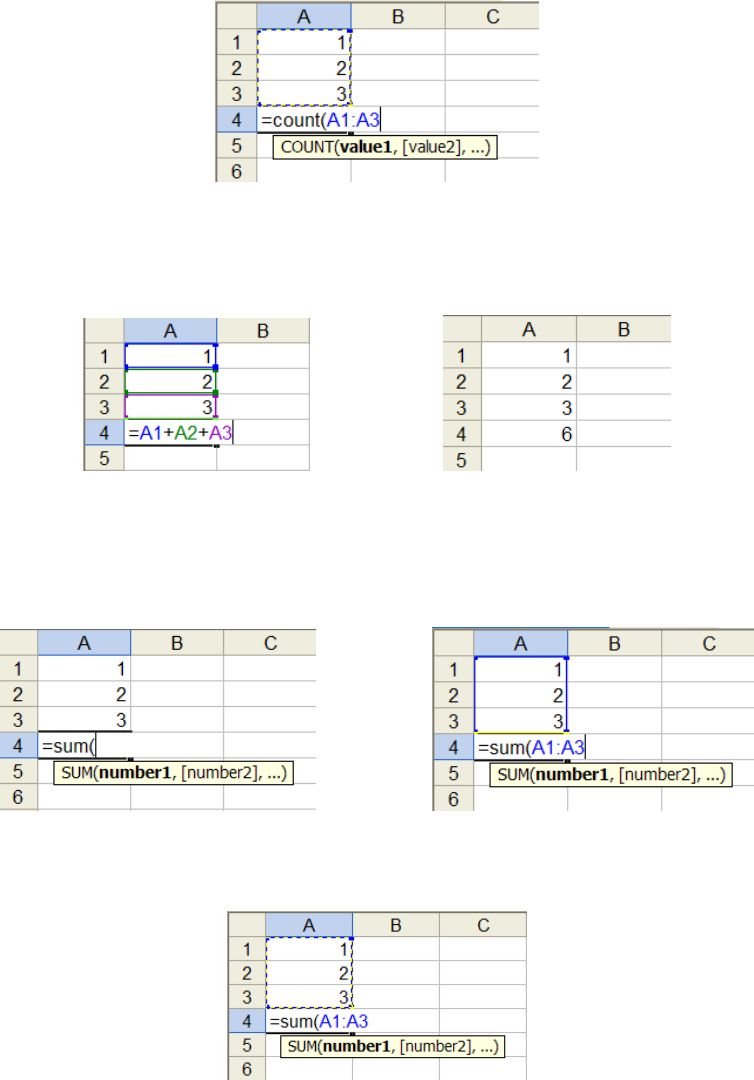
1. Counting. The count of numbers within a range of cells in a spreadsheet can be determined
using the count function. There are three numbers (1, 2, and 3) in the cell range R1C1:R3C1
Type ‘=count(’ in cell A5, and enter a range of cells; in this case, enter ‘A1:A3’, followed by a
closing parenthesis, and press the Enter key to execute the function.
2. Calculating a sum. Numbers in an Excel spreadsheet can be added by writing an equation
referring directly to the cell elements to be added. For example to add the numbers 1, 2, and 3 in
cells A1:A3, type ‘=A1+A2+A3’ in cell A4 and press the Enter key.
The same calculation can be performed more quickly using the sum function. Upon typing
‘=sum(’ in cell A4, a pop-up tool tip box will appear indicating the formula can be completed by
typing a list of numbers. Alternatively, you can enter a range of cells; in this case, enter ‘A1:A3’.
Pressing the Enter key serves to close the parenthesis and execute the function.
After typing ‘=sum(’, you can also click the mouse and drag over the range of cells to be entered,
and press the Enter key to complete the function.
Page 6/47
Copyright © 2006 by Stephen L. Morgan and Stanley N. Deming. All rights reserved
To automate this process further, click and drag the mouse over desired range of cell values, then
click on the toolbar function and select Sum. The sum of the numbers in the selected cells
will be placed in the next contiguous cell.
3. Calculating an average. Numbers in an Excel spreadsheet can be averaged by writing an
equation referring directly to the cell elements to be averaged. For example, to calculate the
average (also called the mean) of the numbers 1, 2, and 3 in cells A1:A3, type ‘=sum(A1:A3)/3’
in cell A4 and press the Enter key to execute the command.
This process is even easier using the Average function. Type ‘=average(’, enter the range of cell
values to be averaged, and press the Enter key to execute the command.
The Average menu item in the toolbar function calculates the average of the current
highlighted range of cells.
4. Calculating a median. Another ‘measure of central tendency’ for a set of data is the median,
which can be calculated using the median function in exactly the same manner as described
above for the Average function.
Page 7/47
Copyright © 2006 by Stephen L. Morgan and Stanley N. Deming. All rights reserved
5. Calculating a standard deviation. The standard deviation of a set of numbers is defined as:
()
2
1
1
n
i
i
xx
s
n
−
⎛⎞
−
⎜⎟
=
⎜⎟
−
⎝⎠
∑
Although a spreadsheet could be written to calculate a standard deviation, the STDEV function
is built into Excel. For example to calculate the standard deviation of the numbers 1, 2, and 3 in
cells A1:A3, type ‘=stdev(A1:A3)’ in cell A4 and press the Enter key to execute the command.
The STDEV function can also be accessed from the toolbar function . Note that the STDEV
function, for n data points, divides the sum of squares about the mean by the number of degrees
of freedom (df) of n - 1; this is appropriate when estimating a sample standard deviation because
of the “loss” of a degree freedom from calculating the mean. The STDEVP function calculates a
population standard deviation by dividing the sum of squares by n; this function should not be
used to calculate the standard deviation of a statistical sample of data.
6. How Excel handles missing values. If a spreadsheet contains a missing value (i.e., if a cell is
blank at a certain position in a column or row or numbers), Excel functions ignore the missing
number in calculations. Consider the following spreadsheet.
The first row contains a blank cell at R3C1 (row 3, column 1). This “missing value” is ignored in
the calculation of the mean and standard deviation of cells R1C1:R4C1. Be aware, however, that
Excel plotting and regression functions do not behave in this fashion: missing values are treated
as zeroes.

Page 8/47
Copyright © 2006 by Stephen L. Morgan and Stanley N. Deming. All rights reserved
7. Additional statistical functions. Other functions can also be accessed from the button on
the toolbar. A partial list of statistical functions, adapted from the Excel help pages, is given
below.
Function Purpose
AVERAGE
Returns the average of its arguments
BINOMDIST
Returns the individual term binomial distribution probability
CHIDIST
Returns the one-tailed probability of the chi-squared distribution
CHIINV
Returns the inverse of the one-tailed probability of the chi-squared distribution
CHITEST
Returns the test for independence
CONFIDENCE
Returns the confidence interval for a population mean
CORREL
Returns the correlation coefficient between two data sets
COUNT
Counts how many numbers are in the list of arguments
COVAR
Returns covariance, the average of the products of paired deviations
DEVSQ
Returns the sum of squares of deviations
FDIST
Returns the F probability distribution
FINV
Returns the inverse of the F probability distribution
FISHERINV
Returns the inverse of the Fisher transformation
FREQUENCY
Returns a frequency distribution as a vertical array
FTEST
Returns the result of an F-test
INTERCEPT
Returns the intercept of the linear regression line
KURT
Returns the kurtosis of a data set
LARGE
Returns the k-th largest value in a data set
LINEST
Returns the parameters of a linear trend
MAX
Returns the maximum value in a list of arguments
MEDIAN
Returns the median of the given numbers
MIN
Returns the minimum value in a list of arguments
MODE
Returns the most common value in a data set
NORMDIST
Returns the normal cumulative distribution
NORMINV
Returns the inverse of the normal cumulative distribution
NORMSDIST
Returns the standard normal cumulative distribution
NORMSINV
Returns the inverse of the standard normal cumulative distribution
PEARSON
Returns the Pearson product moment correlation coefficient
PERCENTILE
Returns the k-th percentile of values in a range
PERCENTRANK
Returns the percentage rank of a value in a data set
PERMUT
Returns the number of permutations for a given number of objects
PROB
Returns the probability that values in a range are between two limits
QUARTILE
Returns the quartile of a data set
RANK
Returns the rank of a number in a list of numbers
RSQ
Returns the square of the Pearson product moment correlation coefficient (R)
SKEW
Returns the skewness of a distribution
SLOPE
Returns the slope of the linear regression line
SMALL
Returns the k-th smallest value in a data set
STANDARDIZE
Returns a normalized value
STDEV
Estimates standard deviation based on a sample
STEYX
Returns the standard error of the predicted y-value for each
x-value in a regression
TDIST
Returns the Student's t-distribution
TINV
Returns the inverse of the Student’s t-distribution
TTEST
Returns the probability associated with a Student’s t-test
VAR
Estimates variance based on a sample
ZTEST
Returns the two-tailed p-value of a z-test
Page 9/47
Copyright © 2006 by Stephen L. Morgan and Stanley N. Deming. All rights reserved
Each of these functions has a help page that is useful in determining usage. For example,
consider the function NORMDIST, which evaluates the normal distribution as a function of x,
2
2
()
2
1
()
2
μ
σ
σ
π
−
−
=
x
fx e
where
μ
and
σ
are the mean and standard deviation of the population. A spreadsheet to plot the
normal distribution and its cumulative area function are shown below. Column A is filled with
numbers ranging from -4 to +4. Column B calculates f(x) using the corresponding x-values in
column A. The second and third arguments specify the mean and standard deviation, and the
fourth argument specifies whether the normal probability distribution (FALSE) or its cumulative
area from -∞ to x is calculated (TRUE). Both of these calculations and the resulting plots are
shown below.
Note that the mean and standard deviation were set to 0 and 1 in the above function calls in the
spreadsheets, which make the calculation refer to the standard normal distribution,
2
2
1
()
2
z
fz e
π
⎛⎞
−
⎜⎟
⎝⎠
=
where z = (x -
μ
)/
σ
represents the standardized z-score. The NORMSDIST function calculates
the cumulative area from -∞ to a particular value of z for the standard normal distribution. For
example,
= normsdist(-1) returns 0.158655
= normsdist(-2) returns 0.02275
= normsdist(-3) returns 0.00135
as expected from a comparison to the cumulative area tables of any statistics text.
Page 10/47
Copyright © 2006 by Stephen L. Morgan and Stanley N. Deming. All rights reserved
C. The Analysis Toolpak
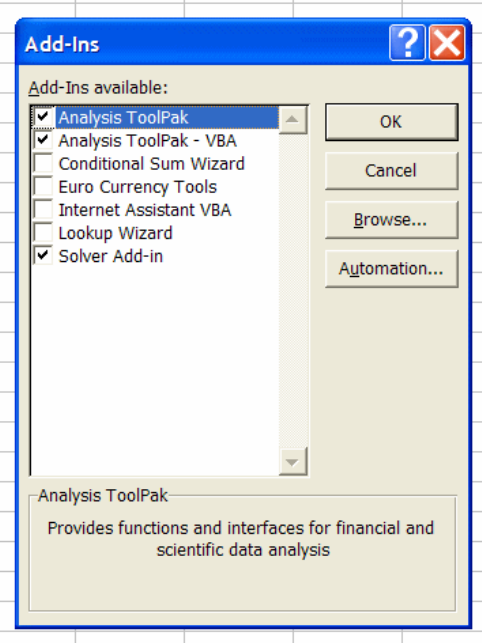
Installing the Analysis Toolpak. The data analysis tools in Microsoft Excel are provided as an
“add-in” toolbox. This toolbox contains additional functions enabling a variety of statistical
analyses including descriptive statistics, t-tests, the F-test, and analysis of variance (ANOVA).
The Analysis Toolpak may already be available in the Tools menu of Excel.
If you do not see the Data Analysis option on the Tools menu right away, check the entire
contents of the menu by clicking on the down-arrows at the bottom of the menu to expand the
full list. If the Data Analysis option is not available on the Tools menu, you must activate it by
clicking on Tools Add-Ins, checking the Analysis ToolPak option, and clicking OK. This
action will install the data analysis tools on the Tools menu.
Page 11/47
Copyright © 2006 by Stephen L. Morgan and Stanley N. Deming. All rights reserved
If you have a networked installation of Microsoft Office, you might need assistance from the
network supervisor to complete the installation.
Page 12/47
Copyright © 2006 by Stephen L. Morgan and Stanley N. Deming. All rights reserved
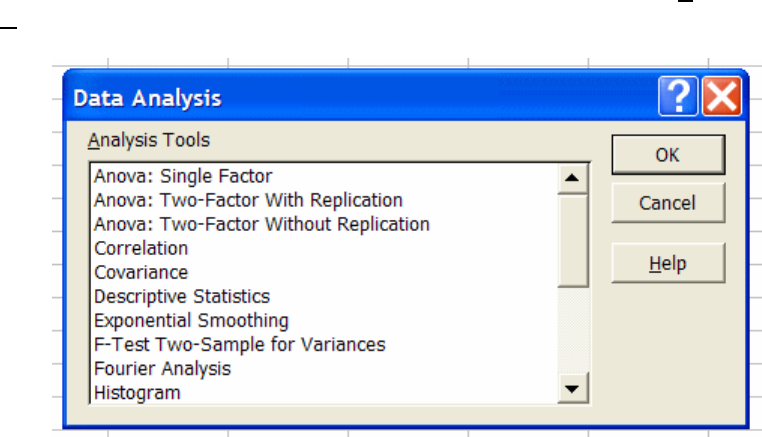
Using the Analysis Toolpak. If the Analysis Toolpak is installed, click on the Tools menu and
select Data Analysis. The Data Analysis dialog box lists the available functions.
The functions in the Analysis Toolpak assume that you have already entered appropriate data in
rows or columns of the current spreadsheet. When a particular analysis tool is selected and OK
key is pressed, a dialog box for the selected tool pops up to request further information such as
the location of the data to be evaluated and selections relevant to the statistical test being
performed.
Statistical functions in the Analysis Toolpak.
The following sections describe the use and interpretation of several of the statistical functions
that are available in the Analysis Toolpak.
Page 13/47
Copyright © 2006 by Stephen L. Morgan and Stanley N. Deming. All rights reserved
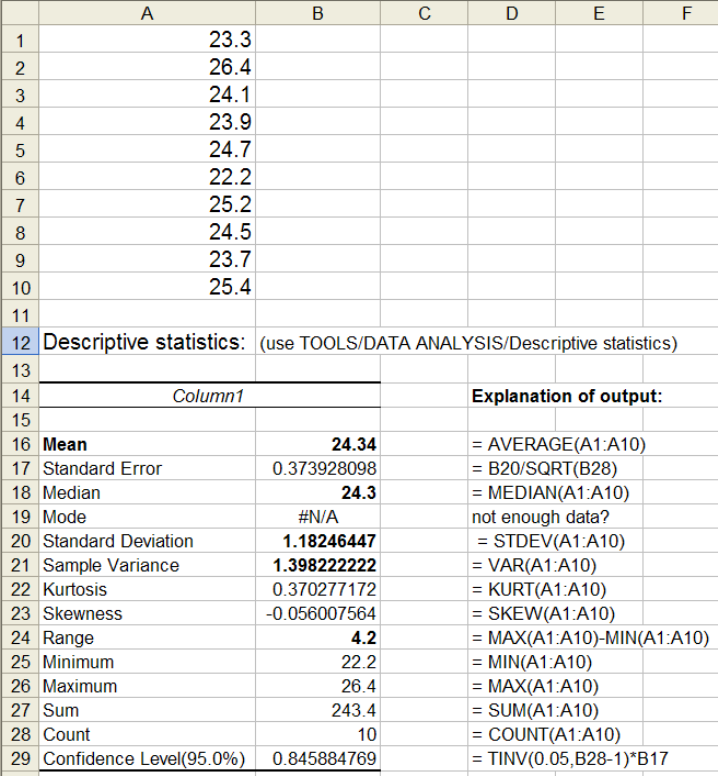
1. Descriptive Statistics
DESCRIPTION: This analysis tool generates univariate statistics for data, providing information
about central tendency and variability.
USAGE: Access the Descriptive Statistics function in the Analysis Toolpak. Enter the range of
cells encompassing the rows and columns of sets of variables, indicate whether the variables are
grouped in rows or columns, select the output range, and click on
OK.
OUTPUT AND INTERPRETATION: A sample output with explanations added to the right of
the output table is provided below.
As seen at the right side of the above figure, all the output values can be obtained by appropriate
combinations of basic statistical functions. Excel does not have a function for calculating a
confidence interval for a mean from a single set of data, nor does it have a built-in one sample t-
test function. However, it is possible to write the equation for a confidence interval of a mean, or
the equation for a one-sample t-test, based on output from the
Descriptive Statistics function.
Page 14/47
Copyright © 2006 by Stephen L. Morgan and Stanley N. Deming. All rights reserved
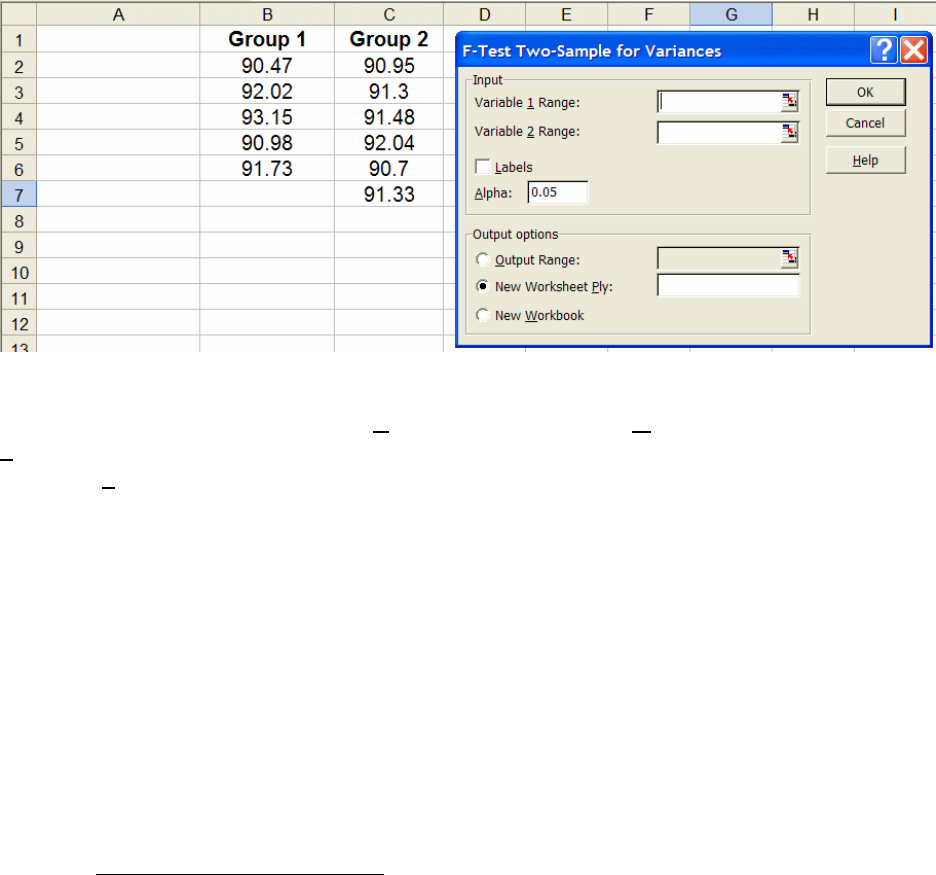
2. F-Test Two-Sample for Variances
DESCRIPTION: The F-test function in the Analysis Toolpak performs a one-sided Fisher
variance-ratio test to determine if one population variance (or standard deviation) is statistically
significantly greater than another population variance (or standard deviation). Because the F-test
is always a comparison of two variances (or standard deviations), it is a two-sample test.
USAGE: The two sets of data whose variances are to be compared should be entered in
consecutive rows of two columns, or in consecutive columns of two rows. It is not necessary that
the number of data points in each group be the same. In the sample spreadsheet below, the two
groups of data have been entered in columns. Access the F-test function in the Analysis Toolpak
by clicking on Tools, choosing Data Analysis, selecting F-Test Two-Sample for Variances
and clicking OK.
In the above dialog box, enter the range for each group of data, enter the level of significance at
which the F-test should be conducted (Alpha), and then enter the Output range location. If the
Labels options is checked, the function interprets the first entry in each variable’s range as a
label. The Labels option is useful to identify the two different groups of data in the output. Click
OK to see the output of the function.
Because Excel provides no information about the correct use and interpretation of the F-test
function, it is easy (and common) for users to apply the function incorrectly, and also to interpret
its output incorrectly. The following guidelines help clarify the proper use of this function.
ONE-SIDED F-TEST. The F-distribution, derived by Ronald Aylmer Fisher (later Sir R. A.
Fisher) in 1926, serves as the reference distribution for judging the significance of the ratio of
two estimates of variance. A one-sided (or one-tailed) test is appropriate if researchers want to
know if the population standard deviation of one set of data (s
1
) is larger than that of another set
of data (s
2
); or, equivalently, if the population standard deviation of one set of data (s
2
) is smaller
than that of another set of data (s
1
). For example, suppose that the two groups of data in the
figure directly above represent titration volume measurements (in mL) from two analytical
chemists. Before the data were acquired
, the second researcher had claimed that his standard
deviation would be smaller than the standard deviation of the first researcher. The data support

Page 15/47
Copyright © 2006 by Stephen L. Morgan and Stanley N. Deming. All rights reserved
this claim: the standard deviation of his replicate measurements (Group 2, s
2
= 0.4612) is smaller
than the standard deviation of the data from the first researcher (Group 1, s
1
= 1.0287. However,
there is always the possibility that this difference in the standard deviations could have occurred
by chance.
A one-sided F-test is appropriate in the scenario described above because of the claim that one
standard deviation is “smaller than” another standard deviation; or, equivalently, that the second
standard deviation is “greater than” the first standard deviation. The one-sided F test is set up by
placing the variance that is expected to be larger in the numerator and the variance that is
expected to be smaller in the denominator. This ratio is called F
calc
:
2
calc
2
=
num
denom
s
F
s
Formally, the alternative and null hypotheses are:
22
22
0
alternative hypothesis :
null hypothesis :
a num denom
num denom
H
H
σσ
σσ
>
≤
Although the Excel dialog box for the F-test does not explicitly inform the user which group’s
variance is divided by the other, the function always divides the variance of the first group of
data (specified in Variable 1 Range) by the variance of the second group (specified in Variable
2
Range).
OUTPUT AND INTERPRETATION OF ONE-SIDED F-TEST: Statistical tables show
“critical values” of F
crit
based on the single-tail area remaining at the right side of the F-
distribution (e.g., a fractional single-tail area of Alpha = 0.05). Tables of F
crit
are “two-
dimensional” — the critical values depend on the number of degrees of freedom of the variance
in the numerator as well as the number of degrees of freedom of the variance in denominator.
Because the ratio F
calc
for the one-sided F-test is set up with the variance expected to be larger in
the numerator, the area in this single tail at the right side of the F-distribution is the probability
of getting a value of F
calc
greater than F
crit
by chance (i.e., the probability of getting a value of
F
calc
greater than F
crit
when there is no difference in the two variances).
The decision to reject the null hypothesis and accept the alternative hypothesis is made by
comparing F
calc
to F
crit
at a level of risk α for the numbers of degrees of freedom associated with
the variance estimates in the numerator and denominator (e.g., F
(0.05, 5, 6)
). The traditional logic is
straightforward: (a) If F
calc
> F
crit
, then reject the null hypothesis and accept the alternative
hypothesis; or (b) If F
calc
≤ F
crit
, then do not reject the null hypothesis.
The data set having variance that is expected to be larger should be entered in the Variable 1
Range
in the input dialog box. If, in fact, that variance is larger, the F-test function in Excel
works well, as shown in Case 1 below. If, however, that variance is not larger, then the
interpretation of the F-test function in Excel must be done cautiously, as shown in Case 2 below.
Page 16/47
Copyright © 2006 by Stephen L. Morgan and Stanley N. Deming. All rights reserved
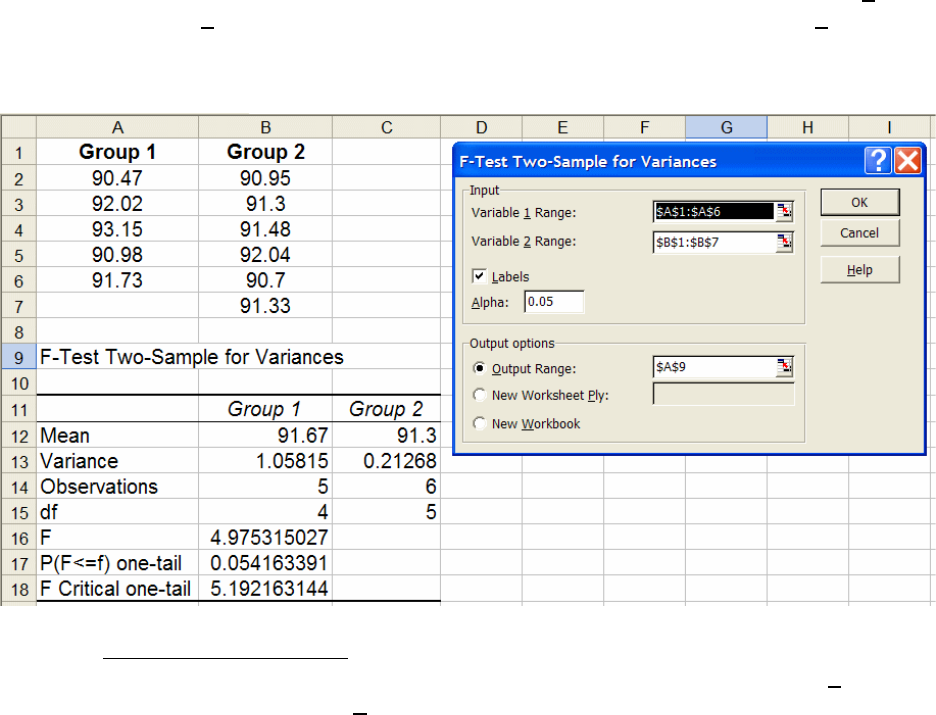
Case 1: Interpretation of output for a one-sided F-test. Group 1 was selected as Variable 1;
group 2 as Variable 2. The first row was selected along with the data range, and the Labels
check box was been selected to label the output with the correct group labels. The F-ratio turns
out to be greater than unity.
In Case 1, before looking at the data it was assumed that the variance of Group 1 was going to be
greater than the variance of Group 2. The data that were then entered in the Variable 1 Range
(the Group 1 data) and the Variable 2 Range (the Group 2 data) resulted in a value of “F”
(F
calc
) that is greater than unity (F = 4.975315027). This value is compared to the value of “F
Critical one-tail” (F
crit
) of 5.192163144 based on α = 0.05, 4 df in the numerator, and 5 df in the
denominator. Because F
calc
< F
crit
(4.98 < 5.19), the null hypothesis cannot be rejected at the 95%
level of confidence [100%
× (1 - α)].
The p-value (0.054163391) is the probability that a value of F greater than or equal to the
calculated value (F
calc
= 4.975315027) could have occurred by chance if there were no difference
in the variances (the p-value is the fractional area of the right tail of the F-distribution above the
calculated value of F
calc
). In this Case 1, the risk of getting the value F
calc
= 4.975315027 by
chance is greater than
Alpha = 0.05.
The label for the p-value listed in the table [“P(F<=f) one tail”] is difficult to interpret and can be
misleading (see Case 2 below) – “F” is clearly the value of F calculated with this data (F
calc
), but
it is not clear that “f” is any value of F. It is rare to see this label written “backward” as it is in
the Excel table – at the very least, writing “P(f>=F)” would have been better.
Nonetheless, Excel works just fine for this Case 1.
Page 17/47
Copyright © 2006 by Stephen L. Morgan and Stanley N. Deming. All rights reserved
Case 2: Interpretation of output for a one-sided F-test. Caution: Group 2 was selected as
Variable 1; group 1 as Variable 2. The first row was selected along with the data ranges, and
the Labels check box was been selected to label the output with the correct group labels. The F-
ratio turns out to be less than unity.
In Case 2, before looking at the data it was assumed that the variance of Group 2 was going to be
greater than the variance of Group 1 (the opposite of what was assumed for Case 1). The data
that were then entered in the Variable 1 Range (the Group 2 data) and the Variable 2 Range
(the Group 1 data) resulted in a value of “F” (F
calc
) that is less than unity (F = 0.200992298, the
reciprocal of the F-value for Case 1 above). This is OK so far, but it is after this point that Excel
goes astray:
As always, the calculated value of F (F
calc
) should be compared to the critical value of F
(F
crit
), but if that comparison is made in this Case 2 the result is that F
calc
> F
crit
(0.201 >
0.193) and it appears that the first variance (0.21268) can be said with at least 95%
confidence to be greater than the second variance (1.05815), clearly a falsehood.
Excel has incorrectly assumed that because F
calc
turned out to be less than unity the opposite
alternative hypothesis H
a
: σ
num
< σ
denom
must have been intended, the opposite of what was
actually intended (H
a
: σ
num
> σ
denom
). Note that in this Case 2, F
calc
is constructed as the inverse
of F
calc
in Case 1 (the variances in the numerator and denominator are switched). Thus, Excel’s
inversion of hypothesis coupled with this inversion of F
calc
makes the (incorrect) test in this Case
2 equivalent to the test in Case 1 above. But because F
calc
is less than unity in Case 2, Excel does
the math by working on the left side of the F distribution. The results are equivalent:
in Case 2, it cannot be said that the variance in the numerator (the Group 2 data) is
significantly less than the variance in the denominator (the Group 1 data)
Page 18/47
Copyright © 2006 by Stephen L. Morgan and Stanley N. Deming. All rights reserved
in Case 1, it cannot be said that the variance in the numerator (the Group 1 data) is
significantly greater than the variance in the denominator (the Group 2 data).
But all of this explanation doesn’t help. It appears to be impossible to do a one-sided F-test in
Excel and get a meaningful p-value if the variance in the numerator turns out to be less than the
variance in the denominator.
Other programs are easier to interpret. Here are the (slightly edited) STATA outputs for Case 1
and Case 2:
Variance ratio test (Case 1)
------------------------------------------------------------------------------
Variable | Obs Mean Std. Err. Std. Dev. [95% Conf. Interval]
---------+--------------------------------------------------------------------
var1 | 5 91.67 .4600323 1.028664 90.39275 92.94726
var2 | 6 91.3 .1882736 .4611743 90.81603 91.78397
---------+--------------------------------------------------------------------
combined | 11 91.46818 .2270236 .7529521 90.96234 91.97402
------------------------------------------------------------------------------
ratio = sd(var1) / sd(var2) f = 4.9753
Ho: ratio = 1 degrees of freedom = 4, 5
Ha: ratio > 1
Pr(F > f) = 0.0542
Variance ratio test (Case 2)
------------------------------------------------------------------------------
Variable | Obs Mean Std. Err. Std. Dev. [95% Conf. Interval]
---------+--------------------------------------------------------------------
var2 | 6 91.3 .1882736 .4611743 90.81603 91.78397
var1 | 5 91.67 .4600323 1.028664 90.39275 92.94726
---------+--------------------------------------------------------------------
combined | 11 91.46818 .2270236 .7529521 90.96234 91.97402
------------------------------------------------------------------------------
ratio = sd(var2) / sd(var1) f = 0.2010
Ho: ratio = 1 degrees of freedom = 5, 4
Ha: ratio > 1
Pr(F > f) = 0.9458
If it is stated for Case 1 that the standard deviation 1.028664 is greater than the standard
deviation 0.4611743, the risk of being wrong is p = 0.0542, clearly greater than
Alpha = 0.05;
thus it cannot be said with 95% confidence that the variance in the numerator is greater than the
variance in the denominator.
If it is stated for Case 2 that the standard deviation 0.4611743 is greater than the standard
deviation 1.028664, the risk of being wrong is p = 0.9458, clearly much greater than
Alpha =
0.05; thus it cannot be said with 95% confidence that the variance in the numerator is greater
than the variance in the denominator.
Page 19/47
Copyright © 2006 by Stephen L. Morgan and Stanley N. Deming. All rights reserved
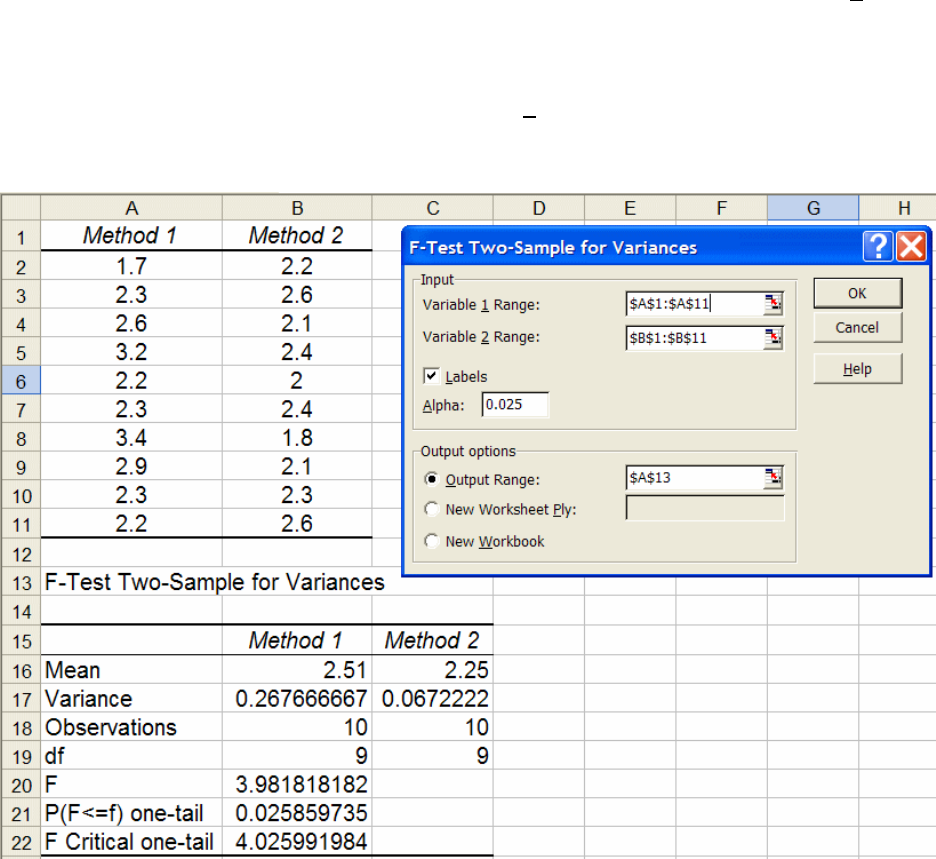
TWO-SIDED F-TEST. A two-sided F-test is appropriate if researchers want to know if the
population standard deviation of one set of data (s
1
) is different than that of another set of data
(s
2
). A two-sided test is appropriate when there is no specific claim that one variance is smaller
or larger than the other—all that is desired is to find out if the variances are different. For
example, suppose that two different methods were employed to measure the weight of protein in
milligrams (mg) in ten random 10.0 mg samples from a batch fermentation reactor with the
results shown in the next figure.
The null and alternative hypotheses for the two-sided F-test are:
null hypothesis, H
0
:
2
1
σ
=
2
2
σ
alternative hypothesis, H
a
:
2
1
σ
≠
2
2
σ
For the calculation of the F-statistic in a two-sided F-test, the variance that is larger is always
placed in the numerator and the variance that is smaller is always placed in the denominator.
This means that F
calc
should always be greater than or equal to 1. If F
calc
is less than one, the
Variable 1 Range is set incorrectly.
OUTPUT AND INTERPRETATION OF TWO-SIDED F-TEST: Because the Excel F-test
function was written as a one-sided test, two adjustments are required to use it for two-sided F-
tests:
(1)
the variance that is larger is always placed in the numerator and the variance that is
smaller is always placed in the denominator. This means that the variances must be
calculated
(2) For the two-sided F-test, F
calc
should compared to the critical value of F associated with
a tail area of α/2, not α, for a test carried out at the α level of significance and the 100×(1
-
α) % level of confidence.
Page 20/47
Copyright © 2006 by Stephen L. Morgan and Stanley N. Deming. All rights reserved
Thus, the decision to reject the null hypothesis and accept the alternative hypothesis is made by
comparing F
calc
to the “critical value” of F (F
crit
), for a tail area of α/2 (usually 0.025) for the
numbers of degrees of freedom associated with the variance estimates in the numerator and
denominator. The logic is identical to that previously used: (a) If F
calc
> F
crit
, then reject the null
hypothesis; or (b) If F
calc
≤ F
crit
, then do not reject the null hypothesis.
The next figure shows the output from the Excel F-test function. Note that the variances of the
data set were calculated first to determine which group of data to define in the Variable 1
Range
(Method 1 in column B) and that the Alpha value is set to 0.025.
Correct usage for a two-sided F-test (below) Because the data set with the larger variance
(Method 1 in column B) was entered in the Variable 1 Range. Null hypothesis, H
0
:
2
1
σ
=
2
2
σ
.
Alternative hypothesis, H
a
:
2
1
σ
≠
2
2
σ
The calculated value of F (labeled as “F”) is 3.98. To judge the outcome of the hypothesis test,
this value is compared to the critical value of F, which is given as 4.03 for a right-tail area of
α/2
= 0.025, 9 df in the numerator, and 5 df in the denominator. Because F
calc
< F
crit
, the null
hypothesis that
2
1
σ
is equal to
2
2
σ
is not rejected. However, there is a critical error when
interpreting this output as a two-sided F-test: the p-value in cell B23 is incorrect. Because the
function assumes that a one-sided test is being done, this value is actually equal to p/2. Thus, the
Page 21/47
Copyright © 2006 by Stephen L. Morgan and Stanley N. Deming. All rights reserved
correct p-value of this two-sided should be 2 × 0.0258 = 0.0517. As illustrated here, this error in
the Excel F-test function can mislead the user to incorrectly reject the null hypothesis when it
should not have been rejected (a p-value of 00258 versus the correct value of 0.0517).
In summary, the F-test function in the Analysis Toolpak assumes that a one-sided test is being
conducted. This necessitates two changes to correctly use and interpret the results as a two-sided
F-test:
(1) the variance of the data set with the larger variance should be placed in the numerator
of the calculated F-ratio; if F
calc
is less than one this step has not be performed correctly.
(2) the p-value reported by Excel should be doubled to give the correct p-value for the
two-sided hypothesis test. The documentation does not provide the user enough
information to use the function or to interpret the results correctly and incorrect decisions
might be result if these recommendations are not followed.
Page 22/47
Copyright © 2006 by Stephen L. Morgan and Stanley N. Deming. All rights reserved
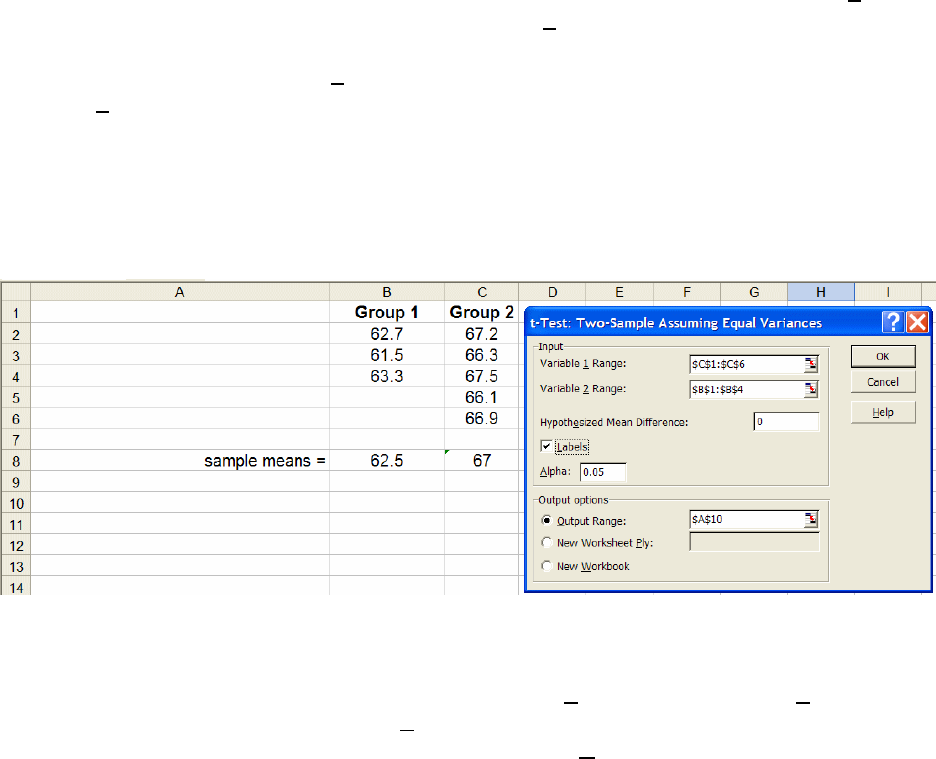
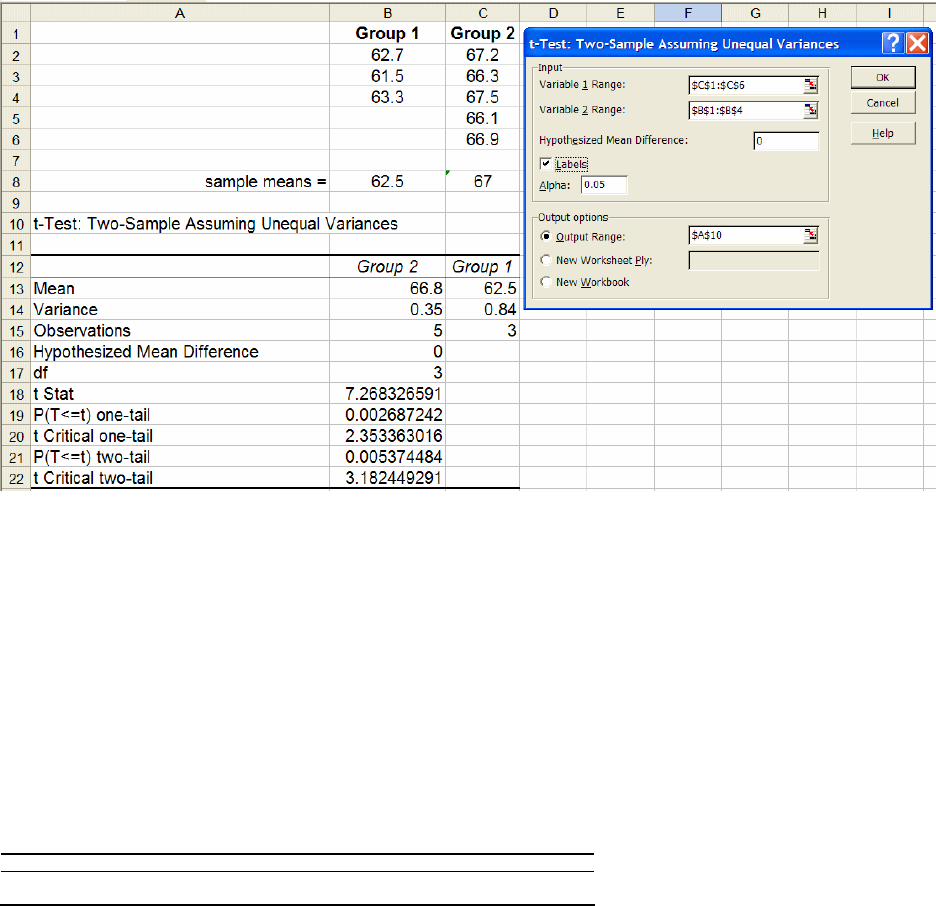
3. t-Test: Two-Sample Assuming Equal Variances
DESCRIPTION: This function performs a two-sample Student’s t-test to test the null hypothesis
that the population means of two groups are equal, or “not different”. This version of the test
assumes that the variances of the two data sets are equal.
USAGE: The two sets of data whose means are to be compared should be entered in consecutive
rows of two columns, or in consecutive columns of two rows. It is not necessary that the number
of data points in each group be the same. Entering labels as column or row headers will aid in
identifying the two sets of data in the output. In the sample spreadsheet below, the two groups of
data have been entered in columns.
The documentation of this function in Excel does not make it clear how to use or interpret the
outcome correctly for one-sided versus two-sided tests, especially how this interpretation is
dependent on the sign of the calculated t-statistic. This point is vital because, although the Excel
dialog box for the t-test does not explicitly inform the user which group’s mean is subtracted
from the other, the function always subtracts the mean of the data specified in Variable 1
Range
from the mean of the data specified in Variable 2 Range. For this reason, to insure
correct use and interpretation of the two-sample t-test, the group having the larger sample mean
should be entered in the
Variable 2 Range and the group having the smaller sample mean in the
Variable 1 Range. This choice will force the calculated value of t (t
calc
, labeled as “t Stat” in the
Excel output) to be positive. If the value of “t Stat” is negative, the ranges have not been entered
correctly. It is helpful to calculate the two sample means using the AVERAGE function to
identify the data with the largest sample mean before executing the t-test function, as shown
below. The consequences of this function behavior and appropriate interpretation of two- and
one-sided tests are described below.
Access the Excel function for the two-sample t-test (equal variances in the Analysis Toolpak by
clicking on
Tools, choosing Data Analysis, selecting t-Test: Two-Sample Assuming Equal
Variances
and clicking OK. Make sure that the Variable 1 Range and Variable 2 Range
includes the column labels and check the
Labels option. Excel provides the option of entering a
hypothesized mean difference other than zero, as well as an
Alpha value other than 0.05.

Page 23/47
Copyright © 2006 by Stephen L. Morgan and Stanley N. Deming. All rights reserved
This function assumes that the two statistical samples come from populations that can be
assumed to have the same variance. For example, suppose that the measurement of a property of
two physical samples of material. If the same measurement method was used for both physical
samples, the two data sets should have the same standard deviations. Absent such profound
knowledge, the F-test is appropriate for verifying this assumption. When the two variances
cannot be assumed to be the same, the t-Test: Two-Sample Assuming Unequal Variances
should be used. Because the two statistical samples come from populations that are assumed to
have similar variances, a pooled standard deviation (s
p
) is calculated:
12
22
11 22
11
12
()( )
2
==
−+ −
=
+−
∑∑
nn
ii
ii
p
x
xxx
s
nn
where x
1i
and x
2i
represent the individual data for each set, n
1
and n
2
are the number of data
points in each group, and
1
x
and
2
x
are the means of the two groups. The number of degrees of
freedom associated with the pooled standard deviation is given by (n
1
+ n
2
– 2).
TWO-SIDED TWO-SAMPLE t-TEST ASSUMING EQUAL VARIANCES: A two-sided t-test
is appropriate if researchers want to know if the population mean of one set of data (
1
x
) is
different than that of another set of data (
2
x
). A two-sided test is appropriate when there is no
specific claim that one mean is smaller or larger than the other—all that is desired is to find out if
the population means are different (i.e., not equal to).
The test statistic for judging the significance of the difference in the two population means is the
ratio of the difference in the means to the standard error of the difference in the means, a
calculated value of t:
12
12
11
−
=
⎛⎞
+
⎜⎟
⎝⎠
calc
p
xx
t
s
nn
Note the absolute value sign in the numerator for the two-sided test: the sign of the difference is
of no concern; only the magnitude of the difference in the means is in question. The absolute
value calculation is taken care of by always entering the data having the largest sample mean in
the Variable 2
Range.
The reference distribution for judging the significance of the difference between the population
means of the two groups is the Student’s t-distribution, first described by William S. Gossett
(“Student”) in 1908. The null and alternative hypotheses for the two-sided two-sample t-test are:
null hypothesis, H
0
:
12
μ
μ
=
alternative hypothesis, H
a
:
12
μ
μ
≠
Page 24/47
Copyright © 2006 by Stephen L. Morgan and Stanley N. Deming. All rights reserved
The decision to reject the null hypothesis and to accept the alternative hypothesis is made by
comparing t
calc
to the critical or tabular value of Student’s t (t
crit
) at a level of risk α for the
number of degrees of freedom associated with the standard error of the difference in means (n
1
+
n
2
– 2) . The logic is similar to other statistical hypothesis tests: (a) If |t
calc
| > t
crit
, then reject the
null hypothesis and accept the alternative hypothesis; or (b) If |t
calc
| ≤ t
crit
, then do not reject the
null hypothesis.
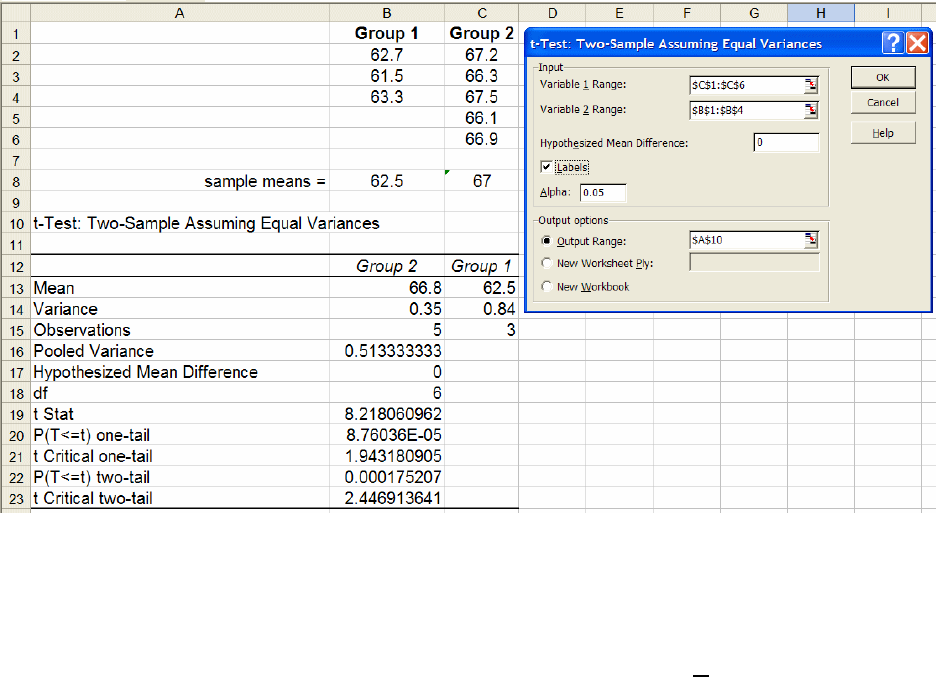
OUTPUT AND INTERPRETATION OF TWO-SIDED TWO-SAMPLE t-TEST: The output
for the two-sample t-test on the present data is shown below.
Excel reports information on both the one-sided and two-sided tests. Only the last two lines of
output (labeled “two-tail”) should be examined when conducting a two-sided two-sample t-test.
In the last line of the output above, the critical value of Student’s t for the two-sided hypothesis
test is reported above as 2.446913641. This value is the critical value of t at (n
1
+ n
2
– 2) df at the
level of significance specified previously in the initial dialog box as the A
lpha value (0.05 in this
case). Because this is a two-sided test, the risk α is divided into two halves on either side of the
distribution; the critical value of t is associated with a cumulative fractional area of 0.975 on the
right side of the distribution (associated with a right tail area of α/2 = 0.025). Note that Excel
displays more digits than necessary; two or three digits after the decimal are sufficient for
reporting.
For the two-sided t-test on the present data, the calculated absolute value of t (t
calc
, or as in the
Excel output, “t Stat”) is 8.22. This value is compared to the value of “t Critical two-tail” (t
crit
) of
2.45 based on α = 0.05 (two-sided), and 6 df. Because |t
calc
| > t
crit
(8.22 > 2.45), the null
hypothesis is rejected at the 95% level of confidence [100% × (1 - α)]. Thus, the population
means are judged to different at the 95% level of confidence.

Page 25/47
Copyright © 2006 by Stephen L. Morgan and Stanley N. Deming. All rights reserved
The p-value (0.000175207) is the probability that a value of t greater than or equal to the
calculated value (t
calc
= 8.22) could have occurred by chance if there were no difference in the
means. The p-value is twice (two-sided) the fractional area of the right tail of the t-distribution
above the calculated value of t
calc
. The risk of getting the value |t
calc
| = 8.22 (ignoring sign) by
chance is less than Alpha = 0.05. Because this value is larger than that which could be expected
to occur by chance if the null hypothesis is true, the null hypothesis is rejected.
The label for the p-value listed in the table [“P(T<=t) two-tail”] is difficult to interpret and can be
misleading. First, “t Stat” was used to label that calculated value of t, not “T”. Second, it is
unusual to see this label written “backward” as it is in the Excel table –writing “P(t >= T)” would
have been better.
ONE-SIDED TWO-SAMPLE t-TEST: The one-sided t-test is appropriate if it is desired wanted
to know, before looking at the data, if one population mean (say,
μ
2
) is greater than the other
(
μ
1
). In the one-sided test, the test statistic for judging the significance of the difference in the
two population means is the ratio of the difference in the means to the standard error of the
difference in the means, a calculated value of t:
()
21
12
11
−
=
⎛⎞
+
⎜⎟
⎝⎠
calc
p
xx
t
s
nn
Note the absence of an absolute value sign in the numerator for the one-sided test: the sign of the
difference is of concern. The null and alternative hypotheses for the one-sided two-sample t-test
are:
null hypothesis, H
0
:
21
μ
μ
≤
alternative hypothesis, H
a
:
21
μ
μ
>
For a one-sided test, it is important to define the difference between the means to be placed in the
numerator of the calculated t-statistic to be positive if the alternative hypothesis, H
a
, is true. Then
all one-sided tests will be ‘greater than” tests and the “less than” possibility doesn't have to be
handled separately. This is accomplished by always selecting the data which is claimed to larger
by the alternative hypothesis (
μ
1
above) to be entered in the Variable 2 Range.
OUTPUT AND INTERPRETATION OF THE ONE-SIDED TWO-SAMPLE t-TEST
ASSUMING EQUAL VARIANCES:
The decision to reject the null hypothesis and to accept the
alternative hypothesis is made by comparing t
calc
to the critical or tabular value of Student’s t
(t
crit
) at a level of risk α for the number of degrees of freedom associated with the standard error
of the difference in means (n
1
+ n
2
– 2). The statistical decision is made using the following
logic: (a) If t
calc
> t
crit
, then reject the null hypothesis and accept the alternative hypothesis; or (b)
If t
calc
≤ t
crit
, then do not reject the null hypothesis. Note the absence of absolute value signs in
these comparisons (unlike with the two-sided t-test). Note also that a negative value of t
calc
could
(i.e., the sample mean for the group entered in the Variable 2
Range is actually less than the
sample mean of the data entered in the Variable 1
Range. In this case, the sign of the difference
Page 26/47
Copyright © 2006 by Stephen L. Morgan and Stanley N. Deming. All rights reserved
is the opposite of what is claimed by the alternative hypothesis, t
calc
will be less than the
(positive) critical value of t (labeled “t Stat”) and the null hypothesis cannot be rejected.
The Excel t-test function reports information on both the one-sided and two-sided tests in the
same output. For the one-sided two-sample t-test, only the two lines of output (labeled “one-
tail”) immediately below the line containing the value of “t Stat” should be examined (output
shown again below).
The calculated value of t (“t Stat”) is 8.22. This value is compared to the value of “t Critical one-
tail” (t
crit
) of 1.94 based on α = 0.05 (one-sided), and 6 df. Because t
calc
> t
crit
(8.22 > 1.94), the
null hypothesis is rejected at the 95% level of confidence [100% × (1 - α)]. Thus, the population
mean of group 2 is judged to greater that the population mean of group 1 at the 95% level of
confidence.
The p-value (8.76 × 10
-5
) is the probability that a value of t greater than or equal to the calculated
value (t
calc
= 8.22) could have occurred by chance if the null hypothesis is true. The p-value is the
fractional area of the right tail (one-sided) of the t-distribution above the calculated value of t
calc
.
The risk of getting the value t
calc
= 8.22 by chance is less than Alpha = 0.05. Because this value
is larger than that which could be expected to occur by chance if the null hypothesis is true, the
null hypothesis is rejected.
The label for the p-value listed in the table [“P(T<=t) one-tail”] is difficult to interpret and can be
misleading. First, “t Stat” was used to label that calculated value of t, not “T”. Second, it is
unusual to see this label written “backward” as it is in the Excel output –writing “P(t >= T)”
would have been better.
Page 27/47
Copyright © 2006 by Stephen L. Morgan and Stanley N. Deming. All rights reserved
4. t-Test: Two-Sample Assuming Unequal Variances.
DESCRIPTION: This function performs a two-sample Student’s t-test to test the null hypothesis
that the population means of two groups are equal, or “not different”. This version of the test
does not assume that the variances of the two data sets are equal.
USAGE: The two-sample t-test with unequal variances should be performed if the user has a
priori knowledge that the variances of the two groups of data are different or if an F-test leads to
rejection of the null hypothesis that the variances are the same. It is not necessary that the
number of data points in each group be the same. Access the t-Test: Two-Sample Assuming
Unequal Variances tool in the Analysis Toolpak. Enter the range of cells encompassing the
rows and columns of sets of variables. It is a good idea to include group labels at the head of
each column; indicate whether or not labels are included in the variable ranges by selecting the
L
abels check box. Enter the value for the level of significance, Alpha (a value of α = 0.05
implies the test will be conducted at the 95% level of confidence). Finally, select the output
range, and click on OK. The usage of this function with regard to date entry and the “sidedness”
of the test is the same as described for the t-Test: Two-Sample Assuming Equal Variances.
The only difference between the two-sample t-test assuming unequal variances and that
assuming equal variances involves the calculation of the calculated test statistics and associated
number of degrees of freedom. In the case of unequal variances, for the two-sided test, the test
statistic for judging the significance of the difference in the two population means is given by:
12
22
12
12
−
=
⎛⎞
+
⎜⎟
⎝⎠
calc
xx
t
ss
nn
For the one-sided test, the test statistic for judging the significance of the difference in the two
population means is given by:
()
21
22
12
12
−
=
⎛⎞
+
⎜⎟
⎝⎠
calc
xx
t
ss
nn
In either case, the number of degrees of freedom associated with the critical value of the test
statistic is given approximately by:
(
)
()
()
()
()
2
22
11 22
22
22
11 1 22 2
11
+
=
−+ −
sn sn
df
sn n sn n
This calculation in general will not be an integer; usually the value is rounded to the next highest
integer.
Page 28/47
Copyright © 2006 by Stephen L. Morgan and Stanley N. Deming. All rights reserved
OUTPUT AND INTERPRETATION OF THE TWO-SAMPLE t-TEST ASSUMING
UNEQUAL VARIANCES: The output for the same data as was used previously for the two-
sample t-test assuming equal variances is shown below.
The output and interpretation of this function with regard to date entry and the “sidedness” of the
test is the same as described for the
t-Test: Two-Sample Assuming Equal Variances. For the
output shown above, both the two-sided and one-sided cases report differences between the two
population means that are significant at the 95% level of confidence.
SAMPLE OUTPUT FROM OTHER STATISTICAL PROGRAMS:
The following output is from Systat (version 11, SYSTAT Software, Inc.). Note that the program
correctly handles the calculations so that the sign of the difference between the means does not
matter.
Two-sample t-test on VAR00001 grouped by VAR00002 against Alternative = 'not equal'
Group N Mean SD
1 3 62.500 0.917
2 5 66.800 0.592
Separate variance:
Difference in means = -4.300
95.00% CI = -6.172 to -2.428
t = -7.268
df = 3.0
p-value = 0.005
Pooled variance:
Difference in means = -4.300
95.00% CI = -5.580 to -3.020
t = -8.218
df = 6
p-value = 0.000
Page 29/47
Copyright © 2006 by Stephen L. Morgan and Stanley N. Deming. All rights reserved
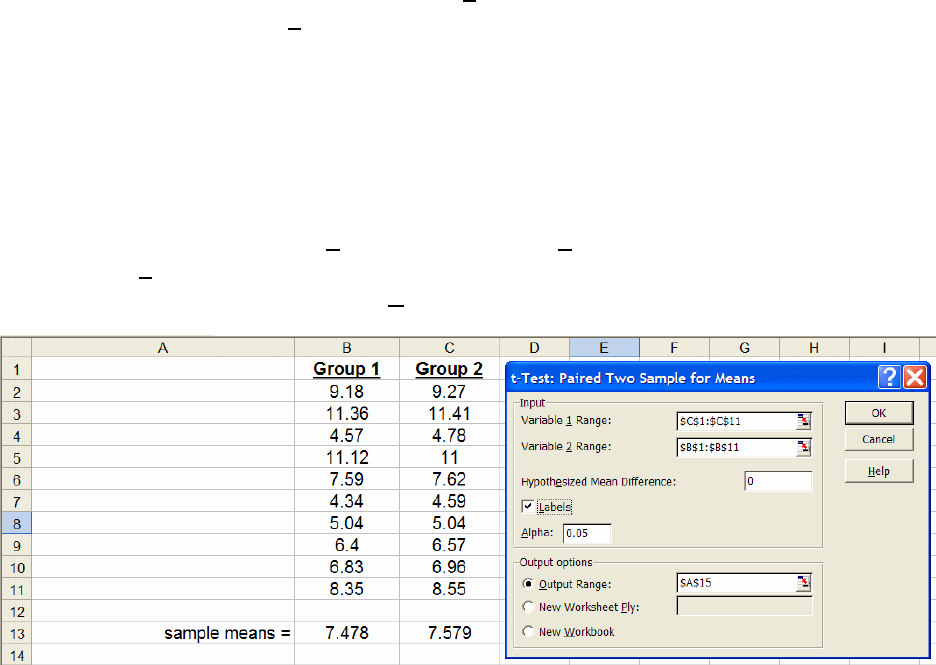
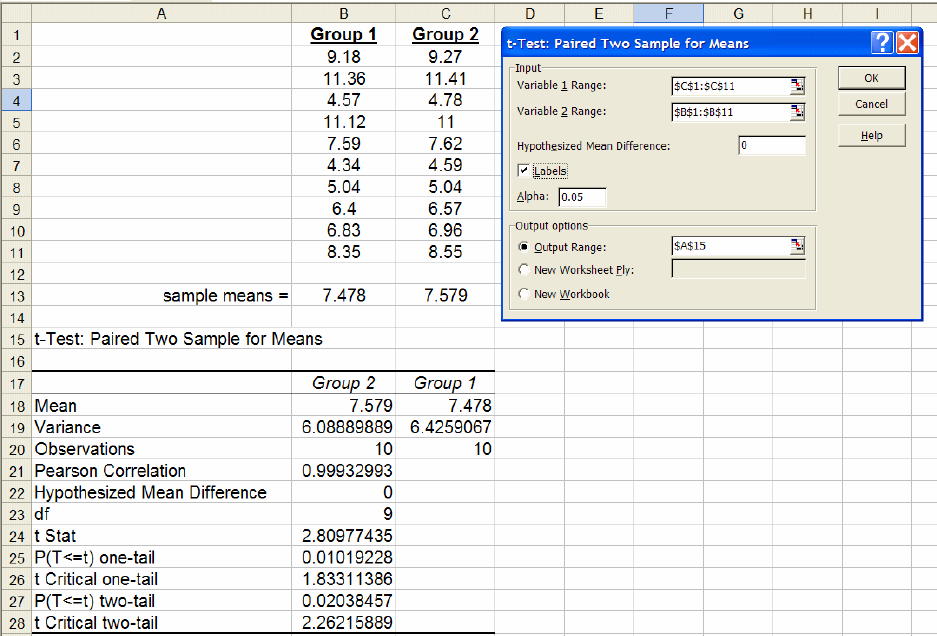
5.
t-Test: Paired Two Sample For Means
DESCRIPTION: This tool performs a paired Student’s t-test to determine whether the paired
differences between two sets of paired data have a population mean of zero. It is a more sensitive
test of equality for two means than the two-sample t-test. However, the paired t-test can only be
used when the experimental design involves a paired relationship between samples in one and
samples in a second group. This test does not assume that the variances of the two populations
are equal.
USAGE: The two sets of data whose means are to be compared should be entered in consecutive
rows of two columns, or in consecutive columns of two rows. It is not necessary that the number
of data points in each group be the same. Entering labels as column or row headers will aid in
identifying the two sets of data in the output. In the sample spreadsheet below, the two groups of
data have been entered in columns.
To insure correct use and interpretation of the two-sample t-test, the group having the larger
sample mean should be entered in the
Variable 2 Range and the group having the smaller
sample mean in the
Variable 1 Range. This choice will force the calculated value of t (t
calc
,
labeled as “t Stat” in the Excel output) to be positive. If the value of “t Stat” is negative, the
ranges have not been entered correctly. It is helpful to calculate the two sample means using the
AVERAGE function to identify the data with the largest sample mean before executing the t-test
function, as shown below.
Access the Excel function for the paired t-test in the Analysis Toolpak by clicking on
Tools,
choosing
Data Analysis, selecting t-Test: Two Paired Two Sample For Means and clicking
OK
. Make sure that the Variable 1 Range and Variable 2 Range includes the column labels
and check the
Labels option. Excel provides the option of entering a hypothesized mean
difference other than zero, as well as an
Alpha value other than 0.05.
Page 30/47
Copyright © 2006 by Stephen L. Morgan and Stanley N. Deming. All rights reserved
OUTPUT AND INTERPRETATION OF THE t-TEST: PAIRED TWO SAMPLE FOR
MEANS: The paired test is used when there is a natural pairing of observations in the samples.
This pairing relationship is usually the result of designing the experiment in that way. For
example: an aliquot from the same solution might be tested by two different analytical methods;
to evaluate whether a treatment has an effect, each object might be tested twice, before and after
treatment.
The interpretation of the paired t-test is equivalent to that described for the two-sample t-test.
The output is shown below for the present data.
INTERPRETATION OF THE TWO-SIDED PAIRED t-TEST: The reference distribution for
judging the significance of the difference between the population means of the two groups is the
Student’s t-distribution. The null and alternative hypotheses for the two-sided paired t-test are:
null hypothesis, H
0
:
12
μ
μ
=
alternative hypothesis, H
a
:
12
μ
μ
≠
For the two-sided test, only the magnitude of the paired differences of concern; it does matter
which mean is larger than the other. The calculated value of the t-statistic (“t Stat”, above) is
equal to 2.81. For the present data, this value is compared to the critical value of t based on a
level of significance (typically, α = 0.050) and a number of degrees of freedom equal to (m – 1),
where m is the number of paired measurements (e.g., if 10 measurements are made on samples

Page 31/47
Copyright © 2006 by Stephen L. Morgan and Stanley N. Deming. All rights reserved
using two different analytical methods, df =10 -1 = 9). In this case, the calculated value of t (“t
Stat”) is 2.81. This value is compared to the value of “t Critical two-tail” (t
crit
) of 2.26 based on α
= 0.05 (one-sided), and 9 df. Because |t
calc
| > t
crit
(2.81 > 2.26), the null hypothesis is rejected at
the 95% level of confidence [100% × (1 - α)]. Thus, the population mean of group 2 is judged to
greater that the population mean of group 1 at the 95% level of confidence.
The p-value (0.0204) is the probability that a value of t greater than or equal to the calculated
value (t
calc
= 2.81) could have occurred by chance if the null hypothesis is true. The p-value is
twice (two-sided) the fractional area of the right tail of the t-distribution above the value of |t
calc
|
The risk of getting the value |t
calc
| = 2.81 (ignoring sign) by chance is less than Alpha = 0.05.
Because this value is larger than that which could be expected to occur by chance if the null
hypothesis is true, the null hypothesis is rejected.
The label for the p-value listed in the table [“P(T<=t) one-tail”] is difficult to interpret and can be
misleading. First, “t Stat” was used to label that calculated value of t, not “T”. Second, it is
unusual to see this label written “backward” as it is in the Excel output –writing “P(t >= T)”
would have been better.
INTERPRETATION OF THE ONE-SIDED PAIRED t-TEST: The null and alternative
hypotheses for the one-sided paired t-test are:
null hypothesis, H
0
:
21
μ
μ
≤
alternative hypothesis, H
a
:
21
μ
μ
>
The one sided paired t-test output is also shown in the above figure. Its interpretation is similar to
that of the one-sided two-sample t-test. For a one-sided test, remember that the difference
between the means to be placed in the numerator of the calculated t-statistic is defined to be
positive if the alternative hypothesis, H
a
, is true. Then all one-sided tests will be ‘greater than”
tests and the “less than” possibility doesn't have to be handled separately. This is accomplished
by always selecting the data which is claimed to larger by the alternative hypothesis (
μ
1
above)
to be entered in the
Variable 2 Range.
Page 32/47
Copyright © 2006 by Stephen L. Morgan and Stanley N. Deming. All rights reserved
6.
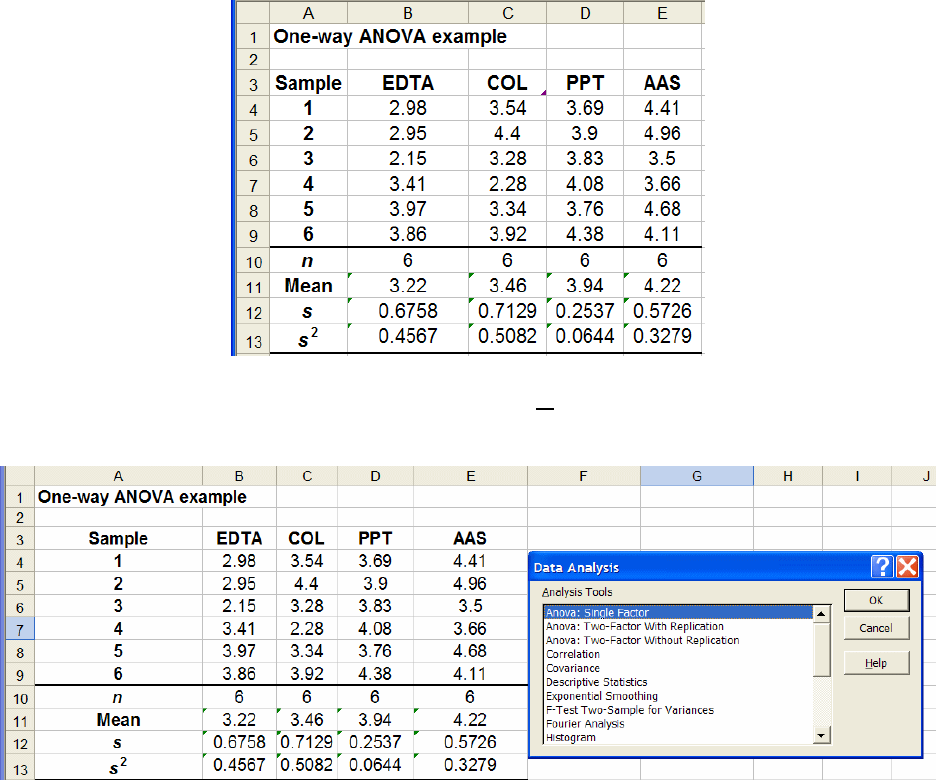
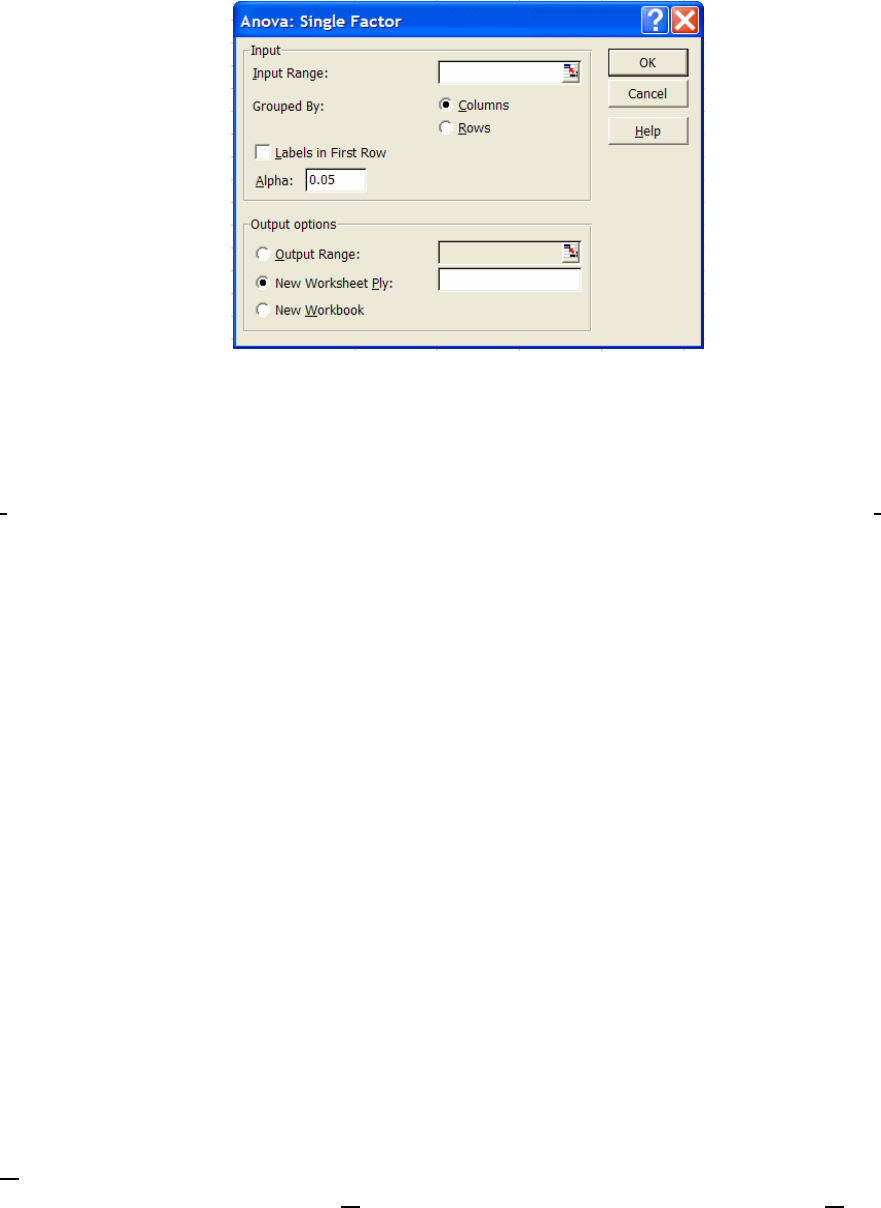
Anova: Single Factor.
DESCRIPTION: This tool performs a “one-way analysis of variance” to test for the significance
of differences among the means of more than just two groups. Specifically, one-way analysis of
variance (ANOVA) tests the null hypothesis that the different groups all have the same
population mean (H
0
:
μ
1
=
μ
2
=
μ
2
=
μ
4
) versus the alternative hypothesis (H
a
) that at least one
group mean is different from the others.
Also included as a separate program in the Data Analysis Toolpak is a two-way (or two-factor)
ANOVA function that tests for differences among groups based on two factors (
Anova: Two-
Factor
).
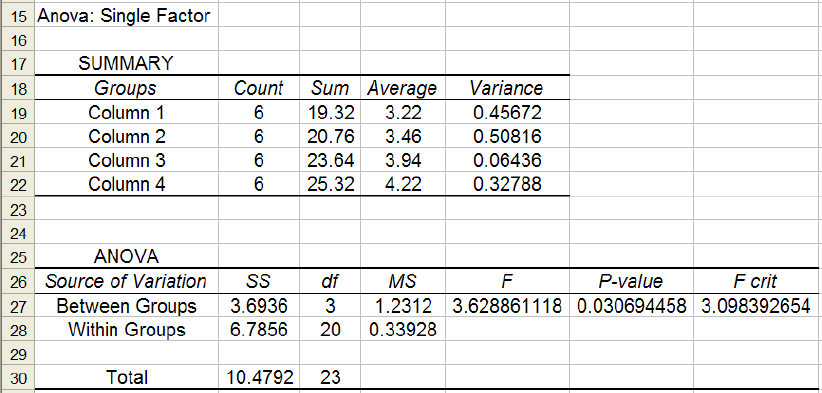
USAGE: Consider the data set shown below. The values represent six measurements (n = 6) of
calcium (Ca) in parts-per-million (ppm) for aliquots of the same sample by each of the four
analytical methods. Summary statistics are also shown for each group of data.
To perform the analysis of variance, click on the
Tools Data Analysis menu, select Anova:
Single Factor
, and click OK.
Page 33/47
Copyright © 2006 by Stephen L. Morgan and Stanley N. Deming. All rights reserved
The
Anova: Single Factor dialog box will be displayed.
The next steps involve filling in the requested input range for your data and selecting other
options. When finished with this process, click
OK to execute the Anova: Single Factor
program and generate a report.
Input Range: Enter the range of cells for the several groups of data by clicking within the Input
Range
box, clicking on the first cell containing a data value (in this case, cell B4), and then
dragging the mouse cursor to the last cell containing a data value (in this case,
E9). The data
range will be displayed in the input box. This operation selects a rectangular area on the
spreadsheet containing the columns and rows containing the data. In the example given, the four
groups of data have the same number of data values (n = 6 in each group). The program can
correctly identify situations if groups have different numbers of data values; make sure that the
entire rectangular block of data is selected, even if some groups have missing values.
Grouped By: The default check box for this option is Columns. That selection is appropriate
for the groups arranged in columns as in the present example.
Labels: If you have a first row or a first column containing labels for the rows or columns, and
you have included these rows or columns in your selections of the
Input Range, you must also
select the
Labels check box in this dialog box to inform Excel that these rows or columns
contain labels. Otherwise, leave the
Labels check box unchecked. If you have non-numeric
labels in the input ranges and have not checked the
Labels box, an error dialog box will be
displayed.
Alpha: Enter the level of significance (
α
) at which you wish to conduct the ANOVA hypothesis
test. Usually, the default fractional risk value of 0.05 (95% level of confidence) should not be
changed. The value in this box only affects the critical value of Fisher’s F-statistic displayed in
the report.
Output range: Enter the cell reference to the upper-left cell of the range where the output
summary is to appear. Click on the
Output Range radio button, click on the (empty) Output
Page 34/47
Copyright © 2006 by Stephen L. Morgan and Stanley N. Deming. All rights reserved
Range edit box where the output range is to be entered, and then click on the first cell where
you desire the output to appear. In this case, cell
A15 was selected.
Most errors result from inappropriate ranges for input or output. Check these boxes carefully and
delete and redo if needed. After the output is generated, click and drag to highlight the report
columns, click on the
Format, Column, Autofit selection to format the spreadsheet columns
wide enough to display all output.
OUTPUT AND INTERPRETATION: The report generated by clicking OK to execute the
Anova: Single Factor program is shown below. Note that more or fewer digits can be displayed
by formatting the cells appropriately.
The label “Source” indicates “Between Groups” (or “among-group”) and “Within Groups” (or
“residual”) sources of variation. The “Total” variation actually represents the “total sum of
squared deviations of the data about the grand mean of the data” (often termed the “total
corrected for the mean” or “about the mean”). The corresponding measures of these sources of
variation are displayed as sums of squares in the column labeled “SS”. The “df ” are the degrees
of freedom for the treatments (J - 1, where J is the number of groups), and for the residuals (the
total number of data points minus J). Note that the between Groups SS and the “Within Groups”
SS add to give the “Total” SS; the degrees of freedom associated with these sums of squares are
also additive. Dividing a sum of squares by its corresponding degrees of freedom (SS/df) gives a
variance (s
2
), a sort of average sum of squares, a mean sum of squares, a “Mean Square,” or
“MS”; these values are shown in the fourth column for the Between and within Groups sources
of variation. Finally, the ratio of the two mean squares (variances) gives the calculated F ratio for
testing the null hypothesis of equivalent group population means.
The outcome of the ANOVA F-test is interpreted by comparing the calculated value of the F-
statistic (in cell
E27) to the critical value of F (displayed in cell G27). The critical value of F
can be thought of as the largest value that could be expected to occur by chance for the given
degrees of freedom. If the calculated F-value is larger than the critical F-value, then the null
hypothesis of equivalent group means is rejected. The alternative hypothesis, that at least one
Page 35/47
Copyright © 2006 by Stephen L. Morgan and Stanley N. Deming. All rights reserved
mean is different from the others, is accepted. This comparison is based on the level of
significance entered previously in the
Alpha edit box. Note that cell F27 reports the exact level
p-value at which the null hypothesis can be rejected. As an aside, the Within Groups mean
square (MS) in the above table (0.33928) is the pooled estimate of the variance of the replicate
experiments over all groups; its square root (0.582477) is the pooled standard deviation, an
estimate of the experimental uncertainty in the measurements.
If the ANOVA indicates that there are significant differences in the treatment effects (H
a
accepted), then we can go ahead and find where the differences are. However, if ANOVA fails to
indicate that there are significant differences in the treatment effects (H
0
not rejected), then we
are not permitted look for differences. If the “gate” is opened and we begin to look for the
differences that must exist, we enter the statistically inexact territory of “post-hoc comparisons,”
multiple comparisons that try to control the overall experiment-wise error rate,
α
EW
. It is
inappropriate to conduct two-sample t-tests on all group differences in an attempt to find the
differences because of the loss of control over the level of significance that is incurred.
This next step is where the ANOVA functions in the Analysis Toolpak fail the user. Excel
provides no tools for comparisons to find where the real differences exist when the ANOVA F-
test rejects the null hypothesis; Excel also does not provide suitable graphics for judging such
comparisons. Post-hoc comparison methods that look at the data in different ways, while
controlling the type I error rate, are implemented in other statistical packages. Be aware that
different methods will frequently disagree, and it is not appropriate to “shop” for a method that
gives a particular desired outcome. Instead, choose one method and use it consistently. As an
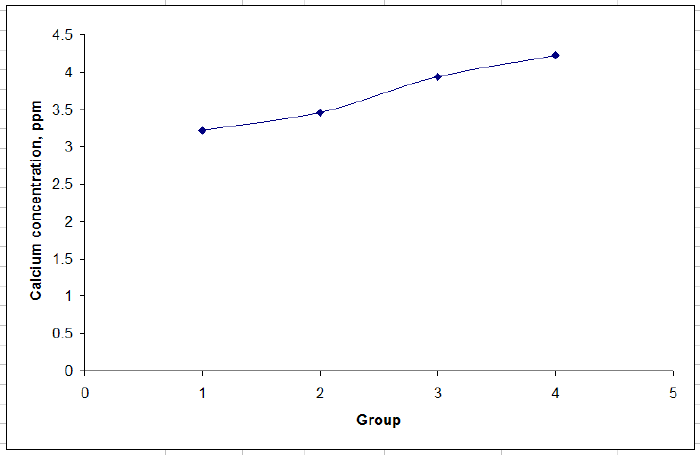
example, both MINITAB version 13 and SYSTAT version 11 implement the Fisher/Tukey
Least-Significant-Difference test and find significant differences for the means between group 1
and both of groups 3 and 4, and between the means of groups 2 and 4. A plot of the means is
shown below.
Page 36/47
Copyright © 2006 by Stephen L. Morgan and Stanley N. Deming. All rights reserved
7.
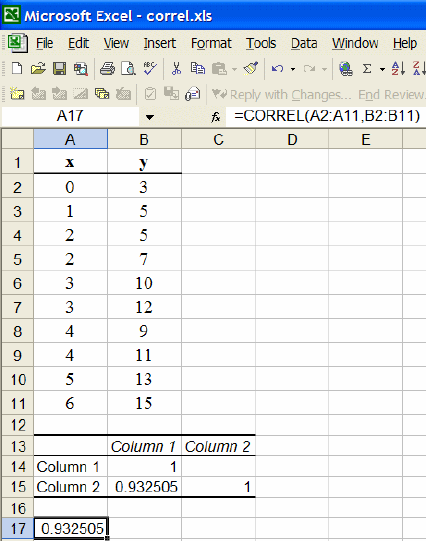
Correlation, CORREL.
DESCRIPTION: The Correlation function in the Analysis Toolpak and the CORREL function
produce the same result: the correlation coefficient (R) for two or more data ranges consisting of
equal numbers of measurements arranged in columns.
The correlation coefficient in both cases is that associated with the fitted straight line with
intercept and slope parameters. R ranges in magnitude from 0 (uncorrelated) to 1 (perfect
correlation); the sign of R indicates whether the two sets of data are positively or negatively
correlated, i.e., whether the values in the second data become larger or smaller as the values in
the first data set become larger.
USAGE: To use the CORREL function, type ‘=correl(’, enter the range of cell values to be
averaged, and press the
Enter key to execute the command. The CORRELATION function is
accessed from the Analysis Toolpak. Enter the range of cells encompassing the rows and
columns of two sets of variables, indicate whether the variables are grouped in rows or columns,
select the output range, and click on
OK.
OUTPUT AND INTERPRETATION: The output the Correlation tool (at cell E13) and the
CORREL function (at cell E17) are illustrated below:

Page 37/47
Copyright © 2006 by Stephen L. Morgan and Stanley N. Deming. All rights reserved
The correlation coefficient calculated by Excel is the sample correlation coefficient, R, given by:
===
== ==
⎛⎞
⎛⎞⎛⎞
⎜⎟
−
⎜⎟⎜⎟
⎜⎟⎜⎟
⎜⎟
⎝⎠⎝⎠
⎝⎠
=
⎛⎞⎛⎞
⎛⎞ ⎛⎞
⎜⎟⎜⎟
−−
⎜⎟ ⎜⎟
⎜⎟⎜⎟
⎜⎟ ⎜⎟
⎜⎟⎜⎟
⎝⎠ ⎝⎠
⎝⎠⎝⎠
∑∑∑
∑∑ ∑∑
2
111
22
22
11 11
nnn
ii i i
iii
nn nn
ii ii
ii ii
xy x y n
R
x
xn y yn
This correlation coefficient can also be calculated after estimating the parameters of the fitted
straight line with intercept and slope parameters. R is the square root of the ratio of the sum of
squares due to regression divided by the sum of squares corrected for the mean from resulting
regression ANOVA:
=
regression
corrected for mean
SS
R
SS
The correlation coefficient ranges in magnitude from 0 (uncorrelated) to 1 (perfect correlation);
the sign of R indicates whether the two sets of data are positively or negatively correlated, i.e.,
whether the values in the second data become larger or smaller as the values in the first data set
become larger. The square of the correlation coefficient is the coefficient of determination, R
2
.
Page 38/47
Copyright
© 2006 by Stephen L. Morgan and Stanley N. Deming. All rights reserved
D. Graphing and fitting models to data
Excel has the ability to create “charts” of data. However, if the charting tools in Excel are
employed indiscriminately, graphical paralysis and stupor is easily introduced. The principles of
graphical excellence listed by Edward R. Tufte in his book, The Visual Display of Quantitative
Information, are “a matter of substance, of statistics, and of design.” As Tufte explains,
“[g]raphical excellence consists of complex ideas communicated with clarity, precision, and
efficiency. Graphical excellence is that which gives to the viewer the greatest number of ideas in
the shortest time with the least ink in the smallest space. Graphical excellence is nearly always
multivariate. And graphical excellence requires telling the truth about the data.”
Let’s start with making an XY plot of a set of data.
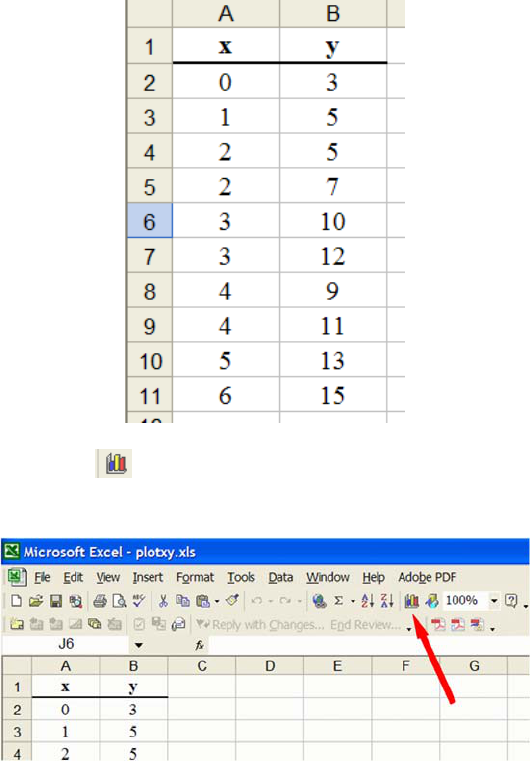
1. Creating an XY plot of data. Enter the data set, with data points representing each of the two
variables in separate adjacent columns. Enter text in the column headings to identify the
variables. For example:
Click on the charting tool icon
located in the top right hand side of the toolbar (a colored
histogram).
Page 39/47
Copyright
© 2006 by Stephen L. Morgan and Stanley N. Deming. All rights reserved
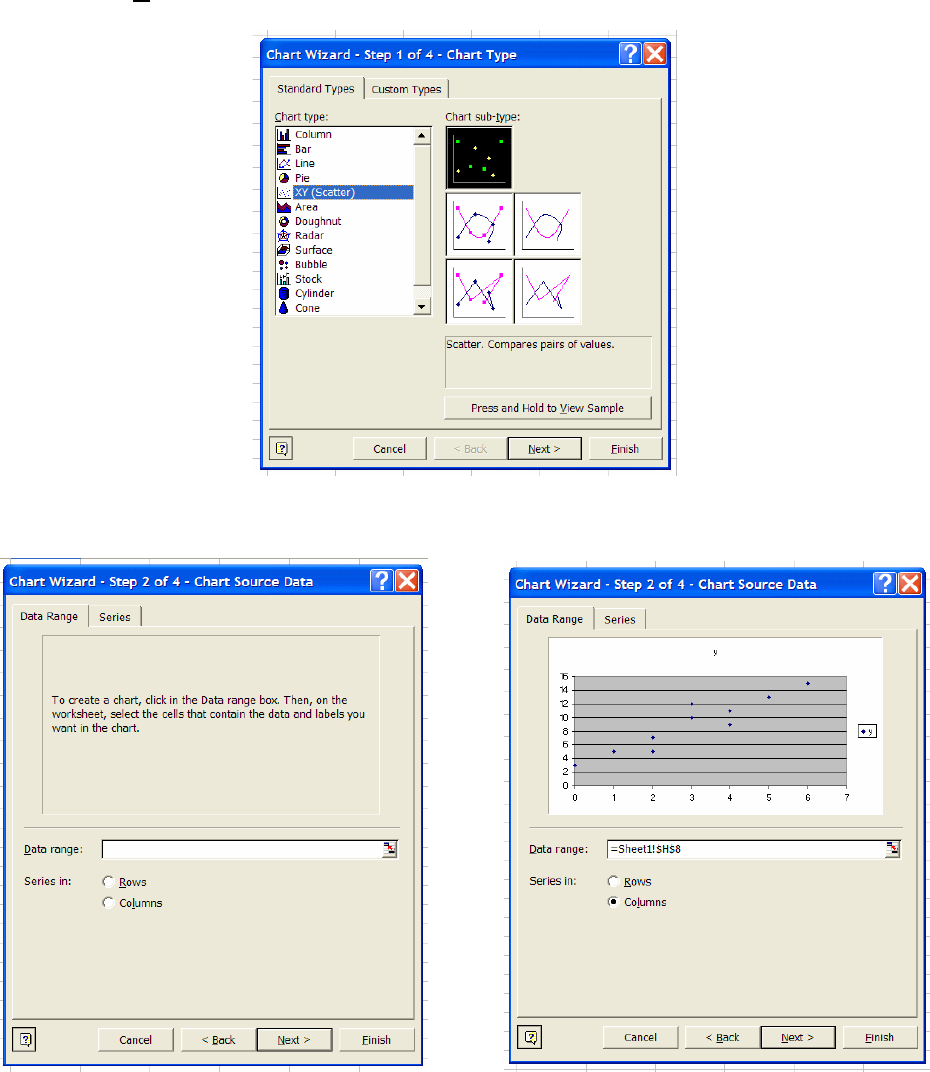
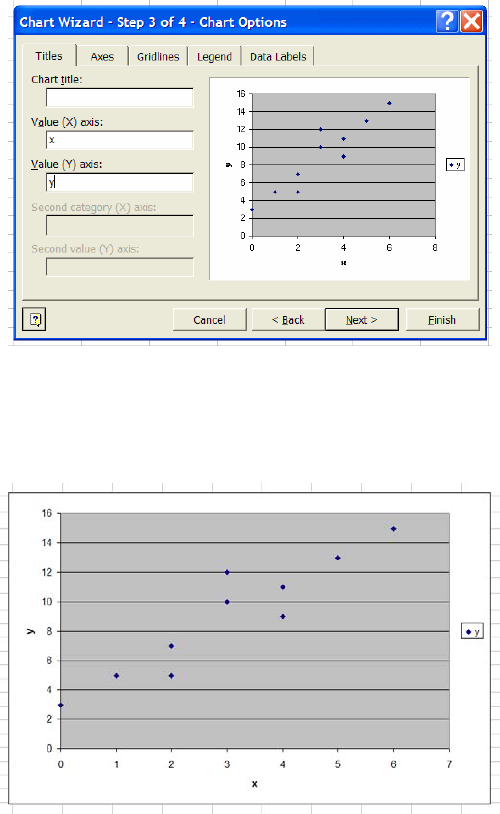
When the Chart wizard appears, click on the
XY (Scatter) plot on the Standard types tab. In
general, do not surrender control of the appearance of your graph to Excel. If you really want to
connect the lines between the points, click on one of the other options displayed. However, you
should usually resist the temptation to connect wavy lines through all your data points. These
lines usually have no statistical significance and may represent your data by an inappropriate
model. Click on the first chart type showing only data points at the upper right side of the dialog
box. Click on
Next to continue.
The next dialog box (Step 2 of 4) facilitates input of the data ranges (left below).
Page 40/47
Copyright
© 2006 by Stephen L. Morgan and Stanley N. Deming. All rights reserved
If you previously clicked and dragged to select the data range (excluding the text headings)
before clicking on the Chart Tool, the dialog box will show a preliminary plot of the data and
have the Data Range input box already filled with the data range.
If the data range has not been specified yet, type the cell range for the data (including both
columns and excluding the headings) or, even easier, click and drag to select the data range
(including the text heading) on the current spreadsheet. Make sure that the
Series in option
button is clicked to specify that the data series are in columns. Clicking on the Series tab will
confirm that the first column has been assigned to the x-series and the second column to the y-
series. Click
Next to continue.
The next dialog box (Step 3 of 4) solicits legends to be added to the chart. You may add a title to
be centered above the plot, a legend on the x-axis, and/or a legend on the y-axis. The chart title is
often unnecessary if the figure is going to be accompanied by a figure number and descriptive
legend in a report. Click
Finish when done. The chart can also be edited later to include any of
these legends.
The plot of the data will show as a chart region on your worksheet (seen below). It may be
moved for positioning, and the “handles” or square dots at the corners or sides may be dragged to
change the plot size. Double click on the chart itself or click on the right mouse button to select
objects in the chart to edit.
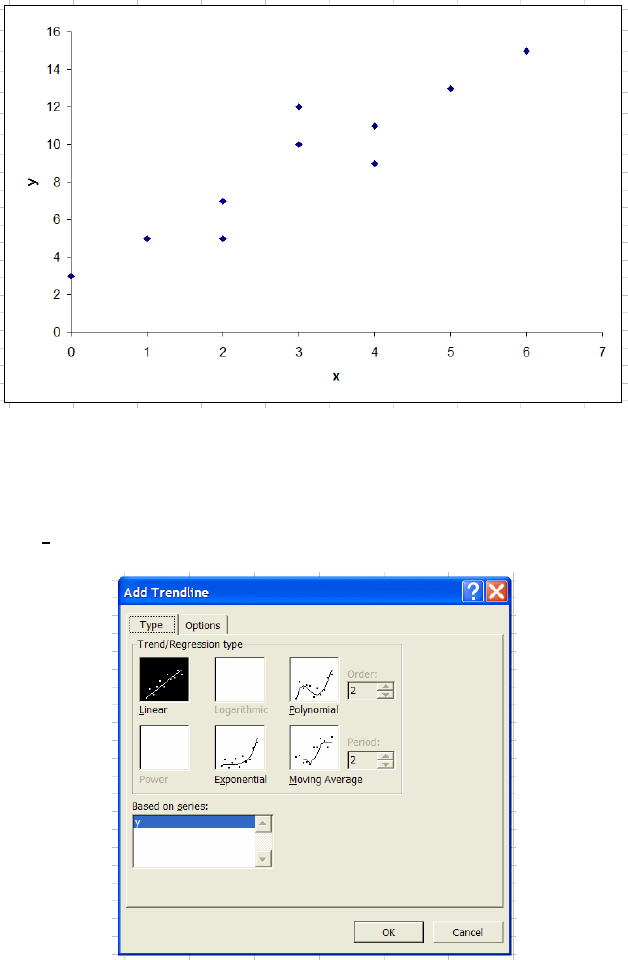
Page 41/47
Copyright
© 2006 by Stephen L. Morgan and Stanley N. Deming. All rights reserved
As Tufte suggests, “[t]he interior decoration of graphics generates a lot of ink that does not tell
the viewer anything new.” The appearance of the above chart can be improved by deleting the
dark background by right-clicking on the background and selecting
Clear. Likewise the grid
lines can be removed by right-clicking on a grid line and selecting
Clear. The small box to the
right of the plot is usually superfluous and also can be removed by right-clicking on it and
selecting
Clear. The chart appearance is now as shown below. The series pattern can also be
edited (by right-clicking) to display a different symbol or color for the data values.
This plot is valuable because it shows the raw data without any assumptions concerning models
that might summarize the relationship between the two variables. x and y. A straight line (or
other polynomial) may be quickly fitted to the data by right-clicking on any of the data points
and selecting
Add Trendline.
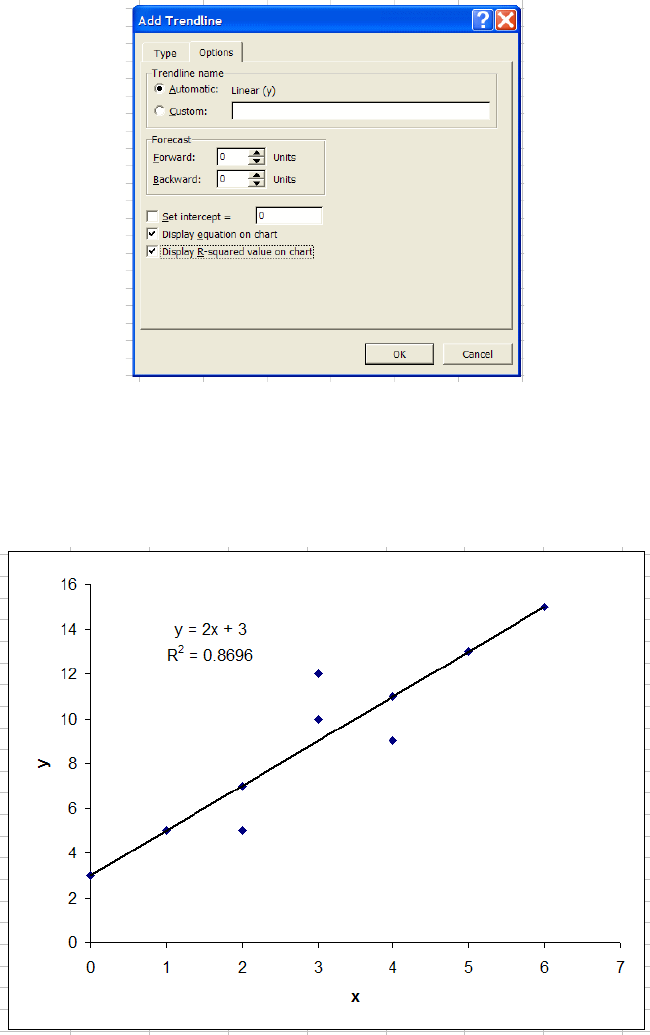
Page 42/47
Copyright
© 2006 by Stephen L. Morgan and Stanley N. Deming. All rights reserved
If there is no scientific or other reason to suspect that a higher-order model may represent the
data, select the
Linear Trend/Regression type (the default). If the fitted equation and the R
2
(coefficient of determination) value is desired on the chart, click on the
Options tab and select
the appropriate check boxes for these options. Click
OK to continue.
The chart should now appear as shown below. The position of the text box on the plot can be
adjusted by (a) clicking on the box to select, (b) clicking and holding down the left mouse button
while positioned on the text box edge or on the handles that appear, and (c) dragging the text box
to a new position.
The resulting chart is relatively free of unnecessary clutter.
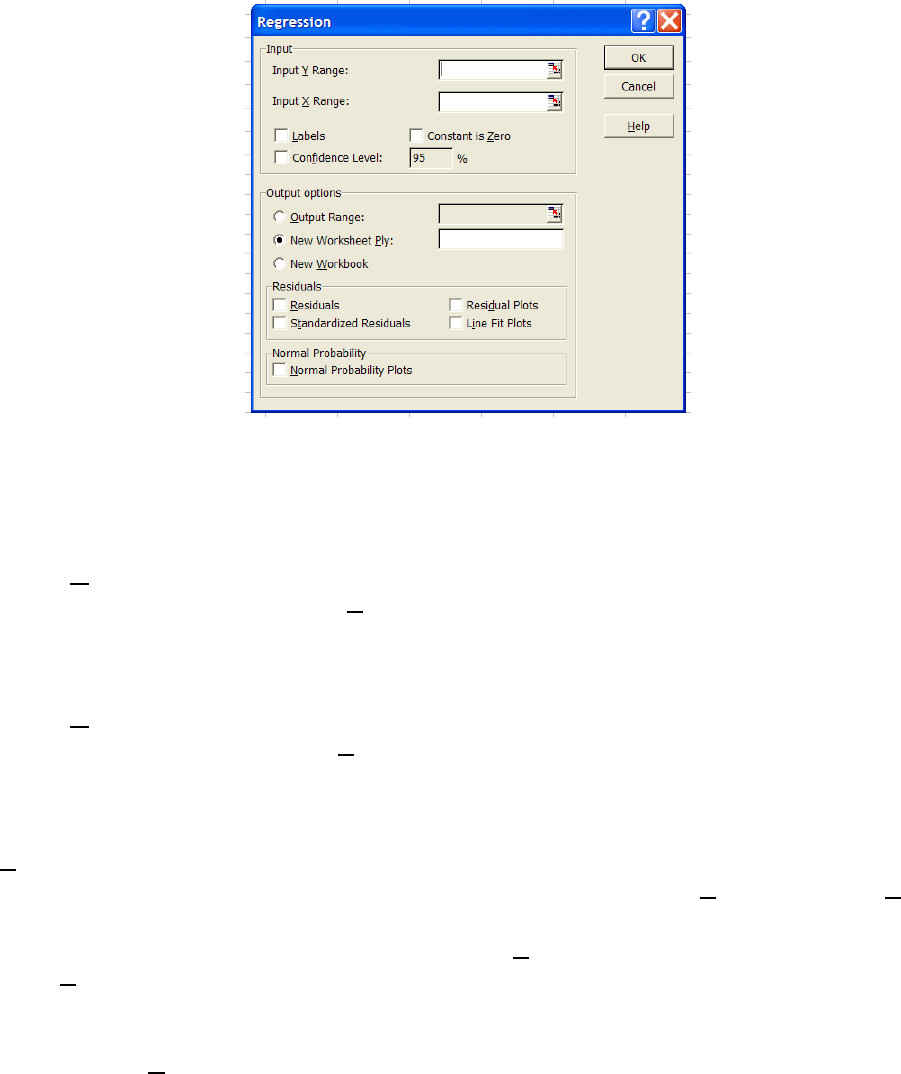
Page 43/47
Copyright
© 2006 by Stephen L. Morgan and Stanley N. Deming. All rights reserved
2. Using the regression function to fit a straight line
This discussion assumes that the data has been entered in two columns as described at the start of
the previous section. Click on the
Tools menu on the top menu line, select Data Analysis, and
choose
Regression. The regression dialog box will appear as shown below.
The next step involve filling in the requested input and output ranges for your data and selecting
other options. When finished with this process, click
OK to execute the regression program and
generate a report.
Input Y range: Enter the range of cells for the “dependent” variable, y. The easiest way to do
this is to first click within the
Input Y Range input box and then click on the first cell
containing a y-value (in this case, cell
B2) and then drag the mouse cursor down to the last cell
containing a y-value (in this case,
B11). The y data range will be displayed in the input box.
Input X range: Perform the same actions for the “independent” variable, x, as done above for
the y range. Click within the
Input X range input box, click on the first cell containing x-values
(in this case,
A2) and drag down to the last data value (in this case, cell A11). The x data range
will be displayed in the input box.
Labels: If you have a first row or a first column containing labels for the rows or columns, and
you have included these rows or columns in your selections of the
Input Y Range or Input X
Range
, you must also select the Labels check box in this dialog box to inform Excel that these
rows or columns contain labels. Otherwise, leave the
Labels check box immediately below the
Input X Range unchecked. If you have non-numeric labels in the x or y ranges and have not
checked the Labels box, an error dialog box will be displayed.
Constant is Zero: Select this box by clicking on it only if you want to fit a straight line
through the origin. This option should not be checked unless you are sure that it is appropriate to
omit an intercept parameter from the model.

Page 44/47
Copyright
© 2006 by Stephen L. Morgan and Stanley N. Deming. All rights reserved
Confidence level: Click the confidence level box for additional confidence interval
calculations to be performed; usually the default value at the 95% confidence level should not be
changed.
Output range: Enter the cell reference to the upper-left cell of the range where you want the
output summary to appear. The easiest way to define this is to click on the
Output Range radio
button, then click on the (empty)
Output Range edit box where the output range is to be
entered, then click on the first cell where you desire the output to appear. In this case, cell
A22
was selected. The rows immediately below this cell will be where the output appears; the number
of rows used for residuals depends on the number of data points.
Residuals: Select the Residuals check box if you want residuals printed.
Standardized residuals: Select the Standardized Residuals check box if a table
standardized residuals is desired.
Residual plots: Select this check box if you want a chart containing the residuals to be
generated.
Line fit plot: Select this check box if you want a chart containing the predicted versus observed
values to be generated.
Normal probability plot: Select this check box if you want a chart containing a normal
probability plot to be generated.
Most errors result from inappropriate ranges for input or output. Check these boxes carefully and
delete and redo if needed. After the output is generated, format the cell widths to fit all displayed
results by clicking and dragging to highlight the report columns. Then click on the
Format
toolbar menu, select the
Column option, and click on Autofit selection to insure that all
spreadsheet columns are formatted wide enough to display all output.
The result is shown below. The chart can be created by selecting
Line Fit Plots or by the Chart
tool (see instructions above). The series pattern can also be edited to display a different symbol
for the predicted values. In the chart below, the points representing the predicted y-values were
deleted, because they are unnecessary once the trend line is on the chart.

Page 45/47
Copyright
© 2006 by Stephen L. Morgan and Stanley N. Deming. All rights reserved
Page 46/47
Copyright
© 2006 by Stephen L. Morgan and Stanley N. Deming. All rights reserved
E. Frequently asked questions
Question: How can Microsoft Excel charts be inserted into Word without making file sizes
large?
Answer: If an Excel chart is selected and copied with the COPY function in the EDIT
menu, the chart can then be inserted into a Word document by the
EDIT, PASTE
function in Word. This operation puts a copy of the entire Excel document inside the
Word document. This can create problems if your Excel file is very large. For example: a
600 kB file pasted into Word in this way produces approximately a 1.2 MB Word file.
Just a few such figures make your file excessively large, frequently leading to long
waiting times for file transfers and problems with sending files by emails.
To insert an Excel chart into a Word document in a more memory efficient manner, follow these
steps:
1. Click anywhere on the chart in Excel.
2. Click on a region near the edge of the chart, slightly inside the outer border. Some
square black dots appear at the corners of the chart, indicating that the entire chart (as
opposed to just the chart area) has been selected.
3. Size the chart in Excel to the appropriate dimensions by dragging the handles (the
square dots). What you see in Excel is what you will get in Word.
4. While the picture is still selected, hold down the
Shift key and go to Edit, Copy
Picture
(“Copy” has changed to “Copy Picture”). A message box appears.
5. Select the upper box with every choice (screen, screen, picture).
6. Go to Word and select
Edit, Paste.
After these operations, the Word document with the inserted chart is only 29 KB, a much more
manageable size.
Perhaps the best way to import an Excel chart into Word is to transfer the chart to a graphics
editing program (e.g., PaintShop Pro) and save the file as a GIF image before inserting it into
Word. When you do this, make sure that the Word document is in
Normal View mode.
Question: How do I show more significant figures in the Excel fit equation?
Answer: When you fit a line and check the Show equation on chart box in the Options tab of
the
Add Trendline function, Excel sometimes shows only the first digit of your calculated
parameters. For example: “y = -2E-21x + 6E-20.” If these values are used in further calculations
(e.g., for predictions), large rounding errors may result.
Follow these steps to display more significant figures:
1. Right-click on the equation on the chart. This will cause a message box to appear.
2. Select
Format Data Labels.
3. Select the
Number tab and select Scientific in the “Category” list.
4. Increase the value in the
Decimal Places box to the desired number.
5. Click
OK.
Page 47/47
Copyright
© 2006 by Stephen L. Morgan and Stanley N. Deming. All rights reserved
Alternatively, the
Regression function in the Data Analysis Toolpak can be employed to
generate the parameter estimates and their standard errors, which can be used as a guide to
decide how many digits should be shown for each parameter.
