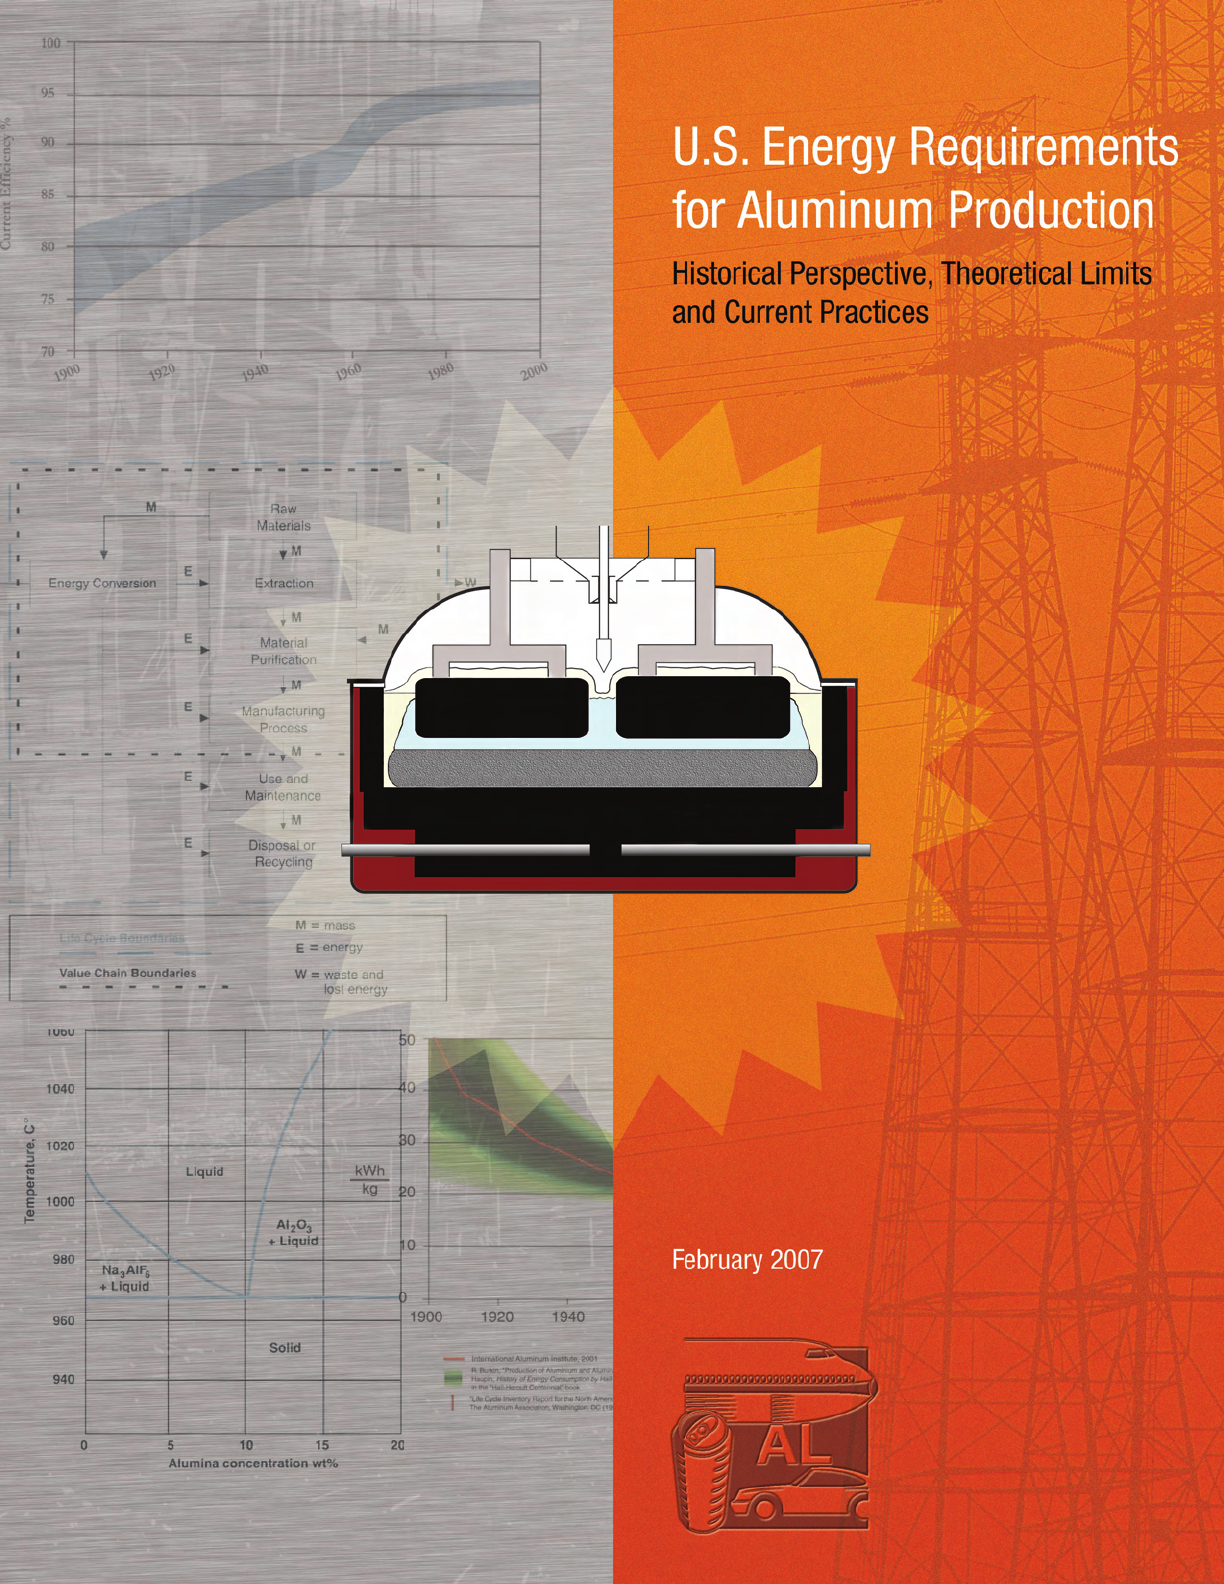

U.S. Energy Requirements for Aluminum Production
Historical Perspective, Theoretical Limits
and Current Practices
Prepared for
Industrial Technologies Program
Energy Efficiency and Renewable Energy
U.S. Department of Energy
February 2007

Preface
This report provides reliable and comprehensive statistical data over the period 1960 to 2003 for the
evaluation of energy trends and issues in the U.S. aluminum industry. It should be noted, however,
that these trends need careful interpretation as they incorporate unusual circumstances of a single
year, i.e., 2001. During the summer of 2001, the extensive heat wave in the western United States
produced an increased demand for electricity. Simultaneously, the ability to generate hydroelectric
power was reduced due to historically low snow packs in the Columbia River basin and new
regulations mandating the spill of water to aid migrating salmon. The combination of high electricity
demand and limited water supply contributed to a significant increase in the market price of
electricity during this time. This price increase in the Pacific Northwest made it more economical for
aluminum smelters to stop metal production and sell back power from their low-cost, fixed-price
electric contracts to aid in minimizing the shortfall in energy supply. As a result, the majority of
aluminum smelting capacity in the Pacific Northwest, representing approximately 43 percent of all
U.S. primary aluminum capacity, shut down.
The dramatic and relatively quick shutdown of a substantial amount of the U.S. primary aluminum
capacity can make certain trend numbers appear misleading. Throughout this report, percentages are
given for 10-year trends in various sectors throughout the aluminum industry. For example, U.S.
primary aluminum production has a 10-year annual growth rate of -2.5%, decreasing from 3,695
thousand metric tons in 1993 to 2,704 thousand metric tons in 2003. These numbers would seem to
imply a steady decline throughout the specified time period, but this is not the case. In fact, the total
drop in primary production over this time period (991 thousand metric tons) is less than the 1,031
thousand metric ton drop from 2000 (3,668 thousand metric tons) to 2001 (2,637 metric tons).
1
This
one year drop coincides with the majority of the Pacific Northwest shutdown. Other primary
production numbers in this report have similar trends, and this drastic shutdown should be taken into
account when considering these numbers.
It is currently too early to accurately assess the long-term impact of these sudden shutdowns and
changing conditions on the aluminum industry. It remains to be seen whether the shutdowns will lead
to a permanent decline of primary metal production in the Pacific Northwest, or whether the industry
will emerge robustly with additional self-generated power capacity and energy efficiency
improvements. It was announced (October 8, 2004) that one of the shutdown smelters will be
restarted at half capacity (+110,000 metric tons/yr), but it is difficult to judge whether or not this will
be the common trend. Whatever the industry's future, it is clear that the local and global pressures to
increase overall energy efficiency will determine its vitality. The energy efficiency opportunities
discussed in this report are pertinent to the future of the aluminum industry.
Another recent trend to make note of is China's rapid growth in both primary and secondary
aluminum production. While the United States has been slipping in its rank, China has taken
worldwide lead in primary aluminum production, producing 5,450 thousand metric tons of primary

aluminum in 2003. Additionally, China has been buying up much of the excess aluminum scrap
supply. In 2003, the United States exported 568,721 metric tons of scrap and dross, with 43 percent
(244,374 metric tons) going to China.
1
These trends are manifested in the slight decline of secondary
aluminum production within the United States.
Authors’ Note
A complete accounting of the energy consumed in the production of any product should include the
energy required to produce the fuels and electricity that are used plus the “feedstock energy”
associated with any fuels that are used as materials (e.g., carbon used in anode production). This
document, in many places, reports energy as a set of two numbers, e.g., 1.0 (2.0
tf
) kWh. The first
value represents the energy consumed within a facility (on-site energy consumption), while the value
with "tf" superscript (tacit-feedstock energy) is a measure of energy that includes the energy used to
produce and transmit the energy consumed within a facility and raw material feedstock energy. This
adjustment is very significant in processes that consume electricity.
The U.S. average grid connection requires about 3.01 kWh (10,270 Btu) of fuel energy to deliver 1
kWh (3,412 Btu) of electrical energy (Table D.1, Appendix D). The average U.S. grid is supplied with
approximately 7 percent hydroelectric generation. The aluminum industry is located near low-cost
power sources and many of these are hydroelectric. Even today with the Pacific Northwest shut
down, the average primary aluminum plant connection is 39.4 percent hydroelectric generation. The
average primary aluminum plant grid connection requires 2.24 kWh (7,624 Btu) of fuel energy to
deliver 1 kWh (3,412 Btu) of electrical energy. It should be noted that values reported in this
document use the U.S. average grid connection values. The use of U.S. average grid values results in
a higher reported tacit energy consumption value than the actual tacit value required for primary
aluminum production. The advantage of reporting primary production energy consumption based on
the U.S. average grid is that it allows easier and same basis comparisons to other U.S. manufacturing
industries.

Contents
Executive Summary ................................................................................................... i
1. Introduction................................................................................................................1
1.1 Purpose of Report .....................................................................................................1
1.2 Energy and Environmental Overview.......................................................................2
2. Methodology, Metrics and Benchmarks ....................................................................4
2.1 Theoretical, Practical Minimum and Current Practice Benchmarks ........................ 4
2.2 Tacit, Process, Feedstock and “Secondary” Energies............................................... 5
2.3 Life Cycle Assessment.............................................................................................. 7
2.4 Energy Value Chain Analysis ................................................................................... 8
2.5 Transportation Energy............................................................................................... 8
2.6 Emissions .................................................................................................................. 9
3. Aluminum Production..............................................................................................10
3.1 U.S. Aluminum Supply.......................................................................................... 12
4. Primary Aluminum Raw Materials ..........................................................................14
4.1 Bauxite .................................................................................................................... 14
4.2 Alumina (Al
2
O
3
) ..................................................................................................... 16
4.3 Carbon Anode ......................................................................................................... 20
5. Primary Aluminum Production................................................................................24
5.1 Production, Capacity, and Growth ..........................................................................24
5.2 Historical Hall-Héroult Energy Utilization............................................................. 25
5.3 Theoretical Minimum Energy Requirement for Reduction .................................... 27
5.4 Hall-Héroult Reduction Process ............................................................................. 30
5.5 Environmental Considerations................................................................................38
5.6 Technological Change in the Next Decade ............................................................. 40
6. Advanced Hall-Héroult Cells...................................................................................43
6.1 Wetted Drained Cathode ........................................................................................ 43
6.2 Hall-Héroult Inert Anode........................................................................................47
6.3 Multipolar Cells ...................................................................................................... 52
7. Alternative Primary Aluminum Processes ...............................................................54
7.1 Carbothermic Technology.......................................................................................54
7.2 Kaolinite Reduction Technology ............................................................................58
8. Secondary Aluminum (Recycling)...........................................................................64
8.1 Secondary Aluminum Production...........................................................................65
8.2 Production, Capacity and Growth...........................................................................66
8.3 Recycling Processes................................................................................................67

9. Aluminum Processing ..............................................................................................71
9.1 Melting, Alloying, and Melt Treatment ..................................................................71
9.2 Ingot Casting........................................................................................................... 75
9.3 Rolling..................................................................................................................... 78
9.4 Extrusion................................................................................................................. 81
9.5 Shape Casting.......................................................................................................... 83
9.6 Thermal Treatments ................................................................................................86
Endnotes...................................................................................................................89
Glossary....................................................................................................................94
Appendix A: Summary of Production and Energy Data for the U.S. Aluminum Industry................98
Appendix B: Energy Intensity of Materials Produced in the United States.....................................100
Appendix C: Energy Values for Energy Sources and Materials .....................................................102
Appendix D: Hydroelectric Distribution and Electrical Energy Values .........................................104
Appendix E: Emission Data and Calculations ................................................................................107
Appendix F: U.S. Energy Use by Aluminum Processing Area ......................................................111
Appendix G: U.S. Primary, Secondary and Imported Aluminum Quantities, 1960-2003 ..............117
Appendix H: U.S. Bauxite and Alumina Quantities, 1960-2003 ....................................................119
Appendix I: Energy Requirements for Carbon Anodes .................................................................121
Appendix J: Theoretical Energy Data and Calculations ................................................................122
Appendix K: Alumnum Heat Capacity and Heat of Fusion Data ...................................................128
Appendix L: Impact of Secondary Metal Production on
Energy Requirements for U.S. Aluminum Production.................................................130
Appendix M:Impact of Using Different Technologies on
Energy Requirements for Producing Aluminum.........................................................131

List of Tables
Table A: U.S. Energy Requirements and Potential Savings ................................................................. iii
Table 4.1: Energy Associated with Carbon Anode Manufacturing........................................................ 22
Table 5.1: Typical Parameters of Aluminum Reduction Cells 1948 vs. 1999
28
................................... 26
Table 5.2: Ore-to-Metal Comparison of Near and Mid-Term Technology Improvements ................... 42
Table 6.1: Energy Consumption Associated with Various Wetted Cathode Arrangements .................. 46
Table 6.2: Energy Impact of Inert Anode Technology........................................................................... 50
Table 7.1: Comparison of Hall-Héroult and Carbothermic Reduction .................................................. 57
Table 7.2: Carbon Dioxide Equivalent Comparison of Hall-Héroult and Carbothermic Reduction ..... 58
Table 7.3: Comparison of Hall-Héroult and Kaolinite Reduction ........................................................ 62
Table 9.1: Primary Ingot Casting Distribution of Energy Consumption ............................................... 77
Table 9.2: Secondary Ingot Casting Distribution of Energy Consumption ........................................... 77
Table 9.3: Cold Rolling Distribution of Energy Consumption ............................................................. 79
Table 9.4: Hot Rolling Distribution of Energy Consumption ............................................................... 79
Table 9.5: Extrusion Distribution of Energy Consumption ................................................................... 82
Table 9.6: Shape Casting Distribution of Energy Consumption ........................................................... 85
Table A.1: Theoretical, Process, and Gross Energy Requirements......................................................... 98
Table A.2: United States Total Energy Requirements and Potential Savings......................................... 99
Table B.1: Energy Requirements to Produce Materials in the United States (2002)............................ 100
Table B.2: Gross Energy Requirements to Produce Materials in the United States (2002) ................. 101
Table C.1: Energy Values for Energy Sources and Materials ............................................................... 102
Table C.2: kWh/yr of Fuels Consumed Worldwide for U.S. Aluminum Processing
Excluding Electricity and Coke Feedstock Energy ............................................................ 103
Table C.3: Impact of Electric Tacit Conversion Factors on kWh/yr
Consumed Worldwide for U.S. Aluminum Production...................................................... 103
Table D.1: Electric Tacit Energy and Emission Data for Fuels Used for Aluminum Producion ......... 104
Table D.2: Energy Sources of Electrical Power in 2002 (electrical power used in gigawatt hours) .... 105
Table D.3: Sources of Supply of Electrical Power in 2002 (electrical power used in gigawatt hours) 105
Table D.4: Average U.S. Grid Connection Tacit Energy ...................................................................... 106
Table E.1: Carbon Dioxide Equivalent Emission Coefficients for Fuels
Associated with Aluminum Production.............................................................................. 107

Table E.2: Carbon Dioxide Equivalent (CDE) Emissions Associated
with Primary Aluminum Production.................................................................................... 108
Table E.3: Carbon Dioxide Equivalent (CDE) Emissions Associated with Aluminum Production .... 109
Table E.4: Carbon Dioxide Equivalent Emissions Associated
with New Aluminum Production Technologies................................................................... 110
Table F.1: Materials and Energy Associated with Primary Metal Electrolysis.....................................111
Table F.2: Materials and Energy Associated with Aluminum Manufacturing Operations ...................112
Table F.3: Theoretical Minimum Energy Requirements to Produce
Raw Materials and Aluminum Products..............................................................................113
Table F.4: U.S. Energy Use in the Production of Domestic Aluminum ...............................................113
Table F.5: Total U.S. Aluminum Industry Energy Consumption and Potential Savings ......................114
Table F.6: Energy Impact of Recycling.................................................................................................114
Table F.7: U.S. Electric On-site Energy Consumption in the Aluminum Industry...............................115
Table F.8: Smelting and Heating Fractions of Total U.S. Aluminum Industry Energy Consumed ......115
Table F.9: Total Worldwide Production and Energy Consumption
Associated with Producing Aluminum in the United States.................................................116
Table F.10: Percent Break-Up of Different Types of Energy Used
in Aluminum Production Operations....................................................................................116
Table G.1: U.S. Supply of Aluminum from 1960 to 2003 ....................................................................117
Table H.1: U.S. Supply of Bauxite and Alumina from 1960 to 2003 ...................................................119
Table I.1: Energy Associated with Aluminum Industry Carbon Anode Manufacturing..................... 121
Table I.2: Onsite and Tacit Energy Associated with Carbon Anode Production ................................ 121
Table J.1: Theoretical Minimum Energy for Hall Héroult Carbon Anode System ............................. 123
Table J.2: Theoretical Minimum Energy for Hall Héroult Inert Anode System ................................. 123
Table J.3: Theoretical Minimum Energy for Carbothermic Reduction............................................... 124
Table J.4: Theoretical Minimum Energy for Reduction of Aluminum Chloride ................................ 124
Table J.5: Theoretical Minimum Energy for Kaolinite / Aluminum Chloride Reduction................... 125
Table J.6: Thermochemistry Data for Elements and Compounds
Associated witb Aluminum Production................................................................................126
Table J.7: Changes in Heat of Formation Values as a Function of Temperature................................. 126
Table J.8: Theoretical Minimum Energy for Gibbsite Dehydration.................................................... 127
Table J.9: Heat of Capacity Equations for Gases Associated with Aluminum Production................. 127
Table K.1: Aluminum Energy Requirements for Heating and Melting................................................ 129

Table L.1: Impact of Secondary Metal Production on the Nominal
Energy Requirements to Produce Aluminum......................................................................130
Table M.1: Impact of Wetted Cathode Technology on Primary Metal Electrolysis............................. 131
Table M.2: Impact of Inert Anode and Wetted Cathode Technology on Primary Metal Electrolysis. 132
Table M.3: Estimate of Energy Requirement for Manufacturing an Inert Anode................................. 133
Table M.4: Estimate of Energy Requirement to Manufacture
Aluminum Using Different Technologies.............................................................................134

List of Figures
Figure A: Aluminum Industry Flow Diagram ........................................................................... i
Figure 2.1: Boundaries for Life Cycle and Value Chain Assessments ........................................ 8
Figure 3.1: Energy
tf
Consumption of U.S. Aluminum Operations ............................................ 11
Figure 3.2: U.S. Aluminum Supply from 1960 to 2003 ............................................................. 12
Figure 4.1: U.S. Bauxite Supply 1960 to 2003 ........................................................................... 15
Figure 4.2: U.S. Alumina Supply 1960 to 2003 ......................................................................... 17
Figure 5.1: U.S. Production of Primary Aluminum from 1960 to 2003 ..................................... 24
Figure 5.2: Primary Aluminum Electric Energy Consumption 1900 to 2000 ............................ 25
Figure 5.3: Primary Aluminum Current Efficiency 1900 to 2000 ............................................. 26
Figure 5.4: Alumina to Aluminum Theoretical Minimum Energy ............................................ 27
Figure 5.5: Alumina and Carbon to Aluminum Theoretical Minimum Energy ......................... 29
Figure 5.6: A Typical Hall-Héroult Cell ..................................................................................... 30
Figure 5.7: Voltage Distribution in a Hall-Héroult Cell ............................................................. 32
Figure 5.8: Cryolite-Alumina Phase Diagram ............................................................................ 37
Figure 6.1: Conceptual Wetted Cathode Cells ............................................................................ 44
Figure 6.2: Theoretical Energy Schematic for Inert Anode ....................................................... 48
Figure 6.3: Inert Anode .............................................................................................................. 51
Figure 6.4: Multipolar Cells ....................................................................................................... 52
Figure 7.1: Carbothermic Reactor .............................................................................................. 55
Figure 7.2: Carbothermic Theoretical Minimum Energy ........................................................... 56
Figure 7.3: Clay to Aluminum Process Schematic ..................................................................... 59
Figure 8.1: U.S. Aluminum Market and Growth ........................................................................ 65
Figure 8.2: U.S. Production of Secondary Aluminum 1960 to 2003 ......................................... 67
Figure 9.1: Typical Rolling Mill Processing Operations ............................................................ 78
Figure 9.2: Typical Aluminum Extrusion Processing Operations .............................................. 81
Figure 9.3: Typical Aluminum Product Shape Casting Operations ........................................... 84

Executive Summary
The United States aluminum industry is the world’s largest, processing 9.6 million metric tons of
metal and producing about $40 billion in products and exports in 2003. It operates more than 400
plants in 41 states and employs more than 145,000 people. Aluminum impacts every community and
person in the country, through either its use and recycling or the economic benefits of manufacturing
facilities.
Energy reduction in the U.S. aluminum industry is the result of technical progress and the growth of
recycling. These two factors have contributed 22 percent and 39 percent respectively to the total 61
percent energy reduction over the past forty years. By many measures, aluminum remains one of the
most energy-intensive materials to produce. Only paper, gasoline, steel, and ethylene manufacturing
consume more total energy in the United States than aluminum. Aluminum production is the largest
consumer of energy on a per-weight basis and is the largest electric energy consumer of all
manufactured products. The U.S. aluminum industry directly consumes 45.7 x 10
9
kilowatt hours
(0.16 quad) of electricity annually or 1.2 percent of all the electricity consumed by the residential,
commercial, and industrial sectors of the U.S. economy. This is equivalent to the electricity consumed
by 5,222,000 U.S. households annually.
The aluminum industry has large opportunities to further reduce its energy intensity. The annual sum
of all the energy required in the production of aluminum metal and products in the United States is
equivalent to 183 x 10
9
kilowatt hours (0.62 quad). The difference between the gross annual energy
required and the theoretical minimum requirement amounts to over 149 x 10
9
kilowatt hours (0.51
quad). This difference is a measure of the theoretical potential opportunity for reducing energy
consumption in the industry, although achievable cost-effective savings are smaller.
U.S. Energy Requirements for Aluminum Production, Historical Perspective, Theoretical Limits and
New Opportunities provides energy performance benchmarks for evaluating new process
developments, tracking progress toward performance targets, and facilitating comparisons of energy
use. The report provides a basic description of the processes and equipment involved, their
interrelationship, and their effects on the energy consumed and environmental impact of
manufacturing aluminum and aluminum products. This knowledge can help identify and understand
process areas where significant energy reductions and environmental impact improvements can be
made.
This report examines and carefully distinguishes between the actual “onsite” energy consumption
values and gross or “tacit” energy values. The “tacit” or gross energy value accounts for the
generation and transmission energy losses associated with electricity production, the “feedstock”
energy of fuels used as materials, and the “process energy” used to produce fuels. Onsite energy
improvements provide concomitant gross energy savings.
ii

Executive Summary
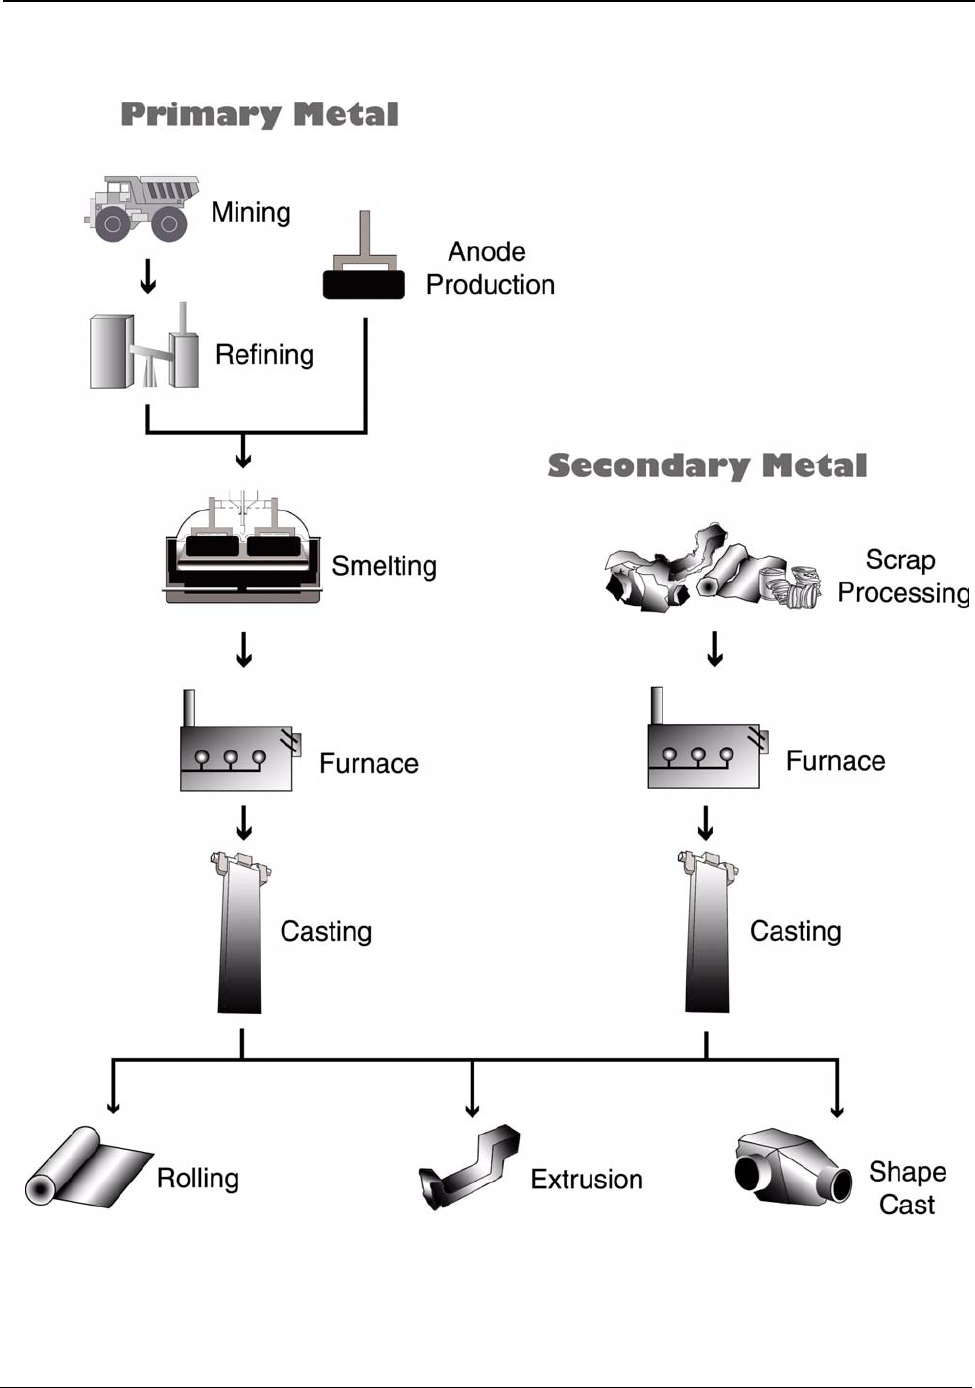
Primary aluminum is produced globally by mining bauxite ore, refining the ore to alumina, and
combining the alumina and carbon in an electrolytic cell to produce aluminum metal. Secondary
aluminum is produced globally from recycled aluminum scrap. Primary and secondary aluminum
metal are cast into large ingots, billets, T-bar, slab or strip and then rolled, extruded, shape-cast, or
otherwise formed into the components and useful products we use daily. Figure A (page i) shows the
major processing operations required to produce aluminum and aluminum products. This report
examines these processes and the energy they require.
Identifying Energy Reduction Opportunities
Energy performance benchmarks, current practice, and theoretical minimums provide the basis for
evaluating energy reduction opportunities. These benchmarks and gross energy consumed during
aluminum production in the United States are summarized in Table A.
Table A: U.S. Energy Requirements and Potential Savings
U.S.
Theoretical U.S. Potential
Total U.S. Potential
Annual
Minimum Process Process U.S.
Gross Gross U.S.
Production
Energy Energy Energy
Energy
tf
Energy
tf
2003
Requirement Required Savings
Required Savings
metric tons
kWh (10
9
) / yr
(quad)
kWh (10
9
) / yr
(quad)
kWh (10
9
) / yr
(quad)
kWh (10
9
) / yr
(quad)
kWh (10
9
) / yr
(quad)
Bauxite Mining
Alumina Refining 2,661,500 0.37 (0.001) 10.02 (0.034) 9.65 (0.033) 10.89 (0.037) 10.52 (0.036)
Anode Production 1,230,000 12.12 (0.041) 15.75 (0.054) 3.63 (0.012) 16.45 (0.056) 4.33 (0.015)
Al Smelting 2,758,000 16.52 (0.056) 42.97 (0.147) 26.46 (0.090) 128.36 (0.438) 111.84 (0.382)
Primary Casting 2,704,000 0.90 (0.003) 2.73 (0.009) 1.83 (0.006) 3.94 (0.013) 3.04 (0.010)
Secondary Casting 2,820,000 0.94 (0.003) 7.05 (0.024) 6.11 (0.021) 7.93 (0.027) 6.99 (0.024)
Rolling 4,842,600 1.55 (0.005) 3.04 (0.010) 1.49 (0.005) 6.08 (0.021) 4.53 (0.015)
Extrusion 1,826,000 0.80 (0.003) 2.37 (0.008) 1.57 (0.005) 2.77 (0.009) 1.97 (0.007)
Shape Casting 2,413,000 0.80 (0.003) 6.17 (0.021) 5.36 (0.018) 6.37 (0.022) 5.56 (0.019)
Total 34.00 (0.116) 90.10 (0.307) 56.10 (0.191) 182.77 (0.624) 148.78 (0.508)
Industrial processes that consume energy at significantly higher rates than their theoretical
requirements are, on the surface, obvious targets for potential improvement. However, energy
performance is only one factor in identifying the best opportunities for improving energy efficiency.
Other factors, particularly market dynamics, process economics and forecasting of future demand are
very significant in identifying real opportunities. This report examines the energy performance of the
operations involved in manufacturing aluminum products.
iii

Executive Summary
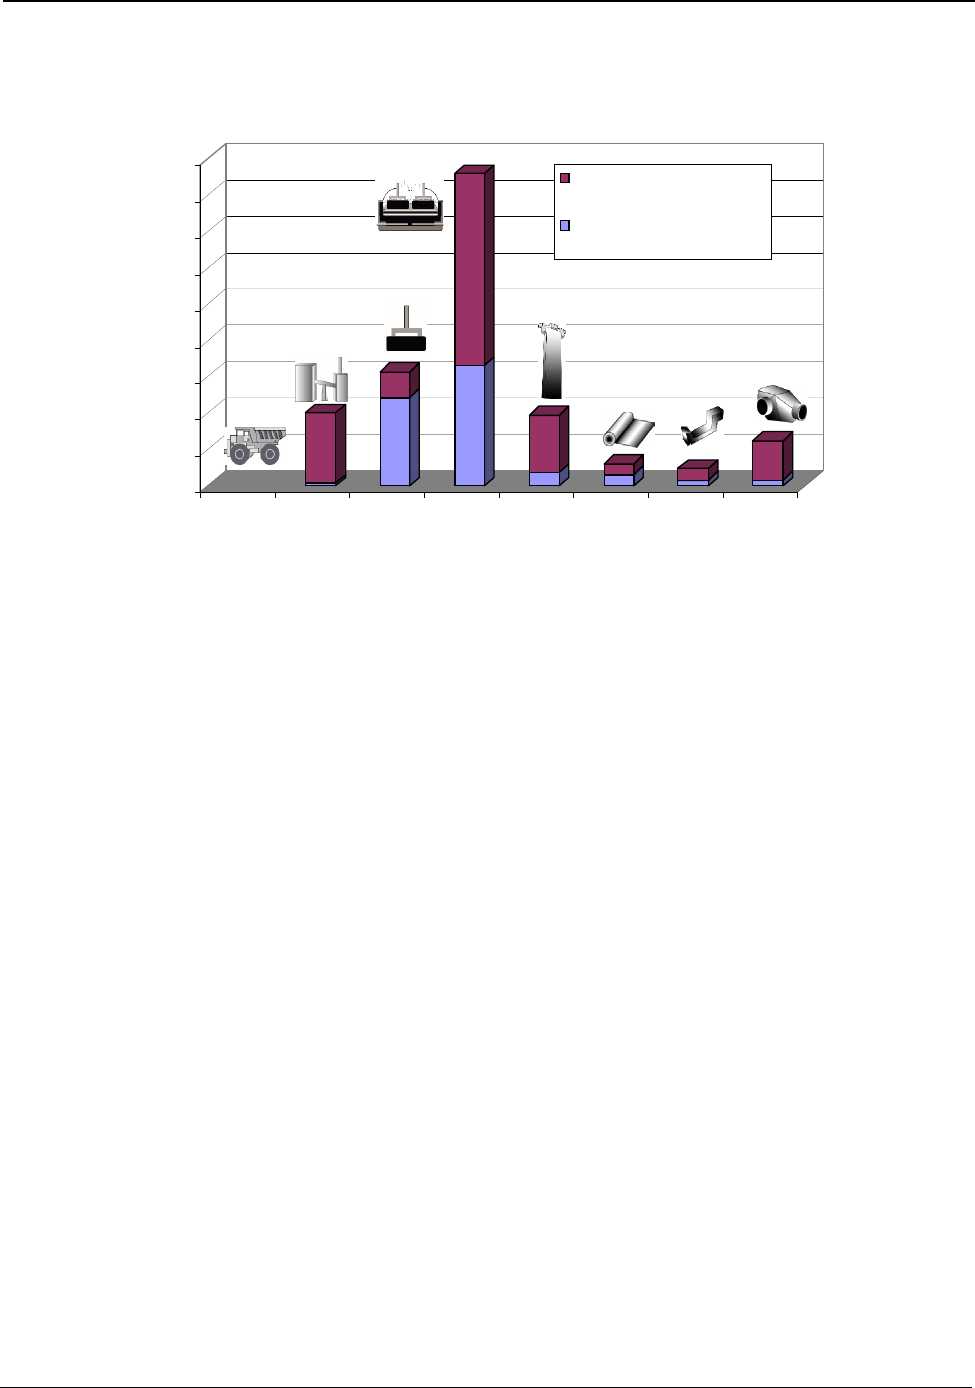
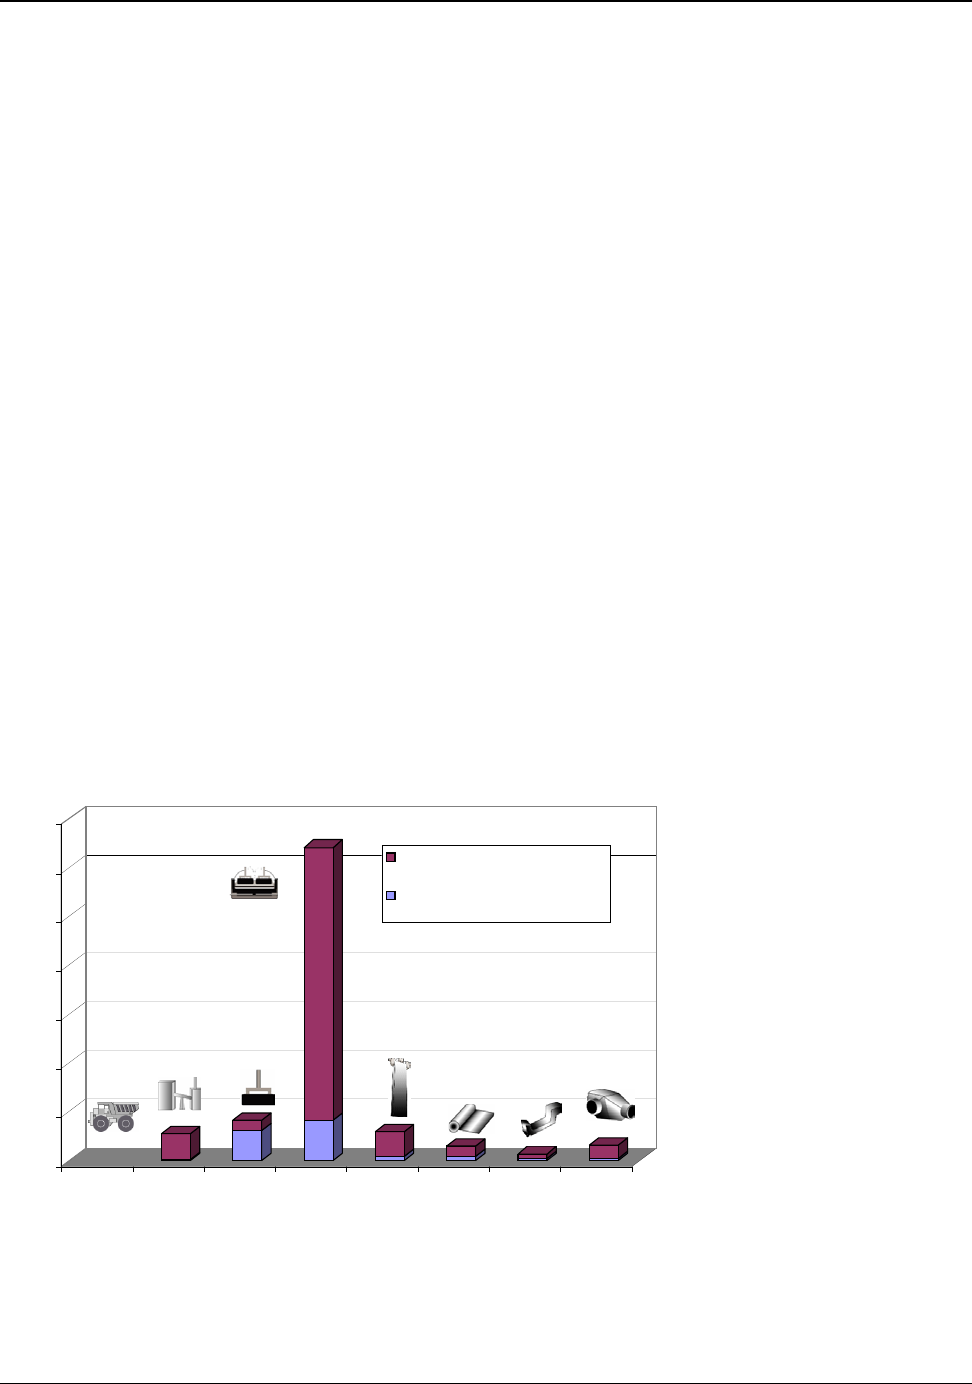
The amounts of energy used onsite in the major processing operations of the U.S. aluminum industry
are shown in Figure B (page v). The bottom band on each bar shows the theoretical energy
requirement, while the top band of each bar shows the energy used above the theoretical minimum.
The size of the top band is an indication of how large the opportunity is for energy reduction in that
process step.
Smelting requires 46 percent of the total energy consumed in U.S. manufacturing of aluminum. This
process is the largest consumer of energy and the most technically complex operation. Smelting
requires more than twice its theoretical minimum energy and has the potential for the greatest energy
reduction of all operations. Electricity is required for smelting and accounts for over 98 percent of the
energy used in the process. Current research and development (R&D) efforts to advance existing
technology and to develop alternatives to the existing smelting process have the potential to lower
smelting energy consumption by more than 30 percent.
Process heating accounts for 27 percent of the total energy consumed in U.S. manufacturing of
aluminum. Process heating is required for holding, melting, purifying, alloying, and heat treating. It is
utilized in nearly all aluminum production operations. Heating is the second largest energy
consuming operation.
Recycled aluminum now accounts for over half of all U.S. produced aluminum. It requires less than 6
percent of the energy to produce aluminum from mined bauxite and provides significant
environmental benefits. R&D efforts that improve the ability to recycle aluminum offer some of the
greatest opportunities for energy reduction in the industry, since recycling displaces aluminum
produced by smelting.
The magnitude of the top bands of the energy bars in Figure B shows that large opportunities exist for
lowering energy consumption in the industry. The Aluminum Industry Vision, Sustainable Solutions
for a Dynamic World published by the Aluminum Association in 2001 recognizes these opportunities
and sets industry goals for achieving further energy reduction. In Hall-Héroult smelting technology,
the most energy-intensive process, the industry has set a target for reducing electrical energy usage
from 15.4 kWh/kg to 11 kWh/kg of aluminum produced by the year 2020, a 27 percent reduction
from 2000 practices. The 2003 U.S. average of 15.0 kWh/kg shows a slight improvement from 2000,
likely due to the ongoing upgrades of larger, older primary production plants.
iv
0
5
10
15
20
25
30
35
40
45
kWh(10
9
)/yr
Bauxite
Mining
Al u m i n a
Refining
Anode
Production
Aluminum
Smelting
Casting Rolling Extrusion Shape
Casting
energy used above theoretical
minimum
theoretical minimum energy
required
Executive Summary
Figure B: Process Energy Used in U.S. Manufacturing of Aluminum Products
0
5
10
15
20
25
30
35
40
45
kWh(10
9
)/yr
energy used above theoretical
minimum
theoretical minimum energy
required
Bauxite Al u m i n a Anode Aluminum Casting Rolling Extrusion Shape
Mining Refining Production Smelting Casting
Evaluation of the many opportunities that exist for reducing energy consumption in the industry can
only be made by comparing processes using consistent system boundaries and measures. This report
provides data and information necessary for the reader to understand opportunities for energy savings
in the aluminum industry.
v

1. Introduction
Aluminum is an essential material for modern manufacturing. It is a lightweight, high-strength,
corrosion-resistant metal with high electrical and thermal conductivity, and it is easy to recycle. The
U.S. aluminum industry is the largest in the world in terms of consumption. The U.S. aluminum
industry utilized 9,592,000 metric tons of metal in 2003 to produce an enormous variety of products.
U.S. per capita consumption was 29.5 kilograms. The industry operated more than 400 plants in 41
states and employed over 145,000 people to make aluminum products.
1
These products are shipped to
thousands of businesses in the United States from which they are distributed or are incorporated into
other products. Aluminum, per unit mass, is the most energy-intensive material produced in large
quantities in the United States. Only paper, gasoline, steel and ethylene manufacturing consume more
total energy for manufacturing in the United States than aluminum (Appendix B).
Research and development (R&D) efforts to reduce energy consumption are important, since energy
consumption correlates to manufacturing economics, environmental impact and United States
dependence on imported energy sources. Identifying process areas where opportunities for energy use
reduction exist and applying resources to capture these opportunities will benefit the industry and the
nation.
Aluminum manufacturing is energy intensive and roughly one-third of the cost to produce aluminum
from ore is associated with the use of energy and environmental compliance. The aluminum industry,
in the past forty years, reduced its overall energy intensity by nearly 61 percent (Appendix L).
However, even with the large reduction in energy intensity, the industry consumes nearly three times
the theoretical minimum energy required. Significant opportunities for further energy improvements
still remain.
1.1 Purpose of Report
The energy consumption and environmental effects associated with product manufacturing and use
are important measures of the product’s impact on society. Energy consumption and environmental
impact measures are becoming key decision tools for consumers and corporations when choosing a
product. In the near future, manufactured products will compete not only on price and performance,
but also on their impact on society.
The purpose of this report, U.S. Energy Requirements for Aluminum Production, Historical
Perspective, Theoretical Limits and New Opportunities, is:
• to provide an understanding of the processes involved, the energy consumed and the
environmental impact of manufacturing aluminum and aluminum products;
• to provide a common set of terms, benchmarks and values for comparing processes and issues
related to the aluminum industry;
1

Introduction
• to identify process areas in which significant energy reductions and environmental impact
improvements could be made;
• to strengthen public and work force awareness, education and training (identified as an industry
goal in Aluminum Industry Vision
2
).
This report focuses on the most energy-intensive manufacturing operations for aluminum, electrolysis
(smelting) and process heating operations. These two operations account for over 69 percent of the
energy used by the industry (Appendix F, Table F.8). There is a large difference between the
theoretical minimum energy requirements and current practice energy values in electrolysis and
melting. The magnitude of the energy consumed and the difference between current practice and
theoretical energy levels means improvement in electrolysis and process heating will have the largest
impact on the performance of the industry. This report documents existing operations and explores
potential new technology opportunities.
The science and technologies associated with the production of aluminum and aluminum products are
complex. This report attempts to provide the reader with a basic understanding of the science,
technology and energy usage of the aluminum industry. More detailed books
3, 4
are available for the
reader who requires further in-depth study of the subject.
1.2 Energy and Environmental Overview
Technologies, practices and product use determine the energy consumption and environmental impact
of aluminum. Many of the current technologies and practices used to produce aluminum metal and
aluminum products are mature. New technologies and practices are being proposed and studied to
improve aluminum manufacturing from an energy and environmental standpoint. The history and
explanation of current state-of-the-art technologies and practices are presented so the reader can
appreciate the values and benefits that new technologies or practices might bring to the aluminum
industry. Current U.S. production levels, historical production levels and projected growth rates of
aluminum are presented. These production values are needed to measure the magnitude of the impact
of a change in technology or practice. The energy and environmental impacts from the use of
aluminum products are generally low and in some applications may be significantly better than the
impacts of alternative materials. As significant as these impacts on the use of aluminum products are,
they are beyond the scope of this report.
The greatest impact on the future energy intensity of aluminum has been the structural change in the
industry itself. More than 51 percent of the aluminum produced by U.S. industry in 2003 came from
recycled material. In 1960, recycled material was used to generate less than 18 percent of U.S.
produced aluminum (Appendix G). Recovering aluminum from wastes and scraps requires less than 6
percent of the energy of aluminum production from bauxite mining (Appendix F, Table F.6). This
report examines how “urban mining” (recycling) will continue to change the structure of the
2

Introduction
aluminum industry and continue to lower the overall energy associated with aluminum production.
Recycling is the largest contributor to the reduction of the energy intensity of U.S. produced
aluminum.
Aluminum is an “energy bank” in that nearly all of the original energy stored in the metal can be
recovered again and again every time the product is recycled. Small fractions of the recycled metal
are lost to oxidation (melt loss) and entrapment in purifying fluxes (dross) during the recycling
process. Aluminum can be recycled indefinitely, allowing this saved energy to be collected again and
again.
Greenhouse gas (GHG) emission reduction is a key environmental and sustainability issue for the
twenty-first century. Energy-intensive manufactured materials (such as aluminum) could be
significantly affected both in terms of price and use by GHG emission-reduction policies. However,
contrary to common belief, aluminum production could be positively affected by GHG emission
reduction policies. A combination of emission mitigation in production and significant GHG
emission reduction further down the product chain enhance the attractiveness of aluminum for end-
use applications.
Additional energy and environmental savings can be achieved in the aluminum product chain through
the introduction of new alloys and improved (light weight) product design. These options will not be
considered in this study, but their potential is at least of the same order of magnitude as changes to
production practices and processes.
3

2. Methodology, Metrics and Benchmarks
There are a variety of metrics, measurements, benchmarks, boundaries, systems and units that are
used differently by various analytical groups. These variations can cause confusion when comparing
values stated in one report to those in another. Two commonly confused values are the relationship
between onsite and tacit energy values, and between U.S. energy requirements and worldwide energy
requirements. Onsite energy values are based on physical measurements. Tacit energy values have
assumptions associated with them. These assumptions can create large differences in the reported
values. The onsite and tacit values used in this report are explained in Section 2.2. The United States
does not mine ore for aluminum production, but refines roughly half of the ore required domestically.
This report focuses on energy consumption within the United States. The total energy associated with
production of metal from ore is an important value and is reported as the “worldwide” energy
requirement in this report.
2.1 Theoretical, Practical Minimum and Current Practice Benchmarks
When examining industrial processes, two metric values for energy requirement are obtainable with
little debate: the process theoretical minimum value and the current practice value. The theoretical
minimum energy requirement for chemically transforming a material is based on the net chemical
reaction used to manufacture the product. In the case of aluminum made from alumina
(2Al
2
O
3
4Al + 3O
2
)
, the theoretical minimum energy is 9.03 kWh/kg of aluminum
produced (Appendix J). This minimum value is simplistic and represents the thermodynamically ideal
energy consumption. It requires any reaction to proceed infinitely slowly. The theoretical minimum
energy to transform a material from one shape to another shape is based on the mechanical properties
of the material. It is also an idealized value. Neither chemical nor mechanical theoretical minimums
can be realized in practice; however, these provide the benchmarks that no process can surpass
(Analogy: The theoretical minimum score for a full round of golf is 18).
The current practice value is the average of the actual measurements of existing processes and
practices (Analogy: The current practice value for golf is the average score of every player, which is
well above par). The boundaries drawn around the process or practice, the number of samples,
sampling techniques, etc., determine the precision and accuracy of this value. The difference between
the theoretical minimum and current practice metric is a valuable measure of the opportunities for
energy efficiency improvement in that process or practice.
Practical minimum energy is a term in common usage. However, its definition varies. In some
instances, it is used to describe the process energy value that represents the combination of integrated
unit operations using best available technology and best energy management practices. In other
instances, practical minimum energy is defined as the optimal design value projected with the
adoption of new, advanced technology. Practical minimum energy values are, in reality, a moving
4

Methodology, Metrics and Benchmarks
target since it is not possible to predict the new technologies, practices and materials that will impact
an industrial process. What is known about the practical minimum energy value is that it lies
somewhere between the current best available value and the theoretical minimum value. (Analogy:
The practical minimum score for golf is some value below par and over 18.)
The “Aluminum Industry Vision”
5
has selected a goal of 11 kWh/kg of aluminum as its smelting
current practice value for the year 2020. This represents a 27 percent reduction over 1995’s value of
15.4 kWh/kg of aluminum. The industry envisions this as an obtainable and practical minimum
smelting energy goal for 2020.
2.2 Tacit, Process, Feedstock and “Secondary” Energies
Current practice process measurements are actual measurements taken within a facility on existing
operations. These onsite process measurements are valuable because they are the benchmarks that
industry uses to compare performance between facilities and companies. More importantly, these
onsite process measurements are used to assess the value of new processes and practices. These are
the critical values used in the decision-making process to adopt new technologies and practices.
Onsite process measurements, however, do not account for the complete energy and environmental
impact of manufacturing a product. A full accounting of the impact of manufacturing must also
include the energy used to produce the electricity, the fuels and the raw materials used within a
manufacturing facility. These “secondary energy” requirements for electric power generation and
transmission, for the energy needed to produce fuels, and for the energy values of feedstock materials
are very important from a regional, national, and global energy perspective, but they are seldom
analyzed or accounted for within an individual plant site.
The process energy or “secondary energy” associated with the fuels used in aluminum processing is
presented in Appendix C, Table C.1. The process energy adds approximately 3 percent to the energy
values of the fuels used (Appendix C, Table C.2). Feedstock energy represents the energy inherent in
fuels that are taken into a manufacturing process, but used as materials rather than fuels. Aluminum
production uses coke as a raw material in the production of carbon anodes. Coke’s feedstock energy is
significant and is equivalent to a 30 percent increase in the onsite energy consumption of the Hall-
Héroult process (Appendix F, Table F.1). The energy contribution of feedstocks is expressed in terms
of calorific or fuel value plus the “secondary energy” used to produce the feedstock. (Note: fuel and
feedstock tacit energy values used in this report are the calorific fuel value plus the fuel processing
energy, Appendix C, Table C.1).
Tacit energy is a term frequently used to describe the combined total of onsite energy and the
“secondary energy” requirements. Tacit electrical energy and environmental impact measurements
account for the fact that substantial electrical generation inefficiencies and transmission losses occur
outside the facility. It can take as much as four units of hydrocarbon or coal calorific energy to
5

Methodology, Metrics and Benchmarks
produce one unit of electric energy. Saving 1 kilowatt-hour of onsite electricity is equivalent to saving
nearly 4 kilowatt-hour of the energy contained in the petroleum or coal-based fuels used to generate
electrical power.
Tacit electric conversion factors are variable since they are dependent on the sources of the energy
used to produce electricity. Each manufacturing facility has a different tacit conversion factor
depending on its location. Typical U.S. grid electricity requires about 10,270 Btu of energy to deliver
1 kWh of onsite electricity (3,412 Btu) for use. Electricity production from coal requires 10,388 Btu
to deliver 1 kWh of onsite electricity (3,412 Btu). Water has no fuel value and typically hydroelectric
facilities are assumed to have a tacit energy requirement of 3,412 Btu to deliver 1 kWh of onsite
electricity (3,412 Btu) and near zero greenhouse gas emissions (Appendix D). The onsite and tacit
electric energy requirements for a facility operating on hydroelectric power are equal.
Comparing energy values for the various steps used in the production of aluminum products is
simpler when a common unit is used for all processing steps. Since electricity is the single largest
source of energy consumed in the manufacture of aluminum, the common units of a kilowatt-hour
(kWh) are used in this report. Process energy values for production steps that consume fuels are
converted to kWh using the conversion factor of 3,412 Btu/kWh.
The large variations in tacit electric energy conversion values, 10,388 Btu per onsite kWh for coal
compared to 3,412 Btu per onsite kWh for hydroelectric, have a dramatic influence on the reported
tacit energy profile of an industry. Aluminum smelting energy is 98 percent electric energy. A modern
smelter operating from a hydroelectric utility requires onsite energy of 14.4 kWh/kg of aluminum
produced and tacit energy of 14.4 kWh/kg of aluminum, whereas an identical smelter operating from
a coal-fired utility requires onsite energy of 14.4 kWh/kg of aluminum and tacit energy of 36.0 kWh/
kg of aluminum (Appendix C, Table C.3). The U.S. primary aluminum industry has approximately 40
percent of its capacity connected to hydroelectric facilities.
All values reported in this document use the U.S. average grid connection values (i.e., 10,270 Btu/
kWh). The use of U.S. average grid values results in a higher energy consumption value than the
actual tacit value required for primary aluminum production. The advantage of reporting primary pro-
duction energy consumption based on the U.S. average grid is that it allows easier and same bases
comparisons to other U.S. manufacturing industries. This report, for clarity, distinguishes between the
onsite operating energy values and the secondary energy values that include tacit/feedstock
contributions with the use of a superscript, tf. Any value that includes tacit and/or feedstock
components is denoted with the superscript “tf”, e.g., 1.0
tf
kWh.
6

Methodology, Metrics and Benchmarks
2.3 Life Cycle Assessment
Life Cycle Assessment (LCA) is recognized as the most complete analysis model of a product’s
impact on energy, environmental, economic and social values. LCA of an industrial product extends
from “cradle-to-grave”, i.e., from material acquisition and production, through manufacturing,
product use and maintenance, and finally, through the end of the product’s life in disposal or
recycling. LCA recognizes the importance of considering energy, economic and environmental
factors not only during the production of a product, but also over the product’s complete life cycle,
including use and disposal. The LCA is particularly useful in ensuring that the benefits derived in one
area do not shift the impact burden to other places within a product’s life cycle.
The LCA “use and maintenance” factor for aluminum varies by end-product and in many applications
is more significant in terms of energy and environmental impact than production. Aluminum, in some
cases, provides LCA “use and maintenance” energy savings that are significantly greater than the
energy used in its production. For example, production of an equal strength, but lighter aluminum
product in the transportation sector saves significant amounts of transportation fuel and provides
substantial reductions in greenhouse gases during the product’s “use” phase when compared to
traditional materials. In 2001, an estimated 2.2 billion gallons of gasoline use and 20 million metric
tons of CO
2
emissions were reduced due to the use of lightweight aluminum castings in automobiles.
6
Complete LCA for aluminum products must account for the significant portion of aluminum that, in
the acquisition phase, comes from “urban mining” (recycling). Aluminum’s ability to be easily
recycled is reflected in the fact that over half of the U.S. produced aluminum now originates from
recycled material. Recycling is the best option for disposal of nearly every product made from
aluminum. This makes aluminum a “cradle-to-cradle” LCA product.
7
Methodology, Metrics and Benchmarks
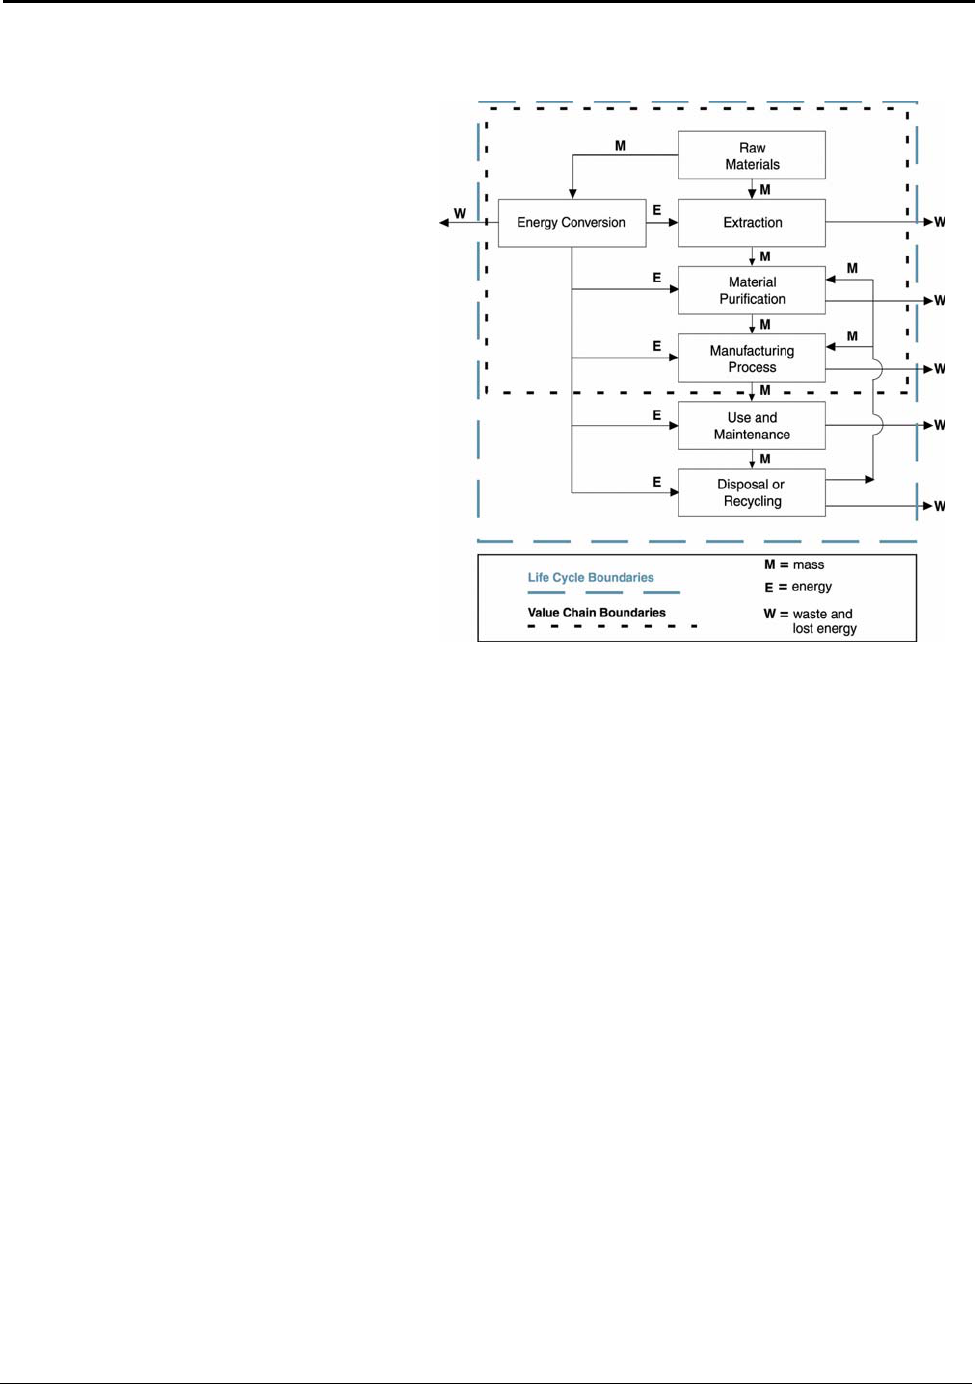
2.4 Energy Value Chain
Analysis
The energy values studied and presented
are based on an energy “value chain”
analysis. The value chain analysis or
“cradle-to-shipping dock” analysis
provided is an integral part of an LCA. It
provides valuable information and data
values for organizations performing LCA
on aluminum products. Value chain
analyses are similar to LCA; however, they
cover only a portion of a total LCA. Figure
2.1 shows the global boundaries of an LCA
study and the boundaries for this study’s
value chain.
Figure 2.1: Boundaries for Life Cycle and Valu
e
Chain Assessments
Value chain analysis allows for the capture of the direct energy and feedstock inputs of each
processing step (link) and builds a cumulative value of each product along the chain. This report
looks at a portion of the LCA, the energy value chain from “cradle-to-shipping dock.” It does not
account for the LCA “use and maintenance” phase energy or for “tertiary” energy inputs (i.e., the
energy used to make the equipment or buildings that house the process steps). The “cradle-to-
shipping dock” approach is valuable for providing decision-making analyses within the
manufacturing sphere.
2.5 Transportation Energy
The transportation energy associated with acquiring raw materials and distribution of intermediate
products is important for a full LCA. Transportation energy can account for a significant portion of
the total energy associated with manufacturing a final product. The energy required to transport
mined bauxite to refining operations, alumina to smelting operations, ingots to metal processors, and
scrap from collection to melting is not accounted for in the process energy requirements that are
developed in this report. This report focuses on the energy associated with the processing of raw
materials and the processes employed in aluminum production. The transportation energy associated
with these raw materials and processes is small in relation to the total energy consumed in production.
8

Methodology, Metrics and Benchmarks
Transportation energy calculations for raw materials that are mined globally are highly variable. They
are a function of the location and multiple modes of transportation, e.g., conveyors, trucks, trains,
ocean freight. Transportation energy requirements were evaluated in the Life Cycle Inventory Report
for the North American Aluminum Industry. Transportation of raw materials accounted for 2 percent
of the total energy associated with primary aluminum production in the United States.
7
Evaluation of the transportation energy requirements associated with secondary aluminum production
is complicated. Consumer scrap can require considerable transportation energy resulting from
individual consumer drop-off, curbside collection, transfer station collection and the actual
transportation to a secondary processor. Transportation energy, associated with industrial
manufacturing scrap and scrap originating at large automotive and white good scrap processing
centers, is more easily estimated since its boundaries are easier to define. The Life Cycle Inventory
Report for the North American Aluminum Industry estimates transportation energy from these sources
to account for 6 to 8 percent of the total energy associated with the production of secondary aluminum
products.
2.6 Emissions
Energy use and greenhouse gas emissions are closely related. This report provides overall carbon
emission data associated with fuels used for aluminum operations. Other fuel-related emissions (e.g.,
nitrous oxides, sulfur dioxide, volatile organic compounds) are not considered because their
quantities are typically small as compared to the carbon-based emissions. Emissions that are
aluminum process-related (e.g., perfluorocarbons, from cryolite) are reported. Energy and
Environmental Profile of the U.S. Aluminum Industry
7,8
provides detailed emission data for aluminum
operations.
Emission calculations for this report are shown in Appendix E. Greenhouse gases contribute to
climate change by increasing the ability of the atmosphere to trap heat. Gases differ in their ability to
trap heat. To express the greenhouse effect of different gases in a comparable way, atmospheric
scientists use a weighting factor, global warming potential (GWP). The heat-trapping ability of one
metric ton of CO
2
is the standard, and emissions are expressed in terms of a million metric tons of
CO
2
equivalent or 10
6
TCDE. This report uses carbon dioxide equivalents (CDE). Emissions are also
commonly expressed in terms of a million metric tons of carbon equivalent (10
6
TCE). Carbon
comprises 12/44 of the mass of CO
2
; to convert from CO
2
equivalent to C equivalent multiply the
CO
2
equivalent by 0.273.
9

3. Aluminum Production
Aluminum metal is classified as primary aluminum if it is produced from ore and as secondary
aluminum if it is produced predominantly from recycled scrap material. Primary aluminum metal
production consists of bauxite mining, refining bauxite to produce alumina, and finally, smelting
alumina to produce aluminum. Secondary aluminum is produced by sorting, melting and treating
scrap aluminum. Primary and secondary aluminum metal are further processed using traditional metal
working technologies-rolling, extrusion, forging, shaping and casting into thousands of products.
Aluminum is the most abundant metallic element in the Earth’s crust. However, it is never found in
natural deposits as a free metal, like copper and gold. Aluminum is typically found as one of several
aluminum oxides or silicates mixed with other minerals and must be processed to be recovered in its
pure form. All commercial primary aluminum is produced from one raw material, bauxite and by one
process, electrolytic reduction. For economic and strategic reasons, the aluminum industry continues
to perform research and development on alternative raw materials (e.g., kaolin clay) and processes
(e.g., chemical reduction). Although these alternatives hold promise for reducing costs, energy
consumption, and environmental impacts, none are near commercialization.
The markets for aluminum industry’s raw materials and products are global. Global primary
aluminum production has been growing at a rate of 3.6 percent annually over the last ten years.
9
The
U.S. aluminum total supply grew at an annual rate of 0.6 percent over the period of 1993 to 2003
(Appendix G). Aluminum is still in the growth phase of the product cycle. Demand for aluminum is
increasing, mainly due to aluminum substitution for other materials in the transportation sector and
other lightweight applications. Its light weight, corrosion resistance and processing possibilities
coupled with its ease and value for recycling strengthen its position as the material of choice in many
applications. Measured in either mass produced or economic value, aluminum’s use exceeds that of
any other metal except iron. It is important in virtually all segments of worldwide manufacturing.
The global estimate for economically recoverable bauxite reserves is 22,000,000,000 metric tons.
This quantity can address the demands for the next century. Two countries have nearly half of the
world’s identified bauxite resources (Guinea has 25 percent and Australia has 20 percent). Bauxite is
no longer mined in the United States as a commercial feedstock for aluminum production. Domestic
ore, which accounts for less than 1 percent of the U.S. requirement for bauxite, is used in the
production of non-metallurgical products such as abrasives, chemicals, flame retardants, and
refractories.
10
Alumina is produced by refining bauxite in a wet caustic chemical leaching process (Bayer Process).
Imported bauxite is refined in the United States, the largest importer of bauxite and the second largest
bauxite refiner after Australia. Alumina production is continuing to rise in Australia, Brazil, Jamaica,
10
Aluminum Production
Surinam, Venezuela and India, all countries with large indigenous bauxite reserves. The trend in
alumina production is towards placing refining capacity near the mineral resources, thereby reducing
transportation energy and costs, and adding more value to exports.
Primary aluminum (aluminum from ore) is globally produced by the Hall-Hèroult process, a method
that involves electrolysis or smelting of alumina. Companies choose their smelting locations where
production conditions are favorable, like the availability of skilled labor, proximity to a consumer
market, and provision for a highly-developed infrastructure and, especially, for low cost and reliable
energy. Hydroelectric power accounts for 50 percent of the energy used worldwide for electrolysis of
aluminum (Appendix D, Table D.2). The bulk of energy use in aluminum production is related to the
electricity required for primary electrolysis. Since energy costs are approximately one third of the
total cost of smelting primary aluminum, smelter production has been moving from sites close to
consumer markets to sites with low electricity costs. Most of the primary aluminum industry
restructuring began in the late 1970s and continues to this day. China and Russia have emerged as
major metal producers; other countries entering the world market include Canada, Australia, Brazil,
Norway and countries in the Persian Gulf area, all areas with low energy costs.
Secondary aluminum is produced from scrap or recycled aluminum. The world’s average share of
secondary aluminum production is roughly one quarter of total aluminum production. The United
States produces over half of its aluminum from recycled aluminum scrap (Appendix G). Aluminum
recycling is concentrated in the countries where the scrap is generated with the exception of Asia,
which imports significant amounts of aluminum scrap (driven by the demand for cast aluminum in
the Asian car industry).
Kwh(10
9
)/yr
140
120
100
80
60
40
20
0
tacit energy used above theoretical
minimum
theoretical minimum energy
Bauxite Alumina Anode Smelting Casting Rolling Extrusion Shape
Mining Refining Production Casting
Figure 3.1: Energy
tf
Consumption of U.S. Aluminum Operations
Primary and secondary
aluminum are used to
manufacture numerous
products ranging from aircraft
components to household and
packaging foils. Each product
requires processing like
heating, melting, alloying and
mechanical working. Figure
3.1 shows the tacit energy
consumption of the major
processes in the aluminum
production chain. Production
of primary aluminum accounts
for 87.6
tf
percent of the energy
11
Aluminum Production
consumed by the U.S. industry; production of secondary aluminum for 4.3
tf
percent ; rolling for 3.3
tf
percent; extrusion for 1.5
tf
percent; and shape casting for the remaining 3.4
tf
percent (Appendix F,
Table F.4).
Two operations, electrolysis and the heating/melting of aluminum, account for over 73(82
tf
) percent
of energy consumed in aluminum processing (Appendix F, Table F.8). Heating and melting
technologies are used for holding, alloying, and treating metal as well as for recycling. Programs that
improve thermal efficiency of heating and melting while minimizing the formation of aluminum
oxide and/or dross, provide a much larger impact on decreasing industry energy usage than their
energy consumption indicates.
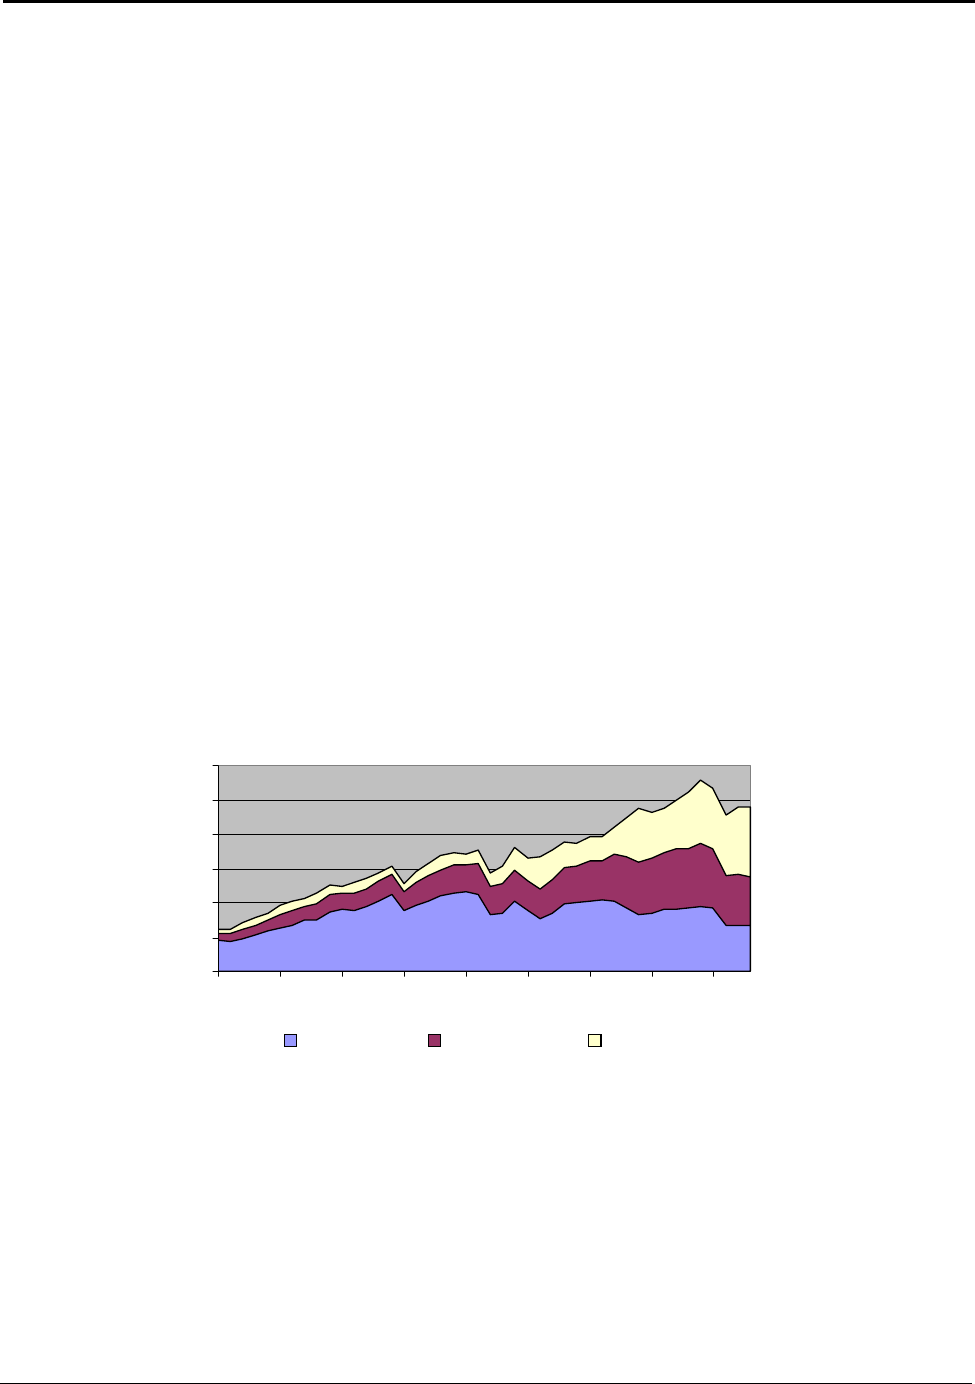
3.1 U.S. Aluminum Supply
The U.S. aluminum supply of 9,592,000 metric tons in 2003 originated from three basic sources:
primary aluminum (domestically produced), secondary aluminum (recycled domestic material), and
aluminum imports. This consisted of 2,704,000 metric tons of primary aluminum, 2,820,000 metric
tons of secondary aluminum and 4,068,000 metric tons of imported aluminum.
11
From 1993 to 2003,
the annual U.S. growths of these supplies were −2.5 percent, −0.4 percent and 5.1 percent
respectively. Since 1993, the total U.S. supply has risen at an annual rate of about 0.6 percent. Figure
3.2 shows the distribution of these supplies over the past 43 years (Appendix G).
Figure 3.2:U.S. Aluminum Supply from 1960 to 2003
12
10
8
6
4
2
0
Primary Secondary Imports
Source: Appendix G
The United States is the fourth leading producer of primary aluminum metal in the world. However,
its dominance in the global industry has declined. The U.S. share of world production in 1960
accounted for slightly more than 40 percent of the primary aluminum produced. By 2003, the U.S.
share of world production had decreased to 9.8 percent. U.S. primary production peaked in 1980, and
over the past twenty-three years has been gradually declining. Significant year-to-year variations
occur as a result of U.S. electrical costs and global market changes.
Million Metric Tons
1960 1965 1970 1975 1980 1985 1990 1995 2000
12

Aluminum Production
Secondary (recycled) aluminum is of growing importance to the U.S. supply. In 1960, only 401,000
metric tons of aluminum were recovered. In 2003, 2,820,000 metric tons of aluminum were
recovered. For the years 1993 through 2003, the secondary production of aluminum has dropped at an
annual rate of −0.4 percent (Appendix G). Recently, the U.S. secondary aluminum growth rate has
been slowing due to a combination of factors. Scrap collection programs are beginning to reach their
maturation stage, and the market growth of scrap sources has slowed. Additionally, the U.S. has now
become a net exporter of scrap and dross. In 1993, the U.S. had net imports of scrap and dross of
98,540 metric tons, while in 2003, the U.S. had net scrap and dross exports of 152,000 metric tons.
The main cause for this change is again China’s radical increase in demand for scrap. In 2003,
244,000 metric tons of the 567,700 metric tons of scrap and dross exported by the U.S. (43%) went to
China.
12
These trends of decreasing U.S. secondary aluminum production are, however, expected to
change. Use of aluminum in the automotive industry grew at over 5 percent annually between 1993
and 2003. This large and growing supply is now beginning to enter the scrap markets and will spur
new growth in secondary aluminum.
Imported aluminum is the fastest growing source of U.S. supply with an annual rate of 5.1 percent
over the 1993 to 2003 time frame (Appendix G). New primary aluminum facilities are being located
outside the United States, near new sources of low-cost electricity.
13

4. Primary Aluminum Raw Materials
The total energy associated with producing the raw materials required for aluminum
production from bauxite ore was approximately 8.25(14.23
tf
) kWh/kg of aluminum in 2003.
This accounts for 28 percent of the total energy required to produce primary aluminum metal
and consists of:
• 0.32( 0.34
tf
) kWh per kg aluminum for bauxite mining
• 7.27( 7.87
tf
) kWh per kg aluminum for bauxite refining to alumina, and
• 0.66( 6.02
tf
) kWh per kg aluminum for carbon anode production.
A complete account of the energy requirements and environmental impacts to produce any product
must include the energy requirements and environmental impact associated with the production of the
raw materials used. The raw material energy requirements and environmental impacts associated with
primary aluminum production can be divided into the major operations required to produce it. These
are bauxite mining, bauxite refining and carbon anode manufacturing. Roughly 5,900 kg of earth are
mined to produce 5,100 kg of bauxite, which is refined into 1,930 kg of alumina. The 1,930 kg of
alumina are electrolytically processed with 446 kg of carbon to produce one metric ton (1,000 kg) of
aluminum (Appendix F, Table F.1).
Cryolite and other fluoride salts are used as the electrolytic bath for aluminum production. These
materials are theoretically not consumed in the process or combined as part of the final product.
However, approximately 19 kg of bath material is lost for every metric ton of aluminum produced
(Appendix F, Table F.1). These losses are a result of process upsets and bath drag-out when molten
aluminum is removed from the smelting operation. Since these salts represent only a small portion of
the energy requirement for producing the raw materials required for aluminum production, they are
not addressed in this report.
4.1 Bauxite
Aluminum, never found as a free metal, occurs naturally in the form of hydrated aluminum oxides or
silicates. Since the silicates are mixed with other metals such as sodium, potassium, iron, calcium,
and magnesium and it is chemically difficult and expensive to extract aluminum from them, the
silicates are not a practical source of alumnium. The oxides are, therefore, used for producing
aluminum. The aluminum oxides commonly found as naturally occurring minerals include
• corundum (alumina, Al
2
O
3
)
• böehmite (α-Al
2
O
3
•H
2
O, a monohydrate containing 85 weight percent alumina)
• diaspore (β-Al
2
O
3
•H
2
O
, chemically same as böehmite but with a different crystal structure)
14
1960
1965
1970
1975
1980
1985
1990
1995
2000
Primary Aluminum Raw Materials
• gibbsite (γ-Al
2
O
3
•3H
2
O, a trihydrate containing 65.4 weight percent alumina)
Alumina, used for the production of aluminum, is obtained from bauxite deposits. Bauxite is not a
true mineral but a rock that contains mostly böehmite and gibbsite along with diaspore, corundum and
numerous impurities (mostly compounds of iron, silicon and titanium). Bauxite commonly appears as
a collection of small, reddish-brown nodules in a light-brown, earthy matrix. The alumina available in
commercial bauxite ranges from 30 to 60 weight percent. Bauxite is typically classified according to
its intended commercial application: abrasive, cement, chemical, metallurgical, refractory, and other
end uses. The bulk of world bauxite production (approximately 85 percent) is metallurgical and used
as feedstock for the manufacture of aluminum.
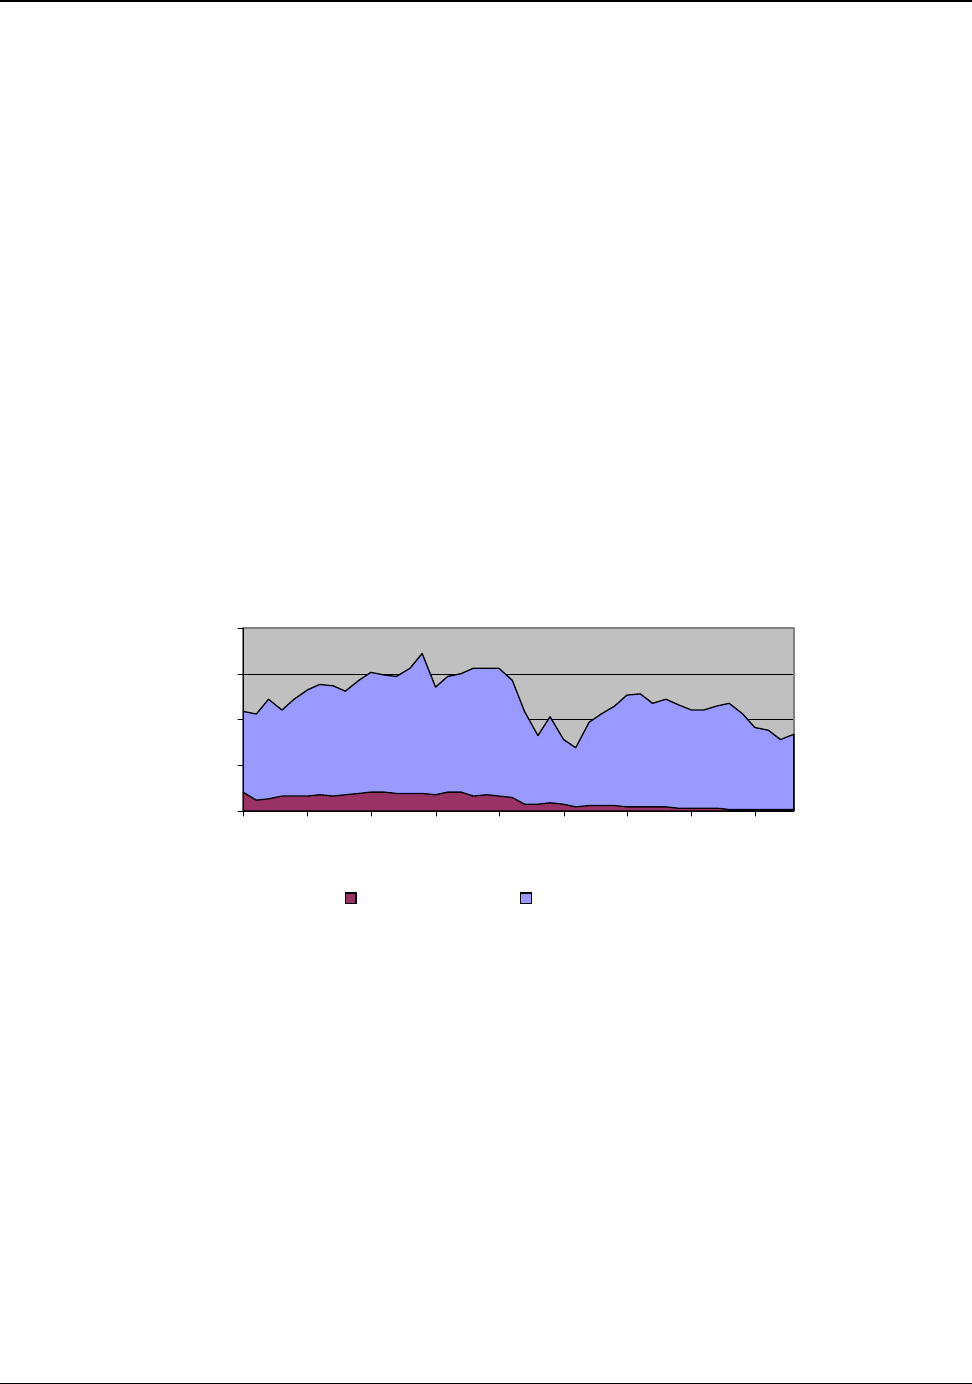
The United States mines less than 1 percent of the bauxite it uses annually, virtually all of which is
used in the production of non-metallurgical products, such as abrasives, chemicals, and refractories.
10
Nearly all bauxite consumed in the United States is imported. Figure 4.1 tracks the the domestic and
imported components of U.S. bauxite supply from 1960 to 2003 (Appendix H).
Figure 4.1: U.S. Bauxite Supply 1960 to 2003
0
5
10
15
20
Million Mteric Tons
U.S. Mined Bauxite Imports of Bauxite
Source: Appendix H
In 2003, the United States imported a total of 8,300,000 metric tons of bauxite. About 95 percent of
the imported bauxite is refined to produce alumina and approximately 90 percent of the refined
alumina is used to produce primary aluminum. Approximately 7,097,000 metric tons of the imported
bauxite were refined for the primary production of aluminum.
15

Primary Aluminum Raw Materials
4.1.1 Bauxite Energy Requirements (Onsite and Theoretical)
Approximately 0.32(0.34
tf
) kWh of process energy were required in 2003 to produce the 5.1
kilograms of bauxite needed to produce 1.0 kilogram of aluminum. Approximately 16.7
kilograms of carbon dioxide equivalent (CDE) were released for each metric ton of bauxite
mined.
The energy demand associated with the extraction of bauxite is typical of most mining operations.
Bauxite ore is generally strip-mined by removing the overburden (the soil on top of the deposit) and
excavating it with mechanical equipment. The overburden is saved for reclamation operations which
are extensively practiced to ecologically restore mined areas. The soft earthy nature of many bauxite
deposits generally does not require drilling or blasting operations. After mining, the bauxite is
crushed, sometimes washed and dried, and transported to refining plants via ship, barge, rail, truck or
conveyor belt.
Approximately 5.1 kilograms of bauxite are required to produce a kilogram of aluminum. The energy
requirement per kilogram of mined bauxite is 0.06 kWh for typical extraction.
13
Since electricity
accounts for less than 1 percent of the energy used in bauxite production, the tacit addition is
negligible (Appendix F, Table F.1).
Calculation of a theoretical minimum energy requirement for mining bauxite is dependent on the
system boundaries applied and the processes used. The laws of thermodynamics state that separating
the constituents of a mixture, such as bauxite from bauxite-rich soil, requires a certain minimum
expenditure of energy. Bauxite is the major constituent of bauxite-rich soils, and there is no change in
the chemical nature of bauxite in the mining process. So the theoretical minimum energy for
preparing bauxite is negligible. In addition, since it is theoretically possible to find bauxite on the
surface, the theoretical minimum energy requirement to produce bauxite is very close to zero. In the
interest of simplicity, this report uses a zero theoretical minimum energy requirement for mining
bauxite.
Emissions from fuels used in the extraction of bauxite are listed in Appendix E, Table E.2. These
emissions are typically from surface mining operations and result from a variety of fuels used in the
production of bauxite. Nearly 0.0167 kg CDE are emitted for each kilogram of bauxite mined.
4.2 Alumina (Al
2
O
3
)
Theoretically, from the stoichiometric equation (
2Al
2
O
3
+ 3C 4 Al + 3CO
2
), 1.89 kilograms
of alumina is required to produce 1 kilogram of aluminum. In practice, a very small portion of the
alumina supply is lost and the industry requires approximately 1.93 kilograms of alumina for
16
1960
1965
1970
1975
1980
1985
1990
1995
2000
Primary Aluminum Raw Materials
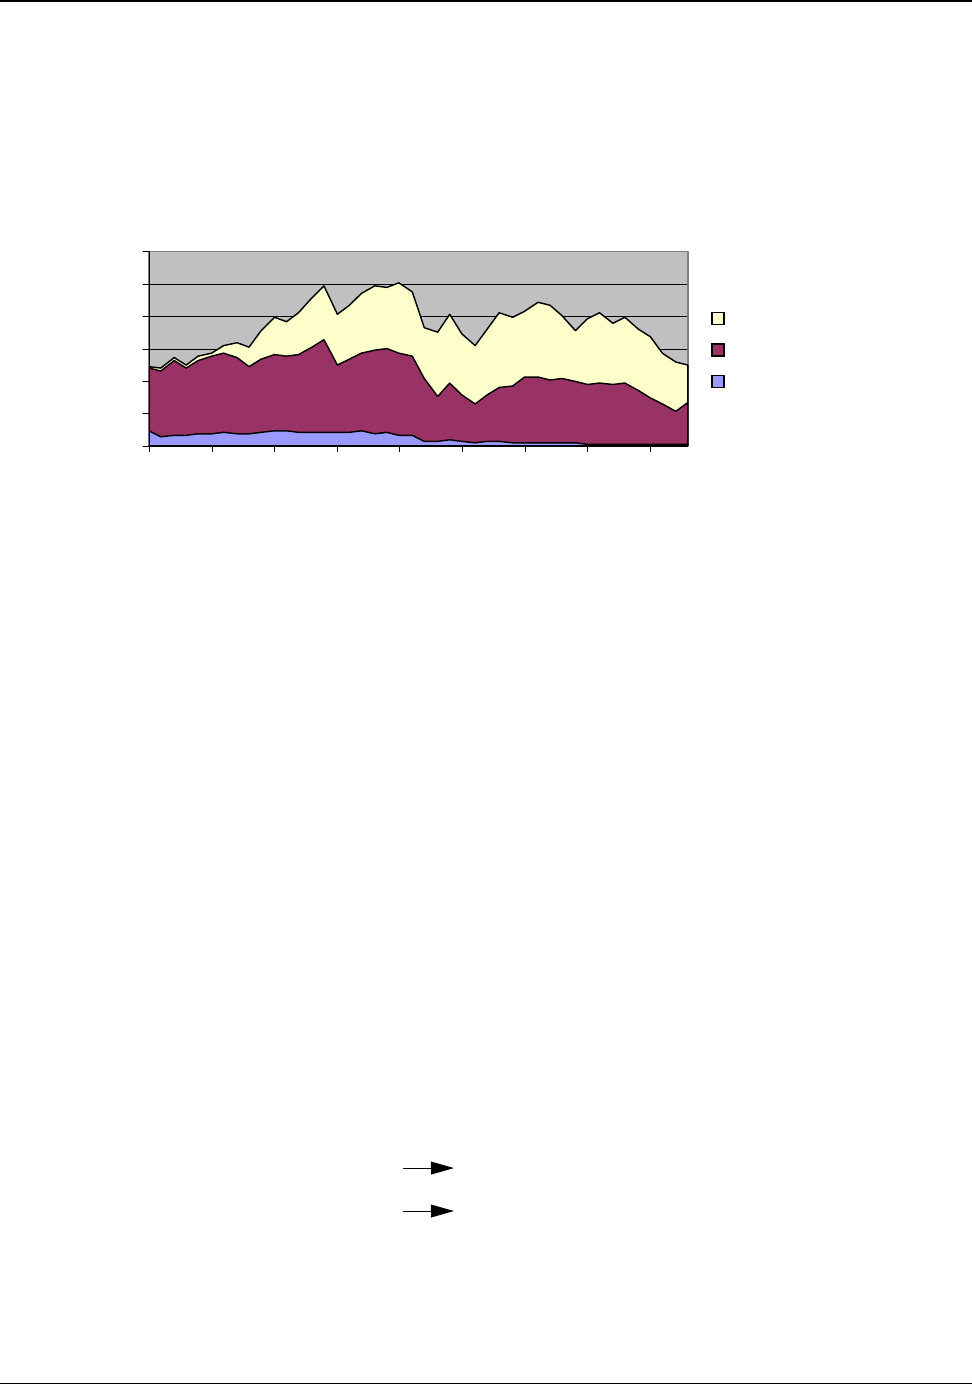
production of each kilogram of aluminum. In 2003, the United States produced 3,488,400 metric tons
of alumina from bauxite and imported an additional 2,300,000 metric tons of alumina to make
aluminum.
Figure 4.2:U.S. Alumina Supply 1960 to 2003
0
2
4
6
8
10
12
Million Metric Tons
Alumina Imports
From Imported Bauxite
From Domestic Bauxite
Source: Appendix H
Figure 4.2 shows the alumina supply sources from 1960 to 2003. The United States had three Bayer
refineries in operation in 2003, and one temporarily idled at midyear. These refiners processed about
7,752,000 metric tons of bauxite into 3,488,400 metric tons of alumina. About 10 percent of the
alumina produced is used to manufacture abrasive, refractory and other products. Approximately
3,139,560 metric tons of U.S. refined alumina were transferred to the primary aluminum industry.
This quantity of alumina was not sufficient to supply the U.S. demand for alumina; therefore, an
additional 1,300,000 (net) metric tons of alumina were imported (Appendix H)
All commercial alumina is refined from bauxite using the Bayer refining process. The process,
developed by Karl Bayer in 1888, consists of four major steps. Bauxite composition varies and
refining plant designs are slightly different to account for the site-specific quality of the bauxite.
1) Digestion – Crushed, ground, and sized bauxite is dissolved under pressure with a hot (180°C to
250°C) sodium hydroxide and sodium carbonate solution in a series of steam-heated digesters. The
concentrations, temperatures, and pressures employed vary depending on the properties of the
bauxite. Gibbsite is soluble in caustic soda above 100°C, while böehmite and diaspore are soluble in
caustic soda above 200°C. Since the treatments of böehmite and diaspore require higher temperatures
and longer digestion times, they are more expensive than treatment of gibbsite. The aluminum oxides
in the bauxite react to form soluble sodium aluminate or “green liquor.”
Al
2
O
3
•
H
2
O + 2NaOH 2NaAlO
2
+ 2H
2
O
and
Al
2
O
3
•
3H
2
O + 2NaOH 2NaAlO
2
+ 4H
2
O
17

Primary Aluminum Raw Materials
Silicas in the bauxite are detrimental to the digestion efficiency. They react to form sodium aluminum
silicate, which precipitates. This precipitate chemically binds the aluminum from the bauxite and the
sodium from the sodium hydroxide into a solid from which the alumina cannot be economically
recovered. This decreases the yield of alumina and increases the costs associated with sodium
hydroxide. Chemical additions and the adjustment of refining practices can effectively provide
desilication and decalcification of specific alumina streams.
2) Clarification – The green liquor produced by digestion is clarified to remove sand, undissolved
iron oxides, titanium oxides, silica and other impurities. The insoluble materials, called “bauxite
residue” or “red mud,” are thickened, washed, and dewatered to recover sodium hydroxide. Bauxite
residue is a large-quantity waste product that is generally stored adjacent to refinery sites in landfills
or lagoons. After weathering, the landfills can sustain vegetation.
3) Precipitation – The clarified liquid that results from clarification is cooled and “seeded” with
crystals of gibbsite to aid precipitation of alumina trihydrate (Al
2
O
3
•3H
2
O). This is the reverse of the
digesting step (2NaAlO
2
+ 4H
2
O Al
2
O
3
•3H
2
O + 2NaOH). However, by carefully controlling
the seeding, temperature and cooling rate, specific physical properties can be given to the
precipitating alumina trihydrate.
4) Calcination – Alumina trihydrate is typically calcined in a fluid bed or rotary kiln at about 980°C
to 1,300°C to remove the water of crystallization and produce the dry white powder, alumina
(Al
2
O
3
•3H
2
O Al
2
O
3
+ 3H
2
O). Calcining rates and temperatures are carefully controlled and
vary depending on the final physical properties specified for the alumina.
Alumina used for electrolysis not only has a chemical purity specification, but also a physical
specification on particle size, surface area, bulk density and attrition behavior. These properties affect
alumina’s free flowing properties (how it flows in feeders), the rate at which it dissolves in cryolite,
dust levels, the strength of the alumina crust, its insulating properties and other properties important
in the aluminum electrolysis cell operation. Alumina’s bulk density is 880 to 1,100 kg/m
3
while its
specific gravity is 3.9 grams/cm
3
.
Bauxite residue (red mud) is a byproduct of the Bayer process and contains the insoluble impurities of
bauxite. The amount of residue generated per kilogram of alumina produced varies greatly depending
on the type of bauxite used, from 0.3 kilograms for high-grade bauxite to 2.5 kilograms for low-grade
bauxite. Its chemical and physical properties depend primarily on the bauxite used and, to a lesser
extent, the manner in which it is processed.
Although a great deal of effort has been expended over several decades to find and develop uses for
bauxite residue, a cost-effective, large-scale bulk application has yet to be found.
14
Numerous
attempts have been made to recover additional metals from the residue, such as iron, titanium, and
gallium. Other possible uses for the residue have included production of ceramic bricks or tiles, use as
18

Primary Aluminum Raw Materials
roadbed material or as filler material for plastics, or production of cement. Accordingly, the current
industry efforts focus on minimizing the amount of residue generated and improving its storage
conditions.
Probably the most promising and recent application for the residue has occurred in Western Australia,
where it is being evaluated as a soil amendment or conditioner. The soils in Western Australia are
sandy and drain freely, allowing fertilizers to leach into waterways where they boost nutrient levels
and can lead to problems such as algal blooms. The application of bauxite residue to these sandy soils
aids the retention of phosphates and moisture, and reduces the need to apply lime for soil pH
adjustments. As part of the Bauxite Roadmap project on bauxite residue, a model farm has been
planned to run for 5-7 years with the application of red mud, and all its aspects and results will be
studied in great detail.
4.2.1 Alumina Energy Requirements
Approximately 7.27(7.87
tf
) kWh of energy were required and 1.62 kg CDE were released to
refine the 1.93 kg of alumina from bauxite needed to produce one kilogram of aluminum in
2003.
The energy required to produce alumina from bauxite in 1985 was estimated to range from 2 kWh/ kg
to 9 kWh/ kg of alumina.
15
This broad range of energy intensity reflects both bauxite quality (alumina
content) and refinery design. It was estimated that in 1991, U.S. refiners averaged 3.66 kWh/kg of
alumina produced.
16
The most recent available refining data lists 3.76 kWh/kg of alumina for 1995.
17
Calcination is the most energy-intensive operation of the Bayer process. On average, 1.93 kg of
alumina are consumed to make one kilogram of aluminum.
18
The alumina energy requirement for one
kilogram of aluminum can be estimated as 3.76 kWh/kg of alumina times 1.93 kg alumina, or 7.27
kWh/kg of aluminum, a tacit value of 7.87
tf
kWh/kg of aluminum.
The Alumina Technology Roadmap provides insight into the high-priority research and development
needs of the global alumina industry.
19
The Roadmap recognizes the need and the opportunity for a 25
percent energy reduction by 2020 and improved, more sustainable handling of bauxite residues.
Better chemical process knowledge, waste heat utilization, and cogeneration are opportunities for
energy reduction in the refining process.
Emissions from fuels used in the refining process are listed in Appendix E, Table E.2. These
emissions are predominately related to natural gas and coal consumption for digestion and
calcination. Nearly 1.62 kg CDE are emitted for each kilogram of refined alumina.
19

Primary Aluminum Raw Materials
4.2.2 Alumina Theoretical Minimum Energy Requirements
The theoretical minimum energy required to produce alumina is 0.13 kWh/kg of aluminum
produced.
The theoretical minimum energy requirements to produce metallurgical grade alumina from bauxite
can be calculated from the reactions required in the process. The minimum energy requirements for
the digestion, clarification, and precipitation steps are related to the two chemical reactions that take
place during these processing steps.
Al
2
O
3
•3H
2
O + 2NaOH 2NaAlO
2
+ 4H
2
O Al
2
O
3
•3H
2
O + 2NaOH
However, since there is no net chemical or temperature change for the combined reactions the
theoretical minimum energy requirement for these steps is near zero. The final reaction, calcination,
requires energy to remove the hydrated water from alumina (Al
2
O
3
•3H
2
O Al
2
O
3
+3H
2
O). The
theoretical minimum energy requirement to calcine (dehydrate) the alumina is 0.13 kWh/kg of
aluminum produced (Appendix J, Table J.10). This value assumes that the precipitated alumina
trihydrate is completely bone dry before entering the calcining process. At 8 percent moisture, this
would add about 0.01 kWh/kg of aluminum to the minimum requirement.
4.3 Carbon Anode
The United States consumed 1,651,000 metric tons of carbon anode in 2000. Approximately 0.45
kilograms of carbon anode were needed to produce one kilogram of aluminum. (Appendix F, Table
F.1) All commercial production of aluminum uses carbon as the anode material for the electrical
reduction of alumina to aluminum. The carbon anode net reduction reaction
(
2Al
2
O
3
+3C 4Al+3CO
2
) requires three carbon atoms for the reaction to free four aluminum
atoms. The theoretical minimum anode consumption is 0.33 kg of carbon per kilogram aluminum [(3
x 12.01 carbon molecular weight )/( 4 x 26.98 aluminum molecular weight)]. Anode material quality
is important since all the impurities dissolve into the bath and ultimately contaminate the molten
aluminum. The anode’s physical quality also affects both the energy efficiency and productivity of
smelting cells.
Anode consumption rates in practice, typically about 0.45 kg carbon per kg of aluminum, are
35 percent higher than the theoretical requirement. Excess carbon usage results from the need to
protect the iron electrical connection within the carbon anode, and from air burning and dusting. The
surface of the carbon is hot enough at cell operating temperatures to oxidize at a slow rate. This is
minimized by coating the anode surface and covering the anode with alumina, which insulates it from
air exposure.
20

Primary Aluminum Raw Materials
Dusting, breaking off small particles of carbon into the air or bath, can account for half of the excess
carbon used in the smelting process. Dusting is a direct function of the anode material uniformity. It is
caused by selective electrolytic oxidation and air burning of the binder pitch, which releases
aggregate carbon particles into the bath. Anode carbon dust is unavailable for aluminum production.
Two different anode technologies are utilized by the U.S. industry. “Prebaked” carbon anodes account
for more than 86 percent of the U.S. capacity
.
Older, “in-situ-baked” Söderberg anodes account for
the remainder of the capacity. New prebaked anode reduction cells have surpassed Söderberg anodes
in terms of current efficiency and emissions control. Only three operational smelters in the United
States are currently using Söderberg anodes. No new Söderberg cells are being built, and those that
exist are progressively being replaced, converted, or shut down. This report will focus mainly on
“prebaked” anodes for smelting technology.
Carbon “prebaked” anodes are made by mixing ground used carbon anodes, calcined petroleum coke
and coal tar or petroleum pitch. Pitch acts as a binder to hold the anode mass in a “green” formed
shape. Compacting the anode by using vacuum and vibrating the mixture when forming produces a
denser, more conductive and lower dusting anode. Baking carbonizes the pitch and creates a solid
bond between the particles of calcined coke and used anode material. Cast iron is poured into
preformed sockets in the baked anode to form an electrical connection. “Prebaked” anodes can weigh
as much as 1,250 kg and have a working face size of about 0.70 m x 1.25 m and a 0.5 m height.
“Prebaked” anodes are removed before they are completely consumed. Used anodes are recycled into
the anode production system to recover the carbon and the iron rods used for electrical connections.
Used anodes can account for 15 to 30 percent of the mass used in green anode makeup.
Calcined petroleum coke is a byproduct of the crude oil refining industry. Green or raw coke contains
8 to 10 percent moisture and 5 to 15 percent volatile organic materials. Raw coke must be calcined at
about 1,200°C to 1,350°C in gas-fired kilns or rotary hearths to remove the moisture, drive off
volatile matter, and to increase the density, strength and conductivity of the product.
20
Calcined coke
has a bulk density of about 800 kg/m
3
. Worldwide, about 25 percent of all raw coke is calcined and
about 70 percent of all calcined coke goes to aluminum production. Modern calcining hearth and kiln
designs capture and use the volatile organic matter in raw coke as their major fuel source.
4.3.1 Carbon Anode Energy Requirements
Approximately 0.66(6.02
tf
) kWh of energy were required and 0.12 kg CDE were released in the
manufacturing of the 0.45 kg of carbon anode needed to produce one kilogram of aluminum in
2003.
Anode blocks are typically baked in a natural gas-fired furnace for several weeks. Quality anodes
21

Primary Aluminum Raw Materials
depend upon careful baking controls to gradually raise the temperature to about 1,250°C. Volatile
hydrocarbons from the pitch are gradually released during the baking process. Theoretically, these
volatile compounds could provide sufficient heat for anode baking and no additional energy would be
required. However, in practice, volatile organic compounds account for only 46 percent of the energy
input to the prebake ovens. The remaining 54 percent of the energy needed comes from fuel. Only
about 30 percent of the input energy goes into making the anode, 24 percent is lost from oven
surfaces, 29 percent goes up the stack and 17 percent is lost in other ways. New prebake furnace
ovens with computer controls are more efficient with both regenerative and recuperative elements.
21
Emissions associated with prebaked anodes result mainly from the combustion of natural gas and the
volatile organic compounds contained in the pitch. These amount to 0.27 kg CDE per kilogram of
anode or 0.12 kg CDE per kilogram of aluminum (Appendix E, Table E.2).
The process energy used to produce a
Table 4.1: Energy Associated with Carbon Anode Manufacturing
carbon anode is 1.36(1.66
tf
) kWh/kg of
anode from the most recent available
U.S. data for 1995.
20
The total energy
(see Appendix I) to produce a carbon
anode is shown in Table 4.1. The
energy per kg of aluminum produced is
obtained by multiplying 0.45 times the
total energy required to produce a
kilogram of carbon anode.
kWh per kg of Anode kWh per kg of Aluminum
Pitch
Coke
anode
a
0.003 (2.58
tf
)
0.13 ( 8.99
tf
)
1.36 (1.93
tf
)
0.45 X a
0.001 (1.15
tf
)
0.06 (4.01
tf
)
0.61 (0.86
tf
)
Total
1.49 (13.50
tf
) 0.66 (6.02
tf
)
Söderberg anodes use green coke and are baked in-situ. These anodes can be baked only to the
maximum cell-operating temperature, which results in an anode with 30 percent higher electrical
resistivity and a greater dusting propensity than a prebaked anode.
23
The cell emission control system
is also more complex than for a prebake cell, since emission systems must be designed to handle the
5 percent to 15 percent volatile organic material content of the green coke.
24
Some plants employ both
wet and dry gas scrubbing systems to meet the environmental regulations.
4.3.2 Carbon Anode Theoretical Energy Values
The minimum theoretical energy requirement to manufacture a carbon anode is the energy necessary
to convert the coal tar pitch by destructive distillation to a coke-based binder. Approximately one-
third of the pitch binder mass is lost in the baking process.
25
A portion of this loss consists of volatile
components, while the remainder is the carbonization of the pitch. Pitch contains approximately
85 percent carbon. Approximately 79 percent of the pitch is actually carbonized, while 21 percent is
volatilized. The fuel energy value of the pitch that is carbonized, 0.75 kWh/kg of anode, is a measure
22

Primary Aluminum Raw Materials
of the theoretical energy required for anode manufacturing. In addition, the tacit or inherent energy of
11.55
tf
kWh/kg of anode must be accounted for as part of the total theoretical requirement. Therefore,
the total theoretical minimum energy associated with the production of pre-baked carbon anodes is
12.30
tf
kWh/kg of carbon anode. Further, since 0.33 kg of carbon anode are required to produce a
kilogram of aluminum in theory, the minimum energy requirement to produce anodes is 4.1 kWh/kg
of aluminum.
23

1960
1965
1970
1975
1980
1985
1990
1995
2
000
5. Primary Aluminum Production
The total energy associated with primary aluminum production from bauxite ore was
approximately 23.78(45.21
tf
) kWh/kg of aluminum in 2003. This consisted of:
• 8.20(14.11
tf
) kWh/kg aluminum for raw materials, and
• 15.58(31.10
tf
) kWh/kg aluminum for electrolytic reduction.
Alumina is insoluble in all ordinary chemical reagents at room temperature and has a high melting
point (above 2,000°C). These properties make conventional chemical processes used for reducing
oxides difficult and impractical for conversion of alumina into aluminum.
Commercial primary aluminum is produced by the electrochemical reduction of alumina. Charles
Martin Hall in the United States and Paul Lewis Toussaint Héroult in France independently developed
and patented a commercially successful process for alumina reduction in 1886. This process,
commonly referred to as the Hall-Héroult process, is still the primary method in use for aluminum
production. Though the engineering has improved vastly, the process fundamentals are basically
unchanged today. The Hall-Héroult process takes place in an electrolytic cell or pot. The cell consists
of two electrodes (an anode and a cathode) and contains a molten bath of fluoride compounds
(cryolite), which serves as an electrolyte and solvent for alumina. An electric current is passed
through the bath, which reduces the alumina to form liquid aluminum and oxygen gas. The oxygen
gas reacts with the carbon anode to form carbon dioxide. Molten aluminum collects at the cathode in
the bottom of the cell and is removed by siphon.
5.1 Production, Capacity, and Growth
In 2003, 10 companies operated 15 primary aluminum production facilities in the United States.
These facilities having a production capacity of approximately 4,149,000 metric tons, operated at
approximately 65 percent capacity to produce 2,704,500 metric tons of aluminum in 2003.
26
Figure 5.1:U.S. Production of Primary Aluminum from 1960 to 2003 (Source: Appendix G)
0
1
2
3
4
5
Million Metric Tons
24
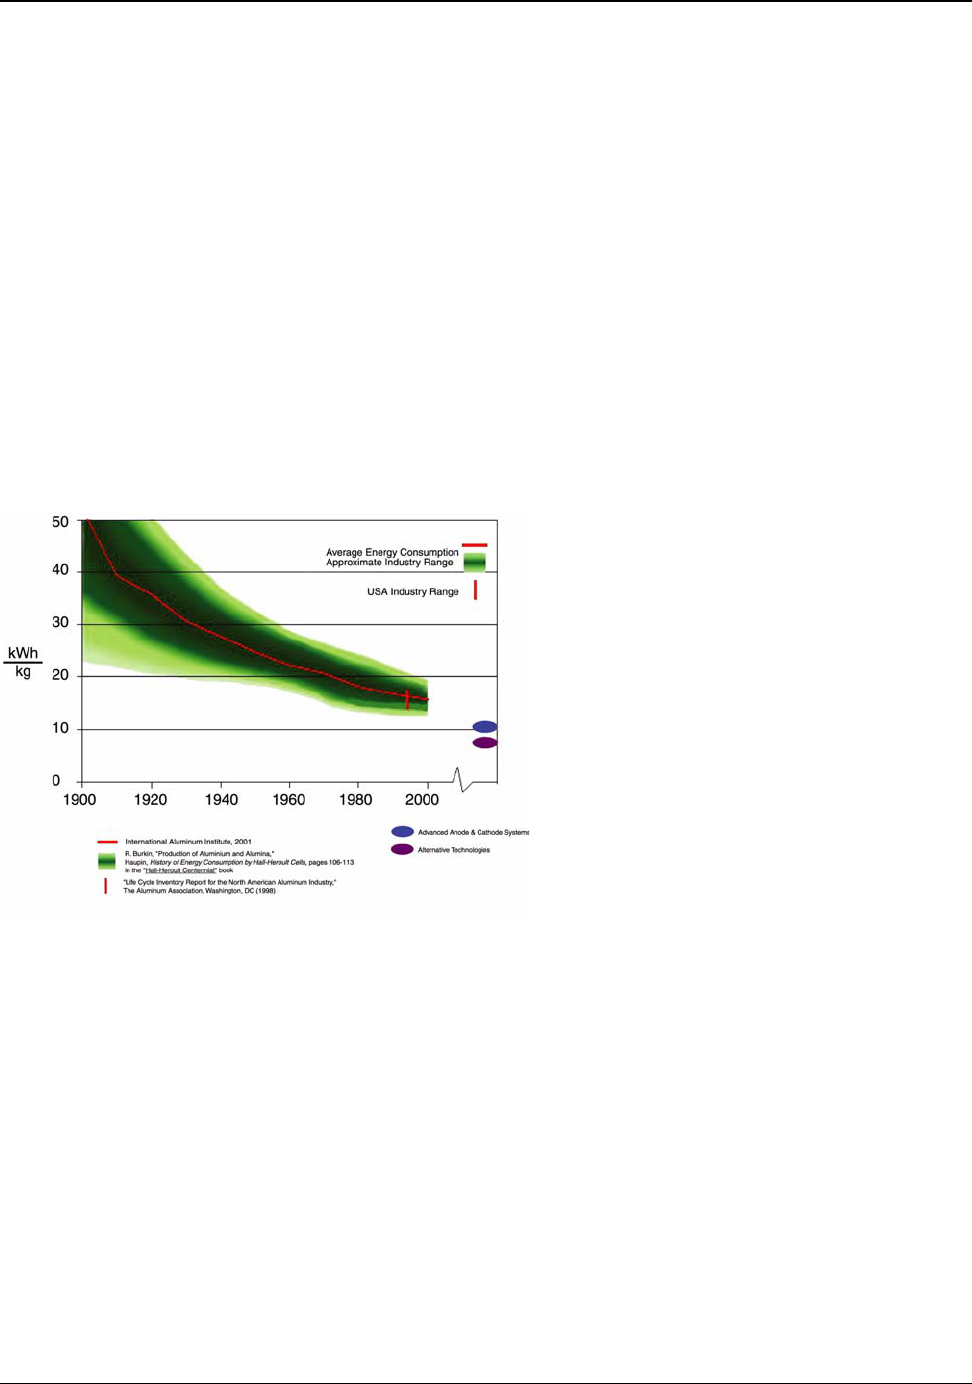
Primary Aluminum Production
Figure 5.1 shows variations in the production of primary aluminum in the United States from 1960 to
2003. These production variations are more representative of the costs to produce aluminum than of
the domestic demand. Primary aluminum is traded on a global market, and global supply has been
growing steadily at a rate of 3.6 percent annually for the past ten years. The United States accounted
for 9.8 percent of the world’s primary aluminum production in 2003.
5.2 Historical Hall-Héroult Energy Utilization
“The first commercial aluminum cells at Neuhausen, Switzerland (Héroult) and Pittsburgh,
Pennsylvania (Hall) required more than 40 kWh/kg of aluminum produced and had current
efficiencies ranging from 75 percent to 78 percent.”
27
The Hall-Héroult process is still electric energy
intensive. Since electricity costs are an important component (about one third) of the total production
costs, energy efficiency continues to be a major area of focus for the aluminum industry.
The electrical energy consumed in a primary
aluminum cell is measured by the number of
watts consumed over a period of time.
Wattage is determined by multiplying the
cell voltage by cell amperage. Figure 5.2
shows the significant electrical energy
improvements made between 1900 and
2000. Total electricity usage (excluding tacit
generation and transmission losses) varies
from less than 13 kWh/kg of aluminum for
the state-of-the-art plants up to more than 20
kWh/kg for older Söderberg facilities (U.S.
plants in 1995 averaged around 15.4 kWh/kg
of aluminum). The theoretical minimum
energy requirement for carbon anode
aluminum electrolysis is approximately 5.99
kWh/kg of aluminum (see Section 5.3.1).
Compared to theoretical values, U.S. facilities are operating at roughly 38 percent energy efficiency.
Significant engineering changes in cell design and operation have occurred over the past fifty years.
Table 5.2 shows the changes in operating parameters of a typical cell from 1948 to 1999.
28
Each new
or updated primary facility tries to increase productivity and incorporate energy-reducing
technologies to lower production costs. This results in gradual changes in the industry. The most
significant change is the new equipment and techniques allowing for smaller and more frequent
alumina additions (point feeders). This, combined with higher amperage, lower current density and
larger cells, has dramatically improved current efficiencies and productivity.
Figure 5.2: Primary Aluminum Electric Energy
Consumption 1900 to 2000
25
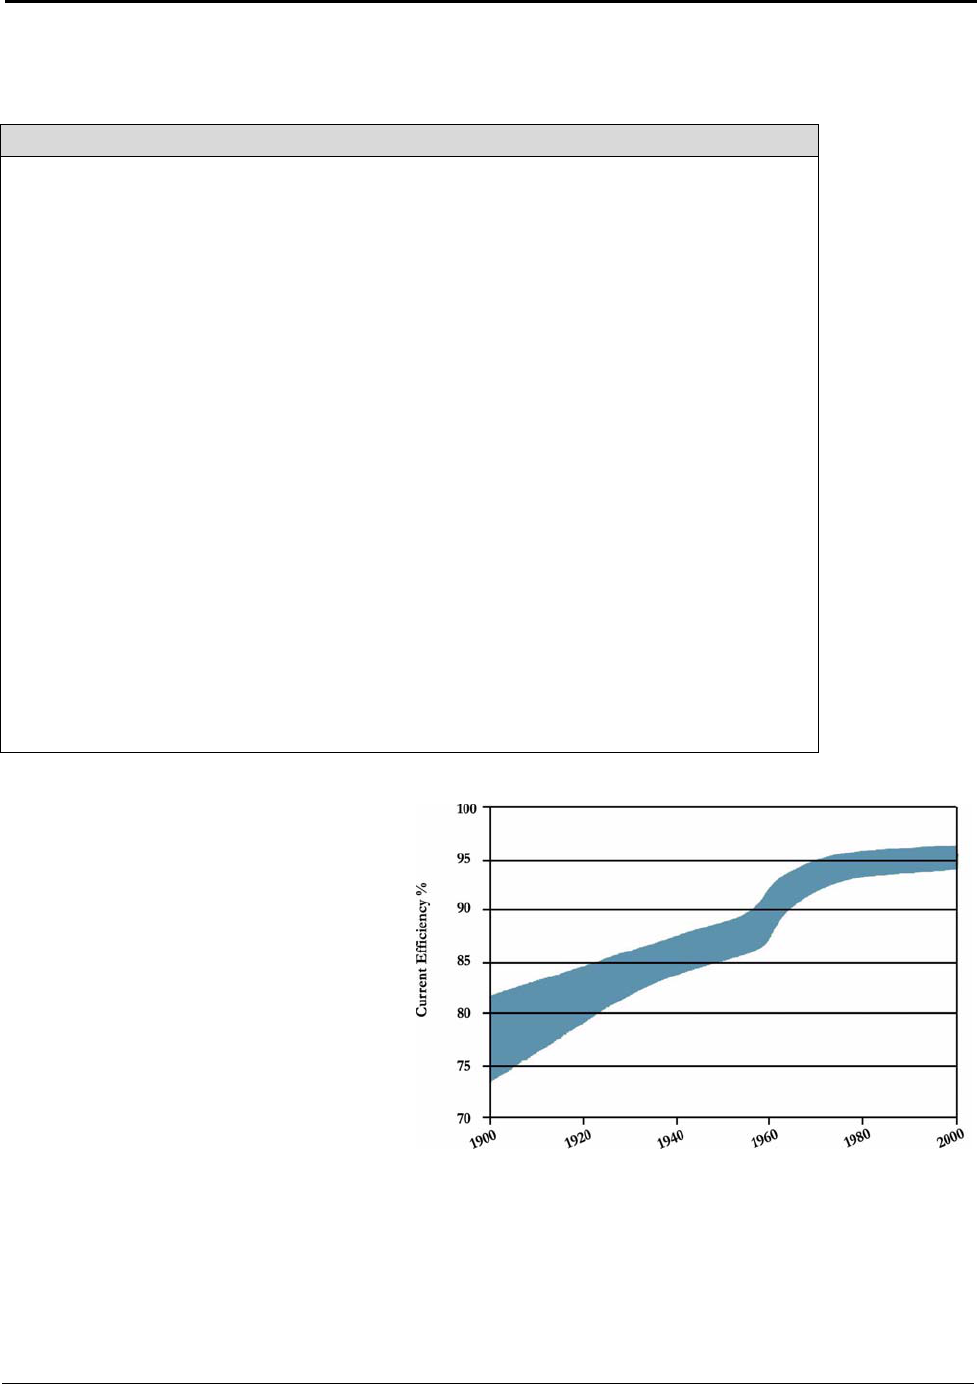
Primary Aluminum Production
Table 5.1: Typical Parameters of Aluminum Reduction Cells 1948 vs. 1999
28
Parameter 1948 1999
Current Rating (kA)
Aluminum Production (kg Al /pot day)
Energy Consumption (DC kWh/kg Al)
Anodic Current Density (A/cm
2
)
Area of Cavity (m
3
)
Nominal Anode Area (m
3
)
Ratio of Area (Anode/Cavity)
Average Velocity of Flow in Cathode (cm/s)
Cathode Life (days)
Potroom Workers (hours/metric ton Al)
Interval for Alumina Additions (minutes)
Emissions (kg /metric ton Al)
F
CF
4
Anode Effects per Pot Day
Net Anode Carbon Consumption (kg C/kg Al)
Number of Pots per Potline
World Primary Production (10
6
) metric tons
50 - 60
385
18.5 - 19
1.2 - 1.3
8
4 - 5
~ 0.55
10 - 15
600 - 800
5 - 8
80 - 240
~ 30
~ 1.5
3 - 4
0.55
~ 40
~ 1
300 - 325
2,475
12.9 - 13.5
0.8 - 0.85
40 - 45
38
~ 0.9
4 - 6
2,500 - 3,000
1.7
0.7 - 1.5
< 0.5
0.05
0.05
0.43
~ 288
~ 20
There is a minimum cell amperage
(electrical current) required to produce
aluminum (see Section 5.3). Production
in the the United States now operates at
about 95 percent current efficiency, a
significant improvement over the past
several years, as shown in Figure 5.3.
The high current efficiency of existing
technologies leaves little opportunity for
process or technology improvements to
further reduce amperage and save
additional energy. Since current
efficiency is high, lowering the voltage
requirements of cells presents the largest
challenge and the best opportunity for
improving Hall-Héroult efficiencies. The
voltage requirements of a cell are
described in section 5.4.2.
Figure 5.3: Primary Aluminum Current Efficiency
1900 to 2000
Source: Production of Aluminum and Alumina
26
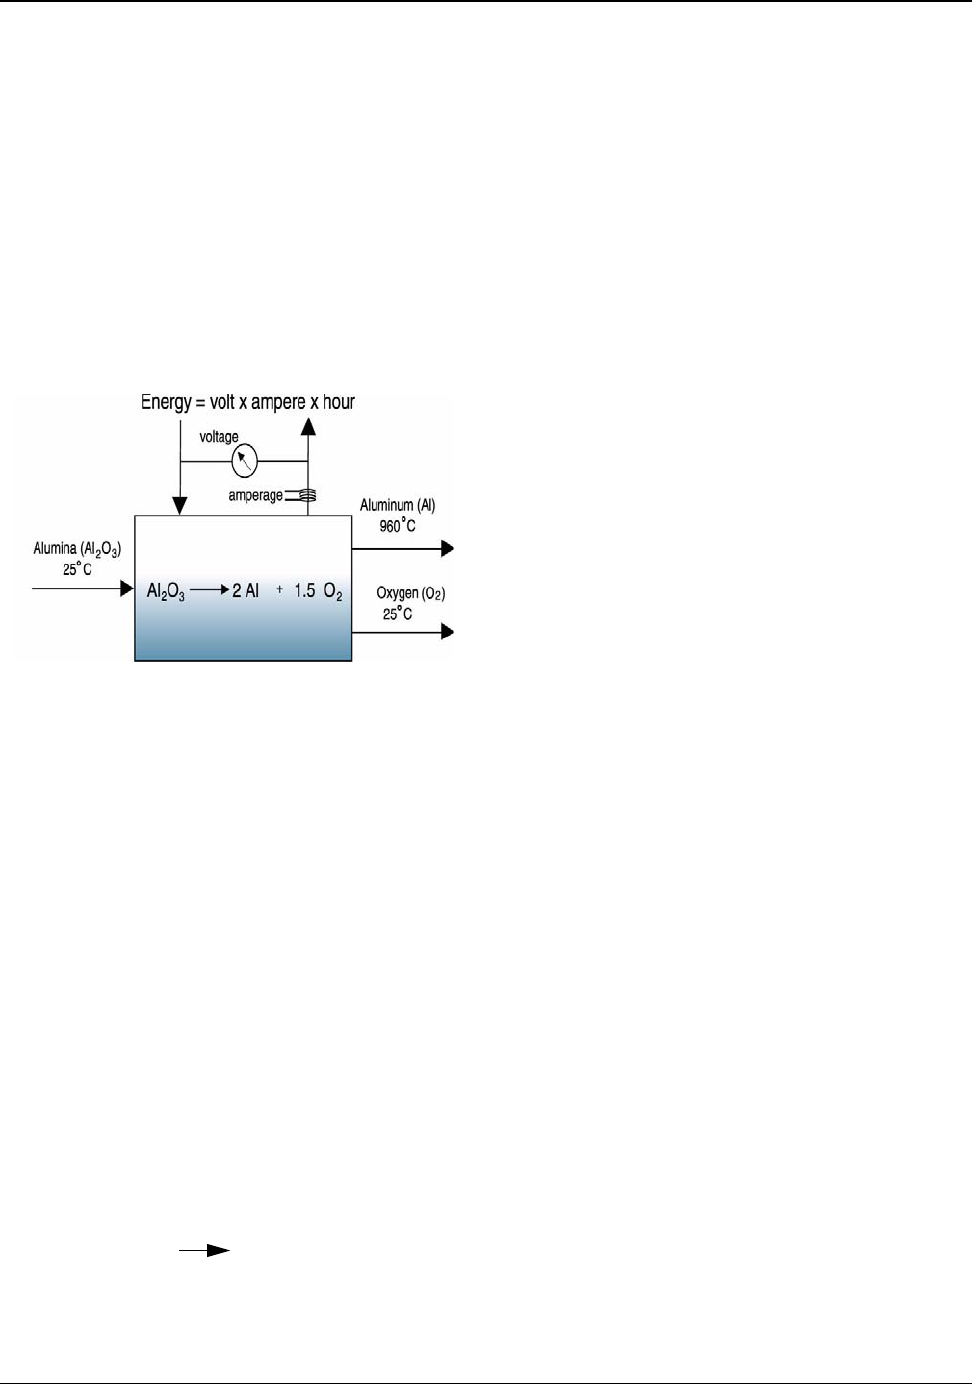
Primary Aluminum Production
5.3 Theoretical Minimum Energy Requirement for Reduction
Figure 5.4: Alumina to Aluminum Theoretical
Minimum Energy
All current primary production facilities and most alternative processes for aluminum production use
alumina as their raw material. Any process that starts with alumina to produce aluminum has the same
theoretical energy requirement. Different processes do not offer any theoretical energy advantage.
However, they do offer significant tradeoffs between efficiencies, emissions, footprints, and sources
of input energy (electricity, carbon, and fuels). The theoretical limits required to manufacture
aluminum provide a valuable insight into Hall-Héroult cell operation and potential future reduction
processes.
The product of primary reduction process is molten
aluminum. This report calculates the theoretical
minimum energy by assuming the reactants enter
and the byproducts leave the system at room
temperature and that molten aluminum leaves the
system at 960°C. The molten metal temperature,
960°C (1233°K), is an approximation of an average
commercial operating cell. Figure 5.4 illustrates the
theoretical boundaries for a system that reduces
alumina to form aluminum and oxygen. Changes in
the operating temperature of a cell have a minor
effect on the theoretical energy requirements.
Operating changes of 100°C in a Hall-Héroult cell, operating in the range of 700°C to 1,100°C, result
in less than a 1 percent change in the theoretical minimum energy requirements (Appendix J, Table
J.7).
Some studies assume that the gases evolved during reduction leave the system at the molten metal
temperature. In these studies, the theoretical minimum is 2.5 percent to 3 percent higher than the
values presented in this report (Appendix J). Theoretically, it is possible to capture all the energy
associated with these gaseous emissions. In practice, however, the gas stream is collected from
hundreds of hooded pots and treated before release to the atmosphere. Only a very small portion of
the heat is actually absorbed and returned to the system.
Three energy factors must be examined in the production of aluminum: the energy required to drive
the reduction reaction forward, the energy required to maintain the system at constant pressure and
temperature, and the energy required to change the temperature of the reactant and/or product. The
thermodynamics and chemical equilibrium of the reactions are described by the following equation:
∆G = ∆H – T∆S
The energy required to drive the reaction forward is the energy for the electrolytic reduction of
alumina (
2Al
2
O
3
4Al + 3O
2
) and is given by the change in the Gibbs free energy value (∆G).
The energy required to maintain system equilibrium is the difference between the heat of reaction
27

----------------------------------------- ---------------------------- ---------------------- ---------------------------------- ----------------------
Primary Aluminum Production
(∆H) and the Gibbs free energy value (∆G), which equals the entropy term (T∆S). Since the Gibbs
free energy requirement is less than the heat of reaction for alumina reduction, additional energy must
be added to the system to maintain the system temperature. Otherwise the system will cool as the
reaction proceeds. Hence, for the alumina reduction reaction, the ∆H term provides the minimum
theoretical energy requirement (reaction and equilibrium). Reduction cells operate at atmospheric
conditions and no pressure change results from the reduction. Numeric values for these
thermodynamic measures for the elements and compounds common to aluminum processing and the
calculations used to determine the theoretical minimum energy requirement are given in Appendix J.
The energy required to change the temperature of reactants and products is calculated from their heat
capacities (C
p
), which are provided in Appendix J.
Faraday’s law provides the minimum amperage requirement for electrolytic reduction. This law states
that 96,485 coulombs of electricity are passed through a cell to produce a one gram equivalent of an
element or compound. Aluminum has an atomic weight of 26.98, a charge of 3
+
and therefore, has an
8.99 gram equivalent weight. Faraday’s law is converted to more common measurements:
96,485 coulombs
gm equivalent
Ampere sec
coulomb
hour
3,600 sec
gm equivalent 1,000 gm
= 2,980 Ah/kg
8.99 gm kg
The value 2,980 Ah/kg of aluminum is the theoretical minimum amperage (current) required for
production. This value assumes perfect conditions, where there are no reverse or parasitic reactions
that consume amperage and no limitation to the ionic species availability to react at the electrodes (no
concentration gradients or gas bubbles). The Gibbs free energy (∆G) divided by the Faraday
amperage provides the minimum voltage required to drive the reaction forward. Cell voltage and
current efficiency are variables that are controllable by design and they determine the electrical power
required for reducing alumina. In practice, electrolytic cells have significant inefficiencies and
operate above the minimum voltage requirement. This excess voltage provides the thermal energy
required to maintain system equilibrium (∆H – ∆G) and to produce molten material (C
p
).
In the case of aluminum made directly from alumina (2Al
2
O
3
4Al+3O
2
), shown in
Figure 5.4, the energy required to drive the reaction forward (∆G) is 8.16 kWh/kg, the thermal energy
(∆H – ∆G) required to maintain thermal equilibrium is 0.48 kWh/kg, and the thermal energy (C
p
)
associated with producing the molten aluminum is 0.39 kWh/kg of aluminum. The theoretical
minimum energy requirement is 9.03 kWh/kg of aluminum. (Note: if the gas emission at 960°C is
included, the total theoretical minimum energy requirement is 9.30 kWh/kg of aluminum) (Appendix
J, Table J.2).
28
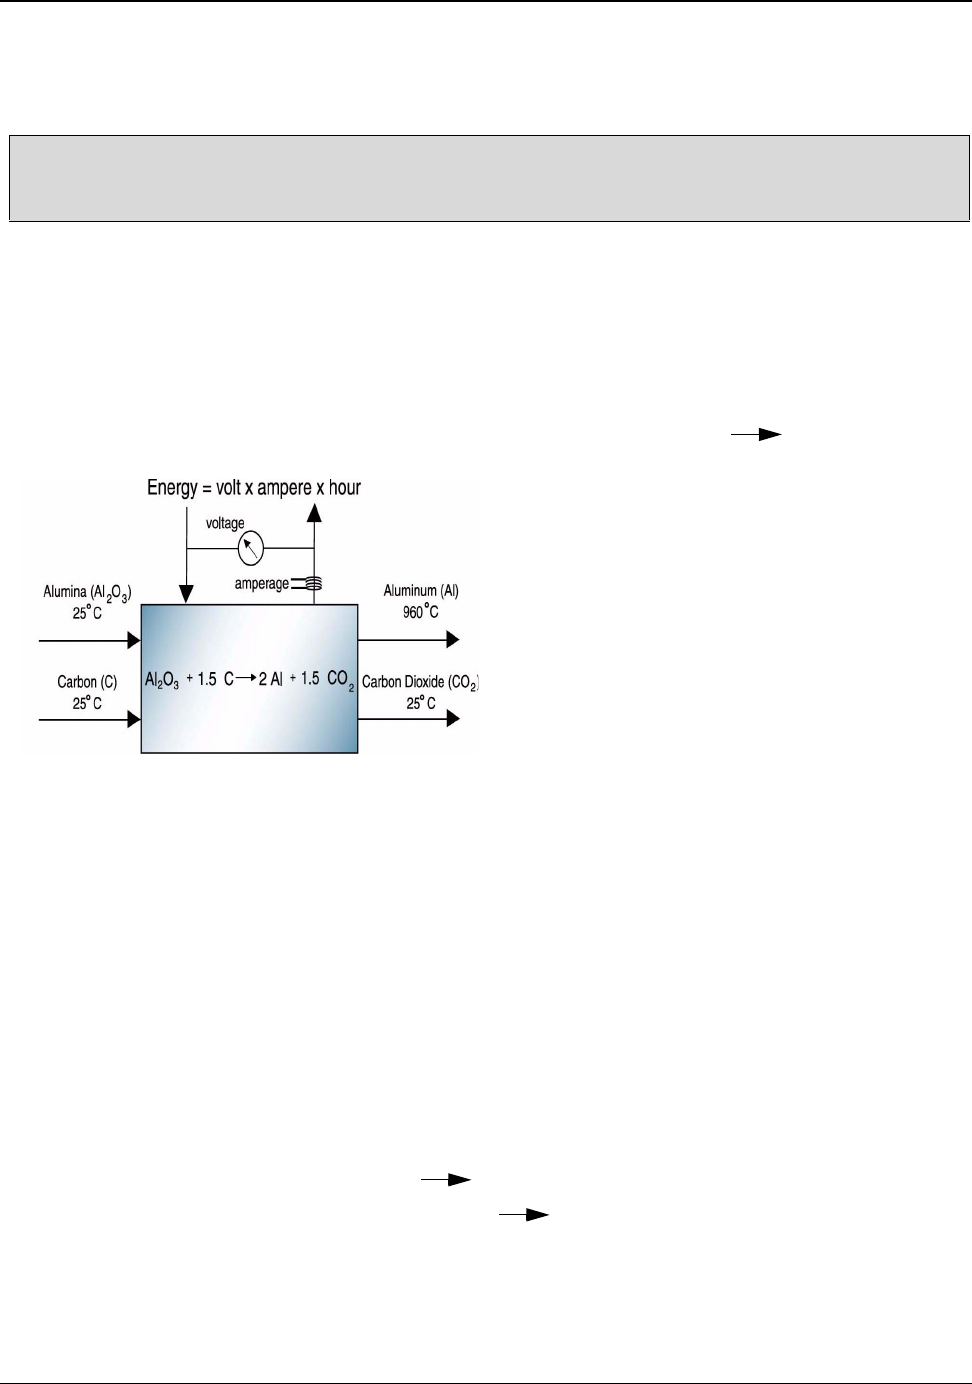
Primary Aluminum Production
5.3.1 Theoretical Energy for Hall-Héroult Carbon Anode Reduction
The theoretical minimum energy requirement for producing molten aluminum at 960°C in a
Hall-Héroult cell with a carbon anode is 5.99 kWh/kg.
All commercial aluminum production uses a carbon anode in a Hall-Héroult cell. The carbon is
consumed during the electrolytic process and supplies part of the energy necessary for the reduction
of alumina. This gives the Hall-Héroult carbon anode process a lower energy requirement than the
direct reduction of alumina to aluminum. The theoretical energy required for reduction is the same for
prebaked or Söderberg carbon anodes.
The net reaction for the carbon anode Hall-Héroult process is 2Al
2
O
3
+3C 4Al+3CO
2
.
Figure 5.5 shows an idealized Hall-Héroult cell
for the production of aluminum. In this cell, it is
assumed that the reactants (alumina and carbon)
enter the cell at 25°C, the carbon dioxide
byproduct leaves the cell at 25°C, and the
aluminum product leaves as molten metal at the
cell operating temperature of 960°C. The
reaction is assumed to occur under perfect
conditions, where there are no reverse reactions,
no parasitic reactions consuming additional
anode carbon, no limitations to the ionic species
reacting at the electrodes, and no heat or energy
losses external to the system.
Appendix J, Table J.1 details the calculation of theoretical minimum energy for this reaction. The
results show that the energy required to drive the reaction forward (∆G) is 5.11 kWh/kg, the thermal
energy required to maintain equilibrium is 0.49 kWh/kg and the thermal energy associated with the
molten aluminum is 0.39 kWh/kg of aluminum. Therefore, the theoretical minimum energy
requirement for the reduction of alumina in a carbon anode cell adds up to 5.99 kWh/kg of aluminum.
(Note: if the CO
2
gas emission at 960°C is included, the total theoretical minimum energy
requirement is 6.16 kWh/kg of aluminum).
In actual carbon anode cell operations, current efficiencies of less than 100 percent result from
reverse oxidation reactions between part of the aluminum metal that is dissolved in the cryolite and
carbon dioxide gas produced
(2Al+3CO
2
Al
2
O
3
+3CO)
and to a lesser extent between the
carbon dioxide gas and the carbon anode
(CO
2
+C 2CO)
. Current efficiency losses can also
result from direct shorting of the anode to the aluminum pad.
Figure 5.5: Alumina and Carbon to Aluminum
Theoretical Minimum Energy
29
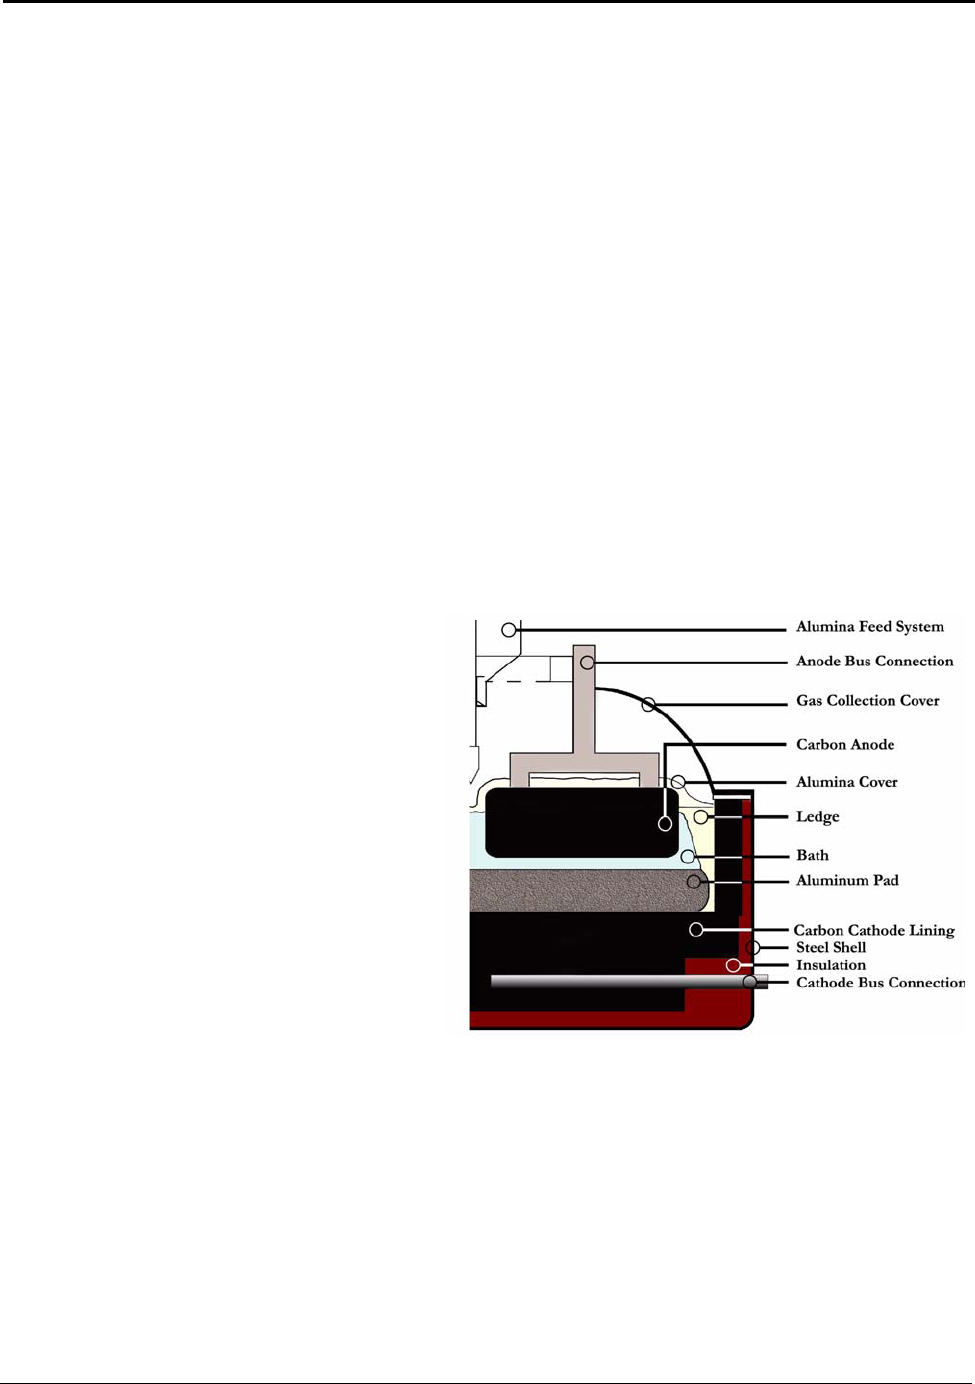
Primary Aluminum Production
Today’s state-of-the-art reduction cells are achieving current efficiency levels of more than 96 percent
and energy consumption levels of less than 13.0 kWh/kg of aluminum.
29
The theoretical minimum
energy requirement at 100 percent current efficiency is 5.99 kWh/kg of aluminum. The energy
efficiency levels of present state-of-the-art carbon anode reduction cells are about 46 percent.
5.4 Hall-Héroult Reduction Process
The engineering, materials, and process knowledge of existing components and processes form the
foundation for developing new components, processes, and techniques for producing aluminum. The
Hall-Héroult cell works as a system where all the components perform together. Therefore,
improving one component may not necessarily result in an improved cell or a more energy-efficient
operation. To understand the impact of component and system changes on the cell performance, it is
helpful to know about the Hall-Héroult process in terms of its components, operations and
interrelationships. This section explains the process by describing a typical prebake anode operation.
5.4.1 Typical Hall-Héroult Cell Operation
A typical modern aluminum electrolysis
Hall-Héroult reduction cell (pot) is a
rectangular steel shell 9 m-12 m long, 3 m-
4 m wide and 1 m-1.5 m deep (Figure 5.6). It
has an inner lining of carbon, which is
surrounded by refractory thermal insulation,
that keeps it isolated thermally and
electrically from the steel shell. Commercial
cells range in capacity from 60,000 amperes
to more than 500,000 amperes and can
produce more than 450 to 4,000 kilograms of
aluminum per day, respectively.
A cell typically operates at 950°C to 980°C
and yields molten aluminum and carbon
dioxide. The molten aluminum has a higher
density than the electrolyte (cryolite bath)
and settles to the bottom of the cell on top of the carbon lining. Molten aluminum at about 99.7
percent purity is periodically “tapped” by a vacuum siphon from the cell bottom. The tapped metal is
transferred to holding furnaces where the metal is alloyed, and entrained gases and impurities are
removed prior to casting. The carbon dioxide and other gases generated in the cell during the
reduction process are collected and treated to meet environmental regulations.
Figure 5.6: A Typical Hall-Héroult Cell
30

Primary Aluminum Production
Electric current enters the cell through the carbon anode and flows through 3 cm–6 cm of electrolyte
(bath) to the aluminum pad and carbon lining cathode. The aluminum pad is in intimate contact with
the carbon lining and serves as the charged surface of the cathode. Steel collector bars are set near the
bottom of the carbon lining to conduct the current to the anode of the next cell.
The 950°C to 980°C molten cryolite and aluminum used in a typical reduction cell are corrosive.
Molten cryolite has low viscosity and interfacial tension that allows it to easily penetrate any porosity
in the cell lining. To protect the carbon lining, the thermal insulation is adjusted to provide sufficient
heat loss to freeze a protective coating of the electrolyte, known as “ledge,” on the inner walls. The
molten aluminum pad protects the carbon bottom of the cell. The cell is never tapped completely dry
of molten aluminum. It is essential that no alumina or frozen ledge form under the metal pad. The
carbon cathode must remain bare for good electrical contact with the aluminum pad and to minimize
wear of the carbon surface.
The reduction reaction is continuous and alumina must be supplied to the bath at a controlled rate to
maintain constant conditions. This is accomplished with automatic feeders that break the surface crust
and deposit alumina into the molten bath where it is dissolved for reaction. Alumina is also used to
cover the carbon anodes and the frozen bath surface. The alumina covering serves as thermal
insulation and as a protective cover to reduce air burning of the anode.
The electrolytic reaction in a Hall-Héroult cell consumes the carbon anode. Approximately 0.45
kilograms of the carbon anode is consumed for each kilogram of aluminum produced. The carbon
anodes provide a necessary part of the energy required to operate a cell. The distance between the
carbon anode and the metal pad is kept constant by adjusting the anode as it is consumed. The
consumable carbon anodes must be replaced periodically, typically about every four weeks in a
modern plant. The frequency of anode changing depends on the anode design and the cell operation.
Anode changing represents the most frequent cell and productivity disruption. The removed portion
of an anode (known as a “butt”) is recycled or sold as a fuel. The pot cover, which is part of the gas
collection system, must be removed, the used anode must be pulled from the frozen surface crust, and
the new anode must be inserted into the space of the consumed anode. This has to be accomplished
without significant pot crust breakage or alumina falling into the bath. Anode changing is the single
largest thermal, current, and magnetic disturbance in cell operation.
Cells are arranged in long rows called “potlines.” They are placed as close as possible to each other
while maintaining sufficient room for anode changing, alumina feeding, and reasonably low
electromagnetic interference. The cells are connected electrically in series. Rectifiers, which convert
alternating current to direct current, are chosen to minimize capital investment and typically provide
about 700 V(dc). Typically a reduction cell’s design requires about 4.6 V(dc) so that a potline of
roughly 150 to 180 cells would be used.
31
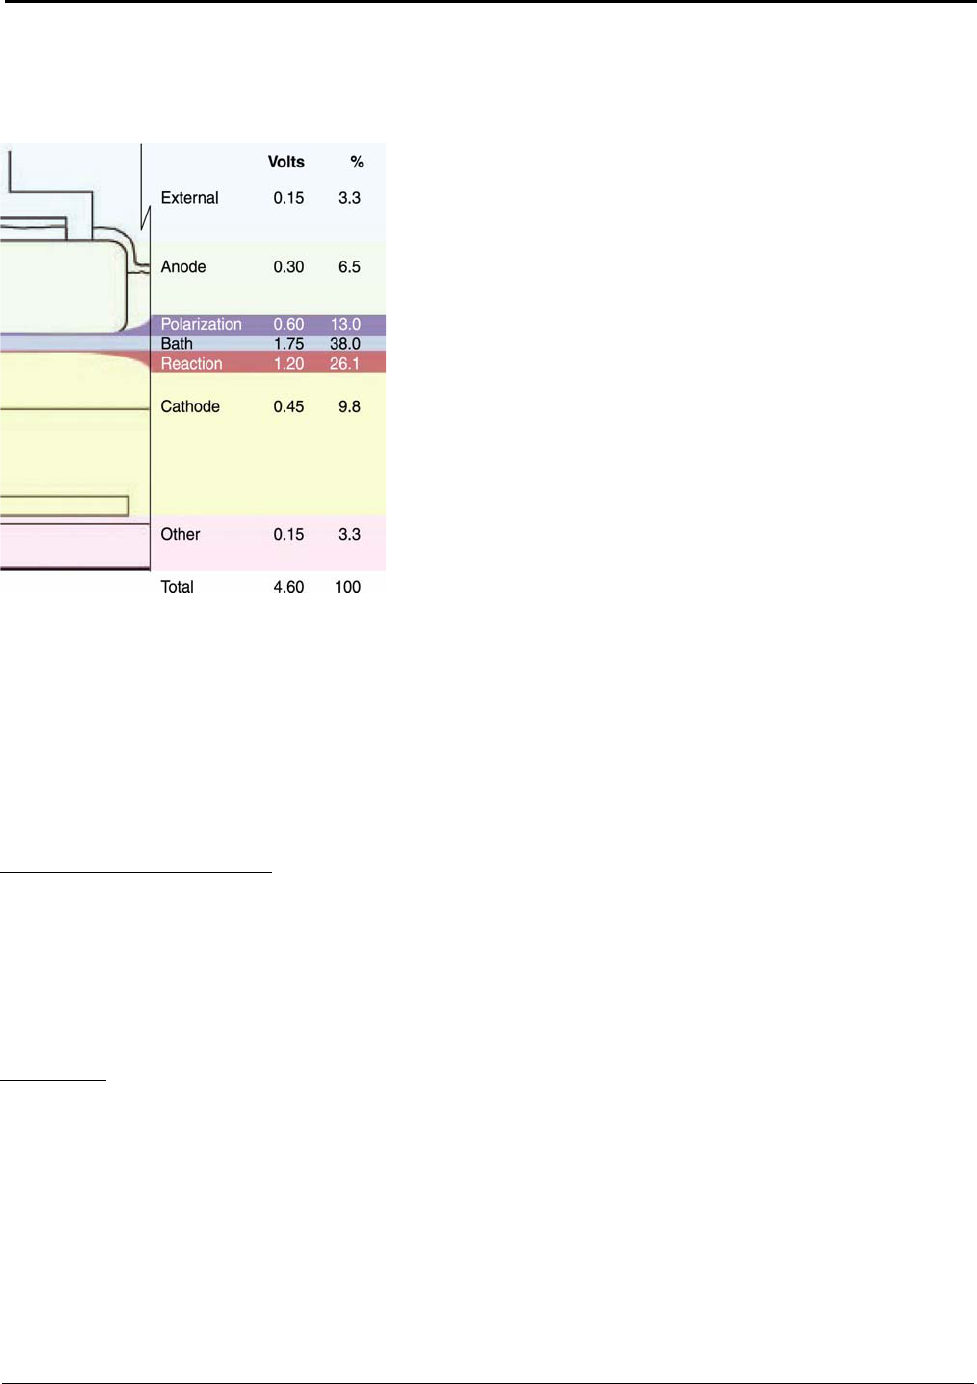
Primary Aluminum Production
Figure 5.7: Voltage Distribution in a Hall-
Héroult Cell
5.4.2 Voltage Requirements
The energy consumed in an electrolytic reaction is a
function of the voltage used and the current efficiency of the
operating cell (the minimum current is fixed by Faraday’s
Law, see Section 5.3 on page 27). Modern Hall-Héroult
cells operate at high (96+ percent) current efficiencies. The
approximate voltage components of a conventional cell are
shown in Figure 5.7.
The electric current flows through the cell and the cell
voltage components can be described as a set of resistors in
series.
E = cell reaction + overvoltage + bath + cathode + anode
+ connectors
The cell reaction voltage is a function of temperature and at
960°C, is fixed at 1.2 V(dc).
30
This is the theoretical
minimum voltage required for the reduction reaction to take
place and no cell can operate at 960°C below this voltage.
The total cell operating voltage includes the addition of voltages required to overcome the ohmic
resistance of the other cell components. These are described in the following section of the report.
5.4.3 Cell Subsystems and Variables
Busbars and Pot Connectors
Busbars electrically connect in series all the cells of a single potline, which typically contains more
than 150 pots or cells. They are fabricated from highly conductive aluminum alloy and are sized for
minimum overall system cost. Any voltage drop in the busbar and connector system results in energy
loss.
Electrolyte
The electrolyte or bath used in Hall-Héroult is cryolite (Na
3
AlF
6
). This is modified with the addition
of aluminum fluoride (AlF
3
), calcium fluoride (CaF
2
) and other additives to control the operating
temperature, solubilities, activities of ionic species, conductivity, viscosity, interfacial tension, bath
density, vapor pressure, hardness of the crust, and other factors. Bath chemistry, physical properties
32

Primary Aluminum Production
and thermodynamics are very complex. The bulk electrical conductivity of the bath is influenced not
only by its composition and temperature, but also by the presence of anode gas bubbles and carbon
dust.
Aluminum fluoride (AlF
3
) is the most common bath additive. It lowers the operating temperature, the
solubility of the reduced aluminum, surface tension, viscosity and density. However, it has the
undesirable effect of decreasing alumina solubility and electrical conductivity. The weight ratio of
NaF to AlF
3
is referred to as the bath ratio. Controlling this ratio is important for efficient cell
operation (Note: Outside the United States, many countries use the cryolite or molar ratio, which is
twice the bath ratio).
The fluid bath circulates within the cell. As gas molecules are formed at the anode, they accumulate
and coalesce into fine bubbles that aggregate into larger bubbles. These bubbles collect and move
across the anode surface to escape around the edges of the anode. The buoyancy of the gas creates
movement, which contributes to the motion of the bath and pad. The bath movement results from, in
decreasing order of magnitude, gas bubble drag and electrolyte density difference caused by the
bubbles generated at the anode, electromagnetic forces on the molten metal pad, and temperature
gradients. This motion influences the concentration gradients of dissolved alumina and affects current
efficiency. The motion also influences the heat transfer from the bath to the protective frozen ledge.
Anode-Cathode Distance
The anode-cathode distance (ACD) is the distance between electrode surfaces. In the Hall-Héroult
cell, it is the distance from the lower face of the carbon anode to the top surface of the aluminum pad.
This distance is typically about 4 cm–5 cm. The electrolytic bath occupies the space between the
carbon anode and the aluminum pad. The voltage required for current to pass through the bath is
related to the bath conductivity and the distance between the anode and the cathode. Decreasing the
ACD lowers the voltage and energy requirements of the cell. The operating ACD is a compromise
between keeping a low value of bath resistance, while at the same time enabling electrolyte rich in
alumina ionic species to reach the charged surfaces and allowing reactant gas bubbles to escape. The
ACD also must be large enough to ensure that the liquid metal does not contact the anode and short
circuit the cell.
The heat required to keep the bath molten is in part supplied by the electrical resistance of the bath as
current passes through it. The amount of heat developed depends on the current path or the ACD.
Changing the ACD is one method of controlling the desired bath operating temperature.
33

Primary Aluminum Production
Aluminum Pad
The molten aluminum pad that forms at the bottom of the cell is the cathodically-charged surface for
the reduction reaction. The large amperage flowing through the cell creates electromagnetic forces
and torques that cause the metallic pad to rotate. These magnetohydrodynamic (MHD) forces create
this motion which deforms the molten aluminum/cryolite interface. The MHD forces cause local
metal velocities of about 5 cm/sec to occur. Control of MHD effects is one of the key factors for
successful cell operation with high current efficiency and low energy consumption. Cells are designed
to minimize these forces and today, velocities are typically one third of what was common fifty years
ago. Movement of the aluminum pad is mainly caused by electromagnetic forces in the cell and, to a
smaller extent, by the interfacial drag of the bath fluid. Joint discontinuities in the carbon blocks
create additional flow disturbances in the moving pad. The combination of all these forces causes the
pad to undulate or roll which could result in waves forming on the surface of the pad. These waves
can approach the anode and result in an electrical short circuit. The current that flows during this
shorting produces no aluminum and results in a major loss of power and productivity. The motion of
the aluminum pad also produces erosion of the carbon lining and shortens cell life. Since the distance
between the anode and cathode is constantly changing as a result of the undulating pad, the ACD is
kept large enough to avoid contact between the anode and the pad. This requires that the anode be
backed away from its optimal position. Designing systems to minimize movements of the metal pad
is a key factor in the efficient operation of a cell. A stable pad surface will allow the ACD to be
decreased.
The newer concept of using a “drained cathode cell” is an approach to circumvent the difficulties
associated with keeping the metal pad stable. Essentially the bulk of the metal is drained to a sump
and the cathode is left wetted only by a thin metal sheet (Advanced Hall-Héroult Cells, Section 6.1 on
page 43).
Cathode
The bottom lining of the cell also serves as a cathode and carries current from the molten metal pad.
Since 10 percent of the total cell voltage drop is in the carbon cathode blocks, it is important that they
have the highest density and electrical conductivity possible.
In an attempt to reduce the resistance of the cathode, some have experimented with cathode blocks
containing a higher content of graphitic carbon. However, while less resistive, graphite is also less
wear resistant and this compromises the life of the cathode. The cathode life generally determines cell
life, since cathode replacement requires the complete dismantling of a cell. The advent of hard
titanium diboride (TiB
2
) coatings may offer an opportunity to increase the graphitic content of
cathode blocks, and lower cell resistance, without reducing the cell life. Under optimal conditions, the
life of a cathode or cell is in the range of 7 to 10 years.
34

Primary Aluminum Production
Current Density
Current density is a measure of the productivity of a cell. It is calculated by dividing the amperage
supplied to an anode by the geometric face area of the anode. It is generally expressed in amperes per
square centimeter (A/cm
2
). Most potlines operate in the range of 0.8 A/cm
2
to 1.0 A/cm
2
. The
quantity of aluminum produced per cell increases with increasing current density. The tradeoff is that
as current density and productivity increase, current efficiency decreases, which results in a higher
energy consumption per unit of metal produced. Lower current densities are more energy efficient,
but increase capital and labor costs per unit of output.
Cell Polarization/Overvoltage
The reactions occurring at the anode and the cathode create localized conditions that are different
from the bulk of the bath. The reactions deplete the supply of reactants and increase the quantity of
products. This creates concentration gradients, which in turn cause concentration polarization.
Additionally, the gas generated at the anode forms bubbles, which lower the effective bath
conductivity. Localized conditions at the anode and cathode are unavoidable and require a voltage
higher than the minimum reaction voltage to be applied to the cell.
No free aluminum (Al
3+
) or oxygen (O
2–
) ions are present in the bath. Alumina dissolves and
dissociates into salt complexes in the bath. The dynamics at the anode are complicated by the release
of gas bubbles. Oxygen-containing ionic species are transported through the bath and discharged on
the carbon anode. These anode reactions are:
Al
2
O
2
F
6
2–
+
2F
–
+
C CO
2
+ 2AlF
4-
+ 4e
–
and
Al
2
O
2
F
4
2–
+ 4F
–
+ C CO
2
+ 2AlF
4
–
+ 4e
–
At least three phenomena have been identified as contributing to the anode overvoltage:
1. an increase in the local current density due to the presence of gas bubbles adjacent to the anode
surface, which displace the electrolyte bath,
2. an ohmic component from an increase in the resistance of the electrolyte due to the presence of
the bubbles, and
3. the concentration polarization overvoltage.
31
Polarization effects at the cathode contribute much less to overvoltage than at the anode. The cathode
–
reactions are (
AlF
6
3–
+
3e
–
Al + 6F
–
) and (
AlF
4
+
3e
–
Al + 4F
–
). The aluminum ion
–
complexes, AlF
6
3–
and AlF
4
have higher ionic mobility than their anodic counterparts, which lowers
the concentration polarization effect. In addition, no gas bubbles, which influence both resistance and
concentration polarization, are produced at the cathode.
35

Primary Aluminum Production
Anode Effects
Control of the quantity of alumina dissolved in the bath is important for proper operation of a cell.
Alumina saturation is reached at about 7 percent alumina dissolved in a typical bath. The normal
operating level is about 3 percent alumina. If the level goes above 4 percent, some of the added
alumina may not dissolve rapidly and can settle to form a sludge on the cell bottom, thereby reducing
the cell conductivity. If it falls below 1 percent alumina the cell is starved of the reactant and an
“anode effect” ensues. When this occurs, the production of metal is interrupted and fluorine (F
2
),
hydrogen flouride (HF), and two perfluorocarbon gases – tetrafluoromethane (CF
4
) and hexafluoro-
ethane (C
2
F
6
) – are discharged instead of carbon dioxide. These perfluorocarbon gases have 6,000 to
9,000 times the global warming potential of carbon dioxide and require gas scrubbing to meet
environmental regulations.
Significantly, alumina is a good absorbent of fluorine and hydrogen fluoride, but not perfluorocarbon
gases. This allows primary production facilities to use their alumina raw material as an absorbent in
dry gas scrubbing systems. The fluorides absorbed on the alumina in the scrubbers are recycled into
the pot feeding systems, so that both the alumina and fluorides can be reused in the process.
Alumina Feed
Alumina is ideally added to the cell at a rate that exactly replaces the alumina that has been reduced.
If alumina is fed too fast or in large increments, it may not dissolve and can form sludge. Sludge
affects fluid flows within the cell and contributes to erosion of the cathode block surface. Under-
feeding the cell results in an anode effect. There is no current technology for in-situ, real-time bath
analysis to provide precise control of alumina concentration in the bath and alumina feed rate.
Alumina is fed by automatic handling and conveyor systems. The specifications for alumina are
complex with numerous tradeoffs. It must dissolve rapidly; it should contain few impurities, and have
a high surface area, yet be a relatively large particle (this apparent inconsistency is overcome by the
particle having significant porosity). The particle must also be robust, create little dust, and resist
breakage during handling. The introduction of dry scrubbing systems for the cell offgases, wherein
the alumina is used as an adsorbent for fluoride emissions, further complicates the alumina
specifications.
Alumina is “side-worked” in older prebake cell designs and Söderberg cells. Side-worked cells
introduce alumina into the bath using automated crust-breaking and feeding machines that move
along the length of the cell. Side-working is time-consuming and can take one to four hours before the
machine feeds the same section of the cell again. Newer prebaked cell designs utilize the spaces
between the anodes to feed alumina into the cells. “Point feeders” pierce the crust and dispense small
quantities of alumina at numerous points, typically in the center of the cell. One-minute intervals
between point feeding is common. This frequent addition of small quantities of alumina takes
36
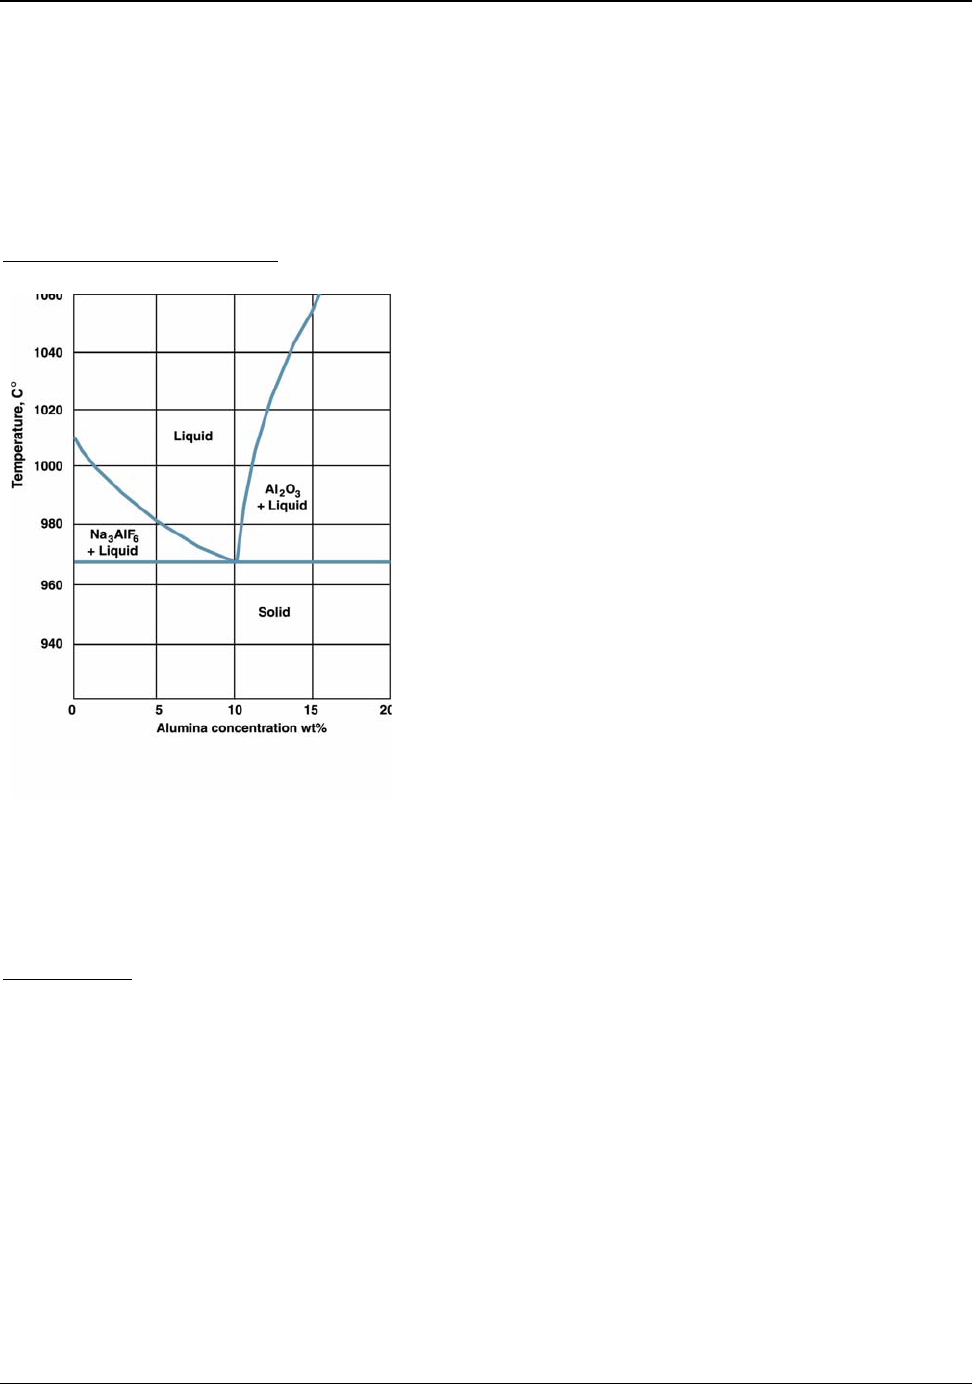
Primary Aluminum Production
Figure 5.8: Cryolite-Alumina Phase Diagram
advantage of the motion of the bath and provides significantly better control of local alumina
concentration. This provides for better current efficiency, fewer anode effects and less erosion caused
by solid alumina. Point feeders have proven to be significantly better and have replaced most feeding
systems in both prebaked and Söderberg cells.
Cell Operating Temperature
Bath chemistry controls the operating temperature of the
Hall-Héroult process. Most commercial cells operate near
960°C (1,233°K). Reducing the cell operating
temperature is an obvious approach to saving energy and
reducing capital costs by lowering insulation
requirements. However, controlling the operating
variables of a cell becomes more critical as temperature is
lowered. Dissolved alumina must be available for
reduction in the bath to have high cell productivity, and
minimal energy-consuming concentration polarization
and anode effects. Lowering the cell temperature lowers
the solubility range for alumina in a cryolite bath. The
solubility or phase diagram for a cryolite alumina system
is V-shaped with temperature on the y-axis and alumina
concentration on the x-axis, as shown in Figure 5.8. Cells
must operate within the V; operations to the left will
precipitate cryolite, and those to the right will precipitate
alumina. Decreasing the temperature narrows the cell
operating range with respect to alumina solubility. In practice, bath chemistry is modified with the
addition of aluminum fluoride, calcium fluoride and other salts. These modifications lower the liquid
phase temperature. However, the basic V-shape of the diagram is retained.
Heat Balance
Controlling the thermal balance of the cell is of prime importance for efficient operation and long cell
life. There is no commercially available material that can retain its insulating value and resist
penetration and chemical attack by cryolite at cell-operating temperatures. Accordingly, the method
used to protect the side walls is to allow some heat loss so that the temperature of the exposed surface
of the cell lining is below the freezing point of the bath. This creates a frozen layer or ledge of bath
that protects the linings. Sidewall heat losses can account for 35 percent to 45 percent of the total heat
loss in a cell.
32
The frozen ledge, due to phase relationships, differs in composition from the bath. If
the temperature rises above steady state, the ledge begins to dissolve and the bath ratio (sodium
fluoride to aluminum fluoride) changes. If the temperature is allowed to fall too much, ledge
formation is excessive, anodes are changed with great difficulty, alumina does not dissolve as readily,
37

Primary Aluminum Production
and the bath ratio is affected. The frozen electrolyte ledge also provides the electrical insulation of the
side walls. The thermal conductivity of frozen cryolite is an order of magnitude lower than that of the
molten cryolite.
Large cell designs require less energy to maintain operating temperatures because of the lower ratio
of cell surface area to volume. This is one factor in the trend to use larger cells in newer smelting
plants.
5.5 Environmental Considerations
The Energy and Environmental Profile of the U.S. Aluminum Industry,
8
compiled by the U.S.
Department of Energy, Office of Industrial Technologies Program, and Life Cycle Inventory Report
for the North American Aluminum Industry,
7
published by The Aluminum Association, provide
detailed environmental information on the overall aluminum production process. The byproducts
generated in the Hall-Héroult process that are of environmental concern can be grouped into three
areas: electrolysis, anode production, and cell waste products.
Electrolysis
Electrolysis green house gas (GHG) emissions in the Hall-Héroult process can be split into three
groups: reduction reaction emissions, carbon dioxide (CO
2
) and carbon monoxide (CO); process
upset perfluorocarbons emissions; and hydrogen fluoride (HF) formed from the inclusion of moisture
(H
2
O) in the raw materials. Hydrogen fluoride gas is almost completely captured and returned to the
cells by the alumina dry scrubbing system used in modern facilities.
The carbon-based emissions associated with the reduction reaction come from three sources:
1. Reaction Products – The reaction produces oxygen that reacts with the carbon anode to produce
CO
2
and small quantities of CO; this reaction produces 1.22 kg of carbon dioxide equivalents for
each kilogram of aluminum produced (Appendix E, Table E.4).
2. Air Burning – The carbon anode loses mass to oxidation with the atmosphere. This produces
0.30 kg of CO
2
for each kilogram of aluminum produced (Appendix E, Table E.4).
3. Electricity Generation and Transmission – The emissions related to the fuels used in
electricity generation for U.S. primary facilities are 5.38 kg of carbon dioxide for each kilogram
of aluminum produced (Appendix E, Table E.2).
38

Primary Aluminum Production
A total of 6.90 kilograms of CO
2
gas is generated from the reduction process for each kilogram of
aluminum produced in an average U.S. primary facility. It should be noted, that electricity-related
emissions for specific potlines vary widely. Potlines operating on electricity obtained from coal-fired
power plants produce 16.0 kg of CO
2
gas for each kilogram of aluminum produced, while potlines
using electricity from hydro-power plants produce close to zero CO
2
gas emissions.
The perfluorocarbon emissions are related to the “anode effect.” If the concentration of alumina in the
bath becomes too low, other reactions between the carbon anode and the bath occur and
tetrafluoromethane (CF
4
) and hexafluoroethane (C
2
F
6
) are generated. These gases have a high global
warming potential (GWP). The GWP of a GHG is a ratio developed to compare the ability of each
greenhouse gas to trap heat in the atmosphere relative to CO
2
gas. The GWP of CF
4
and C
2
F
6
is 6,500
and 9,200 respectively. In other words, 1 kg of CF
4
released to the atmosphere is equivalent in its
warming potential to 6,500 kg of CO
2
.
Aluminum smelting is the principal quantifiable source of perfluorocarbon in the United States. The
U.S. Environmental Protection Agency (EPA) estimates U.S. emissions from aluminum production at
500 metric tons of CF
4
gas and 50 metric tons of C
2
F
6
gas in 2003.
33
In 1995, the aluminum industry
entered into a “Voluntary Aluminum Industry Partnership” (VAIP) with the EPA to reduce
perfluorocarbon emissions by 46 percent during the next decade. Reductions in primary aluminum
production and efficiency improvements to reduce anode effects have reduced emissions of CF
4
and
C
2
F
6
gases since 1990 by 71 percent each. The U.S. aluminum industry and EPA are continuing the
VAIP to seek further GHG reductions beyond the original achievements. The total 2002 U.S.
aluminum perfluorocarbon emissions are 2.0 CO
2
equivalent metric tons per ton of aluminum.
The emissions of perfluorocarbon for older side-fed cells are one order of magnitude higher than the
emissions for cells with point feeders. The industry continues to improve point feed systems.
Ultimately, with the entire industry on point feeders and advanced cell control systems, it should be
possible to virtually eliminate anode effects and, hence, perfluorocarbon generation.
Anode Production
The CO
2
emissions for the carbon anode manufacturing amount to approximately 0.13 kg of CO
2
equivalents per kg of aluminum. In this report, the feedstock portion of the CO
2
emissions for carbon
anode manufacturing are included in the electrolysis. More specific information on this topic can be
found in the comprehensive life cycle information published by The Aluminum Association.
7
39

Primary Aluminum Production
Cell Waste Products
Aluminum electrolysis carbon slime (AECS) and spent potlining (SPL) are unavoidable byproducts
of the aluminum smelting process and are listed in the United States as hazardous wastes.
Development work is underway to mitigate problems associated with spent pot linings. Most
development efforts attempt to combust the carbon linings to destroy any remaining toxic chemicals,
to recover the valuable fluoride as AlF
3
, and to render the remaining material inert through
vitrification. In some areas of the world, SPL is destroyed by combustion in the production of cement.
5.6 Technological Change in the Next Decade
The Hall-Héroult electrolysis process, utilizing a carbon anode and cryolite bath, is a mature
technology. However, gradual improvements in both productivity and environmental performance are
still possible. The typical Hall-Héroult cell life ranges from seven to ten years. Adoption rates of new
technology and systems are governed to some degree by the cell life. There is a slow autonomous
efficiency improvement in the Hall-Héroult process because of the continued adoption of advanced
cell designs, feeding systems, bath composition, control systems, and other practices. This trend has
resulted in a gradual decline in energy consumption in the range of 0.2 percent to 0.5 percent per year.
Energy savings are actively pursued by aluminum producers since electricity costs constitute a high
percentage of total production costs. Since current efficiencies are already over 95 percent, the goal is
generally to reduce the overvoltage in the aluminum cells to increase the overall electric efficiency.
A number of technological and engineering improvement options exist and are being adopted by the
aluminum industry. These include:
• Point Feeders – Point feeders enable more precise, incremental alumina feeding for better cell
operation. Point feeders are generally located in the center of the cell and thereby cut down on the
diffusion required to move dissolved alumina to the anodic reaction sites. The controlled addition
of discrete amounts of alumina enhances the dissolution process, which aids in improving cell
stability and control, minimizing anode effects, and decreasing the formation of undissolved
sludge on the cathode. In the jargon of modern commerce, point feeders enable “just-in-time
alumina supply” to permit optimum cell operation. Point feeder improvements continue to be
made as more accurate cell controllers become available.
• Improved Process Controls – Advanced process controllers reduce the frequency of anode
effects and control operational variables, particularly bath chemistry and alumina saturation, so
that cells remain at their optimal conditions.
• Slotted Anodes – The use of transversally slotted anodes helps to facilitate the removal of anode
gases from underneath the anode. This consequently lowers the overall anode polarization,
allowing for incremental improvements in productivity and cell amperage.
40

Primary Aluminum Production
5.6.1 Changes to the Hall-Héroult Cell and Alternative Technologies
Two innovative technological changes to the Hall-Héroult process, the wetted drained cathode and
the inert anode, are on the near-term horizon for improving energy efficiency. These technologies can,
with cell modifications, be retrofit into existing potlines and supporting infrastructure. Wetted
cathodes are anticipated to lower energy consumption of a Hall-Héroult cell by 18
tf
percent when
compared to a modern Hall-Héroult cell. This report defines a modern cell as one that operates at 4.6
V(dc) and 95 percent current efficiency with the voltage distribution shown in Figure 5.7 (page 32).
The combination of an inert anode with a wetted cathode could provide a 22
tf
percent reduction in
energy consumption and the elimination of cell CO
2
emissions. These technologies are described in
Section 6.0, Advanced Hall-Héroult Cell (page 43), and the energy impacts are calculated in
Appendix M. Multipolar cells using Hall-Héroult chemistry require the use of inert anode and wetted
cathode technologies. The multipolar design allows for a more compact, more productive cell with
significant thermal energy savings. Section 6.0 also describes multipolar electrolytic cells.
Two alternative technologies to the Hall-Héroult process, Carbothermic Reduction and Kaolinite
Reduction, have been studied by several groups for many years. These alternative technologies could
displace existing Hall-Héroult cells in the future. They are described in Section 7, Alternative
Primary Aluminum Processes (page 54). Both these processes could potentially change where and
how the aluminum industry operates, while lowering energy consumption. These alternatives
consume more carbon and have higher onsite carbon emissions than the Hall-Héroult process.
However, their electrical demands are lower which results in lower overall (utility-to-metal) CO
2
emissions. The carbothermic process is anticipated to save 20
tf
percent in energy and be economical
at a much smaller scale than the Hall-Héroult facilities. The kaolinite reduction process is anticipated
to save about 12
tf
percent of the energy required for a modern Hall-Héroult system. This value is
impacted by the need to prepare additional ore mass and carbon for the process. However, the
kaolinite reduction process is commercially interesting because of its lower onsite energy demands,
domestically available ore, and lower-cost raw materials.
Table 5.2 summarizes the estimated energy performance of these near and midterm technologies
(Appendix M, Table M.4). The onsite and tacit energy values in the table allow the processes to be
compared on a reaction, raw material or a complete ore-to-metal basis. The table provides the energy
associated with anode production and feedstock energies. The energy performance of the near-term
technologies, wetted cathode and inert anode, are based on voltage changes in the electrolysis cell
(Appendix M, Tables M.1 and M.2). These voltage changes are supported by theory and reported
experiments and provide a good estimate of energy use. The energy values reported for midterm
technologies, carbothermic reduction and kaolinite reduction, are approximations based on the
theoretical energy requirements and assumed reactor inefficiencies. Both midterm technologies
involve multiple reaction and separation zones. To date, no fully integrated reactor systems have been
built. These midterm energy approximations assume that there is significant heat integration
(recovery) within a facility.
41

Primary Aluminum Production
Table 5.2: Ore-to-Metal Comparison of Near and Mid-Term Technology Improvements
Energy Input kWh/kg Al
Modern Prebaked
Hall-Héroult
Wetted
Cathode
ACD = 2.0
Inert Anode
Wetted
Cathode
ACD = 2.0
Carbothermic
Reduction
Kaolinite
(AlCl
3
)
Reduction
ONSITE ENERGY DEMANDS
Raw Materi
als
Bauxite-Alumina
Kaolinite
Anode Materials
Reaction Carbon
Total
7.59
0.61
8.20
7.59
0.61
8.20
7.59
0.77
8.36
7.59
0
7.59
8.14
0.77
0
8.91
Reaction Energy
Reaction Thermal
Furnace Losses
Reaction
Cell Ohmic
Total Reaction
3.76
10.67
14.43
3.76
7.62
11.38
6.90
6.20
13.11
7.71
1.93
9.63
-1.90
0.40
6.48
2.93
7.91
TOTAL Onsite
Percent Energy
Savings:
22.63 19.58 21.46 17.22 16.82
Reactions
Reactions & anode
Reactions, anodes & ore
21%
20%
13%
9%
8%
5%
33%
36%
24%
45%
42%
26%
TACIT ENERGY DEMANDS
Raw Materi
als
Bauxite-Alumina
Kaolinite
Anode Materials
Reaction Carbon
Total
8.24
6.02
14.26
8.24
6.02
14.26
8.24
0.77
9.00
8.24
8.43
16.67
8.84
0.77
11.37
20.97
Reaction En
ergy
Reaction Thermal
Furnace Losses
Reaction
Cell Ohmic
Total
8.41
23.82
32.23
8.41
17.01
25.41
15.41
13.86
29.27
17.21
4.30
21.52
-1.90
0.60
14.48
6.54
19.72
TOTAL Tacit
Percent Energy
Savings:
46.48 39.67 38.27 38.19 40.69
Reactions
Reactions & anode
Reactions, anodes & ore
21%
18%
15%
9%
21%
18%
33%
44%
18%
39%
46%
12%
Many technical hurdles remain to be solved in these new processes before they become commercially
viable. Wetted cathodes and inert anodes will be adopted as their performances are proven and
existing cells need rebuilding. Industry will require significant demonstration time before adopting
any alternative to Hall-Héroult technology.
42

6. Advanced Hall-Héroult Cells
The Hall-Héroult cell system efficiency can be improved with the adoption of new cell technologies
described below. Wetted drained cathode technology offers the most significant improvement in
energy efficiency, but its adoption will be gradual. Typical cell life is seven to ten years. The industry
will optimize the capital invested in existing cells before retrofitting with new technology. Inert
anodes offer significant environmental benefits, lower maintenance costs, and can be retrofit into the
existing cells. Inert anodes could be adopted more quickly by industry since the carbon anodes are
replaced approximately every four weeks. However, their superior performance must still be proven
in industrial trials.
6.1 Wetted Drained Cathode
Wetted drained cathodes allow the anode-cathode distance to be reduced and are expected to
result in a 20(18
tf
) percent reduction in the electrolysis energy required to produce aluminum.
Molten aluminum does not wet the carbon lining of a Hall-Héroult cell. The aluminum pad rests on an
extremely thin sheet of cryolite bath. This creates an electrical junction similar to the air gap between
two metal bars and causes a small voltage drop. If the bars are clamped tighter, providing better
contact, the junction voltage drop decreases. The thicker (heavier) the aluminum pad is, the thinner
the cryolite sheet becomes and the lower the junction voltage drop. Modifying the cathode surface to
make it more wettable would allow the same electrical contact with a decreased thickness in the pad.
A thinner pad would be more hydrodynamically stable, have lower wave height, and allow a decrease
in the anode-cathode distance (ACD). A decrease in the ACD results in energy savings. A cell lining
that is completely wetted and inert to cryolite would be even more efficient. This combination of
properties would allow the aluminum pad to be drained out of the anode-cathode spacing. Removing
the unstable aluminum pad would allow the ACD to be considerably reduced and provide significant
energy savings.
Titanium diboride (TiB
2
) has been found to be a wettable cathodic material, and several approaches to
incorporate TiB
2
into a Hall-Héroult cell are being studied.
34
Cathodes made wettable with TiB
2
appear to increase cell life by making the cathode less susceptible to penetration by bath material.
This is a considerable benefit, as cell rebuilding costs are a major contribution to primary aluminum
operational costs. Longer life cells also generate less cell lining waste material (spent pot liner) per
ton of aluminum produced. These benefits have to be balanced with the higher costs associated with
the TiB
2
material. Recent evidence also suggests that the wetted cathodes reduce the formation of
sludge (undissolved alumina) on the cell bottom and improve cell operations.
35
43
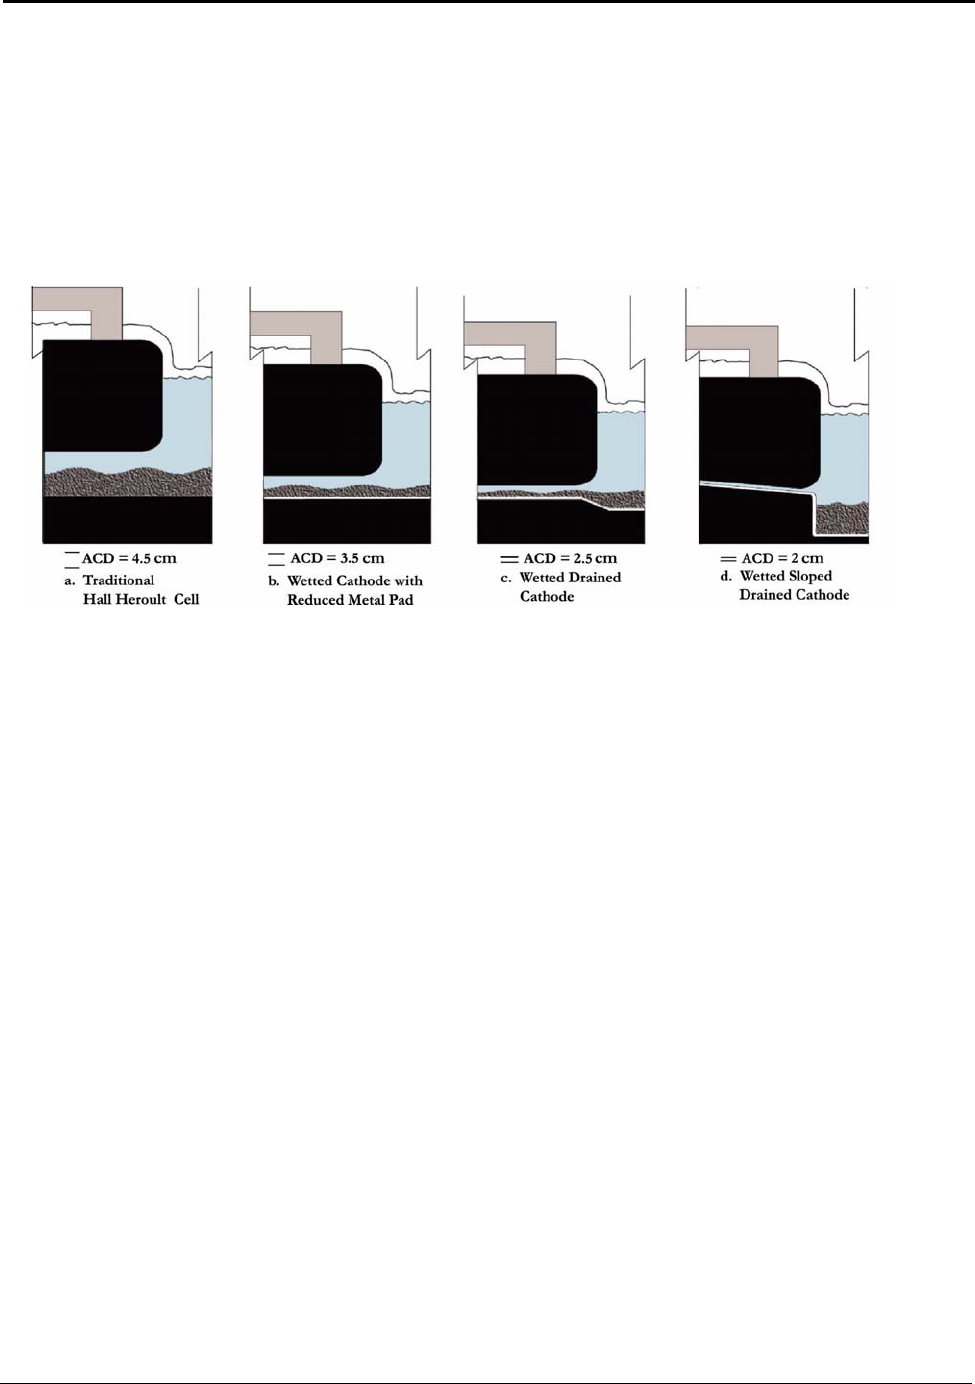
Advanced Hall-Héroult Cells
Several concepts for wetted cathode and draining cells have been proposed. Figure 6.1 shows:
a. a conventional cell,
b. a low metal pad with a wetted cathode in a conventional cell,
c. a hybrid cell with a metal sump, and
d. a fully drained slanted cell.
Figure 6.1: Conceptual Wetted Cathode Cells
The decrease in ACD is shown for each configuration. These configurations offer attractive
alternatives since they can be incorporated as a retrofit to the existing facilities. Some of these
configurations are currently being evaluated in commercial cells and could soon be available.
36
However, as ACD is decreased, less bath is available for circulation and mixing. This requires retrofit
cell designs to account for the change in bath dynamics. Designs must ensure that dissolved alumina
is available across the anode surface to maintain high current efficiency and productivity and to avoid
anode effects. Designs also need to compensate for the heat energy lost due to the lower cell voltage
operation.
Conceptually, the fully-drained inclined cathode design offers the greatest potential for energy
savings. By inclining the anode and cathode a few degrees, the molten metal pad (with all its
complexities) is removed completely to a sump. Without the pad, the anode-cathode-distance is
dimensionally stable and can be narrowed, which significantly reduces the total electrical resistance
of the bath. The alumina feeding of the bath is not compromised because the buoyancy of the gas
bubbles generated during reduction causes bath circulation and fresh alumina is drawn into the ACD
gap and across the electrode face.
44

Advanced Hall-Héroult Cells
6.1.1 Energy Savings for Wetted Cathode Technologies
Decreasing the anode-cathode distance (ACD) results in a proportional decrease in the voltage drop
associated with the electrolytic bath. Energy is saved when the ACD reduction is matched with the
ability to maintain current efficiency and heat balance. The energy savings for the different wetted
designs shown in Figure 6.1 are estimated in Appendix M, Table M.1.
The modern Hall-Héroult cell, shown in Figure 6.1 (a) has an ACD of 4.5 cm and a voltage
distribution similar to that shown in Figure 5.7 (page 32). The traditional cell voltage distribution has
1.75 V(dc) associated with the ACD which accounts for approximately 38 percent of the total 4.60
V(dc) drop across the cell. As discussed in Section 6.1, a wetted cathode provides better electrical
contact between the metal pad and the cathode allowing the ACD to be decreased. If the ACD were
lowered from 4.5 cm to 3.5 cm, as shown in Figure 6.1 (b), the voltage associated with the bath would
be proportionally lowered to 1.36 V(dc). The total voltage would decrease to 4.21 V(dc), which
would provide an 8 percent reduction in the electrical energy usage.
Draining the metal pad into a sump would eliminate the unevenness of the pad and permit an even
smaller ACD with greater energy savings. If the ACD were lowered from 4.5 cm to 2.5 cm, as shown
in Figure 6.1 (c), the voltage associated with the bath would be proportionally lowered to 0.97 V(dc).
The total voltage would decrease to 3.82 V(dc), providing a 16 percent reduction in the electrical
energy usage.
Reducing the ACD is limited by the ability to transport the reactant (dissolved alumina) to the
electrode interface and to remove products (aluminum and carbon dioxide) from the electrode
interface. Sloping the electrode interface slightly as shown in Figure 6.1 (d), removes products and
supplies reactants more effectively by using the buoyancy of the gas to induce bath circulation. It is
estimated that under the best conditions, the ACD for a sloped configuration could be reduced to as
little as 2.0 cm,
37, 38
in which case, the voltage associated with the resistance of the bath would be
0.78 V(dc). The total voltage required would then decrease to 3.63 V(dc), providing nearly a 20
percent reduction in the electrical energy usage.
45

Advanced Hall-Héroult Cells
Table 6.1: Energy Consumption Associated with Various Wetted Cathode Arrangements (kWh/kgAl)
Energy Input kWh/kg Al
Modern Prebaked
Hall-Héroult
ACD = 4.5
Wetted
Cathode
ACD = 3.5
Wetted
Cathode
ACD = 2.5
Wetted
Cathode
ACD = 2.0
ONSITE ENERGY DEMANDS
Raw
Mate
rials
bauxite-alumina
anode materials
TOTAL
7.59
0.61
8.20
7.59
0.61
8.20
7.59
0.61
8.20
7.59
0.61
8.20
Reacion
Energy
Reaction Electrolysis
Cell Ohmic
TOTAL Reaction
3.76
10.67
14.43
3.76
9.45
13.21
3.76
8.23
11.99
3.76
7.62
11.38
TOTAL Onsite
Percent Energy
Savings:
22.63
Reactions
Reactions & anode
Reactions, anodes & ore
21.41
8%
8%
5%
20.19
17%
16%
11%
19.58
21%
20%
13%
TACIT ENERGY DEMANDS
Raw
Materi
als
bauxite-alumina
anode materials
TOTAL
8.24
6.02
14.26
8.24
6.02
14.26
8.24
6.02
14.26
8.24
6.02
14.26
Reaction
En
ergy
Reaction Electrolysis
Cell Ohmic
TOTAL Reaction
8.41
23.82
32.23
8.41
21.09
29.50
8.41
18.37
26.78
8.41
17.01
25.41
TOTAL Tacit
Percent Energy
Savings:
46.48
Reactions
Reactions & anode
Reactions, anodes & ore
43.76
8%
7%
6%
41.03
17%
14%
12%
39.67
21%
18%
15%
Table 6.1 lists the data and measures the impact of the various wetted cathode arrangements.
Depending upon the cell design, the reduction energy impact is expected to be as high as 18
tf
percent.
6.1.2 Environmental Impacts for Wetted Cathode Technologies
The byproducts generated in the Hall-Héroult process that are of environmental concern are grouped
into three areas: electrolysis, anode production, and cell waste products. Of these, the wetted cathode
technology impacts electrolysis and cell waste products.
Electrolysis
Electrolysis green house gas (GHG) emissions can be split into three groupings: reduction reaction
emissions, process upset perfluorocarbons emissions and hydrogen fluoride emissions from the bath.
Wetted cathode technology does not change the emissions related to process upsets or bath emissions.
The reduction reaction emissions come from three sources: the reaction products, anode air burning
46

Advanced Hall-Héroult Cells
and electricity generation and transmission. Wetted cathodes do not change the reaction products or
anode air burning. Both wetted and traditional cathodes will produce 1.22 kg of carbon dioxide from
the reduction reaction (2Al
2
O
3
+ 3C 4Al + 3CO
2
), 0.30 kg of carbon dioxide for each kilogram
of aluminum produced from air burning of the carbon anode, and 0.12 kg of carbon dioxide for each
kilogram of aluminum for the fuels associated with manufacturing the anodes.
The environmental benefit of wetted cathode technology is related to the emissions associated with
the electricity production. A wetted cathode lowers the electrical energy requirement, which in turn
reduces the emissions related to the fuels used in electricity generation and transmission. The
electricity production (14.4 kWh/kg of aluminum) for a modern Hall-Héroult cell emits 5.04 kg of
carbon dioxide equivalents (CDE) for each kilogram of aluminum produced. A wetted-sloped
cathode cell with a 2.0 cm ACD will lower the CDE emission associated with electricity generation
and transmission by nearly 21 percent to 3.98 kg CDE/kg of aluminum produced. This lowers the
total CDE emissions associated with a wetted-sloped cathode cell from 10.62 kg CDE/kg to 7.90 kg
CDE/kg of aluminum produced (Appendix E, Table E.4).
Cell Waste Products
One of the benefits of using wetted cathodes is longer cell life. Rebuilding cells less frequently will
lower the quantity of spent pot liner waste per unit of aluminum produced.
6.2 Hall-Héroult Inert Anode
Carbon anodes are consumed in the Hall-Héroult process, making the continuous manufacture of new
anodes and constant changing of the consumed anodes necessary. Anode changing upsets the
stability, production, and energy efficiency of the cell. For more than 100 years, Charles Hall and
other primary metal producers have attempted to find an inert anode that would eliminate the
manufacturing and handling of consumable anodes.
39
The material demands of an inert anode require
that it be highly conductive, and be thermally and mechanically stable at 800°C to 1,000°C. Further, it
should not react or dissolve to any significant extent in the cryolite, or react or corrode in the 800°C to
1000°C oxygen containing atmosphere. Any undesirable reaction with the bath must occur at a very
slow rate since this will result in the anode material contaminating the aluminum product.
Few materials are truly inert under the extreme conditions of a cell. Research has focused on three
classes of inert anode materials: ceramics, cermets, and metals. The challenges to finding the most
efficient material are substantial. Ceramics typically have poor thermal-shock resistance, are not
mechanically robust, display poor electrical conductivity, and are difficult to connect electrically.
Metals have good thermal, mechanical, and electric properties, but are attacked by the hot oxidizing
atmosphere. Metal oxides are somewhat soluble in cryolite and can resist the hot oxygen atmosphere,
but they exhibit lower electrical conductivity than metals. Once in solution, they electrochemically
47
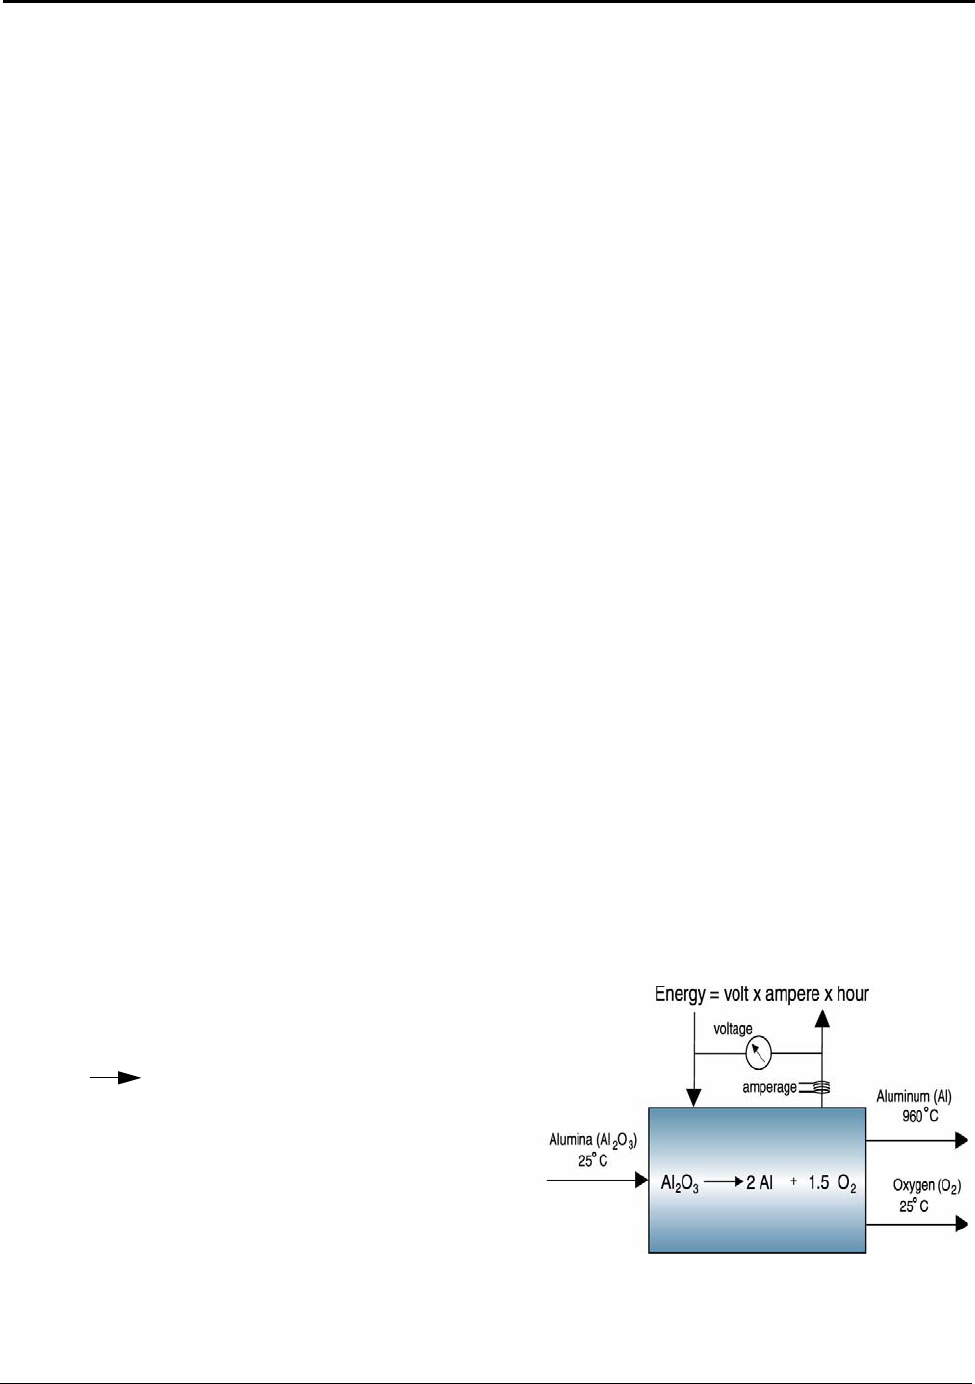
Advanced Hall-Héroult Cells
reduce and contaminate the aluminum metal. Metal oxide solubility can be reduced dramatically in
cryolite by operating with a bath saturated in aluminum oxide, alumina. However, this presents
significant bath feeding challenges. Cermets combine the advantages and disadvantages of ceramics
and metals. In addition to overcoming technical hurdles, the likely higher-cost of manufacturing inert
anodes of commercial size must be compensated with longer life, lower energy consumption, and
higher productivity.
An inert anode would enable greater control of the critical anode-cathode distance (ACD), which
represents the largest voltage drop in the cell (Figure 5.7 on page 32). When used in conjunction with
a drained cathode, it is estimated that an inert anode may save up to 21
tf
percent of the energy required
for reducing aluminum. Inert anodes offer a major environmental advantage and the potential of
producing a valuable coproduct. Replacing the carbon anode with an inert material results in oxygen
being discharged rather than carbon dioxide. If a significant market for oxygen is near the reduction
facility, the oxygen produced could be collected and sold as a coproduct. Carbon credits are an
unknown but potentially large economic force that could hasten the development of inert anodes.
Inert anode technology could potentially be retrofit into the existing cells with limited changes and
use the existing alumina and aluminum handling infrastructures. Some electrical infrastructure
changes would be required since the inert anode will operate at a higher voltage than the carbon
anodes. Since frequent access to the cells is not required for changing anodes, cells can be sealed
more effectively to provide better gas collection and treatments.
Notable progress in the production and testing of potential inert anode materials has been made in
recent years.
40
Some companies are now conducting trials with relatively stable materials that offer
the promise of inert anode performance. Using an inert anode and wetted cathode could also lead to
the design of multipolar, vertical electrode cells, which would increase productivity and further
reduce energy usage.
6.2.1 Theoretical Energy for Hall-Héroult Inert Anode
The theoretical minimum energy requirement for an
ideal Hall-Héroult cell using an inert anode can be
calculated from the thermodynamics of the reaction,
2Al
2
O
3
4Al + 3O
2
(Appendix J, Table J.2).
The production of aluminum shown in Figure 6.2
assumes that the reactant (alumina) enters the cell at
25°C, the oxygen byproduct leaves the cell at 25°C,
and the aluminum product leaves the cell as molten
metal at 960°C. The theoretical minimum energy
requirement is calculated under perfect conditions, an
Figure 6.2: Theoretical Energy Schematic for
environment with no reverse reactions, parasitic
Inert Anode
48

Advanced Hall-Héroult Cells
reactions, heat/energy losses external to the system, or limitations to the ionic species reacting at the
electrodes. The results show that the energy required to drive the reaction forward (∆G) is 8.16 kWh/
kg, the thermal energy (∆H – ∆G) required to maintain equilibrium is 0.48 kWh/kg and the thermal
energy (C
p
) associated with the molten aluminum is 0.39 kWh/kg of aluminum. The total theoretical
minimum energy requirement for an inert anode adds up to 9.03 kWh/kg of aluminum. (Note: If the
O
2
gas emission at 960°C is included, the total theoretical minimum energy requirement is 9.30 kWh/
kg of aluminum).
In actual cell operations, current efficiencies of less than 100 percent can result from reverse
oxidation reactions between part of the metallic aluminum and the oxygen gas produced by the
reaction. Inert anode cell designs must ensure that oxygen bubbles are discharged from the system
without contacting the molten aluminum being produced.
6.2.2 Comparative Energy Requirements for Carbon and Inert Anode Hall-Héroult Cells
The theoretical minimum energy requirement for an inert anode reaction is 51 percent higher than the
carbon anode requirement. Both, the Hall-Héroult carbon and inert anode processes, use the same
starting raw material, alumina, and require the same total theoretical energy, 9.03 kWh/kg of
aluminum. The Hall-Héroult carbon anode is consumed as part of the reduction reaction and provides
part of the energy to the system. The energy provided by oxidizing the carbon (3.04 kWh/kg of
aluminum) lowers the carbon anode system’s theoretical energy requirement to 5.99 kWh/kg of
aluminum. The inert anode must supply the full minimum energy requirement for alumina reduction.
The inert anode system requires 2.2 V(dc) compared to the Hall-Héroult reaction’s 1.2 V(dc).
41
This
increase in reaction voltage supplies the additional 3.04 kWh/kg of aluminum minimum energy
required by the inert anode system to reduce alumina.
Although the inert anode reaction voltage is 1 V(dc) higher than a carbon anode Hall-Héroult cell,
three factors are expected to provide the inert anode with an overall improved operational energy
performance than the carbon anodes:
a. elimination of carbon anode manufacturing,
b. reduction of anode polarization overvoltage, and
c. reduction in ACD that results from a stable anode surface.
The impacts of these three factors are shown in Table 6.2 and calculations are presented in Appendix
M, Table M.2.
Elimination of Carbon Anode
The energy inherent in the carbon and required for carbon anode manufacturing exceeds the
additional theoretical energy need for the inert anode system. A complete account of the energy
associated with the carbon-anode production shows that 6.02
tf
kWh/kg of aluminum produced is
49

Advanced Hall-Héroult Cells
associated with the anode’s manufacture and fuel value. This value is higher than the 3.04 kWh/kg of
aluminum that the carbon anode supplies in the reaction for theoretical reduction. Since the actual
values for manufacturing inert anodes are unknown at this time, a conservative estimate is made in
Appendix M, Table M.3. This estimate, approximately 0.77 kWh/kg of aluminum, provides a basis
for comparing the two processes. The total energy associated with an inert anode operating cell is
0.77
tf
kWh/kg for anode manufacturing, 3.14 kWh/kg for the onsite additional voltage requirement,
and 3.86
tf
kWh/kg for the generation and transmission losses associated with the additional anode
voltage. The inert anode requires 7.77
tf
kWh/kg of aluminum produced, 29
tf
percent more than the
tacit energy associated with the Hall-Héroult carbon-anode requirement.
Table 6.2: Energy Impact of Inert Anode Technology
Energy Input kWh/kg Al
Modern
Prebaked Hall-
Héroult
ACD = 4.5
Inert Anode
a) Elimination
of Carbon
Anode
ACD = 4.5
Inert Anode
a) Elimination of
Carbon Anode
b) Low Polariza-
tion
ACD = 4.5
Inert Anode
a) Elimination of
Carbon Anode
b) Low Polarization
c) Wetted Cathode
ACD = 2.0
ONSITE ENERGY DEMANDS
Raw
Mate
rials
bauxite-alumina
anode materials
TOTAL
7.59
0.61
8.20
7.59
0.77
8.20
7.59
0.77
8.20
7.59
0.77
8.20
Reacion
Energy
Reaction Electrolysis
Cell Ohmic
TOTAL Reaction
3.76
10.67
14.43
6.90
10.67
17.57
6.90
9.25
16.15
6.90
6.20
13.11
TOTAL Onsite
Percent Energy
Savings:
22.63
Reactions
Reactions & anode
Reactions, anodes & ore
25.76
-22%
-22%
-14%
24.35
-12%
-13%
-8%
21.30
9%
8%
6%
TACIT ENERGY DEMANDS
Raw
Materi
als
bauxite-alumina
anode materials
TOTAL
8.24
6.02
14.26
8.24
0.77
9.00
8.24
0.77
9.00
8.24
0.77
9.00
Reaction
En
ergy
Reaction Electrolysis
Cell Ohmic
TOTAL Reaction
8.41
23.82
32.23
15.41
23.82
39.23
15.41
20.67
36.08
15.41
13.86
29.27
TOTAL Tacit
Percent Energy
Savings:
46.48
Reactions
Reactions & anode
Reactions, anodes & ore
48.23
-22%
-5%
-4%
45.08
-12%
4%
3%
38.27
9%
21%
18%
50
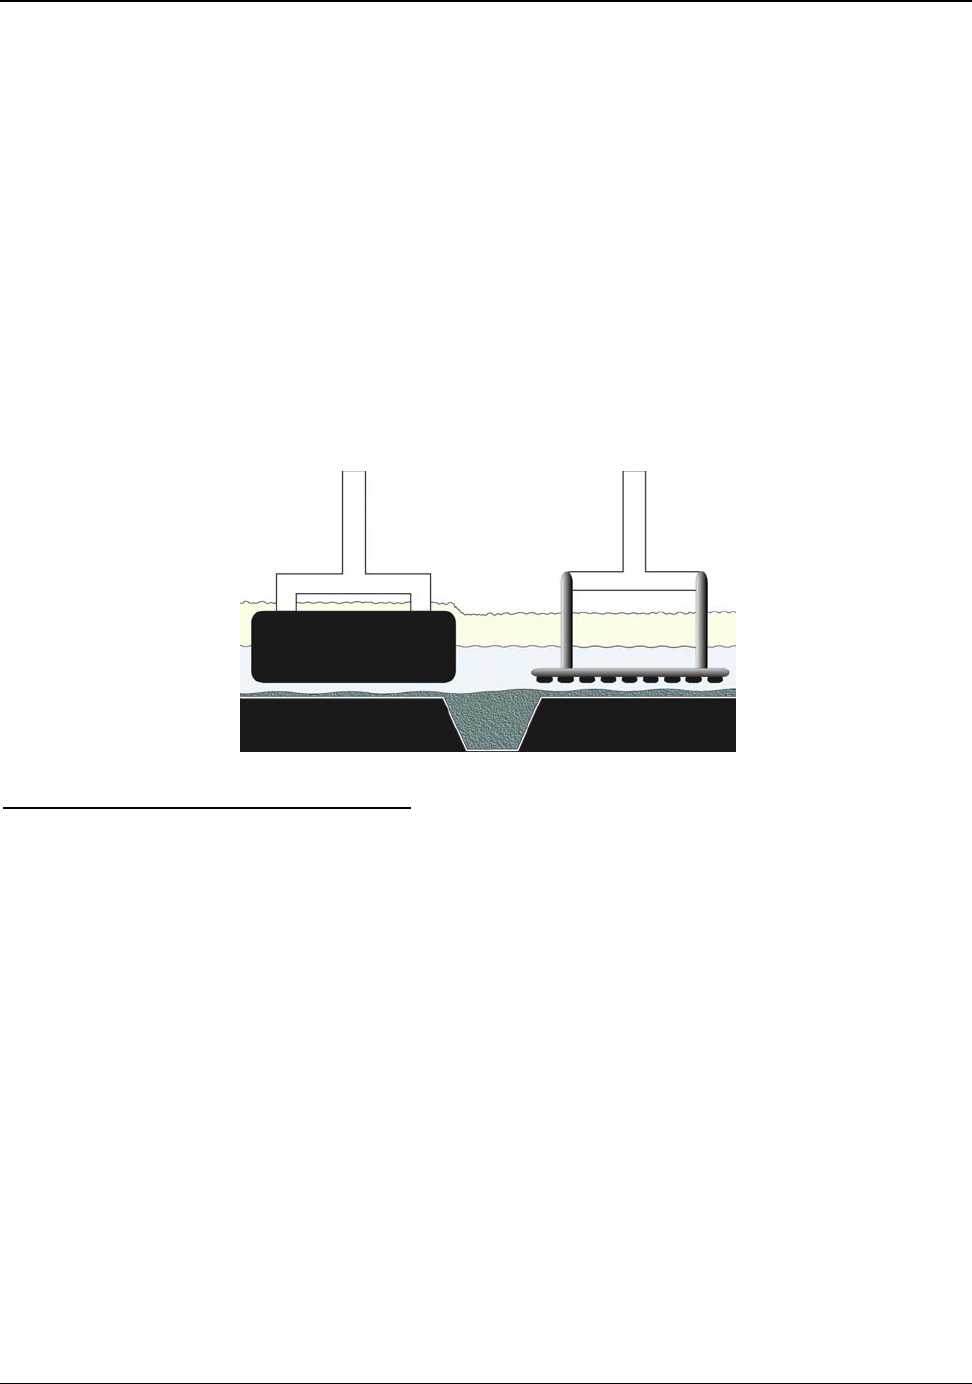
Advanced Hall-Héroult Cells
As gas molecules evolve on the anode surface, they coalesce and form bubbles, which creates a layer
of bubbles adjacent to the horizontal electrode. These bubbles jostle and move along as a result of
their density difference with the bath and by the motion imparted from the aluminum pad.
Experimental evidence shows that the oxygen gas evolved in the bath has a different froth/foam
dynamic than carbon dioxide. The molar volumes of gases that result from the reduction reaction are
equal. However, because oxygen is 27 percent lighter than carbon dioxide, less mass moves through
the electrode area. The physical properties, in practice, contribute to a lower anode overvoltage.
42
The
inert anode can also be shaped to allow for better release of the oxygen generated (Figure 6.3). The
lower overvoltage of the inert anode, compared to a carbon anode, reduces the energy consumed. The
overvoltage reduction combined with the elimination of carbon anode manufacturing, is estimated to
provide a 5 percent energy improvement.
Figure 6.3:Inert Anode
Inert Anode-Wetted Cathode Combination
A more stable inert anode surface will allow the anode-cathode distance (ACD) to be reduced and
will be simpler to control. Carbon anodes must be lowered as they are consumed to maintain an
optimal ACD. Combined with a wetted cathode, the inert anode probably offers the greatest potential
for bath voltage reduction. Inert anodes will also eliminate cell disruptions that occur with carbon
anode changing.
Overall, inert anodes, when combined with a wetted cathode and compared to the traditional Hall-
Héroult cells, are expected to provide
• a 10 percent reduction in operating costs (elimination of carbon anode plant and labor costs
associated with replacing anodes),
43
• a 5 percent increase in cell productivity,
43
and
• a 41 percent reduction in greenhouse gas emissions (Appendix E, Table E.4)
51
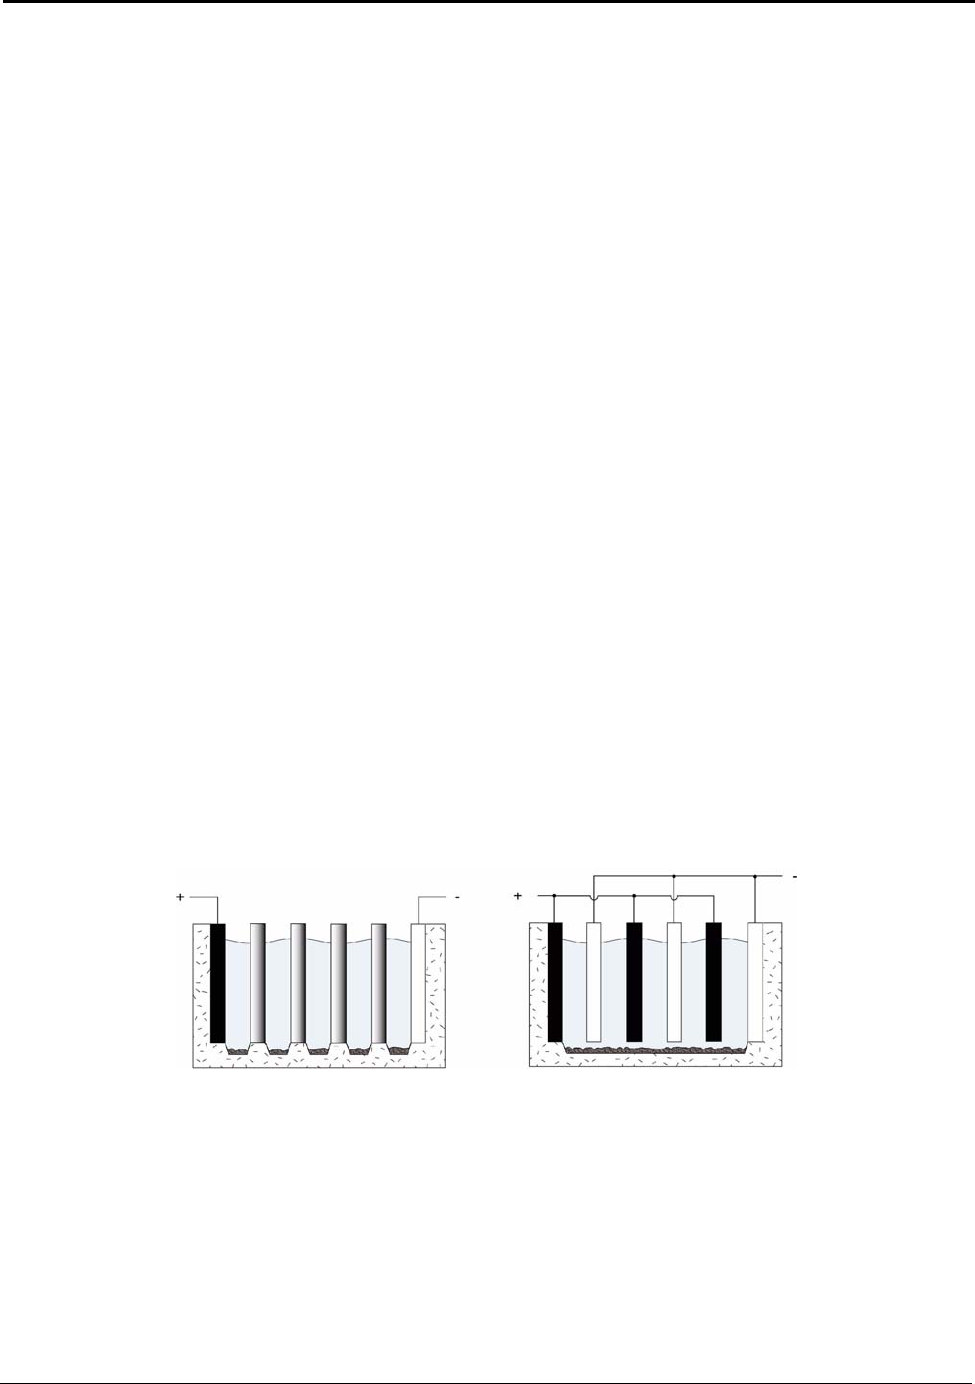
Advanced Hall-Héroult Cells
These practical scenarios provide the inert-anode cell with an overall lower-energy requirement than
the state-of-the-art Hall-Héroult cell. However, the challenging engineering designs for the inert-
anode cell systems must incorporate effective approaches for minimizing thermal losses from the
reduction cells, the current-carrying bus systems, and the connectors external to the cell.
6.3 Multipolar Cells
Present Hall-Héroult industrial cells consist of a single cathode surface and essentially a single anode
surface immersed horizontally one over the other in a bath. This single-pole arrangement makes
aluminum reduction a capital-intensive process. Use of multipolar electrolytic cells would greatly
increase productivity-per-unit-reactor volume by placing multiple electrodes in a single reactor. This
arrangement would also provide better control of heat losses. For practical engineering reasons, a
multipolar cell requires that the ACD be stable, which in turn requires an inert/stable anode. To date,
the lack of suitable materials of construction have ruled out multipolar cells using molten fluoride
electrolytes.
Two variations of electrochemical multipolar cells are possible, as shown conceptually in Figure 6.4.
One system uses a cell with an anodic surface on one side, multiple bipolar electrodes in the center
portion, and a cathodic surface on the opposite side, as in Figure 6.4 (a). One surface of a bipolar-
electrode plate acts anodically, while the opposite surface acts cathodically. Bipolar electrodes must
be electrically isolated and sealed to the cell walls to avoid bypass current efficiency losses.The
second system uses independent pairs of electrodes immersed in the same cell, as shown in Figure 6.4
(b). Multipolar cell designs are complicated by the need to remove liquid metal and collect the
gaseous reaction products.
Figure 6.4:Multipolar Cells
(a) (b)
The bipolar-multipolar concept was successfully demonstrated for electrolytic aluminum chloride
reduction.
44
In 1976, Alcoa Inc. began operating a multipolar, prototype plant with a capacity of over
18,000 kg of aluminum per day. Alcoa obtained 90 percent current efficiency at 9.26 kWh/kg of
aluminum. The Alcoa multipolar cell was electrically 40 percent more efficient than a present day
Hall-Héroult cell. However, the prototype plant was eventually shut down because of the combination
52

Advanced Hall-Héroult Cells
of the costs to produce anhydrous aluminum chloride feed, the failure to reach full design capacity,
the need to remove and destroy trace amounts of chlorinated biphenal byproducts, the reactor capital
costs, and general maintenance costs.
45
The Alcoa cell had distinct technical advantages over the classic Hall-Héroult cell: it worked at
substantially lower temperatures, it had relatively high current densities, its carbon anodes were not
consumed, it had no fluoride emissions, and the plant had a smaller footprint. The improvement in
electrical energy efficiency was a result of the higher electrical conductivity of the electrolyte and the
small interpolar distance. The cell feed consisted of 3 percent to 10 percent of purified aluminum
chloride (AlCl
3
), obtained by carbochlorination. The electrolyte consisted mainly of sodium chloride
and potassium chloride, or lithium chloride. Electrolysis was performed in a sealed cell consisting of
12 to 30 bipolar carbon electrodes stacked vertically at an interpolar distance of 1 cm. The electrodes
remained immersed in the electrolyte at an operating temperature of 700°C ± 30°C. A current density
of 0.8 A/cm
2
to 2.3 A/cm
2
and a single-cell voltage of 2.7 V(dc) were typical operating conditions. An
operating life of nearly three years was claimed for the electrodes.
A useful feature of the Alcoa cell was that the buoyant chlorine created a flow in the narrow gap
between the bipolar electrodes. This aided in sweeping the aluminum from the cathodes and
enhancing the formation of aluminum droplets. The gas also helped maintain a continuous flow of
electrolyte across the cell. Chlorine was collected at the top of the cell and molten aluminum was
collected in the bottom. The chlorine gas generated by the reduction reaction was completely recycled
to produce new aluminum chloride feed for the cell.
A Hall-Héroult multipolar design, involving multiple inert anodes and wettable cathodes arrayed
vertically in a fluoride electrolyte cell, has been explored by Northwest Aluminum.
46
In this concept,
the operating temperature was 750°C, much lower than Hall-Héroult technology. Alumina saturation
at the lower temperature of the electrolyte bath was maintained by controlling a suspension of fine
alumina particles in the bath. This technology offered all the benefits of reduced energy consumption
(low ACD), elimination of carbon anodes and associated emissions, as well as a significant increase
in productivity per cell, as a result of the multipolar design. This work came to an unfortunate halt
with the closure of Northwest Aluminum. However, recent multipolar cell work done at Argonne
National Laboratory shows much promise, although it is still in the early stages.
53

7. Alternative Primary Aluminum Processes
Carbothermic reduction of alumina and chloride reduction of kaolinite clay have been under study for
more than 40 years. These technologies have the potential to be alternative processes to the Hall-
Héroult process. The non-electrolytic, carbothermic reduction of alumina is estimated to produce
aluminum with significantly less energy consumption, reduced emissions, and lower investment
costs. Multipolar-reduction technology to produce aluminum using aluminum chloride obtained from
low-grade domestically available clays is also estimated to reduce energy consumption, capital costs,
and emissions. The aluminum industry has yet to adopt these processes for producing aluminum,
mainly because of the uncertain capital and operating economics associated with large-scale plants.
7.1 Carbothermic Technology
Carbothermic reduction of alumina is the only non-electrochemical process that has shown potential
for aluminum production. This technology has been an industry objective and the subject of extensive
research for more than forty years.
47
Carbothermic technology is projected to produce aluminum from
ore at 38.2
tf
kWh/kg or 18 percent below a modern Hall-Héroult carbon-anode technology (Table 7.1
on page 57).
Carbothermic reduction produces aluminum using a
chemical reaction that takes place within the volume
Volumetric Vs. Area Processing
of a reactor. This volumetric reaction requires much
less physical space than the area reaction of Hall-
Héroult. These properties give carbothermic
technology a smaller footprint and make it much less
The Hall-Héroult reduction electrolytic
reaction occurs on the surface of an
electrode in a reactor (cell). Capacity is
doubled simply by doubling the electrode
dependent on the economies of scale (large and long
surface area. Non-electrolytic reduction
potlines) required for an economically efficient Hall-
chemistry occurs within a volume of fluid.
Héroult facility. If successful, this technology could
A spherical volumetric reactor can be
significantly change the structure of the aluminum
industry, allowing industry the freedom to relocate
from regions of inexpensive power to centers of
doubled by increasing its radius 1.4 times.
This difference between volume and
surface area reactions provides significant
savings in capital cost for a reactor.
manufacturing. Aluminum production “mini-mills”
could be placed adjacent to or within aluminum
casting facilities. These “mini-mill” installations could provide molten aluminum and/or specifically
alloyed metal directly to the casting operations. This would provide additional energy, economic, and
environmental benefits to the industry.
54
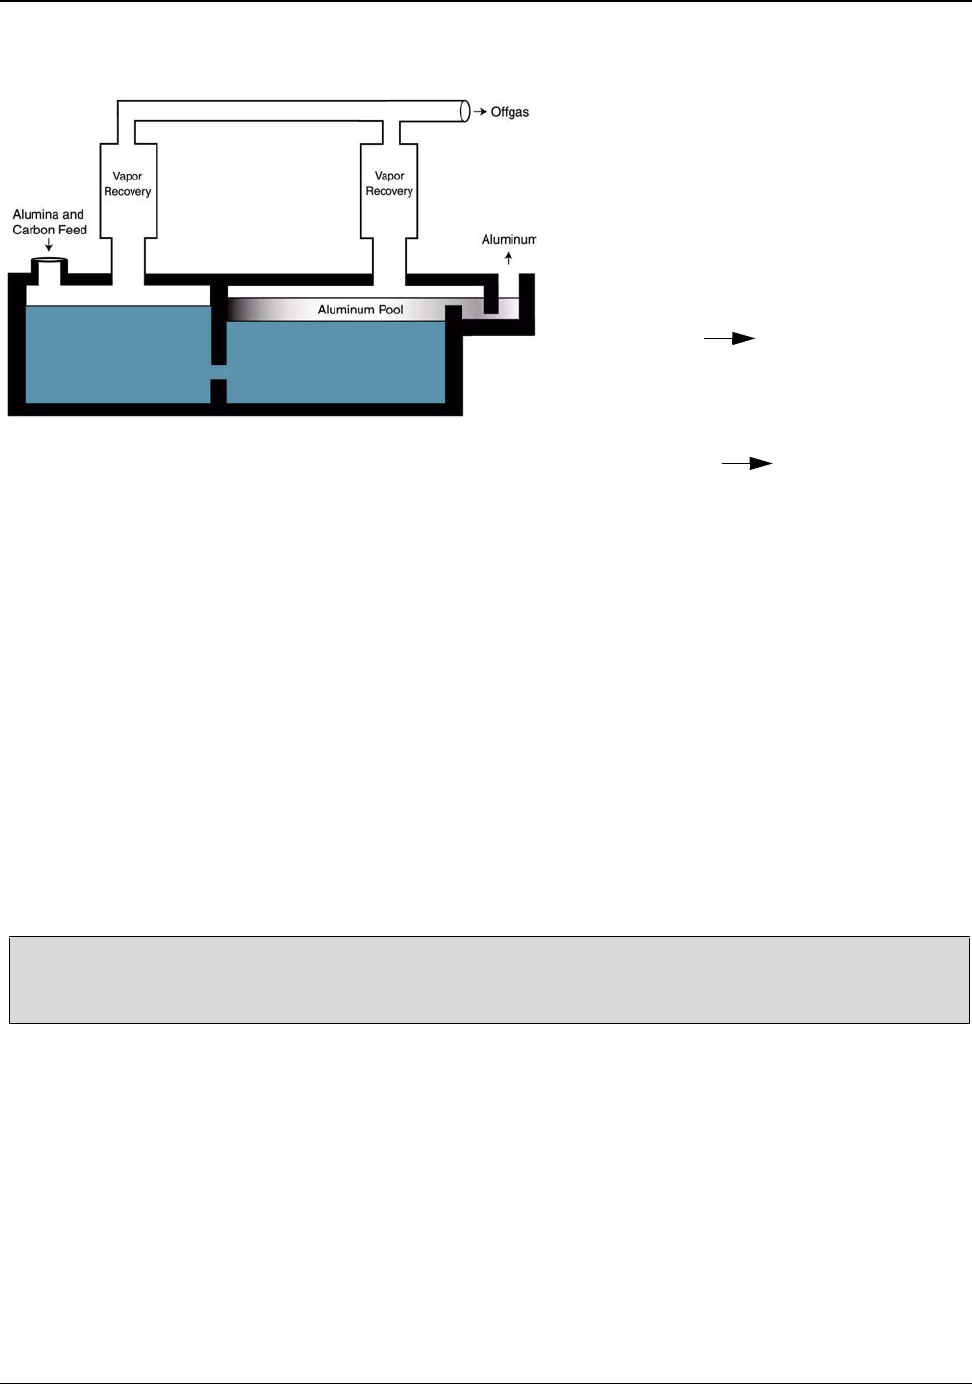
Alternative Primary Aluminum Processes
Figure 7.1: Carbothermic Reactor
Carbothermic reduction of alumina to
aluminum is a multi-step chemical reaction
process. The thermodynamic optimization
for the reactions requires a multi-zone
furnace operating at very high temperatures
(Figure 7.1). In the first stage net reaction,
alumina and carbon form an alumina-
aluminum carbide slag at ~1,900°C
(2Al
2
O
3
+ 9C Al
4
C
3
+ 6CO). In
the next stage net reaction, aluminum
carbide is reduced by alumina to form
aluminum metal at ~2,000 °C,
(Al
4
C
3
+ Al
2
O
3
6Al + 3CO
). The
thermodynamics (temperatures and chemical equilibria) of these reactions are very complex. A
significant portion of aluminum evolves as gas phase components (Al and Al
2
O) at these operating
temperatures. Careful process control is necessary to minimize the generation of volatiles. Recovery
of these components in the form of Al
4
C
3
in a vapor recovery system is required for the process to be
economically viable. If the Al and Al
2
O back react with CO to form Al
2
O
3,
then the productivity of
the process is decreased and the Al
4
C
3
required to satisfy the process stoichiometry is deficient.
The complex thermodynamic controls, sophisticated equipment, and construction materials required
to successfully develop an economical commercial system have eluded the industry so far. Current
R&D efforts are reevaluating carbothermic technology in hopes of capitalizing on new, advanced,
high-intensity, electric-arc furnace technology, advanced thermodynamic and system modeling
techniques, and an improved understanding of the process dynamics.
48
7.1.1 Theoretical Energy for Carbothermic Reduction of Alumina
The theoretical minimum energy requirement for producing aluminum by the carbothermic
reduction of alumina is 7.32 kWh/kg.
Carbon is a reactant in the carbothermic reduction reaction process and supplies part of the energy
necessary to drive the reaction forward. This gives the carbothermic reduction process a lower
theoretical energy requirement than the direct electrolytic reduction of alumina to aluminum.
55
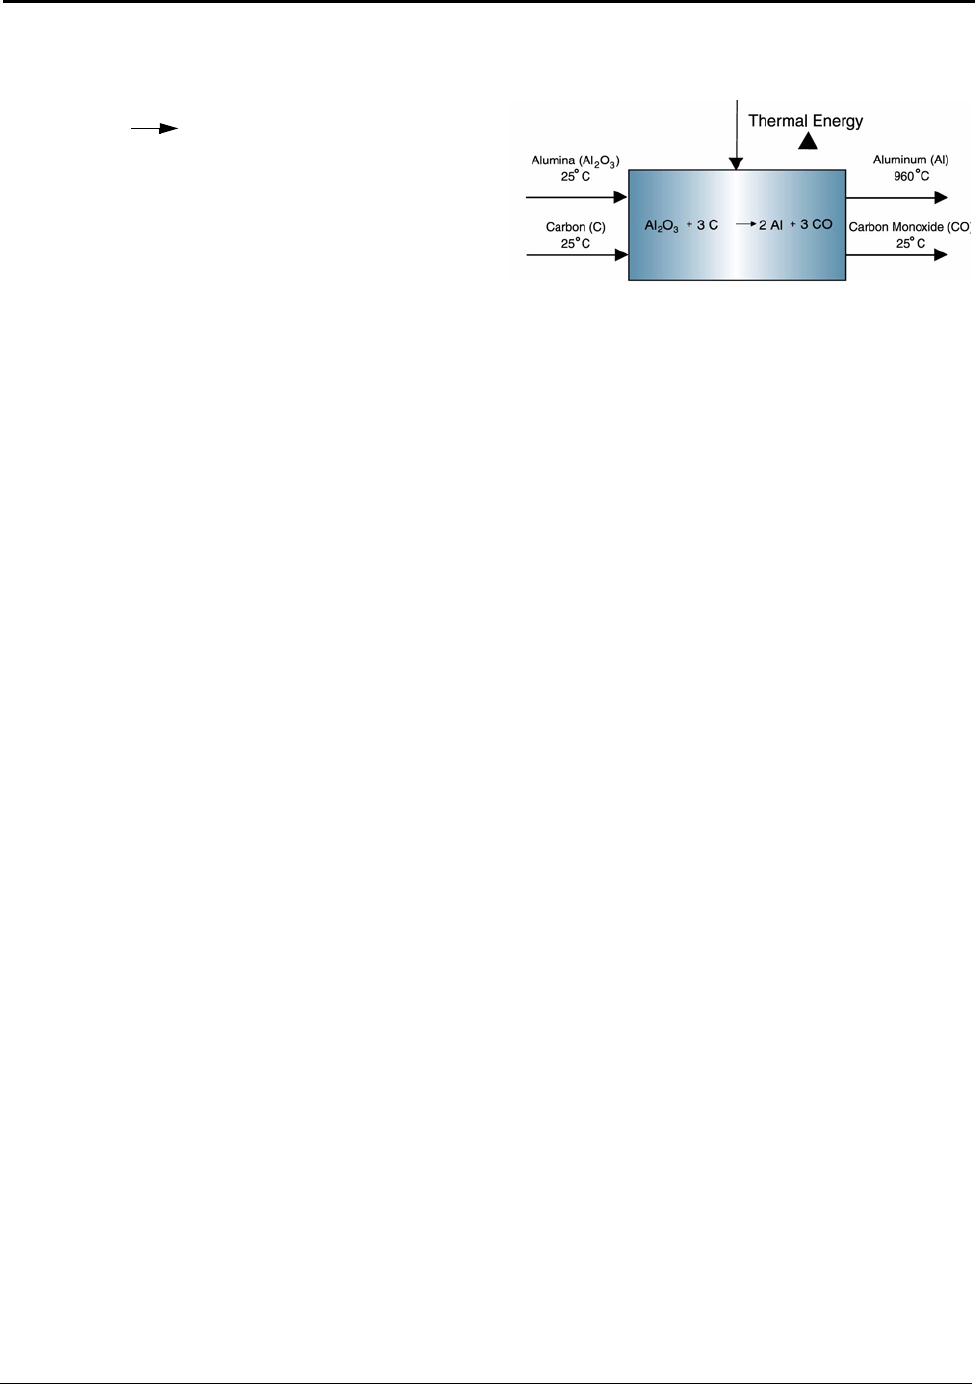
Alternative Primary Aluminum Processes
The net reaction for the carbothermic reduction is
Al
2
O
3
+ 3C 2Al + 3CO. It is assumed that
the reactants (alumina and carbon) enter the reactor
system boundaries at 25°C, the carbon monoxide
byproduct leaves at 25°C, and the aluminum
product leaves the reactor system as molten metal at
960°C. The assumed molten metal temperature is
lower than the actual reactor metal discharge
temperature. Theoretically and practically, the
Figure 7.2: Carbothermic Theoretical Minimum
Energy
energy in the higher temperature reactor discharge
can be recovered efficiently (e.g., by mixing high temperature reactor aluminum with solid metal
scrap to recover the heat energy and lower the temperature). To compare the theoretical limits of the
various aluminum production processes, the same molten product temperature of 960°C is used
throughout this report. The theoretical reaction occurs under perfect conditions when there are no
reverse reactions, parasitic reactions, or heat/energy losses external to the system.
The calculation of theoretical minimum energy requirement for the carbothermic reaction is detailed
in Table J.3, Appendix J. The results show that the energy required to drive the reaction forward (∆G)
is 6.03 kWh/kg and this energy is supplied as thermal energy vs. the electrical energy used in a Hall-
Héroult cell. The thermal energy (∆H – ∆G) required to maintain equilibrium is 0.90 kWh/kg and the
thermal energy (C
p
) associated with the molten aluminum is 0.39 kWh/ kg of aluminum. The
theoretical minimum energy requirement under these conditions adds up to 7.32 kWh/kg of
aluminum. (Note: If the CO gas emission at 960°C is included, the total theoretical minimum energy
requirement is 7.51 kWh/kg of aluminum).
The carbon monoxide byproduct has a fuel value and would likely be captured and used to supply
thermal energy to the carbothermic facility.
7.1.2 Comparative Benefits for Carbothermic Reactors and Hall-Héroult Cells
Electric furnace technology provides 90 percent thermal efficiency in many applications. Heat losses
are limited to conduction and radiation losses from the furnace shell. Flue gas heat losses are
eliminated, as are any undesired reactions between flue gases and molten aluminum metal. It is
reasonable to assume that the carbothermic furnace/reactor can be designed with more than 85
percent thermal efficiency. If the thermodynamics of the reaction and offgas recovery can be
controlled within 95 percent of the theoretical requirements, the electrical energy required for an
operating carbothermic reactor would be (7.32 kWh/kg ÷ (0.85 x 0.95)) or 9.07 kWh/kg of aluminum
produced. This represents a 37 percent reduction in energy use when compared to the 14.4 kWh/kg of
aluminum from a modern Hall-Héroult Cell. Table 7.1 (page 57) shows the onsite and tacit energy
savings potential of carbothermic technology.
56

Alternative Primary Aluminum Processes
In addition to electrical energy savings, carbothermic technology is expected to provide other
benefits, like
• a reduction in capital costs by 50 percent or more as a result of volumetric processing through
high-intensity smelting;
• a reduction in production costs by 25 percent through lower electrical demand and elimination of
carbon anode manufacturing and handling,
• the production of a high purity CO/CO
2
stream for coproduct sale or energy integration,
• the potential to use small blocks of electrical power due to high turn-down ratio, and
• the potential of widely locating “mini-mills” with integral, captive smelters delivering molten
metal.
Table 7.1: Comparison of Hall-Héroult and Carbothermic Reduction
Energy Input kWh/kg Al
Modern Prebaked
Hall-Héroult
Carbothermic
Reduction
ONSITE ENERGY DEMANDS
Raw
Materi
als
Bauxite-Alumina
Kaolinite
Anode Materials
Reaction Carbon
Total
7.59
0.61
8.20
7.59
0
7.59
Reaction
Energy
Reaction Thermal
Furnace Losses
Reaction
Cell Ohmic
Total Reaction
3.76
10.67
14.43
7.71
1.93
9.63
TOTAL Onsite
Percent Energy
Savings:
22.63 17.22
Reactions
Reactions & anode
Reactions, anodes & ore
33%
36%
24%
TACIT ENERGY DEMANDS
Raw
Materi
als
Bauxite-Alumina
Kaolinite
Anode Materials
Reaction Carbon
Total
8.24
6.02
14.26
8.24
8.43
16.67
Reaction
En
ergy
Reaction Thermal
Furnace Losses
Reaction
Cell Ohmic
Total
8.41
23.82
32.23
17.21
4.30
21.52
TOTAL Tacit
Percent Energy
Savings:
46.48 38.19
Reactions
Reactions & anode
Reactions, anodes & ore
33%
44%
18%
57

Alternative Primary Aluminum Processes
7.1.3 Environmental Impacts of Carbothermic Technology
The carbothermic process, when compared to Hall-Héroult technology, results in significantly
reduced electrical consumption, and the elimination of perfluorocarbon emissions that result from
carbon anode effects, hazardous spent pot liners, and hydrocarbon emissions associated with the
baking of consumable carbon anodes.
The total carbon dioxide emissions from carbothermic reduction, as with Hall-Héroult, depend on the
source of electricity. Hydroelectric power generation emits almost no carbon dioxide, whereas the
carbon dioxide emissions associated with the average U.S. grid electricity are 0.51 kg CDE/kWh
(Appendix E, Table E.1). Since 40 percent of the U.S. primary industry operates on hydroelectric
power, the aluminum industry’s average electrical generation emission rate is 0.35 kg CDE/kWh. The
carbothermic reaction results in the generation of carbon-based greenhouse gases (GHG), mainly
carbon monoxide (CO), at twice the rate of the Hall-Héroult reaction. However, the carbothermic
process only requires electricity for heating and not for the reduction reaction. Assuming
carbothermic technology is used in “mini-mills” operating off the average U.S. electric grid, the total
GHG emissions from “utility-to-metal” for the carbothermic process are reduced relative to the
average U.S. Hall-Héroult system, because of carbothermic’s lower electrical intensity. Table 7.2
(Appendix E, Table E.4) shows the lower electrical demand of carbothermic technology resulting in
lower total carbon dioxide equivalent (CDE) emissions than for a Hall-Héroult system.
Table 7.2: Carbon Dioxide Equivalent Comparison of Hall-Héroult and Carbothermic Reduction
Emission Sources Modern Hall-Héroult Carbothermic
kg CDE/kg Al kg CDE/kg Al
Carbon Anode 1.66 2.45
Reaction Energy
Requirements:
kWh/kg Al
kg CDE/kWh
14.43
0.349
5.04
9.63
.511
4.92
Process 2.20 0.0
Total 8.91 7.37
7.2 Kaolinite Reduction Technology
Production of pure aluminum by reduction of aluminum chloride was discovered before the Hall-
Héroult process, in 1825. Alumina conversion to aluminum chloride and reduction to aluminum using
bipolar technology was demonstrated in the late 1970s, but it was not commercialized because of
problems with the product purity and projected high capital and operating costs (Section 6.3 on
58
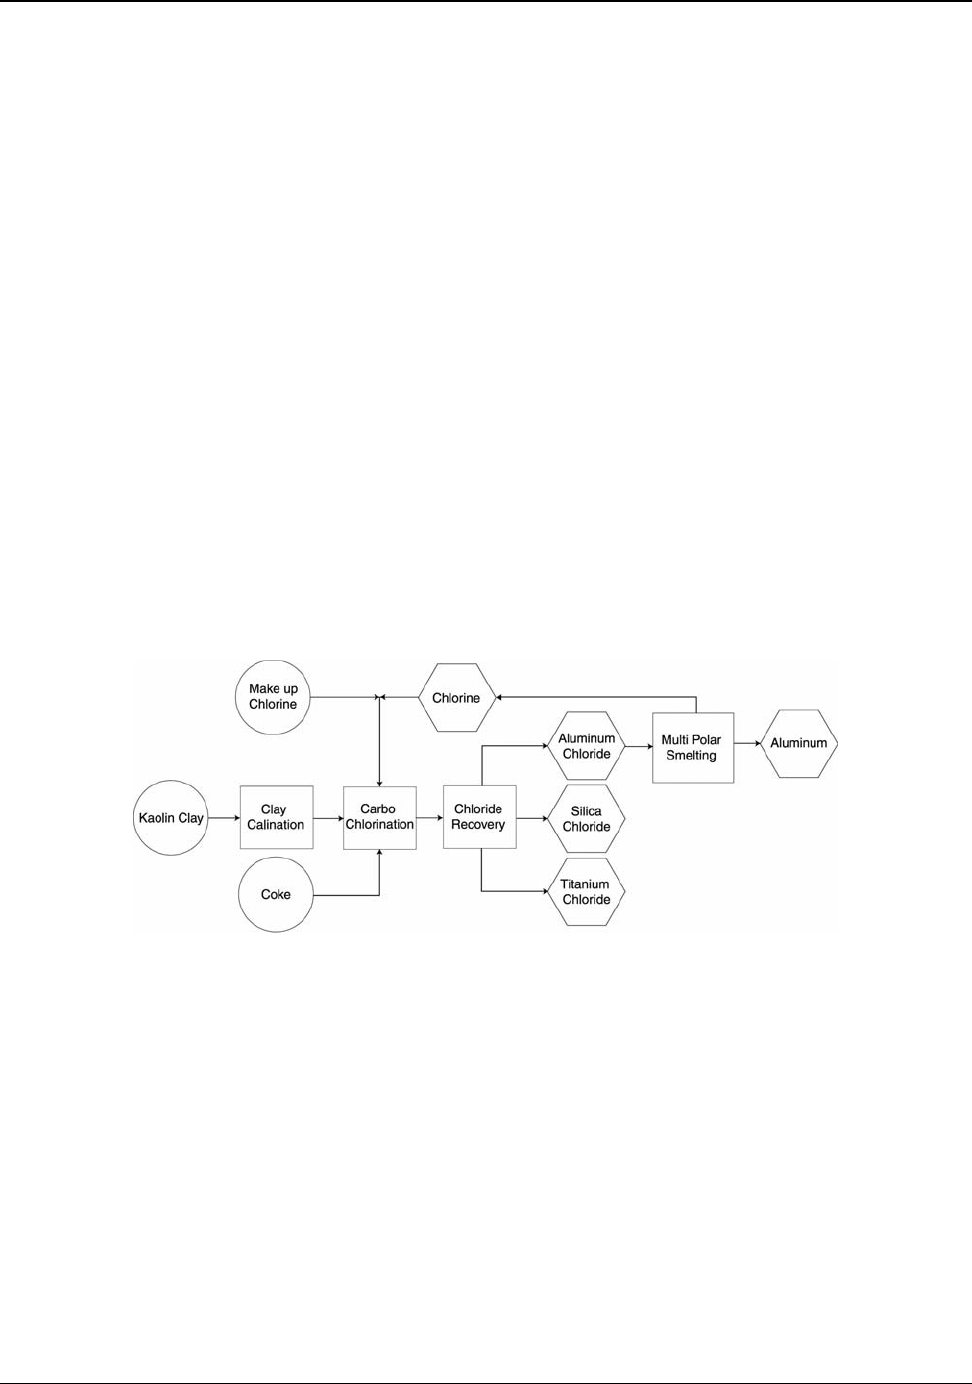
Alternative Primary Aluminum Processes
page 52). New construction materials, improved thermodynamic understanding, and the potential to
use low-cost alumina containing clays have maintained the interest in chloride reduction technology
for producing aluminum.
Compared to the current Bayer refining and Hall-Héroult fluoride-based smelting of alumina, the
chlorination of alumina-containing clays promises many potential advantages:
• Raw materials are widely available, inexpensive, and indigenous to the United States.
• Thermodynamics provide high-speed, high-conversion reactions with lower electrical demand.
• No “bauxite residue” is produced, though there is waste from the clay chlorination.
• Conventional materials-of-construction (i.e., mild steel) can be used.
Industry has spent more than 30 years developing process technologies for the chlorination of widely
available, low-grade kaolin clays. These clays contain kaolinite (hydrated alumina silicate, i.e.,
Al
2
O
3
•
2SiO
2
•
2H
2
O
), significant amounts of titanium dioxide (1 percent to 5 percent), and other
materials. Titanium tetrachloride and other metal chloride byproducts are also produced when
processing kaolin clays.
The basic steps of the clay to aluminum process are shown in Figure 7.3.
49
Figure 7.3:Clay to Aluminum Process Schematic
First, the kaolin clay and process coke are dried. All feed materials to the clay chlorination units must
be dried to minimize chlorine absorption in any water and to reduce the corrosive effects of moisture
in the chlorination offgas stream. The drying process involves controlled, catalyzed heating of the
finely ground clay at ~800°C in a fluidized reactor, using coke and air to provide the heating energy.
The hot reactor produces a dehydrated calcined clay, which is sent to carbo-chlorination.
The carbo-chlorination step is a high-speed, catalyzed exothermic reaction of calcined clay with
chlorine and coke:
59

Alternative Primary Aluminum Processes
3(Al
2
O
3
•2SiO
2
) + 14C + 21Cl
2
6AlCl
3
+ 6SiCl
4
+ 7CO + 7CO
2
Chlorine is injected into the bottom of the fluidized reactor with the clay oxides and coke. The
metallic oxides, principally those of aluminum and silicon, are converted to their chlorides. The
chlorides exist as vapors at the reaction temperatures. The next process step is designed to suppress
the formation of silicon tetrachloride. The offgases of the chlorination reactor are treated with a small
amount of catalyst vapor and reacted in a second fluid bed reactor with additional calcined clay. The
alumina portion of the clay is converted to aluminum chloride, and silicon tetrachloride is converted
to solid silica and discharged (
3SiCl
4
+ 2Al
2
O
3
4AlCl
3
+ 3SiO
2
). The net effect of this step
is the preferential chlorination of alumina relative to silica. The hot vapors from the second reactor
are cooled and crude aluminum chloride is recovered. Several byproducts are produced as an
extension of the chlorination step. Titanium tetrachloride, silicon tetrachloride, and boron trichloride
are not condensed in the cooler and can be recovered in subsequent processing. Silicon tetrachloride
can be reacted with oxygen to recover chlorine, which is recycled back to the chlorination step as
below:
4SiCl
4
+ 5O
2
2SiO
2
+ 3O
2
+ 8Cl
2
The crude aluminum chloride must be purified for ease of operation of the electrolytic reduction cells
and for the final aluminum quality. The main impurity is iron, which is present as ferric chloride at
levels as high as ~50,000 ppm. Impurities are removed by chemical treatment.
The electrolysis of aluminum chloride to aluminum takes place in an aluminum chloride smelting
cell, which comprises a stack of horizontal bipolar graphite electrodes, between which the aluminum
chloride is converted into high-grade aluminum and chlorine gas
(2AlCl
3
2Al + 3Cl
2
)
. The
electrodes are immersed in a chloride bath, which is contained in fully enclosed, thermally lined
vessels. The bipolar electrodes are supported and separated by inert spacers resting on the electrode
below it, and the entire stack, consisting of bottom cathode, bipolar electrodes, and top anode, is
supported by the walls of the cell.
7.2.1 Theoretical Energy for Kaolinite Reduction of Alumina
The theoretical minimum energy requirement for producing aluminum from kaolinite is 5.76
kWh/kg of aluminum produced. The theoretical minimum for the chloride reduction step of
aluminum chloride is 7.66 kWh/kg of aluminum.
The theoretical minimum energy requirement can be calculated from the net chemical reaction in the
kaolinite to aluminum process:
60

Alternative Primary Aluminum Processes
7(Al
2
O
3
•2SiO
2
) + 14C 14Al + 14SiO
2
+ 7CO + 7CO
2
It is assumed that the reactants (kaolinite and carbon) enter the system boundaries at 25°C, the carbon
monoxide and carbon dioxide byproducts leave at 25°C, and the aluminum product leaves the system
as molten metal at 960°C. The theoretical net reaction occurs under perfect conditions when there are
no reverse reactions, parasitic reactions, or heat/energy losses external to the system. These
assumptions yield a theoretical minimum energy requirement of aluminum production from kaolinite
as 5.76 kWh/kg of aluminum (Appendix J, Table J.5). This assumes a pure kaolinite feedstock.
The kaolinite process is accomplished in two steps, carbo-chlorination and aluminum chloride
reduction. The electrolytic aluminum chloride reduction process used in the kaolinite process requires
the exact same minimum amperage (2,980 Ah/kg of aluminum) as any electrolytic process for
reducing aluminum. The theoretical chloride reduction reaction occurs under perfect conditions
(where there are no reverse reactions, parasitic reactions, or heat/energy losses external to the system)
and requires 7.66 kWh/kg of aluminum produced. The theoretical minimum energy requirement used
in this report is calculated at 960°C to provide comparison with the other processes. The proposed
multipolar system operates at about 700°C, which would lower the theoretical energy demand by
about 0.09 kWh/kg of aluminum. The exothermic nature of the carbo-chlorination reaction
(–1.90 kWh/kg of aluminum) results in the overall kaolinite to aluminum theoretical energy
requirement to be lesser than the minumum energy requirement for the aluminum chloride reduction
.
61

Alternative Primary Aluminum Processes
7.2.2 Comparative Benefits for Kaolinite Reduction and Hall-Héroult Cells
The kaolinite reduction process offers potential advantages when compared to the Hall-Héroult
process. Table 7.3 shows the onsite and tacit energy comparison for Hall-Héroult and Kaolinite
processes.
Table 7.3: Comparison of Hall-Héroult and Kaolinite Reduction
Energy Input kWh/kg Al
Modern Prebaked
Hall-Héroult
Kaolinite (AlCl
3
)
Reduction
ONSITE ENERGY DEMANDS
Raw Materi
als
Bauxite-Alumina
Kaolinite
Anode Materials
Reaction Carbon
Total
7.59
0.61
8.20
8.14
0.77
0
8.91
Reaction Energy
Reaction Thermal
Furnace Losses
Reaction
Cell Ohmic
Total Reaction
3.76
10.67
14.43
-1.90
0.40
6.48
2.93
7.91
TOTAL Onsite
Percent Energy
Savings:
22.63 16.82
Reactions
Reactions & anode
Reactions, anodes & ore
45%
42%
26%
TACIT ENERGY DEMANDS
Raw Materi
als
Bauxite-Alumina
Kaolinite
Anode Materials
Reaction Carbon
Total
8.24
6.02
14.26
8.84
0.77
11.37
20.97
Reaction En
ergy
Reaction Thermal
Furnace Losses
Reaction
Cell Ohmic
Total
8.41
23.82
32.23
-1.90
0.60
14.48
6.54
19.72
TOTAL Tacit
Percent Energy
Savings:
46.48 40.69
Reactions
Reactions & anode
Reactions, anodes & ore
39%
46%
12%
The combined clay carbo-chlorination and bipolar aluminum chloride smelting process is estimated
to be 35
tf
percent more tacit energy efficient than the Hall-Héroult, has a smaller plant footprint, can
be more flexible in regard to use of off-peak power and power fluctuations, and produces fewer
emissions and process wastes. Onsite energy use is about 19 percent lower than a modern Hall-
62

Alternative Primary Aluminum Processes
Héroult cell. The large tacit energy improvement results from a decrease in electrical use. Compared
to the current Hall-Héroult smelting technology, the bipolar aluminum chloride smelting process
consumes less electricity, yielding 60 percent more metal for the same electrical input. Bipolar cell
designs provide significantly lower reactor volume per unit of product output. This lower volume
allows the cell to idle and hold temperature much more efficiently than a single electrode cell. These
properties allow multipolar cells to take better advantage of off-peak electrical costs. Chloride cells
also operate at lower temperatures, providing additional savings.
Raw materials used in the kaolinite process require approximately 47 percent more energy compared
to those in a modern Hall-Héroult process (Table 7.3). Kaolinite requires more energy for extraction
on an aluminum basis and the carbo-chlorination step requires 2.5 times the carbon of a Hall-Héroult
carbon anode system. The raw material energy expenses may be compensated for by the lower-cost
domestic supply of kaolinite and the ability to use lower-cost carbon than Hall-Héroult systems.
It is important to emphasize that while significant elements of the kaolinite process have been studied
and developed, no integrated production of aluminum from kaolinite clays has yet been attempted.
Significant work in developing an integrated production process has been reported.
7.2.3 Environmental Impacts of Kaolinite Technology
Table E.4 in Appendix E tabulates the CDE emissions for the kaolinite to aluminum process.
Operating off the average U.S. electrical grid, this process would produce 14 percent fewer CDE
emissions than a typical Hall-Héroult facility. However, the same plant operating on the average U.S.
smelter grid (50.2 percent hydroelectric) would actually result in 8 percent lower CDE emissions than
Hall-Héroult facilities.
63

8. Secondary Aluminum (Recycling)
The production of primary aluminum ingots from bauxite ore requires approximately 23.8(62.2
tf
)
kWh/kg of aluminum. Recovering aluminum from scrap to produce secondary aluminum ingot
consumes about 6 percent of the energy required to produce primary aluminum.
50
This significant
energy difference drives the emphasis placed on aluminum recycling in today’s society and in the
aluminum industry.
Recycling in the United States saved more than 167 x 10
9
kilowatt hours (0.57 quad) of energy in
2003, the equivalent of 19,100 Megawatts. Each kilogram of aluminum that is recovered by recycling
saves 59.4
tf
kWh of the 62.2
tf
kWh of energy consumed in producing a primary aluminum ingot from
bauxite ore (Appendix F, Table F.6). Any process that improves the recovery of scrap aluminum is
effectively making an order of magnitude change in the energy associated with aluminum production.
The growth of aluminum recycling represents the greatest change in the structure of the industry and
in the energy associated with aluminum manufacturing. A common practice since the early 1900s,
recycling was a low-profile activity until 1968 when aluminum beverage can recycling vaulted the
industry into public consciousness. In 1960, recycled aluminum accounted for 18 percent of the
nation’s total aluminum supply (401,000 metric tons). Over the next 43 years, production of recycled
aluminum rose by 703 percent to 2,820,000 metric tons. During those same 43 years, the total U.S.
aluminum metal supply increased 300 percent (Appendix G). In 2003, 75 plants in the United States
produced secondary ingots. Over half – 51 percent – of the aluminum metal produced in the United
States in 2003 was from recycled material.
51
The growth of the market for recycled aluminum is due in large measure to economics. It is cheaper,
faster, and more energy-efficient to recycle aluminum than to manufacture it from ore. Recovered
aluminum is easily melted at relatively low temperatures (aluminum alloys typically melt at
temperatures below 660 ºC). Producing a recycled aluminum ingot consumes only about 6 percent of
the energy required to produce a primary aluminum ingot from bauxite ore. In addition, to achieve a
given output of ingot, recycled aluminum requires only about 10 percent of the capital equipment
costs compared with those required for the production of primary aluminum.
Aluminum products are corrosion resistant which allows them to be easily and repeatedly recycled
into new products. The corrosion resistance is due to the metal’s properties. When the surface of
aluminum is exposed to air, it rapidly forms a tenacious, self-limiting, protective oxide layer. Other
surface treatments can be applied to further enhance aluminum’s corrosion resistance.
64
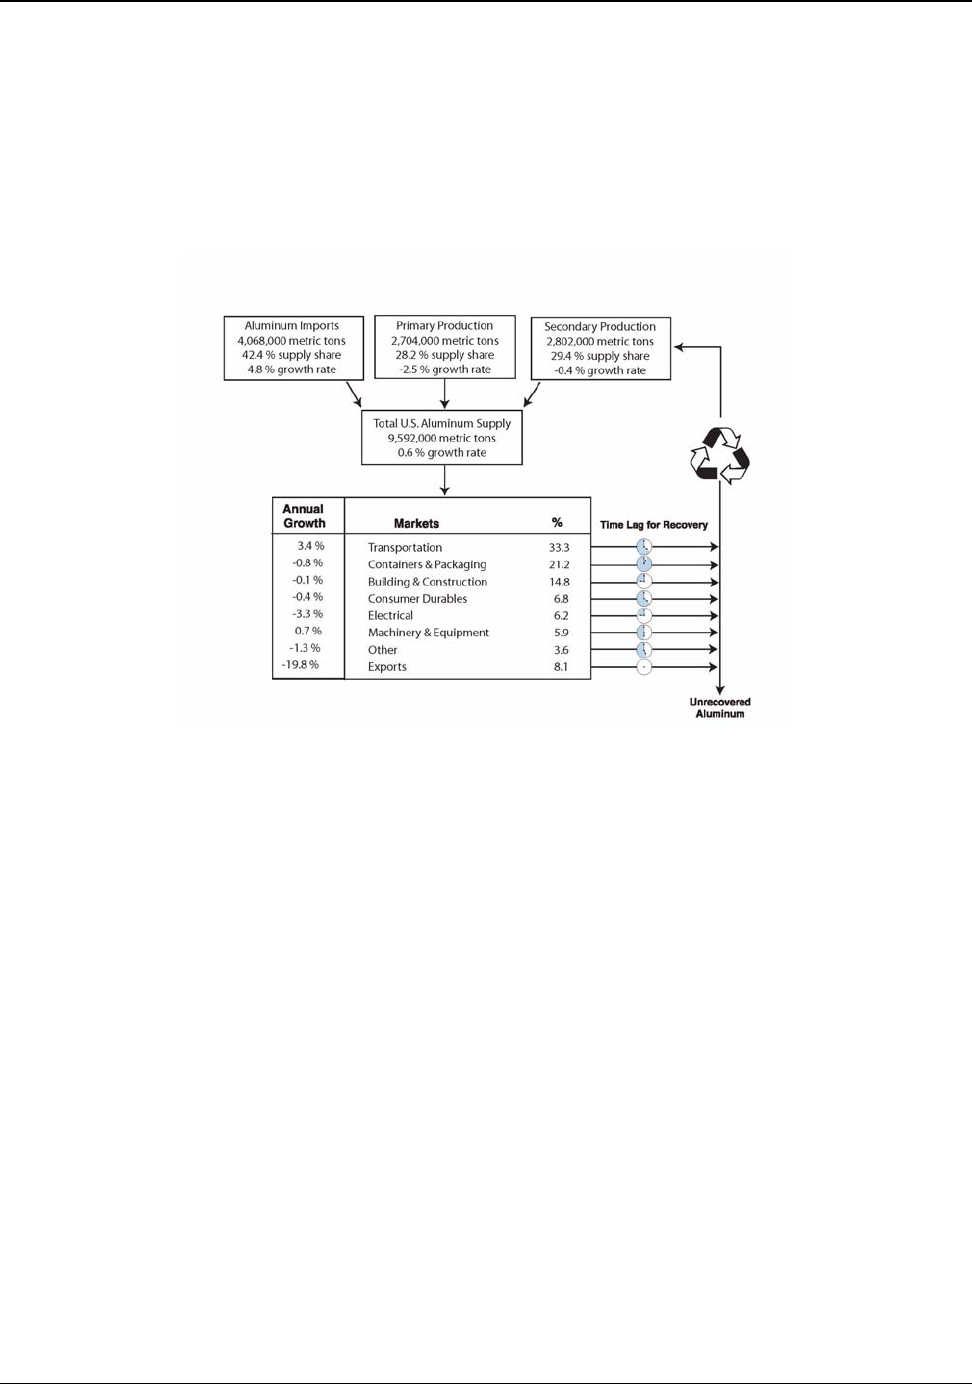
Secondary Aluminum (Recycling)
Figure 8.1 shows the annual growth rates of the three sources of metal supply between 1993 and 2003
period, together with the growth in the major aluminum product markets. Aluminum imports are
growing at at a rate of 5.1 percent per year while both U.S. primary and secondary productions are in
decline (Appendix G).
Figure 8.1:U.S. Aluminum Market and Growth
Aluminum scrap is categorized as “new” or “old.” “New” scrap is generated when aluminum
products are manufactured. It includes defective products; scalping chips; edge and end trim from
rolling processes; skeleton scrap from stamping and blanking operations; flash, gates, and risers;
extrusion butts and ends; and turnings and borings. “Old” scrap (post consumer or obsolete products)
comes from discarded, used, worn-out, or out-of-date products that include automotive parts, white
good parts, containers such as used beverage cans and closures, wires, cables, and building materials.
“Runaround scrap” is “new” scrap that is recycled by the same company that generated it. Since
runaround is usually not sold or marketed, it is not reported in the U.S. recycling statistics.
8.1 Secondary Aluminum Production
Secondary aluminum producers represent a separate and vital segment of the aluminum industry
whose principal activities are converting purchased scrap, and metal recovered from skim and dross
generated in molten metal operations into usable aluminum alloy products. Recycling in primary
aluminum operations is typically confined to in-house or runaround scrap and manufacturing scrap
returned directly from their customers. Secondary aluminum producers specialize in melting and
processing a wide range of new and old, segregated and mixed, high and low-quality scrap.
65

Secondary Aluminum (Recycling)
The most desirable form of recycling is closed-loop in which scrap from specific product applications
are returned for remanufacturing of the same products. Rigid container stock used in beverage cans is
an example of closed-loop recycling since used beverage cans are processed exclusively to
remanufacture can sheet. Secondary aluminum producers are involved in closed-loop recycling as
contractors to primary producers for this and other products.
Scrap segregated by alloy has greater value than mixed scrap because it can be used predictably and
most efficiently in the production of the highest value-added compatible compositions. Mixed scrap
presents the greatest challenge, generally requiring added steps in melting, composition
identification, and often casting into ingot form before consumption.
Casting alloys are the largest and the most important, but not the only market for secondary
aluminum. Scrap is used, with primary metal, in the production of extrusion billet and fabricating
ingot. Reclaimed smelter ingot (RSI) is produced from scrap and dross, often on a toll conversion
basis.
Alloys used by aluminum foundries in the production of shape or engineered castings include
compositions designed to facilitate production from scrap. These alloys, which have been historically
prominent, typically specify broader element ranges and higher impurity limits than the alloys
developed for more specialized purposes and whose compositions require production from primary
metal sources. The increased use of aluminum in structural applications in the ground transportation
sector typically requires primary compositions, but the expanded use of aluminum in engine blocks,
cylinder heads, and other power train parts relies on castings in secondary alloys. The emphasis on
light weighting for improved fuel efficiency and reduced environmental degradation is encouraging
the adoption of various wrought aluminum products such as auto body sheet, fuel tanks, seat backs,
extruded drive shafts and stringers, and forged connecting rods. As the proportion of aluminum
increases in ground transportation designs, segregating and blending scrap into saleable alloy
compositions will become common practice.
New scrap sorting technology is developing, including those related to the recovery of aluminum
from the large transportation and white goods markets.
52
New technologies with computer screening
are using color segregation and laser-induced-breakdown spectroscopy (LIBS) to sort wrought from
cast and, in some instances, one alloy from another. Aluminum alloy separations will allow scrap to
be segregated into more specific alloy groupings with higher economic value.
8.2 Production, Capacity and Growth
Aluminum scrap is widely recycled and supports a large secondary aluminum industry. In 2003, the
United States produced 2,820,000 metric tons of secondary aluminum, amounting to nearly one-third
of its total supply of aluminum. This market had an annual growth rate of –0.4 percent over the last
ten years (Figure 8.2).
66

1960
1965
1970
1975
1980
1985
1990
1995
2000
Secondary Aluminum (Recycling)
Figure 8.2:U.S. Production of Secondary Aluminum 1960 to 2003
0
1
2
3
4
Million Metric Ton
s
Source: Appendix G
Market demand for recycled aluminum will remain strong due to its inherent low-energy cost relative
to primary metal. Aluminum use in consumer products has become widespread in a trend described as
the “urban mine.” Challenges in scrap recovery, alloy sorting and impurity removal can be addressed
with the current technologies. The limitation to secondary metal market growth is the economic
supply of scrap.
The urban mine has been accumulating scrap products for the past hundred years. There is a lag time
from when aluminum leaves the shipping dock to when it becomes available for recycling. This lag
time, or “use” phase life, varies significantly among aluminum products. For packaging products such
as beverage cans, this lag is only about 65 days. Long-life products, such as building frames, can have
a lag time of 40 to 50 years. Automobile lag time is 12 to 15 years. Aluminum in automobiles
accounted for 5 to 10 percent of scrapped automobiles’ weight in 2000, but represents 35 to 50
percent of its scrap value. This source will grow rapidly as new automobile designs continue to utilize
a greater proportion of aluminum.
Considering the large amounts of aluminum that are stored in long-life products (accumulated within
the “urban mine”) and the continued growth in aluminum demand, recycling will continue to increase
and be a significant contributor to the U.S. metal supply. In fact, recycling has overtaken primary
production as the main source of domestically produced aluminum in the United States.
8.3 Recycling Processes
The objectives of the recycling process are maximum metal recovery, minimum contamination, and
lowest conversion cost. Safety is of prime importance since components mixed with scrap can present
the risk of explosive reactions and other concerns. Since moisture is a safety concern, remelt ingot
and reclaimed smelter ingot (RSI) are routinely preheated before charging to the furnace hearth.
Preheating methods vary from heating on the charging doorsill to using dedicated preheating ovens.
Preheating standards from times of exposure and temperature also vary. In either case, energy is
consumed for the promotion of operational safety.
67

Secondary Aluminum (Recycling)
Scrap for recycling is available in many forms. Light scrap is typically baled or briquetted to reduce
transportation costs. Bales and briquettes are typically split for inspection of integrity and
contamination and/or are crushed, shredded, or shripped (sheared and ripped) to controlled flowable
particle sizes. Conveyor systems segregate particle fines for separate processing, provide magnetic
separation, and allow for visual or automated inspection.
Large volumes of aluminum scrap contain paint, enamel, lacquer, or porcelain coatings. These
coatings, which contain oxidizing compounds, would significantly reduce metal recovery if not
removed before melting. Conveyor furnaces or rotary kilns operating at temperatures near the melting
point are required for their removal. Turnings, borings, and other fine scrap may contain oil from
cutting fluids which must be removed for satisfactory metal recovery by swarf (metal fines and
chips) drying in which the oil contributes to the energy required, or by elevated temperature treatment
in rotating kilns. Fine scrap is conveyed to external charging wells for submergence by mechanical
methods including the use of recirculating molten metal pumps. Light scrap is charged directly to the
furnace hearth and is covered by additional heavier charge components.
Melting is typically accomplished in gas-fired furnaces ranging in size from 75,000 to more than
250,000 pounds. Coreless induction furnaces are in common use for rapidly melting fine scrap.
Molten metal from these furnaces is transported to the main furnaces for further processing. After
iterative alloying steps, molten metal is held and processed before casting. Furnaces have thermal
efficiencies ranging from approximately to 20 to 45 percent. Rotary kilns and conveyor furnaces
operate in essentially the same efficiency range. Induction melting is more efficient at approximately
90 percent but furnace capacities are limited and additional steps are required to address oxide
concentrations created by electromagnetic stirring. In-furnace and in-line molten metal treatments are
employed to remove dissolved hydrogen and entrained oxides and other nonmetallics before casting.
In-line systems are usually internally heated using gas-air or electric resistance immersion elements.
Troughing and filter basins are preheated using air-gas torches or resistance elements. Open molds for
casting remelt ingot and sow are routinely preheated before use.
The aluminum, recoverable from skim and dross obtained from foundries, and primary and secondary
molten metal processing units, is typically extraced in secondary producers. While other dross
treatment processes have been developed, rotary furnaces in which dross and salts are mixed and
heated remain the most commonly used. The products of dross recovery treatment by this process are
aluminum and black dross, a mixture of unrecovered aluminum, metallic oxides, and salt. Tertiary
processes have been developed for separating the components of black dross into saleable salt fluxes,
metal, and value-added nonmetallic derivatives such as calcium aluminate and additives for low-
density cement. The economics of tertiary processing are strongly and adversely influenced by the
current low-cost alternative of landfill disposal.
In summary, the energy intense operations common in recycling are:
• swarf drying for removal of combustible contaminants,
68

Secondary Aluminum (Recycling)
• kiln or conveyor delacquering of coatings,
• preheating charge components,
• melting,
• holding and melt processing, and
• rotary furnace operation
8.3.1 Theoretical Energy for Secondary Aluminum
The theoretical minimum energy required to produce secondary aluminum at 960°C is 0.39
kWh/kg of aluminum. On a theoretical and a practical basis, the energy required to produce
secondary aluminum is less than 6.5 percent of the energy required to produce primary metal.
If the system boundaries are drawn around a secondary aluminum facility, the material entering and
leaving is aluminum metal. Since no chemical change has occurred, the theoretical minimum energy
requirement for scrap conversion is only the energy required to melt and raise the metal temperature
to that required for casting. Molten metal furnace temperatures vary depending on the furnace, alloys,
and other proprietary factors. A molten metal temperature of 960°C, the same production temperature
as for primary aluminum, is used in this report for secondary aluminum to compare aluminum process
technologies easily. In reality, normal pouring temperatures are much lower, in the range of 650°C to
750°C.
The theoretical minimum energy requirement to bring room-temperature (25ºC) aluminum to its
molten form at 960°C is 0.39 kWh/kg, which is less than 6.5 percent of the theoretical energy
requirement for the primary production of aluminum. The theoretical energy required to heat
aluminum from room temperature to its melting point, melt it, and raise the molten aluminum to a
higher temperature is calculated and explained in Appendix K. Pure aluminum melts at 660°C and
requires 0.30 kWh/kg to melt, 23 percent lower than the value used in this report.
8.3.2 Technological Change in the Next Decade
The energy efficiency of the entire aluminum industry can be further increased by capturing a greater
percentage of material for recycling and by improving technology for scrap handling and melting.
Non-technological and nonmarket factors are also important for the continued growth of recycling.
Two of these factors, consumer awareness and incentives, can contribute significantly to the recycling
volume. Consumer awareness requires continuing educating the public about the energy and
environmental benefits of recycling. Offering incentives will aid in the return of aluminum scrap to
the manufacturing base.
Recycling energy efficiency will be enhanced by developing technologies that minimize oxidation
and improve thermal inefficiencies in scrap processing and melting. Improved collection systems and
separation devices (e.g., eddy current, color sorting, laser sorting) can increase aluminum scrap
69

Secondary Aluminum (Recycling)
recovery by 20 to 30 percent. Improved technology can be applied to increase scrap recovery rates,
especially with regard to aluminum in municipal solid waste. Incremental improvements in existing
furnaces can further reduce the recycling energy requirements. They can be achieved by recuperating
stock gas energy for preheating combustion air and metal feedstock, by modifying burner and furnace
designs, and controlling furnace practice and operating conditions.
53, 54
New technologies must also
be developed to ensure more significant progress.
70

9. Aluminum Processing
The aluminum industry can be divided into metal- and product-producing sectors. In 2003, the metal-
producing sector manufactured approximately 2,704,000 metric tons of primary metal and 2,820,000
metric tons of secondary metal. The product-producing sector processes these domestically produced
and imported metals into approximately 5,497,000 metric tons of rolled products, 1,719,000 metric
tons of extrusions, and 2,513,000 metric tons of shape castings.
53
Wire rod and bar, forgings, impacts,
and powder products total more than 700,000 metric tons, comprising about 7 percent of the
aluminum product market; these have not been studied as a part of this report.
Recoveries (yields) in each product processing sector are less than 100 percent. Handled, melted, and
worked tonnage exceeds that implied by the product statistics. The manufacturing of circles and
blanks from aluminum sheet, for example, may recover as little as 35 percent of the original ingot
weight as shipped product. The gross to net weight ratio in gravity castings is often 2:1, in other
words, fifty percent of the original cast weight is automatically designated for remelting.
Furthermore, many products have a genealogy of repeated melting and casting steps. Ingot cast at a
primary smelter is remelted at a secondary producer for casting remelt ingot, which is again remelted
at an aluminum foundry for casting production. On a yield basis, it may be conservatively estimated
that more than 18,000,000 metric tons of aluminum alloys are melted each year to support aluminum
industry shipments. Some casting operations are located sufficiently close to primary smelters and
secondary aluminum producers to allow the molten metal to be shipped in insulated and protected
crucibles, saving the energy of remelting.
Minimizing planned and unplanned scrap represents a large opportunity for energy and cost savings.
Each kilogram of metal that does not go into a final product must be remelted, recast, and reworked.
Remelting also leads to the loss of a percentage of metal to oxidation, which must be replaced with
energy-intensive primary metal. Melting and melt processing operations are the most energy intense
of all post-smelting processes.
9.1 Melting, Alloying, and Melt Treatment
In an aluminum primary smelting facility, molten metal is transferred from the smelting cells to
furnaces for alloying and melt treatment prior to casting. In secondary and other casting plants, ingot,
metallurgical metals, and master alloys must be melted and alloyed. The melting arrangement in most
larger plants provides high heat-input, high melt-rate furnaces for melting, and separate holding
furnaces to which molten metal is transferred for final alloying and preparation for casting. Some
operations have combination melting/holding furnaces.
71

Aluminum Processing
There are a wide variety of furnace types and designs for melting aluminum. Furnace choice depends
on the required melt volume, melt rate, availability, cost of fuel and electrical energy, and emission
standards. The most common in primary and secondary operations are natural gas-fired reverberatory
furnaces reaching capacities of more than 120,000 kg. Crucible furnaces with capacities ranging from
160 to 4,500 kg are more common in small- and medium-sized foundries. Other furnace types include
coreless and channel induction, electrical resistance and radiant tube furnaces.
Reverberatory furnaces are box-shaped and consist of an insulated steel shell with a refractory lining.
Fuel-fired reverberatory furnaces are used when the melt rate and/or capacity are large. The fuel-fired
reverberatory furnace fires natural gas, propane, or oil directly into the furnace from either the roof or
more typically, the sidewall. The heat is transferred to the surface of the molten aluminum
predominantly by refractory radiation and some convection. There are a large number of
reverberatory furnace design variations: charging and access doors, refractory specifications, side-
wells for charging and/or recirculation, hearth or sidewall induction stirring, split hearths, dry
hearths, divided zones for melting and holding, and various burner capacities and types. Recuperation
concepts include charge preheating, preheating combustion air, and cogeneration.
The growth in recycling has resulted in a number of specialized processes, furnaces, and systems to
improve metal recovery from scrap. Molten metal pumps have been incorporated into these designs to
provide rapid ingestion of fine scrap and more rapid melting of larger scrap forms. Salt flux additions
maintain system cleanliness and aid in the separation of oxides. Pump-induced flow external to the
furnace may include provisions for melt treatment and the separation of oxides as well as for melting.
Natural gas or oil-fired reverberatory furnaces use about 0.87 to 1.96 kWh/kg of aluminum.
54
In
addition, a gas furnace increases metal losses due to oxidation. Gas furnaces have 5 to 8 percent metal
loss compared to 0.5 to 3 percent loss in electric furnaces. Recent design innovations in fossil-fuel
reverberatory furnaces help capture the waste heat in the stack gas to preheat incoming materials.
This increases energy efficiency and reduces the time required to melt the metal. Recuperated waste
heat can also be used to preheat combustion air. These technologies can reduce fuel usage to less than
0.57 kWh/kg of aluminum.
Crucible furnaces are more versatile with regard to alloy changes and melt quantities. Combustion
occurs between an insulated steel shell and a crucible of silicon carbide, graphite, clay graphite or
other refractory material resistant to molten aluminum attack. Electrical resistance elements can be
substituted for gas burners in crucible furnace designs.
In recent years, much research has been done on using immersion heaters as a way to remelt
aluminum. Immersion heaters have very low rates of heat loss (~97 percent thermal efficiency), and
have energy usage levels of less than 0.50 kWh/kg of aluminum.
72

Aluminum Processing
Skimming
Oxide naturally forms on the surface of molten aluminum, resulting initially in a thin protective film.
With increase in time and temperature, the thickness of the oxide layer increases. Turbulence and
agitation accelerate oxide formation and result in the intermixing of metal and oxides. Oxidation
rates are influenced by alloy content and increase with temperature, especially when magnesium is
present in the alloy. The oxide layer also effectively insulates the bath from radiation heat transfer and
must be periodically removed to maintain thermal-efficiency in reverberatory furnaces.
If fluxes are employed to treat the skim before it is removed from the furnace, the oxides are typically
dewet and a large portion of the molten aluminum entrained in the skim layer separates to the melt. In
either case, untreated (skim) or flux-treated (dross) contains entrained free metal as a result of the
skimming action. Efforts are usually made to recover entrained free aluminum after skimming. While
still hot, metal can be drained from the skim gravimetrically and with vibration. Alternatively, skim
may be rapidly cooled by inert gas quenching or in rotating water-cooled steel drums after which free
aluminum may be physically separated. The residue comprising unrecovered aluminum and oxides is
normally further processed for its metal content.
Gross melt losses typically range from 1 to 8 percent. The magnitude of the loss is dependant on the
type of furnace and burners, the surface-to-volume ratio, the practices that are used, and the material
being melted.
55
Melt loss has significant economic impact since oxidized metal must be replaced in
the supply chain with new primary aluminum metal.
Alloying
Specific elements or combinations of elements are added to molten aluminum to produce aluminum
alloys. Alloying provides the basis for a remarkable range of physical and mechanical property
capabilities not displayed by unalloyed aluminum or by any other metal system. Among the elements
and combinations of elements added to molten aluminum are modifiers and refiners, which provide
finer grain structures, and controlled microstructural features, including metallurgical phases that
influence recrystallization behavior.
Molten Metal Treatment
Molten aluminum contains dissolved hydrogen, entrained oxides, and other nonmetallic inclusions
which, if not removed, would adversely affect metal acceptability and performance. Treatment with
salt fluxes or active fluxing gases changes the interfacial relationship of included particles with the
melt so that gravitational separation is facilitated. Fluxing with argon, nitrogen, and/or other gases
results in flotation of entrained matter while dissolved hydrogen is reduced by partial pressure
73

Aluminum Processing
diffusion. Metal treatment takes place in the melting furnace, holding furnace, or in-line between the
furnace and the casting unit. Rotary degassers have been developed to provide the finest dispersion
and intermixing of metal and fluxes for these purposes.
Molten metal filtration for the removal of particulate contamination was introduced in the 1950s and
has grown in importance and application since that time. The first and still among the most effective
filtration processes are deep bed filters using tabular alumina as the filtration medium. Crushed
carbon beds are capable of fine inclusion removal and a reduction in sodium content that is important
for many products. Porous foamed ceramics are widely used for commercial grade and higher quality
requirements. Fused ceramic and refractory filtration elements are also available.
9.1.1 Energy Requirements for Melting Aluminum
Melting is an energy-intensive process; it requires nearly the same amount of energy to raise one
kilogram of aluminum to a molten 700°C state as it does to raise one kilogram of iron to 1,500°C.
However, nearly three times the volume of aluminum is produced compared to iron because of
density differences.
The energy requirements for melting aluminum are presented in Section 8.3.1, Theoretical Energy for
Secondary Aluminum. When the system boundaries are drawn around an aluminum melting facility,
the material entering and leaving is aluminum metal. Since no chemical change has occurred, the
theoretical minimum energy requirement is only the energy required to melt the metal. Molten metal
furnace temperatures vary depending on the furnace, alloys, and other proprietary factors. The
theoretical minimum energy requirement to bring room-temperature (25°C) aluminum to a molten
960°C metal is 0.39 kWh/kg. The theoretical energy requirement for melting pure aluminum to
molten metal at various temperatures is presented in Appendix K.
Basic natural gas or oil-fired reverberatory furnaces range in efficiencies from approximately 20 to 45
percent. The more efficient furnaces employ recuperation of stack gas heat for reduced melting
energy requirements through charge preheating or for more efficient burner operation through
preheating combustion air. Furnace condition and operating practices have large effects on energy
performance. Because heat transfer in reverberatory furnaces takes place principally through
radiation, melt surface temperatures are considerably hotter, leading to more rapid oxidation and
higher melt losses.
Electric furnaces, typically used in small processing operations, do not require a flue and their heating
chambers can be made nearly airtight. A side-well is provided for charging metal and alloying
materials. The side-well removes the need to open the furnace door and prevents a major convective
heat loss. Energy losses (excluding electrical generation and transmission) in electrical furnace
heating are principally due to conduction and radiation losses from the exposed furnace shell. Losses
74

Aluminum Processing
are typically 0.49 to 0.81 kWh/kg of aluminum. Induction furnaces are typically more than 90
percent energy efficient, while gas-fired crucibles are 15 to 28 percent, and electrically heated
crucibles 83 percent energy efficient.
9.1.2 Technological Change in the Next Decade
The industry is constantly evaluating, adopting, and improving furnace technologies and practices.
This provides not only energy and environmental benefits, but also cost savings. New burner
technologies and oxygen-enhanced combustion systems are being developed and evaluated to further
improve efficiency and reduce the costs of melting without increasing emissions. All industry
segments have transitioned to greater reliance on scrap and recycling for their metal needs.
Technologies for sorting, handling, and remelting scrap in all forms with optimum metal recoveries
and lowest costs are continuously being developed and refined. New technologies for melting thin
gauge material to minimize oxidation losses are being developed and implemented. Also, industry is
continually seeking better methods to recover the aluminum that is trapped in dross. Additional
efforts are directed at the closed-loop recycling of dross-related wastes including saltcake.
New laser technologies will speed the in-situ chemical analysis of molten metal and minimize the
processing time required for alloy compliance. The development of better, longer-lasting, ceramic
materials for furnace linings is ongoing and will reduce the time required for furnace maintenance.
The aluminum industry has recently published a technology roadmap in conjunction with the
advanced ceramics industry, to encourage the development of superior furnace construction
materials.
56
Finally, new melting technologies now under development offer the prospects for revolutionary
improvements in melting efficiencies that may be applicable to the scale and operational demands of
much of the industry. One exciting development is that of immersion heating with high watt-density
elements for melting as well as temperature maintenance. The development of commercial immersion
heaters for aluminum remelting is very likely to occur within the next few years.
9.2 Ingot Casting
Ingot casting is the solidification of molten alloys into shapes that are suitable for subsequent
thermomechanical processing or for remelting. Ingots are made by controlled solidification in molds
designed to produce the desired geometrical configuration and metallurgical characteristics.
Ingot casting is by itself not energy intensive; however, casting is typically a batch process, and large
quantities of molten metal are held in furnaces in which alloying, fluxing, and degassing are
performed. Accordingly, conductive and radiant heat losses occur from these furnaces operations.
75

Aluminum Processing
Ingot for wrought product applications is almost universally cast by the semi-continuous direct-chill
(DC) casting process. The process includes different means of introducing and controlling the flow of
molten metal into the mold, lubrication methods, the use of insulation in mold construction, and the
injection of air or imposition of an electromagnetic field for reducing or eliminating contact between
molten metal and the mold. The process produces rectangular cross-section ingots for rolling, round
log-like billets for extrusion, squares for wire, rod, and bar products, and various shapes as fabricating
ingot in forging.
The DC casting process begins when aluminum flows from the furnace through troughs to the casting
station. At the casting station, the aluminum flows into one or multiple water-cooled stationary molds
that rest on the casting station table. The DC ingot molds are only a few inches deep and form the
cross-section of the ingot or the billet. The ingot is initially formed in the water-cooled mold. Once
perimeter solidification has begun, the casting table is gradually lowered into the casting pit, while
additional molten aluminum is supplied to the top of the mold. The water-cooled mold remains at the
top of the pit and continues to shape the casting. Water sprays impinging on the solid shell continue
the solidification process of the molten ingot core. The casting table is lowered into a casting pit until
the desired length is achieved. After casting, ingot intended for wrought fabrication may be stress-
relieved, scalped, cut to length, and homogenized. Cutting, shearing, forming, and other mechanical
operations, as well as melting, heating, casting, heat treating and other thermal operations are utilized
by the product-producing sector.
Casting operations attempt to control the crystal/grain structure and composition gradient of cast
products. Grain size and boundaries are important factors affecting the material’s physical and
mechanical properties in cast and wrought form. However, because there is a significant temperature
profile across the ingot cross-section during solidification, grain structure and composition can vary
from surface to center. For subsequent fabricating operations, it is usually necessary to remove the
skin layer by scalping so that the final product has consistent physical properties. The amount of
surface to be removed is dependent on shape, surface quality, and the depth of undesirable grain
structure and segregation. Scalpings are remelted and reprocessed, which results in additional energy
usage and metal losses due to oxidation.
A percentage of DC ingots are rejected for quality reasons. Cracking may occur during or after
solidification. Surface defects may form, which affect the acceptability of the ingot for wrought
processing. Other specialized standards concern grain structure, segregation, and microstructure. At
times, ingots are found to exceed alloy specification limits. The processing energy used to produce
the ingot is then lost and additional energy is required for remelting and reprocessing.
76

Aluminum Processing
9.2.1 Energy Requirements
More than 2,704,000 metric tons of primary aluminum were cast into ingots in 2003 (Appendix G).
The tacit energy consumed in aluminum processing operations can be divided into three categories:
1. fossil-thermal energy use, which includes furnaces, heating and heat treatment operations;
2. electrical energy required for heating, sawing and scalping, and for motor, pump and compressor
operation; and
3. other fuel-consuming operations, including transportation.
Primary ingot casting has typical metal yields from 88 to 98 percent and requires about 1.01(1.46
tf
)
kWh/kg of cast ingot product (Appendix F, Table F.2).
Table 9.1: Primary Ingot Casting Distribution of Energy Consumption (Appendix F, Table F.10)
Energy Category Fossil-Thermal Electrical Other Fuels
Percent
79 (63
tf
) % 21 (36
tf
) % 0 (0
tf
) %
The theoretical minimum energy requirements for primary and secondary castings are the same at
0.33 kWh/kg of aluminum (Appendix F, Table F.3). The difference in their actual energy usage results
from their respective initial materials. In primary casting, the initial material is molten aluminum in a
holding furnace, while the initial material in secondary casting is metal scrap. The scrap must first be
melted before it enters a holding furnace, giving secondary casting a higher actual energy use than
primary casting. Secondary aluminum was cast into 2,820,000 metric tons of ingots in 2003.
Secondary casting has typical yields of 96 percent and requires about 2.50 (2.81
tf
) kWh/kg of product.
Table 9.2: Secondary Ingot Casting Distribution of Energy Consumption (Appendix F, Table F.10)
Energy Category Fossil-Thermal Electrical Other Fuels
Percent
77 (73
tf
) % 5 (9
tf
) % 18 (17
tf
) %
9.2.2 Technological Change in the Next Decade
Ingot casters have strived to improve process yields and to refine practices to provide more consistent
internal and surface quality in wrought ingot manufacture. These efforts have resulted in significant
progress in surface, sub-surface, and metallurgical improvements. Grain refining by heterogeneous
nucleation agents has benefited from decades of constant research and development by primary
producers in cooperation with master alloy suppliers.
Molten metal fluxing and filtration processes continue to undergo changes leading to greater
efficiencies, higher product quality, reduced environmental impact, and reduced costs.
Numerous research programs are directed at the modeling and prediction of the solidification process
for reduced cracking incidence and improved structural uniformity. The evolution of mold designs
capable of improved surfaces, reduced scalping, and higher production rates continues in all wrought
ingot production.
77
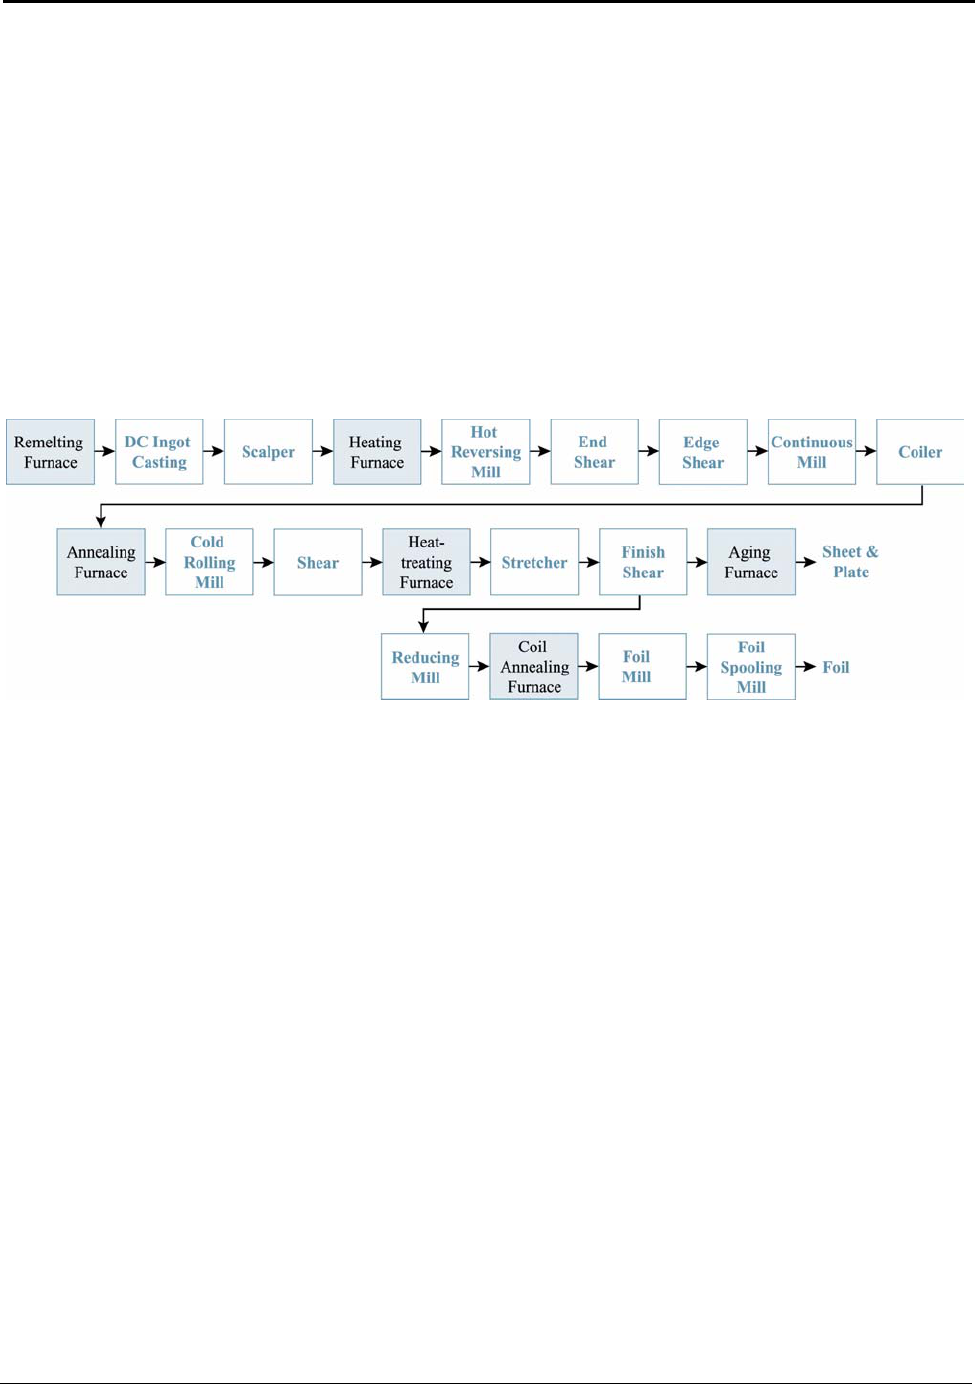
Aluminum Processing
All of these developments reflect advances in sensors and instrumentation that permit more accurate
monitoring and comprehensive control of the casting process.
9.3 Rolling
Rolling is the process of reducing ingot thickness by passing it between counter-rotating steel rolls.
Aluminum-rolled products include plate (typically > 0.6 cm thick), sheet (typically 0.02 cm to 0.6 cm
thick), and foil (typically < 0.02 cm thick). Figure 9.1 shows the unit operations of a typical rolling
mill.
Figure 9.1: Typical Rolling Mill Processing Operations
Hot and cold rolling operations are used industrially to shape material into the broad category of flat
rolled products. Hot rolling is generally performed at various temperatures exceeding the
recrystallization temperature for differing rolling alloys. Cold rolling takes place at room temperature,
but the heat generated can result in metal temperatures as high as 150°C.
Large high strength alloy ingot may require thermal stress relief after casting. Most ingots are
homogenized to reduce intergranualar segregation and to modify intermetallic particle form.
Homogenization may be integral to preheating for hot rolling, or the preheating may take place
separately. Although some ingot may be rolled with the cast surface intact, rolling surface faces are
normally removed by scalping, and the head and butt of the ingot are “cropped” to assure finished
product uniformity.
Hot rolling begins with repetitive reversing mill reductions on stock preheated to temperatures in the
range of 400°C to 500°C. The slab is passed repeatedly back and forth through the rolls until the
desired reduction in thickness is achieved. While heat is generated during deformation, the number of
passes required at the reversing mills may – because of reducing section thicknesses, time, and
coolant application – cause losses in temperature that require reheating before continuing the hot
78

Aluminum Processing
rolling process. Slabs are lifted from the hot line and charged in reheating furnaces until working
temperatures are restored. End crops are taken during breakdown rolling as required to maintain
squareness.
Edge trimming knives remove stock from the edges of the sheet before coiling. The amount of edge
trim required is determined by the depth of edge cracks and the ragged conditions associated with the
unrestrained deformation that occurs during hot rolling. The amount of edge trim required with
cropping losses represents a significant percentage of planned scrap that must be returned to the cast
shop for remelting. Edge trim losses can be minimized by improved ingot quality and by edge rolling.
The hot rolling process completely changes the microstructure formed during casting and elongates
the grain structure in the direction of rolling. Even though deformation temperatures are typically
greater than the recrystallization temperature, there is inevitably some degree of equivalent cold work
so that annealing at reroll gauge will result in recovery or recrystallization before cold rolling.
9.3.1 Energy Requirements for Rolling Aluminum
About half of U.S. rolled aluminum products are cold rolled. 2,421,300 metric tons of cold rolled
products were produced in 2003 (Appendix F, Table F.4). Cold rolling has typical yields of about 84
percent and requires about 0.64(1.35
tf
) kWh/kg of rolled product.
Table 9.3: Cold Rolling Distribution of Energy Consumption (Appendix F, Table F.10)
Energy Category Fossil-Thermal Electrical Other Fuels
Percent
42 (25
tf
) % 55 (72
tf
) % 3 (3
tf
) %
In 2003, nearly 2,421,300 metric tons of hot-rolled products were produced (Appendix F, Table F.4).
Hot rolling has typical yields of about 82 percent and requires about 0.62(1.16
tf
) kWh/kg of rolled
product.
Table 9.4: Hot Rolling Distribution of Energy Consumption (Appendix F, Table F.10)
Energy Category Fossil-Thermal Electrical Other Fuels
Percent
57 (38
tf
) % 43 (62
tf
) % 0 (0
tf
) %
Theoretically, it is possible to roll products without the need for heat treatments and with no loss of
material due to trimming or slitting. In this case, the minimum theoretical energy to roll a product is
composed of only two components:
• the energy required to heat starting stock to the rolling temperature, and
• the energy required to deform the shape.
79

Aluminum Processing
The hotter the material, the lower the deformation energy required. The heat capacity equations
required to calculate the energy requirement for heating pure aluminum are listed in Appendix I. The
energy required for deforming is given by the equation E = εσ
c, where ε is the strain or deformation
defined as ε = ln (t
i
/t
f
), where t
i
represents the initial and t
f
the final dimension, σ denotes the yield
stress, and c denotes a constant describing the shape of the stress strain curve. The yield stress value
for aluminum can vary by as much as a factor of ten over the hundreds of alloys that are used by the
industry.
The very large variations in alloy properties, particularly the shape and the magnitude of the stress
strain curves, make it possible to calculate theoretical minimum energy requirements for rolling
aluminum only for a specific rolling process with a specific alloy. There are a large number of heavy
equipment requirements in rolling mill operations that are not confined to rolling. Roller and tension
levelers, slitters, stretchers, roll formers, and paint or coating lines are examples of energy consuming
operations that rely on pumps, motors, and compressors as well as on mechanical design for
efficiency. A rough approximation of the rolling sector’s minimum energy can be made by assuming
overall process heating efficiencies and electric/hydraulic system efficiencies and by looking at the
entire rolling sector yield and energy consumption. If the overall sector heating efficiency is 50
percent and the electric/hydraulic system efficiency is 75 percent, the estimate of the minimum
energy requirement is 0.31 kWh/kg of product for hot rolling and 0.33 kWh/kg of product for cold
rolling. These assumptions imply that cold rolling is operating at about 52 percent overall energy
efficiency and hot rolling at about 50 percent overall efficiency (Appendix F, Table F.3).
9.3.2 Advanced Rolling Technology
Hot rolling typically requires numerous passes through the rolling mills and is energy intensive. One
approach to improving productivity and reducing heating energy is to continuously cast molten metal
into slab or strip.
57
Going directly to thin strip, continuous strip and slabcasting saves the energy
required for homogenization, scalping, preheating, end and side trim, and multiple passes through
rolling mills.
Continuous strip casting is in wide current use for some sheet and foil specifications and has
demonstrated energy savings of more than 25 percent relative to conventional ingot rolling. These
casters convert molten metal directly into reroll gauge sheet at 1 mm to 12 mm thickness. Continuous
strip casters employ twin counter-rotating water-cooled rolls or belts to accomplish solidification.
Strip casting is now restricted to certain low alloy content compositions. Technology is being
developed for more complex or more highly alloyed compositions. Very high solidification rates and
the extrusion component of casting between cylindrical rolls result in high degrees of segregation of
solute to the centerline and in cracking tendencies.
80

Aluminum Processing
While continuous strip casting is recognized as alloy-constrained, an alternative continuous process
for coiled reroll, slab casting is highly alloy tolerant and results in metallurgical structures that closely
correspond to those of the ingot and wrought products produced by the Direct Chill process. In slab
casting, solidification takes place between water-cooled belts or blocks. Slab thickness varies but
typically corresponds to continuous hot mill entry gauges of 75 mm to 150 mm. An individual slab
casting line has a production capacity ten times that of the largest strip caster. The cast slab is directly
fed into one or more in-line, low-speed, high-torque, hot reduction mills that reduces thickness to
coilable gauge. Slab casting processes have successfully produced high strength aluminum alloy
sheet as well as challenging products such as beverage can sheet, but subtle differences in product
performance—especially in formability and anisotropy—continue to favor the use of conventionally
hot-rolled sheet in these applications.
A further advancement in rolling technology is spray rolling. In this process, molten metal droplets
are sprayed directly into the nip of twin rolls and the material is solidified and consolidated directly
into sheet material in one step. In concept, this offers the most energy-efficient process, and recent
projects have sought to advance this technology.
9.4 Extrusion
Extrusion is the process of forcing an aluminum ingot or billet through a steel die to form an
elongated shape of consistent cross-section. Extruded products include rods, bars, tubes, and
specialized products interchangeably called shapes, sections, or profiles. Figure 9.2 shows the unit
operations of a typical extrusion plant. After rolling, extrusion is the second most common processing
technique for aluminum. Aluminum extrusion is remarkable because the process combines high
productivity with an essentially infinite variety of extremely complex shapes, cross-sections, or
profiles that cannot be economically duplicated in any other process. Furthermore, aluminum can be
readily extruded; this process is either extremely difficult or impractical for many other metals.
Figure 9.2: Typical Aluminum Extrusion Processing Operations
It is possible to produce almost any cross-sectional shape, within wide limits. Through the use of
hollow stock and floating or fixed mandrels, hollow shapes or cross-sections with complex enclosed
configurations can be produced. The extrusion process is capable of producing a cross-section with a
weight of a few grams to more than 300 kg/m, a thickness of less than 1 mm to over 250 mm,
circumscribing diameters of 5 mm to 1,000 mm and lengths in excess of 30 m. The appropriate choice
81

Aluminum Processing
of alloy and extrusion conditions can result in an optimum combination of properties for a particular
application. Such properties may include tensile strength, toughness, formability, corrosion
resistance, and machinability. Countless extrusion products are made in the United States. These
include frame and supporting shapes for windows and doors, carpet strips, household bath enclosures,
screens, bridge structures, automotive parts, aerospace components, and many other consumer
products.
Operations at individual plants vary widely depending on the cross sections and alloys produced.
Extrusion presses range in capacity up to 15,000 tons but the most common are perhaps 2,500 tons.
Presses may extrude vertically or horizontally but virtually all modern extrusion presses are
horizontal. Typically, billets in diameters up to 275 mm are preheated to temperatures ranging from
450°C to 550°C depending on the alloy, product design, and the desired mechanical characteristics.
The preheated billet is charged to the extrusion press container and forced by hydraulic pressure
through the extrusion die.
There are essentially two processes for extrusion production. In the direct extrusion process, the billet
is hydraulically pressed through the die, while in the indirect extrusion process, the die is forced over
the billet. In direct extrusion, the billet surface is retained in the extrusion container and contributes to
butt loss, which may total 8 percent of the starting billet weight. Because the billet surface is not
extruded to become part of the product, scalping is not required. For indirect extrusion, the billet
surface becomes an integral part of the product and so, scalping before extrusion is essential.
The single largest area for energy improvement in extrusion technology is the reduction of process
scrap, including butt losses. Extrusion product specifications include significant surface-quality and
chemical finishing criteria. Defects include torn surface, die pick-up which is often related to the
billet’s microstructure, and non-fill. Variable response to chemical finishing results in appearance and
color mismatches which affects product acceptability.
9.4.1 Energy Requirements for Extruding Aluminum
The United States produced over 1,826,000 metric tons of extruded aluminum products in 2003
(Appendix F, Table F.4). Extrusion processes have typical yields of 69 percent and require about
1.30(1.52
tf
) kWh/kg of extruded product.
Table 9.5: Extrusion Distribution of Energy Consumption (Appendix F, Table F.10)
Energy Category Fossil-Thermal Electrical Other Fuels
Percent
87 (25
tf
) % 7 (72
tf
) % 6 (3
tf
) %
82

Aluminum Processing
Theoretically, it is possible to extrude products without the need of additional heat treatments and
without loss of material. The minimum theoretical energy to extrude a product, in such a case, is
composed of only two components:
• the energy required to preheat the billet to extrusion temperature, and
• the energy required to deform the material through a die.
The hotter the material is, the lower the deformation energy required. The simpler the die, the lower is
the extrusion-energy requirement. The heat capacity equations needed to calculate the energy
requirements for heating pure aluminum are listed in Appendix K. The energy required to deform the
material through the die is highly dependent on the size and shape of the product and the die design.
Calculation of the minimum extrusion force is very complex and can only be estimated with
theoretical and empirical models. Typical formulae have the following simplified form:
F = A
o
(σ
m
/η) ε, where
ε, the strain, corresponds to the reduction area, ε = ln(A
o
/A
f
),
σ
m
is the mean stress for the strain,
A
o
is the original cross-sectional area, and
η is an efficiency factor.
The very large variations in alloy properties, particularly the infinite numbers of possible shapes,
make it impossible to calculate a theoretical minimum energy requirement. This value can only be
determined by analyzing a specific process, a specific extruded profile, and a specific alloy. The
perimeter of the profile and the radius of intersecting edges have a large influence on the force
required for extrusion. A rough approximation of a minimum energy value can be made by examining
the entire aluminum extrusion industry yield and energy values, and assuming an overall process-
heating efficiency and electric/hydraulic-system efficiency. This approach provides an estimate of the
minimum energy, 0.44 kWh/kg of aluminum, when efficiencies are assumed to be 50 percent for
heating and 75 percent for the electric/hydraulic system. These assumptions imply that overall
extrusion facilities operate at about 34 percent energy efficiency.
9.5 Shape Casting
Shape casting or the casting of engineered designs enables the production of simple and complex
parts that meet a wide variety of needs. The process produces parts weighing ounces to parts
weighing several tons. Figure 9.3 shows the unit operations of a typical aluminum shape casting
foundry. These operations vary significantly depending on the size of the operation, the processes
employed, the complexity of the parts, alloy compositions, and the type of castings being produced.
83

Aluminum Processing
Figure 9.3: Typical Aluminum Product Shape Casting Operations
The basic casting process consists of melting and alloying aluminum and pouring or injecting molten
metal into molds containing single or multiple cavities of the desired shape. The important casting
processes for engineered aluminum castings are pressure die, permanent mold, green and dry sand,
plaster, and investment casting.
In pressure die or die casting, metal is injected at pressures up to 10,000 psi into water-cooled steel
dies. Productivity rates are high and the process can be highly automated. While surface quality and
dimensional accuracy are excellent, the typical die casting contains a degree of internal unsoundness
associated with non-directional solidification, entrapped gasses and inclusions resulting from
turbulent metal flow, and the presence of air and lubricants in the die cavity.
Permanent mold or gravity die-castings are produced by introducing molten metal by gravity or
counter-gravity means into iron or steel molds. Productivity, surface quality and dimensional
accuracy is lower than in pressure die-casting. Internal soundness, depending on the extent to which
sound molten metal treatment for hydrogen elimination and oxide removal are practiced and the
principles of directional solidification are employed, can meet the most challenging quality standards.
Low-pressure casting is usually considered a variation of the permanent mold process even though
dry sand and plaster cast parts have been produced. In this process, molten metal is forced by the
application of pressure to rise through a tube into a mold mounted over the furnace. It has the
advantages of a significantly reduced gross to net weight ratio and correspondingly lower trimming
costs.
Green and dry sand casting can also yield high integrity parts. In green sand casting, sand, binders
such as clays, and moisture are blended to provide the molding medium. Patterns may include loose
pieces, wood models, cast match-plates, and molded styrofoam. For dry sand molding, air or thermal
setting chemicals coat sand particles so that the finished mold after curing offers superior surfaces,
dimensional accuracy, and shelf life.
Investment molds are produced by repetitive immersion of plastic, wax, or other low temperature
melting and volatile pattern material into ceramic slurries. After drying, the hardened casing
containing the pattern is heated to a temperature at which the pattern material is eliminated. Typically,
the mold is preheated before pouring and may be filled under vacuum. Investment castings offer
extremely fine finishes, thin walls, and excellent dimensional accuracy. Plaster molding offers the
same advantages and may be used for the production of thicker sections, large parts for which
investment is less suited.
84

Aluminum Processing
Molten aluminum is required as the basis for all foundry production. High volume casting operations
may acquire part or all of their metal requirements as molten metal delivered over-the-road in
insulated crucibles. Other foundries melt and process prealloyed ingot, RSI, and internal scrap
including gates and risers. All melting and melt processing technologies and considerations described
in Section 9.1 are applicable to foundry operations.
9.5.1 Energy Requirements for Shape Casting Aluminum
Nearly 2,413,000 metric tons of shape-cast products were produced in 2003. Shape casting has
typical yields of only 45 percent and requires about 2.56(2.64
tf
) kWh/kg of cast product. The energy
consumed is almost exclusively related to furnace and heating operations (Appendix F, Table F.4).
Table 9.6: Shape Casting Distribution of Energy Consumption (Appendix F, Table F.10)
Energy Category Fossil-Thermal Electrical Other Fuels
Percent
100 (80
tf
) % 0 (14
tf
) % 0 (6
tf
) %
The theoretical minimum energy requirement for shape casting can be calculated from the energy
required to go from room temperature to liquid metal plus some superheat value (Section 8.2). Pure
aluminum melts at 660°C. The minimum energy required to produce liquid aluminum at 660°C is
approximately 0.3 kWh/kg.
Alloy composition, superheat requirements, mold sprue, gates, runners, and riser systems, and post-
casting heat treatments vary by mold design and casting practices. A rough approximation of the
aluminum shape cast sector’s minimum energy requirement can be made by looking at the entire
sector yield and energy values (Appendix F, Table F.2), and assuming an overall process heating
efficiency and electric/hydraulic-system efficiency. The estimate of the minimum energy requirement
using this approach is 0.60 kWh/kg, when a 50 percent overall heating efficiency and a 75 percent
electric/hydraulic system efficiency are assumed. These assumptions imply that shape-casting
facilities operate at about 23 percent overall energy efficiency.
9.5.2 Technological Change in the Next Decade
Castings are among the most cost-effective and versatile solutions to part design and performance
challenges. The range of available alloys and properties provides combinations of manufacturability
and product characteristics for one-of-a-kind, prototype, limited, or high volume applications.
Castings are near-net-shape with the potential for precise integral internal passages and complex
shapes. Aluminum is cast in more alloys with a wider range of physical and mechanical properties by
more processes than any competing metal system.
85

Aluminum Processing
The most important trend affecting aluminum casting production is its continous growth in
automotive applications. The advantages of aluminum for many powertrain components including
transmission cases, oil pans, pistons, intake manifolds, cylinder heads, and engine blocks have been
reflected in its wide adoption.
Squeeze casting and semisolid forming have emerged as candidates for a new generation of process
capabilities producing heat-treatable, high integrity pressure die castings that utilize lower impurity
compositions, vacuum, and dry lubrication.
9.6 Thermal Treatments
A significant component of energy use in the aluminum industry is the heat treatment of metal and
products. The physical and mechanical properties of aluminum alloys in any product form can be
controllably altered by thermal treatment. Thermal treatments are used to soften the material and to
recrystallize the grain structure. Other aluminum alloys, principally those containing copper,
magnesium, silicon, and zinc can be thermally treated to significantly improve strength through the
dissolution and reprecipitation of soluble phases. Aluminum alloys are categorized as heat-treatable if
thermal treatments have significant hardening benefits or nonheat-treatable if the alloy is
unresponsive to thermal treatments for hardening purposes. Among the latter are alloys dependent on
work-hardening for strengthening and those whose properties are essentially fixed after solidification.
All product types including sheet, plate, foil, wire, rod, bar, extrusions, forgings, and castings are
produced in heat-treatable alloys. The majority of extrusions, forgings, and a large percentage of plate
and castings are heat-treated. Heat-treatment facilities are integral to larger operations. Commercial
firms also provide contracted heat-treatment services.
Annealing is performed at temperatures from 300°C to 500°C to reduce strength, improve formability
and ductility, lower residual stress levels, and improve dimensional stability in cast and wrought
products. Since electrical conductivity is adversely affected by elements retained in solution,
annealing is also used in electrical and electronic applications. Deep drawn sheet is normally
annealed. Intermediate annealing is usual practice in rolled product manufacture to permit subsequent
cold reductions. The final temper of nonheat-treatable rolled products may include annealing, partial
annealing, or stabilization treatments. Most annealing is a batch operation.
Heat-treatable aluminum alloys contain intermetallic metallurgical phases which can be dissolved at
elevated temperature (up to 550°C) and retained in solid solution by rapid quenching. Solution heat-
treatment is batch or continuous. Sheet and foil can be heat-treated continuously through accumulator
towers and plate, castings, and forgings by conveyer furnaces. Coiled sheet, plate, and extrusions are
more typically batch treated. In either case, the product must be held at solution temperature long
enough for complete solution to occur and for desirable changes in the shape or form of the insoluble
intermetallics that are present in the microstructure. The quench medium is water at room
86

Aluminum Processing
temperature. The retained metastable solid solution permits precipitation hardening at intermediate
temperatures (170°C to 300°C) for fully hardened, partially hardened, or over-aged conditions. Each
offers combinations of strengths, ductilities, toughness, stability, resistance to stress corrosion and
hardness not achievable through solidification or work hardening. Precipitation hardening furnaces
are also batch or continuous.
The high rate of solidification in many casting processes results in a degree of solution retention in
heat-treatable compositions permitting age or precipitation hardening to be employed without
solution heat-treatment. This method is extensively used in extrusions which can be press-quenched
by forced-air or water-mist to improve solution retention.
Recommended solution heat-treatment practices have been standardized to reflect worst-case
conditions. The cycle defines the minimum time at the required temperature for successfully treating
the part requiring the longest exposure. A safety factor is usually also applied to assure that reheat-
treatment will not be necessary. Practices are typically generic, applying to specific alloys and
tempers without regard for section thickness or degree of metallurgical refinement. Thinner wall
castings, forgings and extrusions generally respond to heat treatment more rapidly. Finer grain and
dendrite cell sizes are reflected in smaller, more dispersed, solute particles which can be more rapidly
dissolved. Solution heat treatment time can therefore be patterned to specific products and
manufacturing processes and the combination of finer metallurgical structures. Decreased variability
can result in substantially reduced cycle times and energy costs.
New heating technologies are being studied to reduce energy requirements through more rapid
heating to treatment temperature. Fluidized beds and infra-red heating can be used to shorten heat-up
times but do little to accelerate either the rate of solution or microstructural change once solution
temperatures are reached.
Another approach being investigated is the use of sensible heat to reduce energy requirements. While
there are metallurgical concerns, extrusions, castings, and forgings can be placed in heat-treatment
furnaces directly from the mold or die, thereby preserving the latent heat of the casting or final
forming operation.
9.6.1 Energy Requirements for Thermal Treatment
The theoretical energy required for all thermal treatments can be calculated from the specific heat or
heat capacity of the various aluminum alloys. For example; it requires 0.06 kWh/kg (95Btu/lb) to heat
A356 to its solution heat treatment temperature, 0.05 kWh/kg (80 Btu/lb) to reach annealing
temperature for 1100 alloy, and 0.02 kWh/kg (32Btu/lb) to reach precipitation hardening temperature
for alloy 2024.
87

Aluminum Processing
Time at temperature for each procedure varies depending on alloy and product form but can exceed
twelve hours. While most energy is consumed in raising the product and oven to temperature,
additional energy is required to maintain the temperature for the duration of the cycle. Sustaining
energy requirements are exclusively a function of furnace design and condition. Standard quench
temperatures include room temperature: 65°C (150°F), 80°C (180°F), and 100°C (212°F). Large
volumes of water must be heated and maintained at temperature by steam or other means for the latter
practices.
88

Endnotes
1
Aluminum Statistical Review for 2003 (Washington, D.C.: The Aluminum Association, Inc.,
2004), 7. The Aluminum Association’s statistical reviews are issued annually and assemble, in
one document, important detailed data from primary production, to markets for finished goods,
to the recovery of scrap. Both U.S. and world information is included.
2
Aluminum Industry: Vision Sustainable Solutions for a Dynamic World, (Washington, D.C.:
Aluminum Association, Inc., November 2001), 3. The Vision document identifies key needs of
the industry and outlines a comprehensive aluminum R&D agenda.
3
Production of Aluminium and Alumina, ed. A.R. Burkin (Chichester: John Wiley & Sons, 1987)
(p. 38). This book, published on behalf of the Society of Chemical Industry, is one of the only
texts to provide a comprehensive overview of the state-of-the-art of all science and technologies
associated with primary aluminum production in a single volume. It is a detailed, academic
volume that covers chemistry, thermochemistry, fluid dynamics, process dynamics, etc., from
both a theoretical and practical perspective.
4
Dietrich G. Altenpohl, Aluminum: Technology, Applications, and Environment; A Profile of a
Modern Metal, Sixth Edition (Washington, D.C.: The Aluminum Association, Inc. and the
Minerals, Metals and Materials Society, 1998). This book is described in its foreword as having
“global recognition as the definitive educational text and reference book for aluminum industry
participants, a broad range of aluminum fabricators and users, students, and the scientific,
engineering, and academic community.”
5
Aluminum Industry Vision, Sustainable Solutions for a Dynamic World, 22.
6
Robert D. Naranjo, Ehr-Ping Huang Fu, and Mike Gwyn, “Castings Drive Fuel Efficiency,”
Modern Casting Vol. 94 No. 9 (September 2004), pg. 20.
7
Life Cycle Inventory Report for the North American Aluminum Industry (Washington, D.C.:
Aluminum Association, Inc., 1998). This report is summarized in Appendix F. This report
provides information on a life cycle inventory study of the North American aluminum industry in
1995. The report is the result of extensive surveying and contains the best and most complete
industry performance information of any recent study. The report was produced in accordance
with International Organization for Standardization (ISO) procedures and was favorably peer-
reviewed by groups outside the industry.
8
Energy and Environmental Profile of the U.S. Aluminum Industry (Washington, D.C.: U.S.
Department of Energy Office of Industrial Technologies Program, July 1998). This report
reviews the energy and environmental characteristics of the key technologies used in the major
processes of the aluminum industry.
89

9
Aluminum Statistical Review for 2003, 49.
10
“Bauxite and Alumina Statistics and Information,” U.S.Geological Survey, Minerals
Information, Available: [http://minerals.usgs.gov/minerals/pubs/commodity/bauxite/].
11
Aluminum Statistical Review for 2003, 7.
12
Aluminum Statistical Review for 2003, 38, 42.
13
Life Cycle Inventory Report for the North American Aluminum Industry, E-3.
14
Technology Roadmap for Bauxite Residue Treatment and Utilization (Washington, D.C.: The
Aluminum Association, February 2000). This booklet contains a comprehensive discussion of
bauxite residue.
15
Production of Aluminium and Alumina, 38.
16
Energy and Environmental Profile of the U.S. Aluminum Industry, 29.
17
Life Cycle Inventory Report for the North American Aluminum Industry, E-8.
18
Life Cycle Inventory Report for the North American Aluminum Industry, E-8.
19
Alumina Technology Roadmap (Washington, D.C.: the Aluminum Association, Inc., November
2001). This document identifies performance goals and describes 25 research and development
areas that are a priority for the global alumina industry.
20
Paul J. Ellis, “Tutorial: Petroleum Coke Calcining and Uses of Calcined Petroleum Coke,” 13.
Speech given at AIChE 2000 Spring National Meeting, 3
rd
International Conference on Refining
Processes, March, 2000.
21
Production of Aluminium and Alumina, 57.
22
Life Cycle Inventory Report for the North American Aluminum Industry, E-6.
23
Production of Aluminium and Alumina, 49.
24
Ellis, 13.
25
“The Manufacture of Carbon and Graphite,” Chapter in Industrial Graphite Engineering
Handbook, (Parma, OH: UCAR Carbon Company, Inc, 2001) 1-6.
26
Aluminum Statistical Review for 2003, 10-11.
90

27
Warren Haupin, “History of Electrical Consumption by Hall-Héroult Cells,” Chapter in Hall-
Héroult Centennial, ed. W. Peterson and R. Miller (New York: the Metallurgical Society of
AIME, 1986) 106. This article provides a detailed historical review of energy usage in the Hall-
Héroult process from the first cells to 1986.
28
R.P. Pawlek, “75 Years of Development of Aluminum Electrolysis Cells,”Aluminium, 75.9
(1999): 734-743.
29
Barry J. Welch, “Aluminum Production Paths in the New Millennium,” Journal on Metals51.5
(February 1999): 24-28.
30
Report of the American Society of Mechanical Engineers’ : Technical Working Group on Inert
Anode Technologies (Washington, D.C.: U.S. Department of Energy Office of Industrial
Technologies, July 1999) Appendix A-9: Thermodynamics of Electrochemical Reduction of
Aluminum, 3. This report reviews the literature and patents concerning inert anode technologies.
It presents a theoretical discussion of aluminum reduction and has input from over eleven experts
in the field. Carbon anode voltage equation E = 1.898 - 0.0005728 x T, where E is in V(dc) and T
is in degrees Kelvin.
31
Noel Jarrett, W.B. Frank, and Rudolf Keller, “Advances in Aluminum Smelting,” Metallurgical
Treatises AIME VI.93 (1981): 137.
32
Production of Aluminium and Alumina, 63.
33
U.S. Environmental Protection Agency, Office of Air and Radiation, Web site. Available:
[www.epa.gov/globalwarming/].
34
G. D. Brown, M. P. Taylor, G. J. Hardie, and R.W. Shaw, from Comalco Aluminum Ltd., “TiB
2
Coated Aluminum Reduction Cells: Status and Future Direction of Coated Cells in Comalco.”
Paper presented at the Queenstown Aluminum Smelting Conference, 26 Nov 1998.
35
Mark P. Taylor, Gregory J. Hardie, Fiona J. Stevens McFadden, and William Uru from Comalco
Aluminum Ltd., “Use of Refractory Hard Cathodes to Reduce Energy Consumption in
Aluminum Smelting.” Paper presented at the Second International Conference on Processing
Materials for Properties, TMS 2000 Technical Program.
36
Use of Refractory Hard Cathodes to Reduce Energy Consumption in Aluminum Smelting.
37
Larry Boxall, Arthur V. Cooke, and Wayne Hayden,“TiB
2
Cathode Material: Application in
Conventional VSS Cells,” Journal of Light Metals 36.11 (November 1984): 35-39.
38
Low Energy Aluminum Reduction Cell With Induced Bath Flow, U.S. Patent 4,602,990.
91

39
Report of the American Society of Mechanical Engineers’ : Technical Working Group on Inert
Anode Technologies, 28.
40
Thomas M. Leeuwen, “An Aluminum Revolution,” Desk Notes, (Credit Suisse First Boston
Corporation: 22 June 2000).
41
Report of the American Society of Mechanical Engineers’ : Technical Working Group on Inert
Anode Technologies, Appendix A-9. Inert anode voltage equation, E = 2.922 - 0.0005712 x T,
where E is in V(dc) and T is in degrees Kelvin.
42
Report of the American Society of Mechanical Engineers’ : Technical Working Group on Inert
Anode Technologies, Appendix A-9: Thermodynamics of Electrochemical Reduction of
Aluminum.
43
Inert Anode Roadmap: A Framework for Technology Development (Washington, D.C.: The
Aluminum Association, Inc. and the U.S Department of Energy Office of Industrial
Technologies Program, Feb. 1998), 1. This document describes the potential benefits,
performance targets, technical barriers and technology development steps associated with the
R&D and production of inert anodes.
44
D. Bhogeswara Rao, U.V. Choudry, T.E. Erstfeld, R.J. Williams, and Y.A. Chang, “Extraction
Processes for the Production of Aluminum, Titanium, Iron, Magnesium, and Oxygen from
Nonterrestrial Sources,” Chapter in Space Resources and Space Settlements (Moffett Field,
California: NASA Ames Research Center Summer Study, 1977) 15.
45
Warren Haupin, “Reflections on the Hall-Héroult Process,” Editorial in Molten Salts Bulletin, ed.
59 (Marseille: Ecole Polytechnique, Universitarire de Marseille).
46
Craig Brown, “Next Generation Vertical Electrode Cell,” Journal on Metals 53.5 (May 2001):
39-42.
47
Vianey Garcia-Osorio and B. Erik Ydstie (the Department of Chemical Engineering Carnegie
Mellon University) and Tor Lindstad (SINTEF MAterials Technology), “Dynamic Model for
Vapor Recovery in Carbothermic Aluminum Process.”
48
Kai Johansen, Jan A. Aune, Marshal Bruno, and Anders Schei, “Carbothermic Aluminum -
Alcoa and Elkem’s New Approach Based on Reactor Technology to Meet Process
Requirements.” Paper presented at the Sixth International Congress on Molten Slags, Fluxes,
and Salts, Stockholm, June 2000.
49
“Toth Aluminum Corporations’s Bipolar Clay-Aluminum Technology and Project,” Seminar
Edition. Paper presented at TMS annual meeting, New Orleans, 11 February 2001.
50
Life Cycle Inventory Report for the North American Aluminum, E-12.
92

51
Aluminum Statistical Review for 2003, 12.
52
“New Technology is a Breakthrough for Automotive Aluminum Recycling,” Aluminum Now
November/December 2000: 28.
53
“Melt Loss Reduction in Recycling Processes,” J.H.L. Van Linden, Katholieke Universiteit
Leuven, May, 1988.
54
“Aluminum Dross - Liability into Opportunity,” E.L. Rooy, Light Metal Age, June, 1995.
55
Aluminum Statistical Review for 2003, 19-23.
56
Metal Melting Practices and Procedure for Efficiency and Effectiveness, 20
57
Metal Melting Practices and Procedure for Efficiency and Effectiveness (California Cast Metals
Association: Summer 2001), sponsored by The California Energy Commission. This and its
companion booklet Foundry Energy Use Study and Conservation Manual provide detailed,
furnace design information and operational survey data on melting and furnace practices for non-
ferrous metals in the State of California.
58
Applications for Advanced Ceramics in Aluminum Production: Needs and Opportunities
(Washington, D.C.: The Aluminum Association, Inc., February 2001).
59
Shaun Hamer, Bruno Taraglio, and Chris Romanowski, “Continuous Casting and Rolling of
Aluminum: Analysis of Capacity, Product Ranges, and Technology,” Light Metal Age 60.9-10
(October 2002): 6.
93

Alumina
Aluminum
Anode
Anode-Cathode Distance
(ACD)
Anode Effect
Bath
Bauxite
Bayer Process
Calcining
Carbon Dioxide Equivalents
(CDE)
Carbon Equivalents (CE)
Carbothermic Reduction
Glossary
An oxide of aluminum (Al
2
O
3
) and the compound from which aluminum metal is
commercially obtained.
A versatile, silvery-white metal. When exposed to the atmosphere, aluminum
rapidly forms an oxide film that prevents it from reacting with air and water. This
gives it exceptional corrosion-resistant properties. Aluminum is not found in
nature as a free metal like gold, but is chemically bound to other elements.
Aluminum is the most abundant metal in the earth’s crust (8.1 percent).
Atomic Number ... 13
Atomic Mass........ 26.982
Melting Point ...... 993.52
°
K
Boiling Point ....... 2698
°
K
A positively charged mass or surface that attracts negatively charged ions
(anions). The anode used in the Hall-Héroult Process is composed of carbon. The
oxygen containing anions react on the anode surface, releasing oxygen that
consumes the carbon to form carbon dioxide.
The geometric linear distance between the anode and the cathode is a critical
measurement in an electrolytic cell. This distance affects the voltage and energy
requirement of a cell.
An aluminum-industry idiom used to describe a process upset where the anode
reaction shifts from producing oxygen to fluorine, and the cell voltage increases.
Anode effects are primarily the result of having insufficient alumina dissolved in
the bath and available at the anode for reduction.
An aluminum-industry idiom referring to the cryolite-based electrolyte pool in the
reduction cell.
A prime source of alumina, found as a collection of small, reddish-brown nodules
in a light brown, earthy matrix. Commercial bauxite ore contains 30 to 60 weight
percent of alumina.
A process developed by Karl Bayer in 1888 that refines bauxite ore into alumina
grains. It is the process currently in use worldwide.
The process of heating a material to a sufficiently high temperature to drive off
volatile components or to oxidize the material without fusing it. The aluminum
industry uses calcining in the Bayer Process to produce alumina and to prepare
coke for anodes.
The preferred unit of measure used to compare the impact of different
Greenhouse Gases. It is calculated by multiplying the quantity of a Greenhouse
Gas emission by the Global Warming Potential (GWP) of the gas. The results are
commonly expressed in terms of a million metric tons of carbon dioxide
equivalent (10
6
TCDE).
A unit of measure used to compare the impact of different Greenhouse Gases
(GHG). It is calculated by multiplying the Carbon Dioxide Equivalent (CDE) by
12/44, the mass ratio of carbon to carbon dioxide.
An alternative process to electrolytic reduction. The carbothermic process reduces
alumina in a high-temperature furnace with carbon.
94

Castings Metal objects which are cast into a shape by pouring or injecting molten/liquid
metal into a mold. This report divides castings into ingot and shape categories.
Ingot castings are produced in molds of very simple cross-section and shape
castings are complex structures.
Cathode A negatively charged surface that attracts positively charged ions (cations). The
cathode surface in the Hall-Héroult Process is the molten aluminum pad, which
rests directly on the cell’s carbon lining. The aluminum containing cations reacts
on the cathode surface, releasing the aluminum as free metal.
Chloride Reduction An alternative process to alumina electrolytic reduction in which aluminum
chloride is used as the feed to the reduction cell.
Coke A carbon product of the crude oil refining industry. Green or raw coke contains 8
to 10 percent moisture and 5 to 15 percent volatile organic materials. Coke is
calcined in thermal kilns to remove moisture and volatile organic materials.
Cryolite Na
3
AlF
6
, a mineral that when molten dissolves alumina to form aluminum and
oxide ions. It is the main component used in the electrolyte bath for aluminum
production.
Dross The material that forms on the surface of molten aluminum as it is held in a
furnace. It is composed of impurities that have surfaced as a result of gas fluxing,
oxidized aluminum that is the result of molten aluminum exposure to the furnaces
atmosphere and aluminum that becomes entrapped in the surface material. Dross
is periodically skimmed off the surface of molten aluminum and processed to
recover its aluminum content.
Dusting An aluminum industry idiom used to describe fine carbon anode particles that are
lost in the electrolyte bath or atmosphere during electrolytic reduction. Dusting
results in a loss of productivity.
Electrolysis An electrochemical process in which the charged species in an electrolyte are
attracted to electrodes where they react with the electrons of the electrical current.
Positively charged ions migrate to the cathode and negatively charged ions
migrate to the anode.
Electrolyte A nonmetallic electrical conductor in which current is carried by the movement of
ions.
Extrusion The process of forcing the metal ingot (or billet) to flow through a die to create a
new cross-section.
Feedstock Energy
These values represent the energy inherent in a fuel that is used as material. For
example, aluminum production uses coke as the raw material in carbon anodes.
The energy contribution of a feedstock is expressed in terms of calorific or fuel
value plus the tacit/process energy used to produce the feedstock.
Global Warming Potential
(GWP)
Greenhouse gases differ in their abilities to trap heat. Global Warming Potential is
used to express the greenhouse effect of different gases in a comparable way. The
heat-trapping ability of one metric ton of CO
2
is the common standard, and
emissions are expressed in terms of a million metric tons of CO
2
equivalent or 10
6
TCDE.
Greenhouse Gases (GHG)
Atmospheric gases that contribute to climate change by increasing the ability of
the atmosphere to trap heat.
95

Hall-Héroult Process
Ingot
Kilowatt-hour (kWh)
Life Cycle Assessment (LCA)
Onsite Energy
Pad
Polarization
Pot
Potline
Potlining
Primary Aluminum
Quad
Red Mud
Reduction Cell
An electrolytic process for reduction of alumina, developed independently by
Charles Martin Hall and Paul Lewis Toussaint Héroult in 1886. This process is
commonly referred to using both names, the Hall-Héroult process. It is the pro-
cess used worldwide for commercial aluminum production.
Ingot as used in this report describes an aluminum casting of simple shape. It
includes billets, pigs, sows, T-bar and other simple cast semifinished shapes.
A unit of energy.
An internationally recognized analysis model of a product’s impact on energy,
environment, economic, and social values. LCA extends from “cradle-to-grave”:
from material acquisition and production, through manufacturing, product use
and maintenance, and finally, through the end of the product’s life in disposal or
recycling. The LCA is particularly useful in ensuring that benefits derived in one
area do not shift the impact burden to other places within a product’s life cycle.
The energy used within a facility. This is sometimes called “primary energy.”
Electrical onsite energy is the kilowatt hours used and does not include the “sec-
ondary energy” required for generation and transmission of electricity. Fuel onsite
energy use is based on the calorific heating value of the fuel and does not include
the “secondary energy” required to produce and transport the fuel.
An aluminum industry idiom used to describe the body of molten aluminum that
accumulates within the Hall-Héroult electrolytic cell.
The nonuniform concentration gradients that form near electrodes during the
reduction process. The reactions occurring at the anode and the cathode create
localized conditions that are different from the bulk of the bath. The reactions
deplete the supply of reactants and increase the quantity of products. Additionally,
in aluminum electrolysis, gas is generated at the anode which lowers the effective
bath conductivity. An electric overpotential is required to overcome the effects of
polarization.
An aluminum industry idiom used to describe an electrolytic cell. The term was
derived from the shape of the first cells.
An aluminum industry idiom that describes the arrangement of a long row of
interconnected electrolytic cells (pots).
An aluminum industry idiom that describes the refractory and carbon materials
used to line the interior of the cell (pot).
Refers to aluminum metal produced directly from alumina feedstock by chemical
reduction.
A common abbreviation for a quadrillion Btu. (1 quad = 10
15
Btu.)
The residue of insoluble materials that results from extracting alumina from
bauxite ore. It is also referred to as “bauxite residue.”
A container holding single or multiple anodes, cathodes and an electrolytic bath
used for reducing a material.
96

Reverberatory Furnace The most commonly used furnace type in the aluminum industry. The furnace is
box-shaped and consists of a steel shell with refractory lining. Fuel is fired
directly into the box either from the roof, or more typically, from the sidewall.
Heat is transferred to the molten metal with convection and radiation.
Rolling A process that results in the reduction of the cross-sectional area of a metal shape
as it is passed through rotating rolls.
Secondary Aluminum Aluminum metal that is produced from recycled aluminum products and wastes.
Tacit Energy A term used to describe an energy value that equals the combination of onsite
energy (“primary energy”) consumption, the process energy required to produce
and transmit/transport the energy source (“secondary energy”), and feedstock
energy (energy inherent in fuels used as materials). This report uses the
superscript “tf” to denote any value that includes the tacit and feedstock energy
contributions. The report does not include the energy used to make the equipment
or buildings that house the process steps (“tertiary energy”).
Urban Mining A term that describes the large source of aluminum available through urban
recycling programs as compared to bauxite mining.
Value Chain Analysis A method that captures the energy and material inputs and outputs of each
processing step (link) and builds the cumulative value for each product along the
chain. A value chain analysis or “cradle to shipping dock” analysis is an integral
part of a Life Cycle Analysis.
97

Appendix A: Summary of Production and Energy Data for the U.S.
Aluminum Industry
The following tables summarize the U.S. aluminum industry production and energy data developed in
this report. Energy data are based on requirements to produce a kilogram of aluminum. Process
energy is a direct measure of the energy used within a processing facility, the onsite energy. Gross
Energy
tf
is a tacit measure of the total energy consumed and consists of the process energy plus the
energy associated with the generation and transmission of electricity, the energy content of fuel
products that are used as materials (e.g., carbon used as anodes) and the energy required to produce
fuels.
Table A.1: Theoretical, Process, and Gross Energy Requirements
Ratio of
Material to
Primary
Aluminum
Produced
kg/kg of
Aluminum
Theoretical
Minimum
Energy
Requirement
kWh/kg of
Aluminum
Process
Energy
Required
kWh/kg of
Aluminum
Overall
Process
Energy
Efficiency
percent
Gross
Energy
tf
Required
kWh/kg of
Aluminum
Overall
Gross
Energy
tf
Efficiency
percent
Bauxite Mining 5.10 0.00 0.32 0% 0.34 0%
Alumina Refining 1.93 0.27 7.27 4% 7.90 3%
Anode Production 0.45 4.40 5.71 77% 5.96 74%
Aluminum Smelting 1.00 5.99 15.58 38% 46.54 13%
Primary Casting 0.33 1.01 33% 1.46 23%
Secondary Casting 0.33 2.50 13% 2.81 12%
Rolling 0.32 0.63 51% 1.26 25%
Extrusion 0.44 1.30 34% 1.52 29%
Shape Casting 0.33 2.56 13% 2.64 13%
98

Appendix A: Summary of Production and Energy Data for the U.S. Aluminum Industry
Table A.2: United States Total Energy Requirements and Potential Savings
U.S. Theoretical U.S. Potential
Total U.S. Potential
Annual Minimum Process Process U.S.
Gross Gross U.S.
Production Energy Energy Energy
Energy
tf
Energy
tf
2003 Requirement Required Savings
Required Savings
metric tons
kWh (10
9
)
/ yr
kWh (10
9
)
/ yr
kWh (10
9
)
/ yr
kWh (10
9
)
/ yr
kWh (10
9
)
/ yr
Bauxite Mining*
Alumina Refining* 2,661,500 0.37 10.02 9.65 10.89 10.52
Anode Production 1,230,000 12.12 15.75 3.63 16.45 4.33
Aluminum Smelting 2,758,000 16.52 42.97 26.46 128.36 111.84
Primary Casting 2,704,000 0.90 2.73 1.83 3.94 3.04
Secondary Casting 2,820,000 0.94 7.05 6.11 7.93 6.99
Rolling 4,842,600 1.55 3.04 1.49 6.08 4.53
Extrusion 1,826,000 0.80 2.37 1.57 2.77 1.97
Shape Casting 2,413,000 0.80 6.17 5.36 6.37 5.56
Total 34.00 90.10 56.10 182.77 148.78
* Bauxite is no longer mined in the United States in quantities large enough for commercial
aluminum production. Bauxite is imported and refined to alumina in the United States. However, the
United States imported 53% of the alumina needed to produce aluminum in 2003 (see Appendix H).
99

Appendix B: Energy Intensity of Materials Produced in the United States
Aluminum metal is the most energy-intensive major product manufactured in the United States.
Aluminum, by several measures, is one of the most energy-intensive (Btu/lb) materials produced,
ranking at the top among the major products of the United States. Table B.1 shows a comparison of the
onsite energy requirements for several major products manufactured in the United States. These values
do not include the energy content of fuels used as materials or the generation and transmission losses
associated with electricity production.
Table B.1: Energy Requirements to Produce Materials in the United States (2002)
a b c a b c
Btu/yr Btu/lb lb/yr
Data Sources
†
Paper & Paper Board 2.75E+15 15,590 1.76E+11 MECS a/c MECS
Gasoline 2.41E+15 2,659 9.07E+11 b*c Drexel EIA(2)
Iron & Steel 1.79E+15 8,700 2.06E+11 b*c Steel, pg 23 Steel(A), pg 1
Ethylene 4.22E+14 8,107 5.21E+10 b*c E&E, pg 28 ACC, pg 31
Aluminum (primary ingot) 7.22E+14 44,711 1.62E+10 b*c
Appendix F,
Table F.1
Appendix G
Distillate 3.63E+14 990 3.67E+11 b*c Drexel EIA(2)
Ammonia 3.53E+14 12,150 2.90E+10 b*c E&E, pg 32 ACC, pg 31
Propylene 4.30E+13 1,351 3.18E+10 b*c E&E, pg 28 ACC, pg 31
Jet Fuel 1.46E+14 990 1.47E+11 b*c Drexel EIA(2)
Coal 1.29E+14 60 2.14E+12 b*c EIA(1) EIA(1)
Benzene 2.03E+13 1,255 1.62E+10 b*c E&E, pg 30 ACC, pg 31
†
The data sources in a,b and c columns indicate the source of values in the corresponding data columns. For
key to the abbreviations, see Sources for Tables B.1 and B.2 on page 101.
The data in Table B.2 are the onsite process energy requirements to produce the corresponding products
plus, the energy content of fuels used as materials, and the generation and transmission losses associated
with electricity production. Examples of the energy content of fuels used as materials (feedstock energy)
are: 22,681 Btu/lb is the feedstock energy for ethylene; wood products are commonly assumed to have
no feedstock value since they are renewable resources; and petroleum calcined coke used as a raw
material in aluminum production has a feedstock energy of 15,250 Btu/lb.
100

Appendix B: Energy Intensity of Materials Produced in the United States
Table B.2: Gross Energy Requirements to Produce Materials in the United States (2002)
a b c a b c
Btu/yr Btu/lb lb/yr
Data Sources
†
Paper & Paper Board 2.75E+15 15,590 1.76E+11 MECS a/c MECS
Gasoline 2.41E+15 2,659 9.07E+11 b*c Drexel EIA(2)
Iron & Steel 1.79E+15 8,700 2.06E+11 b*c Steel, pg 23
Steel(A),
pg 1
Ethylene 1.74E+15 33,470 5.21E+10 E&E, pg 28 a/c ACC, pg 31
Propylene 8.90E+14 27,978 3.18E+10 E&E, pg 28 a/c ACC, pg 31
Ammonia 6.95E+14 23,917 2.90E+10 E&E, pg 32 a/c ACC, pg 31
Benzene 5.38E+14 33,305 1.62E+10 E&E, pg 30 a/c ACC, pg 31
Aluminum (primary ingot) 5.59E+14 94,030 5.95E+09 a*b
Appendix F
Table F.1
Appendix G
Distillate 3.63E+14 990 3.67E+11 a*b Drexel EIA(2)
Coal 1.29E+14 60 2.14E+12 b*c EIA(1) EIA(1)
Jet Fuel 1.46E+14 990 1.47E+11 b*c Drexel EIA(2)
†
The data sources in a,b and c columns indicate the source of values in the corresponding data columns.
For key to the abbreviations, see Sources for Tables B.1 and B.2 below.
Sources for Tables B.1 and B.2
ACC: Guide to The Business of Chemistry, American Chemical Council, 2003
Drexel: Energy Analysis of 108 Processes, Harry Brown, Drexel University, 1996
E&E: Energy and Environmental Profile of the U.S. Chemical Industry, May 2000, DOE-OIT
EIA(1): Coal Industry Annual 2003, Energy Information Agency, DOE
EIA(2): Petroleum Annual 2003, Energy Information Agency, DOE
MECS: Manufacturing Energy Consumption Survey, Energy Information Agency, DOE
Steel : Energy Use in U.S. Steel Industry: A Historical Perspective and Future Opportunities,
Dr. J. Stubbles, Sept 2000
Steel(A): Steel Industry of the Future, FY 2004 Annual Report, DOE
101

102
Appendix C: Energy Values for Energy Sources and Materials
Calorific energy values are the energy content inherent to the material. Except for pure materials, e.g., propane, these values vary depending on the raw
materials used and the final products formulations.
Process energy is a measure of the energy required to manufacture the material. Process Energy values are also variable and depend on equipment
efficiency estimates and system boundaries. These values for crude oil-derived products are variable and depend on the specific crude processed, refinery
configuration, local product specifications and refinery efficiency. Process energy values from the California Energy Commission (CEC) include the
energy for processing, as well as factors for raw material, e.g. delivery of crude to refiners and transporting fuels to their point of use.
Tacit or gross energy is the sum of the calorific and process energy values.
Table C.1: Energy Values for Energy Sources and Materials
Input
Unit
Calorific Energy Values
"Primary Energy"
Process Energy Values
"Secondary Energy"
Tacit
Energy
Input
Unit
Btu per Data
Input Unit Source
Btu per Common Unit
Btu per Data
Input Unit Source
Btu per Common Unit
Required to Produce
Btu per
Input Unit
FUELS
†
Fuel Oil, medium
Fuel Oil, light
Diesel
Kerosene
Gasoline
Natural Gas
Bituminous/Sub
Calcined Coke
Pitch
Green Coke
Propane
Coal
kg
kg
L
L
L
m
3
kg
kg
kg
kg
L
kg
139,000 Btu/gal 43,380
cogeneration.net
150,000 Btu/gal 46,813
cogeneration.net
5,670,000 Btu/bbl 35,667 EIA
5,670,000 Btu/bbl 35,667 AEO2004
5,198,000 Btu/bbl 32,698 AEO2004
1,027
Btu/ft
3
36,268 AEO2004
11,110 Btu/lb 24,493 CIA2000
15,250 Btu/lb 33,620 MidCon
6,065,000 Btu/bbl 38,152 E&E, pg 52
14,200 Btu/lb 31,305 MidCon
3,824,000 Btu/bbl 24,055 EGGUS
10,240 Btu/lb 22,574 AEO2004
5,000 Btu/gal 1,321 Drexel
5,000 Btu/gal 1,321 Drexel
5,200 Btu/gal 1,374 CEC
5,200 Btu/gal 1,374 CEC
12,000 Btu/gal 3,170 CEC
30
Btu/ft
3
1,059
60 Btu/lb 132 E&E, Mining
179 Btu/lb 395 E&E, pg 52
18 Btu/lb 40 E&E, pg 52
Btu/lb 500 Drexel
Btu/lb
60 Btu/lb 132
44,700
48,130
37,040
37,040
35,870
37,330
24,630
34,010
38,190
31,810
24,050
22,710
kg
kg
L
L
L
m
3
kg
kg
kg
kg
L
kg
kWh
kWh
kWh
kWh
ELECTRICITY
Electric
Avg U.S. Electric*
Primary Al Electric**
Coal-Fired Electric
kWh
kWh
kWh
kWh
1 kWh 3412 ISO
1 kWh 3412 ISO
1 kWh 3412 ISO
1 kWh 3412 ISO
Hydroelectric Utility 0 ISO
Average U.S. Grid 6,856 tacit Btu
Primary Al Electric** 4,208 tacit Btu
Coal-Fired Utility 6,976 tacit Btu
3,412
10,270
7,620
10,390
†
Fuels and fuels used as materails
* Tacit Btu accounts for generation and transmission energy losses for average U.S. generation (see Appendix D, Table D.4)
**
Tacit Btu for electrolysis and anode manufacture is lower then general electricity because of the large 39.4% hydro component
Sources for Table C.1
AEO2004 - Annual Energy Outlook 2004, Energy Information Agency, Jan 2004, pg 262
CEC - California Energy Commission
CIA2000 - Coal Industry Annual 2000, Energy Information Administration, Jan 2002, pg 284. This report uses an average value for bituminous and sub-bitumenous coals.
Drexel - data derived from Drexel University study
E&E - the "Energy and Environmental Profile" for Aluminum and Mining (documents from DOE, ITP)
EIA - Emissions of Greenhouse Gases in the United States 1987-1992, Energy Information Agency, Oct 1994 (Appendix A)
ISO - Independent System Operators
EGGUS - Emissions of Greenhouse Gases in the United States 1987-1992, Energy Information Agency, Oct 1994 (Appendix A)
MidCon - data from Mid-Continent Coal & Coke Co.
The process ("secondary energy") energy values contribute about 3% additional energy to the total carbon-based fuel energy of the U.S. aluminum
industry. This includes the energy expended worldwide for the production of aluminum in the United States. The United States does not mine bauxite, but
refines it to supply 47% of the alumina needed in 2003 and imported the remaining 53% of alumina required for aluminum production.
Table C.2: kWh/yr of Fuels Consumed Worldwide for U.S. Aluminum Processing Excluding Electricity and Coke Feedstock Energy
Mining Refining Anode w/ Electrolysis Primary Secondary Hot Cold Extrusion Shape TOTAL
Feedstock Casting Casting Rolling Rolling Casting
No Process
(
"secondar
y
ener
gy
"
)
inputs for fuels
(
kWh/
y
r
)
8.86E+08 1.95E+10 1.35E+09 5.00E+08 2.16E+09 6.73E+09 8.62E+08 6.93E+08 2.20E+09 6.16E+09
4.10E+10
With Process
(
"secondar
y
ener
gy
"
)
inputs for fuels
(
kWh/
y
r
)
9.21E+08 2.00E+10 1.39E+09 5.14E+08 2.22E+09 6.95E+09 8.87E+08 7.17E+08 2.26E+09 6.34E+09
4.22E+10
Percent Process
(
"secondar
y
ener
gy
"
)
fuel contributio
n
4% 3% 3% 3% 3% 3% 3% 3% 3% 3%
3%
Tacit electric energy conversion factors vary significantly depending on the fuel source used to generate electricity. The large variation in electric tacit
conversion factors creates the need for careful analysis when comparing different studies. A completely coal-fired electric-based smelting operation
requires 2.5 times greater tacit energy than a completely hydroelectric smelting operation (Appendix D, Table D.1).
Table C.3: Impact of Electric Tacit Conversion Factors on kWh/yr Consumed Worldwide for U.S. Aluminum Production
Mining Refining Anode w/ Electrolysis Primary Secondary Hot Cold Extrusion Shape
Feedstock Casting Casting Rolling Rolling Casting
TOTAL
Average U.S. Aluminum Processing Facilities
10,270 Btu of energy required to produce 1 kWh of onsite electrical power for all U.S. aluminum facility operations.
kWh/yr 9.38E+08 2.18E+10 1.64E+10 1.28E+11 3.94E+09 7.93E+09 2.82E+09 3.26E+09 2.77E+09 6.37E+09
Percent increase relative to a facilities with 100% hydroelectric energy resource
% 4% 9% 4% 199% 44% 12% 87% 112% 17% 3%
1.95E+11
93%
U.S. Aluminum Processing Facilities with 100% electrical power generated by hydroelectric utilities
3,412 Btu of energy required to produce 1 kWh of onsite electrical power from hydroelectric resources for all U.S. aluminum facilitie
s
kWh/yr 8.99E+08 2.00E+10 1.57E+10 4.30E+10 2.73E+09 7.05E+09 1.50E+09 1.54E+09 2.37E+09 6.17E+09 1.01E+11
U.S. Aluminum Processing Facilities with 100% electrical power generated by coal-fired utilities
10,390 Btu of energy required to produce 1 kWh of onsite electrical power from coal resources for all U.S. aluminum facilities
kWh/yr 9.38E+08 2.18E+10 1.65E+10 1.33E+11 4.00E+09 7.97E+09 2.90E+09 3.36E+09 2.79E+09 6.37E+09
Percent increase relative to a facilities with 100% hydroelectric energy resource
% 4% 9% 5% 211% 47% 13% 93% 119% 18% 3%
2.00E+11
98%
Appendix C: Energy Values for Energy Sources and Materials
103

Appendix D: Hydroelectric Distribution and Electrical Energy Values
Significant energy is consumed in the generation and transmission of electricity. Tacit electric energy conversion factors
include the energy associated with production, processing and distribution of the "primary-energy" sources used in the
production of electricity. Tacit values vary significantly depending on the source of energy.
In the United States, 39.4% of aluminum smelting capacity utilizes hydroelectric power.
1
Table D.1: Electric Tacit Energy and Emission Data for Fuels Used for Aluminum Producion
Electrical Energy
Source
U. S. Primary Aluminum Capacity
1
metric tons %
Heat Rate
2
(2003)
Btu/kWh
Carbon Emission
Coefficient
3
Mt/Qbtu
Hydro
Coal
Oil
Natural Gas
Nuclear
1,633,696 39.4%
2,415,826 58.2%
8,245 0.2%
31,120 0.8%
60,112 1.4%
3,412
10,388
10,203
8,021
10,440
0
21.25
19.08
12.50
0
Total 4,149,000 100.0%
Weighted Averages based on Aluminum Capacity
Average US Grid
4
7,624
10,268
12.51
13.56
1
The distribution of electrical sources for U.S. Primary Aluminum capacity is obtained by
subtracting the Canadian capacity of 2.827 million metric tons (2002), which is 100%
hydroelectric, from the North American Totals presented in Table D.2.
2
Heat Rate values are derived using the Primary energy values in Appendix C, Table C.1 and the
Net Generation and Consumption values listed in the "Annual Energy Review 2003," Energy
Information Administration, pg 224.
3
Carbon Emission Coefficient values are derived using the Heat Rate Values in this table and the
Electric Power Industrial Sector Carbon Dioxide Emissions by Fuel Input for Year 2000 listed in
the "Emissions of Greenhouse Gases in the United States 2000," Energy Information Agency,
November 2001, page 23.
4
Appendix D, Table D.4
This Report Uses
10,270 Tacit Btu per kWh for all electricity consumed in U.S. aluminum
processing operations. This value overstates the actual aluminum related tacit
values (which is 7,620 Btu/kWh); but it is m
ore useful for comparing the
aluminum industry to other U.S. manufacturing operations.
104

Appendix D: Hydroelectric Distribution and Electrical Energy Values
Electrical Power Used In Primary Aluminium Production Worldwide
Table D.2: Energy Sources of Electrical Power in 2002 (electrical power used in gigawatt hours)
Electric
Energy
Source
Africa
GWh
North America
GWh %
Latin
America
GWh
Asia
GWh
Europe
GWh
Oceania
GWh
Total
GWh
Grand
Total
%
Hydro 6,444 50,312 64% 32,207 3,030 29,969 7,380 129,342 50%
Coal 13,443 27,248 35% 0 10,080 15,773 24,120 90,664 35%
Oil 0 93 0% 0 109 1,279 0 1,481 1%
Natural Gas 38 351 0% 1,343 16,336 6,199 0 24,267 9%
Nuclear 189 678 1% 0 0 12,672 0 13,539 5%
Total 20,114 78,682 100% 33,550 29,555 65,892 31,500 259,293 100%
Table D.3: Sources of Supply of Electrical Power in 2002 (electrical power used in gigawatt hours)
Electric Source
of Supply
Africa North America
Latin
America
Asia Europe Oceania Total
Grand
Total
GWh GWh % GWh GWh GWh GWh GWh %
Self-Generated 0 27,702 35% 4,386 28,228 9,193 1,244 70,753 27%
Purchased - Grid 20,114 39,015 50% 28,863 1,327 56,698 23,237 169,254 65%
Purchased -
Other
0 11,965 15% 301 0 1 7,019 19,286 7%
Total 20,114 78,682 100% 33,550 29,555 65,892 31,500 259,293 100%
Self-Generated
Other Purposes
0 351 253 2,662 1 0 3,267
Tables D.2 and D.3 Source:
International Aluminum Institute,
New Zealand House, Haymarket,
London SW1Y 4TE,
United Kingdom
http://www.world-aluminium.org/iai/stats
105

Appendix D: Hydroelectric Distribution and Electrical Energy Values
Significant energy is consumed in the generation and transmission of electricity. Tacit electric energy
conversion factors (Btu/kWh) include the energy associated with production, processing and
distribution of the "primary-energy" sources used in the production of electricity. Tacit values vary
significantly depending on the source of energy to produce electric power.
Table D.4: Average U.S. Grid Connection Tacit Energy
billion kWh %
(a)
U.S. Electricity Net
Generation in 2003
1
Units Consumed
2
(b)
Heat Content
(c)
Energy
Consume
d
10
9
Btu
(d)
Btu/kWh
(d) y (a)
Coal
Petroleum
1,970.3 51% 1,014.3 X 10
6
short tons 20,620,000 Btu/ton 3 20,468,000 8 10,388
30.3 X 10
6
bbl Distillate 5,825,000 Btu/gal 3 176,498 9
142.6 X 10
6
bbl Residual 6,287,000 Btu/bbl 3 896,526 9
3.4 X 10
6
bbl Other Liquids 5,670,000 Btu/bbl 5,3 19,278 9
6.4 X 10
6
short tons Coke 14,200 Btu/lb 6 181,760 9
Sub-Total 118.3 3% 1,207,000 8 10,203
Natural Gas 629.2 16% 5,380 X 10
9
ft
3
1,019 Btu/ft
3
3 5,047,000 8 8,021
Nuclear 763.7 20% 10,000 Btu/kWh
7
7,973,000 8 10,440
Hydroelectric 275.0 7% 9,578 Btu/kWh
4
2,634,000 8 9,578
Renewable 84.2 2% 957 X 10
12
Btu 896,000 8 10,641
Other 5.1 0% 27 X 10
12
Btu 22,000 8 4,314
Sub-Totals
Transmission
3,845.8 100% 38,247,000 9,945
Losses 1,243,030
TOTAL
S
3,845.
8
100% 39,490,03
0
10,26
8
1
AER2003 - Annual Energy Review 2003. Table 8.2a Electricity Net Generation, page 224
2
AER2003 - Annual Energy Review 2003. Table 8.5a Consuption of Combustable Fuels for
Electricity Generation, page 238
3
AEO2004- Annual Energy Outlook 2004, Energy Information Agency, Jan 2004 pg 262
4
Assumes that a substitue for hydropower is equivalent to the average of the other sources of
electricity
5
Assumes diesel fuel is the majority of other fuels
6
Data from Mid-Continent Coal & Coke Co. for green petroleum coke
7
Data from Nuclear Energy Institute
8
AER2003 - Annual Energy Review 2003. Table 2.1f Electric Power Sector Energy
Consumption, page 43
9
(c) x (b)
106
107
Appendix E: Emission Data and Calculations
Table E.1 presents the carbon dioxide equivalent emission values for the fuels and materials associated with the production of
aluminum metal and aluminum products.
Table E.1: Carbon Dioxide Equivalent Emission Coefficients for Fuels Associated with Aluminum Production
FUEL
Inpu
t
Btu pe
r
Carbon Carbon Percent
A
PI Densit
y
Million
Unit input uni
t
Emission Emission Carbon Gravit
y
(EGGUS) Btu/bbl
(Appendix F) Coefficient Coefficient
(EGGUS) (EGGUS) (EGGUS)
Source
Mt/Qbt
u
* Pounds/gal
Emissions
per input unit
Kilogram CDE
†
FUEL
Fuel Oil, Heavy (#6)
Fuel Oil, medium
Fuel Oil, light (#2)
Diesel
Kerosene
Gasoline
Natural Gas
Bituminous/Sub
Calcined Coke
Pitch
Green Coke
Propane
Coal
kg 21.49 EGGUS 85.7 17.0 6.287
kg 44,700 20.72 a 3.40E+00
kg 48,130 19.95 b 86.3 33.9 7.064 5.825 3.52E+00
L 37,040 19.95 EGGUS 86.3 35.5 7.064 5.825 2.71E+00
L 37,040 19.72 EGG2000 86.1 41.4 5.670 2.68E+00
L 35,870 19.34 EGG2000 86.6 58.6 5.253 2.54E+00
m
3
37,330 14.47 EGG2000 1.98E+00
kg 24,630 25.81 EGGUS n/a 2.33E+00
kg 34,010 27.85 c 3.47E+00
kg 38,190 20.62 d 85.8 25.6 2.89E+00
kg 31,810 27.85 EGG2000 92.3 n/a 9.543 6.024 3.25E+00
L 24,050 17.20 EGGUS 1.52E+00
kg 22,710 25.76 EGG2000 n/a 2.15E+00
Fuel Oil, Heavy (#6)
Fuel Oil, medium
Fuel Oil, light
Diesel
Kerosene
Gasoline
Natural Gas
Bituminous/Sub
Calcined Coke
Pitch
Green Coke
Propane
Coal
Electricity
Hydro Electric
Average U.S. Electric
Primary Al Electric
Coal-Fired Electric
kWh 3,412 0.0 EGG2000 0.00E+00
kWh 10,270 13.56 EGG2000 5.11E-01
kWh 7,620 12.51 e 3.49E-01
kWh 10,390 21.25 EGG2000 8.10E-01
Hydro Electric
Average U.S. Electric
Primary Al Electric
Coal-Fired Electric
*
Mt/Qbtu - million metric tons per Quadrillion Btu (10
6
metric tons / 10
15
Btu)
† CDE - Carbon Dioxide Equivalent
SOURCES
EGG2000 Emission of Greenhouse Gases in the United States 2000, Energy Information Agency, Nov 2001, page 140
EGGUS Emissions of Greenhouse Gases in the United States 1987-1992, Energy Information Agency, Oct 1994, Appendix A
a Medium Fuel Oil values are the average of the light and heavy fuel oil values
b Diesel and light fuel oil is assumed to have the same carbon coefficient in EGGUS
c Green coke and Calcined coke are assumed to have the same carbon coefficient
d Pitch is assumed to have the same carbon coefficient as asphalt reported in EGGUS
e Primary Aluminum Carbon Dioxide Equivalent are based on the industry's mix of fuels (Appendix D, Table D.1)

Table E.2 uses the units of Energy Input from Table F.1 and calculates the CDE emissions for each Energy Input based on the
CDE values for fuels presented in Table E.1.
Table E.2: Carbon Dioxide Equivalent (CDE) Emissions Associated with Primary Aluminum Production
Input/Output Refining Anode ElectrolysisMining Primary Aluminum Production
Rich Soil kg
Bauxite kg
Alumina kg
Calcined Coke kg
Pitch kg
Green Coke kg
Anode kg
Fluorides kg
Aluminum kg
1,150
1,000 2,640
1,000
820
231
85
1,000
1,930
18.6
446
1,000
Cumulative CDE emissions
from manufacturing the raw
materials required to
produce aluminum
Total CDE emissions from
manufacturing the raw
materials and electrolytic
reduction required to
produce aluminum
Ratio to Aluminum
Fuel Oil, medium kg
Fuel Oil, light (#2) kg
Diesel L
Kerosene L
Gasoline L
Natural Gas
m
3
Bituminous/Sub kg
Calcined Coke kg
Pitch kg
Green Coke kg
Propane L
Coal kg
Electric kWh
Total kg CDE
Manufacturing portion kg CDE
Feedstock portion CDE
kg CDE / kg Al
Total Material Production in the U.
metric tons
TOTAL per 1000 kg
Energy Inputs per 1,000 kg
units kg CDE
1.160 3.94E+00
4.370 1.18E+01
0.274 6.97E-01
0.4 2.04E-01
1.67E+01
1.67E+01
0.085
S. for Aluminum Manufacturing
0
Bauxite
5.10
units kg CDE
93.200 3.17E+02
1.670 4.52E+00
0.024 6.05E-02
225 4.46E+02
8.59 2.00E+01
0.00134 4.65E-03
109 5.57E+01
8.42E+02
8.42E+02
1.626
3,488,400
Alumina
1.93
units kg CDE
3.790 1.29E+01
0.814 2.87E+00
0.110 2.98E-01
0.046 1.17E-01
97.1 1.92E+02
820 2.85E+03
231 6.67E+02
85 2.76E+02
0.136 2.06E-01
266 9.30E+01
VOC 4.99E-01
4.09E+03
3.02E+02
3.79E+03
1.83
1,230,000
Anode
0.45
units kg CDE
4.310 1.52E+01
1.840 4.99E+00
0.285 7.25E-01
7.63 1.51E+01
2.72 4.13E+00
15,400 5.38E+03
5.42E+03
5.42E+03
5.42
2,758,000
Aluminum
1.00
units/kg Al kg CDE/kg Al
187.48 6.37E+02
0.36 1.28E+00
25.54 6.92E+01
- 0.00E+00
1.46 3.72E+00
477.56 9.46E+02
16.58 3.86E+01
365.72 1.27E+03
103.03 2.97E+02
37.91 1.23E+02
0.06 9.20E-02
1.57E+04 1.50E+02
3.54E+03
1.85E+03
1.69E+03
3.54
units/kg Al kg CDE/kg Al
187.477 6.37E+02
4.673 1.65E+01
27.378 7.42E+01
- 0.00E+00
1.748 4.45E+00
485.187 9.61E+02
16.579 3.86E+01
365.723 1.27E+03
103.026 2.97E+02
37.910 1.23E+02
2.781 4.22E+00
31,066.00 5.53E+03
8.96E+03
7.18E+03
1.69E+03
8.96
Total U.S. Production Carbon Dioxide Emissions
metric tons CDE
Total Material Production Worldwid
metric tons
Total Worldwide Emissions Based
metric tons CDE
kg CDE / kg Al
0
e for Use in the U.S. for Alumin
14,053,000
on U.S. Production
234,418
2,938,677
um Manufacturing
5,323,000
4,484,170
5,034,490
1,230,000
5,034,490
14,953,252
2,758,000
14,953,252
7,917,030
12,094,238
4.39
22,870,282
27,047,491
9.81
Appendix E: Emission Data and Calculations
108
Table E.3 uses the units of Energy Input from Table F.2 and calculates the CDE emissions for each Energy Input based on the
CDE values for fuels presented in Table E.1
Table E.3: Carbon Dioxide Equivalent (CDE) Emissions Associated with Aluminum Production
Appendix E: Emission Data and Calculations
109
Input/Output Casting Casting Extrusion Shape CastingHot Rolling Cold Rolling
Primary Ingot Secondary Ingot
Electrolysis Metal kg
Alloy Additives kg
Scrap kg
Primary Ingot kg
Secondary Ingot kg
Product kg
1,020
Yield:
1,000 98%
21
676
346
Yield:
1,000 96%
498
723 Yield:
1,000 82%
474
722 Yield:
1,000 84%
559
885 Yield:
1,000 69%
2,200 Yield:
1,000 45%
Energy Inputs per 1,000 kg
Fuel Oil, medium kg
Fuel Oil, light (#2) kg
Diesel L
Kerosene L
Gasoline L
Natural Gas
m
3
Bituminous/Sub kg
Calcined Coke kg
Pitch kg
Green Coke kg
Propane L
Coal kg
Electric kWh
TOTAL per 1000 kg
Total Material Production in the
metric tons
Total U.S. Production Carbon Di
metric tons CDE
kg of Carbon Dioxide Equivalent
Total kg CDE
kg CDE/kg Al
units kg CDE
17.4 61
0.184
0.075 0
51.8 103
0.798 1
211 73.74
2.39E+02
U.S. for Aluminum Manufac
2,704,000
oxide Emissions
646,233
per kilogram of Product
10.05
units kg CDE
42.3 149
31.464 85
12.757 32
126.0 250
1.941 3
115.000 58.73
5.78E+02
turing
2,820,000
1,629,782
0.58
units kg CDE
0.040 0.109
0.007 0
0.007 0
33.4 66
0.034 0
265 135.32
2.02E+02
2,421,300
488,308
0.20
units kg CDE
0.038 0
2.150 5
24.8 49
0.238 0
349 178.22
2.33E+02
2,421,300
564,819
0.23
units kg CDE
0.002 0
0.417 1
0.028 0
0.044 0
103.0 204
4.460 7
11.200 24
93 47.49
2.84E+02
1,826,000
517,866
0.28
units kg CDE
240.0 475
4 2.06
4.77E+02
2,413,000
1,151,974
0.48

Ta
bl
e E.
4
prov
id
es compar
i
son o
f
t
h
e ore-to-meta
l C
ar
b
on D
i
ox
id
e Equ
i
va
l
ent
(C
DE
)
em
i
ss
i
ons
f
or a mo
d
ern Ha
ll
-H
é
rou
l
t ce
ll
w
i
t
h
the CDE emissions for improved Hall-Héroult and alternative technologies.
Table E.4: Carbon Dioxide Equivalent Emissions Associated with New Aluminum Production Technologies
kWh/kg Al
kgCO
2
/kg Al
Typical modern Hall-Héroult
cell operating at 95% current
efficiency and with an
ACD = 4.5 cm
kWh/kg Al
kgCO
2
/kg Al
Typical modern Hall-Héroult
cell operating at 95% current
efficiency, retrofitted with a
sloped and wetted cathode
surface, aluminum sump, and
a reduced ACD,
ACD = 2.0 cm
kWh/kg Al
kgCO
2
/kg Al
Inert anode operating at 95%
current efficiency with oxygen
polarization differences and
using wetted cathode
technology, ACD = 2.0 cm
kWh/kg Al
kgCO
2
/kg Al
Carbothermic Reduction
with a reaction efficiency of
95% and a furnace
efficiency of 85% with
electric furnace operating
on the Average U.S. grid
kWh/kg Al
kgCO
2
/kg Al
Chloride Reduction of
kaolinite clays, electrolysis
current efficiency 95%,
reaction efficiency 95% and
heating efficiency 85%,
onsite electric furnace and
electrolysis cell operating on
the Average U.S. grid
Mineral Material
Tacit Energy Required
8.24 1.71 8.24 1.71 8.24 1.71 8.24 1.71 8.84 1.84
Onsite Reaction Energy Requirements
Reaction Thermal
Furnace Losses
Reaction Electrolysis
Cell Ohmic
TOTAL Reaction Energy
Anode Related Emissions
Anode Manufacturing
Anode Use
Anode Reaction
Anode Excess (Air Burning)
Total Anode
Process Related Emissions
Carbon Reactant
Perfluorocarbon
3.76
1.32
10.67
3.73
14.43
5.04
0.61
0.13
0.33 kg
1.22
0.11 kg
0.30
1.66
2.20
3.76
1.32
7.62
2.66
11.38
3.98
0.61
0.13
1.22
0.30
1.66
0.55
6.90
2.41
6.20
2.17
13.11
4.58
0.77
0.27
0.00
7.71
3.94
1.93
0.98
9.63
4.92
0.66 kg
2.45
0.00
-1.90
-0.97
0.40
0.20
6.48
3.31
2.93
1.49
7.91
4.04
0.89 kg
3.27
0.00
TOTAL CO
2
Emissions
Mineral Material
Reactions
Carbon
Process
TOTAL
1.71
5.04
1.66
2.20
10.62
1.71
3.98
1.66
0.55
7.90
1.71
4.58
0.00
0.00
6.29
1.71
4.92
2.45
0.00
9.08
1.84
4.04
3.27
0.00
9.15
Appendix E: Emission Data and Calculations
110

- - - -
- - - -
111
Appendix F: U.S. Energy Use by Aluminum Processing Area
The energy input units and raw material quantities used in Tables F.1 and F.2 are from the Life Cycle Inventory Report for the North American Aluminum
Industry published by the Aluminum Association in November, 1998. The report is the result of extensive surveying and contains the best and most
complete industry performance information of any recent study. The report is consistent with ISO procedures, and was favorably “peer” reviewed by groups
outside the industry. The Aluminum Association has provided the authors with permission to use these data.
The conversion of input units to common energy units are based on the values presented in Appendix C, Table C.1.
Table F.1: Materials and Energy Associated with Primary Metal Electrolysis
Input/Output Mining Refining Anode Electrolysis Primary Aluminum
Rich Soil kg
1,150
Bauxite kg
1,000 2,640
Cumulative energy
Total energy requirement
Alumina kg 1,000
1,930
requirement for
for manufacturing the raw
Calcined Coke kg
820
manufacturing the raw
materials and electrolytic
Pitch kg
231
materials required to
reduction required to
Green Coke kg
85
produce aluminum
produce aluminum
Anode kg
1,000 446
Fluorides kg
18.6
Aluminum kg
1,000
Bauxite Alumina Anode Aluminum
Ratio to aluminum
5.10 1.93 0.45 1.00
Energy Inputs per 1,000 kg
units Btu units Btu units Btu units Btu units/ kg Al Btu/kg Al units/kg Al Btu/kg Al
of Material Produced
Fuel Oil, medium kg 1.160 50,321 93.200 4,043,057 3.790 164,412 187.48 8,132,824 187.477 8,132,824
Fuel Oil, light kg
0.814 38,106 4.310 201,766 0.36 16,995 4.673 218,761
Diesel L
4.370 155,865 1.670 59,564 0.110 3,923 1.840 65,627 25.54 910,873 27.378 976,501
Kerosene L
Gasoline L
0.274 8,959 0.024 778 0.046 1,504 0.285 9,319 1.46 47,822 1.748 57,141
3
Natural Gas
m
225 8,160,344
97.1 3,521,642 7.63 276,726 477.56 17,320,117 485.187 17,596,843
Bituminous/Sub kg
8.59 210,396 16.58 406,064 16.579 406,064
Coke kg
0.00134 45 0.003 87 0.003 87
Propane L
0.136 3,271 2.72 65,429 0.06 1,459 2.781 66,888
Coal kg
Electric kWh
0.4 1,365 109 371,908 266 907,592 15,400 52,544,800 331.04 1,129,522 15,731.04 53,674,322
TACIT electric kWh 1.2 328 801 46,353 1,130 47,483
TOTAL ENERGY INPUTS (Energy per kg of Material Output)
Note: The onsite or "primary" electrical energy
kWh/kg
Btu/kg 217 12,846 4,640 53,164
requirement to produce aluminum from ore accounts for
0.06 3.76 1.36 15.58
65% of the total energy requirement
TACIT kWh/kg 0.07 4.09 1.93 46.54
Ratio Adjusted ENERGY INPUTS (Energy per kg of Aluminum)
Btu/kg 1,103 24,793 2,070 53,164 27,966 81,129
kWh/kg
0.32 7.27 0.61 15.58 8.20 23.78
TACIT kWh/kg 0.34 7.90 0.86 46.54 9.10 55.64
Feedstock Energy per Kg Al (Energy Inherent in Fuels used as Materials) Feedstock Ratio adjusted
Btu/kg 17,414 98,544
kWh/kg 5.10 28.88
TACIT kWh/kg Total Tacit (process 0.80 + feedstock 5.10) 6.02 14.26 60.80

Appendix F: U.S. Energy Use by Aluminum Processing Area
Table F.2: Materials and Energy Associated with Aluminum Manufacturing Operations
Input/Output Casting
Primary Ingot
Casting
Secondary Ingot
Hot Rolling Cold Rolling Extrusion Shape Casting
Electrolysis Metal kg
Alloy Additives kg
Scrap kg
Primary Ingot kg
Secondary Ingot kg
Product kg
1,020
Yield:
1,000 98%
21
676
346
Yield:
1,000 96%
498
723 Yield:
1,000 82%
474
722 Yield:
1,000 84%
559
885 Yield:
1,000 69%
2,200 Yield:
1,000 45%
Energy Inputs per 1,000 kg
Fuel Oil, medium kg
Fuel Oil, light kg
Diesel L
Kerosene L
Gasoline L
Natural Gas m3
Bituminous/Sub kg
Coke kg
Propane L
Anthracite kg
Electric kWh
units Btu
17.4 814,554
0.184 6,563
0.075 2,439
51.8 1,878,693
0.798 19,196
211 719,932
units Btu
42.3 1,981,346
31.464 1,122,230
12.757 417,115
126.0 4,569,793
1.941 46,692
115 392,380
units Btu
0.040 1,441
0.007 249
0.007 213
33.4 1,211,358
0.034 818
265 904,180
units Btu
0.038 1,362
2.150 70,301
24.8 899,451
0.238 5,725
349 1,190,788
units Btu
0.002 109
0.417 14,873
0.028 988
0.044 1,442
103.000 3,735,624
4.460 107,285
11.200 252,829
93 317,316
units Btu
240.000 8,704,367
4 13,750
TOTAL ENERGY INPUTS (Energy per kg of Output)
Btu/kg
kWh/kg 1.01
3,441
2.50
8,530
0.62
2,118
0.64
2,168 4,430
1.30
8,718
2.56
TACIT ENERGY INPUTS (Energy per kg of Output)
Btu/kg
kWh/kg
4,967
1.46
9,591
2.81 1.16
3,971
1.35
4,594
1.52
5,180
2.64
9,001
112
Appendix F: U.S. Energy Use by Aluminum Processing Area
113
Table F.3 lists the theoretical minimum energy requirements to produce raw materials and aluminum products. It also shows the process efficiency for
each operation. Mining, refining, anode manufacturing and electrolysis minimum energy values are based on the net chemical changes that result from
these processes. Primary casting, secondary casting, and shape casting minimum energy values are based on the energy required to produce molten pure
aluminum at 775 °C. The minimum energy requirements for rolling and extrusion operations are estimated from their yield and onsite energy
consumption values in Table F.2, and from an overall assumed electric and hydraulic system efficiencies of 75% and thermal furnace and heating
efficiencies of 50%.
Table F.3: Theoretical Minimum Energy Requirements to Produce Raw Materials and Aluminum Products
Mining Refining Anode
w/ Feedstock
Electrolysis Primary
Casting
Secondary
Casting
Hot
Rolling
Cold
Rolling
Extrusion Shape
Casting
kWh/kg
Ratioed to Al kWh/kg Al
Current Practice Onsite
Process Efficiency %
0.14
0.27
4%
12.97
4.40
77%
5.99
5.99
38%
0.33
0.33
33%
0.33
0.33
13%
0.31
0.31
50%
0.33
0.33
52%
0.44
0.44
34%
0.33
0.33
13%
Table F.4 lists U.S. production quantities, and energy and tacit energy consumption associated with producing aluminum products within the United
States. The United States does not consume energy to produce metallurgical bauxite, and consumes only 79% of the energy required for alumina. This
report distinguishes between the worldwide energy values and the United States values in order to measure the impact of market or process changes to the
energy demands within the United States. Table F.9 lists the worldwide values. The theoretical magnitude of the potential U.S. energy savings can be
measured by subtracting the theoretical energy requirements from the actual energy consumption numbers.
Table F.4: U.S. Energy Use in the Production of Domestic Aluminum
Mining Refining Anode
w/ Feedstock
Electrolysis Primary
Casting
Secondary
Casting
Hot
Rolling *
Cold
Rolling *
Extrusion * Shape
Casting
TOTAL
ENERGY
Material Production within the United States
metric tons (2003) 0 3,488,400 1,230,000 2,758,000 2,704,000 2,820,000 2,421,300 2,421,300 1,826,000 2,413,000
On-Site Energy Consumed in Production for the U.S. Aluminum Industry
kWh/kg
ratioed* to Al kWh/kg Al
Total kWh/yr
Proportion of U.S. Energy Used
3.76
7.27
1.31E+10
14%
12.80
5.71
1.57E+10
17%
15.58
15.58
4.30E+10
46%
1.01
1.01
2.73E+09
3%
80%
2.50 0.62 0.64
2.50 0.62 0.64
7.05E+09 1.50E+09 1.54E+09
8% 2% 2%
Total U.S. Primary proportion
1.30
1.30
2.37E+09
3%
2.56
2.56
6.17E+09
7%
9.32E+10
100%
Total TACIT Energy Consumed in Production for the U.S. Aluminum Industry
kWh/kg
ratioed* to Al kWh/kg Al
Total kWh/yr
Proportion of U.S. Energy Used
4.09
7.90
1.43E+10
7.7%
13.37
5.96
1.64E+10
8.8%
46.54
46.54
1.28E+11
69.0%
1.46
1.46
3.94E+09
2.1%
87.6%
2.81 1.16 1.35
2.81 1.16 1.35
7.93E+09 2.82E+09 3.26E+09
4.3% 1.5% 1.8%
Total U.S. Primary proportion
1.52
1.52
2.77E+09
1.5%
2.64
2.64
6.37E+09
3.4%
1.86E+11
100%
Theoretical Magnitude of Opportunities for U.S. Energy Savings
kWh/yr
Tacit kWh/yr
1.26E+10
1.38E+10
-1.99E+08
4.98E+08
2.65E+10
1.12E+11
1.83E+09
3.04E+09
6.11E+09
6.99E+09
7.56E+08
2.07E+09
7.36E+08
2.46E+09
1.57E+09
1.97E+09
5.36E+09
5.56E+09
5.53E+10
1.48E+11
* Data is from 2000. These are the latest numbers available that are specific to the U.S. production. After 2000, the numbers are based on North American data and not specifically the U.S. data.

Table F.5 shows the total energy values consumed by the U.S. aluminum industry and the energy savings possible if:
a it was possible to reduce energy consumption to the theoretical limit,
b. energy were reduced by 30%, or
c. electrolysis electrical energy were reduced from 15 to 11 kWh/kg of aluminum
Table F.5: Total U.S. Aluminum Industry Energy Consumption and Potential Savings
U.S. Aluminum Industr
y
kWh/y
r
Quads/y
r
MW Households bbl crude
per yea
r
Total Energy Use on-site 9.32E+10 0.32 10,600 10,600,000 54,900,000
tacit 1.86E+11 0.64 21,300 21,300,000 109,600,000
Theoretical Requirement on-site 3.79E+10 0.13 4,300 4,300,000 22,400,000
tacit 3.79E+10 0.13 4,400 4,400,000 22,400,000
Energy Efficiency on-site 41%
tacit 20%
a. Theoretical Opportunity
on-site 5.53E+10 0.19 6,300 6,300,000 32,600,000
tacit 1.48E+11 0.51 16,900 16,900,000 87,200,000
b. Practical Goal (Vision)
on-site 2.80E+10 0.10 3,180 3,200 16,500,000
tacit 5.58E+10 0.19 6,390 6,400 32,900,000
c. Electrolysis Savings of 4 kWh/kg
on-site 1.10E+10 0.04 1,259 1,300 6,500,000
tacit 2.46E+10 0.08 2,813 2,900 14,500,000
Table F.6 shows 94% reduction in energy consumption associated with secondary metal production. Recycling aluminum essentially recaptures all the energy
associated with mining, refining and smelting.
Table F.6: Energy Impact of Recycling
Energy Saved with Recycling
(Tacit Energy Values)
62.2 kWh/kg to produce Primary Metal Ingot
2.8 kWh/kg to produce Secondary Metal Ingot
4.5% Secondary to Primary Energy
2,820,000 kg of Secondary Metal produced in 2003
1.67E+11 kWh/yr Energy Saved in 2003
0.57 Quads Saved per Year 2003
19,100 MW SAVED 2003
Appendix F: U.S. Energy Use by Aluminum Processing Area
114
Table F.7 shows the electric energy consumption of the U.S. aluminum industry and compares it to the total electric energy produced in the United States.
Table F.7: U.S. Electric On-site Energy Consumption in the Aluminum Industry
Appendix F: U.S. Energy Use by Aluminum Processing Area
115
Refining Anode Electrolysis Primary Secondary Hot Cold Extrusion Shape TOTAL
w/ Feedstoc
k
Casting Casting Rolling Rolling Casting ELECTRIC
ENERGY
kWh/kg
kWh/yr
metric tons (2003)
3,488,400 1,230,000 2,758,000 2,704,000 2,820,000 2,421,300 2,421,300 1,826,000 2,413,000
0.109 0.266 15.400 0.211 0.115 0.265 0.349 0.093 0.004
3.80E+08 3.27E+08 4.25E+10 5.71E+08 3.24E+08 6.42E+08 8.45E+08 1.70E+08 9.72E+06 4.57E+10
quad 0.16
Total U.S. Al Industry Electrical Use: 4.57E+10 kWh/yr
on-site 5,222 MW
5,222,000 households Net U.S. Generation: 3.858E+12 kWh/yr (Source: eia.doe.gov/cneaf/electricity)
tacit 54,000,000 bbl crude
A
luminum's % of U.S. Net: 1.2
%
Electrolysis and process heating are the two most energy-intensive process areas of the aluminum industry. Electrolysis accounts for 46% of all onsite and
69% of all tacit energy use. Process heating accounts for 27% of all onsite and 13% of all tacit energy use in the industry.
Table F.8: Smelting and Heating Fractions of Total U.S. Aluminum Industry Energy Consumed
Smelting Fraction of Total U.S. Aluminum Industry Energy Consumed
Electrolysis
Total
Industr
y
Percent
of Industr
y
Onsite kWh/yr 4.30E+10
Tacit kWh/yr 1.28E+11
9.32E+10
1.86E+11
46%
69
%
Aluminum Metal Process Heating/Melting Fraction of Total U.S. Aluminum Industry Energy Consumed
Casting Extrusion Shape Total
Hot Cold Casting Process
Heating
Rolling
Total
Industr
y
Percent
of Industr
y
Btu/kg Al 9,244 1,212 905 4,096 8,704 2.42E+04
kWh/kg Al 2.71 0.36 0.27 1.20 2.55 7.08E+00
Onsite kWh/yr 1.50E+10 8.60E+08 6.42E+08 2.19E+09 6.16E+09 2.48E+10
Tacit
Note: The tacit increase for process heating is negligible
9.32E+10
1.86E+11
27
%
13
%
Table F.9 lists the worldwide production quantities, energy, and tacit energy consumption associated with producing aluminum products within the United
States. These values provide a full measure of the energy associated with producing aluminum and aluminum products. The actual energy consumed within
the United States is lower since no aluminum metallurgical bauxite is mined in the United States, and only 47% of the alumina required is refined in the
United States.
Table F.9: Total Worldwide Production and Energy Consumption Associated with Producing Aluminum in the United States
* ratios to primary aluminum
Mining*
5.10
Refining*
1.93
Anode*
w/ Feedstock
0.45
Electrolysis*
1.00
Primary
Casting
Secondary
Casting
Hot
Rolling
†
Cold
Rolling
†
Extrusion
†
Shape
Casting
TOTAL
ENERGY
Total Worldwide Production Required to Produce Aluminum in the United States
metric tons (2003) 14,053,000 5,323,000 1,230,000 2,758,000 2,704,000 2,820,000 2,421,300 2,421,300 1,826,000 2,413,000
Total On-Site Energy Consumed in Worldwide Production for U.S. Aluminum Industry
kWh/kg
ratioed* to Al kWh/kg Al
Total kWh/yr
% Relative to Electrolysis*
Proportion of Energy Used
0.06
0.32
8.92E+08
2.1%
0.9%
3.76
7.27
2.00E+10
46.6%
19.8%
12.80
5.71
1.57E+10
36.6%
15.6%
15.6
15.6
4.30E+10
100.0%
42.5%
1.01
1.01
2.73E+09
6.3%
2.7%
82%
2.50 0.62 0.64
2.50 0.62 0.64
7.05E+09 1.50E+09 1.54E+09
16.4% 3.5% 3.6%
7.0% 1.5% 1.5%
Total Primary proportion
1.30
1.30
2.37E+09
5.5%
2.3%
2.56
2.56
6.17E+09
14.3%
6.1%
1.01E+11
100.0%
Total TACIT Energy Consumed in Worldwide Production for the U.S. Aluminum Industry
kWh/kg
ratioed* to Al kWh/kg Al
Total kWh/yr
% relative to Electrolysis
Proportion of Energy Used
0.07
0.34
9.38E+08
0.7%
0.5%
4.09
7.90
2.18E+10
17.0%
11.2%
13.37
5.96
1.64E+10
12.8%
8.5%
46.5
46.5
1.28E+11
100.0%
66.0%
1.5
1.5
3.94E+09
3.1%
2.0%
88%
2.8 1.2 1.3
2.8 1.2 1.3
7.93E+09 2.82E+09 3.26E+09
6.2% 2.2% 2.5%
4.1% 1.4% 1.7%
Total Primary proportion
1.5
1.5
2.77E+09
2.2%
1.4%
2.6
2.6
6.37E+09
5.0%
3.3%
1.95E+11
100.0%
† Data is from 2000. This is the last year numbers specific to U.S. production are available. After 2000, the numbers are based on North American data, and not specifically U.S. data.
Table F.10 divides energy uses in aluminum casting and semi-fabrication manufacturing operations into three areas: electric, heating and miscellaneous fuels.
The following percentages of energy use are derived from the energy values listed in Table F.2. Fuel oils, natural gas and propane are assumed to be
associated with heating (thermal operations). Miscellaneous fuels include all other fuels and it is assumed that these are fuels used in non-heating operations,
such as transportation and collection of materials. (Note: rounding causes some totals to differ from 100%)
Table F.10: Percent Break-Up of Different Types of Energy Used in Aluminum Production Operations
Primary Secondary Hot Cold Extrusion Shape
Casting Casting Rolling Rolling Casting
Onsite: % onsite electric
% heating
miscellaneous fuels
21% 5% 43% 55% 7% 0%
79% 77% 57% 42% 87% 100%
0% 18% 0% 3% 6% 0%
Tacit: % tacit electric
% heating
miscellaneous fuels
36% 9% 62% 72% 72% 14%
63% 73% 38% 25% 25% 80%
0% 17% 0% 3% 3% 6%
Appendix F: U.S. Energy Use by Aluminum Processing Area
116

Appendix G: U.S. Primary, Secondary and Imported Aluminum
Quantities, 1960-2003
Table G.1: U.S. Supply of Aluminum from 1960 to 2003 (in Thousand Metric Dry Tons)
Year
U.S. Primary
Aluminum
U.S. Secondary
Aluminum
U.S. Aluminum
Imports
U.S. Total
Aluminum
1960 1,828 401 178 2,407
1961 1,727 445 230 2,402
1962 1,921 533 341 2,795
1963 2,098 601 419 3,118
1964 2,316 648 409 3,373
1965 2,499 774 543 3,816
1966 2,693 833 591 4,117
1967 2,966 821 466 4,253
1968 2,953 935 684 4,572
1969 3,441 1,067 484 4,992
1970 3,607 937 406 4,950
1971 3,561 1,004 582 5,147
1972 3,740 1,022 684 5,446
1973 4,109 1,127 523 5,759
1974 4,448 1,163 511 6,122
1975 3,519 1,121 453 5,093
1976 3,857 1,334 608 5,799
1977 4,117 1,456 683 6,256
1978 4,358 1,518 907 6,783
1979 4,557 1,612 711 6,880
1980 4,653 1,577 603 6,833
1981 4,489 1,790 782 7,061
1982 3,274 1,666 823 5,763
1983 3,353 1,773 1,023 6,149
1984 4,099 1,760 1,376 7,235
1985 3,500
1,762 1,332 6,594
1986 3,039 1,773 1,843 6,655
1987 3,347 1,986 1,702 7,035
1988 3,945 2,122 1,467 7,534
1989 4,030 2,054 1,353 7,437
1990 4,048 2,393 1,421 7,862
1991 4,121 2,286 1,398 7,805
117
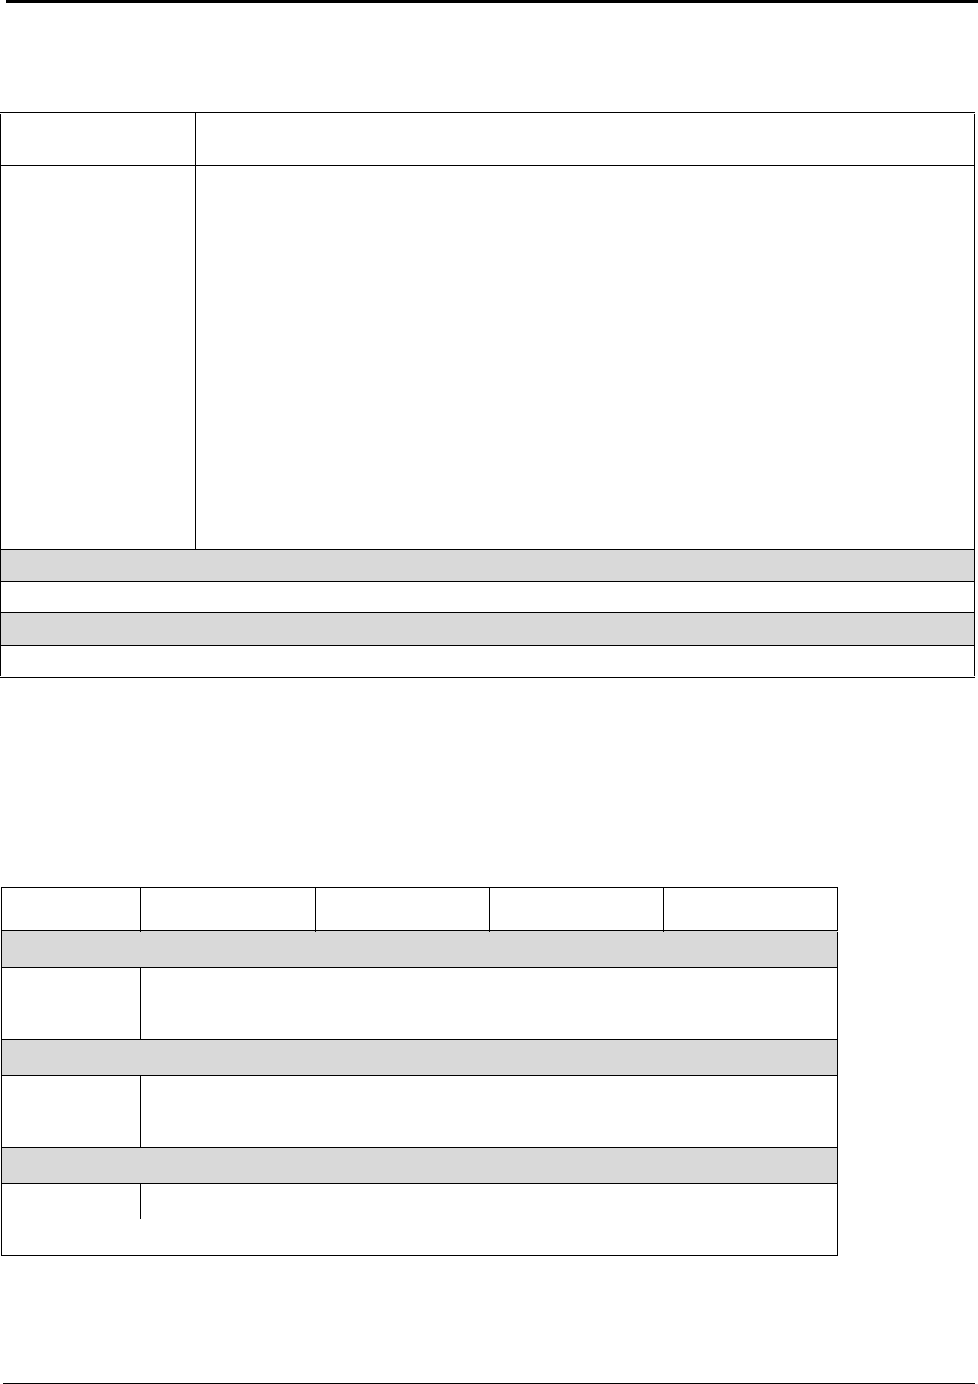
Appendix G: U.S. Primary, Secondary and Imported Aluminum Quantities, 1960-2003
Table G.1: U.S. Supply of Aluminum from 1960 to 2003 (in Thousand Metric Dry Tons) (Continued)
Year
U.S. Primary
Aluminum
U.S. Secondary
Aluminum
U.S. Aluminum
Imports
U.S. Total
Aluminum
1992
1993
1994
1995
1996
1997
1998
1999
2000
2001
2002
2003
4,042
3,695
3,299
3,375
3,577
3,603
3,713
3,779
3,668
2,637
2,705
2,704
2,756
2,944
3,086
3,188
3,307
3,547
3,442
3,695
3,450
2,970
2,927
2,820
1,573
2,327
3,136
2,701
2,572
2,804
3,264
3,680
3,580
3,487
3,947
4,068
8,371
8,966
9,521
9,264
9,456
9,954
10,419
11,154
10,698
9,094
9,579
9,592
Average Growth Rate 1993 through 2003
-2.5% -0.4% 5.1% 0.6%
Percent of Total Supply (2003)
28% 29% 42% 100%
Source: Aluminum Statistical Review for 2003, The Aluminum Association, 2004, p. 7
The growth rates utilized in this report are based on a linear regression of data over ten year period
from 1993 through 2003. Linearizing the data provides a better value for average growth over the
period than a simple comparison of 1993 to 2003.
Primary Secondary Imports Supply
Linear regression for 1993 through 2003
slope
intercept
-83.5 -13.4 156.4
170,211 30,026 -309,163
59.4
-108,927
Linearized values
1993
2003
3,759 3,283 2,452
2,924 3,149 4,015
9,494
10,088
Linearized growth from 1993 to 2003
Avg Growth -2.5% -0.4% 5.1%
U.S. Aluminum Production Growth (Primary & Secondary Combined)
0.6%
-1.47%
118

Appendix H: U.S. Bauxite and Alumina Quantities, 1960-2003
Table H.1: U.S. Supply of Bauxite and Alumina from 1960 to 2003 (in Thousand Metric Dry Tons)
A B C D E F G H I
Year
Imports
of Bauxite
U.S.
Mined
Bauxite
Exports of
Bauxite
Net
Bauxite
Supply
Estimated
Alumina
Production
from
Bauxite
Imports
of
Alumina
Exports
of
Alumina
Estimated
Net
Alumina
for
Electrolysis
1960 8,879 2,030 29 10,880 4,651 80 4,266
1961 9,354 1,248 153 10,449 4,467 171 4,191
1962 10,745 1,391 263 11,873 5,076 158 4,726
1963 9,408 1,549 206 10,751 4,596 173 4,309
1964 10,518 1,627 283 11,862 5,071 191 4,755
1965 11,601 1,681 149 13,133 5,614 206 290 4,969
1966 11,928 1,825 63 13,690 5,852 443 290 5,420
1967 12,010 1,681 2 13,689 5,852 865 499 5,633
1968 11,359 1,692 7 13,044 5,576 1,190 780 5,429
1969 12,355 1,873 5 14,223 6,080 1,730 885 6,317
1970 13,039 2,115 3 15,151 6,477 2,340 998 7,171
1971 12,837 2,020 35 14,822 6,336 2,190 980 6,913
1972 12,803 1,841 29 14,615 6,248 2,590 797 7,416
1973 13,618 1,909 12 15,515 6,633 3,090 694 8,365
1974 15,216 1,980 16 17,180 7,344 3,290 927 8,973
1975 11,714 1,801 20 13,495 5,769 3,180 933 7,439
1976 12,749 1,989 15 14,723 6,294 3,290 1,050 7,905
1977 12,989 2,013 26 14,976 6,402 3,760 857 8,665
1978 13,847 1,669 13 15,503 6,628 3,970 878 9,057
1979 13,780 1,821 15 15,586 6,663 3,840 849 8,988
1980 14,087 1,559 21 15,625 6,680 4,360 1,140 9,232
1981 12,802 1,510 20 14,292 6,110 3,980 730 8,749
1982 10,122 732 49 10,805 4,619 3,180 590 6,747
1983 7,601 679 74 8,206 3,508 4,030 602 6,585
1984 9,435 856 82 10,209 4,364 4,290 648 7,570
1985 7,158 674 56 7,776 3,324 3,830 316 6,506
1986 6,456 510 69 6,897 2,948 3,600 487 5,767
1987 9,156 576 201 9,531 4,075 4,070 1,130 6,607
1988 9,944 588 63 10,469 4,475 4,630 1,040 7,618
1989 10,893 W 44 10,849 4,638 4,310 1,330 7,154
119

Appendix H: U.S. Bauxite and Alumina Quantities, 1960-2003
Table H.1: U.S. Supply of Bauxite and Alumina from 1960 to 2003 (in Thousand Metric Dry Tons) (Continued)
A B C D E F G H I
Year
Imports
of Bauxite
U.S.
Mined
Bauxite
Exports of
Bauxite
Net
Bauxite
Supply
Estimated
Alumina
Production
from
Bauxite
Imports
of
Alumina
Exports
of
Alumina
Estimated
Net
Alumina
for
Electrolysis
1990 12,142 W 53 12,089 5,168 4,070 1,260 7,461
1991 12,300 W 58 12,242 5,233 4,590 1,350 7,950
1992 11,400 W 68 11,332 4,844 4,700 1,140 7,920
1993 11,900 W 92 11,808 5,048 3,940 1,240 7,243
1994 11,200 W 137 11,063 4,729 3,120 1,040 6,336
1995 10,800 W 120 10,680 4,566 4,000 1,040 7,069
1996 10,700 W 154 10,546 4,508 4,320 918 7,460
1997 11,300 W 97 11,203 4,789 3,830 1,270 6,870
1998 11,600 W 108 11,492 4,913 4,050 1,280 7,192
1999 10,400 W 168 10,232 4,374 3,810 1,230 6,517
2000 9,030 W 147 8,883 3,797 3,820 1,090 6,148
2001 8,670 W 88 8,582 3,669 3,100 1,250 5,152
2002 7,710 W 52 7,658 3,274 3,010 1,270 4,686
2003 8,300 W 140 8,160 3,488 2,300 1,000 4,310
W - data withheld
Source: United States Geological Survey, Minerals Information, Statistical Compendium
Note: 3,488,000 metric tons or 79% of the 4,310,000 metric tons of alumina needed to produce
aluminum in the United States was refined in the United States in 2003.
Calculations
Column F is calculated based on USGS data. The average alumina content for bauxite is 45%, and
95% of bauxite is converted to alumina. The calculation is F = 0.95 x 0.45 x E. The numbers produced
in Column F may be slightly over-estimating since slightly less than 100% of the alumina content of
bauxite is actually recovered.
Column I is calculated based on USGS data. 90% of alumina produced is metallurgical alumina used
in aluminum production. The calculation is I = 0.9 x ( F + G - H).
120

Appendix I: Energy Requirements for Carbon Anodes
The following table shows the onsite, process and feedstock energy values that are part of making a carbon electrode (anode)
for reduction of alumina to aluminum. Pitch and coke require process energy for their manufacture, and they have a fuel or
feedstock energy value that must be accounted for in order to fully evaluate the energy associated with producing aluminum.
Table I.1: Energy Associated with Aluminum Industry Carbon Anode Manufacturing
Mass of Material
Input
*
kg/1000 kg Anode
Material Input
Energy
**
Btu/kg
kWh per kg
Anode
kWh per kg
Aluminum
Pitch
Mass 231
Feedstock Energy 8,813 2.58 1.15
Process Energy
Calcined Coke
9 0.003 0.001
Mass 820
Feedstock Energy 27,569 8.08 3.60
Process Energy
Green Coke
395 0.12 0.05
Mass 85
Feedstock Energy 2,664 0.78 0.35
Process Energy
Carbon Anode Baking
43 0.01 0.01
Process Energy
*
TOTAL Raw Materials and Energy
1.93 0.86
Mass (kg/1000 kg Anode) 1,136
Feedstock Energy (kWh) 39,046 11.44 5.10
Process Energy (kWh) 446 2.06 0.92
TOTAL Tacit Energy Input 13.50 6.02
*
Values from Appendix F, Table F.1
**
Values from Appendix C, Table C.1
Table I.2: Onsite and Tacit Energy Associated with Carbon Anode Production
kWh per kg of Anode
tf
kWh per kg of Aluminum
tf
Pitch
Coke
Baking
Total
0.003 2.58
0.13 8.99
1.36 1.93
1.49 13.50
0.001 1.15
0.06 4.01
0.61 0.86
0.66 6.02
121

Appendix J: Theoretical Energy Data and Calculations
The theoretical minimum energy requirement for producing any chemical is determined based on the net chemical reaction used
to produce the product. It is defined as the energy required to synthesize a substance in its standard state from substances also in
their standard states. It can be calculated by summing the reaction energies of the products minus the energies of the reactants.
This report calculates the theoretical minimum energy by assuming the reactants enter and the byproducts leave the system at
room temperature and that molten aluminum leaves the system at 960 ºC. This report has chosen 960 ºC (1233 ºK) as the molten
metal temperature. This value is an approximation of the average operating cell temperatures of industrial cells.
Some studies assume that the gases evolved during reduction leave the system at the molten metal temperature. In these studies,
the theoretical minimum is 2.5% to 3% higher than the numbers calculated here. The additional energy for heating of the
emissions is shown in the individual tables. Theoretically, it is possible to capture all the energy associated with these gaseous
emissions. However, there is currently no available, economic means of recovering this energy. In practice, the emission gas
stream is diluted with air in the cells to lower the temperature that the cell hoods and ducts are exposed to. The emission gas is
collected from hundreds of hooded pots and treated before release to the atmosphere. Only a very small portion of the heat is
actually absorbed and returned to the system.
The minimum theoretical energy requirement for aluminum production requires the evaluation of three energy factors: the
energy required to drive the reduction reaction forward, the energy required to maintain the system at constant pressure and
temperature, and the energy required to change the temperature of the reactant and/or product. The thermodynamics and
chemical equilibrium of reactions are described by the equation ∆G = ∆H - T ∆S and the numeric values are given in Table J.6.
The energy required to drive the reaction forward is the Gibbs free energy value (∆G). The energy required to maintain system
equilibrium is the difference between the heat of reaction (∆H) and the Gibbs free energy value (∆G), which equals the entropy
term (T∆S). Since the Gibbs free energy requirement is less than the heat of reaction for alumina reduction, additional energy
must be added to the system to maintain the system temperature. Otherwise, the system would cool as the reaction proceedes.
(Reduction cells operate at atmospheric conditions and no pressure change results during reduction.) The numeric values for G,
H and S are given in Table J.6.
A detailed discussion of the theoretical requirements is made in Current and Energy Efficiency of Hall-Héroult Cells - Past,
Present and Future, by Warren Haupin and William Frank, published in Light Metal Age, June 2002.
122

Table J.1: Theoretical Minimum Energy for Hall Hé
r
oult Carbon Anode System
(products
–
Reactants Products Reaction Thermodynamics at 298
K
reactants)
Temp Temp cal/gm mole Al
( 2 Al
2
O
3
+ 3 C ) to ( 4 Al +
3 CO
2
)
= Net
2 Al
2
O
3
4 Al
delta G -756,358 0 0 -282,779 118,395
25°C
960q
C
delta H -801,000 0 0 -282,155 129,711
Carbon delta S 24.3 4.1 27.1 153.2 11,311
Anode Process Theoretical Minimum Energy Requirements
kWh/kg
3 C
3 CO
2Cell Electrolytic Work Requirement (delta G) 5.11
25°C
25°C
Thermal Energy for Temperature Maintenance (delta H - delta G) 0.49
Thermal Energy for Al at 960°C 0.39
Theoretical Minimum 5.99
Thermal Energy for CO
2
at 960°C
0.17
Note: Thermodynamic values for G, H and S are from Table J.6. Heat capacity data are from Table J.9 and Appendix K
2 Al
960°C
25°C
25°C
Table J.2: Theoretical Minimum Energy for Hall Héroult Inert Anode System
(products
–
Reaction Thermodynamics at 298
K
reactants)
Reactants Products cal/gm mole Al
Temp Temp
( Al
2
O
3
) to ( 2 Al +
1.5 O
2
)
= Net
delta G -378,179 0 0 189,089
delta H -400,500 0 0 200,250
delta S 12 14 74 11,155
Inert
Al
2
O
3
Process Theoretical Minimum Energy Requirements
Anode kWh/kg
Electrolytic Work Requirement (delta G) 8.16
Cell
O1.5
2
Thermal Energy for Temperature Maintenance (delta H - delta G) 0.48
Thermal Energy for Al at 960°C 0.39
Theoretical Minimum 9.03
Thermal Energy for O
2
at 960°C
0.27
Note: Thermodynamic values for G, H and S are from Table J.6. Heat capacity data are from Table J.9 and Appendix K
123
Appendix J: Theoretical Energy Data and Calculations
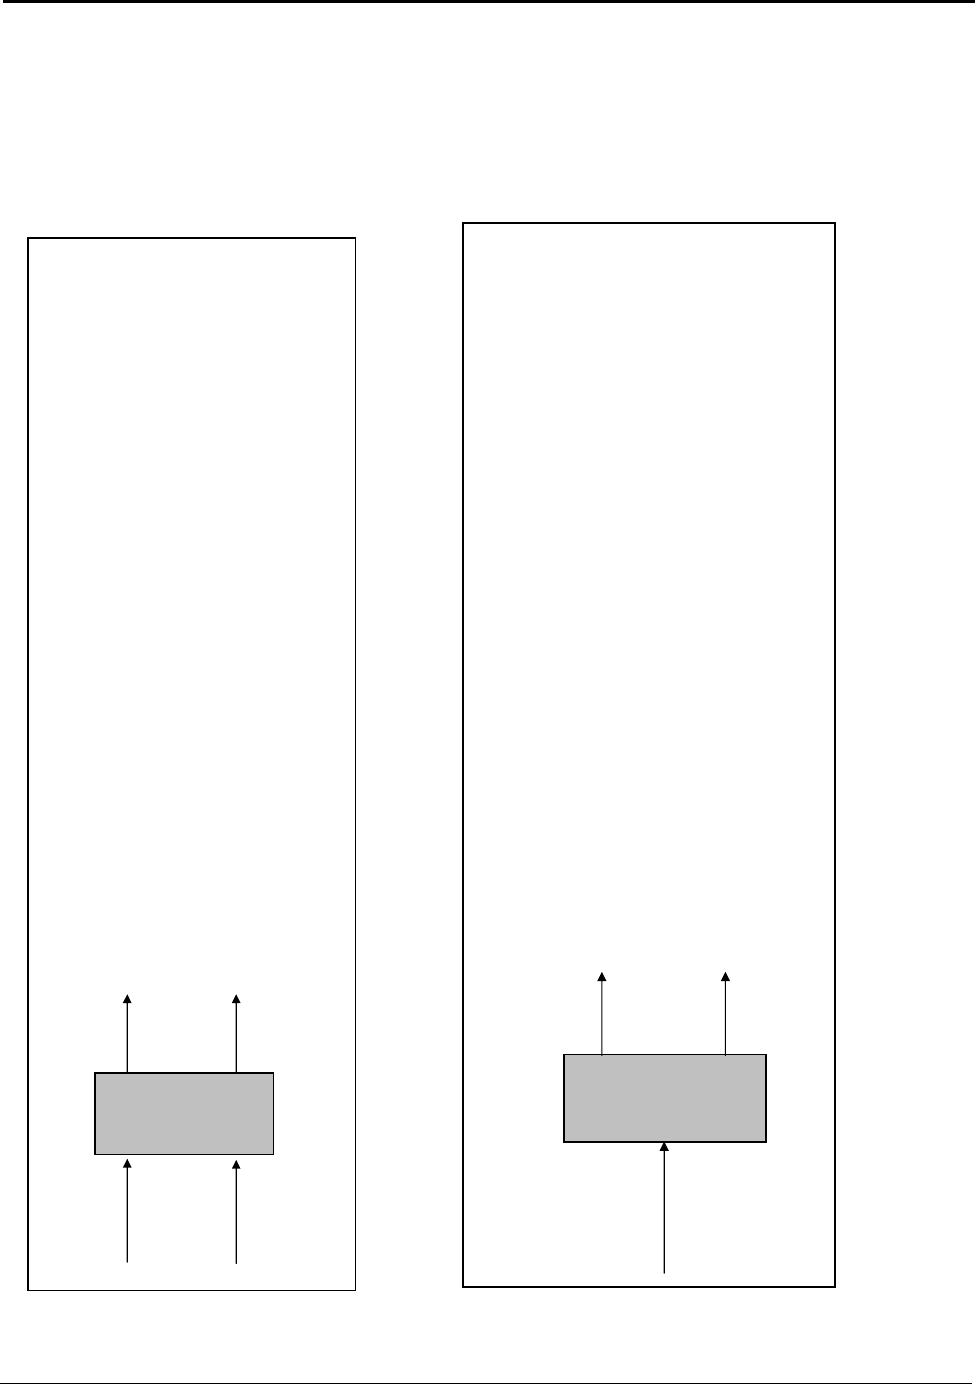
Table J.3: Theoretical Minimum Energy for Carbothermic Reduction
(products
–
Reactants Products Reaction Thermodynamics at 298
K
reactants)
Temp Temp
( Al
2
O
3
+ 3 C ) to ( 2 Al + 3 CO ) = Net
cal/gm mole Al
Al
2
O
3
2 Al
delta G -378,179 0 0 -98,424 139,878
25°
C 960°C
delta H -400,500 0 0 -79,247 160,626
Carbo- delta S 12.2 4.1 13.5 141.9 21,347
Thermic
Process Theoretical Minimum Energy Requirements
Reactor kWh/kg
3 C
3 CO
Work Requirement (delta G) 6.03
25°C 25°C
Thermal Energy for Temperature Maintenance (delta H - delta G) 0.90
Thermal Energy for Al at 960 C 0.39
Theoretical Minimum 7.32
Thermal Energy for CO at 960°C 0.19
Note: Thermodynamic values for G, H and S are from Table J.6. Heat capacity data are from Table J.9 and Appendix K
Table J.4: Theoretical Minimum Energy for Reduction of Aluminum Chloride
(products
–
Reaction Thermodynamics at 298 K reactants)
Reactants Products
( 2 AlCl
3
) to ( 2 Al + 3 Cl
2
) = Net
cal/gm mole Al
Temp Temp
delta G -300,574 0 0 150,287
2 Al
delta H -336,616 0 0 168,308
960°C
delta S 48.1 13.5 159.9 18,664
Inert
2 AlCl
3
Anode Process Theoretical Minimum Energy Requirements
Cell kWh/kg
Electrolytic Work Requirement (delta G) 6.48
3 Cl
2
25°C
Thermal Energy for Temperature Maintenance (delta H – delta G) 0.78
25°C
Thermal Energy for Al at 960°C 0.39
Theoretical Minimum 7.65
Thermal Energy for Cl
2
at 960°C
0.19
Note: Thermodynamic values for G, H and S are from Table J.6. Heat capacity data are from Table J.9 and Appendix K
124
Appendix J: Theoretical Energy Data and Calculations
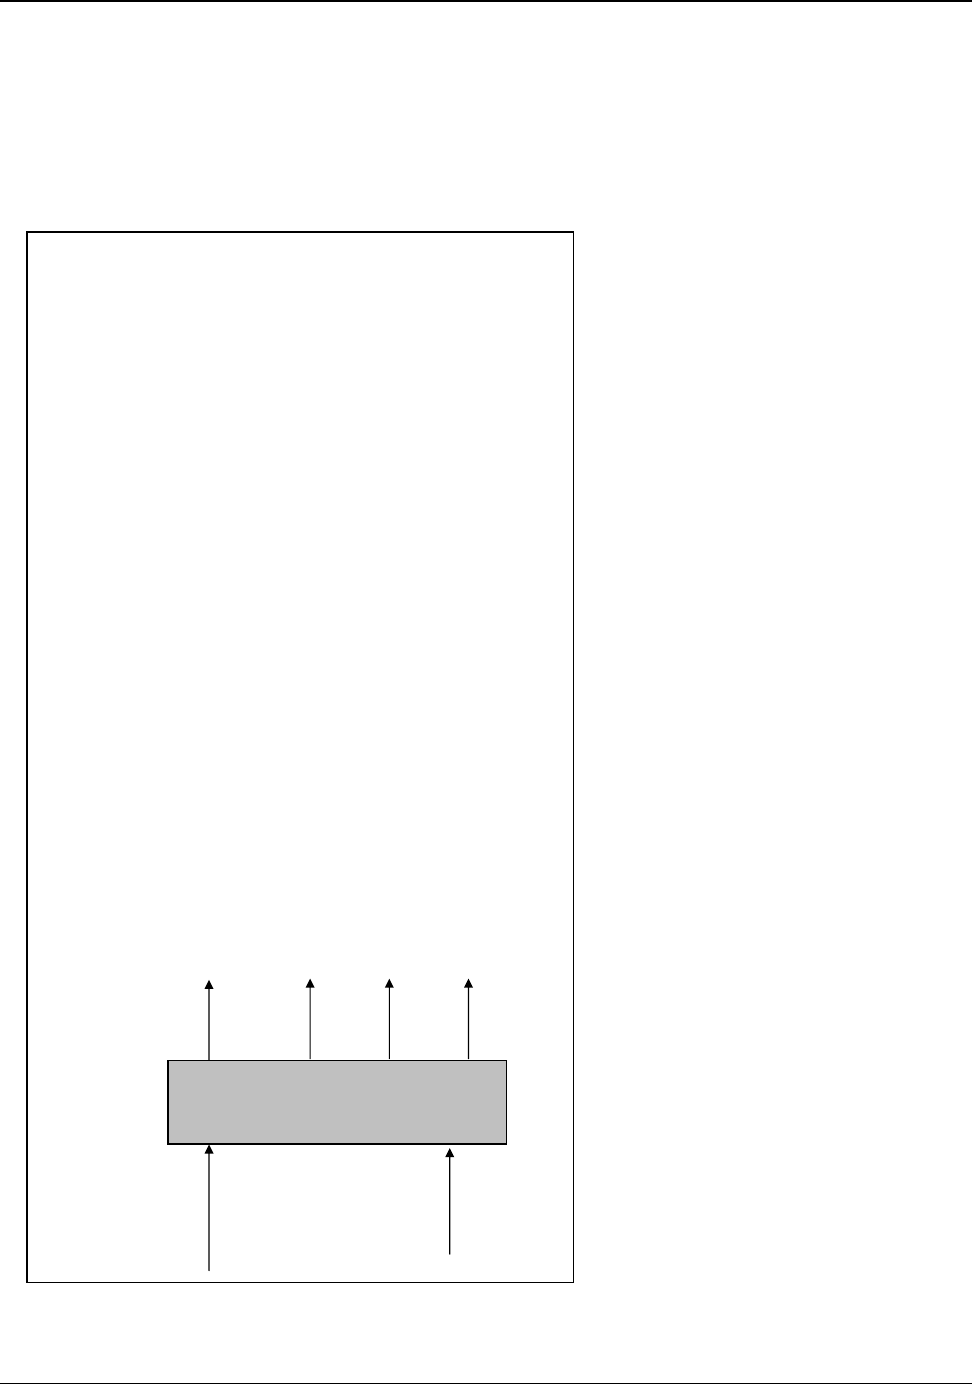
Table J.5: Theoretical Minimum Energy for Kaolinite / Aluminum Chloride Reduction
Appendix J: Theoretical Energy Data and Calculations
Net Aluminum Reaction:
(products
–
reactants)
CarboChlorination (900°C) cal/gm mole Al
( 3 Al
2
O
3
.2SiO
2
+ 14 C + 21 Cl
2
) to ( 6 AlCl
3
+ 6 SiCl
4
+ 7 CO + 7 CO
2
) = Net
Reactants Products
Temp Temp delta G -2,374,053 0 0 -901,721 -884,799 -229,655 -659,819 -50,323
delta H -2,531,520 0 0 -1,009,847 -942,161 -184,910 -658,363 -43,960
7 Al
2
O
3
.2SiO
2
14 Al
delta S 19 1,119 144 474 331 357
25qC
960°C
Kaolinite Chloride Reduction (700°C)
( 2 AlCl
3
) to ( 2 Al + 3 Cl
2
) = Net
to delta G -300,574 0 0 150,287
14 SiO
2
delta H -336,616 0 0 168,308
Aluminum
25°C
delta S 48 14 160 18,664
Chloride
Process Theoretical Minimum Energy Requirement
s
7 CO
2
to kWh/kg
25°C
Thermal Work for AlCl
3
Production
-1.90
Reduction Electrolytic Work Requirement (delta G) 6.48
14 C
Thermal Energy for Temperature Maintenance (delta H – delta G) 0.78
25°C
System
7 CO
Thermal Energy for Al at 960°C 0.39
25°C
Theoretical Minimum 5.76
Thermal Energy for CO
2
at 960°C
0.11
Thermal Energy for CO at 960°C 0.25
Note: Thermodynamic values for G, H and S are from Table J.6. Heat capacity data are from Table J.9 and Appendix K
125

Table J.6: Thermochemistry Data for Elements and Compounds Associated witb Aluminum Production
Molecular Chemical
CAS RN Weight Formula J/mol cal/mol
H (s)
J/mol cal/mol
G (s)
J/mol K cal/mol K
S (s)
J/mol K cal/mol K
Cp (s)
Aluminum 7429-90-5 26.98 Al
Aluminum Chloride 7446-70-0 133.34
AlCl
3
Corundum 1334-28-1 101.96
Al
2
O
3
Gibbsite* 155.96
Al
2
O
3
.3H
2
O
Kaolinite* 1332-58-7
Al
2
O
3
.SiO
2
.2H
2
O
Kaolinite, meta 162.04
Al
2
O
3
.SiO
2
Graphite 7440-44-0 12.01 C
Chlorine 70.91
Cl
2
(g)
Carbon Monoxide 630-08-0 28.01 CO (g)
Carbon Dioxide 124-38-9 44.01
CO
2
(g)
Oxygen 7782-44-7 32.00
O
2
(g)
Water 18.00
H
2
O (g)
Silica Dioxide 14808-60-7 60.08
SiO
2
Silicon tetrachloride 10026-04-7 169.90
SiCl
4
(g)
0 0
-704,200 -168,308
-1,675,700 -400,500
-1,293,100 -309,058
-4,119,000 -984,465
-843,840
0 0
0 0
-110,523 -26,416
-393,513 -94,052
0 0
-241,826 -57,798
-910,700 -217,663
-657,000 -157,027
0 0
-628,800 -150,287
-1,582,300 -378,179
-1,154,900 -276,028
-3,793,900 -906,764
-791,351
0 0
0 0
-137,268 -32,808
-394,383 -94,260
0 0
-228,582 -54,632
-220,615
-617,000 -147,467
28.3 6.764
100.7 24.061
50.9 12.165
5.7 1.361
222.9 53.286
197.9 47.301
213.6 51.061
205.0 49.003
188.8 45.132
41.46 9.909
330.70 79.039
24.35 5.82
91.84 21.95
79 18.88
33.598
90.3 21.6
Source: Handbook of Chemistry and Physics, David R Lide, Editor, 80th Edition CRC
*Source: Advances in Physical Geochemistry, Edited by Saxena, S.K. - data courtesy of Mr. Bruce Hemingway at U.S.G.S.
Table J.7: Changes in Heat of Formation Values as a Function of Temperature
Temperature
Heats of Formation in calories per gram mole
Al
2
O
3
*
C * Al *
CO
2
*
CO *
O
2
qC
K
25 298
727 1,000
827 1,100
927 1,200
960 1,233
1,027 1,300
1,127 1,400
-400,300 0 0 -94,050 -26,400 0
-404,400 2,310 18,710 -94,400 -26,750 9,249
-404,000 3,320 21,710 -94,250 -26,900 10,515
-403,600 3,850 24,740 -94,300 -27,000 11,843
-403,500 4,030 25,750 -94,300 -27,100 12,295
-403,200 4,390 27,790 -94,300 -27,300 13,233
-402,800 4,930 30,850 -94,300 -27,350 14,685
Source: *Values from "Technical Working Group on Inert Anode Technologies" Appendix A.9, page 11
126
Appendix J: Theoretical Energy Data and Calculations
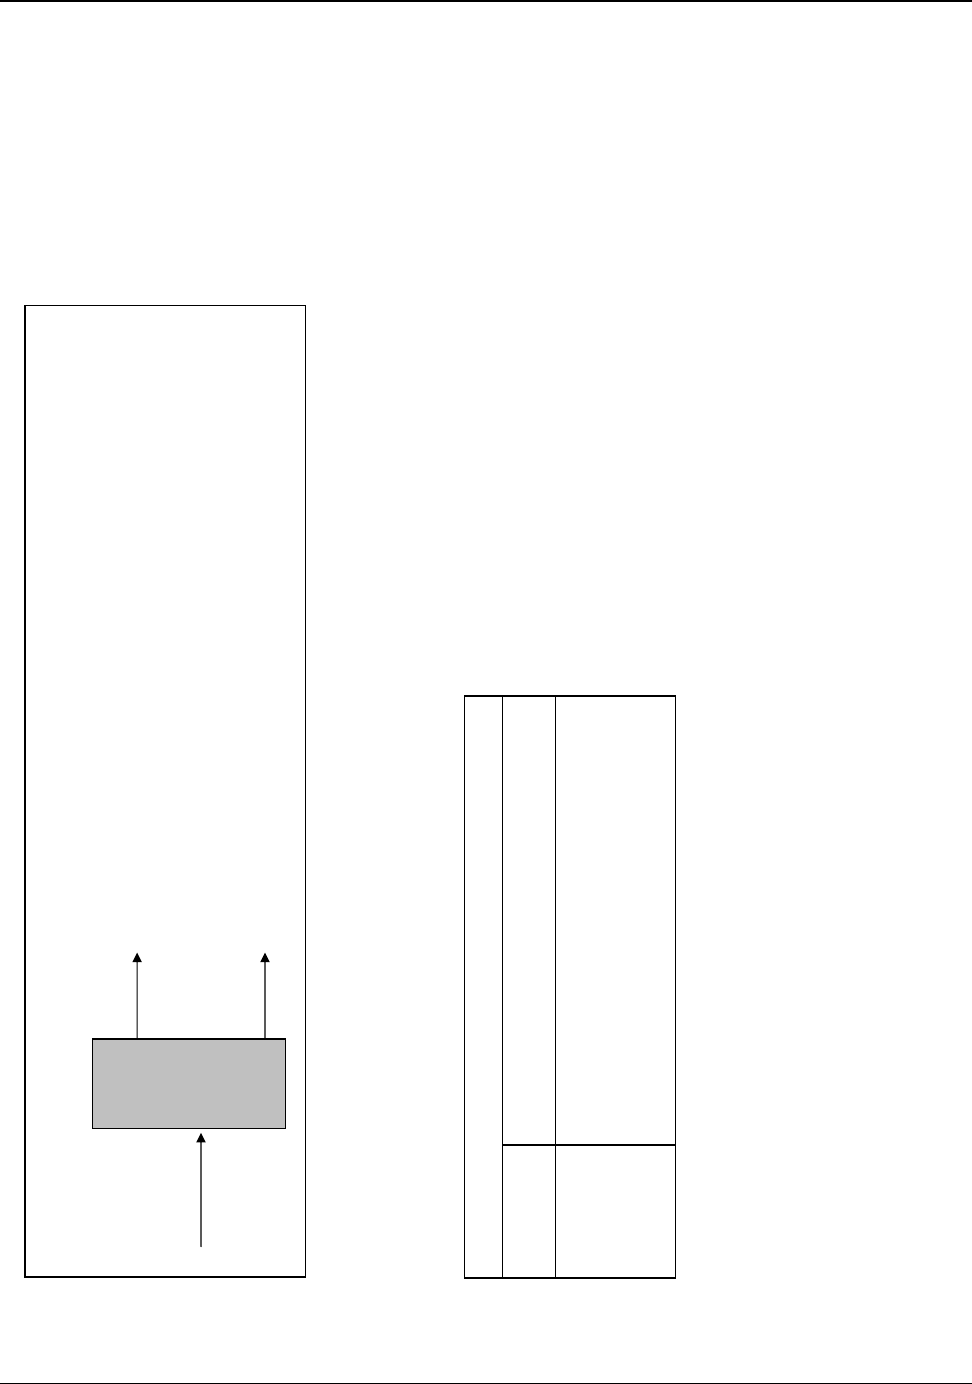
Table J.8: Theoretical Minimum Energy for Gibbsite Dehydration
Reactants
Temp
Al
2
O
3
.3H
2
O
25°C
Kiln
Products
Temp Gibbsite Dehydration Reaction
(products
–
reactants)
Al
2
O
3
( Al
2
O
3
.3H
2
0 ) to ( Al
2
O
3
+ 3 H
2
0 ) = Net cal/gm mole Al
2
O
3
25°C
delta H -618,117 -400,500 -173,393 44,223
Process Theoretical Minimum Energy Requirements
kWh/kg alumina
3 H
2
O
0.50
25°C
Note: Thermodynamic values for G, H and S are from Table J.6. Heat capacity data are from Table J.9 and Appendix K
Table J.9: Heat of Capacity Equations for Gases Associated with Aluminum Production
Standard Molar Heat Capacity, C = a + bT + cT
2
(T in degrees K)
cal/ mol K a
b x 10
3
c x 10
7
O
2
CO
CO
2
Cl
2
6.148 3.102 -9.23
6.420 1.665 -1.96
6.214 10.396 -35.45
7.576 2.424 -0.65
Source: A Different Approach to Thermodynamics, W. F. Ludar, 1967
127
Appendix J: Theoretical Energy Data and Calculations

Appendix K: Alumnum Heat Capacity and Heat of Fusion Data
E
Heat Capacity (cal/mol.K) = A + B.t + C.t
2
+ D.t
3
+ ---
2
-
t
(B.t)
(C.t
3
) (D.t
4
)
E
S tandard Enthalpy (kcal/mol) = A.t + ------------ + --------------- + --------------- –
---
+ F – H
2 3 4
t
(C.t
2
) (D.t
3
)
E
Standard Entropy (cal/mol.K) = A. ln ()t + B.t +
---------------
+
---------------
–
--------------
+ G
2 3
(2.t
2
)
where, t = K/1000 and A, B, C, D, E, F, G and H are constants
Source: http://webbook.nist.gov (Standard Reference Data Program)
Formula Constants for Aluminum
Solid (298 to 933.45 K, 1 atm):
A B C D
6.71348 -1.29418 2.04599 0.819161
E
-0.066294
F
-2.18623
G
14.7968
H
0
Liquid (933.45 to 2790.812 K, 1atm):
A B C D
7.588681 9.40685E-09
4.26987E-09 6.43922E-09
E
1.30976E-09
F
-0.226024
G
17.5429
H
2.524381
128
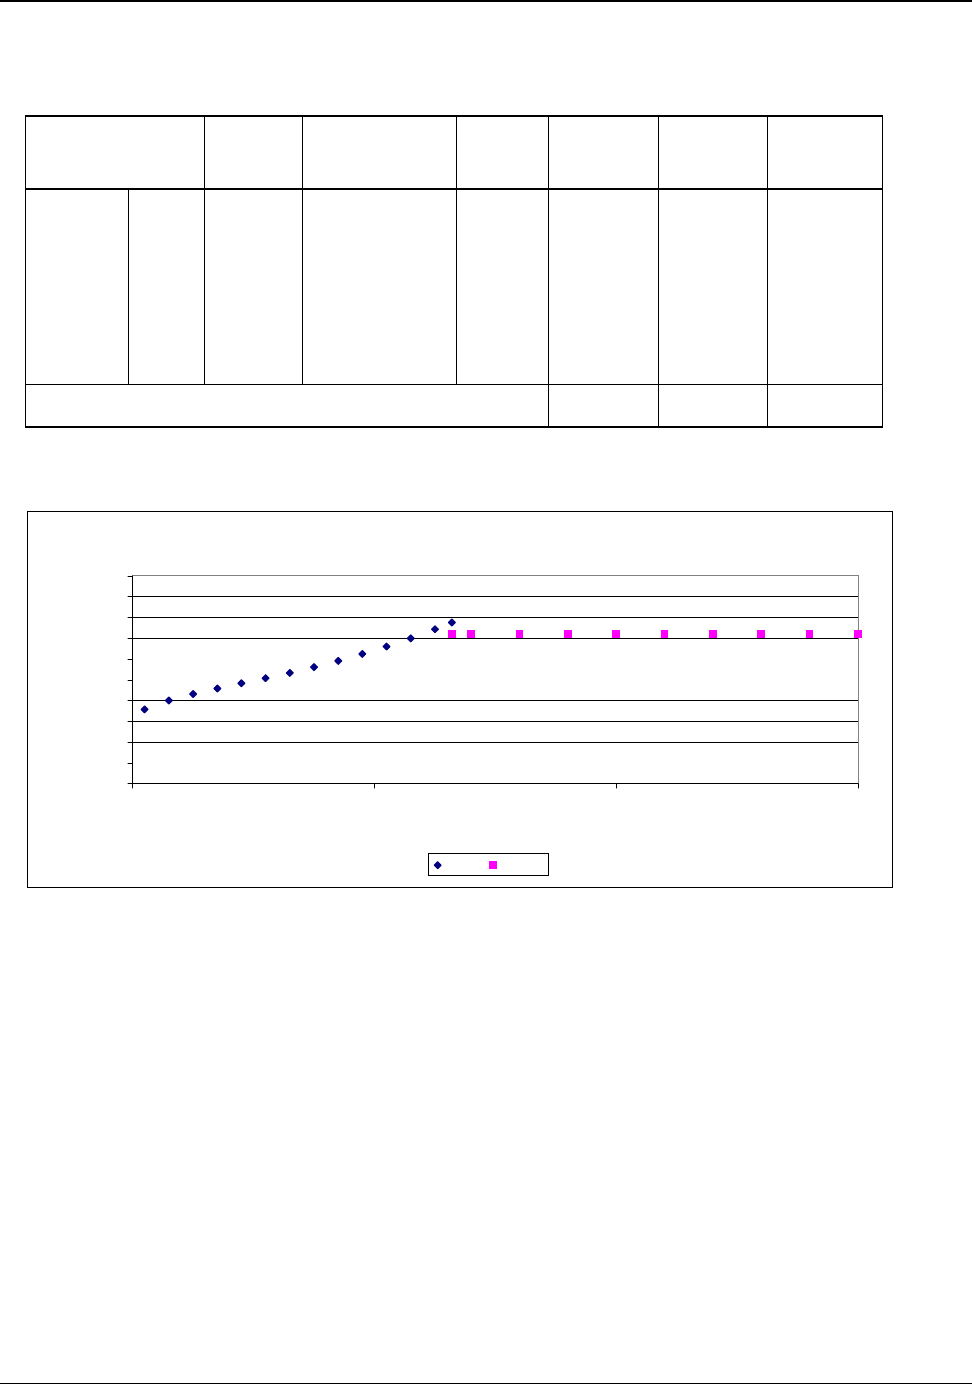
278 5.67
328 5.92
378 6.10
428 6.24
478 6.36
528 6.48
578 6.61
628 6.74
678 6.89
728 7.05
778 7.22
828 7.41
878 7.62
928 7.85
Appendix K: Alumnum Heat Capacity and Heat of Fusion Data
Table K.1:Aluminum Energy Requirements for Heating and Melting
Energy Cumulative Energy Cumulative
Temperature
Heat Capacity at
for Step Energy to Raise for Step Energy to Raise
Temperature
Change from 25
o
C Change from 25
o
C
(
o
C) (K)
(cal/mol K)
(kWh/kg) (kWh/kg) (Btu/lb) (Btu/lb)
25 298 Solid 5.79 0.00 0.00 - -
660 933 7.88 0.19 0.19 286 286
660 Fusion 94.5 (cal/gm) 0.11 170
660 933 Liquid 7.59 0.29 456
775 1048 7.59 0.04 0.33 58 515
960 1233 7.59 0.06 0.39 94 608
2000 2273 7.59 0.34 0.73 526 1,134
Smelting
25
o
C to 960
o
C
Total 0.39 608
Furnace Melting
25
o
C to 775
o
C
Total 0.33 515
Note: Heat capacity for solid aluminum varies significantly with temperature, whereas for molten aluminum, it is nearly
constant.
Heat Capacity as a Function of Temperature
4.00
4.50
5.00
5.50
6.00
6.50
7.00
7.50
8.00
8.50
9.00
0 500 1000 1500
Temperature,
o
C
cal/mol K
Solid Liquid
129

Appendix L: Impact of Secondary Metal Production on Energy
Requirements for U.S. Aluminum Production
The nominal U.S. energy required to produce aluminum metal has been rapidly declining as secondary aluminum
production has grown. Secondary aluminum requires only 6% of the energy necessary to manufacture primary aluminum
(Appendix F, Table F.6). The total U.S. ore-to-metal primary energy values include: refining of half the alumina supply,
anode manufacture, electrolysis and ingot casting. Combining the energy requirements for U.S. production of primary and
secondary metals lowers the average energy associated with U.S. aluminum metal from over 40 kWh/kg for primary alone
to about 21 kWh/kg for the combined metals.
Table L.1:Impact of Secondary Metal Production on the Nominal Energy Requirements to Produce Aluminum
Year
U.S. Primary U.S. Secondary
Aluminum Smelting Aluminum
Production Energy Production
(thousand (kWh per (thousand
metric tonnes) kilogram) metric tonnes)
Market Percent
of Secondary
Metal
Total Energy
Ore-to-Metal to Produce
Combined Metals
(kWh/kg)
Effective Smelting
Energy to Produce
Combined Metals
(kWh/kg)
1960 1,828 23.1 401 18% 69.7 19.2
1961 1,727 22.9 445 67.2 18.5
1962 1,921 22.7 533 65.7 18.1
1963 2,098 22.6 601 64.7 17.9
1964 2,316 22.4 648 64.6 17.8
1965 2,499 22.3 774 62.7 17.3
1966 2,693 22.1 833 62.2 17.2
1967 2,966 21.9 821 63.3 17.5
1968 2,953 21.8 935 61.0 16.8
1969 3,441 21.6 1,067 60.8 16.8
1970 3,607 21.4 937 21% 62.7 17.3
1971 3,561 21.0 1,004 60.5 16.7
1972 3,740 20.6 1,022 59.8 16.5
1973 4,109 20.2 1,127 58.6 16.1
1974 4,448 19.9 1,163 58.0 16.0
1975 3,519 19.5 1,121 54.5 15.0
1976 3,857 19.1 1,334 52.3 14.5
1977 4,117 18.7 1,456 50.9 14.1
1978 4,358 18.3 1,518 50.1 13.8
1979 4,557 17.9 1,612 48.8 13.5
1980 4,653 17.5 1,577 25% 48.2 13.3
1981 4,489 17.4 1,790 45.8 12.7
1982 3,274 17.2 1,666 42.2 11.8
1983 3,353 17.1 1,773 41.3 11.5
1984 4,099 16.9 1,760 43.8 12.1
1985 3,500 16.8 1,762 41.3 11.5
1986 3,039 16.6 1,773 38.9 10.9
1987 3,347 16.5 1,986 38.4 10.7
1988 3,945 16.3 2,122 39.4 11.0
1989 4,030 16.2 2,054 39.7 11.1
1990 4,048 16.1 2,393 37%
37.4 10.5
1991 4,121 16.0 2,286 38.0 10.6
1992 4,042 15.9 2,756 35.0 9.8
1993 3,695 15.8 2,944 32.7 9.2
1994 3,299 15.7 3,086 30.2 8.6
1995 3,375 15.6 3,188 29.9 8.5
1996 3,577 15.5 3,307 30.0 8.5
1997 3,603 15.4 3,547 28.9 8.2
1998 3,713 15.3 3,442 29.6 8.4
1999 3,779 15.2 3,695 28.7 8.1
2000 3,668 15.1 3,450 48% 29.0 8.2
2001 2,637 15.0 2,970 26.4 7.5
2002 2,705 14.9 2,927 26.7 7.6
2003 2,704 14.8 2,820 51% 27.1 7.7
Forty-Three Year Total Change in U.S. Energy Intensity:
1960 69.7 (kWh/kg)
2003 27.1 (kWh/kg) 61.2%
130

Appendix M: Impact of Using Different Technologies on Energy
Requirements for Producing Aluminum
Wetted cathodes allow the anode-cathode-distance to be reduced. This results in a lowering of the voltage requirement for
amperage to pass through the cryolite bath. The following table shows the effect lowering the anode-cathode-distance has
on energy consumption.
Table M.1: Impact of Wetted Cathode Technology on Primary Metal Electrolysis
WETTED
CATHODE
TECHNOLOGY
Typical modern
"prebaked" Hall-
Héroult cell
operating at 95%
current efficiency
ACD = 4.5 cm
Typical modern
"prebaked" Hall-
Héroult cell operating
at 95% current
efficiency and
retrofitted with a
wetted cathode
surface and reduced
ACD
ACD = 3.5 cm
Typical modern
"prebaked" Hall-
Héroult cell operating
at 95% current
efficiency and
retrofitted with a
wetted cathode
surface, aluminum
sump and reduced
ACD
ACD = 2.5 cm
Typical modern
"prebaked" Hall-
Héroult cell operating
at 95% current
efficiency and
retrofitted with a
sloped and wetted
cathode surface,
aluminum sump, and
r e d u c e d A C D
ACD = 2.0 cm
Energy
Requirements
V (dc) kWh/kg Al V (dc) kWh/kg Al V (dc) kWh/kg Al V (dc) kWh/kg Al
Reaction 1.20 3.76 1.20 3.76 1.20 3.76 1.20 3.76
Additional Energy
Requirements:
External 0.15 0.47 0.15 0.47 0.15 0.47 0.15 0.47
Anode 0.30 0.94 0.30 0.94 0.30 0.94 0.30 0.94
Anode
Polarization
0.55 1.73 0.55 1.73 0.55 1.73 0.55 1.73
Cathode
Polarization
0.05 0.16 0.05 0.16 0.05 0.16 0.05 0.16
Cryolite Bath 1.75 5.49 1.36 4.27 0.97 3.05 0.78 2.44
Cathode 0.45 1.41 0.45 1.41 0.45 1.41 0.45 1.41
Other 0.15 0.47 0.15 0.47 0.15 0.47 0.15 0.47
ONSITE Energy Values
Cell Total
% Energy Savings
4.60 14.43 4.21 13.21
8%
3.82 11.99
17%
3.63 11.38
21%
Anode Manufacturing
Total onsite cell and
anode
% Energy Savings
0.61
15.04
0.61
13.82
8%
0.61
12.60
16%
0.61
11.99
20%
TACIT Energy Values
Cell Total
% Energy Savings
4.60 32.23 4.21 29.50
8%
3.82 26.78
17%
3.63 25.41
21%
Anode Manufacturing
Total onsite cell and
anode
% Energy Savings
6.02
38.25
6.02
35.52
7%
6.02
32.80
14%
6.02
31.44
18%
131

Appendix M: Impact of Using Different Technologies on Energy Requirements for Producing Aluminum
Table M.2: Impact of Inert Anode and Wetted Cathode Technology on Primary Metal Electrolysis
A B C D
INERT ANODE and
WETTED
CATHODE
TECHNOLOGY
Typical modern Hall-
Héroult cell
operating at 95%
current efficiency
and ACD of 4.5 cm
Inert Anode direct
substitution operating
at 95% current
efficiency
Inert Anode operating
at 95% current
efficiency with
polarization
differences reported
for oxygen generation
Inert Anode operating
at 95% current
efficiency, with
oxygen polarization
differences and an
ACD of 2cm using
Wetted Cathode
Energy
Requirements
V (dc) kWh/kg Al V (dc) kWh/kg Al V (dc) kWh/kg Al V (dc) kWh/kg Al
Reaction 1.20 3.76 2.20 6.90 2.20 6.90 2.20 6.90
Additional Energy
Requirements:
External 0.15 0.47 0.15 0.47 0.15 0.47 0.15 0.47
Anode 0.30 0.94 0.30 0.94 0.30 0.94 0.30 0.94
Anode
Polarization
0.55 1.73 0.55 1.73 0.10 0.31 0.10 0.31
Cathode
Polarization
0.05 0.16 0.05 0.16 0.05 0.16 0.05 0.16
Cryolite Bath 1.75 5.49 1.75 5.49 1.75 5.49 0.78 2.44
Cathode 0.45 1.41 0.45 1.41 0.45 1.41 0.45 1.41
Other 0.15 0.47 0.15 0.47 0.15 0.47 0.15 0.47
ONSITE Energy Values
Cell Total
% Energy Savings
4.60 14.43 5.60 17.57
-22%
5.15 16.15
-12%
4.18 13.11
9%
Anode Manufacturing
Total onsite cell and
anode
% Energy Savings
0.61
15.04
0.77
18.33
-22%
0.77
16.92
-13%
0.77
13.87
8%
TACIT Energy Values
Cell Total
% Energy Savings
4.60 32.23 5.60 39.23
-22%
5.15 36.08
-12%
4.18 29.27
9%
Anode Manufacturing
Total onsite cell and
anode
% Energy Savings
6.02
38.25
0.77
40.00
-5%
0.77
36.84
4%
0.77
30.03
21%
Inert Anodes by themselves require additional reaction voltage as can be seen by comparing columns A and B. However,
this additional energy requirement is offset by the elimination of carbon anode manufacturing, along with the elimination
of the feedstock energy associated with carbon. The estimate for the energy associated with the manufacture of inert
anode is shown in Table M.3. Column C shows the impact that results from the lower anode polarization and the ability to
design to release gas more effectively. Wetted cathodes combined with inert anodes can provide additional savings as
shown in column D.
132

Appendix M: Impact of Using Different Technologies on Energy Requirements for Producing Aluminum
Table M.3: Estimate of Energy Requirement for Manufacturing an Inert Anode
The energy requirements for manufacturing an inert anode are significantly less than the total manufacturing energy of
the many consumable carbon anodes that it replaces. Below is an estimate of the energy required to manufacture an
inert anode. Assuming an inert anode has a cell life of two years, the equivalent carbon energy requirements can be
calculated. Using 1 cm
2
as a basis, the following can be calculated:
0.85 A/cm
2
is the typical current density for a modern Hall-Héroult Cell current density.
2980 Ah/kg Al is the theoretical amperage required to produce aluminum.
95% is the typical efficiency of a modern Hall-Héroult carbon anode cell.
0.446 kilograms of carbon are required to produce one kilogram of aluminum.
From the above data, the amount of carbon consumed and aluminum produced per cm
2
over a two year period is
calculated to be:
14.82 kg
of carbon are consumed per cm
2
over a two year operating period
33.23 kg
of aluminum are produced per cm
2
over a two year operating period.
From Appendix I:
6.02 kWh/kg of Al is the tacit energy associated with carbon anode. The total energy associated with the two-year
produced
operation of the 1 cm
2
of carbon anode can be calculated.
200 kWh of tacit energy are consumed for anode manufacture and use.
2.27 gm/cm
3
is the density of a carbon anode. The height of the 1 cm
2
of carbon can be calculated as below.
6529 cm
is the height of carbon anode with a 1 cm
2
base or anode face for two years of operation
The materials under consideration for inert anodes have no inherent fuel value as does the carbon anode. The tacit
energy requirement associated with the manufacturing of an inert anode is related to the extraction of materials and the
inert anode manufacturing process. Assuming that the inert anode is 5 cm thick per cm
2
of anode face and that it
requires 5 times the total tacit energy of a carbon anode (which includes its fuel value) to manufacture, it can be
calculated that:
0.77 tacit kWh/kg of aluminum will be required to produce an inert anode.
133

Appendix M: Impact of Using Different Technologies on Energy Requirements for Producing Aluminum
Table M.4: Estimate of Energy Requirement to Manufacture Aluminum Using Different Technologies
ALUMINUM
PRODUCTION
TECHNOLOGIES
Typical modern Hall-
Heroult prebaked anode
cell operating at 95%
current efficiency & with
ACD of 4.5 cm
Typical modern Hall-
Heroult cell operating at
95% current efficiency,
retrofitted with a sloped &
wetted cathode surface,
aluminum sump, & a
reduced ACD of 2.0 cm
Inert Anode operating at
95% current efficiency
with oxygen polarization
differences & ACD of
2.0 cm using Wetted
Cathode technology
Carbothermic Reduction
with a reaction efficiency
of 95% and a furnace
efficiency of 80%
Chloride Reduction of
Kaolinite Clays: electrolysis
current efficiency 95%,
reaction efficiency 95% &
heating efficiency 85%
Raw Materials
Onsite Energy
Required
Tacit Energy Required
kWh/kg Al
alumina 7.59
alumina 8.24
kWh/kg Al
alumina 7.59
alumina 8.24
kWh/kg Al
alumina 7.59
alumina 8.24
kWh/kg Al
alumina 7.59
alumina 8.24
kWh/kg Al
see Note B
kaolinite 8.14
kaolinite 8.84
Onsite Reaction Energy Requirements
Reaction Thermal
Furnace Losses
Reaction Elerctrolysis
Cell Ohmic
TOTAL Reaction
Energy
Anode Manufacturing
Onsite Energy
Savings
V (dc)
1.20 3.76
3.40 10.67
4.60 14.43
0.61
V (dc)
1.20 3.76
2.43 7.62
3.63 11.38
0.61
20%
V (dc)
2.20 6.90
1.98 6.20
4.18 13.11
0.77
8%
7.71
1.93
9.63
0
36%
-1.90
see Note C 0.40
V (dc)
2.07 6.48
0.93 2.93
3.00 7.91
0.77
42%
Total Onsite Energy Requirements Including Raw Materials
Raw Ore Materials
Reactions
Carbon / Electrodes
Total Energy Savings
7.59
14.43
0.61
7.59
11.38
0.61
13%
7.59
13.11
0.77
5%
7.59
9.63
see note A 0
24%
8.14
7.91
see note D 0.77
26%
Total Tacit Energy Requirements Including Raw Materials
Raw Ore Materials
Reactions
Carbon / Electrodes
Total Energy Savings
8.24
32.23
6.02
8.24
25.41
6.02
15%
8.24
29.27
0.77
18%
8.24
21.52
see note A 8.43
18%
8.84
18.60
see note D 12.13
15%
134

Appendix M: Impact of Using Different Technologies on Energy Requirements for Producing Aluminum
Note A: The Carbothermic reaction requires twice the carbon as the Hall-Héroult reaction. The Hall-Héroult
reaction on a theoretical basis requires 0.33 kg C / kg Al. In this estimate, it is assumed that the
carbothermic reaction utilized carbon at a 95% efficiency. Unlike a carbon anode, the carbon used does
not require the energy associated with carbon anode manufacturing. Hence only the fuel or "secondary
energy" requirement of the carbon are used.
Note B: Kaolinite contains 27.2% aluminum by weight. Bauxite contains 45% aluminum by weight. Both
materials contain about the same percentage of impurities. For this estimate, it is assumed that the
processing and calcination energy of kaolinite is the same as bauxite. However, 66% more kaolinite must
be processed to produce a kilogram of aluminum than bauxite. Kaolinic clays contain valuable titanium,
in addition to their silicon content. These materials will likely be recovered in the processing plant and
account for approximately 35% of kaolinic clay content. This report allocates 65% of the total raw
material energy requirement to the kaolinite material used for aluminum manufacturing.
Note C: The Carbo-Chlorination reaction is exothermic (-1.90 kWh/kg Al). However, Toth Aluminum reports that
based on pilot plant experience and the challenges of capturing the off-gas energy, a small quantity of
energy (0.4 kWh/Kg Al) is required to maintain the reaction system temperature.
Note D: The Carbo-Chlorination reaction requires 0.89 kg of carbon per kg of aluminum produced. In this
estimate, it is assumed that the Carbo-Chlorination reaction utilized carbon at a 95% efficiency. It is also
assumed that the energy required and fuel value of the carbon is the same on a weight basis as the carbon
utilized for Carbothermic Reduction of Aluminum. (see note A)
135
