
Development And Integration
Of Renewable Energy:
Lessons Learned From Germany
Hans Poser
Jerey Altman
Felix ab Egg
Andreas Granata
Ross Board
July 2014
DEVELOPMENT AND INTEGRATION
OF RENEWABLE ENERGY: LESSONS
LEARNED FROM GERMANY
July 2014
Hans Poser
Jeffrey Altman
Felix ab Egg
Andreas Granata
Ross Board
© 2014 by FAA Financial Advisory AG (Finadvice).
All rights reserved. No part of this publication may be reproduced, stored in a retrieval system or
transmitted in any form or by any means, electronic, mechanical, photocopying, recording or any
information storage or retrieval system or method, now known or hereinafter invented or adopted, without
the express prior written permission of the FAA Financial Advisory AG.
This work was prepared by FAA Financial Advisory AG (Finadvice) for the Edison Electric Institute
(EEI) and Finadvice’s European clients. When used as a reference, attribution to Finadvice is
requested. Although every reasonable effort has been made to ensure the accuracy of this
publication, Finadvice and any person acting on its behalf (a) does not make any warranty, express or
implied, with respect to the accuracy, completeness or usefulness of the information, advice or
recommendations contained in this work, and (b) does not assume and expressly disclaims any liability
with respect to the use of, or for loss and/or damages resulting from the use of any information, advice or
recommendations contained in this work.
The views and opinions expressed in this work do not necessarily reflect those of Finadvice or any
person(s) acting on behalf of Finadvice. This material and its production, reproduction and distribution by
Finadvice does not imply endorsement of the material.
Published by:
Finadvice
FAA Financial Advisory AG
Soodstrasse 55
CH-8134 Adliswil
Switzerland
Office: +41 43 377 1000
Fax: +41 43 377 1005
Website: www.finadvice.ch
Contents
1. EXECUTIVE SUMMARY ......................................................................................................... 1
2. INTRODUCTION .................................................................................................................... 8
2.1. Why Germany? ............................................................................................................ 8
2.2. Germany’s renewable policies and support mechanisms ........................................... 10
3. GERMANY’S RENEWABLE “SUCCESS” STORY ..................................................................... 16
3.1. Renewable energy deployment and diversification of the power portfolio ............... 16
3.2. Emission reductions ................................................................................................... 18
3.3. Energy independence ................................................................................................. 20
3.4. Lower wholesale prices .............................................................................................. 20
3.5. Job creation and expansion of Germany’s manufacturing industry ........................... 21
4. UNINTENDED CONSEQUENCES OF GERMANY’S RENEWABLE POLICIES ............................... 26
4.1. Enormous governmental subsidies for renewables .................................................... 26
4.2. Ever increasing power prices to residential customers .............................................. 30
4.3. Impact on national competitiveness ........................................................................... 34
4.4. Financial impact to thermal generators and reliability ............................................... 36
4.5. Impact of renewables’ variability on market operations and thermal plants ............. 42
4.6. Expansion and additional investment in the power grid ............................................ 47
4.7. Repeated redesigns and boom and bust cycles ........................................................... 50
5. CONCLUSION: TAKEAWAYS OF THE GERMAN AND EUROPEAN EXPERIENCE WITH
RENEWABLES ............................................................................................................................. 58
APPENDIX A: INFLUENCE OF HIGHLY FLEXIBLE GRID DEMANDS ON AGING AND LONG TERM
RELIABILITY OF LARGE TURBINE GENERATOR: AN INSIGHT FROM SIEMENS ............................. 60
APPENDIX B: A PERSPECTIVE FROM THE INSURANCE INDUSTRY ON CHANGES TO THE POWER
INDUSTRY: INSIGHT FROM MARSH ............................................................................................ 65
APPENDIX C: REGULATORY INTERVENTIONS ON VARIOUS SUBSIDIES SCHEMES ACROSS
SEVERAL EUROPEAN COUNTRIES ............................................................................................... 69
BIBLIOGRAPHY .......................................................................................................................... 72
References to the Finadvice and the Authors ........................................................................... 78

1
1. EXECUTIVE SUMMARY
Over the last decade, well-intentioned policymakers in Germany and other European countries
created renewable energy policies with generous subsidies that have slowly revealed themselves
to be unsustainable, resulting in profound, unintended consequences for all industry stakeholders.
While these policies have created an impressive roll-out of renewable energy resources, they
have also clearly generated disequilibrium in the power markets, resulting in significant
increases in energy prices to most users, as well as value destruction for all stakeholders:
consumers, renewable companies, electric utilities, financial institutions, and investors.
Accordingly, the United States and other countries should carefully assess the lessons learned in
Germany, with respect to generous subsidy programs and relatively rapid, large-scale
deployment and integration of renewable energy into the power system. This white paper is
meant to provide further insight into the German market, present an objective analysis of its
renewable policies, and identify lessons learned from Germany, and to a lesser degree, other
European countries.
1
The rapid growth of renewable energy in Germany and other European countries during the
2000’s was due to proactive European and national policies aimed at directly increasing the share
of renewable production in their energy mixes through a variety of generous subsidy programs.
Two main types of subsidy programs for renewable power developed in Europe include feed-in
tariffs (FITs), which very quickly became the policy of choice for Germany and many other
European countries, and quota obligation systems.
FITs are incentives to increase production of renewable energy. This type of subsidy guarantees
long-term (usually for 20 years) fixed tariffs per unit of renewable power produced. These fixed
tariffs normally are independent of market prices and are usually set by the government, but can
be structured to be reduced periodically to account for technology cost decreases. The level of
1
The authors of this white paper would like to state that they fully support renewables as a part of the overall power
portfolio. All the authors have worked with both electric utilities and purely renewable companies. Some of them
have 20+ years of experience in the power sector, and a couple have direct equity interests in renewable projects.

2
the tariffs normally depends on the technology used and the size of the production facility.
Because of their generosity, FITs proved capable of quickly increasing the share of renewable
power, but since the FITs are set administratively, it is difficult to meet renewable energy goals
in the most cost-effective way possible.
The quota system is the European equivalent to the Renewable Portfolio Standard used in the
United States. Whereas FIT programs set the price for the resources and let the market achieve
whatever level it can at that price, the quota system is a market based system that sets the desired
amount of renewable resources and lets the market determine its price. Under the quota system,
compliance is proven through renewable certificates that can usually be traded.
Germany used FITs to help finance its energy policy, “Energiewende” (the energy
transformation), that calls for a nuclear-free and carbon-reduced economy through a vast
deployment of renewable technologies.
Because FITs levels were administratively driven and slow to adapt to the evolution of the solar
market, the incentive became excessively generous, which initiated an uncontrolled development
of renewables, which, in turn, created unsustainable growth with a myriad of unintended
consequences and lessons learned. Accordingly, this analysis will focus on Germany, whose FIT
policies allowed it to realize the highest production of non-hydro renewable electricity (wind and
solar) in Europe.
The most important lessons learned include:
1. Policymakers underestimated the cost of renewable subsidies and the strain they
would have on national economies. As an example, Germany’s FIT program has cost
more than $412 billion to date (including granted and guaranteed, but not yet paid FIT).
Former German Minister of the Environment Peter Altmaier recently estimated that the
program costs would reach $884 billion (€680 billion
2
) by 2022. He added that this figure
could increase further if the market price of electricity fell, or if the rules and subsidy
2
Amounts in dollars are translated from euros at 1:1.3 exchange rate.

3
levels were not changed.
3
Moreover, it is estimated that Germany will pay $31.1 billion in
subsidies for 2014 alone.
4
A recent analysis
5
found that from 2008 to 2013, Germany
incurred $67.6 billion (€52 billion) in net export losses because of its high energy costs,
compared to its five leading trade partners. Losses in energy intensive industries
accounted for 60 percent of the total losses. This was further highlighted by a recent
International Energy Agency report, which stated that the European Union (EU) is
expected to lose one-third of its global market share of energy intensive exports over the
next two decades due to high energy prices,
6
expensive energy imports of gas and oil, as
well as costly domestic subsidies for renewable energy.
2. Retail prices to many electricity consumers have increased significantly, as subsidies
in Germany and the rest of Europe are generally paid by the end users through a cost-
sharing procedure. Household electricity prices in Germany have more than doubled,
increasing from €0.14/kilowatt hour (kWh) ($0.18) in 2000 to more than €0.29/kWh
($0.38) in 2013. In Spain, prices also doubled from €0.09/kWh in 2004 to €0.18/kWh in
2013 ($0.12 to $0.23) while Greece’s prices climbed from €0.06/kWh in 2004 to
€0.12/kWh in 2013 ($0.08 to $0.16)
7
. Comparatively, household electricity prices in the
United States average $0.13/kWh, and have remained relatively stable over the last
decade.
3. The rapid growth of renewable energy has reduced wholesale prices in Germany,
with adverse consequences on markets and companies. Large subsidies and guaranteed
interconnection to the grid for renewable energy led to unexpected growth over the last 10
years in Germany and elsewhere. The merit order in Germany’s wholesale markets
switched as renewables, with a zero variable cost of production, take precedence over
3
Frankfurter Allgemeine, Energiewende könnte bis zu einer Billion Euro kosten, 19th February 2013;
http://www.faz.net/aktuell/politik/energiepolitik/umweltminister-altmaier-energiewende-koennte-bis-zu-einer-
billion-euro-kosten-12086525.htm
4
German Federal Ministry for the Environment, “Nature Conservation, Building and Nuclear Safety: Development
of renewable energy sources in Germany in 2012”
5
Financial Times, “Germans told of billions lost to trade due to energy policy”, 26
th
February 2014,
http://on.ft.com/1cRFiKb
6
Financial Times, “Energy price gap with the US to hurt Europe for ‘at least 20 years’”; 29
th
January 2014;
http://www.ft.com/cms/s/0/80950dfe-8901-11e3-9f48-00144feab7de.html#axzz2thyHzZc8
7
European Commission, Eurostat,
http://epp.eurostat.ec.europa.eu/tgm/table.do?tab=table&plugin=1&language=en&pcode=ten00115
4
thermal plants. As a result, wholesale prices in Germany for base load have fallen
dramatically from €90-95/megawatt hour (MWh) in 2008 to €37/MWh in 2013. This has
created a large amount of load and margin destruction for utilities that built and financed
thermal plants. Many new gas-fired power plants have been rendered uneconomical,
leaving owners to shore up their balance sheets by undertaking large divestitures of some
of their holdings, as well as by reducing their operational costs. The impact to utilities’
shareholder value has been dramatic and has come on top of the impact of the global
financial crises, and, in the case of Germany, the decommissioning of nuclear power. The
German utilities have seen their stock plunge by nearly 45 percent since 2010. Some
power plant operators in Germany and other countries, like the United Kingdom, are now
calling for capacity payments to ensure that reliability is maintained and not threatened by
the shutdown of various thermal power stations.
4. The wholesale pricing model has changed as a result of the large renewable energy
penetration. In the past, wholesale prices followed the demand curve, but in Europe they
now react to the weather; going down when the sun shines and the wind blows, and up
when—at times of high demand—the sun does not shine and the wind does not blow.
Price forecasts and power trading require more skill sets and different know-how,
including weather forecasting.
5. Fossil and nuclear plants are now facing stresses to their operational systems as these
plants are now operating under less stable conditions and are required to cycle more often
to help balance renewables’ variability. Investments in retrofits will be required for these
plants in order to allow them to run to these new operational requirements. Moreover,
renewable resources are dramatically changing thermal plants’ resource planning and
margins. As a result, many of these plants are now being retired or are required to receive
capacity payments in order to economically be kept online.
6. Large scale deployment of renewable capacity does not translate into a substantial
displacement of thermal capacity. Because of the variability of wind and solar, there are
many hours in the year during which most generation comes from thermal power plants,
which are required to provide almost complete redundant capacity to ensure the reliability

5
of the system. In turn, grid interventions have increased significantly as operators have to
intervene and switch off or start plants that are not programmed to run following market-
based dispatching. For instance, one German transmission operator saw interventions
grow from two in 2002 to 1,213 in 2013. It is higher amounts of renewables with low full
load hours relative to the total portfolio of power production that creates greater variability
and strains on the grid. In the case of Germany, it is the large-scale deployment of both
wind and solar that has impacted the entire system.
7. Large-scale investments in the grid are being required to expand transmission grids so
they can connect offshore and onshore wind projects in the north of Germany to
consumers in the south of the country. The total investment cost for the build-out of
German onshore and offshore transmission systems is estimated to be around $52 billion
(€40 billion) over the next 10 years. Moreover, the grids are now being challenged to meet
the dynamic flows of variable renewables and require significant additional investment to
accommodate increased penetration of renewables. All of these costs will ultimately be
passed on to electricity consumers. This has not gone unnoticed in Germany or in the EU.
A report was released in late February 2014 by an independent expert commission
mandated by the German government, which concluded that Germany’s current program
of incenting renewables is an uneconomic and inefficient means to reduce emissions and
therefore should be stopped
8
. Moreover, the European Commission released new
guidelines on April 9, 2014, with effect starting in 2017 that will correct market
distortions. It will essentially ban all FIT subsidies and introduce technology agnostic
auctions as the only incentives for renewables.
8. Overgenerous and unsustainable subsidy programs resulted in numerous redesigns
of the renewable support schemes, which increased regulatory uncertainty and
financial risk for all stakeholders in the renewable energy industry. As the lessons
above show, some European renewable energy regulatory regimes were inappropriately
structured, gamed by market players, or made obsolete by market conditions. As a result,
governments and regulators corrected unsustainable regulatory regimes by reducing the
8
Frankfurter Allgemeine. http://www.faz.net/aktuell/wirtschaft/wirtschaftspolitik/oekostrom-regierungsberater-
wollen-eeg-abschaffen-12820227.html
6
level of subsidies, sometimes retroactively, and modifying the rules of the programs.
These changes often resulted in significant value destruction to various renewable players
and their respective investors. This continued regulatory uncertainty across Europe is
increasing the cost of capital to European renewable companies, which the rating agency
Fitch just recently highlighted as the most likely sector in the European energy market to
receive a downgrade in 2014.
These lessons learned are important and provide factual analyses to assist other countries’
electric industry stakeholders’ in creating more technically-efficient, cost-effective and
sustainable ways to integrate renewable energy.
U.S. stakeholders should take into consideration the lessons learned from Germany and Europe:
Utilities should incorporate those lessons into their strategic planning, load forecasting, financial
planning, trading, and regulatory affairs organizations. Decisions about current and future
investments should then be made with this new analysis in mind.
Renewable companies should calculate appropriately the true costs of grid enhancements,
capacity, and other important measures when submitting their plans to commissioners, investors,
and other stakeholders.
Legislators and regulators should use the lessons learned from large scale integration of
renewables in Germany and elsewhere in Europe to ensure a stable transition of renewables as
part of the overall power portfolio while ensuring high reliability of power, stability of pricing to
all users, as well as minimal value destruction to both utilities and renewable companies.
Finally, consumers must be made aware of the tradeoffs to a large portfolio of renewables and
the necessary requirement for a smooth transition as part of the overall power portfolio.
In conclusion, the lessons learned in Europe prove that the large-scale integration of renewable
power does not provide net savings to consumers, but rather a net increase in costs to consumers
and other stakeholders. Moreover, when not properly assessed in advance, the rapid, large scale
integration of renewables into the power system will ultimately lead to disequilibrium in power
markets, as well as value destruction to renewable companies, utilities, and their respective
7
investors. The U.S. has the opportunity to incorporate these lessons learned to ensure the
sustainable growth of renewable energy over the long-term, for the benefit of all customers.

8
2. INTRODUCTION
Over the last decade, well-intentioned policymakers in Germany and other European countries
have created renewable energy policies that have slowly revealed themselves to be
unsustainable, resulting in profound, unintended consequences for all industry stakeholders.
While these policies have created an impressive roll-out of renewable energy resources, they
have also clearly generated disequilibrium in the power markets, resulting in significant
increases in energy prices to most users, as well as value destruction for all stakeholders:
consumers, renewable companies, electric utilities, financial institutions, and investors.
Accordingly, the United States and other countries should carefully assess the lessons learned in
Germany, with respect to generous subsidy programs and relatively rapid, large-scale
deployment and integration of renewable energy into the power system. This white paper is
meant to provide further insight into the German market, present an objective analysis of its
renewable support policies, and identify lessons learned from Germany, and to a lesser degree,
other European countries.
9
2.1. Why Germany?
More than any other region in the world, Europe has taken a proactive stance on an extensive
roll-out of renewable forms of energy. Further, Germany has been one of the most aggressive
supporters of renewable power in the world, and, accordingly provides an appropriate case study
of the law of unintended consequences.
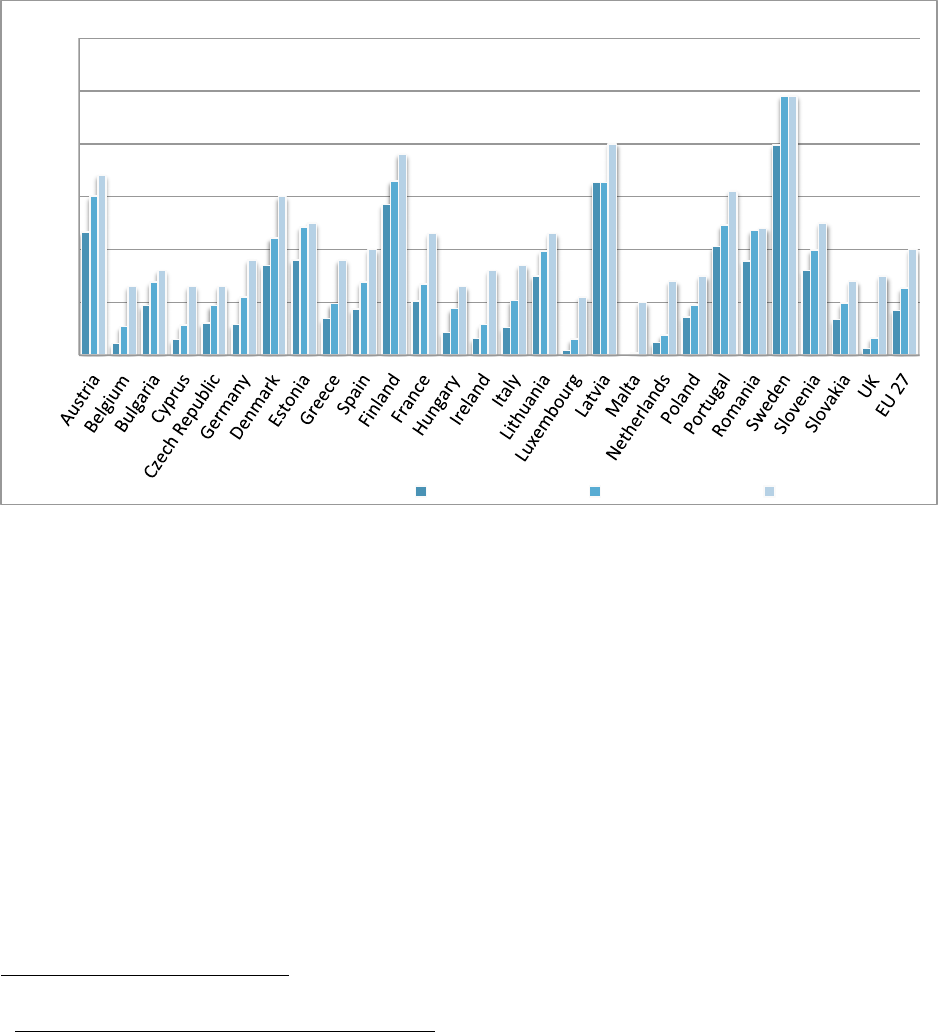
As a result of aggressive policies during the last decade, the European Union (EU or Europe) has
increased its gross renewable electricity generation by 50 percent, climbing from 13.6 percent in
2000 to 23.5 percent in 2012. As of 2011, the EU was the world’s second largest renewable
generator (following China with 18.6 percent of total production), providing 16.5 percent of the
world’s total renewable electricity generation (including hydropower). More interestingly, in
2010, the EU produced 70 percent of the world’s electricity net generation from solar
9
The authors of this white paper would like to state that they fully support renewables as a part of the overall power
portfolio. All the authors have worked with both electric utilities and purely renewable companies. Some of them
have 20+ years of experience in the power sector, and a couple have a direct equity interests in renewable projects.
9
photovoltaics (PV) and 44 percent of the world’s wind generation.
10
However, it must be noted,
this market share is decreasing as the United States and China expand both their wind and solar
PV portfolios.
Figure 1. EU 27 Member States: Trends in the share of renewable generation in gross final
energy consumption (EC, 2010)
11
Although Germany is not the European country with the highest renewable energy penetration, it
has become the most widely cited case study because of its status as the largest European
producer of non-hydro renewable electricity, its economic importance in Europe, and its much-
observed and replicated support mechanism for renewables, the feed-in tariff (FIT) program.
After decades of experience with policies promoting renewable energy, Germany has become the
focus of global attention with respect to its aggressive renewable policies and their unintended
consequences.
Germany is Europe’s largest economy, the fourth largest country in the world based on GDP,
and the third largest exporting country in the world. Additionally, Germany also has the single
10
EU Commission Staff Working Document, “Energy Economic Developments in Europe”, Brussels 22.1.2014.
http://ec.europa.eu/energy/renewables/index_en.htm
11
Eurostat European Commission
!"#
$!"#
%!"#
&!"#
'!"#
(!"#
)!"#
%!!(#*+,#,-./0#
%!$!#*+,#,-./0#
%!%!#*+,#1./203#

10
largest energy market in Europe, with a total net installed generation capacity of 168 gigawatts
(GW) in 2011 and, with its interconnection to nine surrounding countries through a large
interconnection network, Germany is the second largest European exporter of energy after
France.
2.2. Germany’s renewable policies and support mechanisms
The rapid growth of renewable energy in Germany and other European countries is due to
proactive European and national policies aimed at directly increasing the share of renewable
production in their energy mixes through a variety of generous subsidy programs.
2.2.1. Government support for renewable energy
The European Commission (EC) has historically concluded that more renewable energy will
enable the EU to cut greenhouse gas (GHG) emissions and reduce its dependency on energy
imports. It also has created mechanisms to ensure that a strong renewables industry will
encourage technological innovation and job creation.
12
To achieve those goals, the EC developed
the first European Directive on renewable energy in 2001, which was amended by a second
directive in 2009 that established the Europe-wide goal of obtaining 20 percent of its total energy
consumption, including all sectors, from renewable sources by 2020.
13
The directive also set
differentiated goals for each country, but left it up to them to decide how to achieve their national
target. The EC asked each member state to develop a National Renewable Energy Action Plan
(NREAP) outlining the country’s overall strategy and to submit periodic progress reports.
In 2014, the EU extended climate and energy targets to 2030, requiring an aggregate 27 percent
renewable energy within total energy consumption, and a 40 percent reduction of GHG
emissions (from 1990 levels). This package is not prescriptive and does not require NREAPs.
Instead, it offers states the opportunity to determine policy at a national level.
12
European Commission's Directorate-General for Energy, Online Information platform about strategies for
renewable energy
13
European Commission, Directive 2009/28/EC, 23 April 2009; http://eur-
lex.europa.eu/LexUriServ/LexUriServ.do?uri=CELEX:32009L0028:EN:NOT

11
According to the differentiated goals set by the renewables directive, Germany’s share of energy
from renewable sources in gross final consumption of energy by 2020 was set at 18 percent. In
its NREAP from 2010,
14
the country estimated that renewable energy would account for 19.6
percent of final energy consumption by 2020, with 38.6 percent of renewables in the electricity
sector, 15.5 percent in the heating/cooling sector, and 13.2 percent in the transportation sector.
At the end of 2012, Germany’s total renewable generation, including hydropower, represented
23.5 percent of total electric output.
15
In addition to European goals, Germany has, for many years, had its own energy policy
promoting renewable energy. The so-called “Energiewende,” or the energy transformation, calls
for a nuclear-free and carbon-reduced economy through a vast deployment of renewable
technologies. Germany’s goal is to reduce carbon dioxide (CO
2
) emissions by 90 percent from
1990 levels and to provide 80 percent of its electricity generation with renewables by 2050. The
government has also planned the complete phase out of nuclear power by 2022.
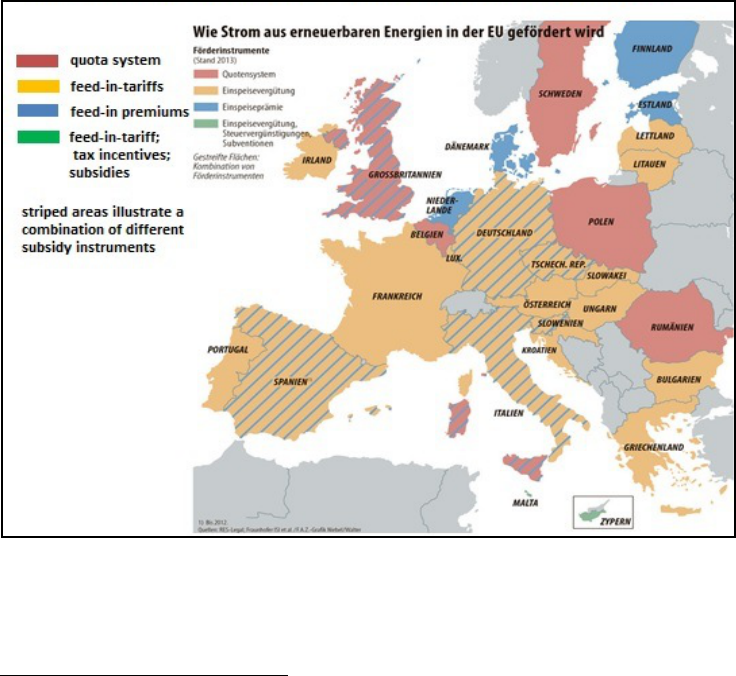
2.2.2. Different subsidy schemes around Europe
16
As a result of the European renewable directives, all European countries chose their preferred
policies and support mechanisms and later implemented NREAPs to deploy renewable energy.
Two main types of subsidy programs for renewable power developed in Europe include FITs,
which very quickly became the policy of choice, and quota obligation systems.
FITs
FITs are incentives to increase production of renewable energy. This type of subsidy guarantees
long-term (usually for 20 years) fixed tariffs per unit of renewable power produced. These fixed
tariffs normally are independent of market prices and are usually set by the government. The
level of the tariffs normally depends on the technology used and the size of the production
14
European Commission, Action Plans and Forecasts; http://ec.europa.eu/energy/renewables/action_plan_en.htm
15
German Federal Ministry for the Environment, Nature Conservation, Building and Nuclear Safety: Development
of renewable energy sources in Germany
16
Sources: IZES (Instituts für ZunkunftsEnergieSysteme); “Das Erneuerbare-Energien-Gesetz –Erfahrungen und
Ausblick“ Institut der deutschen Wirtschaft Köln, 2012 - Frankfurter Allgemeine Zeitung 21.10.2013 Wirtschaft.
http://blog.insm.de/4770-quotenmodell-versus-einspeisevergutung-aus-der-praxis-lernen/;
http://www.greenpeace.de/themen/energie/nachrichten/artikel/warum_das_eeg_besser_ist_als_ein_quotenmodell/

12
facility. Additionally, in some cases, the tariff is scheduled to be lowered periodically by a
defined percentage to account for the assumed technology cost decrease.
The advantage (and also disadvantage) of FITs is that it is independent of the market price. This
mechanism allows fostering a technology that has not yet reached commercial viability, but is
considered an important addition to the production portfolio. In 2004, the FIT for PV power was
€457/megawatt hour (MWh), but in 2014, it was only €94.7/MWh.
17
This reduction followed a
decrease in the cost of technologies, as well as program redesigns that lowered the subsidy rate.
Because of their generosity, FITs proved capable of quickly increasing the share of renewable
power. Since FITs set the price for resources and not volume, it is difficult to set the height of the
FIT such that the renewable goals are reached as economically as possible. A large FIT target
results in uncontrollable development of qualifying projects, irrespective of the demand for this
power. FITs remove the price risk from project developers and gives policymakers the ability to
decide on the optimal allocation of resources (as opposed to the market). This ultimately leaves
consumers paying for the outcome, and causes value destruction to investors in renewables and
utilities who made investment decisions based upon representations of stable regulatory regimes
as well as the interaction of dynamic market forces.
Like many other European countries, Germany chose FITs as the main support mechanism to
support the renewables goals of the EU, and later developed a more comprehensive plan for the
reduction of carbon emissions known as the Energiewende. Germany introduced the first FIT
law in 1990, aimed at fostering the development of renewable energy and designed to promote
rural economic development and domestic manufacturing. This law was later revised several
times, including in 2000, when the German Renewable Energy Act (Erneuerbare Energien
Gesetz or EEG) created the FIT program that became famous throughout the world and that still
remains today. The German legislation guarantees renewable developers interconnection to the
grid, priority scheduling and dispatch, and a technology differentiated FIT for 20 years. The FITs
applicable to new projects decrease each year by a legal percentage (or by law amendments).
17
Erneuerbare-Energien-Gesetz (EEG) am 1. August 2004 in Kraft getreten §11,
http://www.bgbl.de/banzxaver/bgbl/start.xav?startbk=Bundesanzeiger_BGBl&bk=Bundesanzeiger_BGBl&start=//
*%255B@attr_id=%2527bgbl104s1918.pdf%2527%255D#__bgbl__%2F%2F*[%40attr_id%3D%27bgbl104s191
8.pdf%27]__1400074679965

13
This was meant to ensure price certainty while encouraging technology innovation and cost-
efficiency. This subsidy is socialized and financed mainly by residential consumers, since many
exporting industrial customers are exempt from paying any costs associated with the subsidy in
an effort to maintain global industrial competitiveness. It was the starting block for rapid
increases in renewable energy.
German Renewable Energy Act – Erneuerbare Energien Gesetz (EEG)
The German Renewable Energy Act (Erneuerbare-Energien-Gesetz, EEG) is a law that came into
force in 2000 and introduced FITs as the main mechanism to incent and finance renewable energy
projects. The EEG can be seen as the starting point of a tremendous boost of renewable energy in
Germany. The purpose of the EEG is to promote electricity generated from renewables
(hydropower, landfill gas, mine gas, sewage gas, biomass, geothermal, wind, and solar). Due to
changes in market conditions as well as the state of renewable energy in Germany, this law was
reformed several times (EEG 2004, 2009, and 2012) and ongoing modifications are needed to keep
the development of renewable energy up to date and improve the efficiency of its impact.
The main four provisions of the EEG are:
1. Investment protection through guaranteed feed-in tariffs (FITs). Owners of new plants
receive a fixed rate, the FIT, for every kWh of renewable energy they generate. The FIT
depends on the specific year a plant goes online, its size and technology, and is guaranteed
for 20 years.
2. Guaranteed interconnection to the grid for renewable energy resources. Every new plant
which generates renewable energy gets a preferential treatment over conventional sources
by the network operator for feeding “green” electricity into the grid.
3. Decreasing FITs/degressive rates: Every year, the FIT rate decreases for new plants by a
fixed percentage (degression rate). Initially, the degression intended to give renewable
owners an incentive to lower the costs.
4. Socialized and financed by customers, not the government. The FIT is not paid with
governmental funding, but instead is completely financed by markets and consumers.
Renewable generation is sold into wholesale markets and receives the market price. The
difference between the market price and the government set, predetermined FIT, is paid for
by consumers as part of their electricity bills. This portion is called the EEG levy or
renewable energy levy (or surcharge). The levy is not applied equally to all consumer
types. Industrial consumers pay only a fraction or, in the case of energy intensive
industries, are completely exempted.
14
Quota obligation
The quota system is the European equivalent to the Renewable Portfolio Standard used in the
United States. All players, such as energy producers, retailers, and end-use consumers, have to
produce and/or consume a specific amount of renewable power, which is set by the government.
The price paid for the renewables is set by the market and the actual production or usage of
renewable energy is proven through certificates, which are given out once power is produced
from renewable energy. Since these certificates are tradable, at least within the specific country,
it is possible either to produce renewable energy on one’s own or to buy certificates from other
producers. There are government sanctions in place in case market participants don’t fulfill the
quota. The quota system is used by various European countries, such as Sweden, Belgium, the
UK, and the Netherlands, but the regulations and details (number of certificates per kilowatt hour
(kWh), limit of quotas, etc.) vary among the nations.
Figure 2. Incentive schemes in Europe
18
The quota system is a market-based system. It aims at lowering costs during the roll-out of
renewable energy. It exploits the cheapest possibilities of renewable energy production available
18
Frankfurter Allgemeine Zeitung 21.10.2013
15
given a certain demand. This system displays much price competition between different
renewable energy technologies. Sometimes, it is argued, quotas do not give sufficient investment
security to producers of renewable power, which in turn increases the need for a subsidy.
Yet another subsidy mechanism is feed-in premiums, which offer a premium for the ecological
value added in addition to the market price of electricity. As they are not very common in Europe
they are not explained in detail in this document.

16
3. GERMANY’S RENEWABLE “SUCCESS” STORY
Germany’s experience with renewables has often been portrayed as a success story. It
undoubtedly met one of the objectives set by the EEG: the promotion of renewable generation. It
remains unclear, however, how successful Germany has been in meeting the other stated goals of
its renewable energy policy: mainly climate change mitigation, energy independence, reduction
of fuel costs, conservation of fossil fuels, local economic development, and expansion of the
domestic manufacturing base.
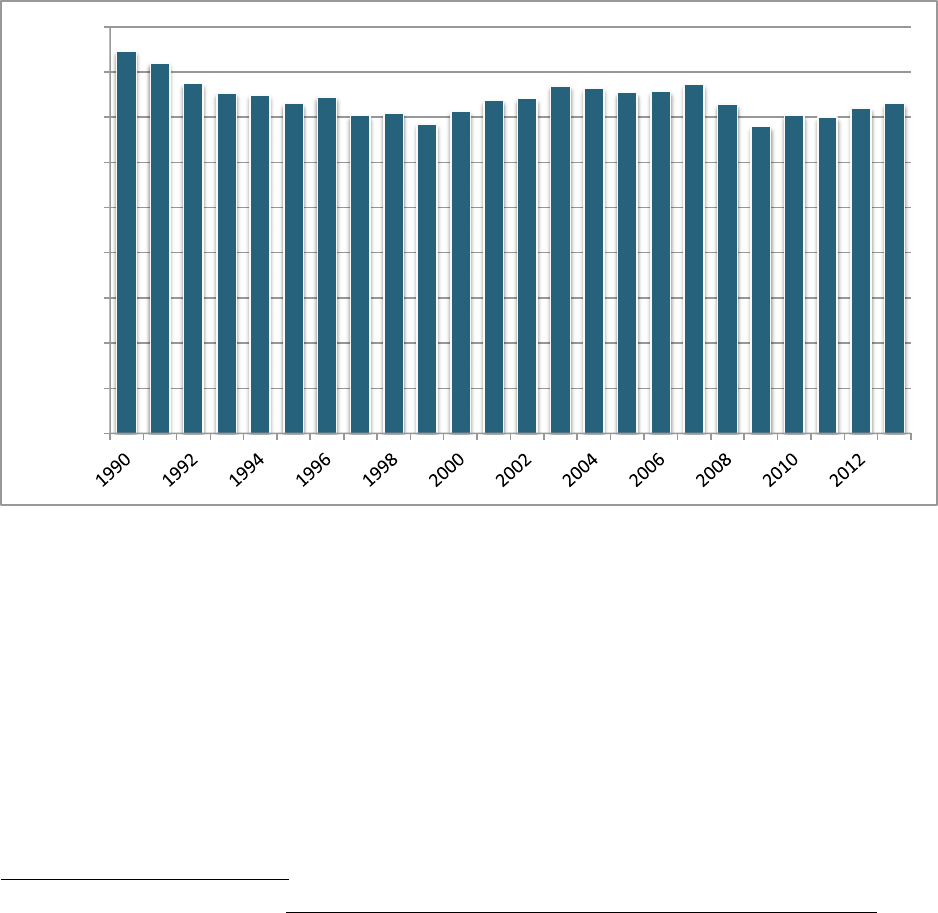
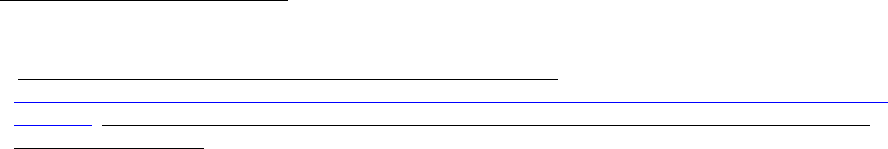
3.1. Renewable energy deployment and diversification of the power portfolio
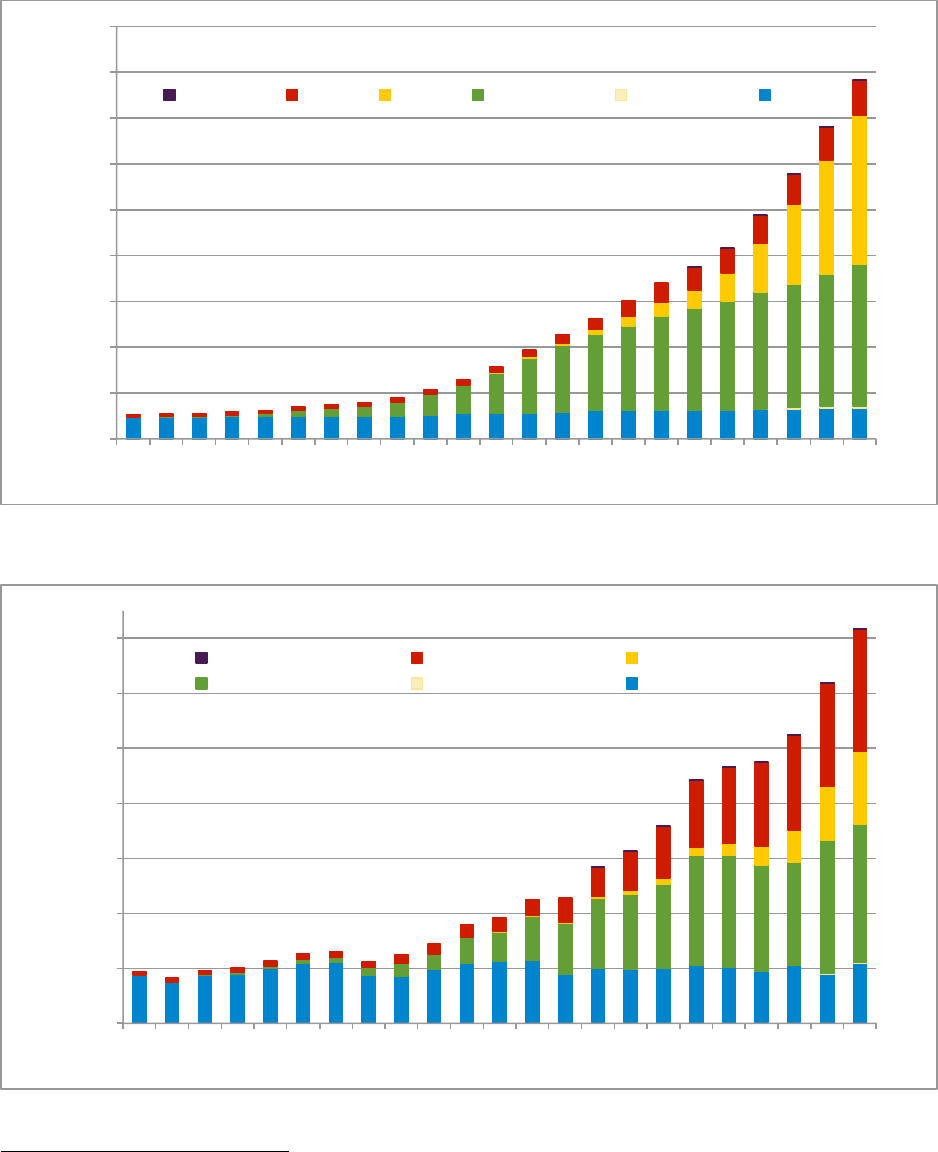
Germany experienced rapid growth of renewable energy. In 2012, renewable energy generation,
including hydropower, accounted for 23.5 percent of total power consumption in Germany, up
from 11 percent in 2005.
19
Renewable generation grew from 4.3 percent (19.000 GWh) of total
power consumption in 1990 to 23.5 percent (140’000 GWh) in 2012. As the potential for
additional hydropower is limited due to topographic preconditions, Germany had to resort to
wind and solar, as well as biomass. All of these resources showed impressive growth rates in the
last decade.
It is worth noting the difference between resources with high capacity factors, like biomass and
hydropower, and those with lower capacity factors, like solar PV. Electricity from biomass, for
example, has grown proportionately more than its installed capacity, whereas solar PV has
required a lot more investment for a much lesser impact on the electricity mix.
19
German Federal Ministry for the Environment, Nature Conservation, Building and Nuclear Safety: Development
of renewable energy sources in Germany. http://www.erneuerbare-energien.de/die-themen/datenservice/zeitreihen-
entwicklung-ab-1990
17
Figure 3. Germany - Installed renewable energy capacity (MW), 1990-2012
Figure 4. German renewable energy generation
20
20
German Federal Ministry for the Environment, Nature Conservation, Building and Nuclear Safety: Development
of renewable energy sources in Germany. http://www.erneuerbare-energien.de/die-themen/datenservice/zeitreihen-
entwicklung-ab-1990/
!#
$!4!!!#
%!4!!!#
&!4!!!#
'!4!!!#
(!4!!!#
)!4!!!#
5!4!!!#
6!4!!!#
7!4!!!#
$77!#
$77$#
$77%#
$77&#
$77'#
$77(#
$77)#
$775#
$776#
$777#
%!!!#
%!!$#
%!!%#
%!!&#
%!!'#
%!!(#
%!!)#
%!!5#
%!!6#
%!!7#
%!$!#
%!$$#
%!$%#
MW#
8093-0/:.;# <=9:.>># ,9;./#?@# AB>-9/0#C=BD# AE>-9/0#C=BD# FGD/9#
!#
%!4!!!#
'!4!!!#
)!4!!!#
6!4!!!#
$!!4!!!#
$%!4!!!#
$'!4!!!#
$77!#
$77$#
$77%#
$77&#
$77'#
$77(#
$77)#
$775#
$776#
$777#
%!!!#
%!!$#
%!!%#
%!!&#
%!!'#
%!!(#
%!!)#
%!!5#
%!!6#
%!!7#
%!$!#
%!$$#
%!$%#
GWh#
8093-0/:.;# <=9:.>># ,9;./#?@#
AB>-9/0#C=BD# AE>-9/0#C=BD# FGD/9#
18
3.2. Emission reductions
According to the European Renewable Energy Council, in 2009 alone, through the use of
renewable energy sources in the EU, carbon dioxide (CO
2
) emissions were reduced by about 340
million metric tons, or 7 percent, against 1990 levels (calculations are based on the GEMIS-
model [Global Emission Model for Integrated Systems]). Given a carbon price of about €15/t in
2009, this emission reduction benefit equals around €51 billion.”
21
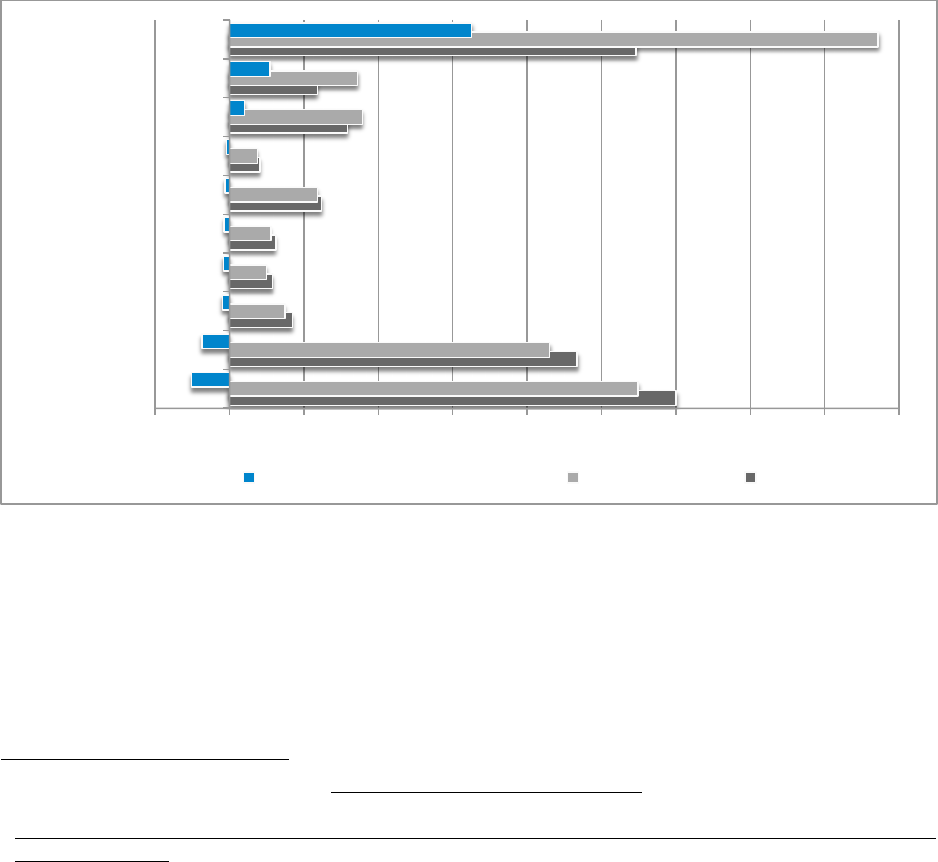
Figure 5. CO
2
emissions worldwide (million metric tons)
22
Without a doubt, renewables have helped achieve the CO
2
goals, thereby taking some of the
burden from other emission sources and keeping the CO
2
certificate prices lower than they would
have otherwise been. From 2005 to 2011, Germany’s CO
2
emissions declined by 99 million
metric tons, or 12 percent.
21
European Renewable Energy Council. http://www.erec.org/statistics/co2.html
22
US Department of Energy, Energy Information Administration, “International Energy Statistics”,
http://www.eia.gov/cfapps/ipdbproject/iedindex3.cfm?tid=90&pid=44&aid=8&cid=regions,&syid=2005&eyid=20
11&unit=MMTCD
H$4!!!# !# $4!!!# %4!!!# &4!!!# '4!!!# (4!!!# )4!!!# 54!!!# 64!!!# 74!!!#
IB=30D#,3.30>#
+J/9K0#
80/:.BG#
IB=30D#L=B2D9:#
M.B.D.#
N.K.B#
O/.BP0#
*J>>=.#
QBD=.#
M-=B.#
R03#M-.B20#%!!(H%!$$# %!$$# %!!(#
19
Yet, since 2009, a number of factors have led to an increase in German emissions: low prices for
CO
2
certificates, low coal prices in comparison to natural gas prices, larger power generation
needs due to the increase in electricity consumption in response to the economic recovery, the
decommissioning of nuclear plants, and the increase in power exports. It is interesting to note
that the United States is the country that has achieved the greatest reductions in CO
2
emissions,
helped by significant fuel switching to natural gas.
Figure 6. CO
2
emissions from the power sector’s generation in Germany
23
While in most circumstances renewable energy contributes to reducing GHG emissions, there
have been voices that have contested the suitability of FITs as a tool to reduce emissions. A 2009
report
24
estimated that while carbon allowances were at the time trading at around $20/metric ton
CO
2
e, PV had an estimated abatement cost of $1,050 per metric ton CO
2
e, and wind had an
abatement cost of around $80 per metric ton CO
2
e. These results suggest that FITs have
produced unnecessarily expensive outcomes.
23
Eionet, Central Data Repository; http://cdr.eionet.europa.eu/de/eu/ghgmm/envutt6ka/index_html?&page=2
24
RWI (2009) “Economic impacts from the promotion of renewable energies: The German experience”, Essen,
Germany.
!#
(!#
$!!#
$(!#
%!!#
%(!#
&!!#
&(!#
'!!#
'(!#
S=;;=9B#39B>#

20
3.3. Energy independence
Energy independence is desirable for every country, and certainly for Europe. Unlike the United
States, which has a long-term estimated supply of 2,400 trillion cubic feet of recoverable natural
gas reserves,
25
and 29 billion barrels of oil reserves,
26
the EU is the world’s largest energy
importer. Fifty five percent of the EU’s total energy supply comes from imports. In 2012, the
region imported 84 percent of its oil consumption and 64 percent of its natural gas consumption.
The EU is keenly aware of its dependence on fuel sources, as was exemplified in January 2009,
when 18 European countries suffered major disruptions of natural gas supplies, or in some cases,
complete cutoff, during the dispute between Russia's Gazprom and Ukraine's Naftohaz Ukrayiny
over prior debts, gas supplies, and prices. European countries that import gas from Russia
received severe drops in pressure in their pipelines that affected countries as far as the United
Kingdom. Needless to say, at the time of this writing, the EU is acutely aware of these issues,
given the disputes between Russia and Ukraine with respect to Crimea, whereby the EU is
considering sanctions against Russia, with the expectation that supply of natural gas from Russia
may be possibly withheld.
As will be discussed later, competitiveness and energy independence are intimately related. A
recent International Energy Agency report released on January 29, 2014, stated that the EU is
expected to lose one-third of its global market share of energy intensive exports during the next
two decades due to high energy prices, the majority of which is due to the high cost of energy
imports, such as gas and oil.
27
Renewables help reduce the dependency on imported fossil fuels,
thereby reducing the risk of possible price shocks.
3.4. Lower wholesale prices
European wholesale power prices have declined in recent years. The reasons for this include
increased participation of renewables in the market (especially PV during the day, reducing high
25
Speech of Gregg Kantor Chairman of American Gas Association, NARUC Winter Committee Meetings, February
11, 2014
26
The Wall Street Journal, “U.S. Oil Reserves Continue to Bulge”, August 1, 2013.
http://online.wsj.com/news/articles/SB10001424127887323681904578641871449942246
27
Financial Times, “Energy price gap with the US to hurt Europe for ‘at least 20 years”, 29
th
January 2014.
http://www.ft.com/cms/s/0/80950dfe-8901-11e3-9f48-00144feab7de.html#axzz2thyHzZc8

21
mid-day prices), abundant and cheaper coal from the United States as a result of the impact of
increased development of shale gas resources on American fuel markets that make exporting
coal more economical, and the global financial crisis. While lower wholesale prices are
problematic for power producers who struggle to obtain adequate compensation in the market for
their costs, reduced wholesale prices have helped to keep retail market prices from rising as
much as they otherwise would have by providing some savings that help to offset a portion of the
cost of the renewable subsidy. Given the ever-increasing large amount of subsidies, retail rates
would have increased even more if wholesale prices had not declined. However, as will be
explained later, sharp decreases in wholesale prices are unsustainable, as owners of generating
units will be unable to keep uneconomical plants in service. In turn, many of these plants will
ultimately be required to receive capacity payments in order to be online to provide back-up
power for periods of power variability.
3.5. Job creation and expansion of Germany’s manufacturing industry
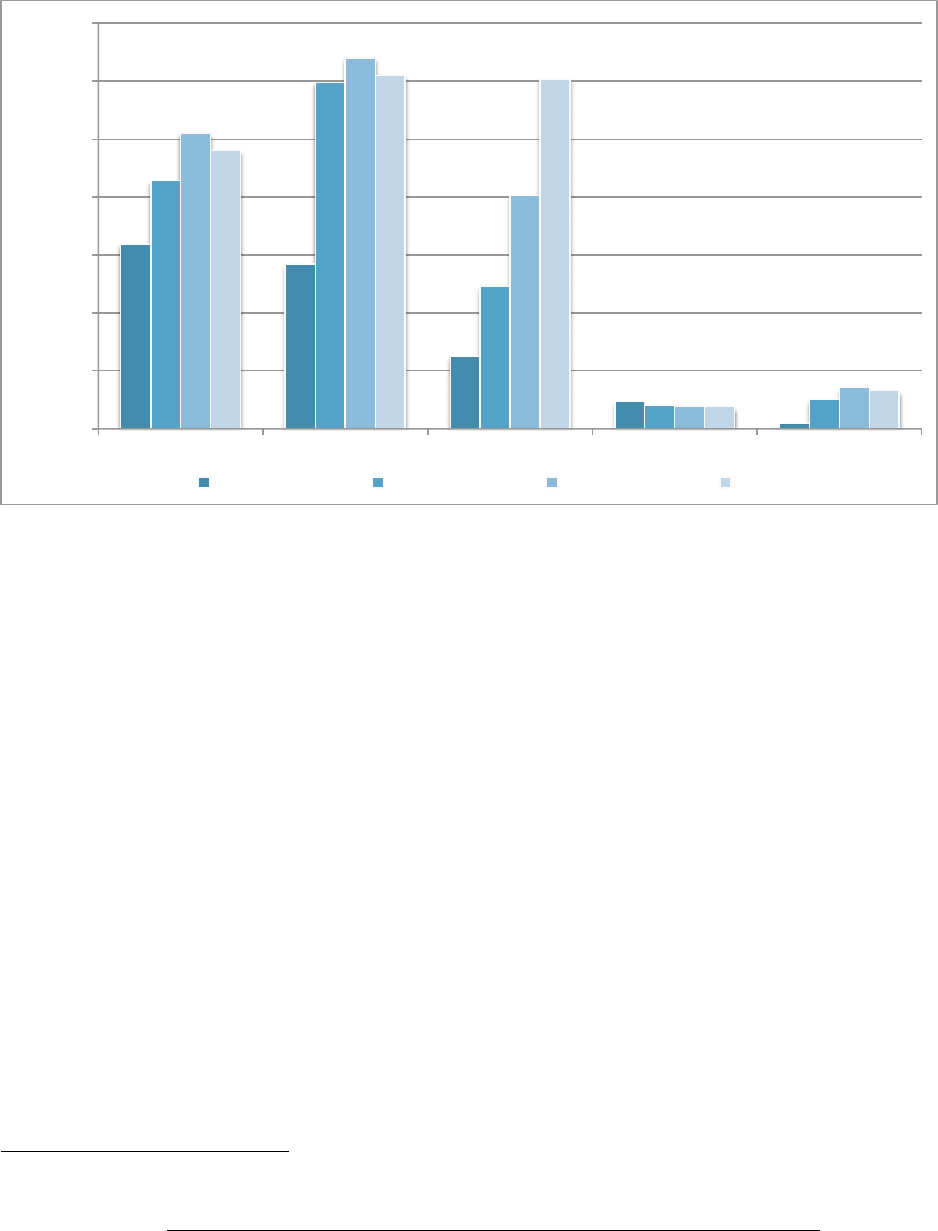
The rapid growth of renewable energy created new jobs in the industry. In 2012, the German
renewables industry employed 378,000 people,
28
which accounted for four times the amount of
jobs in 2000. During the time of greatest growth, 2004-2010, renewable energy jobs grew around
129 percent. Although biomass is the sector that has traditionally employed the most Germans,
most of the growth occurred in the solar energy sector, which went from about 25,000 jobs in
2004 to nearly 120,000 in 2010. During this timeframe, the other technologies remained
relatively stable. Wind energy jobs, however, increased to 100,000 in 2009, but decreased
slightly in 2010 and beyond.
28
Agentur für Erneuerbare Energie - Agency of Renewable Energy Data and Figures about employment in
renewable energy. http://www.unendlich-viel-energie.de/themen/wirtschaft/arbeitsplaetze/artikel367
22
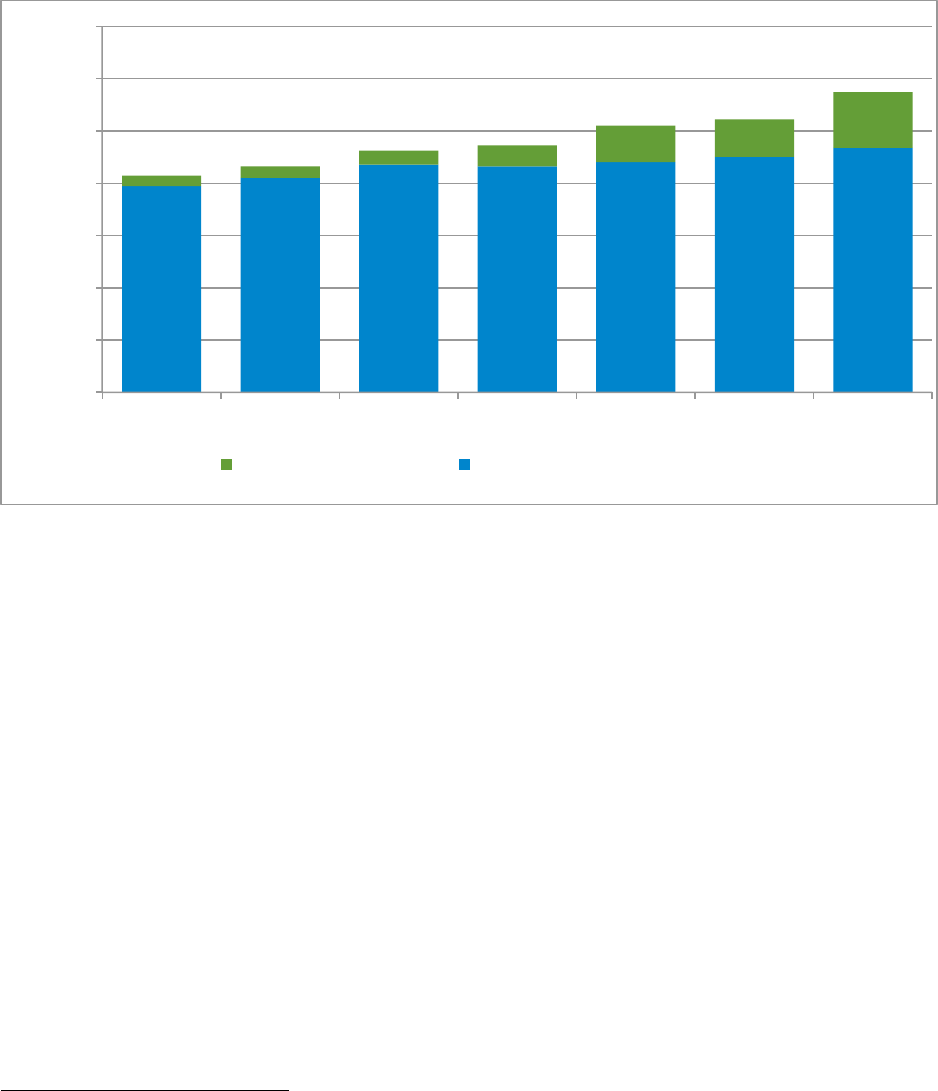
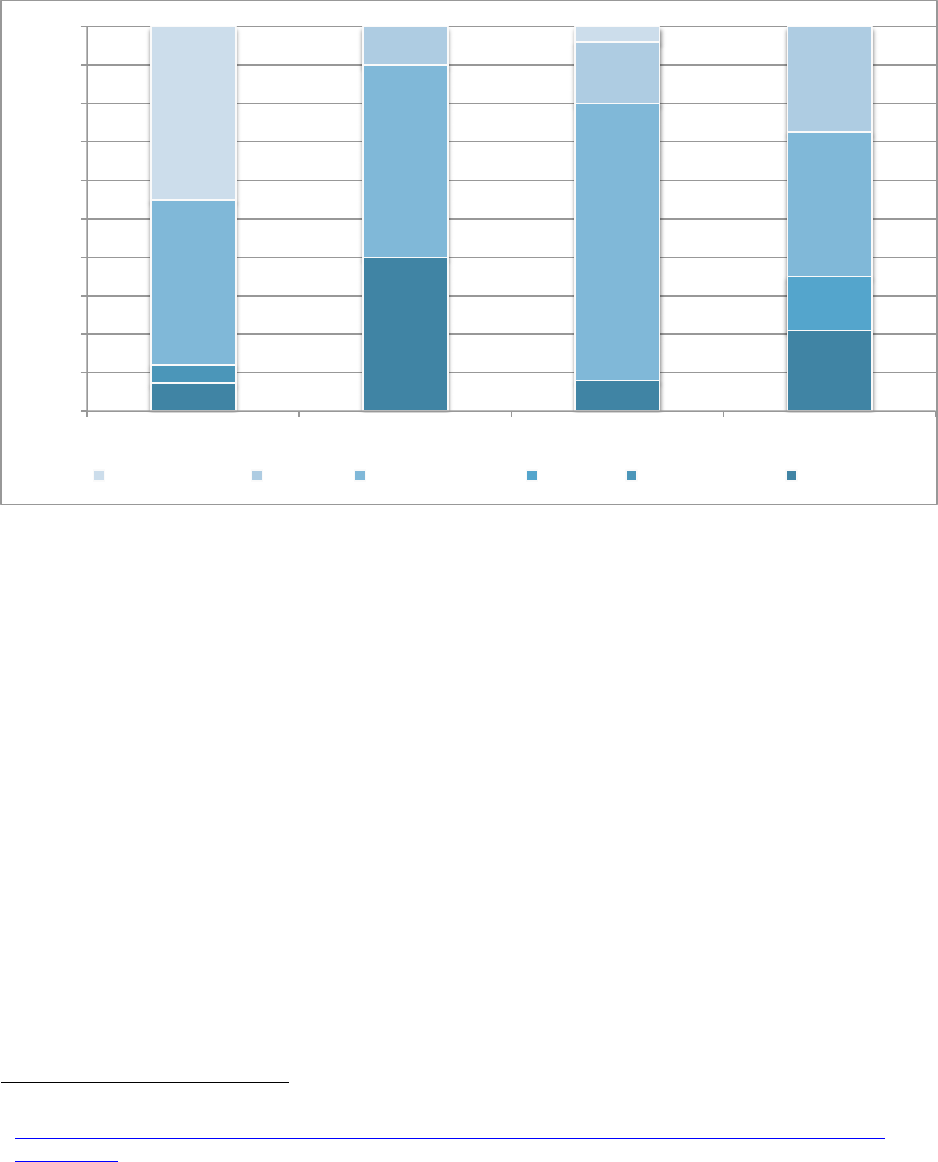
Figure 7. Jobs attributable to renewable energy in Germany: 2004-2010
29
After rapid growth, 2012 saw a slight decrease in the number of renewable jobs, due, for the
most part, to a reduction of employment in the solar industry. German officials, however, expect
that growth in the wind and biomass industries will continue to grow strongly.
30
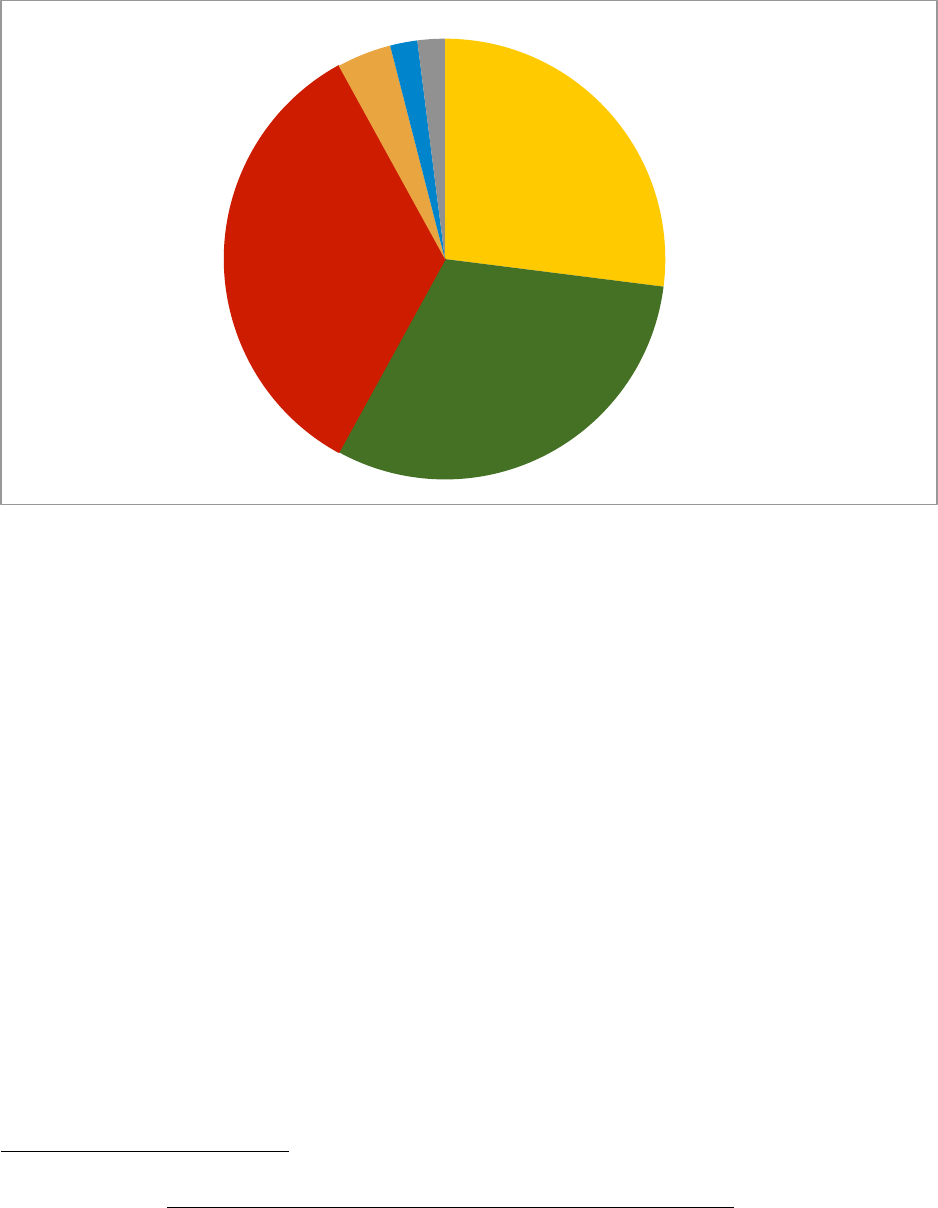
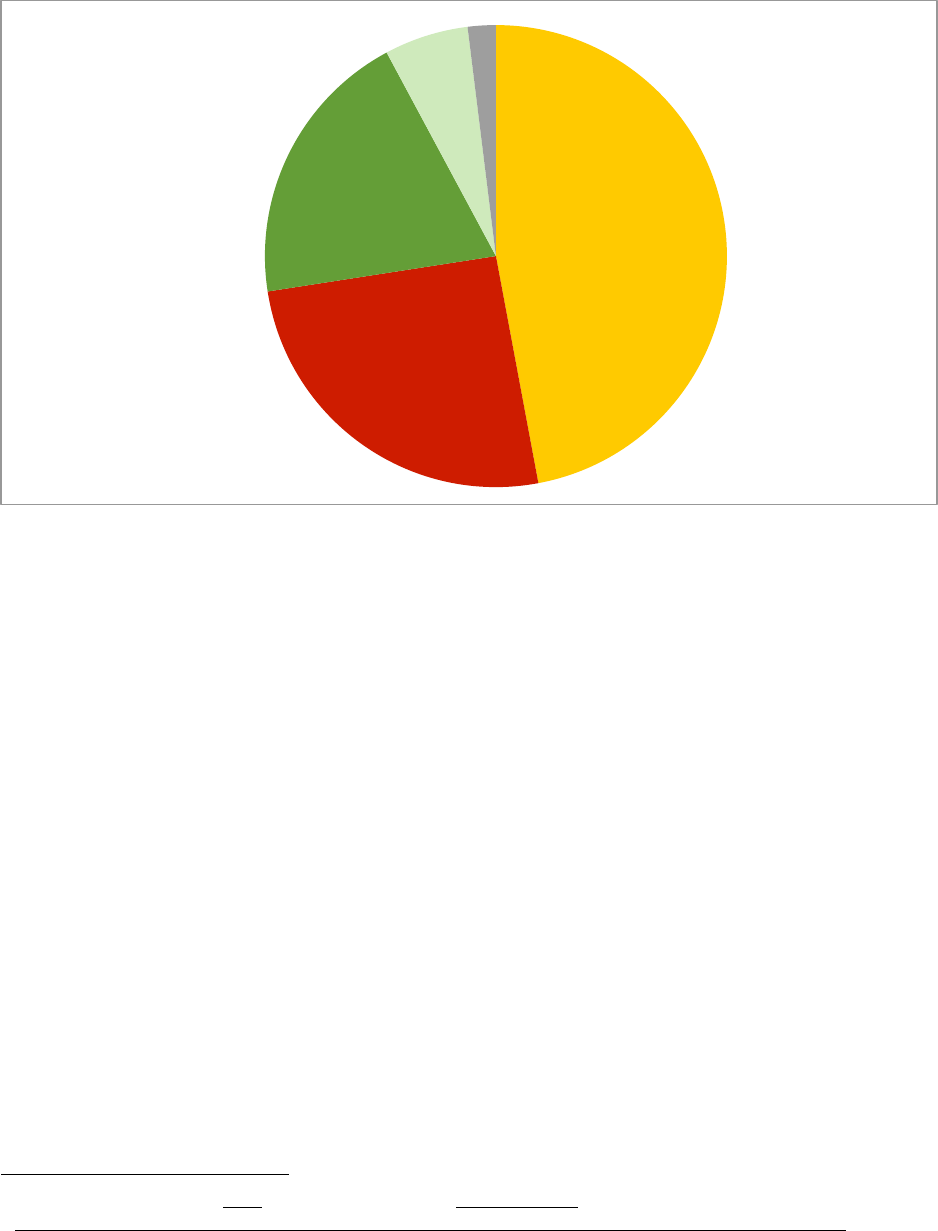
In 2012, biomass, wind, and solar shared almost equal parts of renewable energy jobs. Biomass
accounted for 34 percent of the total, followed by wind (31 percent) and solar (27 percent).
Geothermal, hydro, and other renewables rounded out the total. These figures are converse with
respect to the overall deployment of renewables themselves, which is likely due to the capital
intensity, stage of development of technologies, and economies of scale and scope.
29
O’Sullivan, et al, 2011
30
Agentur für Erneuerbare Energie - Agency of Renewable Energy Data and Figures about employment in
renewable energy. http://www.unendlich-viel-energie.de/themen/wirtschaft/arbeitsplaetze/artikel367
!#
%!4!!!#
'!4!!!#
)!4!!!#
6!4!!!#
$!!4!!!#
$%!4!!!#
$'!4!!!#
C=BD#+B0/2G# <=9:.>># ,9;./#+B0/2G# FGD/9K9T0/# 8093-0/:.;#
%!!'# %!!5# %!!7# %!$!#
23
Figure 8. Renewable energy employment in 2012
31
The development of renewable energy in Germany and other countries fostered growth in the
German manufacturing industry. Germany is Europe’s leading PV manufacturer and is the
largest manufacturer of inverters in the world.
32
The growth of renewable energy throughout the
world has allowed Germany to expand its wind and solar manufacturing base. However, other
countries have also expanded their capabilities, thereby hurting German domestic manufacturers,
which have tended to be more costly than their foreign counterparts. Historically, a considerable
share of PV modules installed in Germany has come from China and Japan. In 2006 and 2007,
for instance, about half of PV module demand was covered by imports. Also, the boom and bust
cycle that FITs created in the solar market has left some German manufacturers in a precarious
situation, while Asian manufacturers have been the greatest beneficiaries of German and other
European countries’ programs.
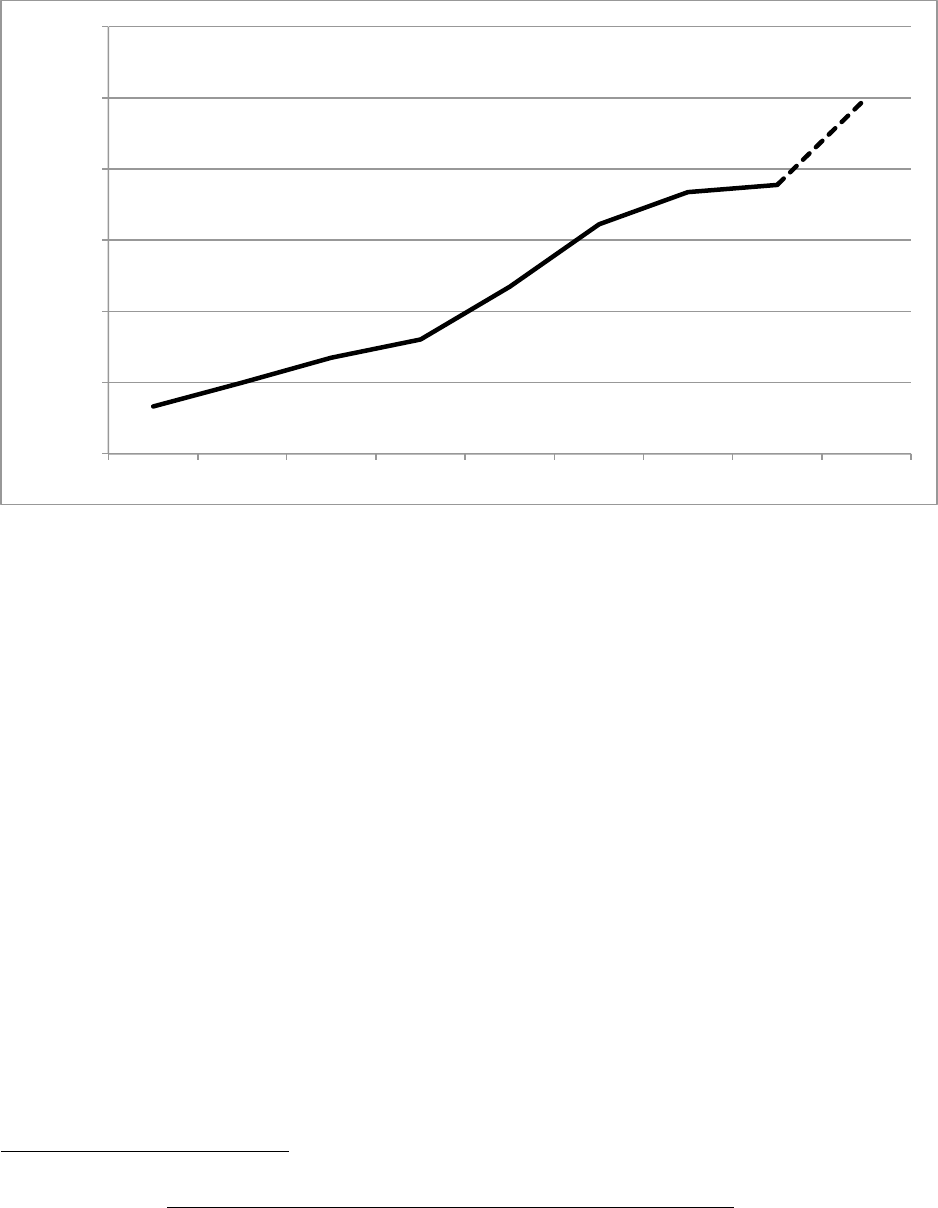
Despite recent difficulties in the solar market, it is expected that new renewable energy jobs will
reach 500,000 in 2020.
31
Agentur für Erneuerbare Energie - Agency of Renewable Energy Data and Figures about employment in
renewable energy. http://www.unendlich-viel-energie.de/themen/wirtschaft/arbeitsplaetze
32
Id.
,9;./4#%5"#
C=BD4#&$"#
<=9:.>>4#&'"#
8093-0/:.;4#'"#
FGD/94#%"#
A3-0/4#%"#
24
Figure 9. Job creation in renewable energy in Germany
33
Yet, there is some controversy around this issue.
34
While there is no doubt that the growth of the
renewable market led to new jobs, like in the case of emissions reductions, it is less clear if it
happened in an efficient way. For example, if 380,000 jobs were created in 2012, and €14 billion
were disbursed in payments to renewables that same year (total amount of EEG levy per year.),
then it can be calculated that each job received a €35,000 subsidy per year.
Moreover, the total net employment is called into question when assessing the total macro-
economic impact. A recently published study by the Institute on the Future of Labor states that
the increasing trend of electricity prices affects jobs in other sectors. This study calculates that
the increase of the EEG levy from 5.28 eurocents/kWh in 2013 to 6.24 eurocents/kWh in 2014,
will lead to the loss of around 86,000 jobs, or 1.4 percent.
33
Agentur für Erneuerbare Energie - Agency of Renewable Energy Data and Figures about employment in
renewable energy. http://www.unendlich-viel-energie.de/themen/wirtschaft/arbeitsplaetze
34
EEG- Jobm otor oder Job killer? www.energie-fak ten.de/pdf/eeg -job-motor.pdf
#H####
#$!!4!!!##
#%!!4!!!##
#&!!4!!!##
#'!!4!!!##
#(!!4!!!##
#)!!4!!!##
$776# %!!!# %!!%# %!!'# %!!)# %!!6# %!$!# %!$%# %!%!#
25
On the other hand, as Germany’s industrial sector is exempt from EEG’s surcharge, a reversal of
this support and its direct impact to industrial jobs could translate into a significant loss of jobs.
35
With respect to the renewable manufacturing sector, the PV industry provides a good example of
what could happen to other industries when Germany reduces the subsidy. There have been
several recent bankruptcies of various solar and wind manufacturers, as well as service
providers. For example, in the last two years, the total number of solar cell and module
production employees has fallen from 10,196 to 5,973.
36
The same trend applies to conventional
power plants. Due to the transition to renewable energy and the need of conventional plants only
as backup, many of these plants have been turned down or closed definitely. It is estimated that
these actions will impact around 200,000 thermal power plant employees.
37
In sum, several industries in Germany have benefited from the development of renewable energy
sources and, as a result, a large number of additional jobs have been created. Nevertheless, it has
to be pointed out that generous subsidies are having adverse macroeconomic effects in other
areas of the economy. Also, due to an increasing level of global competition in the solar market,
especially due to the extraordinary cost efficiency of Chinese companies, German manufacturing
companies are suffering and, as a consequence, job creation is struggling.
35
Die Welt: Ende der EEG-Privilegien gefährdet eine Million Jobs 07
th
November 2013; Handelsblatt Online:
Altmaier reist mit radikalem Ökostrom-Plan zur EU 07
th
November 2013
36
Die Welt: Deutschlands Solarbranche löst sich auf 20
th
April 2013.
http://www.welt.de/wirtschaft/energie/article121621919/Ende-der-EEG-Privilegien-gefaehrdet-eine-Million-
Jobs.html; http://www.handelsblatt.com/politik/international/foerderung-metallindustrie-eine-million-jobs-
bedroht/9039578-2.htm
37
Wirtschaftswoche: Reservekraftwerke werden Milliarden verschlingen 05th February 2014

26
4. UNINTENDED CONSEQUENCES OF GERMANY’S RENEWABLE
POLICIES
While there have been some positive impacts from increased development of renewables in
Germany, with respect to emissions reductions, diversification of the power portfolio, and energy
independence, there have also been challenges and problems associated with this evolution.
Large subsidies brought about rapid deployment of renewable energy that resulted in increased
costs for most types of consumers, additional investment needs for transmission lines and other
integration capabilities, disequilibrium in wholesale markets with the potential of seriously
affecting reliability, and unsustainable costs to the economy, resulting in repeated redesigns and
realignments of renewable policies and support schemes that led to boom and bust cycles
detrimental to the renewables and power industries.
4.1. Enormous governmental subsidies for renewables
Germany’s FIT program has cost more than $412 billion to date (including granted and
guaranteed, but not yet paid FIT). Former German Minister of the Environment Peter Altmaier
recently estimated that the program costs could reach $884 billion (€680 billion) by 2022. He
added that this figure could increase further if the market price of electricity falls, or if the rules
and subsidy levels are not changed.
38
It is estimated that Germany will pay $31.1 billion in
subsidies in 2014 alone.
Enormous, guaranteed FITs for PV led to very rapid, unexpected growth of PV installations
during the last few years in Germany. As technology improved, costs decreased and generous
subsidies made installing PV a lucrative business. While the installation of wind turbines was
relatively stable at around 2 GW since 1999, the growth of PV exploded in 2009. Between 2010
and 2012, Germany built 21 GW of PV, around 7 GW a year.
38
Frankfurter Allgemeine Zeitung: „Energiewende könnte bis zu einer Billion Euro kosten“ 19
th
February 2013.
http://www.faz.net/aktuell/politik/energiepolitik/umweltminister-altmaier-energiewende-koennte-bis-zu-einer-
billion-euro-kosten-12086525.html
27
Figure 10. Annual renewable energy capacity additions in Germany, 1990-2021
Given the long planning and construction periods of traditional power plants, (for example, the
new nuclear plant in Olkiluoto, Finland, with 1.7 GW, is in the tenth year of construction) this
rapid deployment of renewables can only be described as a macroeconomic shock. The
development of 21 GW of PV in only three years blindsided the energy market. The speed of
capacity additions made it impossible for the market and the generation fleet to adjust
appropriately.
The fast growth in PV was unexpected. The system and respective market players were unable to
plan the amount of capacity that was coming online. In 2012, Peter Terium, CEO of RWE,
Germany’s largest power generator, said that the prices for PV modules had decreased to an
extent that RWE did not consider possible. The impact has been material to RWE and other
German energy companies. As an example, RWE recently reported a net loss in 2013 accounts
for €2.8 billion accompanied from write-downs of approximately €4.8 billion which was
attributed to the huge increase in solar and wind capacity. This is RWE’s first full year loss since
the foundation of the Federal Republic of Germany in 1949.
39
Moreover, it was not just the
39
RWE, “RWE posts first net loss in 60 years“. http://www.rwe.com/web/cms/en/113648/rwe/press-news/press-
release/?pmid=4010679
!#
$4!!!#
%4!!!#
&4!!!#
'4!!!#
(4!!!#
)4!!!#
54!!!#
64!!!#
SC#
C=BD#
,9;./#?@#
<=9:.>>#
28
utilities, but also research institutions that underestimated the growth of the renewables. For an
industry that has long-term technical and investment lifetimes, this created system disruptions
that led to value destruction.
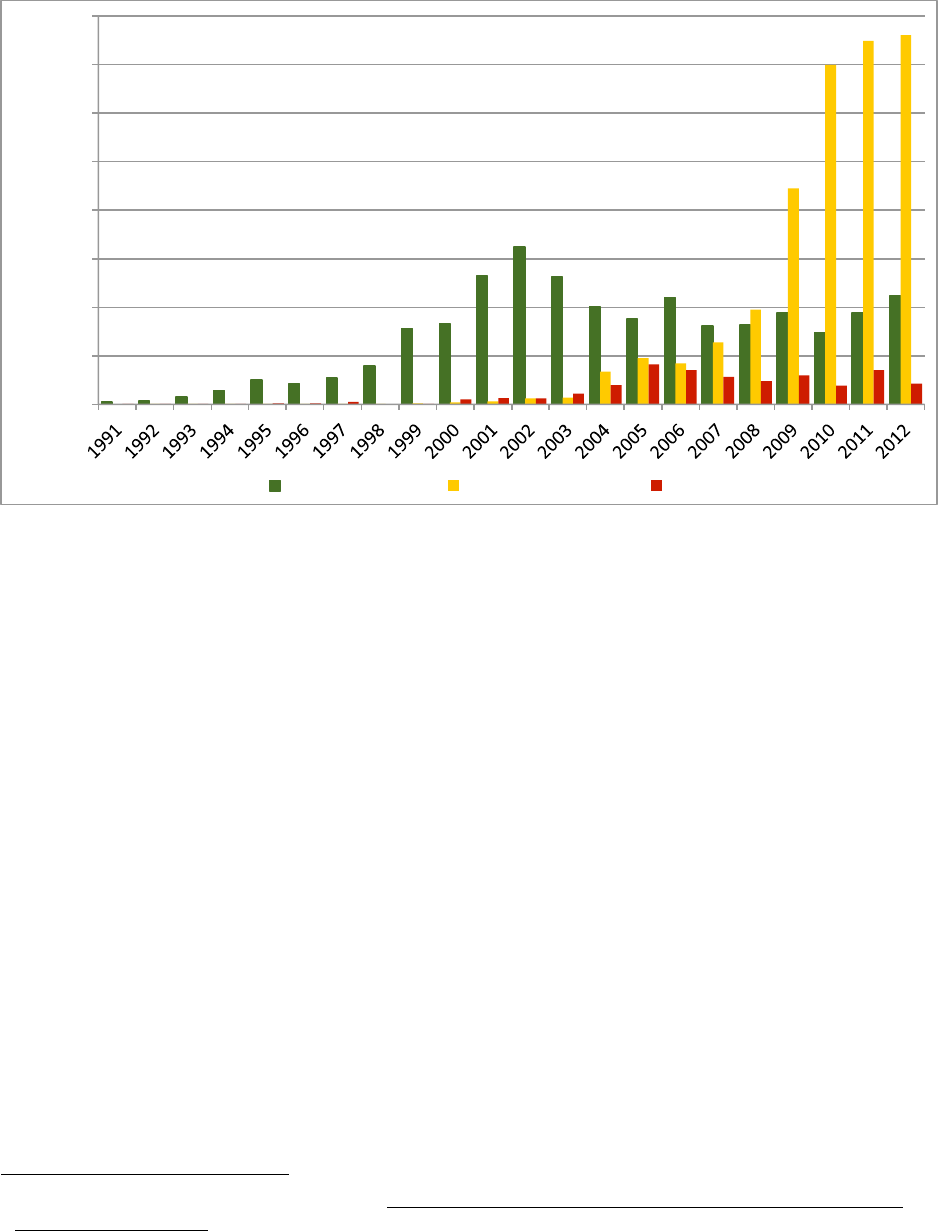
Because of the large amount of renewable plants coming online, the EEG levy increased steadily
from 0.19 eurocents/kWh in 2000 to 6.24 eurocents/kWh in 2014. Future development is unclear
and experts expect a value between 5.8 and 6.8 eurocents/kWh
40
for 2015. The main drivers of
the increase in the EEG levy over the years have been the rapid increase in renewable energy
(especially in expensive PV), the levy exemptions for industry, and the decreasing price of
renewable energy in the wholesale market.
Figure 11. Development of EEG subsidy and EEG levy
41
In absolute terms, the EEG subsidy for renewable energy has increased dramatically. While in
the years between 2000 and 2003 the total amount of the levy for renewable energy was around
40
Netztransparenz: German transmission system operators. http://www.netztransparenz.de/de/Jahres-
Mittelfristprognosen.htm
41
Federal Ministry for the Environment, Nature Conservation and Nuclear Safety: Development of renewable
energy sources in Germany. http://www.erneuerbare-energien.de/die-themen/datenservice/zeitreihen-entwicklung-
ab-1990/ (updated 15.10.2013)
%#U#
%#U#
%#U# &#U#
&#U#
'#U#
(#U#
(#U#
6#U#
$&#U#
$'#U#
%!#U#
%'#U#
!V$7#
!V)(#
%V!(#
(V%6#
)V%'#
!#
$#
%#
&#
'#
(#
)#
5#
!#
(#
$!#
$(#
%!#
%(#
%!!!# %!!$# %!!%# %!!&# %!!'# %!!(# %!!)# %!!5# %!!6# %!!7# %!$!# %!$$# %!$%# %!$&# %!$'#
++8#;0WG##X+J/9P3YZC-[#
++8#M9>3#K0/#G0./#X\=;;=9B#U[#
++8#P9>3#K0/#G0./#X<=;;=9B#U[#
++8#;0WG#X+J/9P3YZC-[#
29
€1 billion per year, it surpassed the €20 billion mark in 2013, and is estimated to approach €25
billion in 2014.
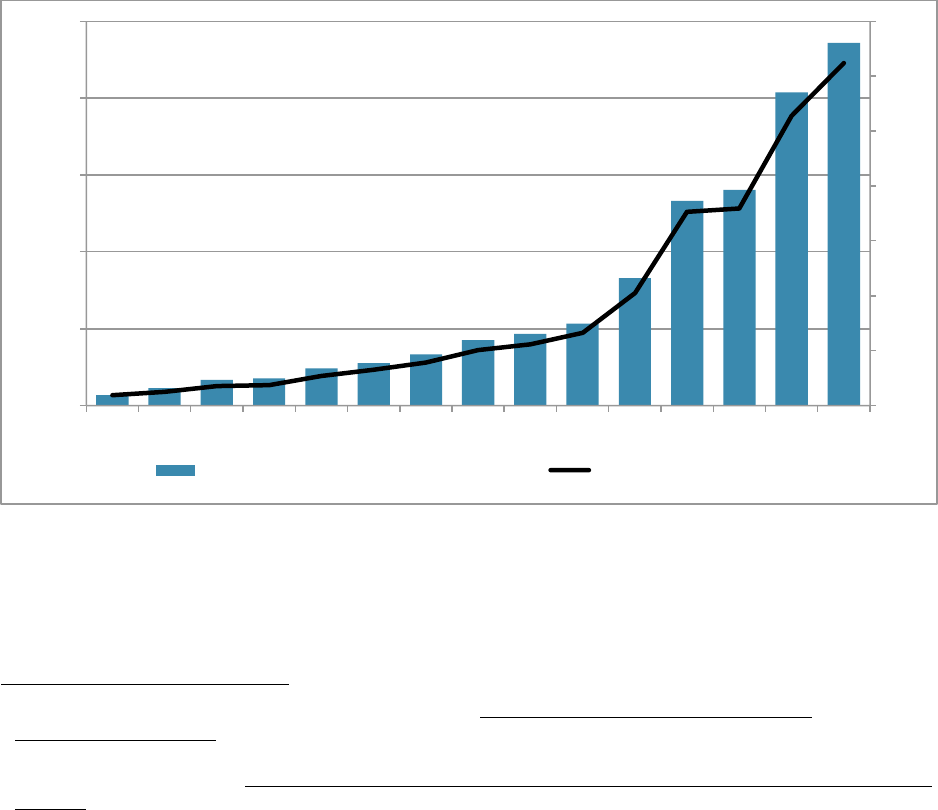
Taking a closer look at the EEG and the distribution of average FITs for existing renewable
projects among the different technologies, figure 12 illustrates the huge differences that persist
between technology types, both in the rate and its trend over the last years. The highest support is
dedicated to PV, although the numbers in 2012 are only two-thirds of what they were in 2006. In
total, the average FIT to plants without direct marketing increased from €89/MWh to
approximately €230/MWh, as the share of high, albeit decreasing, PV FITs increased.
Figure 12. Development of average FIT rates paid out to all existing EEG plants divided
per technology in Germany (€/MWh)
42
In 2014, payments to solar PV will account for almost half of the total EEG levy, followed by
biomass and onshore wind.
42
Netztransparenz: Information platform run by the 4 German transmission system operators. http://www.eeg-
kwk.net/de/EEG-Umlage.htm
!#
$!!#
%!!#
&!!#
'!!#
(!!#
)!!#
FGD/9K9T0/# <=9:.>># 8093-0/:.;# C=BD#9B>-9/0#C=BD#9E>-9/0# ?@# ]W0/.20#
€/MWh#
%!!%# %!!&# %!!'# %!!(# %!!)# %!!5# %!!6# %!!7# %!$!# %!$$# %!$%#
30
Figure 13. Share of renewable technologies to the EEG levy, 2014
43
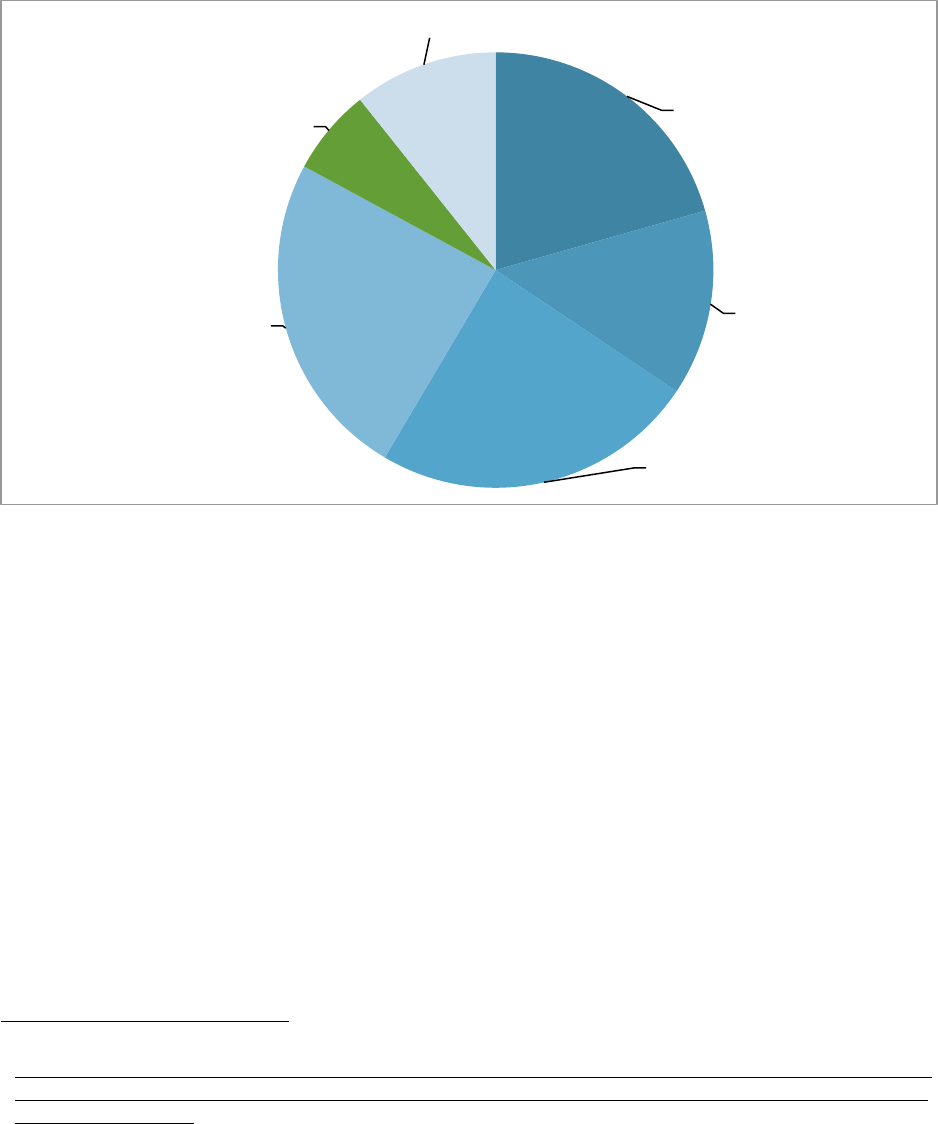
4.2. Ever increasing power prices to residential customers
Retail electricity prices have increased in Germany due in part to the generous subsidies for
renewable energy. The two figures below show an increase in household electricity prices from
€0.14/kWh in 2000 to €0.21 /kWh in 2007 to €0.29 /kWh in 2013. There are diverse reasons
behind the increase in retail electricity rates, including the considerable growth of taxes and
charges. While taxes and charges accounted for 25 percent of the total price in 1998, they were
responsible for around 40 percent of the total price in 2012. Also, the price of electricity
(including procurement, transmission, and distribution) has increased slightly, as a result, in part,
of additional grid costs and balancing needs associated with increased renewable penetration.
Finally, while the EEG levy only contributed slightly to the price of electricity in the first years
of its introduction (1.4 percent in 2000), it is now one of the main factors contributing to the rise
of retail electricity rates (18 percent in 2013). The EEG levy grew from €0.013/kWh in 2009 to
43
PV Magazine, Germany: EEG levy increases in 2014, http://www.pv-
magazine.com/news/details/beitrag/germany--eeg-levy-increases-in-2014_100013038/#axzz2vf5eJZkV
PV!
47%!
Biomass!
25%!
Onshore wind!
20%!
Offshore wind!
6%!
Other!
2%!
31
€0.053/kWh in 2013, or €240 per year per citizen, and is expected to grow to €0.062/kWh in
2014.
Figure 14. Evolution of residential power prices
44
Electricity price increases went mostly uncontested in Germany because of two main factors.
First, electricity expenses are only a small part, about 2.5 percent, of the overall expenditures of a
regular German household. Second, there was initial strong support for the Energiewende and
the readiness to bear additional costs. However, there are signs indicating that further unchecked
price increases risk diminishing the popular support for the Energiewende, which is the main
reason why Germany is currently working on a complete change of the existing EEG system.
Other European countries have had similar experiences with rapidly rising electricity prices. In
the EU-28 area, the household electricity price rose by 11.7 percent between 2011 and 2013,
while the industrial price rose by 9 percent. It is worth noting that the countries with the highest
electricity prices, Denmark (€0.30/ kWh) and Germany (€0.29/kWh), also have significant levels
of renewable energy; whereas the countries with the lowest prices, Bulgaria (€0.09/kWh),
44
Agentur für Erneuerbare Energie – Agency of Renewable Energy
!#
(#
$!#
$(#
%!#
%(#
&!#
&(#
%!!5# %!!6# %!!7# %!$!# %!$$# %!$%# %!$&#
0J/9P3YZC-#
++8#;0WG# ?9T0/#P9>3>4#3.^0>#.BD#93-0/#P-./20>#
32
Romania (€0.13/ kWh), and Estonia (€0.14/kWh), have more traditional electric-generating
resources.
Figure 15. Breakdown of household prices in Germany, 2013
45
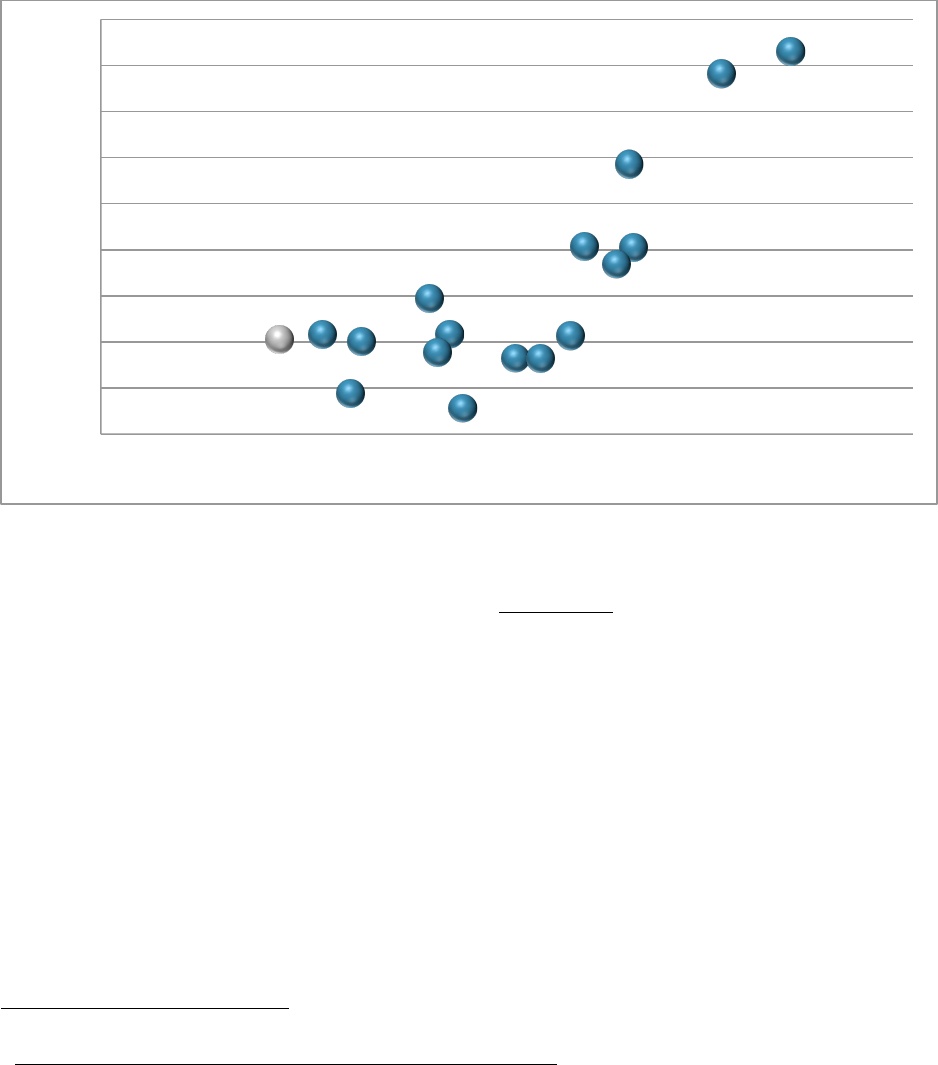
A further analysis confirms that a correlation exists between the amount of variable renewable
energy capacity that a country has (PV and wind) and its household electricity prices including
taxes, levies, and value added tax. The figure below measures the capacity of PV and wind plants
in watts (W) per capita. A trend can be detected which shows that higher W per capita will result
in higher electricity prices. While the majority of European countries have a low/medium level
of capacity, with a level under 300 W per capita, other countries show a higher level of capacity
and, accordingly, increased electricity prices. Leading countries in this analysis are Denmark and
Germany, followed by Spain, Italy, and Belgium.
45
Bundesnetzagentur:
Federal Network Agency.
http://www.bundesnetzagentur.de/SharedDocs/Downloads/DE/Sachgebiete/Energie/Verbraucher/PreiseUndRechn
ungen/WieSetztSichDerStrompreisZusammen.pdf;jsessionid=0B318530B0B7F0F3325CB5CA631C83F7?__blob
=publicationFile&v=2
8/=D#P-./20>4#%!V)!"#
M9BP0>>=9B#;0WG4#
$&V6!"#
+B0/2G#P9>3>4#%'V$!"#
1.^0>4#%'V'!"#
++8#;0WG4#)V'!"#
_=>3/=\J`9B#P9>3>4#
$!V5!"#
33
Figure 16. Comparison of the amount of wind and solar capacity and electricity prices,
selected countries, 2012
46
The rise in electricity prices has spurred a new debate in Europe about a new energy poverty. A
recent front cover of the popular German magazine Der Spiegel titled “Luxury Electricity: Why
energy will always be more expensive and what politicians have to do against it” and showing
gold-plated and diamond-encrusted power cables, succinctly summarized the mood of the
German public toward high energy prices. The article discussed “Germany's aggressive and
reckless expansion of wind and solar power (that) has come with a hefty price tag for consumers
and the costs often fall disproportionately on the poor.”
47
According to the EU Fuel Poverty Network,
48
a portal established with the aim of bringing
together energy researchers and practitioners from across the EU, energy poverty occurs “when a
household is unable to afford the most basic levels of energy for adequate heating, cooking,
46
Wikipedia, ”Solar energy in the European Union”,
http://en.wikipedia.org/wiki/Solar_energy_in_the_European_Union; US Department of Energy, Energy
Information Administration
47
Germany’s Energy Poverty: How Electricity Became a Luxury Good, Der Spiegel, 4 Sept. 2013
48
The EU Fuel Poverty Network has become the leading online portal for information about EU fuel poverty and
aims to bring together researchers and practitioners from across the European Union who are working in the field
of fuel poverty in order to facilitate discussion, further the dialogue on across the EU and provide a platform for
researchers and practitioners
#_0B:./Z#
80/:.BG#
#,K.=B#
#,T0D0B#
#Q3.;G#
#<0;2=J:#
#<J;2./=.#
#8/00P0#
#Ma0P-#*0KJ\;=P#
#]J>3/=.#
#+>39B=.#
#O/.BP0#
IL#
#R03-0/;.BD>#
#*9:.B=.#
#O=B;.BD#
I,#
!#
$!!#
%!!#
&!!#
'!!#
(!!#
)!!#
5!!#
6!!#
7!!#
!# (# $!# $(# %!# %(# &!# &(#
?@bT=BD#P.K.P=3G#=B#C.c>#K0/#P.K=3.#
+;0P3/=P=3G#K/=P0#X0J/9P3YZC-[#

34
lighting, and use of appliances in the home.” While this phenomenon was initially only British
49
,
it is now expanding to the whole EU as electricity and natural gas prices increase throughout the
continent.
In November 2013, after many years of promoting FITs as an effective mechanism to support
renewable energy development, the EC hinted at the need to reform or end renewable subsidies,
and the need to support fossil generation that backs up renewables. The EC stated that “(i)n some
cases, state intervention in energy markets may be necessary in order to ensure security of supply
and to achieve climate objectives” and that “ (a)s technologies mature, renewables should
gradually be exposed to market prices and eventually support must be fully removed.”
50
As will
be described later, the EC will ultimately remove all FIT schemes starting in 2017.
4.3. Impact on national competitiveness
Concerns about the impact of high energy prices on national competitiveness are growing. In
January 2014, the EC released a communication on a policy framework for climate and energy
51
that warned of the particularly high risk for “industries that have high share of energy costs and
which are exposed to international competition” (p.10). At the World Economic Forum Annual
Meeting in early 2014, energy prices and competitiveness was one of the biggest themes.
Participants observed the growing competitiveness gap between Europe and the United States,
contrasting the United States’ “shale revolution” and abundant domestic natural gas supplies
with Europe, where industrial electricity prices are much higher than in other parts of the world
because of “a pell-mell push toward high-cost renewable electricity (wind and solar), which is
imposing heavy costs on consumers and generating large fiscal burdens for governments.”
52
The rise in German power prices does not only apply to residential consumers, but also to
industry consumers. In this case the main factors contributing to the end price are represented by
the procurement costs. For medium-sized enterprises, the additional part is denoted by taxes and
49
Fuel Poverty: a Framework for Future Action, Department of Energy and Climate Change, July 2013
50
EC Communication, Guidance to Member States on state intervention in electricity markets; November 2013;
http://ec.europa.eu/energy/gas_electricity/internal_market_en.htm
51
EC Communication, A policy framework for climate and energy in the period from 2020 to 2030, 22
nd
January
2014. http://ec.europa.eu/energy/doc/2030/com_2014_15_en.pdf
52
Daniel Yergin, US vs. Europe: Energy battle heats up, CNBC, http://www.cnbc.com/id/101365772

35
charges, which has gained a higher portion over the last few years, reaching about one-third of
the final price in 2012.
For energy-intensive industrial consumers, such as paper, aluminum (non-iron metals), steel, and
cement, electricity prices are a critical factor in economic competitiveness. These consumers
represent an important part of the German economy and are therefore exempt from paying the
EEG levy.
53
The aforementioned industries account for around 40 percent of the power
consumption, although they represent only a small portion of the total number of privileged
companies (10 percent).
As the next table shows, a huge number of companies benefit from privileged treatment
regarding power prices, and that number is steadily increasing.
Figure 17. Exempted companies and power consumption in power-intensive industries
(2012/2013)
54
Exempted companies
Consumption (GWh)
Ratio consumption/
companies (GWh)
Paper
107
14,062
132
Aluminum
40
10,699
267
Steel
37
11,945
323
Cement
25
3,738
150
Total: power intensive
industries
209
40,464
194
Total: ALL industries
2,057
107,477
52
The share of total production costs attributable to electricity expenses varies between 7 percent in
the paper industry and 40 percent in the aluminum industry, meaning electricity price increases
have a great impact on total production costs.
53
Forum Ökologisch-soziale Marktwirtschaft by order of Greenpeace e.V.: Strom- und Energiekosten der Industrie
54
German Federal Ministry for the Environment, Nature Conservation, Building and Nuclear Safety: Development
of renewable energy sources in Germany. www.erneuerbare-energien.de/.../ee.../hintergrundpapier_besar_bf.pdf
36
Figure 18. Share of total production costs for power-intensive industries
55
For power-intensive industry companies, this special treatment is without a doubt an important
benefit and enables them to stay competitive. Current calculations state that the exemptions
given to German industrial companies will account for a total of €5 billion in 2014.
56
Because of the advantage that this exemption brings to large German exporting industries, these
exemptions are now being challenged by the EC, which is planning to examine the special
treatment that the above mentioned German companies are enjoying, and determine whether this
situation violates the principle of fair competition.
4.4. Financial impact to thermal generators and reliability
Large penetration of renewable energy has not only translated into higher costs for the economy,
it is also having profound effects on wholesale electricity markets that could ultimately result in
a deterioration of the country’s reliability. Subsidized renewables have dispatch priority over
55
Forum Ökologisch-soziale Marktwirtschaft by order of Greenpeace e.V.: Strom- und Energiekosten der Industrie.
http://www.greenpeace.de/fileadmin/gpd/user_upload/themen/energie/2012-FOES-IZES-Verguenstigungen-
Industrie.pdf
56
Frankfurter Allgemeine Zeitung: EEG-Umlage: Welche Firmen müssen künftig zahlen? 19
th
February 2014.
http://www.faz.net/aktuell/wirtschaft/wirtschaftspolitik/oekostrom-eeg-umlage-welche-firmen-muessen-kuenftig-
zahlen-12808022.html
!"#
$!"#
%!"#
&!"#
'!"#
(!"#
)!"#
5!"#
6!"#
7!"#
$!!"#
?.K0/# ];J:=BJ:# ,300;# M0:0B3#
A3-0/#P9>3># ,3.E# *.T#:.30/=.;# OJ0;# R.3J/.;#8.># +;0P3/=P=3G#
37
thermal generators and come first in the market’s merit order, thus depressing wholesale prices
to levels that are making thermal plants uneconomical. At the same time, increasing amounts of
renewables require increasing amounts of back-up and balancing power that only thermal plants
can provide. The implications of these developments for reliability are evident.
4.4.1. Impact on wholesale markets: Subsidized renewables first in merit order and low
wholesale prices
While it is the total costs that determine investment decisions for power plants, it is the variable
costs that determine if an existing power plant runs at any given time. Therefore the offer curve
of a power market is determined by the marginal costs in ascending order of the available power
sources. This is the so-called merit order. If there is an increase in demand, then plants are turned
on, starting with the cheapest, until the demand is satisfied. The last plant that is turned on
determines the market price for all market participants. Focusing on the difference between the
long-term investment decisions and the short-term merit order is key to understanding power
markets.
Renewable energy resources, like wind and solar, have very low marginal costs because they
have no fuel costs. Accordingly, renewable resources are bid into the market at very low prices,
thereby becoming first in the merit order. In an undistorted market, generators may offer their
power at prices below their total costs. As long as the market is in equilibrium, the use of power
plants with higher marginal costs ensures that other plants cover their total costs. However, the
power markets today are distorted by subsidies. Renewable generation will continue to be built
since it depends only on subsidies and does not react to the markets’ excess power signals.
The change of the merit order and the increasing amounts of low-bid renewable energy in
electricity wholesale markets have been steadily depressing wholesale prices of electricity in
Germany and other European nations over the last couple of years. From values around
€90/MWh in July 2008, the power price fell on the European Energy Exchange (EEX) to levels
under €40/MWh at the end of 2013.
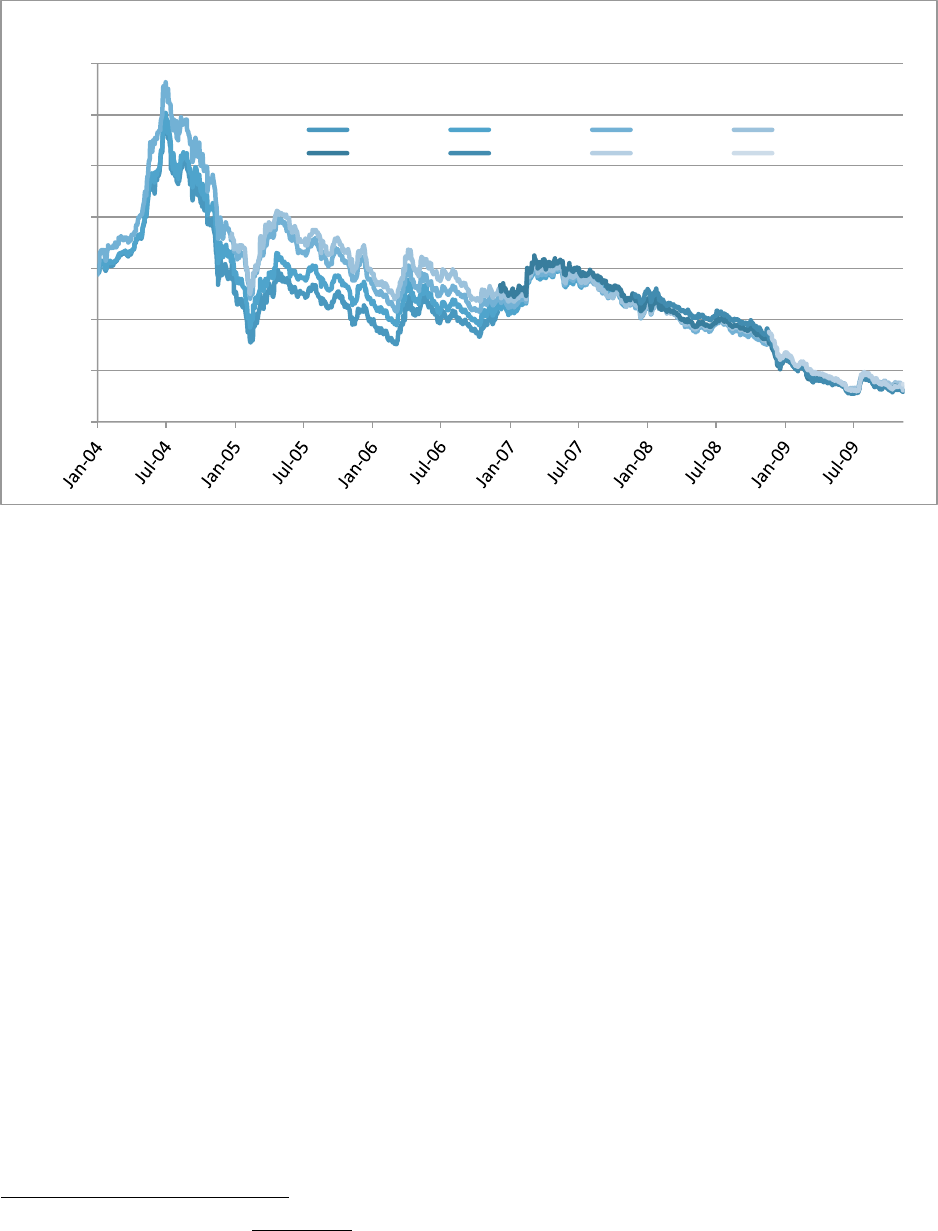
38
Figure 19. Wholesale price Germany - Non-peak futures prices, EEX
57
Although lower prices sound like a positive development, wholesale prices have not translated
into lower prices to consumers, but instead have had a number of perverse effects.
4.4.2. Cost recovery and financial impact to utilities
Lower prices and changes in the structure of wholesale markets have had several implications for
thermal generators.
The first implication is that, at current price levels, coal and gas-fired power plants cannot cover
their full costs. There are fewer hours in which the conventional power plants earn more than the
marginal cost since they run fewer hours than originally planned and, in many cases, provide
back-up power only.
Also, the market peak price has been reduced, further reducing the revenues of traditional
thermal power plants. Given the large percentage of PV deployment, PV was able to reshape the
power market. In the past, wholesale prices followed the demand curve and peak load plants
earned most of their margin in the middle of the day, when high load led to high power prices.
57
European Energy Exchange. www.eex.de
&!#
'!#
(!#
)!#
5!#
6!#
7!#
$!!#
UYSC#
%!$$# %!$%# %!$&# %!$'#
%!$(# %!$)# %!$5# %!$6#
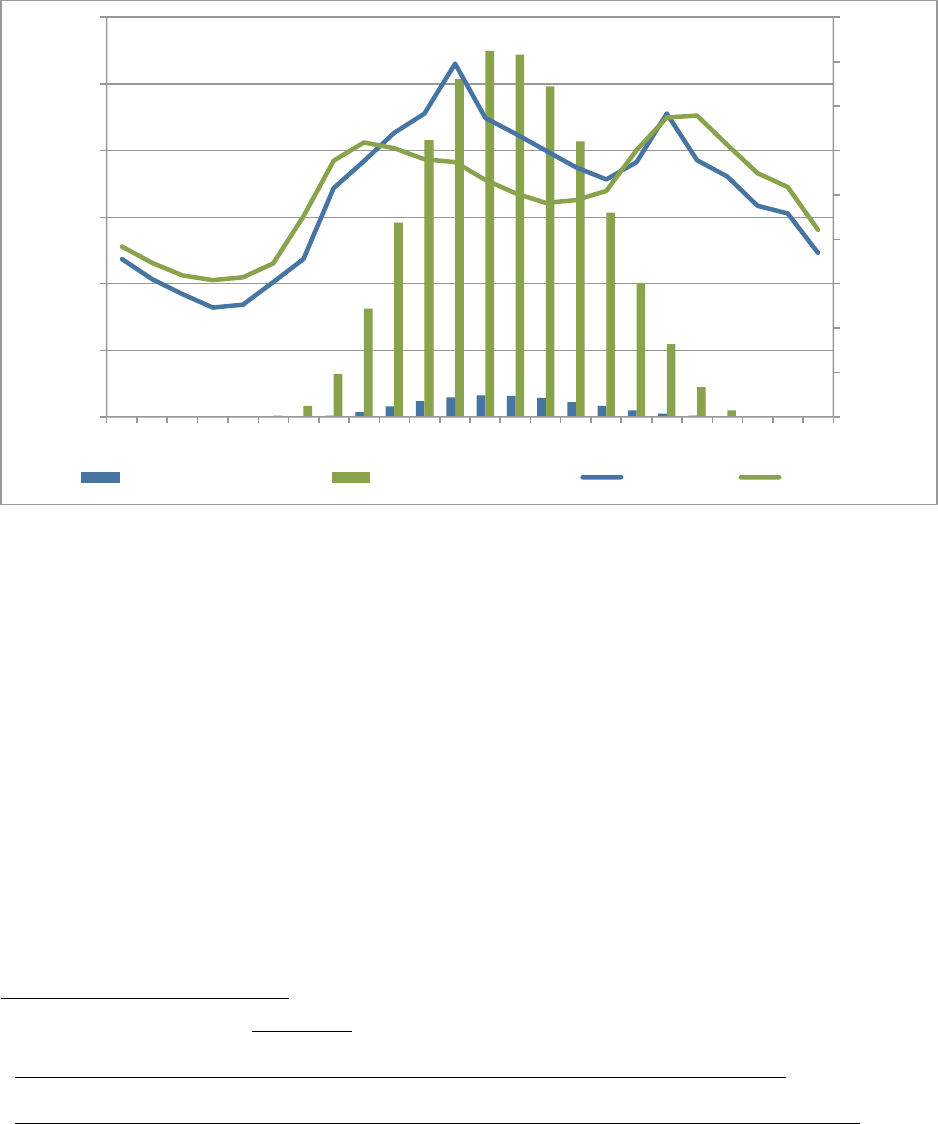
39
The growth in PV eroded the midday peak, which took away the high mid-day margins of the
peak plants.
Figure 20. Yearly Performance of PV and Electricity Tariff (standardized)
58
This situation is making cost recovery even more difficult. This means that the owners of the
plants have to write-off the money they originally invested. As discussed earlier, RWE recently
announced a write down of €4.8 billion on assets, mainly power stations, and a net loss of €2.76
billion ($3.8 billion) on total sales of €54.1 billion, its first full-year loss since 1949.
59
This
situation is not unique to Germany. One of Australia’s largest utilities, Energy Australia, also
announced a significant write down due, in part, to gas-fired generators becoming uneconomic
because of the rapid growth of solar power and the rapid increase of electricity prices for
customers.
60
Generators’ financial difficulties have already translated into lower stock prices and credit
ratings. In terms of the magnitude of share price reductions, power utilities have fared worse than
58
European Energy Exchange. www.eex.de
59
Bloomberg: RWE Suffers First Loss Since Founding of German Republic 4
th
March 2014.
http://www.bloomberg.com/news/2014-03-04/rwe-reports-first-loss-in-more-than-60-years.html
60
Renew Economy, Massive losses hit EnergyAustralia as demand falls, solar soars, 28 February 2014.
http://reneweconomy.com.au/2014/massive-losses-hit-energyaustralia-as-demand-falls-solar-soars-67443
!V!!#
!V%!#
!V'!#
!V)!#
!V6!#
$V!!#
$V%!#
$V'!#
$V)!#
$V6!#
!#
%4!!!#
'4!!!#
)4!!!#
64!!!#
$!4!!!#
$%4!!!#
$# %# &# '# (# )# 5# 6# 7# $!# $$# $%# $&# $'# $(# $)# $5# $6# $7# %!# %$# %%# %&# %'#
F9J/#?/=P0Y<.>0#?/=P0#
SC-Y-#
%!!)#K0/d9/:.BP0#?@#
%!$&#K0/d9/:.BP0#?@#
%!!)#K/=P0#
%!$&#K/=P0#
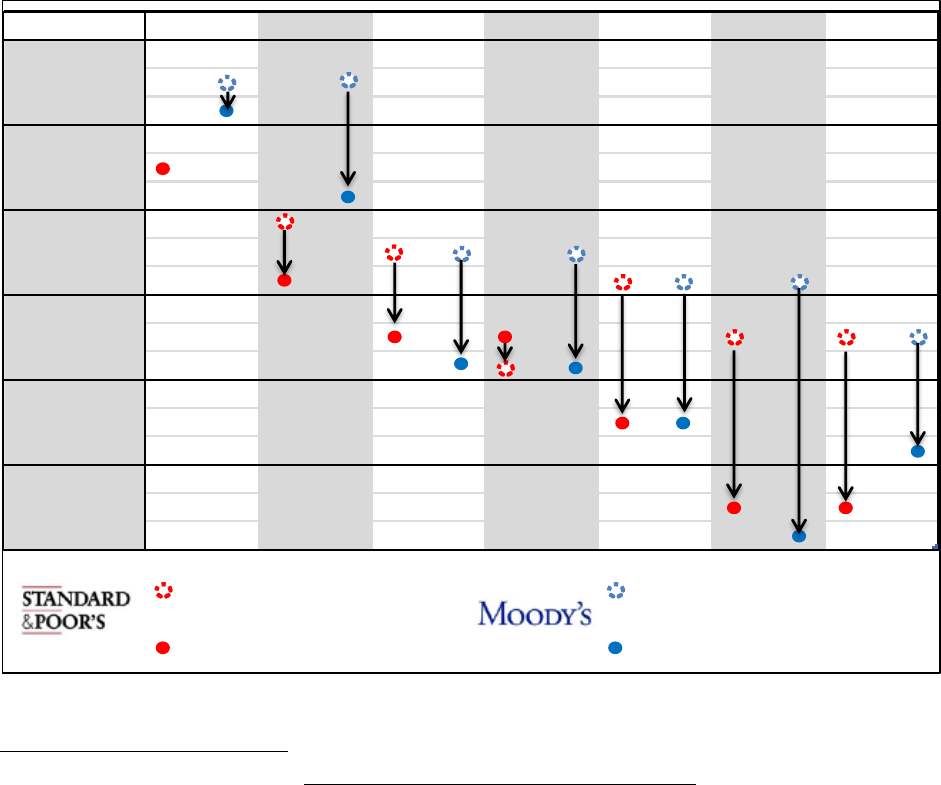
40
the renewable space. According to the MSCI (Morgan Stanley) European utilities share price
index, the top 20 energy utilities have lost more than half a trillion dollars since their peak in
September 2008.
61
This is not only attributed to the large subsidies, but also to deregulation, the impact of the global
financial crises, failed acquisitions, emissions controls, and investment in new efficient plants
(that ultimately were closed due to renewable subsidies and permanent demand destruction), and,
in the case of Germany, nuclear decommissioning. Since 2010, the European Stoxx Utilities
Index is down 31 percent, while German utilities, like Eon, have seen their shares plunge 45
percent.
Figure 21. Development of ratings of major European utilities since 2010
62
61
The Economist October 12
th
, 2013. http://www.economist.com/node/21587782/print
62
Source: E.ON and own research on Bloomberg
Development*of*Ratings*of*major*European*utilities*since*2010
EDF GSZ E=on EnBW RWE Enel Iberdrola
positive
AA=/Aa3
negativ e
positive
A+ /A1
negativ e
positive
A/ A2
negativ e
positive
A=/A3
negativ e
positive
BBB+/Baa1
negativ e
positive
BBB/Baa2
negativ e
++++++++Rating+as+per+Jan+1.+2010 +++++++Rating+as+per+Jan+1.+2010
++++++++current+rating +++++++current+rating
source:+E.ON+;+own+research+on+Bloomberg+Terminal
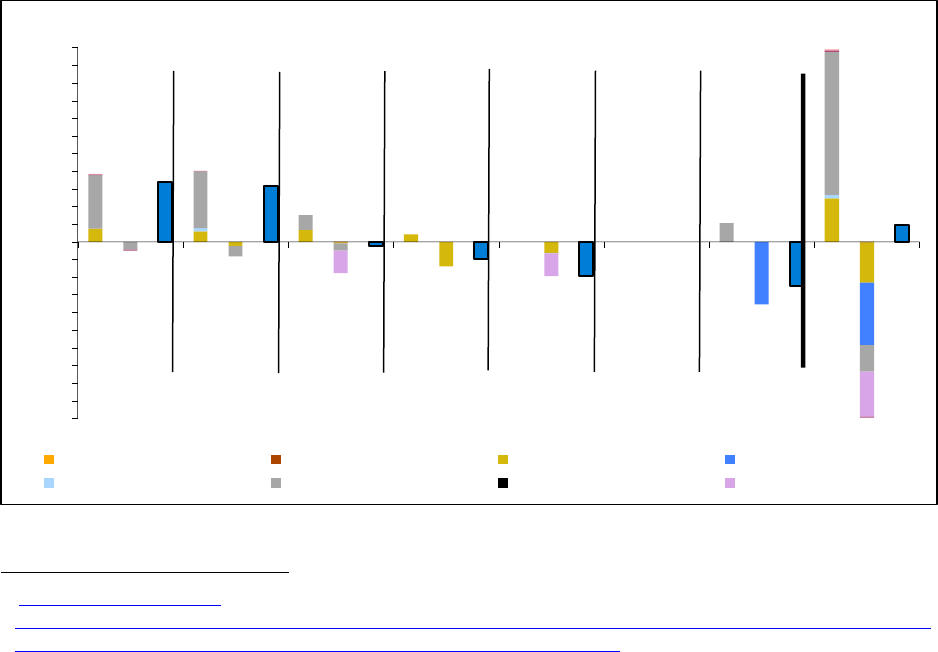
41
The impact to credit ratings of these institutions has also been significant. Back in 2008, the top
10 European electric companies had credit ratings of A or higher. At the time of this writing, less
than half still maintain this rating.
Collectively, both renewable companies and utilities are having their costs of capital increased
by both regulation and the uncertainty that is being created in the capital markets. There is no
doubt that these increased costs will ultimately be passed on to consumers.
4.4.3. Evolution of the fleet and impact on reliability
A second major implication of low wholesale prices is that fewer new plants are planned. This
can present reliability problems, especially as nuclear plants shut down. It can also present a
challenge to integrate large amounts of renewable energy, as thermal power plants still provide
back-up and balancing services.
Figure 22. German-wide commissioning and decommissioning of non-intermitting power
plants; National planning data 2013 - 2018
63
63
Federal Network Agency; 08
th
January 2014.
http://www.bundesnetzagentur.de/DE/Sachgebiete/ElektrizitaetundGas/Unternehmen_Institutionen/Versorgungssi
cherheit/Erzeugungskapazitaeten/Kraftwerksliste/kraftwerksliste-node.html; 08.01.2014
&4&6&#
&4$6&#
H%'5#
H7(!#
H$47%'#
!#
H%4'66#
7(5#
H$!4!!!#
H74!!!#
H64!!!#
H54!!!#
H)4!!!#
H(4!!!#
H'4!!!#
H&4!!!#
H%4!!!#
H$4!!!#
!#
$4!!!#
%4!!!#
&4!!!#
'4!!!#
(4!!!#
)4!!!#
54!!!#
64!!!#
74!!!#
$!4!!!#
$$4!!!#
%!$&#
%!$'#
%!$(#
%!$)#
%!$5#
%!$6#
=BD0eB=30#G0./#
%!$&H%!$6#
C.>30# f=2B=30# R.3J/.;#2.># ,0W0/.;#0B0/2G#>9J/P0>#
?J:K#>39/.20# <=3J:=B9J>#P9.;# S=B0/.;#9=;# RJP;0./#
MW
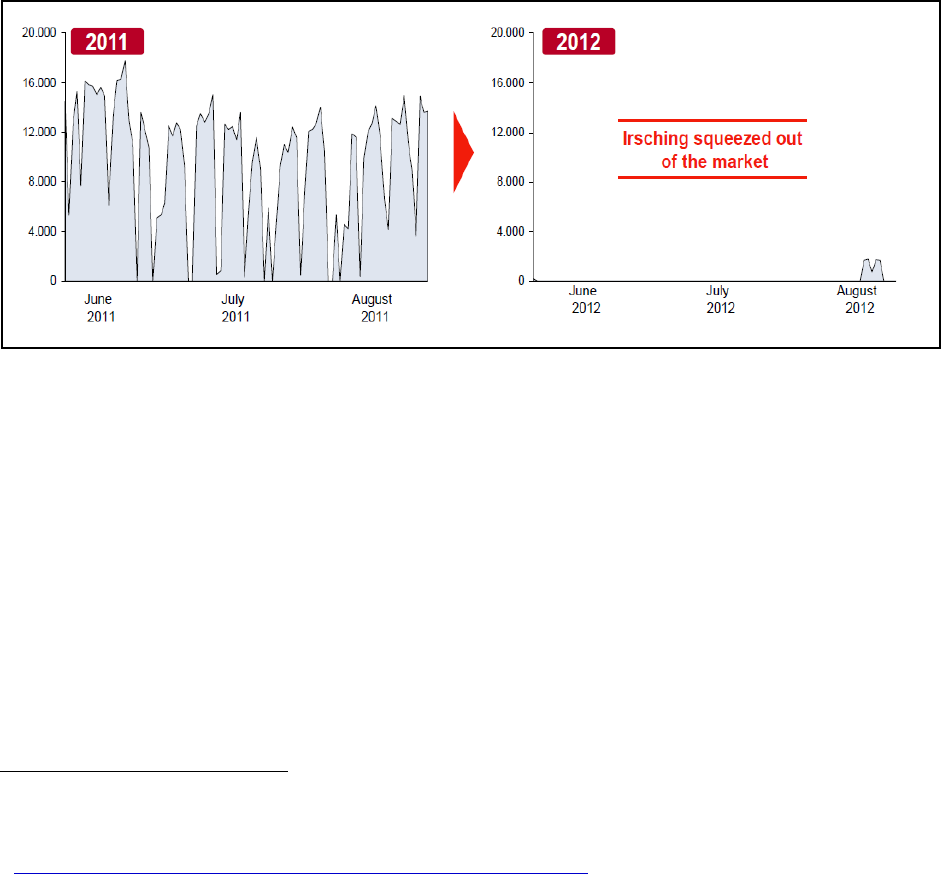
42
The effects on reliability can be seen in an agreement reached by a German grid operator and a
gas-fired power plant that had threatened to close because of economic problems. In 2013, the
owners of the CCGT Irsching 5 threatened to mothball the power plant for two years,
64
even
though Irsching 5 had only been online since 2010, and, with an efficiency factor of 60 percent,
was one of the most modern CCGT plants in Europe. The plant was kept online per decree due to
its role in maintaining system stability. By agreement, the power plant committed to continued
operations and, in exchange, TenneT, the grid operator, compensates Irsching’s fixed costs
proportionally to the number of usages on demand of TenneT (Redispatch).
Figure 23. Electricity generation at E.ON's Irsching Gas power plant (2011 vs. 2012)
65
4.5. Impact of renewables’ variability on market operations and thermal
plants
Ironically, the fast growth in renewables in general, and especially PV, is contributing to drive
out of the market the very same generators that can help them grow. Because of their variability,
renewables require other generators to help them integrate their power into the grid. In most
cases in Germany, it is the thermal generators that used to provide baseload power that are now
providing back-up and balancing services for intermittent renewables at a significant loss of
technical efficiency and increased costs.
64
TAM-News 14
th
. March 2013 and 29
th
April .2013
65
. 01
st
November 2013: Speech of Thomas Barth, CEO and Chairman of the Managing Board, E.ON Energie AG:
“The German Energiewende”: Shining or Warning Example for Europe? 5th Conference ELECPOR.
http://www.elecpor.pt/pdf/Thomas%20Barth_ELECPOR_Nov2013.pdf.

43
4.5.1. Large thermal as back-up – grid interventions
The more variable renewables there are, the more the thermal power plants will serve as back-up
and balancing for renewables.
Figure 24 shows the daily production of solar, wind, and conventional generation in Germany.
The maximum daily solar and wind-combined production in 2012 was 530 GWh on January 5,
2012, while the minimum was only 30 GWh on December 19, 2012.
Figure 24. Daily production of Solar, Wind and Conventional in Germany 2012
66
Given the average daily power consumption of around 1,643 GWh in Germany, this means that
in spite of the 13.2 percent
67
share of wind and solar power in total power generation, there must
be almost complete redundant capacity of thermal plants or storage.
Wind and solar energy, by their very nature, are highly variable, with fluctuations in weather
conditions causing significant variance over multiple timescales: seconds (gusts of wind and
passing cloud cover), minutes (wind speed variations, briefly overcast skies), days (diurnal
cycles, creating peaks of solar condition), months/quarters (seasonal cycles), and years (annual
variation in environmental conditions).
At yearly and seasonal levels, both wind and solar generation can be forecasted with relative
certainty. It is when considering diurnal (daily) generation profiles that variability occurs and
66
FRAUNHOFER INSTITUTE FOR SOLAR ENERGY SYSTEMS ISE; Electricity production from solar and
wind in Germany in 2012; February 08
th
, 2013
67
German Federal Ministry for the Environment, Nature Conservation, Building and Nuclear Safety: Development
of renewable energy sources in Germany
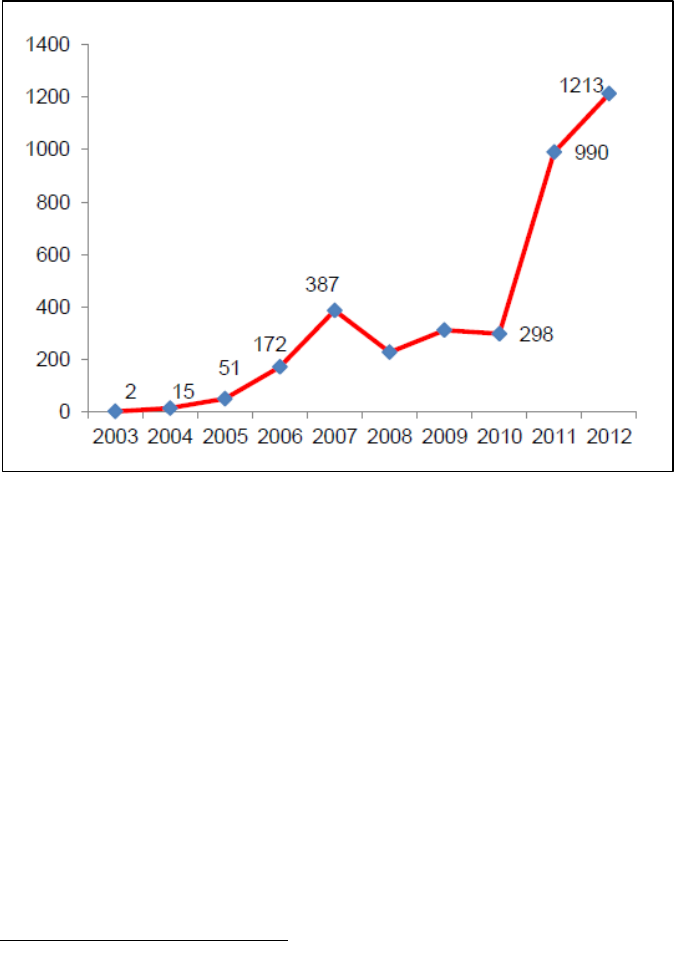
44
requires system operators to intervene and make sure that supply and demand of electricity are
equal at all times.
In Germany, as the percentage of renewable power increased, so did the number of times that
grid operators had to intervene to rebalance the market. In 2012, there were 1,213 such
interventions.
Figure 25. Grid interventions to stabilize the grid by grid operator Tennet, 2003-2012
68
For new thermal power plants to replace the currently uneconomical power plants once they
reach their technical lifetime, current prices will have to rise. The effect of fewer operational
hours needs to be compensated by higher prices in these hours. As a consequence, it is likely that
markets will experience lower prices in times when there is sufficient renewable power and
much higher prices at other times.
Renewables generate higher direct costs than traditional power production. Traditional base load
wholesale power can be generated in Germany at around €65/MWh, but wind power and solar
PV in Germany receive a FIT of around €90 /MWh.
68
Tennet

45
Because renewables, like wind and solar, do not produce at certain times, available back-up
power to the system is required. The back-up capacity must be financed even if it is used only
occasionally as back-up. Therefore the little power that is produced in the back-up plants will
become expensive. Data drawn from business models of Finadvice show that a CCGT can
produce 3000 GWh per year at fixed costs of €11/MWh, in a power system without renewables.
If renewables reduce the production of the CCGT to for example 1500 GWh, the price needed to
recover fixed costs will double to €22/MWh. In a nutshell, this could mean that the cost of power
in the hours with renewable power is the subsidized €90/MWh instead of conventional €65
MWh, and when there is no renewable power, the (back-up) power price will be €76/MWh (65 +
11).
How difficult it is to integrate renewable energy depends on the overall system and the specific
characteristics of each national electric system. Norway, for instance, has 95 percent of
hydropower, which has essentially no variable cost but acts as a nice storage/buffering
mechanism for other renewables, allowing the country to integrate renewables with less impact
on the overall system.
4.5.2. Impact to thermal plants operating under new conditions of high variability
Baseload thermal plants were designed to operate on a continuous base. Although some were
designed to perform efficient ramping, they were all built to operate at their highest efficiencies
when running 24 hours a day, seven days a week. The rapid deployment of renewable energy has
meant that those same thermal plants are providing back-up and balancing services to renewables
at suboptimal efficiencies.
69
The potential operational impact to owners of thermal plants for
material damage and consequential business interruption could be significant and accordingly is
now being closely analyzed by one of the world’s top insurers.
70
Renewable energy sources have a significant influence on the daily operations of conventional
power plants since they have guaranteed access to the grid and are variable in nature. The
fluctuating distribution of all kinds of power generation plants is shown in figure 26 for a one-
69
See Appendix A for an analysis from Siemens which provides further technical related impacts,
70
See Appendix B for an analysis from Marsh Ltd.
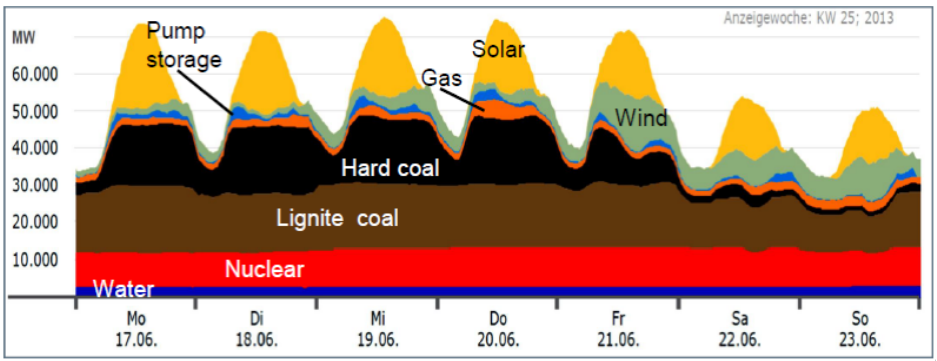
46
week time span in June 2013, in Germany. Hard coal and gas-fired units are following load and
balancing renewables during peak load conditions. Typical baseload lignite coal, and even
nuclear units, has to follow load during minimum load periods because of priority dispatch of
renewables.
Figure 26. SIEMENS: Weather-related fluctuation of renewable energy (solar and wind
power) with significant influence on operation regime of conventional power plants
The change from providing baseload power to increased cycling, load following, and providing
peak load power has had profound effects on thermal generators, particularly the older, less
efficient generators.
Depending on the type of generator, the new peak and medium load operation conditions with
steep load ramps of up to 50 MW/min for new gas-fired units will stress a number of generator
components in different ways. For example, when large, old coal-fired generators, which were
designed for baseload operation, are running in peak load operation, the frequent thermal
expansion and contraction of stator and rotor windings will result in accelerated wear and aging
of the unit.
Adding to the costs associated with increased renewables, a condition-based maintenance,
refurbishment, and replacement strategy will be needed to reduce the sudden outage risk for
these older generators.
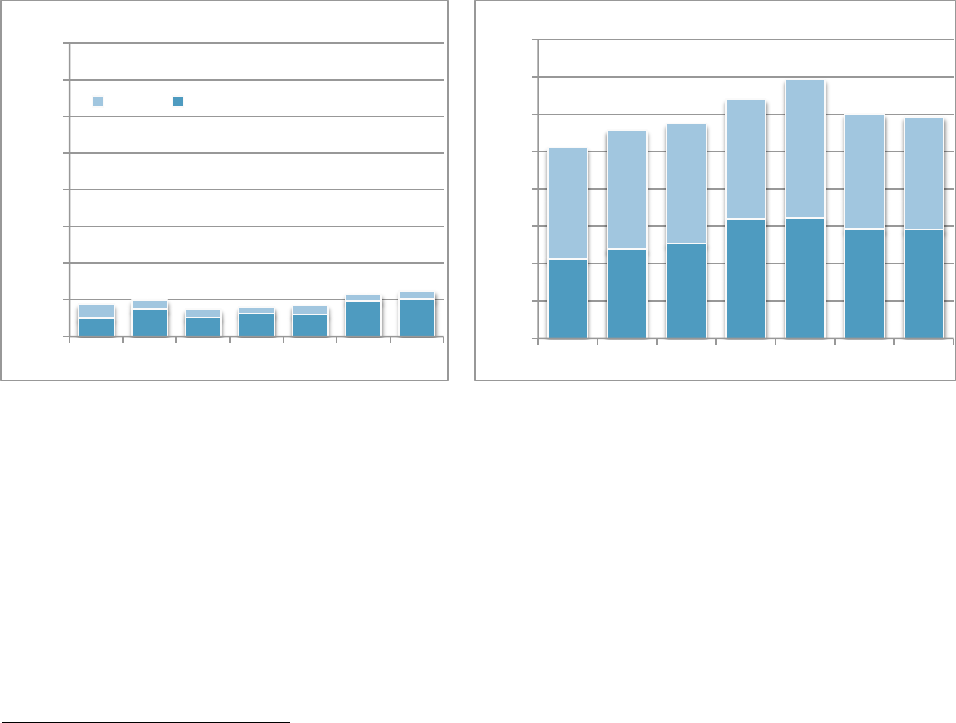
47
4.6. Expansion and additional investment in the power grid
The German power grid was originally designed for centralized, thermal baseload power
production, but the growth of renewable energy (both centralized and distributed) in Germany
requires new investments and the extension and transformation of both the transmission and
distribution grids. Renewables, like offshore wind in Germany, are usually located far from
power demand. Thus, adding renewables to electric systems usually requires a substantial
extension of the transmission system. Resources that are close to consumption, like rooftop PV,
require grid connection and grid services to back up their power when there is no sun and to
ensure power quality through balancing services that control frequency and voltage.
Figure 27. New investments and operational expenditures of transmission and distribution
grid operators
71
While analyzing the amounts of investments related to the grid system, it is important to
distinguish between investments undertaken by the transmission system operators and those by
distribution system operators. While the transmission system operators are mainly concerned
with connecting new power generation plants to the existing system, it is the task of distribution
system operators to work on regional and local bases and to serve private households with
electricity. The investments expenditures undertaken by distribution system operators are mainly
due to maintenance of the existing grid, like metering or communication systems. Since 2007,
71
Federal Network Agency
!#
$4!!!#
%4!!!#
&4!!!#
'4!!!#
(4!!!#
)4!!!#
54!!!#
64!!!#
%!!5# %!!6# %!!7# %!$!# %!$$# %!$%# %!$&#
Transmission#
AgS# QBW0>3:0B3>#
!#
$!!!#
%!!!#
&!!!#
'!!!#
(!!!#
)!!!#
5!!!#
6!!!#
%!!5# %!!6# %!!7# %!$!# %!$$# %!$%# %!$&#
Distribu4on#
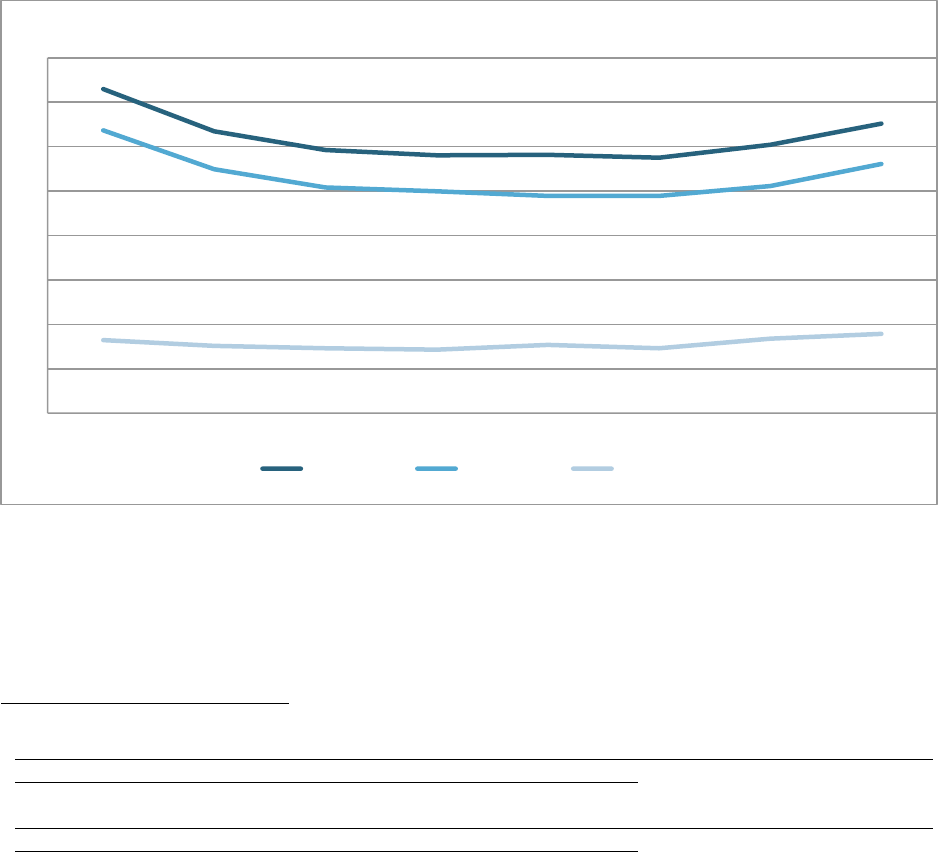
48
investments and operational expenditures by distribution system operators rose significantly and
reached their peak in 2011 (€6,930 million), while the level of investments and operational
expenditures in the transmission system remained proportionally low and quite stable with only a
small rise in 2012 and 2013.
As a result of these additional investments in grid expansion and improvement, grid usage fees
(fees that recover costs associated with transmission and distribution) increased in 2011,
72
and
are expected to continue to increase in the future as a result of Germany’s plan to further expand
the grid to accommodate increasingly large amounts of renewable resources.
Figure 28. Development of the average grid usage fees 2006-2013
73
72
Federal Network Agency Monitoring report 2013.
http://www.bundesnetzagentur.de/SharedDocs/Downloads/DE/Allgemeines/Bundesnetzagentur/Publikationen/Ber
ichte/2013/131217_Monitoringbericht2013.pdf?__blob=publicationFile&v=9
73
Federal Network Agency Monitoring report 2013.
http://www.bundesnetzagentur.de/SharedDocs/Downloads/DE/Allgemeines/Bundesnetzagentur/Publikationen/Ber
ichte/2013/131217_Monitoringbericht2013.pdf?__blob=publicationFile&v=9
!#
$#
%#
&#
'#
(#
)#
5#
6#
%!!)# %!!5# %!!7# %!$!# %!$$# %!$%# %!$&# %!$'#
F9J>0-9;D# M9::0/P0# QBDJ>3/G#
Euroct/kWh!

49
The Grid Development Plan
The “Grid Development Plan” is an effort begun in 2012 by the four German grid operators
(Tennet, 50Hertz, Amprion, and TransnetBW) to develop expansion plans of the current grid,
including the Offshore-Grid Development Plan, which is meant to strengthen the north-south
high voltage connections in order to bring power from the newly built offshore plants in the
North and the Baltic Sea to the populated areas of Southern Germany.
74
The total investment in
the expansion of the onshore and offshore transmission grid in the next 10 years was initially
estimated at around €40 billion,
75
but was recently revised downward as the plan’s focus
changed from building new lines to improving existing ones.
76
The costs will be recovered by
additional grid usage fees paid by all electricity consumers.
77
Unfortunately for transmission operators and regulators, government officials of the State of
Bayern lodged a protest against the build-out of the SUEDLINK on February 6, 2014, calling
into question one of the cornerstones of the Energiewende.
78
The State of Bayern is not the only
state to create protest, other states and municipalities are questioning the build-out of the grid
mainly based upon a “not in my backyard” syndrome, as well as the high cost to be paid.
Also, critics among the scientific community have questioned the magnitude of the grid
development plan and believe the plan is overdesigned, which would result in higher than
necessary costs that will have to be covered by end consumers through higher grid usage fees.
79
74
Transmission system operators: Grid development plan: second draft 17
th
July 2013.
http://www.netzentwicklungsplan.de/sites/default/files/pressematerial/Presse%20release_GDP_2013_second%20d
raft.pdf
75
Transmission system operators_ Grid development plan.
http://www.netzentwicklungsplan.de/sites/default/files/pressematerial/Presse%20release_O-
GDP_2013_second%20draft.pdf
76
Umweltdienstleister Netzentwicklungsplan bestätigt 16 January 2014 ; German Network Agency.
http://umweltdienstleister.de/2014/01/16/netzentwicklungsplan-bestaetigt/;
http://www.netzausbau.de/SharedDocs/Downloads/DE/II/NEP/ZFStromnetzausbau2013.pdf?__blob=publicationF
ile
77
Transmission system operators: grid development plan. http://www.netzentwicklungsplan.de/content/fragen-zur-
finanzierung
78
Frankfurter Allgemeine Zeitung: Die Energiewende kommt die Armen teuer
79
Solarify Netzausbauplan übertrieben: Akzeptanz der Energiewende bedroht 06
th
April 2013.
http://www.solarify.eu/2013/04/06/netzausbauplan-ubertrieben-akzeptanz-der-energiewende-bedroht/
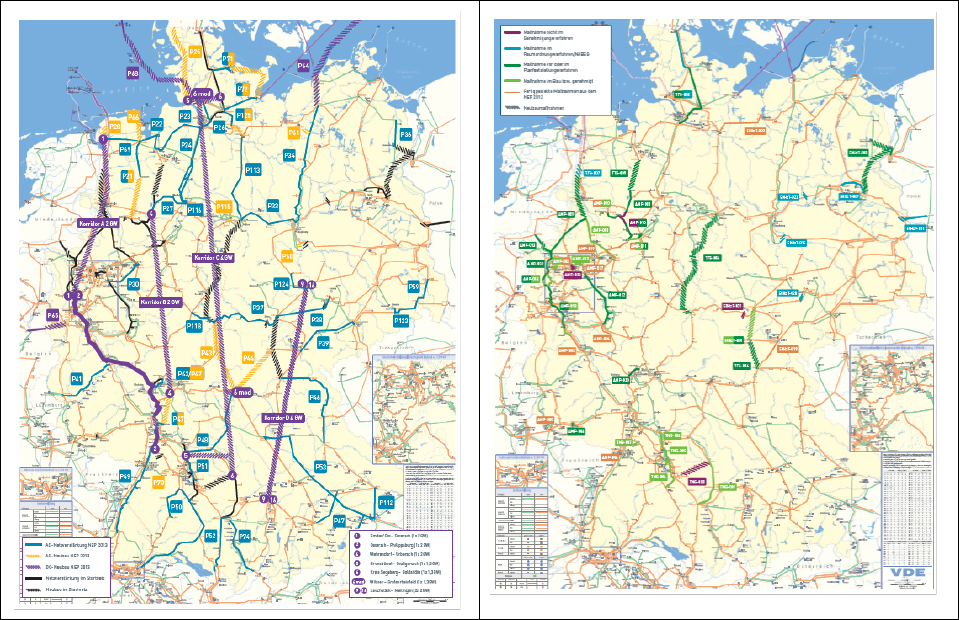
50
Figure 29. Target grid network
Unequivocally, large scale deployment of renewables in Germany has increased the need to
expand the grid, which will therefore lead to higher grid investments and, in turn, to higher grid
usage fees for customers. The effect on the grid usage fees will be even more evident when
interest rates return to pre-crisis levels.
4.7. Repeated redesigns and boom and bust cycles
European subsidy programs for renewables increased prices for European consumers, and, in
many instances, became such a burden on the national economies that they resulted in numerous
redesigns. Some European renewable energy regulatory regimes were inappropriately structured,
gamed by market players, or made obsolete by market conditions. As a result, governments and
regulators corrected unsustainable regulatory regimes by reducing the level of subsidies,
sometimes retroactively, and modifying the rules of the programs. The numerous changes in the
rules increased regulatory uncertainty and financial risk for the renewable industry that
experienced significant value destruction.

51
4.7.1. Redesigning unsustainable programs
Germany set the subsidy level in €/MWh and left it to the market to react with an according
quantity in installed capacity. The original FIT law had no limit to the quantity of renewables to
be built, but the FIT rate was to be reduced year-by-year. This system was meant to lead to a
sustainable growth of renewables. However, neither the wind nor the PV market reacted as
expected by politicians. Rather, they were taken by surprise by the pace of deployment. In the
solar PV industry, for example, as the cost rapidly decreased, the profitability of PV improved
much faster than the FIT was reduced. This led to a boom in PV installations. The ever-
increasing demand led to very high margins for producers, project developers, and installers who
had an incentive to keep installing new PV systems. More systems meant more subsidy
payments, but also higher costs to consumers.
By 2010, the debate over the cost of the FIT program had gained momentum in Germany as the
economic crisis brought cost and industrial competitiveness back to the forefront of policy
concerns, while at the same time solar PV enjoyed a rapid decline in costs. More than 100
electricity service providers announced significant price increases for 2010 (as high as 16 percent
for households) claiming increased costs associated with renewable energy. In 2010, Germany’s
new government introduced significant changes to the FIT scheme for solar and announced its
desire to undertake a major revision of its renewable energy policy in 2012. That year, further
encouraged by the international economic and financial crises to attempt to restrain costs, the
government modified the FIT law again. To make sure that PV installations followed a
sustainable path, a “growth corridor” for solar power was established that linked the subsidy paid
to PVs to the new PV capacity installed. If the yearly installed capacity exceeds 2.5–3.5 GW, the
FIT decreases accordingly.
80
The FIT for solar installations above 10 MW was abandoned and
the self-consumption premium (premium paid above the retail electricity price for all energy that
is self-consumed and not fed into the grid) was cancelled. The new revision also announced the
phase-out of the program by placing a cap on the overall FIT program of 52GW of installed solar
capacity, which the government thinks will be achieved by 2020. At the end of 2013, Germany
80
Bundesministerium für Umwelt, Naturschutz und Reaktorsicherheit (BMU): Die wichtigsten Änderungen der
EEG-Novelle zur Photovoltaik 2012 (PDF; 14 kB) Berlin Juni 2012, abgerufen am 29. September 2012

52
had almost 33 GW of installed solar PV capacity, which brings some to anticipate that the cap
will be reached as early as 2016.
Other countries in Europe and around the world also had to modify, and eventually phase out,
their program because of the very high costs of their renewables support mechanisms. A more
detailed explanation of these regulatory interventions and redesigns can be found in Appendix C.
Spain offers the best example of a poorly designed, overgenerous subsidy program for solar PV
that became so costly for the national economy that the government had to modify it several
times and even take the very unpopular road of introducing retroactive cuts of the tariff, before
ending the program in 2013. These changes had adverse consequences for investors in Spain,
but, because of the size of the Spanish solar market, it also had the effect of contributing to the
collapse of the much overheated international solar market.
In the mid-2000s, Spain was among the leading European countries in overall installed capacity
of wind, solar PV, and concentrated solar power, as well as in share of renewable energy sources
of total power demand, which it fueled through very generous premiums for renewable energy—
PVs in particular–and a poorly designed system without caps or tariff degressions. Spain’s
program, at a time of rapidly decreasing solar costs, created rapid demand for PVs which helped
drive a boom cycle in the solar industry. However, by 2008 these subsidies could no longer be
continued due to the impact of the global financial crisis and its impact on Spanish finances,
which were further worsened by the increasing “tariff deficit” that subsidy payments were
imposing on the Spanish budget.
81
Accordingly, the government introduced changes to the PV
FIT, which ultimately included several revisions that contributed to burst the solar market
worldwide and destroyed large holdings of equity and debt investments. The FIT program ended
in 2013, but the government policy changes were not able to avoid leaving the country holding
€26 billion in debt that tax payers will have to honor, as well as ever-increasing electricity prices.
Almost all European nations also modified, reduced, and/or phased out their FITs programs for
solar including the Czech Republic, Bulgaria, Belgium, France, Greece, Italy, and the United
81
In Spain, the cost of the FIT program is shared between rate payers and tax payers.

53
Kingdom. This trend was also followed outside of Europe. Canada (Ontario) and Australia
(Victoria, Queensland, and New South Wales) also had to cut back their renewable energy rates.
In all cases, the introduction of such sweeping changes damaged investor confidence, increased
the cost of capital to renewable companies and projects, and consequently further reduced
investments in renewable energy.
82
All of those changes tried to moderate cost increases by limiting the growth of renewable
demand. However, since the PV factories where already built, and with production orders
booked, the changes led to reduced prices in PV modules and reduced margins for the producers,
which provoked several manufacturers’ bankruptcies. Between January 2012 and January 2013,
companies producing PV modules with more than 50 employees decreased from 33 to 22.
83
The
reduction in the level of subsidies around the globe drove some industry leaders, including the
Chinese firm SunTech and American companies First Solar and SunPower, to move into the
German market creating greater competition for German manufacturers who are more dependent
on their domestic market and also suffer the most from the FIT revisions. Q-Cells, Soltecture,
and Sovello all went bankrupt in 2012.
Ultimately, the EC recognized that European policies were leading to unintended consequences,
including various market distortions across Europe. On April 9, 2014, the EC approved the new
guidelines
84
for state aid on energy that included the removal of all FIT support mechanisms for
renewables to apply from 2017 onwards, which, depending on the category, included some
transitional measures. Effectively, all prior support mechanisms will be replaced by technology
agnostic auctions (with the exception of emerging technologies and smaller scale plants) and
prices will be directly linked to the wholesale market. Renewable companies will no longer
receive any state support that allows them to exceed their respective market determined cost of
capital. This will require renewable companies to focus on their costs and appropriate profit
creating projects, whereby it is expected that these new incentive mechanisms will instill market
82
European Commission: “Delivering the internal electricity market and making the most of public intervention”
November 5
th
2013. http://ec.europa.eu/energy/gas_electricity/doc/com_2013_public_intervention_en.pdf
83
Die Welt: Deutschlands Solarbranche löst sich auf 20 April 2013.
http://www.welt.de/wirtschaft/article115455341/Deutschlands-Solarbranche-loest-sich-auf.html
84
http://ec.europa.eu/competition/sectors/energy/legislation_en.html

54
competitiveness throughout the renewable sector that will essentially require them to perform as
market competitive generators. It should be noted that these actions are not retroactive, however,
the implications will unequivocally change the European renewable sector and hopefully assist in
creating a level playing field for all energy producers.
4.7.2. Trying to make things right
Germany and other governments around the world have not only reduced the tariffs paid to
renewable developers and modified program rules in an effort to achieve long term sustainable
deployment of renewable energy, but they have also begun to introduce self-generation fees to
ensure that the costs of maintaining and expanding the electric grid are paid for by all electric
consumers, not only those without rooftop PVs.
Spain, Australia, and Germany are the first countries to have proposed changing their pricing
structures and imposing a fixed fee, or back-up rate, on distributed solar installations to help pay for
the electric grid.
The largest element in Germany’s average electricity bill is the “grid fee,” the fixed portion of
costs associated with delivering power to consumers (transmission and distribution).
Figure 30. Retail power price and its components in Germany, euroct/kWh
85
Cost of power
12.20
Charges
16.91
Grid fee
7.00
Concession fee
1.80
EEG levy
5.30
Offshore liability levy
0.25
KWK levy
0.13
§19 power levy
0.33
Electricity tax
2.10
Total retail power price
29.11
85
ET ENERGIE: Zur vermeintlichen „Grid Parity“ von Photovoltaik-Anlagen

55
In 2012, the FIT for PV in Germany was reduced and, for the first time, fell below the retail price
of electricity, which created an incentive for owners of new PV systems to consume their PV
generation directly instead of feeding it into the grid in exchange for the FIT payment. The EEG
allows for the FIT to be applied on the net generation (total generation minus simultaneous
consumption). Consumers generating and consuming their own electricity avoid paying for all
fees and charges that are normally charged via power from the grid. On every kWh self-produced
and consumed onsite, self-generators save €0.07 on grid fees and €0.053 on the EEG levy.
It is problematic that in the case of the grid fee, only the fee is spared but not the cost, as the
owner of the PV plant still relies on the grid and grid costs arise mostly from the grid installation,
irrespective of how little the grid is used. In that way, self-consumption reduces the owners’
electricity bills, while increasing the electricity bills of grid users who do not have the chance for
their own consumption. The savings on the EEG levy is also problematic. Why should the owner
of a PV system contribute less to the Energiewende? It is not only PV owners that resort to this
circumvention. This is also a common method within the German industry, using, for example,
gas-fired generation for self-consumption.
86
In response to the growing trend towards self-production and consumption, and in an attempt to
contain rising electricity prices, in early 2014, the German government proposed a new fee
charging new owners of relatively larger PV installations (above 10 kW) for their own
consumption of self-produced electricity. If approved, the new fee could enter into effect in the
summer of 2014.
87
This fee would prevent companies trying to avoid the EEG levy from not
contributing to the other charges. According to recent reports, 27 percent of German industry
companies are building their own power plants, while another 21 percent are planning to.
88
86
Handelsblatt Online: Der Trend zum eigenen Kraftwerk 06
th
. January 2014; Frankfurter Allgemeine Zeitung: Die
Industrie macht ihren Strom selbst 15
th
October 2013; Markt und Mittelstand Nachrichten: Schutz vor EEG:
Unternehmen produzieren Strom selbst 26
th
August 2013; Wirtschaftswoche EEG-Umlage: Gefährden Industrie-
Ausnahmen die Energiewende? 12
th
July 2013. http://www.handelsblatt.com/technologie/das-technologie-
update/energie/industrie-der-trend-zum-eigenen-kraftwerk/9291960.html;
http://www.faz.net/aktuell/politik/energiepolitik/steigende-eeg-umlage-die-industrie-macht-ihren-strom-selbst-
12618930.html; http://www.marktundmittelstand.de/nachrichten/finanzierung/schutz-vor-eeg-unternehmen-
produzieren-strom-selbst/; http://green.wiwo.de/eeg-umlage-gefahrden-industrie-ausnahmen-die-energiewende/
87
Bloomberg, Germany Tax on Own Use of Renewables Is First in Europe, 24
th
January 2014.
http://www.bloomberg.com/news/2014-01-24/germany-tax-on-own-use-of-renewables-is-first-in-europe.html
88
Handelsblatt Online: „Der Trend zum eigenen Kraftwerk“ 06
th
January 2014

56
4.7.3. Financial impact on the renewable industry: Renewable Investment Funds
The financial impact of renewable policies on renewable investment funds is becoming
increasingly negative as various European governments and regulators continue to decrease their
generous subsidy programs in order to meet their fiscal requirements, or to correct the
appropriate incentive mechanisms due to new innovations and/or economies of scale and scope.
It is difficult to measure the total impact of these interventions across Europe due to the number
of private transactions. However, while many renewable projects were bankrupted by these
regulatory interventions, many other renewable players made good profits by selling early, or by
not selling, and earning a respectable cash yield with a structure that had little or no debt.
A recent article in the Financial Times, titled “Private equity retreats from renewables fad,”
highlighted a recent survey from Prequin that identified just 22 percent of all renewable funds
earned an internal rate of return higher than 3 percent. Joseph Dear, chief investment officer of
Calpers, the world’s sixth-largest pension fund, last year described clean-tech investment as a
“noble way to lose money.” Calpers suffered annualized losses of 9.7 percent in the sector. “We
are all familiar with the J-curve in private equity. Well, for Calpers, clean-tech investing has got
an L-curve for ‘lose’” added Dear. “If it takes 12 years to get the money out, the internal rate of
return is not going to be very good, even if the investment is reasonably successful.”
89
The outlook for European renewables for 2014 and going forward is negative. According to a
December 2013 Fitch report:
90
“The outlook for the overall renewables sector is negative. This reflects increased
political risk and the expectation that the industry will need to adapt to less favorable
operating requirements and economic incentives. This is true across most jurisdictions
and it results from the greater focus on the sustainability of incremental renewable
capacity additions, in terms of the effect on the power industry in general and cost to
consumers who ultimately foot the bill.”
Fitch rated the renewables sector as having the highest downgrade risk potential for its EMEA
project finance ratings. Budgetary constraints, oversupply and distortion of power prices,
89
Financial Times, “Private equity retreats from renewables ‘fad’” 16
th
February 2014.
http://www.ft.com/cms/s/0/ef1b2248-94bb-11e3-9146-00144feab7de.html
90
Fitch Report: “2014 Outlook: Energy Infrastructure EMEA - Stable Except for Renewables”. December 11, 2013
www.fitchratings.com
57
transaction-specific operational performance, market economics (i.e. Germany proposing to cut
all support for biogas), debt structures, and backlash of consumers paying higher prices were all
factors contributing to regulatory intervention. Projecting past 2014, these factors are expected to
continue over the next several years.
58
5. CONCLUSION: TAKEAWAYS OF THE GERMAN AND EUROPEAN
EXPERIENCE WITH RENEWABLES
The United States and other countries have a unique opportunity to assess the lessons learned in
Germany and other European-member states and achieve positive results at lower cost and risk
for all stakeholders.
The large increase in market share of variable renewable generation (mainly from solar PV and
wind) is changing the dynamics and operations of electricity markets, as exemplified in
Germany:
• While in the past, German wholesale prices followed the demand curve, they now react to
the weather, going down when the sun shines and the wind blows, and up, during times of
high demand, when the sun does not shine and the wind does not blow. Accordingly,
price forecasts and power trading now require new modeling and different inputs,
including a much greater focus on weather forecasting.
• Power trading has become more short-term (intra-day, quarter hour, regulation, capacity)
than in a conventional generation environment.
• Regulatory policies were not designed to incentivize flexible renewable power to be
available where and when needed. Therefore, further regulatory interventions will be
required to create a balanced system that will ultimately impact investments for both
renewable companies and utilities over time as various energy markets transition to an
increased portfolio of renewables.
• The power grid has to be upgraded to accept dynamic power input from many
decentralized and distant variable sources.
• In the absence of energy storage, current electric systems cannot easily cope with the
surplus of renewable energy, and curtailment will be required at times in order to
maintain reliability.
59
• Intermittent renewables, like solar and wind, tend to cannibalize their own market by
reducing prices when they are available. With current cost structures, if wind and solar
are to produce a significant share of the power generation, they will likely require support
through energy storage or additional subsidies to be profitable.
U.S. stakeholders should take into consideration the lessons learned from Germany and Europe.
Utilities should incorporate those lessons into their strategic planning, load forecasting, financial
planning, trading, and regulatory affairs organizations. Decisions about current and future
investments should then be made with this new analysis in mind.
Renewable companies should calculate appropriately the true costs of grid enhancements,
capacity, and other important measures when submitting their plans to commissioners, investors,
and other stakeholders.
Legislators and regulators should use the lessons learned from large scale integration of
renewables in Germany and elsewhere in Europe to ensure a stable transition of renewables as
part of the overall power portfolio while ensuring high reliability of power, stability of pricing to
all users, as well as minimal value destruction to both utilities and renewable companies.
Finally, consumers must be made aware of the tradeoffs to a large portfolio of renewables and
the necessary requirement for a smooth transition as part of the overall power portfolio.
In conclusion, the lessons learned in Europe prove that the large-scale integration of renewable
power does not provide net savings to consumers, but rather a net increase in costs to consumers
and other stakeholders. Moreover, when not properly assessed in advance, large-scale integration
of renewables into the power system ultimately leads to disequilibrium in the power markets, as
well as value destruction to both renewable companies and utilities, and their respective
investors. The U.S. has the opportunity to incorporate these lessons learned to ensure the
sustainable growth of renewable energy over the long-term, for the benefit of all customers.
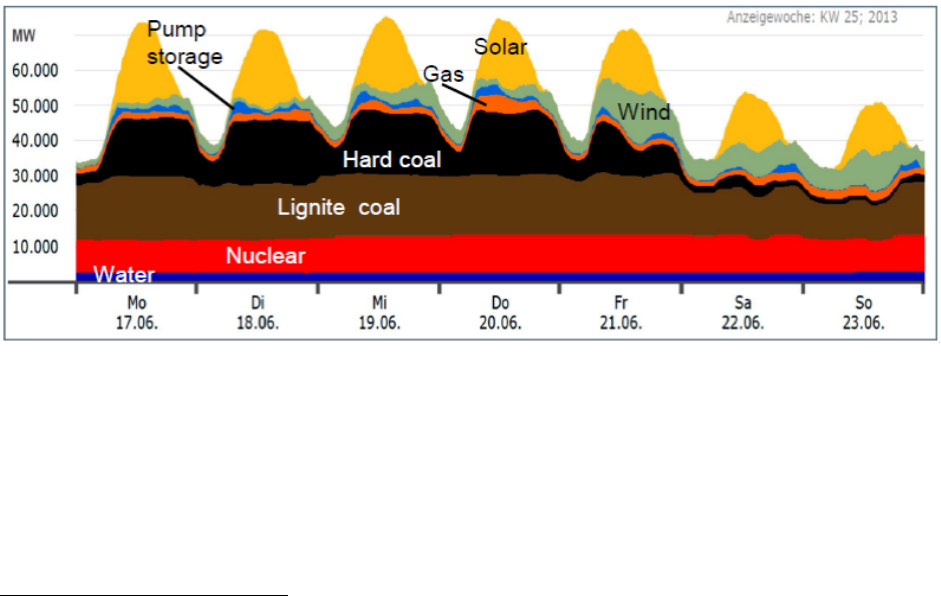
60
APPENDIX A:
INFLUENCE OF HIGHLY FLEXIBLE GRID DEMANDS ON AGING AND
LONG TERM RELIABILITY OF LARGE TURBINE GENERATOR: AN
INSIGHT FROM SIEMENS
91
Depending on actual weather conditions, it is common practice that renewables, with their
guarantied generation dispatch preference, have a significant influence on the daily operation
regime of conventional power plants. The fluctuating distribution of all kinds of power
generation plants is shown in Fig. 44 for a one-week time span in June 2013 in Germany. Hard
coal and gas-fired units are following load and balancing renewables during peak load
conditions. Typical baseload lignite coal, and even nuclear units, have to follow load during
minimum load periods because of priority dispatch of renewables.
Figure 31. SIEMENS: Weather-related fluctuation of renewable energy (solar and wind
power) with significant influence on operation regime of conventional power plants
From 2008 to 2012, the increased penetration of renewables completely changed the load
regime, as demonstrated in Fig. 45. As the figure shows, three 350 MVA generators in a gas-
fired combined cycle power plant in Western Europe shifted from providing baseload power to
peak load power. The on-load service factor decreased from 85 percent in 2008 to 10 percent in
91
Written by Jürgen Weidner,Energy Sector,Power Generation Division,Siemens AG
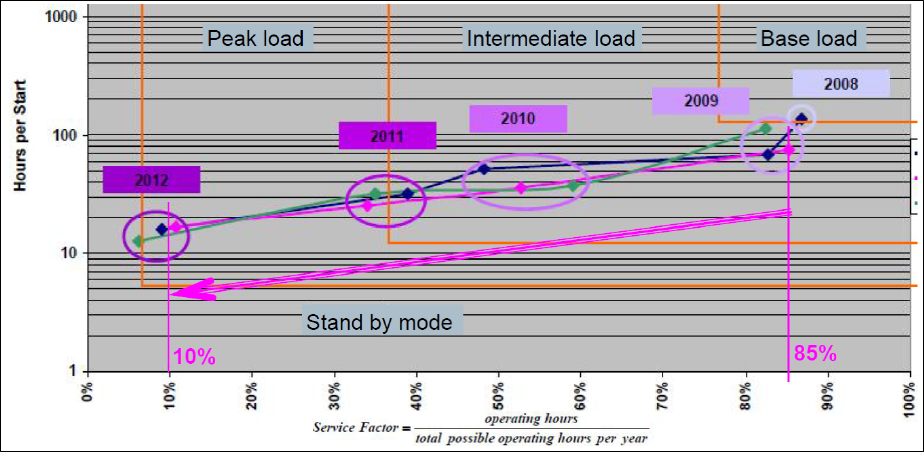
61
2012, and the on-line hours declined from 100h to 15h per start. The generators are now off-line
most of the time, waiting to be needed for fast start-up during peak load conditions.
Figure 32. SIEMENS: Change of operating regime of a Combined Cycle Power Plant
between 2008 and 2012
The demand for a highly flexible grid, combined with the planned new European Grid Code
ENTSO-E with Requirements for Generation, will primarily stress older, less-efficient
generators. The possible impact of ENTSO-E requirements on generators could be summarized
as follows:
• Increased net frequency deviation (47.5 – 51.5 Hz) and higher voltage fluctuation (85
percent - 115 percent rated voltage)
o Risk of magnetic over-fluxing of stator core resulting in hot spots
o High rotor current resulting in over-heating of rotor winding a risk of turn shorts
• Frequent starts and stops of generator unit
o Warming up and cooling down of components
o Thermal cycling of windings and core resulting in increased wear and aging
• Fast load variation with high stator and rotor current gradients up to 24 percent of rated
power
o Fast expansion and contraction of copper windings
o Thermo-mechanical stresses at material interfaces
62
• Longer short-circuit fault-ride-through times up to 250 ms connected to grid
o Significant higher torsional stress at turbo set shaft
o Risk of material cracks at rotor flange
Depending on the type of generator, the new peak and medium load operation conditions with
steep load ramps up to 50 MW/min for new gas-fired units will stress a number of generator
components in different ways. Indirect cooled stator windings of large units will be exposed to
high thermal-mechanical stress between hot copper conductor and cold iron core each time the
unit has to follow fast and high load changes, while direct water cooled stator windings will
mostly smoothen these stresses by direct cooling the heating-up copper conductors. When large,
old coal-fired generators, which were designed for baseload operation, are running in peak load
operation, the frequent thermal expansion and contraction of stator and rotor windings will result
in accelerated wear and aging of the unit.
A condition-based maintenance, refurbishment, and replacement strategy is needed to reduce the
sudden outage risk for these older generators. The first step should be an economic decision-
making process that evaluates operation and maintenance costs against loss of availability risk
and efficiency of the generator. The following influence factors should be analyzed and
weighted:
• Actual and future operation regime of the unit (base - medium - peak load)
• Past and planned maintenance strategy (e.g. condition based maintenance)
• Off-line diagnosis (amount of inspections and tests during stand-still)
• Existing and planned on-line monitoring systems with use of a remote diagnostic center
of OEM for risk mitigation during service period
• Knowledge of generator type dependent risk components
• Availability of strategic spare parts for fast repair
• Planned availability rate of the unit and importance within generation assets of the utility
• Available investments for short term component refurbishment and long term life time
costs
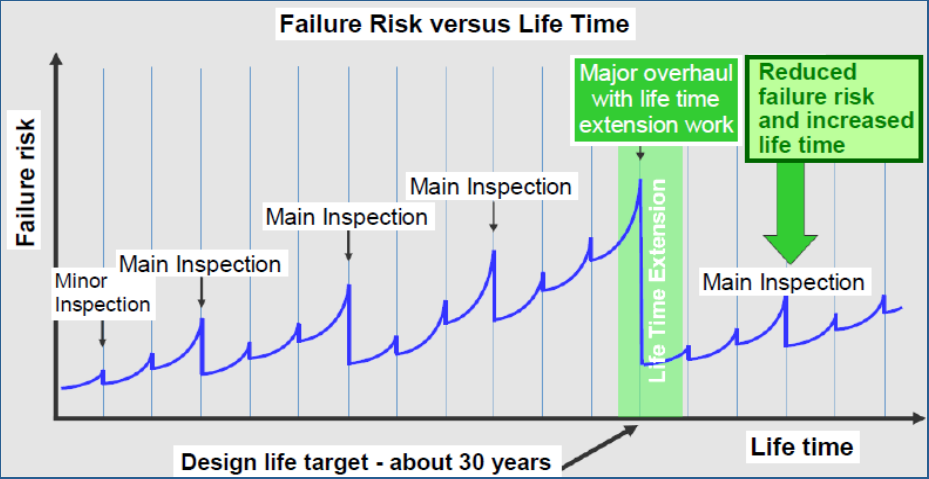
63
Based on this amount of information, the utility, together with the OEM, could start a detailed
residual life assessment study to prepare the decision for possible lifetime extension of the
generator. The graph in Fig. 46 points out the increasing risk of failure versus lifetime at severely
stressed generators, even if the planned minor and major inspections were performed regularly.
Figure 33. SIEMENS: Sudden outage risks of severely stressed generators and lifetime
extension
To reduce a sudden outage risk when the generator gets closer to the expected life target, a major
overhaul with refurbishment or component replacement could be carried out according to the
results of the residual life assessment study. Refurbishment or component replacement with the
new design that is fitted for higher load stresses will give the generator an increased lifetime with
better performance to flexible grid demands.
Lifetime Extension management of aged and highly stressed generators can be summarized by
the following five steps:
1. Prepare residual life time and technical risk assessment study -> utility together with
OEM
2. Plan optimized maintenance activities based on financial risks (forced outage and amount
of damage) -> Predictive maintenance

64
3. Make long-term refurbishment (identified components) or replacement decision based on
financial asset management
4. Install online monitoring tools and a supervising remote diagnostic system for early
warning of incipient damage to assist in sudden outage risk mitigation
5. Plan risk-based predictive maintenance strategy depending on operational stress factor at
peak / medium / base load operation
The International Council on Large Electric Systems, the Electric Power Research Institute, and
the Institute of Electrical and Electronics Engineers are all examining the increased demands on
thermal generators to respond to challenges created by the increased penetration of renewables.

65
APPENDIX B:
A PERSPECTIVE FROM THE INSURANCE INDUSTRY ON CHANGES TO
THE POWER INDUSTRY: INSIGHT FROM MARSH
92
Industry Changes
In recent years, the greater focus on renewable generation methods has necessitated changes to
operating practices. The need to balance grid supply with fuel costs and demand has required an
increase in unit cycling instead of base-load generation. The outcome of such changes, with older
machinery being run in a manner contrary to original design parameters, is hard to predict. While
the industry fully supports renewable sources and they clearly have a part to play in future
generation, issues associated with more intermittent production have to be carefully accounted
for.
At the same time, wider industry changes are afoot. The increasing prevalence of shale gas, the
global uncertainty with fuel infrastructure in areas of turmoil and the collapse of carbon credit
pricing are sources of uncertainty for an industry that requires fixed assets and long-term stability
to be profitable.
Subsidy and regulation are intended to provide some stability and certainty. However, while
initiatives such as the Program of Incentives for Alternative Electricity Sources (PROFINA) in
Brazil have provided a clear target of diversifying production towards renewables, the
International Monetary Fund is pressuring regulators in Pakistan to cut certain subsidies. Future
subsidies and regulation in the European Union are meanwhile subject to legal uncertainties
concerning goals, coverage and regional enforceability. When investments in plant and
machinery may run for over 20 years, investors are naturally cautious to commit to the cost of
expensive equipment. With transmission and distribution equipment being, in many cases,
decades old and with the demand for electricity on a continuing upward trend, the need for such
investment is imperative.
92
Written by Caroline Woolley, Global Business Interruption Centre of Excellence, Marsh Ltd.

66
Insurance Trends
What is the result of all these changes?
For material damage (MD) and business interruption (BI) losses, there are urgent questions for
risk managers to consider. When considering changes to how plant machinery is being run:
A) What is the impact on the useful life of the machinery?
B) How should maintenance schedules be altered?
C) Will the need to manage and monitor the risks of creep fatigue, commonly
associated with base-load generation, be marginalized by increasing risks of thermal-
mechanical fatigue, which is more associated with shut-downs and unit cycling?
D) Will increased unit downtime due to unit cycling increase the prevalence of stress-
corrosion cracking?
E) While new turbine designs reflect the need for fast start-up capacity, what long-
term testing (more than 7,500 operating hours) has been carried out on those models?
Significant increases in equipment prices – for MD claims – and the complexity of repairing
equipment with lower tolerances for error – affecting the duration of BI claims – now mean that
opening a turbine case merely to investigate the possibility of damage now costs millions of US
dollars. Both owners and their insurers will face new engineering challenges, both in the running
of machinery and the investigation of what has actually happened to cause a loss event – and
crucially, whether that loss is a covered event.
Critical Questions around BI:
A) Increased planning and unplanned maintenance play havoc with loss periods –
will theoretical repair period predictions bear any resemblance to the actual position?
B) If damage is discovered during one of these more frequent planned outages, when
does the BI claim period actually commence? When did the damage occur, and in what
policy period?

67
C) With such stresses on machinery, is a loss of some kind inevitable – how will that
affect premium ratings and can such an event be described as sudden and foreseen?
D) With increased frequency of outages and losses, what impact does this have on
your loss distribution curve? Should you reconsider deductible levels? How will insurers
compel such changes and how will they deal with such changes in general?
E) Fluctuations in supply and demand question the security of supply itself, but also
supplies. With shale gas flooding the market, is there a mismatch in requirements
between the fuel and the equipment in use?
F) What impact do the answers to these questions have on market pricing? Pricing
sensitivity can affect theoretical pricing and insured values, potentially affecting the value
of your claim.
G) Taking into account capacity pricing and subsidies that vary according to
individual location, how is revenue affected by a BI event? What revenue loss can be
demonstrated?
H) Actual interruption affects both insured and uninsured costs. Whilst MD and BI
can be covered, market/public reputation and company branding are not. What impact
will a loss have on both your suppliers and customers, and how will that impact affect
industry perception and regulation?
Conclusion
While it is a time of great change for the power industry, current challenges are more formidable
than ever. Risk management, risk transfer and claims will all see some impact. The intricacies of
the issues and the innovation needed for satisfactory solutions require a more holistic approach.
Our experts within Marsh can help you to diagnose the problems, define the issues and design
solutions to help you through this difficult period of change.
The information contained herein is based on sources we believe reliable and should be
understood to be general risk management and insurance information only. The information is
not intended to be taken as advice with respect to any individual situation and cannot be relied
upon as such.
68
In the United Kingdom, Marsh Ltd is authorized and regulated by the Financial Conduct
Authority.
Copyright © 2014 Marsh Ltd All rights reserved
69
APPENDIX C:
REGULATORY INTERVENTIONS ON VARIOUS SUBSIDIES
SCHEMES ACROSS SEVERAL EUROPEAN COUNTRIES
Several countries, for example Spain and the Czech Republic, have implemented retroactive
changes for renewable power producers.
The regulatory interventions in Spain can be divided into four different phases and are
summarized in the table below.
PHASE 1:
In 2008, Spain was among the leading European countries in overall installed capacity of wind,
solar, and concentrating solar power (CSP), as well as in share of renewable energy sources of
total power demand. These subsidies could no longer be continued due to the impact of the
global financial crises on the Spanish government, which was further worsened by the increasing
annual debt of the Spanish electricity system that was being further subsidized by the
government. Accordingly, decisions were made to introduce new regulations, which ultimately
included eight directives that destroyed large holdings of equity and debt investments.
PHASE 2:
First, changes were related to the contract allocation mechanisms of renewable energy, which
changed to a new auction-based system with high entry barriers in 2008 for PV, and further in
2009 for all other renewable technologies. At the same time, PV tariffs fell significantly in 2008-
2010. Furthermore, caps were introduced in February 2010 for all existing CSP, wind, and PV
projects, thereby limiting the maximum subsidy per power plant. For PV-power plants that had
been planned to go online between 2011 and 2013, an even more restrictive cap was introduced.
PHASE 3:
At the beginning of 2013, a 7 percent retroactive tax on electricity sales was introduced affecting
all conventional and renewable producers. The same law also eliminated the “premium option,”
which enabled producers to sell electricity directly to the market and lowered the FIT

70
retroactively. The elimination of this premium was made retroactively from January 1, 2013,
until the date the law went into effect.
In addition, at the same time the inflation index and computation methodology for renewables
were changed, decreeing no inflation increase for 2013 and a 50 percent reduction afterwards.
With the introduction of this law, the Royal Decree-Law 2/2013, the Spanish government
expects to save a total of €600 million to €800 million per year.
PHASE 4:
The consequences caused by the introduction of these regulatory changes are extensive and
touched a wide range of investors and producers in the renewable energy business. A renewable
fund estimates that the impact to portfolio investments it holds in PV equates to a 40 percent-45
percent decrease in gross revenues. For its wind assets built before 2005, the fund estimates a 55
percent decrease in gross revenues.
93
Moreover, it can be imagined that these interventions caused a destabilization of the equilibrium
of this business. This will be reflected in increased uncertainty about existing and future
renewable energy projects, a high probability of legal claims against the government’s actions,
increased unpredictability about future investments, and higher policy and regulatory risks.
Another country that introduced changes on FIT regulations is Czech Republic in 2010. It
lowered the guaranteed FIT for PV retroactively. PV investors, especially with big plants, are
now required to pay a tax of 26 percent to 28 percent. Several groups of investors protested
against this regulation and obtained a special legal acquittal proving that the solar tax violated
the Czech constitution. Moreover, the government planned to raise charges on sites with solar
plants. The Czech government undertook these measures with the aim to stop a further increase
of electricity prices. In 2013, the government proposed a retroactive 10 percent tax on all solar
arrays installed in the Czech Republic since 2010, which would have affected, in total, more than
1.4 GW of PV (approximately 2/3 of the total installed amount in the Czech Republic), and is
estimated to have cost more than €200.000 per company. The aforementioned tax, however,
results to be only an intermediate solution for the current year 2014, without a final solution yet
to be implemented.
93
Described renewable energy fund has requested anonymity
71
Other European nations known for implementing regulatory interventions include:
Bulgaria: Introduced retroactive grid access payments in September 2012 and new retroactive
revenue tax up to 39 percent for solar PV operators. For other technologies, the applied fee is
lower and accounts 10 percent for wind and 5 percent for hydropower. In March 2013, this fee
was however revoked by the Bulgarian Supreme Administrative Court.
Belgium: New grid fee for photovoltaic projects up to 10 kW.
France: Planning 20 percent FIT reduction to all installations that are more than100 kW.
Greece: Introduction in December 2012 of a revenue tax on all solar installations since July 1st
2012, which can reach up to 30 percent. The reasons behind these measures include too generous
FITs, combined with Greek austerity measures. Further retroactive measures were announced in
2013.
Italy: In September 2011, began the contribution of €0.05/kWh of energy self-produced and
incentivized under the Conto Energia IV, and introduction of an additional 6.5 percent corporate
tax on all energy producers, including renewables.
In all of these cases, industry and the European Photovoltaic Industry Association, started
lawsuits against the respective governments with the intention of negating such measures. The
European Energy Commission presently supports the investor side with respect to receiving the
agreed subsidies at the start of the installation. European laws should be “stable, long-term,
transparent, predictable, and credible commitments to investors and consumers.” Retroactive
amendments to correct failures in the prediction of future developments should be avoided. The
introduction of these type of taxes will damage investor confidence, increase the cost of capital
to renewable companies and projects (possibly other regulated entities), and consequently reduce
investments in renewable energy. Moreover, these types of measures go against one of the
general principles of legislation in most EU countries, the irretroactivity of laws.
72
BIBLIOGRAPHY
Newspapers and other media
Frankfurter Allgemeine Zeitung (FAZ)
24.02.2014: “Regierungsberater wollen EEG abschaffen”
http://www.faz.net/aktuell/wirtschaft/wirtschaftspolitik/oekostrom-regierungsberater-wollen-eeg-
abschaffen-12820227.html
19.02.2013: „Energiewende könnte bis zu einer Billion Euro kosten“
http://www.faz.net/aktuell/politik/energiepolitik/umweltminister-altmaier-energiewende-koennte-bis-
zu-einer-billion-euro-kosten-12086525.html
15.10.2013 Steigende EEG-Umlage Die Industrie macht ihren Strom selbst
http://www.faz.net/aktuell/politik/energiepolitik/steigende-eeg-umlage-die-industrie-macht-ihren-
strom-selbst-12618930.html
05.02.2014 Bayern zieht Stromnetzausbau in Zweifel
http://www.faz.net/aktuell/wirtschaft/fruehaufsteher/exklusiv-in-der-f-a-z-bayern-zieht-
stromnetzausbau-in-zweifel-12590891.html
19.02.2014 Ökostrom EEG-Umlage: Welche Firmen müssen künftig zahlen?
http://www.faz.net/aktuell/wirtschaft/wirtschaftspolitik/oekostrom-eeg-umlage-welche-firmen-
muessen-kuenftig-zahlen-12808022.html
Handelsblatt
07.11.2013: Altmaier reist mit radikalem Ökostrom-Plan zur EU
http://www.handelsblatt.com/politik/international/foerderung-metallindustrie-eine-million-jobs-
bedroht/9039578-2.html
06.01.2014 „Der Trend zum eigenen Kraftwerk“ http://www.handelsblatt.com/technologie/das-
technologie-update/energie/industrie-der-trend-zum-eigenen-kraftwerk/9291960.html
24.02.2014 Industrie bangt um Stromrabatte http://www.handelsblatt.com/technologie/das-
technologie-update/energie/grossverbraucher-industrie-bangt-um-stromrabatte/9528744.html
Wirtschaftswoche
12.07.2013 EEG-Umlage: Gefährden Industrie-Ausnahmen die-Energiewende?
http://green.wiwo.de/eeg-umlage-gefahrden-industrie-ausnahmen-die-energiewende/
05.02.2014 Reservekraftwerke werden Milliarden verschlingen
http://www.wiwo.de/politik/deutschland/energiewende-reservekraftwerke-werden-milliarden-
verschlingen/9412340.html
Der Spiegel
18.12.2013 Ökostrom-Rabatte: EU leitet Verfahren gegen Deutschland ein – Der Spiegel Online
http://www.spiegel.de/wirtschaft/soziales/eu-kommission-greift-deutsche-industrie-an-a-939795.html
Die Welt:
07.11.2013 Ende der EEG-Privilegien gefährdet eine Million Jobs
http://www.welt.de/wirtschaft/energie/article121621919/Ende-der-EEG-Privilegien-gefaehrdet-eine-
Million-Jobs.html
73
14.12.2013 Höhere Ökostrom-Umlage kostet 86.000 Jobs
http://www.welt.de/wirtschaft/article122930122/Hoehere-Oekostrom-Umlage-kostet-86-000-
Jobs.html
Tagesschau
19.01.2014 Gabriel im Bericht aus Berlin "Strompreise werden nicht sinken"
http://www.tagesschau.de/inland/bab-gabriel100.html
Wall Street Journal
01.08.2013 U.S. Oil Reserves Continue to Bulge
http://online.wsj.com/news/articles/SB10001424127887323681904578641871449942246
Financial Times
29.01.2014 Energy price gap with the US to hurt Europe for ‘at least 20 years’
http://www.ft.com/cms/s/0/80950dfe-8901-11e3-9f48-00144feab7de.html#axzz2thyHzZc8
16.02.2014: Private equity retreats from renewables ‘fad’ http://www.ft.com/cms/s/0/ef1b2248-94bb-
11e3-9146-00144feab7de.html
Reuters
26.08.2013 EU's Oettinger warns against Germany cutting renewable subsidies
http://uk.reuters.com/article/2013/08/26/uk-renewables-eu-idUKBRE97P0FS20130826
Renewables International
01.08.2013 Spanish solar FITs revisited http://www.renewablesinternational.net/spanish-solar-fits-
revisited/150/510/71701/
22.08.2013 Prague to implement retroactive solar tax (again)
http://www.renewablesinternational.net/prague-to-implement-retroactive-solar-tax-
again/150/452/72232/
PV Magazine
16.12.2010 Czech President approves controversial solar tax http://www.pv-
magazine.com/news/details/beitrag/czech-president-approves-controversial-solar-
tax_100001824/#axzz2pp6Ajpms
19.09.2012 Bulgaria: Up to 39% retroactive grid fee for PV operators http://www.pv-
magazine.com/news/details/beitrag/bulgaria--up-to-39-retroactive-grid-fee-for-pv-operators-
_100008536/#ixzz2uRTtu9GB
19.12.2012 EU solar industry calls for action against retroactive subsidy changes http://www.pv-
magazine.com/news/details/beitrag/eu-solar-industry-calls-for-action-against-retroactive-subsidy-
changes_100009663/#axzz2pp6Ajpms
14.02.2013: Greece prepares for more retroactive PV cuts http://www.pv-
magazine.com/news/details/beitrag/greece-prepares-for-more-retroactive-pv-
cuts_100010212/#axzz2tI1WNo7u
26.03.2013 Bulgaria: Photovoltaic grid access fee revoked; appeals underway http://www.pv-
magazine.com/news/details/beitrag/bulgaria--photovoltaic-grid-access-fee-revoked-appeals-
underway_100010684/
PV Tech
26.11.2012 France retroactively cuts FiT by 20% http://www.pv-
tech.org/news/france_retroactively_cuts_fit_by_20
74
Cleantechnica
17.02.2013 Why German Solar Is So Much Cheaper Than U.S. Solar — Updated Study
http://cleantechnica.com/2013/02/17/why-german-solar-is-so-much-cheaper-than-u-s-solar-updated-
study/
ET Energiewirtschaftliche Tagesfragen
07/2013 Zur vermeintlichen „Grid Parity“ von Photovoltaik-Anlagen http://et-energie-
online.de/AktuellesHeft/Topthema/tabid/70/Year/2013/Month/7/NewsModule/423/NewsId/633/Zur-
vermeintlichen-Grid-Parity-von-PhotovoltaikAnlagen.aspx#fn:7
Markt und Mittelstand Nachrichten
26.08.2013 Schutz vor EEG: Unternehmen produzieren Strom selbst
http://www.marktundmittelstand.de/nachrichten/finanzierung/schutz-vor-eeg-unternehmen-
produzieren-strom-selbst/
Umweltdienstleister
16.01.2014 Netzentwicklungsplan bestätigt
http://umweltdienstleister.de/2014/01/16/netzentwicklungsplan-bestaetigt/
Solarify
06.04.2013 Netzausbauplan übertrieben: Akzeptanz der Energiewende bedroht
http://www.solarify.eu/2013/04/06/netzausbauplan-ubertrieben-akzeptanz-der-energiewende-bedroht/
TAM-News 14.03.2013 and 29.04.2013
Instituts zur Zukunft der Arbeit (IZA)
16.12.2013 Moderater Beschäftigungsrückgang durch steigende Strompreise
http://newsroom.iza.org/de/2013/12/16/moderater-beschaeftigungsrueckgang-durch-steigende-
strompreise
The Ministry for Climate Protection, Environment, Agriculture, Nature Conservation and
Consumer Protection of the German State of North Rhine-Westphalia
17.01.2014 Fachministerinnen und Fachminister aus sieben Bundesländern fordern
Gemeinschaftswerk in der Energie- und Klimapolitik
http://www.umwelt.nrw.de/ministerium/presse/presse_aktuell/presse140117.php
Renewable Energy World
26.08.2013 Norway Approves $3 Billion for Wind Power Plants to Triple Capacity
http://www.renewableenergyworld.com/rea/news/article/2013/08/norway-approves-3-billion-for-
wind-power-plants-to-triple-capacity
Research papers and studies
IZES (Instituts für ZunkunftsEnergieSysteme)
2012 “Das Erneuerbare-Energien-Gesetz –Erfahrungen und Ausblick“ Institut der deutschen
Wirtschaft Köln, - “http://blog.insm.de/4770-quotenmodell-versus-einspeisevergutung-aus-der-praxis-
lernen/)
http://www.greenpeace.de/themen/energie/nachrichten/artikel/warum_das_eeg_besser_ist_als_ein_qu
otenmodell/)
Forum Ökologisch-soziale Marktwirtschaft
Strom- und Energiekosten der Industrie
http://www.greenpeace.de/fileadmin/gpd/user_upload/themen/energie/2012-FOES-IZES-
Verguenstigungen-Industrie.pdf
75
EEG- Jobmotor oder Jobkiller? www.energie-fakten.de/pdf/eeg-job-motor.pdf
Ecofys Group
28.08.2013 Renewable energy deployment possible even with delays in transmission grid expansion –
Impacts of restricted transmission grid expansion
Congressional Research Service
Europe’s Energy Security: Options and Challenges to Natural Gas Supply Diversification
http://www.fas.org/sgp/crs/row/R42405.pdf
Federal Ministry for the Environment, Nature Conservation and Nuclear Safety
14.03.2012 Gross employment from renewable energy in Germany in 2011
http://m.germany.info/contentblob/3146650/Daten/1312974/BMU_GrosEmploymentRE2010_DD.pdf
Public Institutions
German Federal Ministry for the Environment, Nature Conservation, Building and
Nuclear Safety
development of renewable energy sources in Germany:http://www.erneuerbare-energien.de/die-
themen/datenservice/zeitreihen-entwicklung-ab-1990
Hintergrundinformationen zur besonderen Ausgleichsregelung 2012/2013: www.erneuerbare-
energien.de/.../ee.../hintergrundpapier_besar_bf.pdf
German Federal Network Agency
How will the power price calculated?
http://www.bundesnetzagentur.de/SharedDocs/Downloads/DE/Sachgebiete/Energie/Verbraucher/Preis
eUndRechnungen/WieSetztSichDerStrompreisZusammen.pdf;jsessionid=0B318530B0B7F0F3325CB
5CA631C83F7?__blob=publicationFile&v=2
List of power plants in Germany:
http://www.bundesnetzagentur.de/DE/Sachgebiete/ElektrizitaetundGas/Unternehmen_Institutionen/Ve
rsorgungssicherheit/Erzeugungskapazitaeten/Kraftwerksliste/kraftwerksliste-node.html
Monitoring report 2013
http://www.bundesnetzagentur.de/SharedDocs/Downloads/DE/Allgemeines/Bundesnetzagentur/Publik
ationen/Berichte/2013/131217_Monitoringbericht2013.pdf?__blob=publicationFile&v=9
Grid development 2013
http://www.netzausbau.de/SharedDocs/Downloads/DE/II/NEP/ZFStromnetzausbau2013.pdf?__blob=
publicationFile
Grid development plan
http://www.netzentwicklungsplan.de/content/wie-funktioniert-die-erstellung-des-
netzentwicklungsplans
Press release: 2013 Grid Development Plan, second draft_17.07.2013:
http://www.netzentwicklungsplan.de/sites/default/files/pressematerial/Presse%20release_GDP_2013_s
econd%20draft.pdf
http://www.netzentwicklungsplan.de/content/fragen-zur-finanzierung
Agency for renewable Energy
www.unendlich-viel-energie.de
http://www.unendlich-viel-energie.de/themen/wirtschaft/arbeitsplaetze
76
German Association of Energy and Water Industries (BDEW)
Power Price analysis May 2013
https://www.bdew.de/internet.nsf/id/05B6EBC2BF77350DC1257AD700582730/$file/130527_BDEW
_Strompreisanalyse_Mai%202013_presse.pdf
via KWH-Preis http://www.kwh-preis.de/strompreis-dossier-teil-3-vergleich-strompreise-industrie-
und-privathaushalt
Netztransparenz EEG-KWK Informationsplattform der deutschen
Übertragungsnetzbetreiber
Prognosekonzepte und Berechnungen der Übertragungsnetzbetreiber 2008-2014 http://www.eeg-
kwk.net/de/EEG-Umlage.htm
FRAUNHOFER INSTITUTE FOR SOLAR ENERGY SYSTEMS ISE
08.02.2013 Electricity production from solar and wind in Germany in 2012;
http://www.ise.fraunhofer.de/en/downloads-englisch/pdf-files-englisch/news/electricity-production-
from-solar-and-wind-in-germany-in-2012.pdf
09.01.2014 Electricity production from solar and wind in Germany in 2013;
http://www.ise.fraunhofer.de/en/downloads-englisch/pdf-files-englisch/news/electricity-production-
from-solar-and-wind-in-germany-in-2013.pdf
Office of Gas and Electricity Markets (OFGEM)
https://www.ofgem.gov.uk/publications-and-updates/understanding-energy-prices
https://www.ofgem.gov.uk/gas/retail-market/monitoring-data-and-statistics/electricity-and-gas-supply-
market-indicators
European Commission (incl. Eurostat)
Electricity and natural gas price statistics (updated November 2013):
http://epp.eurostat.ec.europa.eu/statistics_explained/index.php/Electricity_and_natural_gas_price_stati
stics
“Delivering the internal electricity market and making the most of public intervention” November 5th
2013 http://ec.europa.eu/energy/gas_electricity/doc/com_2013_public_intervention_en.pdf
The future role of gas. Presentation to the European Commission Directorate-General for Energy,
Madrid Forum, April 18-19, 2013. http://ec.europa.eu/energy/gas_electricity/gas/doc-
23/02.01_mf23_presentation_by_ec_-_future_role_of_gas_-_kitti_nyitrai.pdf
Share of renewables in electricity production (2012):
http://epp.eurostat.ec.europa.eu/statistics_explained/index.php?title=File:Share_of_renewables_in_ele
ctricity_production,_2012_%28in_%25%29.png&filetimestamp=20130429062902
Legal sources on renewable energy: http://www.res-legal.eu/search-by-country/norway/tools-
list/c/norway/s/res-e/t/promotion/sum/378/lpid/379/
European Renewable Energy Council
http://www.erec.org/statistics/co2.html
REN21: Renewable Energy and Policy Network for the 21
st
Century
About REN 21: http://www.ren21.net/AboutREN21.aspx
Renewables 2013 Global Status Report
http://www.ren21.net/Portals/0/documents/Resources/GSR/2013/GSR2013_lowres.pdf
EU Fuel Poverty Network
http://fuelpoverty.eu/about/

77
Fuel Poverty: a Framework for Future Action, Department of Energy and Climate Change, July 2013
Statuette - Norway’s national main grid owner and operator
grid development plan 2013 -
http://www.statnett.no/Global/Dokumenter/Prosjekter/Nettutviklingsplan%202013/Statnett-
Nettutviklingsplan2013-engelsk_03korr.pdf
Norwegian Ministry of Petroleum and Energy
Facts 2013: Energy and water resources in Norway
http://www.regjeringen.no/upload/OED/Faktaheftet/FACTS_energy_water.pdf
Transmission and Distribution grid http://www.regjeringen.no/en/dep/oed/Subject/energy-in-
norway/The-transmission-and-distribution-grid.html?id=444385
Norwegian Renewable Energy http://www.intpow.no/?categoryid=47
Statistics Norway – Statistisk sentralbyrå www.ssb.no
Nord pool Spot http://www.nordpoolspot.com/Market-data1/Elspot/Area-Prices/ALL1/Hourly/
The Swedish-Norwegian Electricity Certificate Market Annual Report 2012 -
http://www.nve.no/Global/Elsertifikater/Elcertifikat2013_Eng_TA%20(2).pdf
Other
European Energy Exchange www.eex.de
E.ON http://www.eon-schafft-transparenz.de/
Fitch Ratings: “ 2014 Outlook: Energy Infrastructure EMEA - Stable Except for Renewables”.
December 11, 2013 www.fitchratings.com
Tennet. www.tennet.eu
Speech of Gregg Kantor Chairman of American Gas Association, NARUC Winter
Committee Meetings, February 11, 2014
Wikipedia
http://de.wikipedia.org/wiki/Erneuerbare-Energien-Gesetz#Photovoltaik
01.11.2013: Speech of Thomas Barth, CEO and Chairman of the Managing Board, E.ON
Energie AG: “The German Energiewende”:Shining or Warning Example for Europe? 5th
Conference ELECPOR http://www.elecpor.pt/pdf/Thomas%20Barth_ELECPOR_Nov2013.pdf
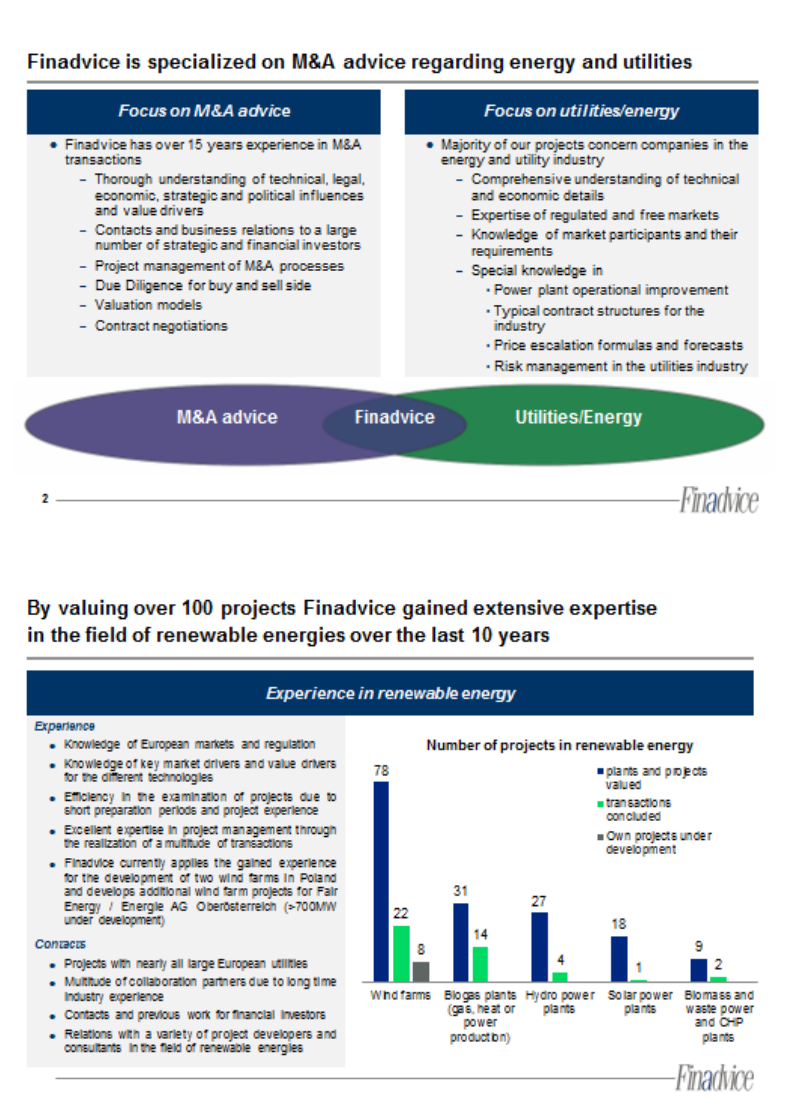
78
References to Finadvice and the Authors

79
Authors:
Hans Poser, Managing Director, FAA Financial Advisory AG
Hans Poser is one of the founders of Finadvice. He has extensive experience in Germany, France, and
Switzerland. Hans’ specialist sector experience is utilities in continental Europe. Before Finadvice, Hans
was Vice President of the European Utilities Team of UBS Investment Bank Zurich and provided M&A
and strategic advice. Prior to that, he was a project leader in the Energy and Utilities Practice Group of
BCG Frankfurt. Hans holds a Master of Engineering from the Technical University of Berlin and a
DESCAF (similar to MBA) from Toulouse Business School.
Jeffrey Altman, Senior Advisor, Finadvice GmbH
Jeffrey Altman has more than 20 years of infrastructure and energy experience. Most recently, Jeffrey
was Director of Investment Management at First State Investments' European Diversified Infrastructure
Fund and was a member of the holding company board of Electricity North West, the electric distribution
company for the City of Manchester, UK. He served 10 years in both the United States and Europe with
Southern Company/Mirant Corporation. During this time, he spent five years successfully privatizing and
restructuring Berlin's electric and gas utilities. While in the United States, Jeffrey initiated, negotiated,
structured, and closed value-creating transactions for Southern Company, as well as developed several
strategic plans, including a recommendation not to enter into the California retail energy market. Jeffrey
has a Masters of Business Administration (Executive MBA Program) from the University of Southern
California and a Bachelor of Science in the School of Foreign Service from Georgetown University. He is
the editor of the book Best Practice in Infrastructure Asset Management, and has authored several
articles.
Felix ab Egg, Managing Director, FAA Financial Advisory AG
Since 2005, Felix ab Egg has advised on more than 90 M&A projects (27 successful transactions) with
respect to every step of the utility value chain, on behalf of Swiss and German utilities. His current
primary focus is renewable energy transactions, where he has advised on more than 40 projects (11
successful transactions). Additionally, Felix advises on risk management, financings, and strategic
analyses, and is also involved with Finadvice's in-house wind park development in Poland. He also
worked as an author for the publisher Neue Zürcher Zeitung. Felix studied at the Universities of Lausanne
and Basel and graduated with a lic. rer. pol. (MBA equivalent).
Andreas Granata, Intern, FAA Financial Advisory AG
Andreas Granata is an intern at the Finadvice Office in Zurich. He is trying to consolidate his
competences and gain additional experience in the renewable energy sector, as well as corporate finance
area. He is currently enrolled in the Master of Science in Management program at the Università
Commerciale Luigi Bocconi in Milan, as well as the CEMS Master in Management, issued by a global
alliance of 29 leading international universities.
Ross Board, Renewable Energy Investment Executive, Downing LLP
Ross Board, a Renewable Energy Investment Executive at Downing LLP, is responsible for deploying
private-equity capital into utility-scale UK energy projects. Prior to joining Downing, Ross served within
one of the UK’s largest solar developers, working on numerous sell-side M&A transactions. Ross is
currently enrolled in Warwick Business School’s Global Energy MBA, focusing on financing of energy
assets and international energy policy.

FAA Financial Advisory AG (Finadvice) is an M&A advisor specialised on
the utility industry (electricity, gas and water) and renewable industry in
Continental Europe with offices in Germany, Switzerland, Austria, Czech
Republic, Poland and Romania as well as having partners in most other
European countries.
Since 1998, Finadvice has advised utility companies, energy trading com-
panies and renewable companies as well as those institutional and in-
frastructure/PE investors investing in these sectors. Finadvice provides a
range of advisory services with respect to investment decisions, including
valuations, due diligence, regulation and economics calculation. Finadvice
is 100% management-owned and has been supporting many of its clients
since the foundation of the company. Most of the partners have over 20
years of professional experience and the total group has around 300 years
of experience with merger & acquisition projects and related services.
Collectively, Finadvice has worked on more than 250 projects worth over
Euro 52B since its foundation, which includes over 150 renewable energy
assets.
For further information, please see www.finadvice.ch
Finadvice
FAA Financial Advisory AG
Soodstrasse 55
CH-8134 Adliswil
Switzerland
Office: +41 43 377 1000
Fax: +41 43 377 1005
Website: www.finadvice.ch
