GDP compact
Grid Development Plan Electricity 2037 with
Outlook 2045, Version 2023, second draft

Grid Development Plan Electricity 2037 / 2045, Version 2023, second draft 2
GDP compact
50Hertz Transmission GmbH
Heidestraße 2
10557 Berlin, Germany
www.50hertz.com
Amprion GmbH
Robert-Schuman-Straße 7
44263 Dortmund
www.amprion.net
TenneT TSO GmbH
Bernecker Straße 70
95448 Bayreuth, Germany
www.tennet.eu
TransnetBW GmbH
Pariser Platz
Osloer Straße 15–17
70173 Stuttgart, Germany
www.transnetbw.de
Editorial staff
Volker Gustedt (50Hertz Transmission GmbH),
Birte Greve (Amprion GmbH),
Christian Brehm (TenneT TSO GmbH),
Claudia Halici (TransnetBW GmbH)
Email: [email protected]
www.netzentwicklungsplan.de
Design
CBE DIGIDEN AG
www.cbe-digiden.de
Dated
26 June 2023
Imprint
All graphics, tables and texts from the second draft of the Grid Development Plan Electricity 2037 / 2045, Version 2023 are licensed under
Creative Commons licence CC BY 4.0. The text of the licence is available at creativecommons.org/licenses/by/4.0/legalcode
An example for proper referencing is: Grid Development Plan Electricity 2037 / 2045, (2023), second draft | Transmission system operator CC-BY-4.0
For adaptations / edits: Grid Development Plan Electricity 2037 / 2045, (2023), second draft | Transmission system operators (M) CC-BY-4.0
Excluded from this rule are graphics, tables and texts with a different or additional source. The overview maps and individual maps can be used with
reference to the source and licence indicated there.

Grid Development Plan Electricity 2037 / 2045, Version 2023, second draft 3
GDP compact
Summary
The transmission system operators (TSOs) with control
area responsibility plan, build and operate new grids for
new energies. In the Grid Development Plan Electricity
(GDP), they present the measures for optimising, rein-
forcing and expanding the German transmission grid. This
includes measures on land as well as the offshore grid
connection systems in the exclusive economic zone and in
the territorial sea in accordance with the legal requirements
of the Energy Industry Act (EnWG).
This GDP 2037 / 2045 (2023) looks at the years 2037 and
2045 and thus also at the statutory target year for achieving
climate neutrality in Germany. It analyses the grid develop-
ment demand for three different scenarios for these years.
This scenario framework is mainly based on the expansion
targets for renewable energy of the Renewable Energy
Act (EEG) 2023. The scenarios differ in their assumptions
regarding the use of hydrogen, the level of direct electri-
fication and the increase in efficiency. Consequently, they
represent a range of potential developments. Moreover,
ad-hoc measures for 2030 were analysed to make it easier
to respond to the stronger expansion of renewable energy
and the likewise increasing gross power consumption in the
short and medium term.
In Germany as well as in Europe, an accelerated ex-
pansion of renewable energy and a strongly rising and
increasingly flexible power demand will point the way
towards a decarbonised society in the coming years. It is
crucial that power is reliably available and can be used
as directly and efficiently as possible. The correspond-
ing expansion and conversion of the transmission grid is
therefore a vital prerequisite for a carbon-neutral future.
The GDP presents the necessary expansion measures in
the transmission grid towards a carbon-neutral grid.
Transport demand grows significantly with
the expansion of renewable energy
To achieve carbon-neutrality in Germany until 2045 and to get
more indepently in terms of energy supply are reflected in
the political targets. Therefore, these political targets are
assumend within the scenario framework for the GDP.
Compared to the last GDP with the observation periods
ending in 2035 and 2040, installed capacity of renewable en-
ergy and gross energy consumption in 2037 and 2045 have
increased significantly. According to Renewable Energy Act
(EEG), the major share of the expansion of renewable ener-
gies is supposed to be implemented by the mid-2030s. The
aim is to enable carbon-neutral power supply to decarbon-
ize other sectors. The development is accelerating by leaps
and bounds. Consequently, this increases the demands on
the transmission grid enormously. The demand for power
transport from northern to southern Germany is expected
to rise significantly to around 87.7 GW by 2037. Between 2037
and 2045 the increase in transport in the scenarios remains
at a similar level or increases only from northern to southern
Germany moderately. The further expansion of renewable
energy can largely be offset by the expansion of flexibilities.
Due to the increasing electrification of the building,
transport and industrial sectors, the total gross power
consumption increases from about 650 to 700 TWh in 2035
of the previous GDP to 899 to 1,053 TWh in 2037 of the cur-
rent GDP. Compared to the last GDP, this corresponds to
an increase of around 40 to 44%. After 2037, gross power
consumption increases further to 1,079 to 1,303 TWh in
2045 according to the scenario framework. To cover this
increase, the installed renewable energy capacity will
have to be expanded to 638 to 703 GW. This corresponds
to almost a fivefold increase in installed renewable energy
capacities by 2045 compared to today.
Expansion of renewable energy
Installed capacity
in GW
Reference
(2020 / 2021)
Target year 2035
(GDP 2021)
Target year 2037
(GDP 2023)
Target year 2045
(GDP 2023)
Photovoltaics 59 110 – 120 345 400 – 445
Offshore wind 8 28 – 34 51 – 59 70
Onshore wind 56 82 – 91 158 – 162 160 – 180
Source: Transmission system operators

Grid Development Plan Electricity 2037 / 2045, Version 2023, second draft 4
GDP compact
In terms of regional distribution, this GDP reveals new
trends. As before, southern and now also increasingly
western federal states tend to experience a generation
deficit in the scenarios, while there is a generation surplus
in northern and north-eastern federal states. The demand
for transport within Germany is still largely determined by
a high feed-in of wind energy in the north and north-east
of Germany and the location of the consumption centres in
the west and south of Germany. Firstly, load flows occur in
the opposite direction – partly due to high generation from
photovoltaics in the south, while electrolyers are opera-
tional in the north.
The national development of the german energy system
are embedded in the European scenario ‘Distributed
Energy’ of the Ten Year Network Development Plan 2022.
This plan accounts for the reduction of EU-wide emissions
manifested at the European level with the target of climate
neutrality by 2050. The Europe-wide balancing of power
and consumption is of vital importance for the reliable and
demand-based design of a carbon-neutral energy system.
This will also reduce the need for flexibility and power
generation capacities in Germany.
Hydrogen gains in importance
Compared to earlier GDPs, the assumptions regarding
the extent of hydrogen utilisation and the expansion of
the hydrogen infrastructure have also increased signifi-
cantly. According to the approved scenario framework, a
comprehensive hydrogen infrastructure is assumed as
early as 2037. In 2045, up to 80 GW of electrolysis capacity
for domestic hydrogen production is supposed to be inte-
grated into the system. The future hydrogen infrastruc-
ture has a major impact on the development needs of the
transmission grid. An extended hydrogen infrastructure
is a prerequisite for grid-supporting allocation of hydro-
gen. This GDP adopts electrolysis locations that support
the grid – a procedure for which currently no regulatory
framework exist. This approach ensures that bottlenecks
in the transmission grid can be minimised and the cur-
tailment of renewable energy in times of high generation
can be reduced as far as possible. Since the corresponding
framework conditions are currently not in place, the ap-
proach is associated with high uncertainties from today’s
perspective. If other criteria are decisive for the allocation
in the future, additional bottlenecks in the transmission
grid are likely to occur.
Progressive interconnection
With the target of tackling the increasing transport de-
mands at the lowest possible investment and redispatch
costs, a higher-level controlling algorithm was used for
the first time in the grid analyses. This metaheuristic
method made it possible to compare several hundred
combinations of expansion options – far more than usual.
Combinations of measures were formed from the cate-
gories of grid connection points (GLP), corridors for High
Voltage Direct Current Transmission lines (HVDC), in-
terconnection of HVDC sites, grid-supporting location
of offsite power-to-gas plants (electrolysers) as well as
load flow control and AC projects in the vicinity of HVDC
and GLP.
The four German TSOs continue to rely on a range of
proven, innovative solutions and technologies and con-
sider potentials of future innovative technologies such as
modern system management concepts and grid boosters.
Transport-bottlenecks identified in the scenarios were not
completely removed by grid enhancement and expansion
measures, so that between 1.5 and 5.9 TWh of redispatch
volume are left. However, no peak capping was applied.
This procedure corresponds to the scenario framework
approval of the German Federal Network Agency (BNetzA).
In order to be able to react to the increasing demands
flexibly and reliably, the TSOs are interconnecting the
transmission grid even further. Since the first GDP in 2012,
the TSOs have focused on linking AC and DC measures.
This GDP now proposes additional measures on linked DC
structures onshore as well as offshore measures among
each other. Together with the European interconnection,
renewable energy can be comprehensively integrated
for flexible demand, and redispatch requirements can be
reduced. This limits congestion management costs and
contributes to a secure energy supply. Furthermore, the
flexibility in grid operations gained through DC linking
increases the security of supply.
Further expansion demand for a carbon-neutral grid
by 2037
The climate neutrality network resulting from this
GDP shows a considerable increase in necessary grid
enhancement and expansion measures. Considering the
increasing transport demand, the measures entrenched
in the current Federal Demand Plan are far from suffi-
cient for a demand-based grid.

Grid Development Plan Electricity 2037 / 2045, Version 2023, second draft 5
GDP compact
The scope and cost volume of the expansion grid will
therefore increase significantly compared to the previ-
ous GDP. Compared to the project portfolio proposed in
the GDP 2035 (2021), the present GDP 2037 / 2045 (2023)
identifies new onshore projects with a route length of
5,620 km and additional investments of EUR 52.3 billion.
This is particularly attributable to the designation of five
additional DC projects, which are necessary to secure
the required transport task and are not yet included
in the current Federal Demand Plan (BBP). Bundling
options with each other or with existing DC projects are
mostly possible or are being examined. The new DC
projects increase the north-south as well as the east-west
transport capacity. Other key drivers for the additional grid
development measures are the strong expansion of re-
newable energy in the north, the dismantling of conven-
tional power plants, the interconnected energy exchange
with foreign countries, and the increasing loads in the
course of achieving climate neutrality in all sectors.
Regarding to the results of the grid development target
grids for the years 2037 and 2045 are almost identical.
This is mainly due to the fact that onshore expansion of
renewable energy between 2037 and 2045 is almost com-
pleted. The moderate increase in onshore renewable en-
ergy capacities by 2045 may cause additional bottlenecks
in the onshore grid. However, it can be offset by the grid
structures in place at that time and correspondingly flex-
ible demand, especially from electrolysers, centralised
and decentralised battery storage as well as demand
side management. A majority of the carbon-neutral grid
must therefore already be implemented in 2037.
Considering these assumptions, the target grid consists
of a robust portfolio of grid enhancement and expansion
measures that are necessary for all scenarios. All projects
presented in GDP 2037 / 2045 (2023) should therefore be
considered to be ‘no-regret’. In the scenarios, the desig-
nated target grid only differs in terms of the remaining
redispatch demand. Currently, there are still high uncer-
tainties due to the not yet fully completed legal planning
for the expansion of renewable energy (including at the
federal states level), the decarbonisation strategies of the
industry or the planning for the future hydrogen economy.
It is important to clarified in the following GDP cycles to
which extent the remaining redispatch can be further
reduced, and especially whether it requires additional
moderate grid expansion or other technical measures.
The onshore initial grid comprises AC and DC measures
totalling around 6,950 km with an estimated investment
volume of EUR 50 billion. For the onshore grid expansion,
grid enhancements AC amount to 6,125 km. Furthermore,
there are about 180 km of DC enhancement measures.
Another 1,714 km are accounted for new AC construction
measures and 4,396 km new DC construction measures.
In total, the onshore expansion grid for all scenarios
includes 12,413 km. For scenarios A / B / C 2037, the in-
vestment costs amount to around EUR 106.1 billion. The
investment costs for the onshore expansion grid of the
A / B / C 2045 scenarios are EUR 0.1 billion higher.
The system stability analyses show considerable addi-
tional demand for reactive power compensation as well
as for the control of grid disconnections in the form of
instantaneous reserve, which already occur in the an-
alysed intermediate scenario 2030. As a consequence,
previously reported plants must be prioritised and made
available via grid-supporting contributions from third
parties (e.g. provision from the distribution grids, from
large consumers such as electrolysers, and other sys-
tem participants, possibly through market procurement).
The analyse on transient stability indicates that control-
lability could no longer be safely guaranteed in individual
hours after conceptual fault clearance in case of distur-
bances. Therefore, in order to maintain system stability,
additional solution concepts must be developed beyond
the suggested measures. The results are presented in
the accompanying document of the stability analyses, and
the necessary measures are indicated.
Compared to the first draft of the GDP 2037 / 2045 (2023),
the investment costs in the second draft of the GDP have
increased by EUR 12.5 billion. This is mainly attributable
to the consideration of additional projects based on addi-
tional demand for transformers and substations between
the distribution and transmission grid. Other contribut-
ing factors include an update of the scope and costs of
existing projects as well as the updated requirements
for plants for reactive power compensation and for the
provision of instantaneous reserve.
The drastic increase in investment costs compared to
the previous GDP is caused by the change in the scope
of projects and measures as well as the adjustment of
standard and project costs resulting from the overall
economic development.

Grid Development Plan Electricity 2037 / 2045, Version 2023, second draft 6
GDP compact
Tapping offshore potential comprehensively
The expansion of the installed capacity from offshore-wind
will continue even after 2037. Compared to today (7.8 GW),
the installed capacity from offshore wind assumed in the
scenarios increases by up to 7.5 times to 58.5 GW in 2037.
By 2045, it further increases to 70 GW of installed capacity.
To integrate offshore wind generation the TSOs have de-
termined offshore grid connection systems in the North
Sea and Baltic Sea with a length of about 6,600 km and a
transmission capacity of about 36 GW in scenario A 2037,
as well as a length of about 9,300 km with a transmission
capacity of about 44 GW in scenarios B 2037 and C 2037.
For long-term scenarios A 2045, B 2045 and C 2045, a
transmission capacity of about 60 GW results in grid con-
nection systems with a length of 13,310 km (excl. initial
grid). Even after 2037, eight more systems with a trans-
mission capacity of 16 GW will be connected.
For the first time, national offshore interconnection is
examined, its benefits are presented and a project with
two measures is identified. Overall, national offshore
interconnection is shown to be a grid-supporting and
cost-efficient expansion measure aimed at minimising
long-range grid bottlenecks.
The investment volume for the offshore grid expansion
until 2037 is about EUR 77 billion for scenario A 2037.
Route kilometres and investment costs of the expansion grid for B / C 2037 (A 2037) offshore and A / B / C 2037 onshore
Route length in km Investment volume in EUR billion
Offshore 9,250 (6,610) 103.5 (77)
Onshore 12,413 106.1
Total 21,663 (19,023) 209.6 (183.1)
Source: Transmission system operators
Scenarios B 2037 and C 2037 require investments of
about EUR 103.5 billion (incl. interconnection). For long-
term scenarios A 2045, B 2045 and C 2045, the estimated
investment costs are around EUR 145.1 billion (incl.
interconnection). Moreover, the investment costs for
the offshore grid expansion measures of the offshore
initial grid that are already being implemented amount
to around EUR 12.4 billion for all scenarios with a route
length of 1,580 km.
Based on the offshore grid connection systems confirmed
by BNetzA in the GDP 2035 (2021), the additional need
for 20 new Offshore grid connection systems with a route
length of approx. 8,455 km and an investment volume of
EUR 86.7 billion was identified in this GDP 2037 / 2045 (2023).
Energy corridors for lower spatial requirements
According to § 12b (3a) of the EnWG (German Energy Act),
the TSOs need to for the first time identify bundling options
for newly identified DC grid expansion measures and the
cross-border onshore part of the offshore connection
lines. It needs to be shown how these measures can be
realised with existing or at least firmly planned routes,
either entirely or to a large extent in one power line corri-
dor. Bundling makes it possible to align offshore connec-
tion systems and newly identified DC projects in the same
route and thus minimise the use of space. According to the
HVDC projects already confirmed in the GDP 2035 (2021)
or submitted for confirmation in the GDP 2037 / 2045 (2023),
there are three central energy corridors based on the
current planning status.
Route kilometres and investment costs for the expansions in scenarios A / B / C 2045
Route length in km Investment volume in EUR billion
Offshore 13,310 145.1
Onshore 12,413 106.2
Total 25,723 251.3
Source: Transmission system operators

Grid Development Plan Electricity 2037 / 2045, Version 2023, second draft 7
GDP compact
The full report with descriptions of all projects for the onshore and offshore grid is available at www.netzentwicklungsplan.de
Shaping the future with determination
The transformation to climate neutrality by one of the
world’s largest industrial nations can only succeed as
a project involving society. It is up to politics, business,
science and citizens to successfully shape this trans-
formation together.
A secure, reliable and efficient transmission grid that keeps
pace with the expansion of renewable energy makes a sig-
nificant contribution to the success of the transformation.
The GDP clearly shows what this transformation means.
Numerous grid development projects throughout Germany,
on land as well as at sea, as enhancement of existing lines
and as new construction need to be explained, decided,
planned, built and operated. Dedicated skilled workers,
available materials at reasonable prices and stable supply
chains are a prerequisite for this.
The implementation of the carbon-neutral grid thus
requires decisive action and joint commitment – from
TSOs and approval authorities, from politicians at
federal, state and local level, as well as other stake-
holders in the energy transition.
Therefore, the follwing is needed:
Faster implementation of grid expansion. The first
important steps to accelerate planning and approval
processes have been taken. They must now be swiftly
put into practice. In order to integrate the very high
output of renewable energy into the power grid by
2037, this GDP presents the carbon-neutral grid that
must be implemented to the greatest possible extent
as early as 2037.
More innovations to reduce the need for grid expan-
sion. One example is the first-time utilisation of
potential through national offshore interconnection.
More flexibility. Appropriate regulatory framework
conditions and sufficient incentives must be created
so that the flexibility potential of new technologies
such as electrolysers can be optimised.This includes
system-supporting locations and utilisation methods.
The same applies to decentralised technologies such
as electric vehicles and heat pumps. In addition to the
provision of communication technologies for control,
suitable market and grid charging structures are
extremely necessary.
An integrated system planning for power, gas and
hydrogen. Even if separate grid planning processes
continue to make sense, they should be based on
jointly agreed scenario key figures in the future.
With its analyses, the GDP not only offers a specific out-
look for the power grid of the next decades, but also a
continuously updated and well-founded information base
for central energy and economic policy decisions. The
biennial rhythm ensures that the latest developments are
reflected, covering market design and price development
to the design of flexibilities or the speed of the expansion
of renewable energy sources. Accordingly, the climate
neutrality network presented in this GDP will also be
further developed in the following GDPs.

Grid Development Plan Electricity 2037 / 2045, Version 2023, second draft 8
GDP compact
Key statements of the chapters
The process of the grid development plan
The demands on the transmission grid are becoming
increasingly complex. Decarbonisation through electri-
fication ensures that ever greater amounts of power are
consumed and in some cases transported over longer
distances. Furthermore, it must be possible to react to
volatile renewable energy generation caused by weather
conditions and to operate the grid more and more flexible.
The continuous development of the power grid is therefore
an important component of a successful energy transition.
According to § 12b EnWG, the four german transmission
system operators with control area responsibility (50Hertz,
Amprion, TenneT and TransnetBW) are obligated to pre-
pare a joint ‘Grid Development Plan Electricity’ document
every two years and submit it to BNetzA for confirmation.
The GDP presents the measures for optimisation, en-
hancement and expansion in the German power transmis-
sion grid as well as the offshore connection systems in the
exclusive economic zone and in the territorial sea, includ-
ing the grid interconnection points on land, considering
the statutory requirements of the EnWG.
Based on the results of GDP, BNetzA determines which
measures are required so that the German transmission
grid can fulfil its future tasks. The calculations in the GDP
are based on the scenario framework previously prepared
by the TSOs and reviewed and approved by BNetzA.
The scenario framework on which this GDP is based con-
siders 2045 and 2037. Considering political targets, it is
assumed that Germany will be climate neutral
1
by 2045
at the leatest. The GDP presents a transmission grid for
a carbon-neutral energy system
1
in Germany for the first
time. It is based on the amendment to the Energy Industry
Act. § 12a of the EnWG was amended as follows: ‘Three
additional scenarios must consider the year 2045 and
present a range of probable developments, which are
aligned with the legally defined climate and energy policy
targets of the Federal Government.’
Therefore, three scenarios were created for each of the
two target years: A, B and C. The GDP 2037 / 2045 (2023)
calculates the grid developments necessary in six different
scenarios.
1
With the GDP, the transmission system operators balance the CO
2
emissions in the domestic power sector. The achievement of targets in other sectors
(such as industry, transport or heat) is outside the scope of our study. Moreover, imports or greenhouse gases used elsewhere are not included in the
CO
2
balance for Germany.

Grid Development Plan Electricity 2037 / 2045, Version 2023, second draft 9
GDP compact
Scenario Framework: Starting point for the
GDP 2037 / 2045 (2023)
The scenario framework for GDP 2037 / 2045 (2023) consid-
ers a carbon-neutral energy system for the first time and
thus forms the basis for a carbon-neutral grid in Germany.
It considers the expansion targets for renewable energy of
Renewable Energy Act 2023.
Scenario A (decarbonisation through higher
share of hydrogen):
This scenario is characterised by the comparatively
highest hydrogen demand in all scenarios. Hydrogen
is increasingly used in some industrial sectors, where
the uncertainty regarding potential electrification still
seems high today. To meet this demand, a high domestic
installed capacity is assumed in this scenario. Gross
power consumption increases to around 1,050 TWh
in 2045. The renewable capacities correspond to the
targets of the Renewable Energy Act (EEG) and the
Offshore Wind Power Act (WindSeeG).
Scenario B (decarbonisation through intensive
electrification):
Scenario B relies on increased direct electrification in all
final energy consumption sectors. Hydrogen is only used
in applications where such direct electrification seems
unlikely from today’s perspective. Efficiency counteracts
a strong increase in power consumption. The increase in
power consumption is thus limited to just under 1,100 TWh.
The renewable expansion path corresponds to the targets of
the Renewable Energy Act (EEG) and Offshore Wind Power
Act (WindSeeG).
Scenario C (decarbonisation despite lower efficiency):
Scenario C also assumes increased direct electrification
in all final energy consumption sectors. Lower efficiency
than in scenario B results in higher power consumption of
almost 1,300 TWh. This is also accompanied by the need
for stronger expansion of renewable energy.
Grid Development Plan Electricity 2037 / 2045, Version 2023, second draft 10
GDP compact
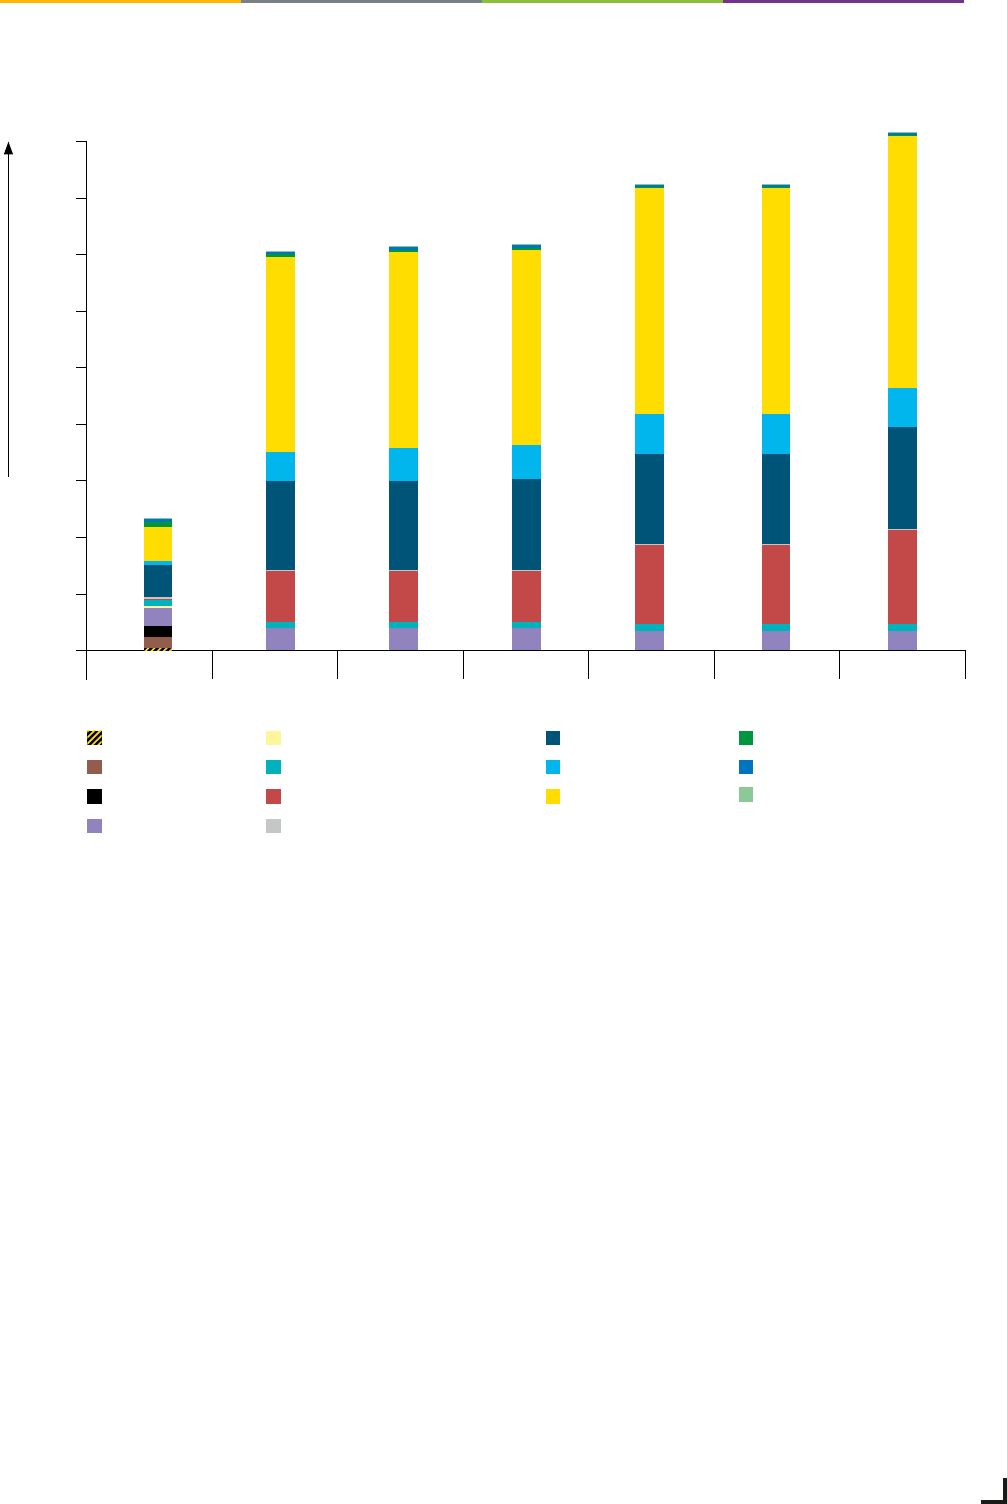
Overview of the distribution of installed capacities per energy source
0
300
400
500
600
200
100
700
800
900
Nuclear
Lignite
Coal
Natural gas/hydrogen
Oil
Pumped storage
Battery storage
other conventional generation*
Wind onshore
Wind offshore
Photovoltaics
Biomass
Hydropower
other renewable generation
* other conventional generation plus 50% waste
C 2045B 2045A 2045C 2037B 2037A 2037Reference
2020 / 2021
Installed capacity in GW
Figure 4: Overview of the distribution of installed capacities per energy source
Source: Transmission system operators
Source: Transmission system operators
Grid Development Plan Electricity 2037 / 2045, Version 2023, second draft 11
GDP compact
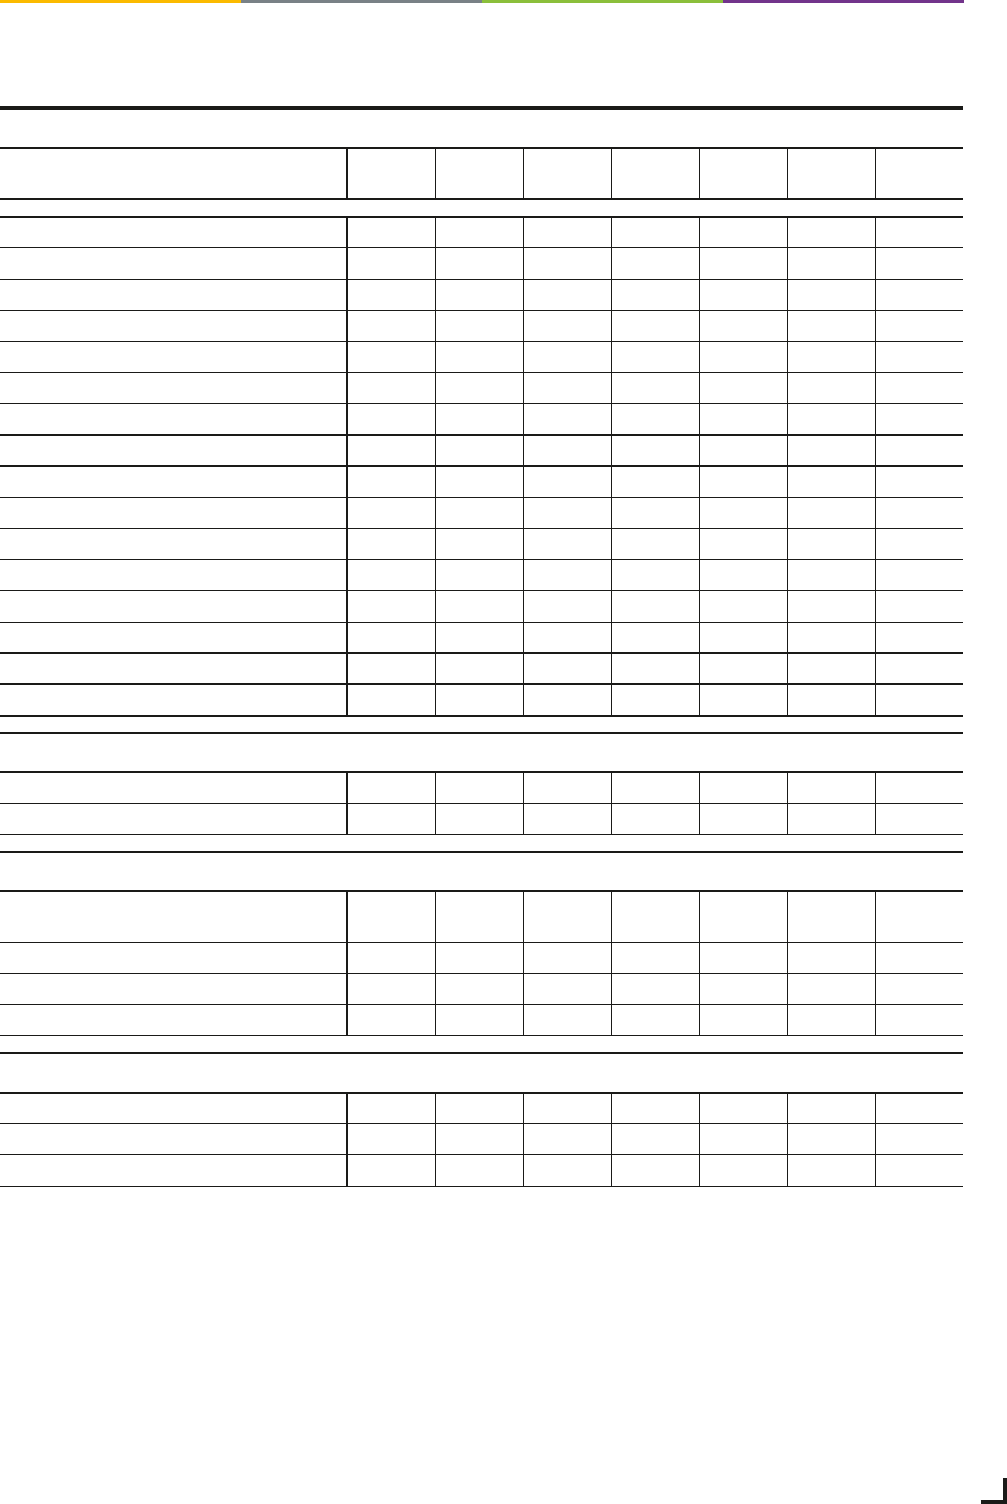
Installed capacity in GW
Energy source
Reference
2020 / 2021
A 2037 B 2037 C 2037 A 2045 B 2045 C 2045
Nuclear 4.1 0.0 0.0 0.0 0.0 0.0 0.0
Lignite 18.9 0.0 0.0 0.0 0.0 0.0 0.0
Coal 19.0 0.0 0.0 0.0 0.0 0.0 0.0
Natural gas/hydrogen* 32.1 > 38.4 > 38.4 > 38.4 > 34.6 > 34.6 > 34.6
Oil 4.7 0.0 0.0 0.0 0.0 0.0 0.0
Pumped storage 9.8 12.2 12.2 12.2 12.2 12.2 12.2
other conventional generation** 4.3 1.0 1.0 1.0 1.0 1.0 1.0
Total conventional generation 92.9 > 51.6 > 51.6 > 51.6 > 47.8 > 47.8 > 47.8
Wind onshore 56.1 158.2 158.2 161.6 160.0 160.0 180.0
Wind offshore 7.8 50.5 58.5 58.5 70.0 70.0 70.0
Photovoltaics 59.3 345.4 345.4 345.4 400.0 400.0 445.0
Biomass 9.5 4.5 4.5 4.5 2.0 2.0 2.0
Hydropower*** 4.9 5.3 5.3 5.3 5.3 5.3 5.3
other renewable generation**** 1.1 1.0 1.0 1.0 1.0 1.0 1.0
Total renewable generation 138.7 564.9 572.9 576.3 638.3 638.3 703.3
Total generation 231.6 616.5 624.5 627.9 686.1 686.1 751.1
Power consumption in TWh
Net power consumption 478 828 891 982 999 1,025 1,222
Gross power consumption 533 899 961 1,053 1,079 1,106 1,303
Drivers of sector coupling
Heat pumps – household and commerce,
trade and services, quantity in millions.
1.2 14.3 14.3 14.3 16.3 16.3 16.3
Electromobility – quantity in millions. 1.2 25.2 31.7 31.7 34.8 37.3 37.3
Power-to-Heat – district heating/industry, in GW 0.8 12.6 16.1 22.0 14.9 20.4 27.0
Electrolysis in GW < 0.1 40.0 26.0 28.0 80.0 50.0 55.0
Further storage and demand-side flexibilities in GW
Photovoltaic battery storage 1.3 67.4 67.4 67.4 97.7 97.7 113.4
Large-scale battery storage 0.5 23.7 23.7 24.2 43.3 43.3 54.5
DSM – industry and commerce, trade and services 1.2 5.0 7.2 7.2 8.9 12.0 12.0
The presented values are from the approval document and a subsequently agreed increase in pumped storage capacity.
Deviations of these values arise in the course of modelling. Due to the large amount of flexible electrical loads and variables,
the exact power consumption will only result from the power market modelling.
* The stated capacities merely include the power plants explicitly allocated with the scenario framework approval, not the additional near-load reserves
reflected in the market simulation.
**
other conventional generation plus 50% waste
***
Storage water and run-of-river water
**** other renewable generation plus 50% waste
Source: Federal Network Agency
Overview of the scenario key figures

Grid Development Plan Electricity 2037 / 2045, Version 2023, second draft 12
GDP compact
Central assumptions of the scenario framework are:
Power sector in pioneering role: The power sector is
highly important for achieving greenhouse gas neutrality
in Germany by 2045. In the context of sector coupling, the
power sector plays a pioneering role and can contribute
significantly to the decarbonisation of other sectors.
Direct electrification seems to be the most efficient
option to replace fossil fuels in many cases.
Developed hydrogen infrastructure: In cases where direct
electrification is associated with higher economic costs
or is not technologically feasible, the use of hydrogen or
synthetic fuels can be advantageous. The scenario frame-
work assumes a comprehensively developed hydrogen
infrastructure by 2037. In the scenarios for 2045, with an
installed capacity of between 50 and 80 GW, a significant
part of the hydrogen demand in Germany is covered by
domestic electrolysis. Bottlenecks in the transmission grid
can be minimised by allocating electrolysers to serve the
grid. Moreover, due to the proximity to renewable energy
plants and a market-oriented operation, the curtailment
of renewable energy in times of high generation can be
largely reduced.
Electrification of the sectors: Due to the increasing elec-
trification of the heating, transport and industrial sector,
gross power consumption is expected to double to 1,300
TWh by 2045 compared to today. The installed capacity
of renewable energy will be expanded to 640 to 700 GW
for this purpose. This corresponds to almost a fivefold
increase in installed capacities from renewable energy
compared to today. In this power system in 2045, which is
dominated by volatile generation, a high demand for flex-
ibility is needed in terms of generation and load capacity.
It is assumed that many power consumers can react flex-
ible to the supply and demand situation and adjust their
consumption accordingly. This ensures an integration with
an great extent of renewable energy and reduces variable
generation costs.
More storage technologies: Demand side management
and storage technologies support the balancing and inte-
gration of renewable power generation. 12 GW of pumped
storage power plants and up to 168 GW of large and small
battery storage are assumed. Hydrogen can be used as an
energy carrier for seasonal storage of renewable energy.
Phasing out coal and nuclear energy: A complete phase-
out of nuclear energy and an end to coal-fired power gen-
eration by 2037 is assumed in all scenarios. Conventional
power plants will still be needed in Germany to provide
secure power generation. To achieve climate neutrality,
these plants must be operated exclusively with hydrogen
or greenhouse gas-neutral fuels by 2045 at the leatest.
European integration: The Europe-wide balancing of
power generation and consumption is of vital importance
for an efficient and demand-based carbon-neutral energy
system. This will reduce the need for flexibility and power
generation capacities in Germany. The national develop-
ment for Germany is embedded in the European scenario
‘Distributed Energy’ of the Ten Year Network Development
Plan 2022.

Grid Development Plan Electricity 2037 / 2045, Version 2023, second draft 13
GDP compact
Market simulation: Focus on renewable
energy and flexible demand
The results of the market simulation highlight the domi-
nant role of renewable energy in Germany’s energy mix. In
all scenarios, power generation from renewable energy
rises to over 1,000 TWh in 2045. The use of conventional
power plant capacities, storage facilities and load-side
flexibilities is strongly aligned with the volatile generation
from renewable energy. Photovoltaics in particular domi-
nate the power system in the summer months and favour
the regular use of storage and electrolysers. Gas power
plants are used almost exclusively in the winter months.
The German power system is supported to a consider-
able extent by power generation from renewable energy,
especially in summer. The number of full load hours of
gas power plants in the scenarios is in some cases signifi-
cantly below 1,000 h/a.
In the various scenarios, Germany develops into a large
net power importer in Europe. This is primarily attrib-
utable to the relatively high domestic power demand and
the high installed capacity of renewable energy abroad.
The imported power increases significantly from 2037 to
2045, in C 2045 presenting the highest increase. Large
amounts of electricity are mainly imported from France,
Austria and Scandinavia in the scenarios.
A significant share of the German hydrogen demand can
be covered by domestic water electrolysis in the scenarios.
Because the hydrogen demand is subject to seasonal
fluctuations, long-term hydrogen storage or hydrogen
imports must be used to operate gas power plants in the
winter months.
The demand for power transport within Germany in-
creases significantly until 2037. By contrast, there is no
longer a significant increase in transport between 2037
and 2045 in the scenarios. Southern and western federal
states tend to experience a generation deficit in the scenar-
ios, while there is a generation surplus in northern and
eastern federal states. The demand for transport within
Germany is largely determined by a high generation of
wind energy in the north and the location of the consump-
tion centres in western and southern Germany. In addition,
load flows occur in the opposite direction due to situations
with high photovoltaic generation in the south.
Depending on the share of carbon-neutral hydrogen for
power generation in 2037, the remaining CO
2
emissions
are reduced. In all three scenarios, the power system
is still responsible for low residual emissions in 2045.
These emissions are attributable to waste incineration
in power plants and must be offset elsewhere to achieve
greenhouse gas neutrality.
Grid Development Plan Electricity 2037 / 2045, Version 2023, second draft 14
GDP compact
Schleswig-Holstein (SH)
Bremen (HB)
Hamburg (HH)
Berlin (BE)
Baden-Württemberg (BW)
Saarland (SL)
in TWh
Natural gas/
Hydrogen
Waste
Reservoir
water
Running
water
Wind
onshore
Wind
offshore
Photo-
voltaics
Biomass
Pumped
storage
Battery
storage
Power con-
sumption***
PtH PtG DSM
Battery
procurement
Pumped storage
procurement
BW
BY
BE
BB
HB
HH
HE
MV
NI
NW
RP
SL
SN
ST
SH
TH
LU (DE)*
AT (DE)*
Total**
Mecklenburg-
Western Pomerania (MV)
Bavaria (BY)
Baden-Württemberg (BW)
Rhineland-Palatinate (RP)
Saxony-Anhalt (ST)
Saxony (SN)
Brandenburg (BB)
Berlin (BE)
Luxembourg (DE)*
Austria (DE)*
Lower Saxony (NI)
*
Generation plants abroad with feed-in to the German transmission grid.
**
Rounding deviations may occur when the individual values are summed.
***
In this presentation, power consumption comprises net power consumption including all grid losses without considering the adjacent power
consumption by power-to-hydrogen and power-to-heat plants (district heating) as well as demand side management. Grid losses in the transmission
grid cannot be clearly allocated to the federal states.
Source: Transmission system operators
Battery storage
Pumped storage
Biomass
Photovoltaics
Wind offshore
Wind onshore
Running water
Reservoir water
Waste
Natural gas/hydrogen
Demand
***
Power-to-Heat
Power-to-Gas
DSM
Battery procurement
Pumped storage procurement
Scale
10 TWh
Thuringia (TH)
North Rhine-
Westphalia (NW)
Hesse (HE)
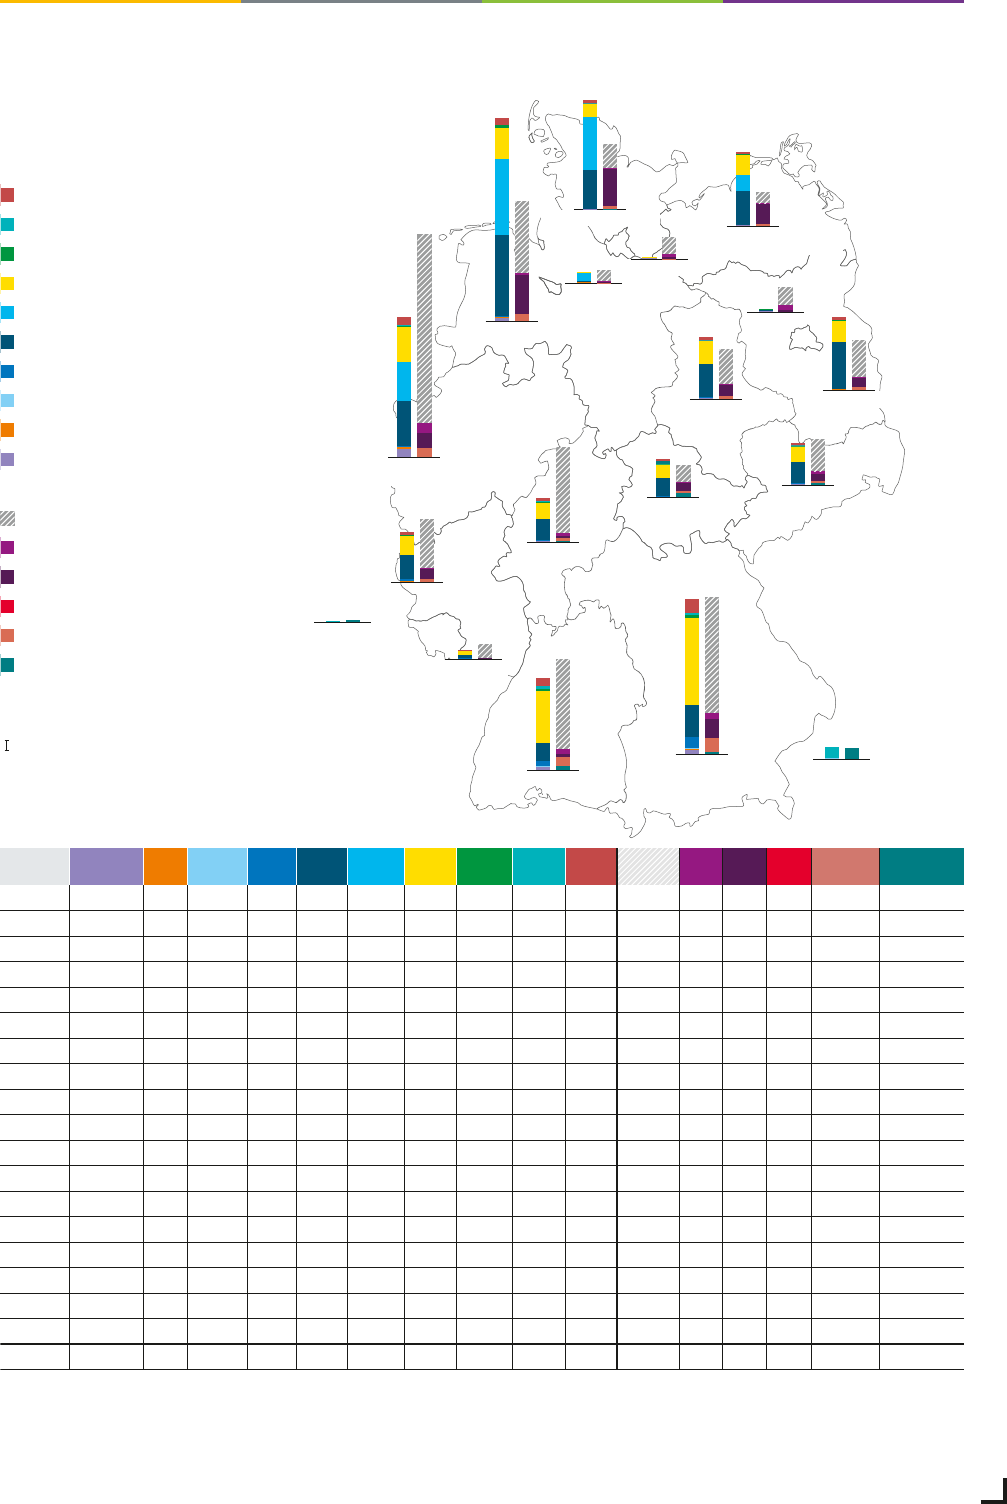
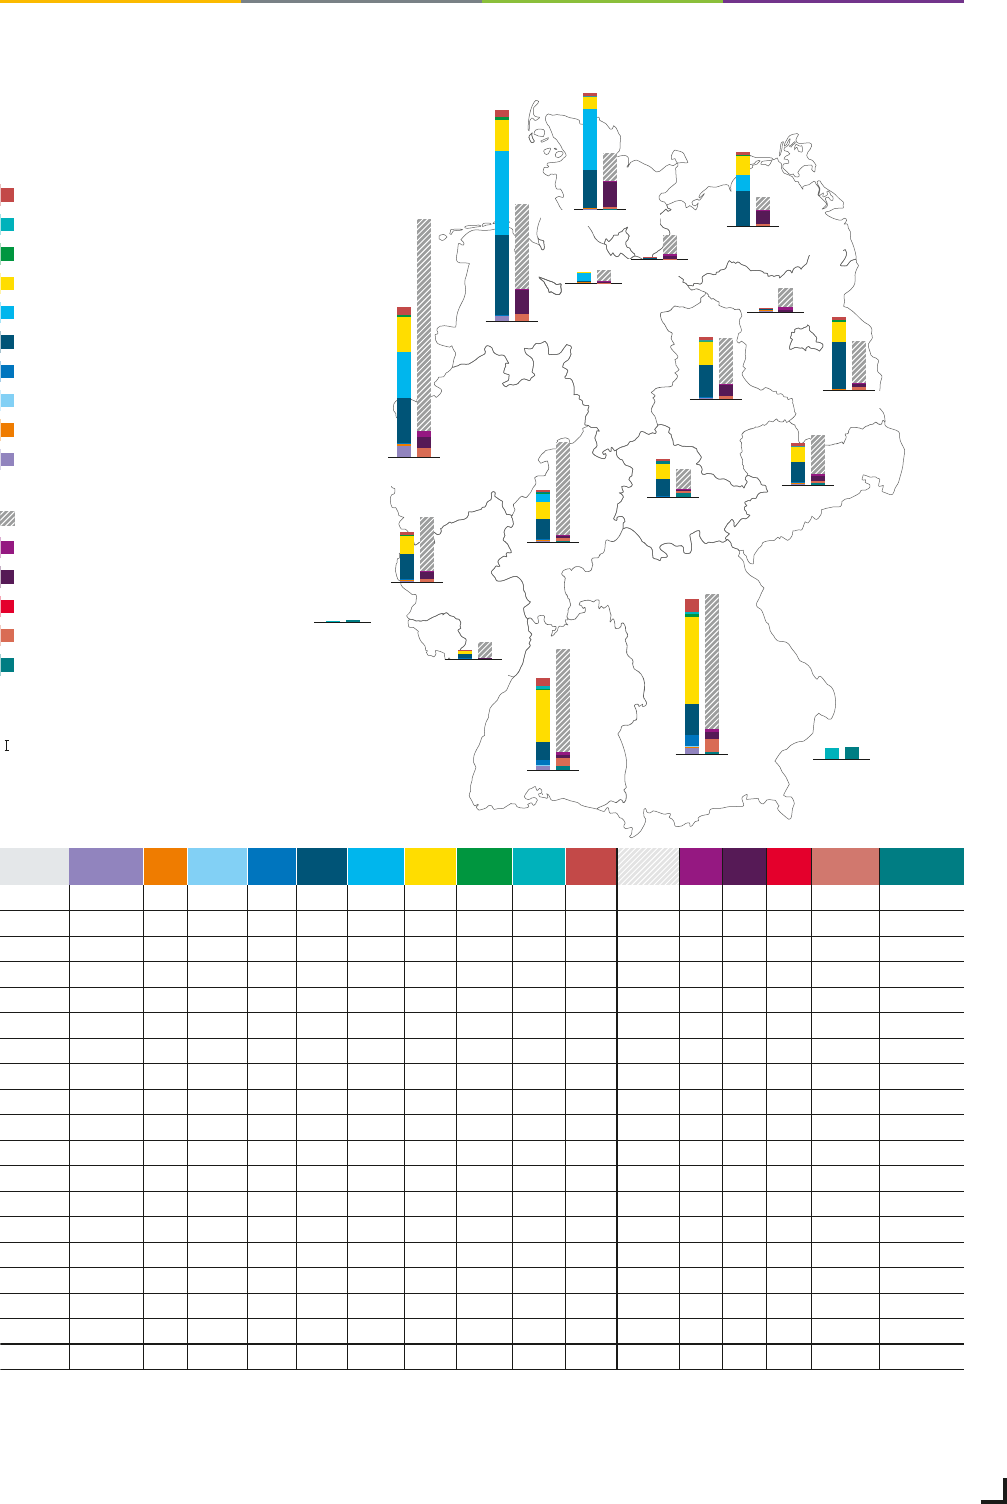
Figure 33: Energy balance in scenario A 2037
A 2037
3.2 0.5 0.1 4.2 15.9 0.0 46.0 1.6 2.8 7.3 79.3 4.8 2.6 -0.1 7.7 3.5
4.0 1.2 0.2 9.9 27.8 0.0 76.8 2.7 2.1 11.9 102.2 4.8 16.9 -0.1 12.5 1.9
1.4 0.2 0.0 0.0 0.3 0.0 0.7 0.1 0.0 0.2 16.1 4.1 1.7 0.0 0.2 0.0
0.6 0.7 0.0 0.0 41.9 0.0 18.0 0.7 0.0 2.8 32.1 0.7 8.7 0.0 2.9 0.0
0.5 0.6 0.0 0.0 0.6 7.6 0.3 0.0 0.0 0.1 9.6 0.6 1.0 0.0 0.1 0.0
0.4 0.1 0.0 0.0 0.3 0.0 0.3 0.1 0.0 0.1 15.3 2.5 1.2 0.0 0.1 0.0
1.0 1.0 0.0 0.3 18.1 0.0 14.7 0.5 0.6 2.7 76.0 2.6 2.0 0.0 2.8 0.7
0.2 0.1 0.0 0.0 31.2 13.9 17.6 0.6 0.0 2.2 10.0 0.5 17.6 0.0 2.3 0.0
3.1 0.6 0.4 0.3 71.6 66.5 28.0 2.8 0.0 5.8 63.2 1.9 34.6 -0.1 6.1 0.0
6.7 2.2 0.3 0.7 39.6 33.7 31.0 1.5 0.1 7.2 166.5 9.0 13.2 -0.1 7.6 0.2
1.1 0.5 0.0 1.0 21.9 0.0 17.0 0.3 0.0 2.8 43.1 1.0 8.9 0.0 2.9 0.0
0.4 0.2 0.0 0.1 3.2 0.0 3.1 0.0 0.0 0.6 12.3 0.4 0.2 0.0 0.6 0.0
1.0 0.1 0.0 0.4 18.3 0.0 13.3 0.5 0.9 2.2 28.6 2.3 6.2 0.0 2.3 1.1
0.8 1.0 0.0 0.1 28.7 0.0 20.7 0.9 0.1 2.7 30.9 0.9 9.8 0.0 2.9 0.1
0.4 0.3 0.0 0.0 34.2 46.9 10.9 0.9 0.1 2.4 20.8 1.1 32.9 0.0 2.6 0.1
0.5 0.1 0.0 0.1 15.5 0.0 12.5 0.4 2.7 1.7 14.9 0.7 7.4 0.0 1.8 3.3
0.0 0.0 0.0 0.0 0.0 0.0 0.0 0.0 0.8 0.0 0.0 0.0 0.0 0.0 1.2
0.0 0.0 0.9 0.0 0.0 0.0 0.0 0.0 9.3 0.0 0.0 0.0 0.0 0.0 9.5
25.3 9.2 2.0 17.3 368.9 168.5 310.6 13.5 19.4 52.6 746.0 37.7 164.9 -0.5 55.3 21.7
NEP 2037/2045, Version 2023, 2. Entwurf – Kapitel 2, Abb. 10–13 – CBE DIGIDEN Entwurf vom 22. Juni 2023, 11:54 AM
Energy balance in scenario A 2037
Grid Development Plan Electricity 2037 / 2045, Version 2023, second draft 15
GDP compact
Schleswig-Holstein (SH)
Bremen (HB)
Hamburg (HH)
Berlin (BE)
Baden-Württemberg (BW)
Saarland (SL)
in TWh
Natural gas/
Hydrogen
Waste
Reservoir
water
Running
water
Wind
onshore
Wind
offshore
Photo-
voltaics
Biomass
Pumped
storage
Battery
storage
Power con-
sumption***
PtH PtG DSM
Battery
procurement
Pumped storage
procurement
BW
BY
BE
BB
HB
HH
HE
MV
NI
NW
RP
SL
SN
ST
SH
TH
LU (DE)*
AT (DE)*
Total**
Mecklenburg-
Western Pomerania (MV)
Bavaria (BY)
Baden-Württemberg (BW)
Rhineland-Palatinate (RP)
Saxony-Anhalt (ST)
Saxony (SN)
Brandenburg (BB)
Berlin (BE)
Luxembourg (DE)*
Austria (DE)*
Lower Saxony (NI)
*
Generation plants abroad with feed-in to the German transmission grid.
**
Rounding deviations may occur when the individual values are summed.
***
In this presentation, power consumption comprises net power consumption including all grid losses without considering the adjacent power
consumption by power-to-hydrogen and power-to-heat plants (district heating) as well as demand side management. Grid losses in the transmission
grid cannot be clearly allocated to the federal states.
Source: Transmission system operators
Thuringia (TH)
North Rhine-
Westphalia (NW)
Hesse (HE)
Battery storage
Pumped storage
Biomass
Photovoltaics
Wind offshore
Wind onshore
Running water
Reservoir water
Waste
Natural gas/hydrogen ****
Demand
***
Power-to-Heat
Power-to-Gas
DSM
Battery procurement
Pumped storage procurement
Scale
10 TWh
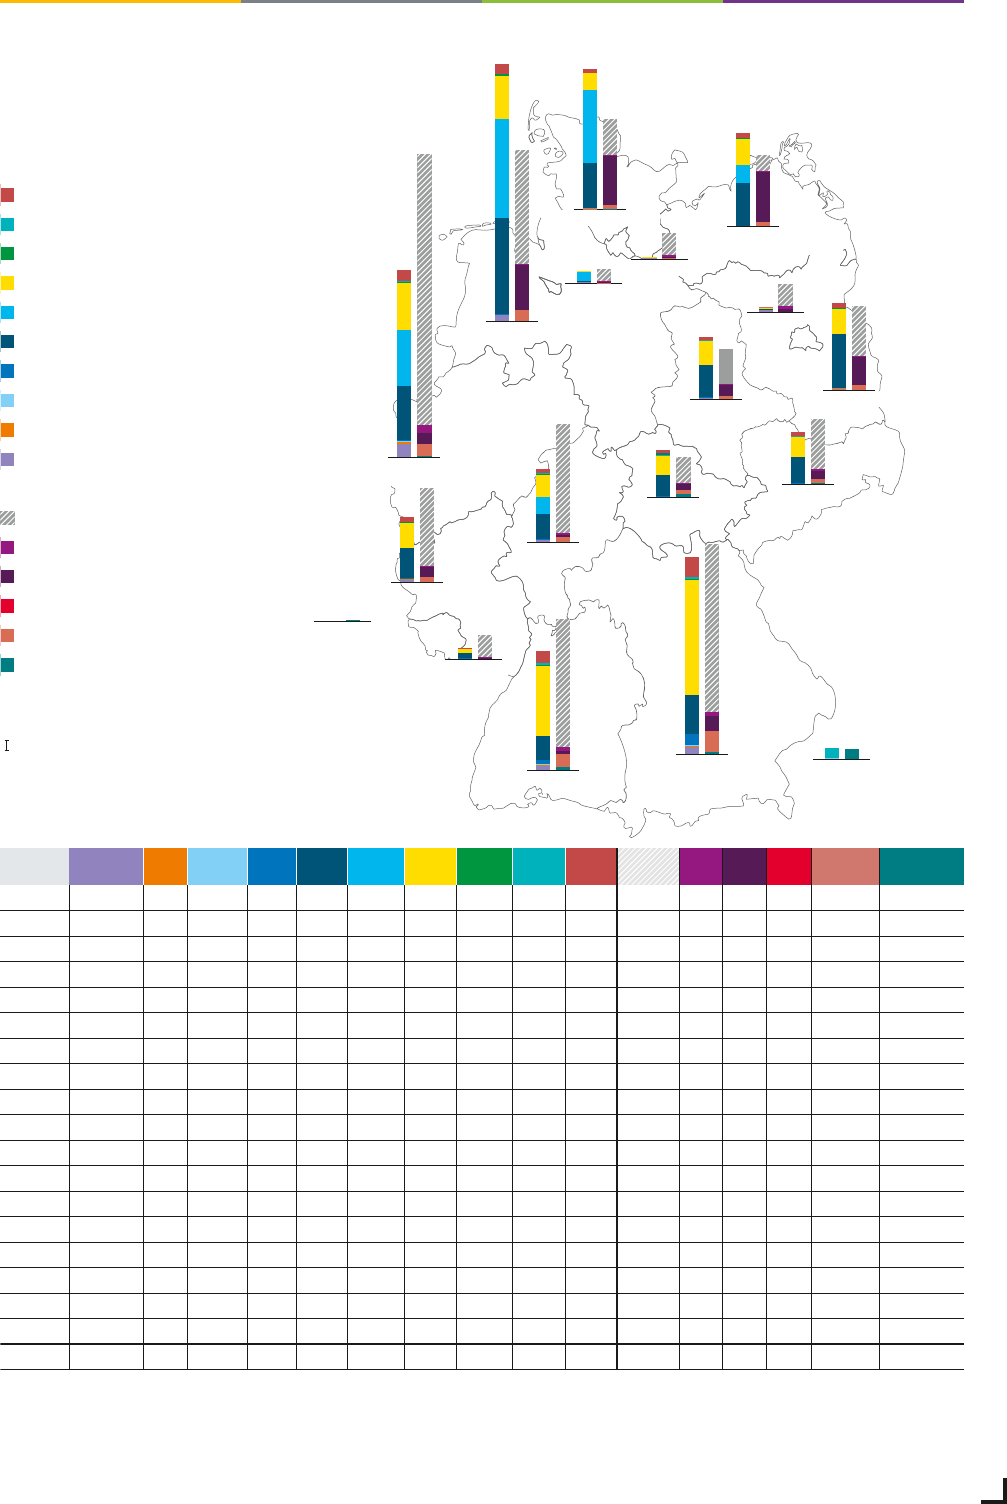
Figure 34: Energy balance in scenario B 2037
B 2037
Natural gas/
hydrogen****
4.0 0.5 0.1 4.2 15.7 0.0 45.7 1.6 2.7 6.9 91.2 2.8 2.2 -0.2 7.3 3.5
5.4 1.2 0.2 9.9 27.5 0.0 76.3 2.7 2.1 11.2 118.8 2.7 6.0 -0.2 11.8 1.9
1.8 0.2 0.0 0.0 0.3 0.0 0.7 0.1 0.0 0.1 16.9 2.1 1.9 0.0 0.2 0.0
0.8 0.8 0.0 0.0 41.5 0.0 17.9 0.7 0.0 2.6 36.8 0.4 3.5 0.0 2.8 0.0
0.6 0.6 0.0 0.0 0.6 7.5 0.3 0.0 0.0 0.1 9.9 0.3 1.0 0.0 0.1 0.0
0.5 0.1 0.0 0.0 0.3 0.0 0.3 0.1 0.0 0.1 16.9 1.4 2.7 0.0 0.1 0.0
1.4 1.0 0.0 0.3 17.9 7.6 14.6 0.5 0.6 2.5 81.7 1.5 1.6 -0.1 2.7 0.7
0.3 0.1 0.0 0.0 30.9 13.8 17.5 0.6 0.0 2.1 11.4 0.3 12.0 0.0 2.2 0.0
4.1 0.6 0.4 0.3 70.8 73.4 27.8 2.8 0.0 5.5 75.2 1.1 21.3 -0.1 5.8 0.0
9.1 2.3 0.3 0.7 39.2 40.9 30.9 1.5 0.1 6.8 187.4 5.1 10.0 -0.3 7.2 0.1
1.5 0.5 0.0 1.0 21.6 0.0 16.9 0.3 0.0 2.6 47.8 0.6 6.4 -0.1 2.8 0.0
0.5 0.2 0.0 0.1 3.2 0.0 3.0 0.0 0.0 0.5 14.2 0.2 0.2 0.0 0.6 0.0
1.3 0.1 0.0 0.4 18.1 0.0 13.2 0.5 0.8 2.0 34.1 1.3 4.7 0.0 2.1 1.1
1.1 1.0 0.0 0.1 28.4 0.0 20.5 0.9 0.1 2.6 40.3 0.5 10.5 0.0 2.7 0.1
0.6 0.3 0.0 0.0 33.9 53.5 10.8 0.9 0.1 2.3 24.7 0.6 22.3 0.0 2.4 0.1
0.6 0.1 0.0 0.1 15.3 0.0 12.4 0.4 2.5 1.6 18.1 0.4 1.4 0.0 1.7 3.1
0.0 0.0 0.0 0.0 0.0 0.0 0.0 0.0 0.8 0.0 0.0 0.0 0.0 0.0 0.0 1.1
0.0 0.0 0.9 0.0 0.0 0.0 0.0 0.0 9.5 0.0 0.0 0.0 0.0 0.0 0.0 9.9
33.7 9.4 2.0 17.3 365.2 196.6 308.7 13.5 19.4 49.8 854.4 21.4 108.0 -1.0 52.3 21.7
NEP 2037/2045, Version 2023, 2. Entwurf – Kapitel 2, Abb. 33–38 – CBE DIGIDEN Entwurf vom 22. Juni 2023, 11:54 AM
Energy balance in scenario B 2037

Grid Development Plan Electricity 2037 / 2045, Version 2023, second draft 16
GDP compact
Schleswig-Holstein (SH)
Bremen (HB)
Hamburg (HH)
Berlin (BE)
Baden-Württemberg (BW)
Saarland (SL)
in TWh
Natural gas/
Hydrogen
Waste
Reservoir
water
Running
water
Wind
onshore
Wind
offshore
Photo-
voltaics
Biomass
Pumped
storage
Battery
storage
Power con-
sumption***
PtH PtG DSM
Battery
procurement
Pumped storage
procurement
BW
BY
BE
BB
HB
HH
HE
MV
NI
NW
RP
SL
SN
ST
SH
TH
LU (DE)*
AT (DE)*
Total**
Mecklenburg-
Western Pomerania (MV)
Bavaria (BY)
Baden-Württemberg (BW)
Rhineland-Palatinate (RP)
Saxony-Anhalt (ST)
Saxony (SN)
Brandenburg (BB)
Berlin (BE)
Luxembourg (DE)*
Austria (DE)*
Lower Saxony (NI)
Thuringia (TH)
North Rhine-
Westphalia (NW)
Hesse (HE)
Figure 35: Energy balance in scenario C 2037
*
Generation plants abroad with feed-in to the German transmission grid.
**
Rounding deviations may occur when the individual values are summed.
***
In this presentation. power consumption comprises net power consumption including all grid losses without considering the adjacent power
consumption by power-to-hydrogen and power-to-heat plants (district heating) as well as demand side management. Grid losses in the transmission
grid cannot be clearly allocated to the federal states.
****
Includes utilisation of reserves near consumption areas.
Source: Transmission system operators
Battery storage
Pumped storage
Biomass
Photovoltaics
Wind offshore
Wind onshore
Running water
Reservoir water
Waste
Natural gas/hydrogen ****
Demand
***
Power-to-Heat
Power-to-Gas
DSM
Battery procurement
Pumped storage procurement
Scale
10 TWh
C 2037
Natural gas/
hydrogen****
5.5 0.5 0.1 4.2 16.4 0.0 46.6 1.6 2.8 7.1 101.2 3.4 1.60 -0.2 7.5 3.6
7.3 1.2 0.2 9.9 28.5 0.0 77.9 2.7 2.1 11.5 131.0 3.4 6.04 -0.3 12.1 1.9
2.4 0.2 0.0 0.0 0.3 0.0 0.7 0.1 0.0 0.2 18.8 2.7 0.97 0.0 0.2 0.0
1.2 0.8 0.0 0.0 42.6 0.0 18.3 0.7 0.0 2.7 38.8 0.5 8.38 0.0 2.8 0.0
0.8 0.6 0.0 0.0 0.6 7.6 0.3 0.0 0.0 0.1 10.5 0.4 0.43 0.0 0.1 0.0
0.7 0.1 0.0 0.0 0.3 0.0 0.3 0.1 0.0 0.1 18.1 1.8 0.74 0.0 0.1 0.0
2.1 1.0 0.0 0.3 18.7 7.6 14.9 0.5 0.6 2.6 87.0 1.9 0.53 -0.1 2.7 0.7
0.5 0.1 0.0 0.0 32.1 14.0 17.9 0.6 0.0 2.1 12.7 0.4 14.55 0.0 2.3 0.0
5.7 0.6 0.4 0.3 73.4 74.3 28.4 2.8 0.0 5.6 82.7 1.3 18.08 -0.1 5.9 0.0
12.8 2.3 0.3 0.7 40.4 41.4 31.5 1.5 0.1 7.0 203.4 6.3 8.43 -0.3 7.3 0.1
2.3 0.5 0.0 1.0 22.5 0.0 17.2 0.3 0.0 2.7 52.0 0.7 6.37 -0.1 2.8 0.0
0.7 0.2 0.0 0.1 3.3 0.0 3.1 0.0 0.0 0.5 15.3 0.3 0.19 0.0 0.6 0.0
1.7 0.1 0.0 0.4 18.9 0.0 13.5 0.5 0.8 2.1 37.2 1.6 3.72 -0.1 2.2 1.1
1.5 1.1 0.0 0.1 29.2 0.0 21.0 0.9 0.1 2.6 42.0 0.7 8.22 0.0 2.8 0.1
0.8 0.3 0.0 0.0 34.8 54.1 11.0 0.9 0.1 2.4 26.6 0.8 21.68 0.0 2.5 0.1
0.8 0.1 0.0 0.1 15.9 0.0 12.6 0.4 2.6 1.6 19.8 0.5 1.86 0.0 1.7 3.2
0.0 0.0 0.0 0.0 0.0 0.0 0.0 0.0 0.8 0.0 0.0 0.0 0.0 0.0 0.0 1.2
0.0 0.0 0.9 0.0 0.0 0.0 0.0 0.0 9.5 0.0 0.0 0.0 0.0 0.0 0.0 9.9
46.6 9.5 2.0 17.3 377.8 199.0 315.1 13.5 19.4 50.7 928.2 26.5 101.8 -1.3 53.4 21.8
NEP 2037/2045, Version 2023, 2. Entwurf – Kapitel 2, Abb. 33–38 – CBE DIGIDEN Entwurf vom 22. Juni 2023, 11:54 AM
Energy balance in scenario C 2037

Grid Development Plan Electricity 2037 / 2045, Version 2023, second draft 17
GDP compact
Schleswig-Holstein (SH)
Bremen (HB)
Hamburg (HH)
Berlin (BE)
Baden-Württemberg (BW)
Saarland (SL)
in TWh
Natural gas/
Hydrogen
Waste
Reservoir
water
Running
water
Wind
onshore
Wind
offshore
Photo-
voltaics
Biomass
Pumped
storage
Battery
storage
Power con-
sumption***
PtH PtG DSM
Battery
procurement
Pumped storage
procurement
BW
BY
BE
BB
HB
HH
HE
MV
NI
NW
RP
SL
SN
ST
SH
TH
LU (DE)*
AT (DE)*
Total**
Mecklenburg-
Western Pomerania (MV)
Bavaria (BY)
Baden-Württemberg (BW)
Rhineland-Palatinate (RP)
Saxony-Anhalt (ST)
Saxony (SN)
Brandenburg (BB)
Berlin (BE)
Luxembourg (DE)*
Austria (DE)*
Lower Saxony (NI)
*
Generation plants abroad with feed-in to the German transmission grid.
**
Rounding deviations may occur when the individual values are summed.
***
In this presentation, power consumption comprises net power consumption including all grid losses without considering the adjacent power
consumption by power-to-hydrogen and power-to-heat plants (district heating) as well as demand side management. Grid losses in the transmission
grid cannot be clearly allocated to the federal states.
Source: Transmission system operators
Battery storage
Pumped storage
Biomass
Photovoltaics
Wind offshore
Wind onshore
Running water
Reservoir water
Waste
Natural gas/hydrogen
Demand
***
Power-to-Heat
Power-to-Gas
DSM
Battery procurement
Pumped storage procurement
Scale
10 TWh
Thuringia (TH)
North Rhine-
Westphalia (NW)
Hesse (HE)
Figure 36: Energy balance in scenario A 2045
A 2045
1.6 0.4 0.1 4.2 16.9 0.0 55.9 0.7 2.1 9.0 83.7 3.0 4.7 -0.2 9.5 2.6
2.2 1.1 0.2 9.9 29.1 0.0 91.8 1.2 1.8 14.6 107.8 3.0 39.8 -0.2 15.4 1.5
0.9 0.2 0.0 0.0 0.3 0.0 0.8 0.0 0.0 0.2 16.3 2.5 3.7 0.0 0.2 0.0
0.3 0.7 0.0 0.0 44.4 0.0 21.2 0.3 0.0 3.6 33.9 0.4 22.4 0.0 3.8 0.0
0.3 0.5 0.0 0.0 0.7 7.7 0.4 0.0 0.0 0.1 9.7 0.4 2.5 0.0 0.1 0.0
0.1 0.1 0.0 0.0 0.3 0.0 0.3 0.0 0.0 0.1 15.6 1.6 1.8 0.0 0.1 0.0
0.3 0.9 0.0 0.3 19.3 15.0 18.1 0.2 0.5 3.4 80.5 1.7 5.4 -0.1 3.6 0.5
0.0 0.1 0.0 0.0 32.6 16.2 21.4 0.3 0.0 3.0 10.5 0.3 46.1 0.0 3.2 0.0
1.8 0.6 0.4 0.3 76.3 87.8 34.5 1.3 0.0 7.4 71.4 1.2 82.6 -0.1 7.8 0.0
4.0 2.2 0.3 0.7 42.2 50.0 37.6 0.7 0.1 8.6 176.1 5.6 20.9 -0.2 9.1 0.1
0.7 0.5 0.0 1.0 23.4 0.0 20.7 0.1 0.0 3.5 44.3 0.6 13.2 0.0 3.7 0.0
0.2 0.2 0.0 0.1 3.5 0.0 3.6 0.0 0.0 0.7 13.7 0.2 0.2 0.0 0.7 0.0
0.3 0.1 0.0 0.4 19.0 0.0 16.1 0.2 0.6 2.7 31.0 1.4 13.2 0.0 2.9 0.8
0.3 1.0 0.0 0.1 30.1 0.0 24.9 0.4 0.1 3.6 36.4 0.6 15.0 0.0 3.8 0.1
0.2 0.3 0.0 0.0 37.3 65.3 13.1 0.4 0.1 3.0 23.2 0.7 66.2 0.0 3.2 0.1
0.1 0.1 0.0 0.1 16.3 0.0 15.4 0.2 2.1 2.2 16.0 0.5 20.1 0.0 2.3 2.5
0.0 0.0 0.9 0.0 0.0 0.0 0.0 0.0 0.6 0.0 0.0 0.0 0.0 0.0 0.0 0.9
0.0 0.0 0.0 0.0 0.0 0.0 0.0 0.0 7.6 0.0 0.0 0.0 0.0 0.0 0.0 7.4
13.3 9.0 2.0 17.3 391.7 242.0 375.8 6.0 15.4 65.9 801.4 23.5 357.8 -1.0 69.3 16.4
NEP 2037/2045, Version 2023, 2. Entwurf – Kapitel 2, Abb. 33–38 – CBE DIGIDEN Entwurf vom 22. Juni 2023, 11:54 AM
Energy balance in scenario A 2045

Grid Development Plan Electricity 2037 / 2045, Version 2023, second draft 18
GDP compact
Schleswig-Holstein (SH)
Bremen (HB)
Hamburg (HH)
Berlin (BE)
Baden-Württemberg (BW)
Saarland (SL)
in TWh
Natural gas/
Hydrogen
Waste
Reservoir
water
Running
water
Wind
onshore
Wind
offshore
Photo-
voltaics
Biomass
Pumped
storage
Battery
storage
Power con-
sumption***
PtH PtG DSM
Battery
procurement
Pumped storage
procurement
BW
BY
BE
BB
HB
HH
HE
MV
NI
NW
RP
SL
SN
ST
SH
TH
LU (DE)*
AT (DE)*
Total**
Mecklenburg-
Western Pomerania (MV)
Bavaria (BY)
Baden-Württemberg (BW)
Rhineland-Palatinate (RP)
Saxony-Anhalt (ST)
Saxony (SN)
Brandenburg (BB)
Berlin (BE)
Luxembourg (DE)*
Austria (DE)*
Lower Saxony (NI)
*
Generation plants abroad with feed-in to the German transmission grid.
**
Rounding deviations may occur when the individual values are summed.
***
In this presentation, power consumption comprises net power consumption including all grid losses without considering the adjacent power
consumption by power-to-hydrogen and power-to-heat plants (district heating) as well as demand side management. Grid losses in the transmission
grid cannot be clearly allocated to the federal states.
Source: Transmission system operators
Battery storage
Pumped storage
Biomass
Photovoltaics
Wind offshore
Wind onshore
Running water
Reservoir water
Waste
Natural gas/hydrogen
Demand
***
Power-to-Heat
Power-to-Gas
DSM
Battery procurement
Pumped storage procurement
Scale
10 TWh
Thuringia (TH)
North Rhine-
Westphalia (NW)
Hesse (HE)
Figure 37: Energy balance in scenario B 2045
B 2045
2.4 0.5 0.1 4.2 16.7 0.0 54.9 0.7 2.3 9.3 94.6 3.1 2.9 -0.2 9.8 2.9
3.9 1.2 0.2 9.9 28.7 0.0 90.1 1.2 1.9 15.1 125.1 3.0 12.4 -0.3 15.9 1.6
1.5 0.2 0.0 0.0 0.3 0.0 0.8 0.0 0.0 0.2 16.8 2.4 5.2 0.0 0.2 0.0
0.5 0.7 0.0 0.0 43.9 0.0 20.8 0.3 0.0 3.7 38.9 0.4 9.7 0.0 3.9 0.0
0.5 0.6 0.0 0.0 0.7 7.6 0.4 0.0 0.0 0.1 9.8 0.4 3.0 0.0 0.1 0.0
0.2 0.1 0.0 0.0 0.3 0.0 0.3 0.0 0.0 0.1 17.1 1.6 7.1 0.0 0.1 0.0
0.8 1.0 0.0 0.3 19.1 14.8 17.7 0.2 0.5 3.5 86.2 1.7 5.1 -0.1 3.7 0.6
0.1 0.1 0.0 0.0 32.2 16.1 21.0 0.3 0.0 3.1 11.9 0.3 37.2 0.0 3.3 0.0
3.1 0.6 0.4 0.3 75.3 86.7 33.8 1.3 0.0 7.6 83.8 1.2 45.5 -0.2 8.0 0.0
6.7 2.2 0.3 0.7 41.7 49.5 36.9 0.7 0.1 8.9 199.6 5.7 15.0 -0.4 9.4 0.1
1.1 0.5 0.0 1.0 23.1 0.0 20.3 0.1 0.0 3.6 54.3 0.6 9.9 -0.1 3.8 0.0
0.4 0.2 0.0 0.1 3.5 0.0 3.6 0.0 0.0 0.7 15.4 0.2 0.2 0.0 0.7 0.0
0.6 0.1 0.0 0.4 18.8 0.0 15.8 0.2 0.7 2.8 36.5 1.5 10.7 -0.1 2.9 0.9
0.5 1.0 0.0 0.1 29.7 0.0 24.4 0.4 0.1 3.7 47.1 0.6 18.8 0.0 3.9 0.1
0.3 0.3 0.0 0.0 36.8 64.6 12.8 0.4 0.1 3.1 26.9 0.7 42.0 0.0 3.3 0.1
0.2 0.1 0.0 0.1 16.1 0.0 15.1 0.2 2.2 2.3 19.5 0.5 4.6 0.0 2.4 2.7
0.0 0.0 0.0 0.0 0.0 0.0 0.0 0.0 0.7 0.0 0.0 0.0 0.0 0.0 0.0 0.9
0.0 0.0 0.9 0.0 0.0 0.0 0.0 0.0 8.5 0.0 0.0 0.0 0.0 0.0 0.0 8.5
22.7 9.1 2.0 17.3 386.9 239.2 368.7 6.0 17.0 67.8 914.8 23.7 229.7 -1.4 71.4 18.5
NEP 2037/2045, Version 2023, 2. Entwurf – Kapitel 2, Abb. 33–38 – CBE DIGIDEN Entwurf vom 22. Juni 2023, 11:54 AM
Energy balance in scenario B 2045
Grid Development Plan Electricity 2037 / 2045, Version 2023, second draft 19
GDP compact
Schleswig-Holstein (SH)
Bremen (HB)
Hamburg (HH)
Berlin (BE)
Baden-Württemberg (BW)
Saarland (SL)
in TWh
Natural gas/
Hydrogen
Waste
Reservoir
water
Running
water
Wind
onshore
Wind
offshore
Photo-
voltaics
Biomass
Pumped
storage
Battery
storage
Power con-
sumption***
PtH PtG DSM
Battery
procurement
Pumped storage
procurement
BW
BY
BE
BB
HB
HH
HE
MV
NI
NW
RP
SL
SN
ST
SH
TH
LU (DE)*
AT (DE)*
Total**
Mecklenburg-
Western Pomerania (MV)
Bavaria (BY)
Baden-Württemberg (BW)
Rhineland-Palatinate (RP)
Saxony-Anhalt (ST)
Saxony (SN)
Brandenburg (BB)
Berlin (BE)
Luxembourg (DE)*
Austria (DE)*
Lower Saxony (NI)
Thuringia (TH)
North Rhine-
Westphalia (NW)
Hesse (HE)
Figure 38: Energy balance in scenario C 2045
*
Generation plants abroad with feed-in to the German transmission grid.
**
Rounding deviations may occur when the individual values are summed.
***
In this presentation. power consumption comprises net power consumption including all grid losses without considering the adjacent power
consumption by power-to-hydrogen and power-to-heat plants (district heating) as well as demand side management. Grid losses in the transmission
grid cannot be clearly allocated to the federal states.
****
Includes utilisation of reserves near consumption areas.
Source: Transmission system operators
Battery storage
Pumped storage
Biomass
Photovoltaics
Wind offshore
Wind onshore
Running water
Reservoir water
Waste
Natural gas/hydrogen ****
Demand
***
Power-to-Heat
Power-to-Gas
DSM
Battery procurement
Pumped storage procurement
Scale
10 TWh
C 2045
Natural gas/
hydrogen****
4.2 0.5 0.1 4.2 20.6 0.0 61.9 0.7 2.2 10.8 112.9 3.5 2.6 -0.3 11.3 2.8
6.2 1.2 0.2 9.9 34.8 0.0 101.0 1.2 1.8 17.5 148.5 3.5 13.2 -0.4 18.4 1.5
2.2 0.2 0.0 0.0 0.4 0.0 0.9 0.0 0.0 0.2 19.7 2.7 2.1 0.0 0.2 0.0
0.9 0.8 0.0 0.0 47.7 0.0 23.1 0.3 0.0 4.4 43.8 0.5 25.3 -0.1 4.6 0.0
0.7 0.6 0.0 0.0 0.7 7.7 0.4 0.0 0.0 0.1 10.7 0.4 1.0 0.0 0.1 0.0
0.4 0.1 0.0 0.0 0.3 0.0 0.4 0.0 0.0 0.1 19.9 1.8 0.8 -0.1 0.1 0.0
1.7 1.0 0.0 0.3 22.1 14.9 20.0 0.2 0.5 4.1 95.7 1.9 1.7 -0.1 4.3 0.5
0.2 0.1 0.0 0.0 37.6 16.2 23.6 0.3 0.0 3.7 14.3 0.4 44.4 0.0 3.9 0.0
5.1 0.6 0.4 0.3 84.1 87.4 38.3 1.3 0.0 8.9 100.2 1.4 39.5 -0.2 9.4 0.0
11.5 2.3 0.3 0.7 47.2 49.8 41.8 0.7 0.1 10.2 239.2 6.5 10.3 -0.5 10.8 0.1
2.1 0.5 0.0 1.0 26.8 0.0 22.9 0.1 0.0 4.3 68.8 0.7 9.4 -0.1 4.5 0.0
0.7 0.2 0.0 0.1 3.9 0.0 4.0 0.0 0.0 0.8 19.2 0.3 0.2 0.0 0.8 0.0
1.1 0.1 0.0 0.4 22.8 0.0 17.7 0.2 0.7 3.3 43.6 1.7 7.8 -0.1 3.5 0.8
1.2 1.0 0.0 0.1 32.6 0.0 27.5 0.4 0.1 4.4 57.2 0.7 13.0 -0.1 4.6 0.1
0.6 0.3 0.0 0.0 39.4 65.0 14.5 0.4 0.1 3.6 32.2 0.8 42.8 0.0 3.7 0.1
0.4 0.1 0.0 0.1 18.6 0.0 17.0 0.2 2.2 2.7 23.0 0.5 6.0 -0.1 2.9 2.6
0.0 0.0 0.0 0.0 0.0 0.0 0.0 0.0 0.7 0.0 0.0 0.0 0.0 0.0 0.0 0.91
0.0 0.0 0.9 0.0 0.0 0.0 0.0 0.0 8.4 0.0 0.0 0.0 0.0 0.0 0.0 8.3
39.2 9.3 2.0 17.3 439.5 241.0 414.9 6.0 16.6 78.9 1.080.2 27.2 220.1 -2.1 83.1 18.0
NEP 2037/2045, Version 2023, 2. Entwurf – Kapitel 2, Abb. 33–38 – CBE DIGIDEN Entwurf vom 22. Juni 2023, 11:54 AM
Energy balance in scenario C 2045

Grid Development Plan Electricity 2037 / 2045, Version 2023, second draft 20
GDP compact
Offshore grid:
Comprehensive development and
progressive interconnection of potentials
The GDP and the Site Development Plan form a coherent
set of plans with the geographical planning of the coastal
states. The implementation of these statutory require-
ments frequently leads to (chronological) overlaps in the
process of preparing the GDP and Site Development Plan.
The process of updating the Site Development Plan was
completed on 20/01/2023. The TSOs considered the Site
Development Plan stipulation in the first draft of the GDP
2037 / 2045 (2023). However, the Site Development Plan
2023 lacks geographical and temporal stipulations that
are necessary for achieving the statutory expansion tar-
gets for offshore wind for the years 2035 and 2045 accord-
ing to the WindSeeG. Considering the fact that offshore
grid connection systems take a long time to be realised,
the necessary fundamentals for confirming the expansion
targets through specific projects in a timely manner is
therefore currently lacking. In agreement with the Fed-
eral Network Agency, the second draft of GDP 2037 / 2045
(2023) is therefore largely based on the draft of Site De-
velopment Plan 2023 dated 1 July 2022. This applies
especially to the geographical allocation of areas, border
corridors and the planned completion dates for offshore
grid connection systems after 2031.
Expansion volume of offshore grid connection systems
Based on the offshore grid connection systems confirmed
by Federal Network Agency, in the GDP 2035 (2021), the
additional need for 20 new offshore grid connection
systems with a route length of approx. 8,455 km and
investment costs of EUR 86.7 billion were identified in
this GDP 2037 / 2045 (2023).
For the offshore expansion grid in the North Sea and the
Baltic Sea, this results in a length of
about 6,600 km with a transmission capacity of about
36 GW in scenario A 2037,
about 9,300 km with a transmission capacity of about
44 GW in scenarios B 2037 and C 2037,
and a length of 13,300 km with a transmission
capacity of about 61.2 GW for long-term scenarios
A 2045, B 2045 and C 2045.
The corresponding grid connection points (GLP) on land
were identified. The investments for the offshore grid con-
nection systems in the offshore grid expansion are based
on specific cost rates and are of a preliminary nature.
For scenario A 2037, the estimated investment volume
for the offshore expansion grid amounts to around
EUR 77 billion by 2037.
Scenarios B 2037 and C 2037 require investment costs
of about EUR 103.5 billion.
For long-term scenarios A 2045, B 2045 and
C 2045, the estimated investment costs are around
EUR 145.1 billion.
Moreover, the investment costsfor the offshore grid
expansion measures of the offshore initial grid that
are already being implemented amounts to around
EUR 12.4 billion for all scenarios.
For the generation capacities to be installed for offshore
wind of the approved scenario framework, all required
transmission lines respectively offshore grid connection
systems were determined. As a result, the number and
thus the required investments for the 2037 and 2045
scenarios go beyond the expansion path for offshore wind
depicted in the 2023 Site Development Plan. Accordingly,
they represent a possible path to achieving the further
statutory expansion targets of at least 40 GW by 2035 and
at least 70 GW by 2045.
For the first time, the GDP 2037 / 2045 (2023) considers
national offshore interconnection. Additionally, it pres-
ents the corresponding benefits and identifies a project
with two measures. The offshore interconnection refers
to the offshore connections between offshore grid con-
nection systems. An offshore transmission capacity will
be created between two onshore GLPs of the offshore
grid connection systems. This additional transmission
capacity can be used as a flexible bypass to relieve the
onshore transmission grid, thus minimising redispatch
interventions. Overall, national offshore interconnection
is shown to be a grid-supporting and cost-efficient ex-
pansion measure aimed at minimising long-range grid
bottlenecks. Further core results of the study on national
offshore interconnection and the offshore interconnec-
tion study on international interconnection needs are
published in a separate report.
The implementation of a high number of offshore grid con-
nection systems in a short period poses a great challenge in
terms of the manufacturer’s market, logistics and approval
procedures. This applies especially to the long offshore and
onshore cable routes to be implemented as well as the cor-
responding planning, approval and construction times.
Grid Development Plan Electricity 2037 / 2045, Version 2023, second draft 21
GDP compact
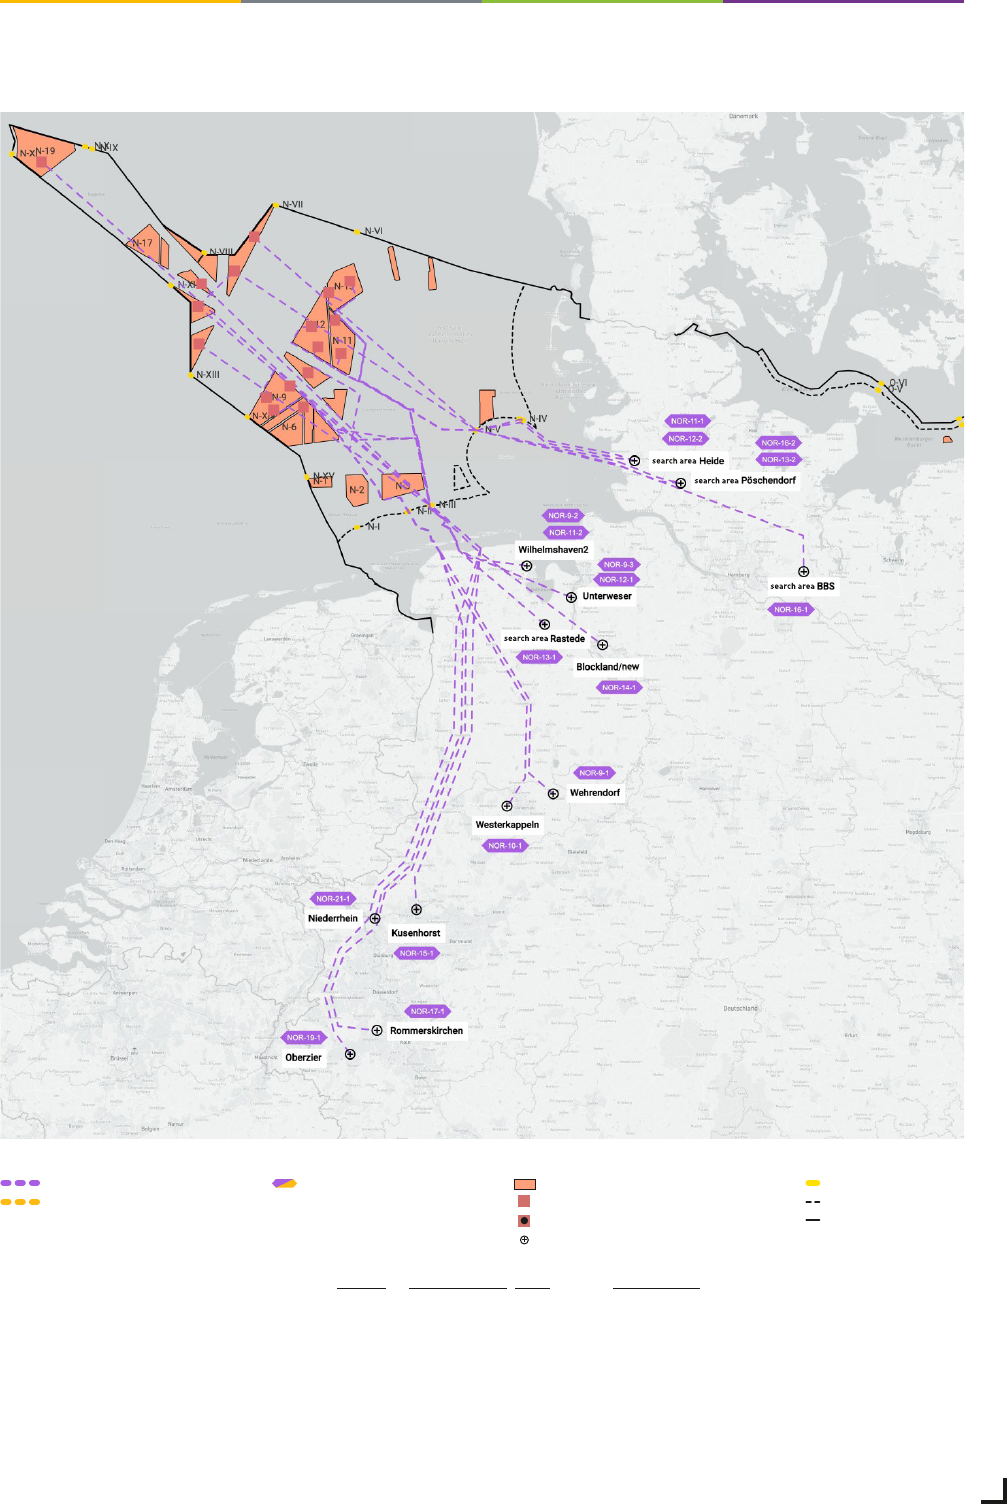
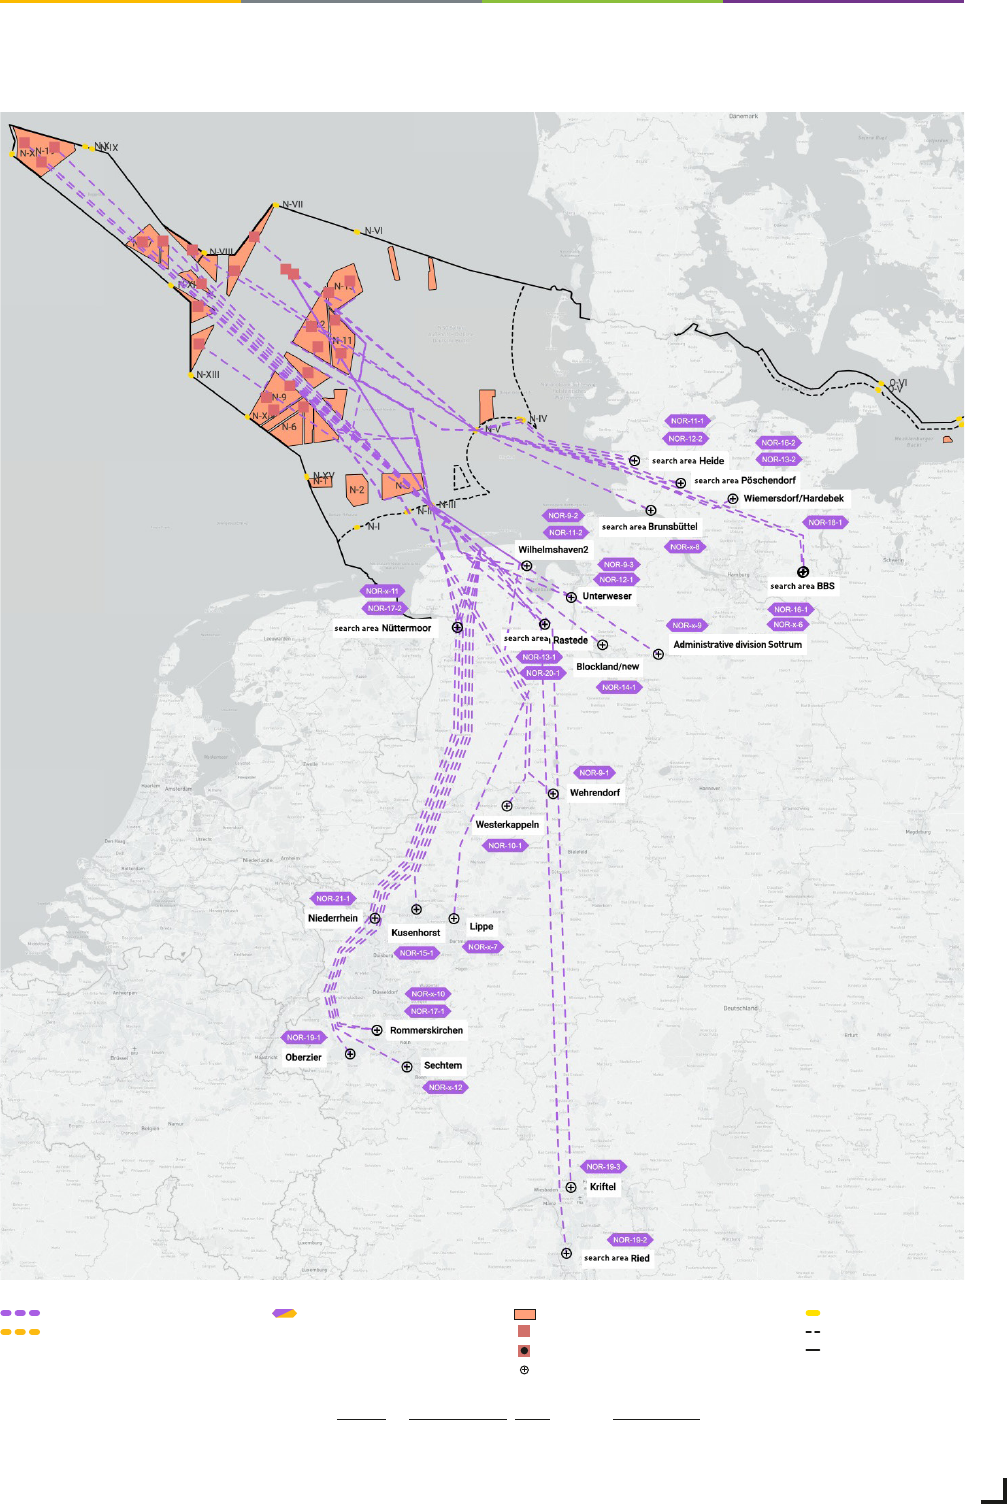
Measures of the North Sea offshore expansion grid in scenario A 2037
DC grid expansion
AC grid expansion
Boundary of the territorial sea
Boundary of the exclusive
economic zone
Border corridor
Converter platform
Transformer platform
Grid link point
Offshore wind farm areaProject name
Source: Transmission system operator / map basis © Mapbox, © OpenStreetMap (ODbL), BSH (© GeoSeaPortal)
Grid Development Plan Electricity 2037 / 2045, Version 2023, second draft 22
GDP compact
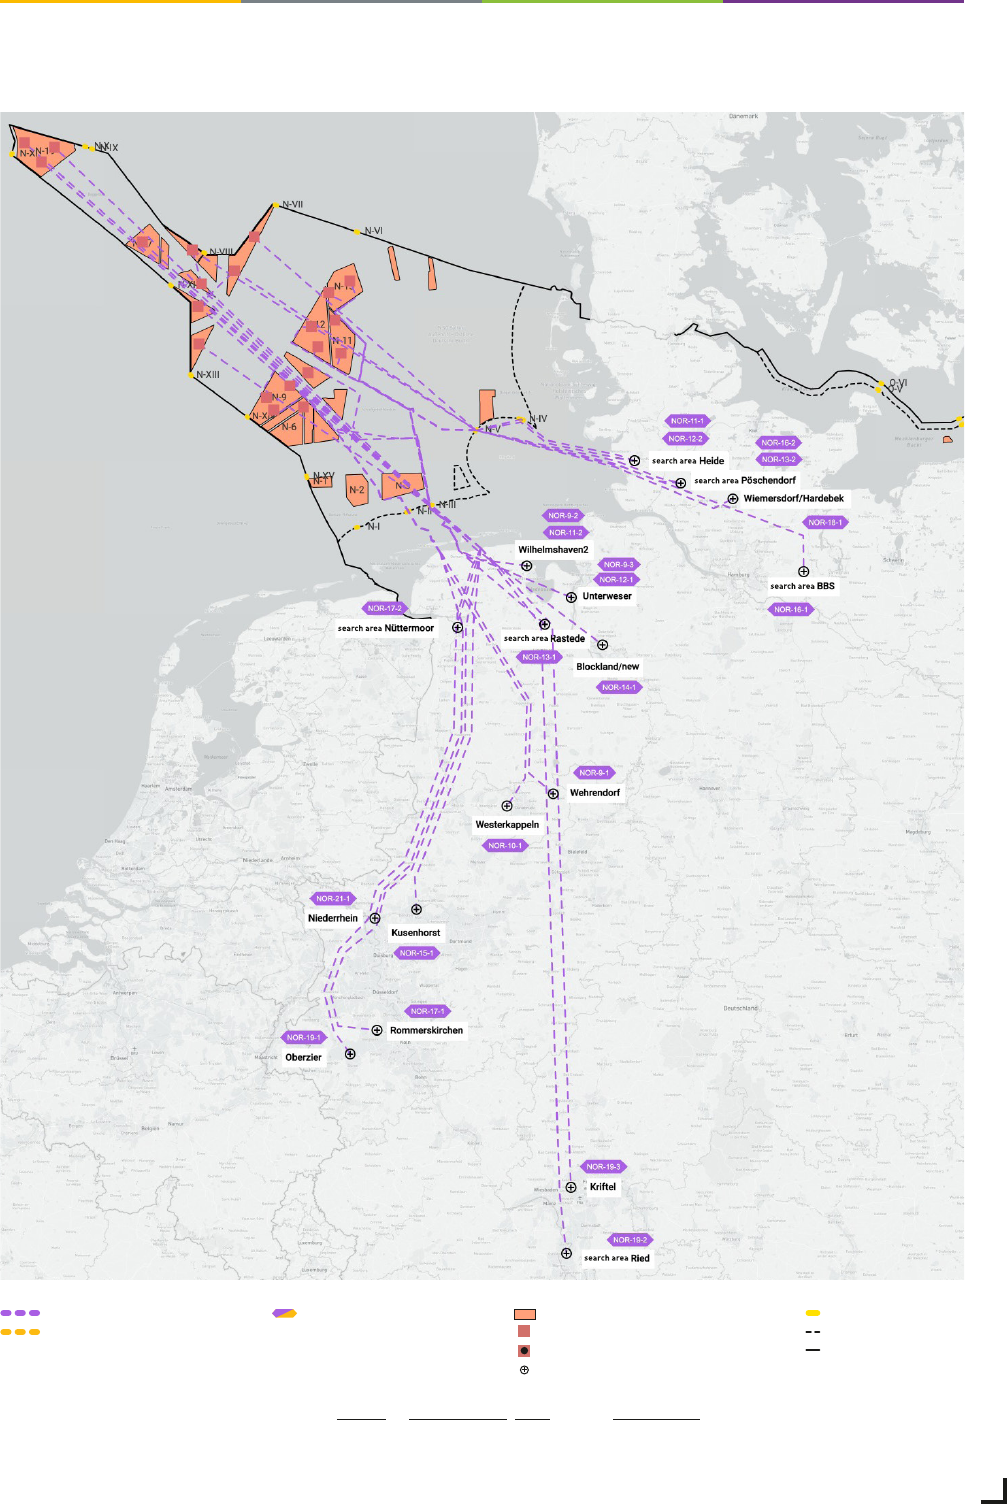
Measures of the North Sea offshore expansion grid in scenarios B / C 2037
DC grid expansion
AC grid expansion
Boundary of the territorial sea
Boundary of the exclusive
economic zone
Border corridor
Converter platform
Transformer platform
Grid link point
Offshore wind farm areaProject name
Source: Transmission system operator / map basis © Mapbox, © OpenStreetMap (ODbL), BSH (© GeoSeaPortal)
Grid Development Plan Electricity 2037 / 2045, Version 2023, second draft 23
GDP compact
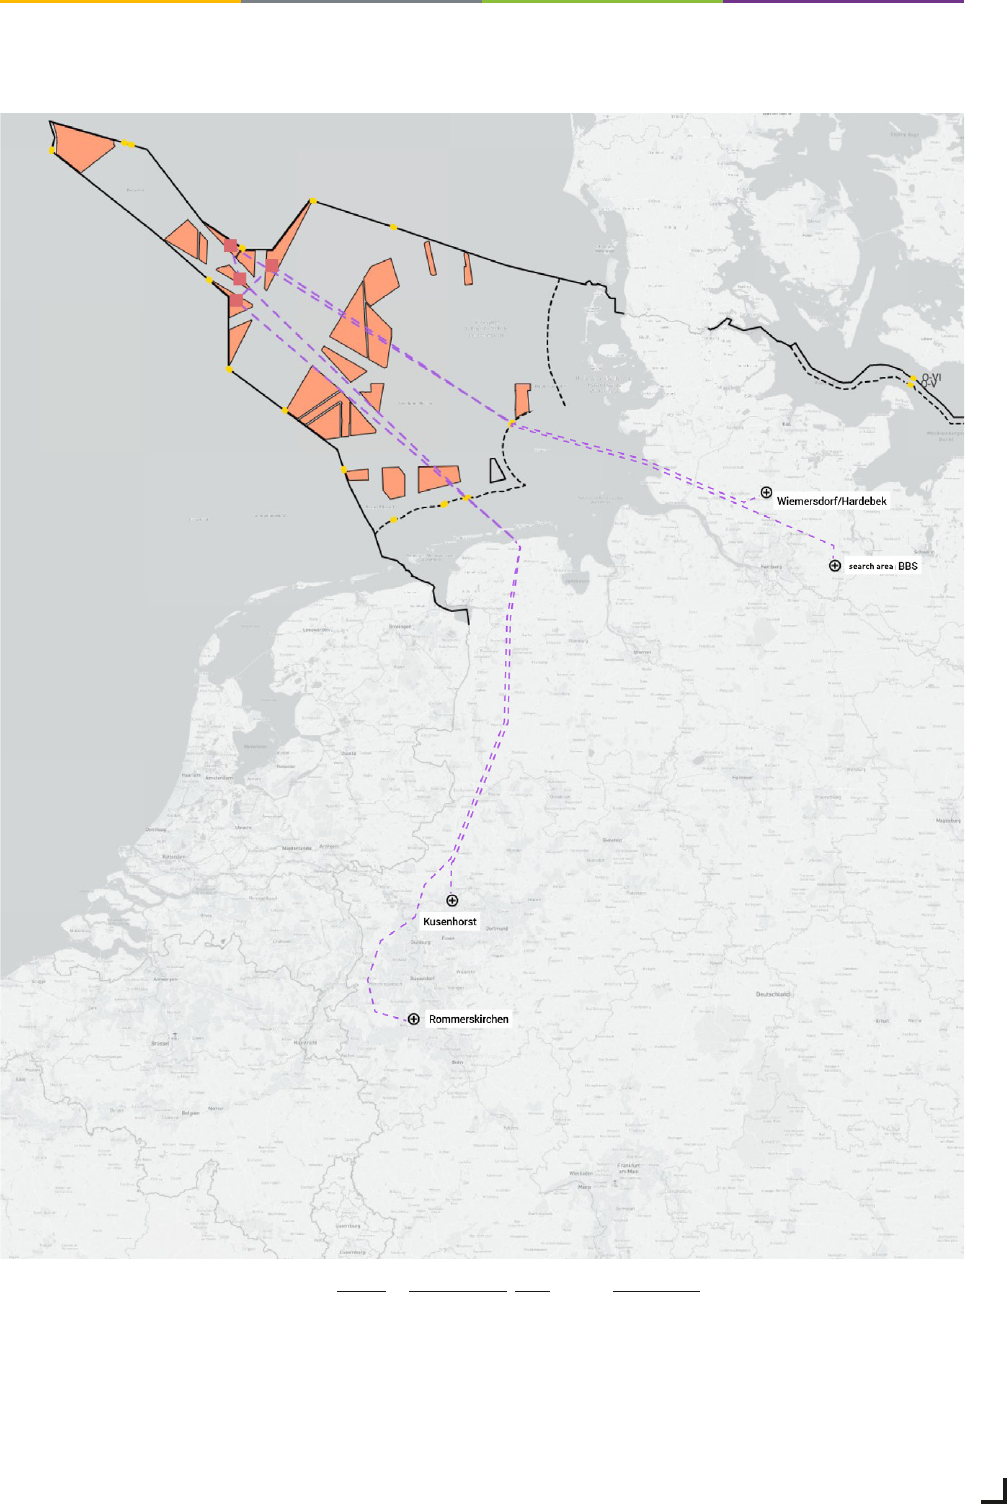
Measures of the North Sea offshore expansion grid in scenarios A / B / C 2045
DC grid expansion
AC grid expansion
Boundary of the territorial sea
Boundary of the exclusive
economic zone
Border corridor
Converter platform
Transformer platform
Grid link point
Offshore wind farm areaProject name
Source: Transmission system operator / map basis © Mapbox, © OpenStreetMap (ODbL), BSH (© GeoSeaPortal)
Grid Development Plan Electricity 2037 / 2045, Version 2023, second draft 24
GDP compact
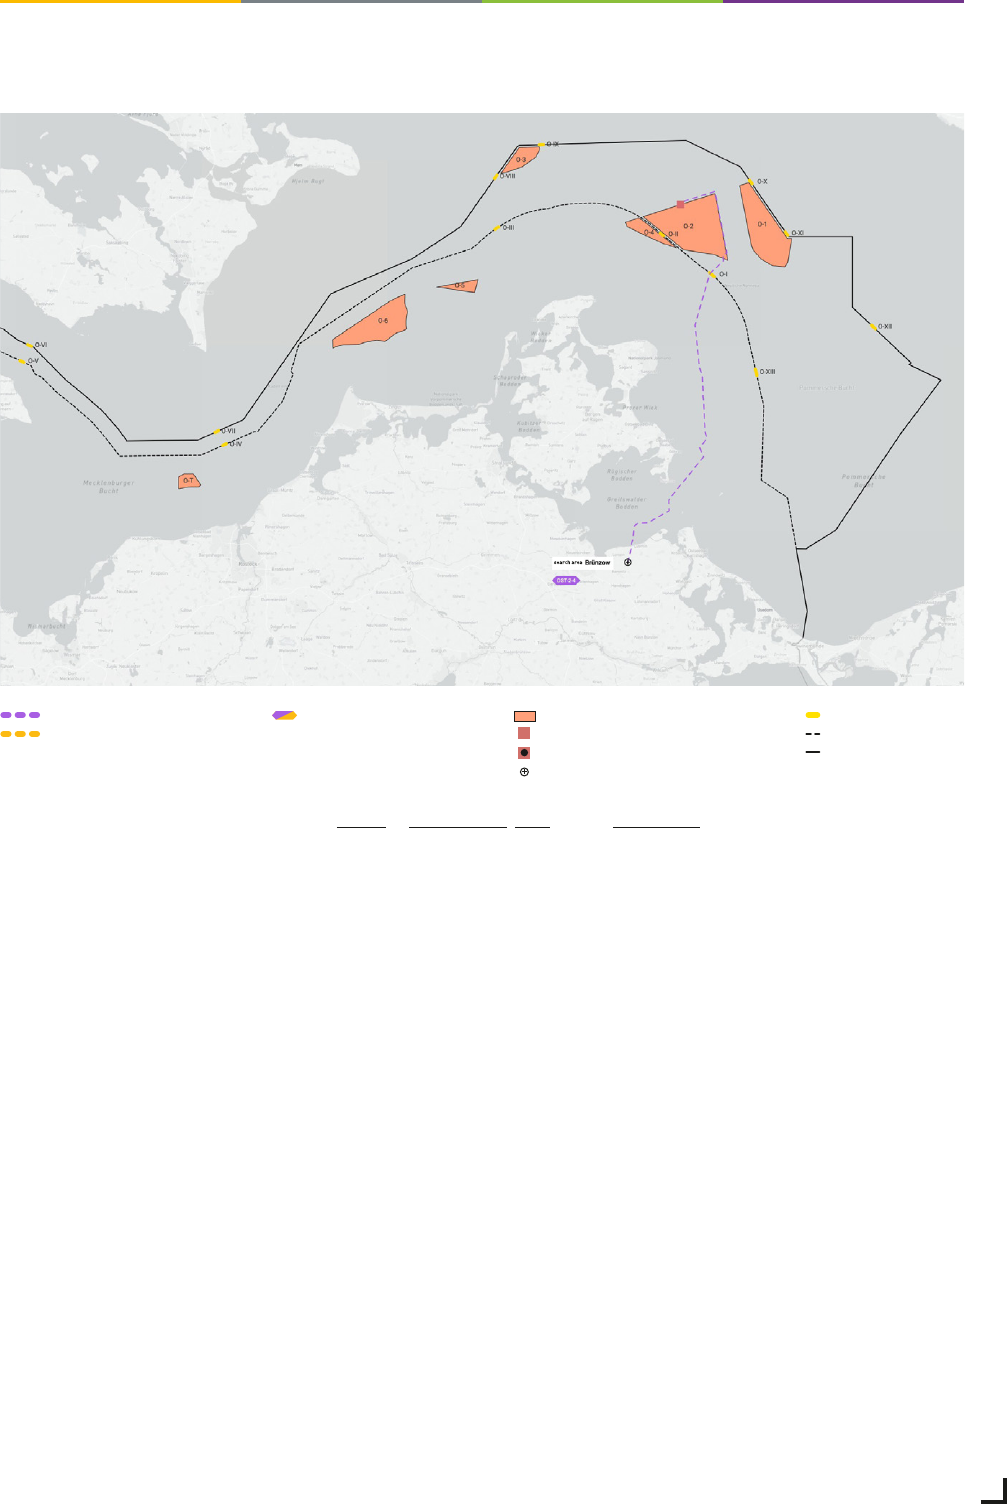
Measures of the Baltic Sea offshore expansion grid in scenarios A / B / C 2037
Source: Transmission system operator / map basis © Mapbox, © OpenStreetMap (ODbL), BSH (© GeoSeaPortal)
DC grid expansion
AC grid expansion
Boundary of the territorial sea
Boundary of the exclusive
economic zone
Border corridor
Converter platform
Transformer platform
Grid link point
Offshore wind farm areaProject name
Grid Development Plan Electricity 2037 / 2045, Version 2023, second draft 25
GDP compact
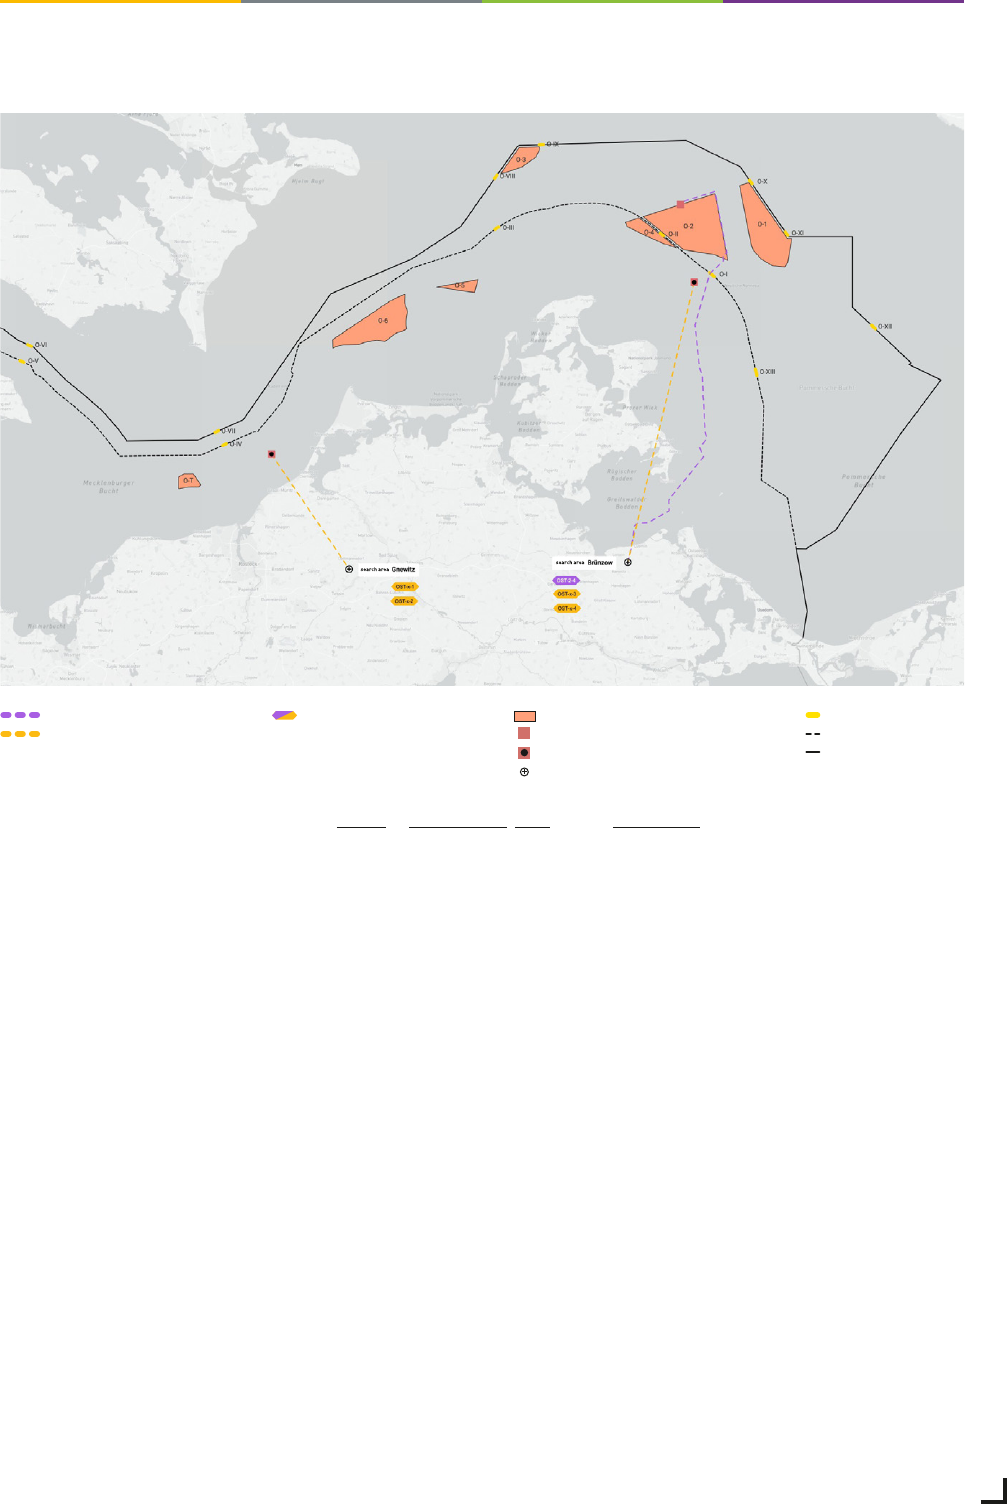
Measures of the Baltic Sea offshore expansion grid in scenarios A / B / C 2045
Source: Transmission system operator / map basis © Mapbox, © OpenStreetMap (ODbL), BSH (© GeoSeaPortal)
DC grid expansion
AC grid expansion
Boundary of the territorial sea
Boundary of the exclusive
economic zone
Border corridor
Converter platform
Transformer platform
Grid link point
Offshore wind farm areaProject name

Grid Development Plan Electricity 2037 / 2045, Version 2023, second draft 27
GDP compact
Onshore grid: Considerable need
for expansion of a carbon-neutral
network by 2037
The statutory plans already foresee the majority of the
necessary expansion of renewable energy by the mid-
2030s. As a result of the substantial increase in domestic
German transport demand to around 87.7 GW by 2037,
a significant part of the onshore climate neutrality grid
needs also be implemented by then. Until 2045, the load
flow from northern to southern Germany almost remains
at a similar level. The further expansion of renewable
energy between 2037 and 2045 can be largely offset by
the expansion of flexibilities, especially electrolysers,
centralised and decentralised battery storage as well as
demand side management. Due to the massive expansion
of photovoltaic, significant load flows in opposite direction
will also occur for the first time. While they partly require
additional regional measures, the long-range transport
can be fulfilled by the transmission grid, which has so far
primarily been expanded for transport from northern to
sourthern Germany.
The transmission grid must be reconstructed in such a way
that it can already integrate an installed capacity of between
565 and 576 GW of renewable energy by 2037. Compared
to today, it must also cover almost double the gross power
consumption of around 900 to 1,050 TWh.
The result shows:
All the projects of the Federal Demand Plan 2022
are necessary for scenarios A / B / C 2037 as well as
all scenarios with the target year 2045. The neces-
sity of these measures is thus confirmed in the GDP
2037 / 2045 (2023). However, in light of the increasing
transport task, they are far from sufficient for a de-
mand-based grid.
Compared to the confirmed grid from the GDP 2035
(2021), the need for grid enhancement and expansion
in GDP 2037 / 2045 (2023) increases by about 7,400 km
of additional measures in the A / B / C 2037 and A / B / C
2045 scenarios (see Chapter 5.2.5).
Of these measures, approx. 2,800 km are accounted
for by new DC construction and enhancement mea-
sures (five additional DC projects), 1,300 km for new
AC construction measures (approx. 20 additional AC
projects) and 3,300 km for grid enhancement mea-
sures. The ratio of DC to AC new construction is 1.6.
The onshore initial grid comprises AC and DC mea-
sures totalling around 6,950 km with estimated in-
vestment costs of EUR 50 billion. For the onshore
grid expansion, grid enhancements in the AC seg-
ment amount to 6,125 km. Furthermore, there are
about 180 km of DC enhancement measures. An-
other 1,714 km are accounted for new AC construc-
tion measures and 4,396 km for new DC construction
measures. In total, the onshore expansion grid for all
scenarios considers a total lentgh of about 12,413 km.
For scenarios A / B / C 2037, the investment costs
amount to around EUR 106.1 billion. The investment
costs for the onshore expansion grid of the A / B / C
2045 scenarios are EUR 0.1 billion higher. Compared
to the first draft of the GDP 2037 / 2045 (2023), the
investment costs have increased by approx. EUR 12.5
billion. This is mainly attributable to the consider-
ation of additional projects based on additional de-
mand for transformers and substations between the
distribution and transmission grid. Other contribut-
ing factors include an update of the scope and costs
of existing projects as well as the updated require-
ments for plants for reactive power compensation
and for the provision of instantaneous reserve.
Compared to the project portfolio proposed in
the GDP 2035 (2021), the present GDP 2037 / 2045
(2023) identifies new onshore projects with a route
length of 5,620 km and additional investments of
EUR 52.3 billion.
The results of the grid analyses show an identical
carbon-neutral grid for all scenarios. This grid only
differs in terms of the remaining redispatch demand.
The climate neutrality grid consists of a robust portfolio
of grid enhancement and expansion measures under
the proposed assumptions. The TSOs assume that these
measures are necessary in the sense of a ‘no-regret’
approach in the GDP 2037 / 2045 (2023) scenarios.

Grid Development Plan Electricity 2037 / 2045, Version 2023, second draft 28
GDP compact
Lengths of initial and expansion grid in the GDP 2037 / 2045 (2023)
Figures
in km
AC enhancement DC enhancement
AC new
construction
DC new
construction
Total
Connection/
rewiring
Replacement/
parallel new
construction
Connection/
rewiring
Replacement/
parallel new
construction
Initial grid 919 2,081 321 560 599 2,466
6,945
Expansion grid
A 2037 2,279 3,846 0 179 1,714 4,396 12,413
B 2037 2,279 3,846 0 179 1,714 4,396 12,413
C 2037 2,279 3,846 0 179 1,714 4,396 12,413
A 2045 2,279 3,846 0 179 1,714 4,396 12,413
B 2045 2,279 3,846 0 179 1,714 4,396 12,413
C 2045 2,279 3,846 0 179 1,714 4,396 12,413
Initial and expansion grid
A 2037 3,198 5,927 321 739 2,312 6,861 19,358
B 2037 3,198 5,927 321 739 2,312 6,861 19,358
C 2037 3,198 5,927 321 739 2,312 6,861 19,358
A 2045 3,198 5,927 321 739 2,312 6,861 19,358
B 2045 3,198 5,927 321 739 2,312 6,861 19,358
C 2045 3,198 5,927 321 739 2,312 6,861 19,358
Due to the long timeframe until 2045 and the cor-
responding uncertainties, identified congestion was
not completely eliminated by grid enhancement and
expansion measures. Therefore, a redispatch volume
of 1.5 to 5.9 TWh remains in the scenarios. A further
reduction in congestion is conceivable by exploiting
the potential of future innovative technologies. Thus,
the curative redispatch potential for scenario B 2037
was explicitly investigated in this GDP.
To evaluate suitable grid topologies, the TSOs have refined
their simulation tools, for example by using heuristic tools.
It ensures more efficient and comprehensive investigation
of the potential solutions and facilitates the comparison
and evaluation of a large number of grid expansion com-
binations.
Considering a potentially significant increase in the ex-
pansion of renewable energy as early as 2030 and the
correspondingly increased short to medium-term load
on the transmission grid, the German transmission sys-
tem operators have identified additional suitable measures
(ad hoc measures) that can already be implemented in the
short to medium term to mitigate the expected situation.
These measures were assessed and identified based on
the scenario and grid model of the long-term analysis
according to § 34 of the Coal-fired Power Generation
Termination Act (KVBG) for the year 2030.
Source: Transmission system operators

Grid Development Plan Electricity 2037 / 2045, Version 2023, second draft 29
GDP compact
Potential bundling options of new onshore
DC projects and offshore grid connection systems
Regarding to § 12b (3a) of the EnWG (German Energy Act),
the TSOs are obligated for the first time to specify bundling
options for newly identified DC grid expansion measures
and the cross-border onshore part of the offshore connec-
tion lines. It needs to be shown how these measures can
be realised with existing or at least firmly planned routes,
either entirely or to a large extent in one power line corridor.
Bundling makes it possible to align offshore connection
systems and newly identified DC projects in the same
route and thus minimise the use of space. According to
the HVDC projects already confirmed in the GDP 2035
(2021) or submitted for confirmation in the GDP 2037 / 2045
(2023), there are three central energy corridors based
on the current planning status. Due to the lack of landing
points for individual offshore projects to date, the imple-
mentation of bundling for these systems still needs to be
specified in more detail.
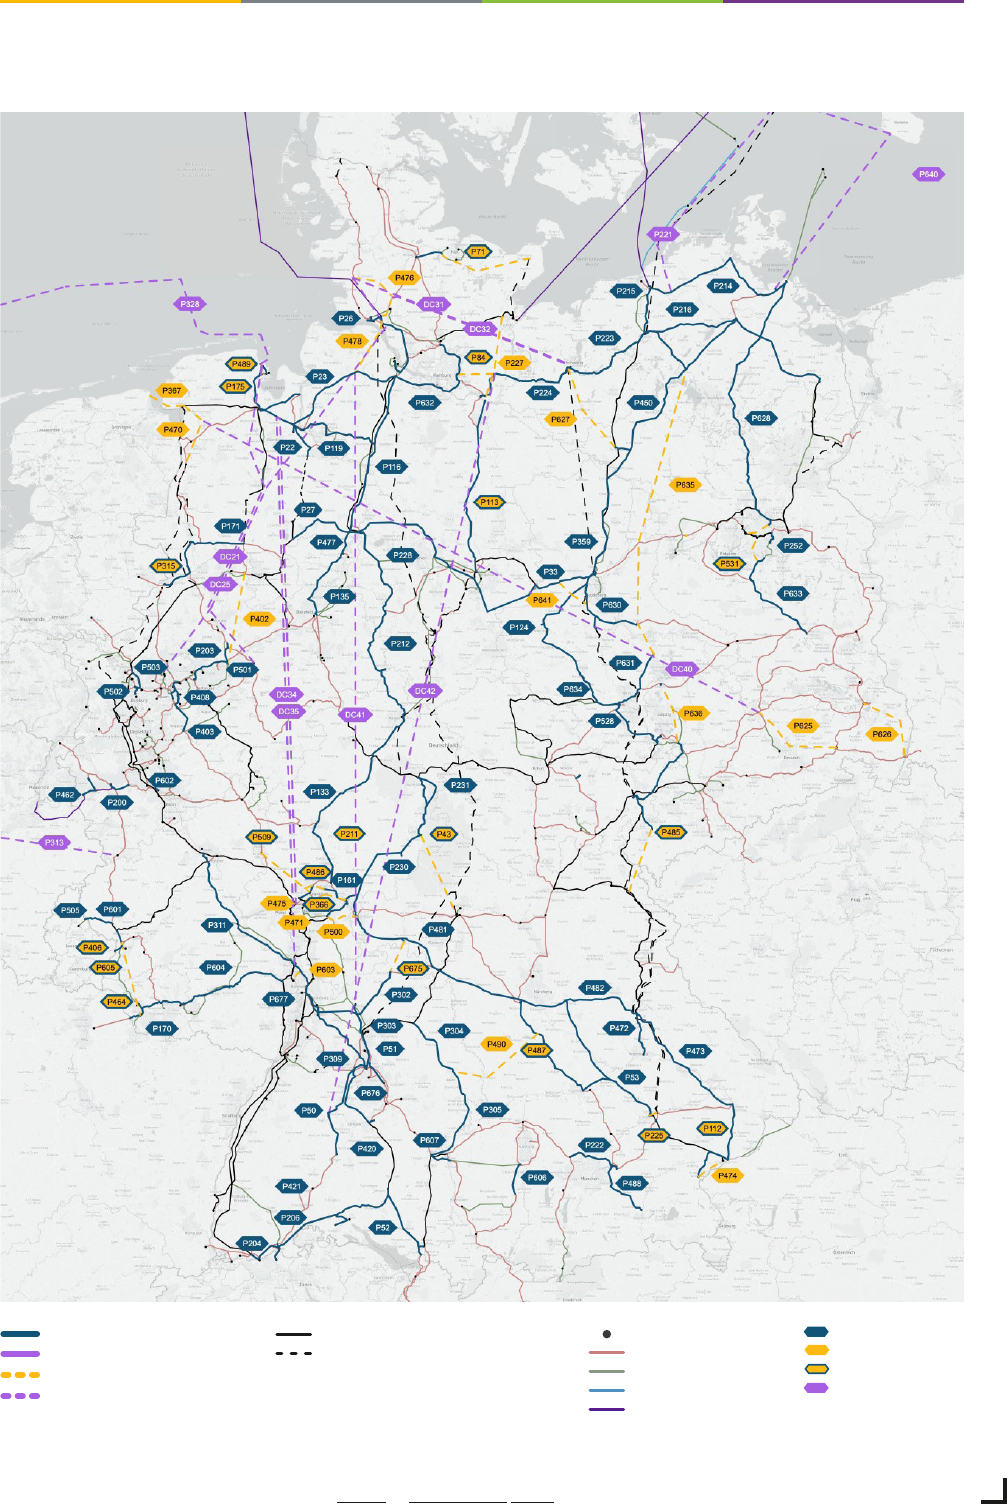
Grid Development Plan Electricity 2037 / 2045, Version 2023, second draft 30
GDP compact
Onshore grid expansion scenarios A / B / C 2037, A / B / C 2045, only power line construction projects*
Source: Transmission system operator / map basis © Mapbox, © OpenStreetMap (ODbL)
* The presentation of the new construction projects shows the starting and end points, but no specific routes.
They will only be determined in downstream approval procedures.
DC
Enhancement and expansion
Grid expansion
Grid enhancement
Grid expansion in the initial grid
Grid enhancement in the initial grid
AC grid expansion
DC grid enhancement
AC grid enhancement
DC grid expansion
Attachments
AC 380 kV
AC 220 kV
AC 150 kV
DC
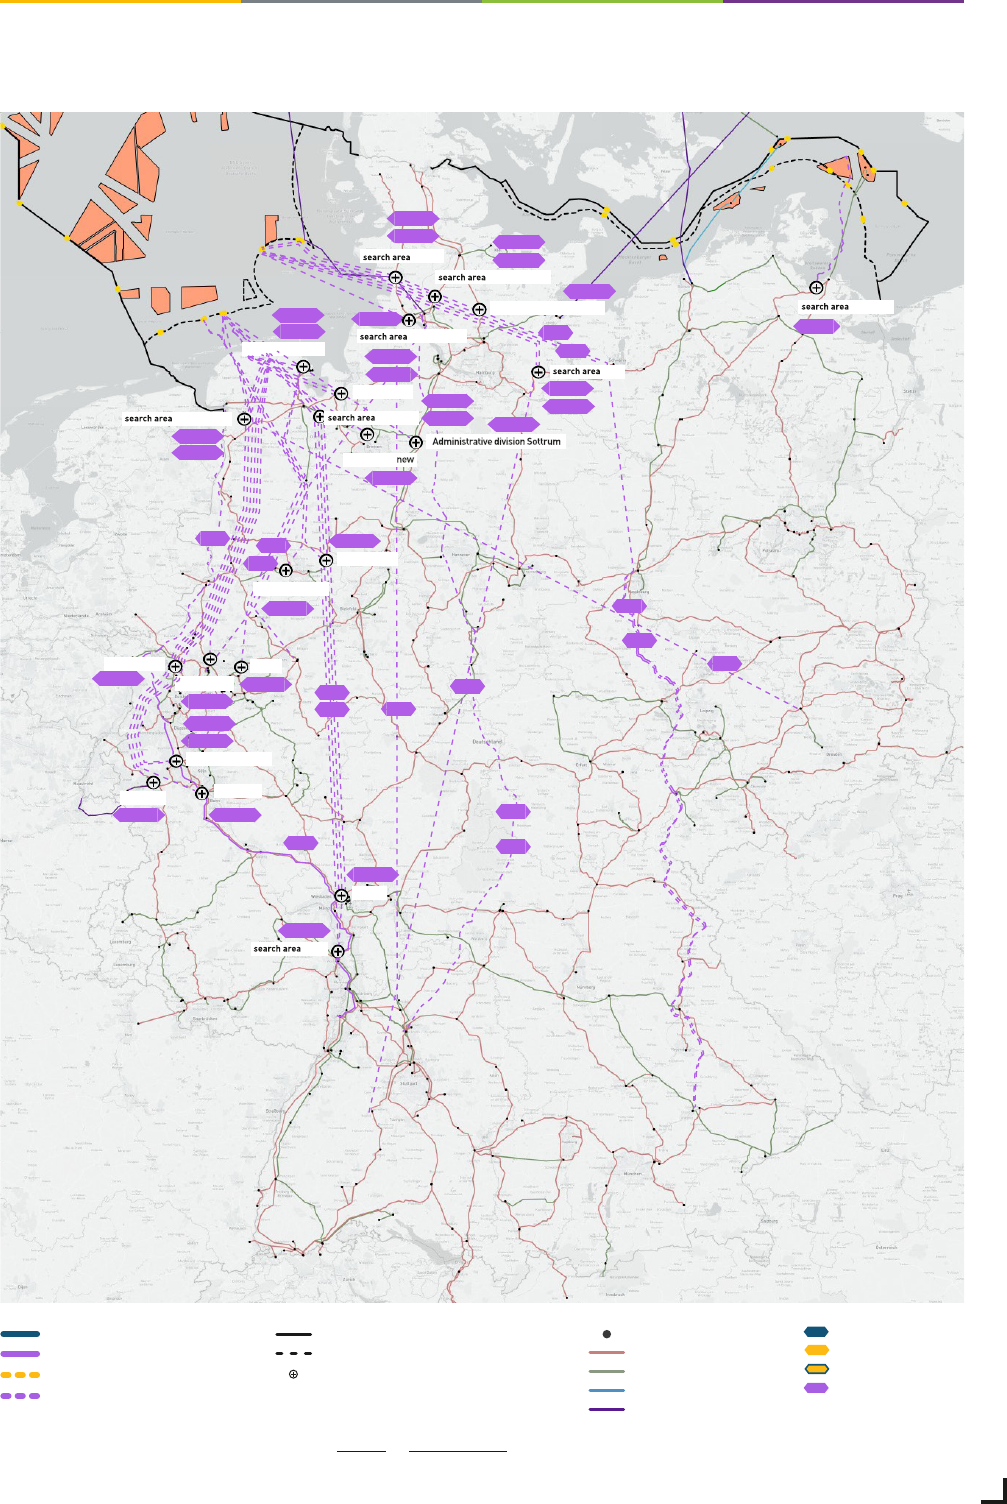
Grid Development Plan Electricity 2037 / 2045, Version 2023, second draft 31
GDP compact
Potential bundling of the new DC projects and the offshore grid connection systems in A / B / C 2045
Grid link point
Source: Transmission system operator / map basis © Mapbox, © OpenStreetMap 222
DC21
DC1
DC25
DC2
DC3
DC42
DC20
DC40
DC31
DC32
DC5
DC41
DC4
Rommerskirchen
Sechtem
Kriftel
Suchraum Ried
Kusenhorst
Lippe
Niederrhein
Suchraum Nüttermoor
Wehrendorf
Suchraum BBS
Wiemersdorf/Hardebek
Suchraum Pöschendorf
Unterweser
Blockland/neu
Samtgemeinde Sottrum
Suchraum Brunsbüttel
Wilhelmshaven2
Suchraum Heide
Oberzier
NOR-X-11
NOR-17-2
NOR-X-8
NOR-X-9
NOR-X-6
NOR-9-3
NOR-9-1
NOR-9-2
NOR-11-2
NOR-12-1
NOR-13-1
NOR-20-1
NOR-16-1
NOR-18-1
NOR-16-2
NOR-12-2
NOR-11-1
NOR-13-2
NOR-14-1
NOR-10-1
NOR-15-1
NOR-21-1
NOR-19-1
NOR-19-2
NOR-19-3
NOR-17-1
NOR-X-7
OST-2-4
NOR-X-10
NOR-X-12
Suchraum Brünzow
DC35
DC34
Westerkappeln
Suchraum Rastede
DC
Enhancement and expansion
Grid expansion
Grid enhancement
Grid expansion in the initial grid
Grid enhancement in the initial grid
AC grid expansion
DC grid enhancement
AC grid enhancement
DC grid expansion
Attachments
AC 380 kV
AC 220 kV
AC 150 kV
DC

Grid Development Plan Electricity 2037 / 2045, Version 2023, second draft 32
GDP compact
Innovations: progressive interconnection
The demand on the transmission grid is becoming in-
creasingly complex. In the future, the transmission grid
must particularly meet the requirements caused by
higher volatility of renewable energy generation as well
as long-distance transport routes. To ensure that the
transformation to a carbon-neutral energy system
succeeds, the four TSOs are relying on a range of inno-
vative solutions and technologies.
The TSOs are investigating technical solutions as well as
operating concepts that facilitate an increase in the trans-
port capacity of the existing grid infrastructure without
compromising system stability. In the context of grid
optimisation, weather-dependent overhead line operation
as well as the rewiring to high-temperature conductor
cables are also considered in this grid development plan.
Furthermore, the transmission system operators have
again implicitly assumed potentials of future innovative
technologies based on curative system management,
which need to be tested in pilot projects. The first grid
boosters are expected to be ready to go into operation
in 2025. Further curative measures for potential piloting
are under consideration.
For the restructuring of the energy system and the as-
sociated changes in the demands on the transmission
grid, HVDC technology enables low-loss transmission of
high power over long distances. Operational experience
with HVDC technology in Germany and Europe has so far
mainly been limited to point-to-point connections. By the
end of this decade, additional HVDC transmission lines are
expected to be implemented in Germany. The upgrade to
linked DC structures makes it possible to leverage further
grid flexibility potential, while the accompanying techno-
logical standardisation offers opportunities to reduce the
associated investment costs in the process. Moreover,
linked DC structures have the potential to increase the
reliability of energy transmission. They can be designed to
create redundant transmission systems. In order to make
such an approach feasible, technological, operational and
regulatory barriers still need to be eliminated, as do other
risks, for example with regard to liability issues. With that
in mind, the transmission system operators are pursuing
the strategy of planning future linked systems with tech-
nological fallback options.
Parallel to the grid development plan, 50Hertz, Amprion
and TenneT are investigating the international intercon-
nection potential and potential offshore grid topologies
in a joint offshore study. The offshore study shows that
national offshore interconnection offers an option to
leverage additional HVDC grid flexibility at minimum cost
and thus reduce the need for redispatch. Furthermore, an
international offshore interconnection demand has been
identified for Germany, which can be efficiently tapped
by interconnecting German offshore grid connection
systems with foreign offshore grid connection systems.
The current regulatory framework does not provide suf-
ficient incentives for cost-efficient and technology-neu-
tral innovations in the transmission grid or for digital
and climate-friendly solutions. Therefore, a regulatory
framework for innovative solutions in the transmission
grid independent of specific technologies is needed on the
way to climate neutrality. There is a need to address these
challenges and close the economic viability gap of new
technologies.
For a carbon-neutral energy system by 2045, the power,
gas and hydrogen sectors should be considered jointly
and interlinked more closely. Integrated system planning
makes it possible to leverage synergy potentials. The target
should be to ensure robust infrastructure planning of the
gas, hydrogen and power sectors.

Grid Development Plan Electricity 2037 / 2045, Version 2023, second draft 33
GDP compact
The consultation for the GDP 2037 / 2045 (2023) by the
TSOs took place from 24 March to 25 April 2023. During
this period, the TSOs received 288 submissions, of which
207 were different opinions. The difference is based on
the co-sign function. More than half of the comments
came from private individuals. But plenty of companies in
the energy sector and public authorities also participated
in the consultation. The TSOs also received comments
from citizens’ initiatives and environmental protection
associations.
The TSOs categorised the comments in the first draft
and examined them in detail. Subsequently, they revised
and supplemented the grid development plan accordingly.
Further explanations on the raised issues were added
to the respective chapters, and the project profiles in
the appendix were supplemented where necessary. The
comments address a wide range of aspects – here
is a selection:
While the previous consultation showed that quite a few
people care about achieving the 1.5 degree target, this
year many contributors wanted to make sure that there is
no ‘mislabelling’ in the term ‘climate neutrality network’.
Many consultation contributions refer to the input data
of the scenario framework. For example, the weather
year 2012 on which the calculations are based is con-
sidered outdated. In the future, more extreme weather
conditions are expected. In addition to heat, the cooling
factor should also be considered more urgently. For the
next scenario framework, the TSOs will examine whether
other weather parameters can be applied in the future.
In connection with the input data, many comments also
noted that a wider spread of the scenarios would be
desirable. If all three paths – A, B and C – lead to the
same target grid, the influence of the respective factors
is not discernible. The almost identical target grid of
this GDP in all three pathways shows that the measures
contained here are imperative. Sensitivity calculations,
for which the TSOs have no mandate within the framework
of the GDP, can be used to assess the effects of various
influence factors.
Security of supply is coming more to the fore as a topic
in this consultation than before. Private individuals are
particularly concerned about whether the power supply
will be secure in future. Security of supply analyses are
carried out within the scope of the Federal Network Agency:
national monitoring report on security of supply according
to § 51 (3) and 63 (2)(2) EnWG and at the European level
within the scope of the ERAA. The investigation security
of supply is not within the scope of the GDP.
The top issue from the economic and political spheres is
electrolyser allocation. Many companies have ambitious
climate targets and depend on the corresponding energy
infrastructure for their implementation.
Cities and municipalities are also registering their needs.
As there are still many uncertainties here, different solu-
tions are conceivable. The TSOs have received a lot of
support for their approach in this consultation.
Many comments called for a stronger interconnection of
power and gas infrastructure. This makes sense for effi-
cient planning of the energy system. The TSOs are making
a constructive contribution to integrated system develop-
ment planning.
Counties and municipalities as well as interest groups
are interested in which criteria the TSOs have used for
HVDC bundling.
The following overview outlines the different participation
steps and the respective issues in the planning of the
transmissin grid.
Further information on specific projects can be found on
the websites of your respective TSO and the BNetzA:
50Hertz Transmission GmbH: www.50hertz.com
Amprion GmbH: www.amprion.net
TenneT TSO GmbH: www.tennet.eu
TransnetBW GmbH: www.transnetbw.de
Federal Network Agency: www.netzausbau.de
Public consultation for
GDP 2037 / 2045 (2023)

Grid Development Plan Electricity 2037 / 2045, Version 2023, second draft 34
GDP compact
GDP Cycle 10 months
Revision and transfer to BNetzA
by transmission system operators
GDP second draft
Review / confirmation &
submission of environmental report
by the Federal Network Agency
Development and publication
by transmission system operators
GDP first draft
Development
by transmission system operators
Scenario framework
Inspection and approval
by the Federal Network Agency
by the federal legislator
Federal Demand Plan
Federal sectoral planning
/
spatial planning & planning
approval procedure
Structural implementation
» What are the future
prospects of the
various scenarios? «
» What principles
are used to identify
the necessary
measures? «
» How did the Federal
Network Agency verify
the measures? «
» What is the exact line
route? Which tech-
nology is being used –
where and why? «
Scenario framework consultation
Grid development Participation
Consultation for GDP second draft
Participation in formal proceedings
by the Federal
Network Agency
by the Federal
Network Agency
• Development forecast
of the energy industry
• Power consumption, fuel costs,
prices for CO₂ certificates
• Energy-related economic and
political framework conditions
• Regional distribution
of the generation plants
• Determining the transport require-
ments of the various scenarios
• Methodology and result
of the market modelling
• Methodology and result
of the grid analysis
• NOVA criteria
• Sustainability of the plans
• Result of the preliminary
assessment by the Federal
Network Agency
• Environmental report of the
Federal Network Agency in
addition to the results of the GDP
• Stipulation of expansion needs
• Stipulation of start and end points
• Approval procedure
• Underground cable / overhead line
• Route
• Environmental protection and
nature conservation
• Distances to residential buildings
• Applied technology
• Compensation and replacement
measures
• Tourism
by BNetzA or competent
stateauthorities; Public
participation by transmission
systemoperators and
public interest groups
by transmission
system operators
Consultation for GDP first draft
Figure 79: Participation in the planning of the transmission system grid
Source: Transmission system operators
1st draft
GDP
2nd draft
Environ-
mental
report
GDP
Federal
Demand Plan
Participation in the planning process of the transmission grid
Source: Transmission system operators
