
Applied Linear Regression in Matlab
rng(2017); % set the Random Number Generator
x = linspace(1,15,100)';
y = 2*x + (x+randn(size(x))).^2;
Calculating Pseudoinverses
We saw before how the general linear model can be solved for by finding the
pseudoinverse of the design matrix . Then our estimate for can be found via matrix
multiplication
For example, given a 5x3 design matrix
X = rand(5,3)
X =
0.5978 0.6104 0.7408
0.8466 0.9087 0.8940
0.4716 0.8236 0.2554
0.8076 0.2589 0.9636
0.5071 0.3713 0.1046
and a 5x1 response vector
y = rand(5,1)
y =
0.8001
0.6658
0.7738
0.3867
0.3185
we can estimate the parameters using the pinv function to calculate the pseudoinverse.
b = pinv(X)*y
b =
-0.0260
0.8084
0.1795
Matlab also offers the backslash operator (\) to solve linear systems.
b = X \ y
b =
-0.0260
0.8084
0.1795
The backslash operator will always choose the appropriate method for solving the system based on the
structure of the coefficient matrix. If the coefficient matrix is square and full rank, an efficient variant of
Gaussian elimination is selected. If the coefficient matrix is not square, pseudoinversion is used to find
the least-squared solution.
Simple Linear Regression
rng(2017); % set the Random Number Generator
x = linspace(1,15,100)';
y = 2*x + (x+randn(size(x))).^2;
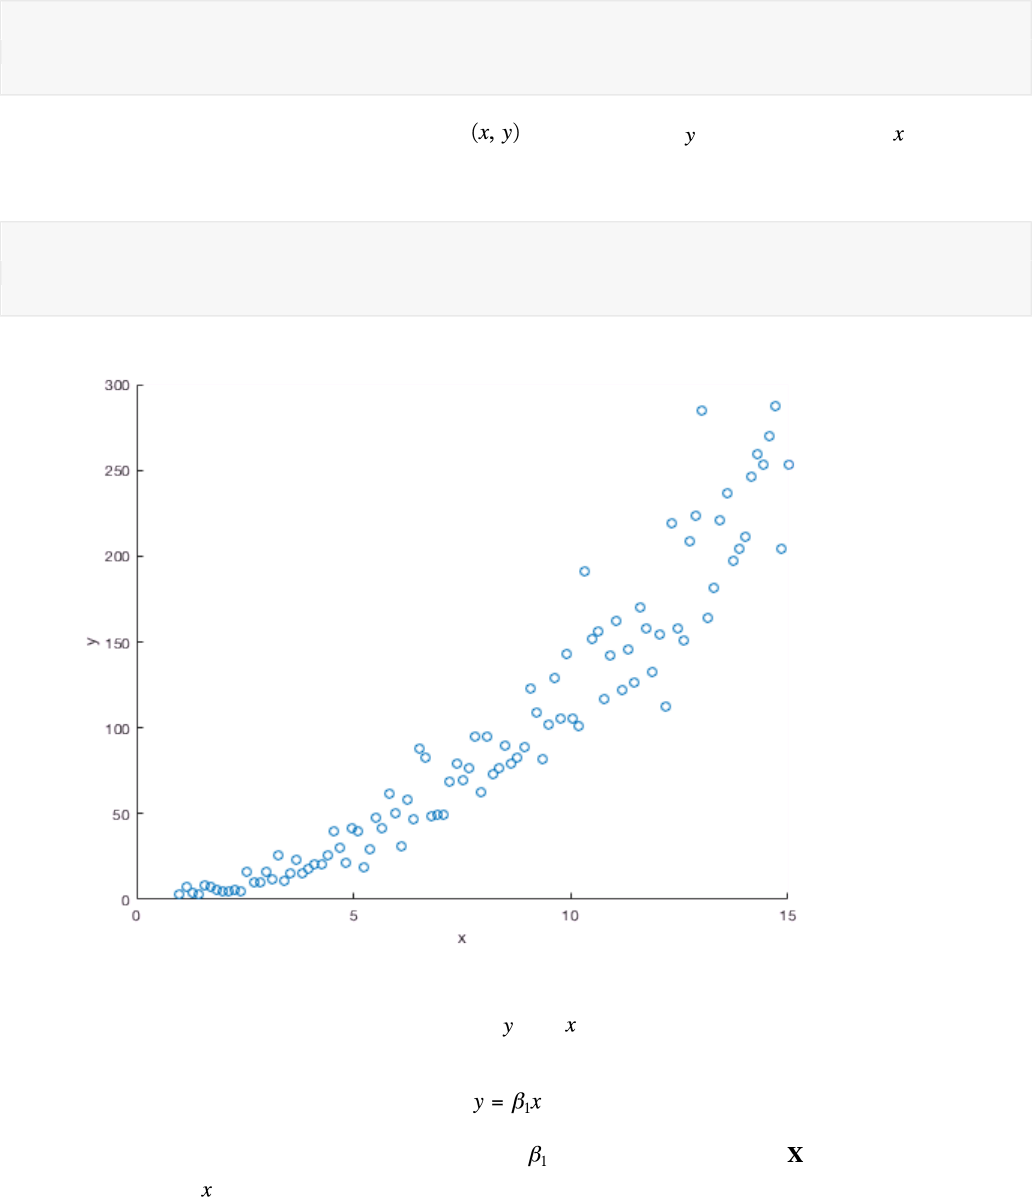
Imagine you are given a set of 100 pairs of data . We belive that is some function of ; can we
identify this function using linear regression? If possible, we always start by plotting the data. In Matlab,
we can use the scatter function to visualize individual points.
scatter(x,y)
xlabel('x')
ylabel('y')
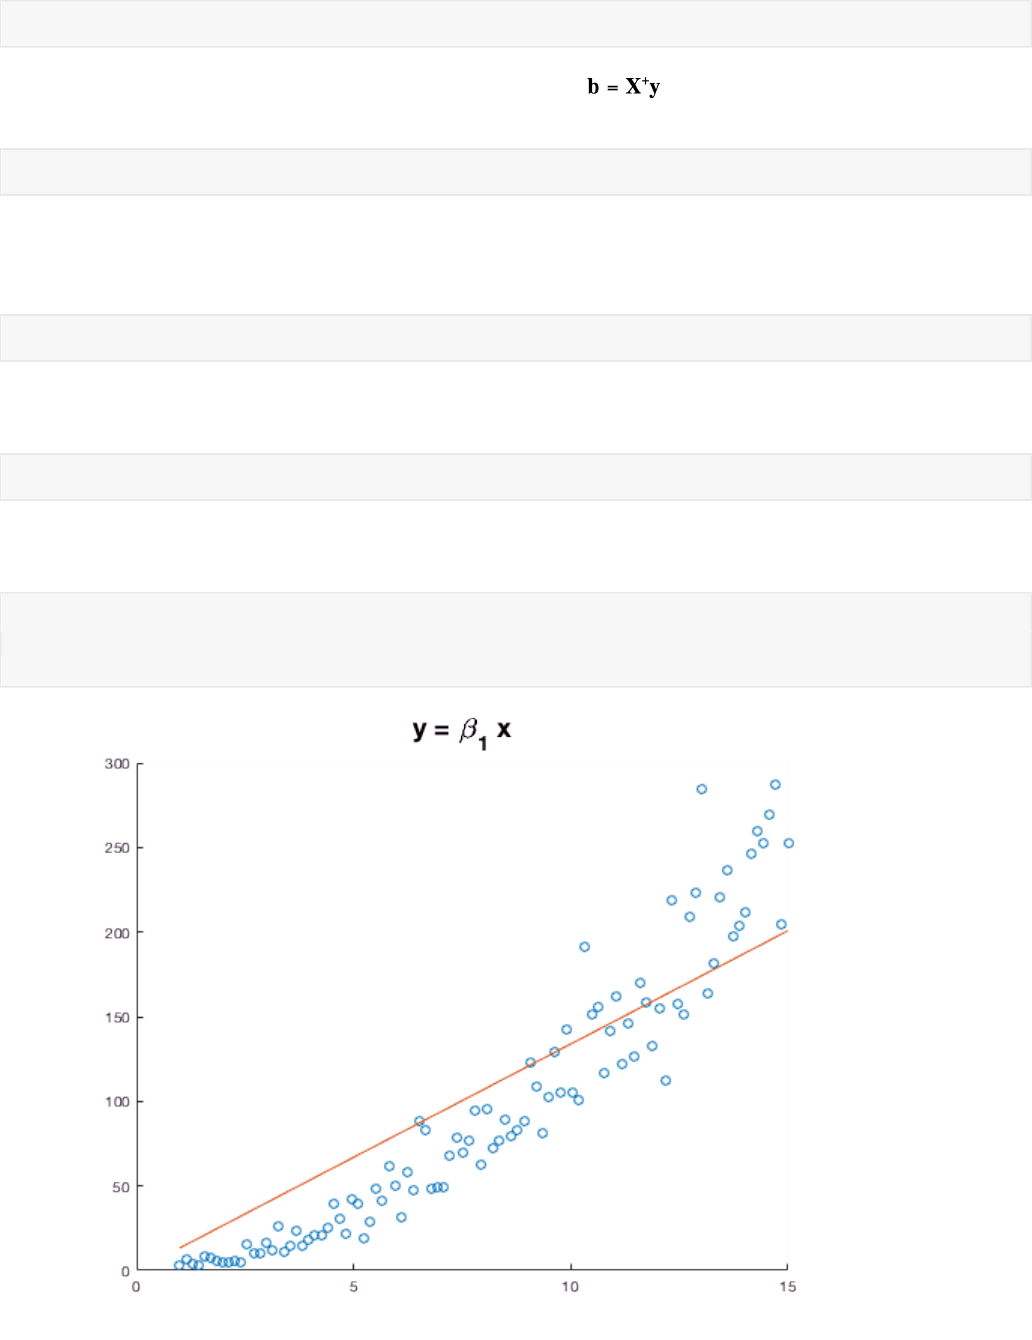
Clearly there is some positive relationship between and . Let's begin by fitting the simplest linear
model
In this case, we only have one parameter to estimate ( ), and the design matrix has only a single
column with the 100 values.
X = [x];
Let's solve for the parameter estimates by pseudoinversion ( ), or, equivalently, using the
backslash operator.
b = X \ y
b = 13.3924
Let's plot our model on the same plot as the original data. First, we plot the data.
scatter(x,y)
Then, we tell Matlab to "hold on". This prevents Matlab from making a new figure for subsequent plots
(until we tell it to "hold off").
hold on
Now we can plot a line with our model. The easiest way to multiply the design matrix by the parameter
estimates.
plot(x, X*b)
title('y = \beta_1 x', 'FontSize',18)
hold off
This does not seem to be a great fit. Maybe we need an intercept term, making our model
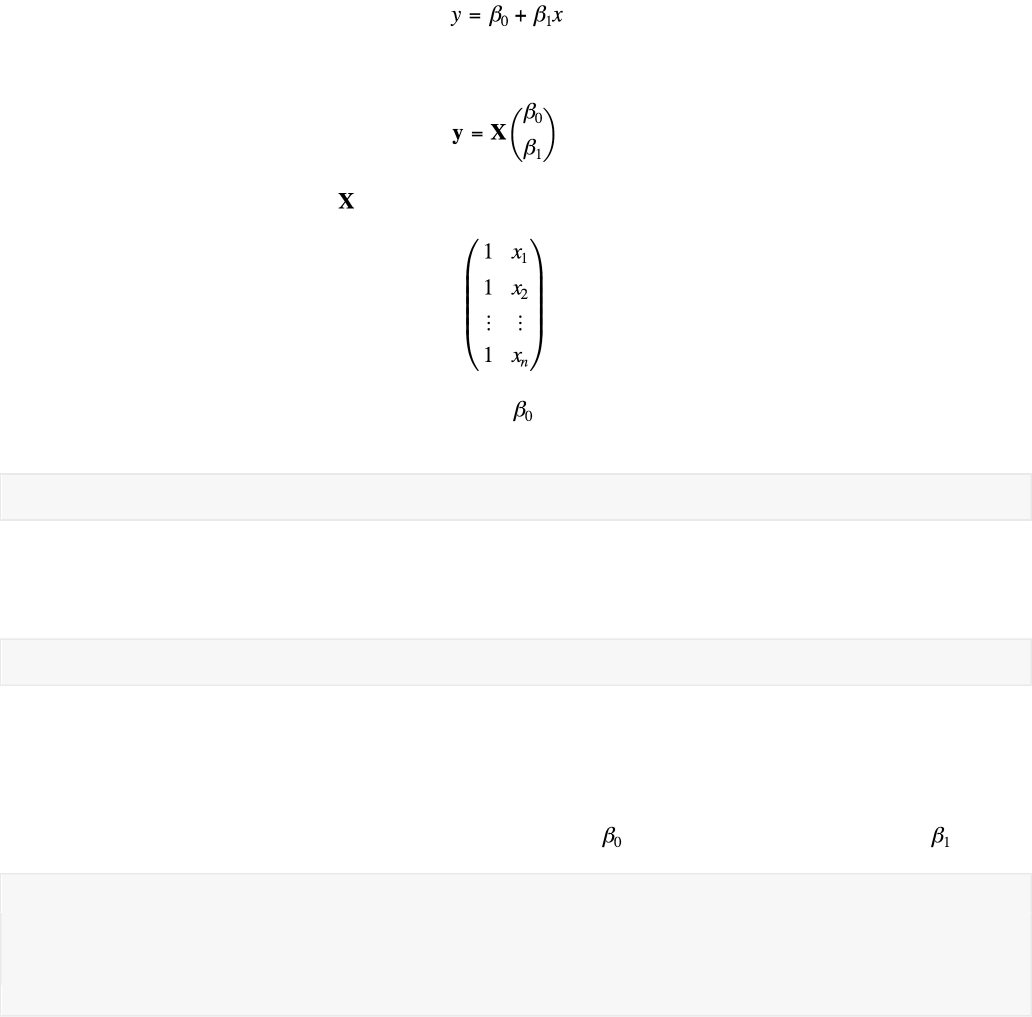
How do we add an intercept term? We want our final model to be of the form
This tells us that the design matrix should be
The column of ones on the left allows the parameter to stand alone as an intercept. Let's construct
this design matrix, solve for the parameters, and plot the new model.
X = [ones(size(x)) x];
We use the ones function to create a column of ones. The ones function accepts either two values
giving the dimensions (e.g. ones(3,4)) or the size of a similar matrix (ones(size(x))). Yes, in case
you're wondering, there is a zeros function.
b = X \ y
b =
-49.8172
18.3332
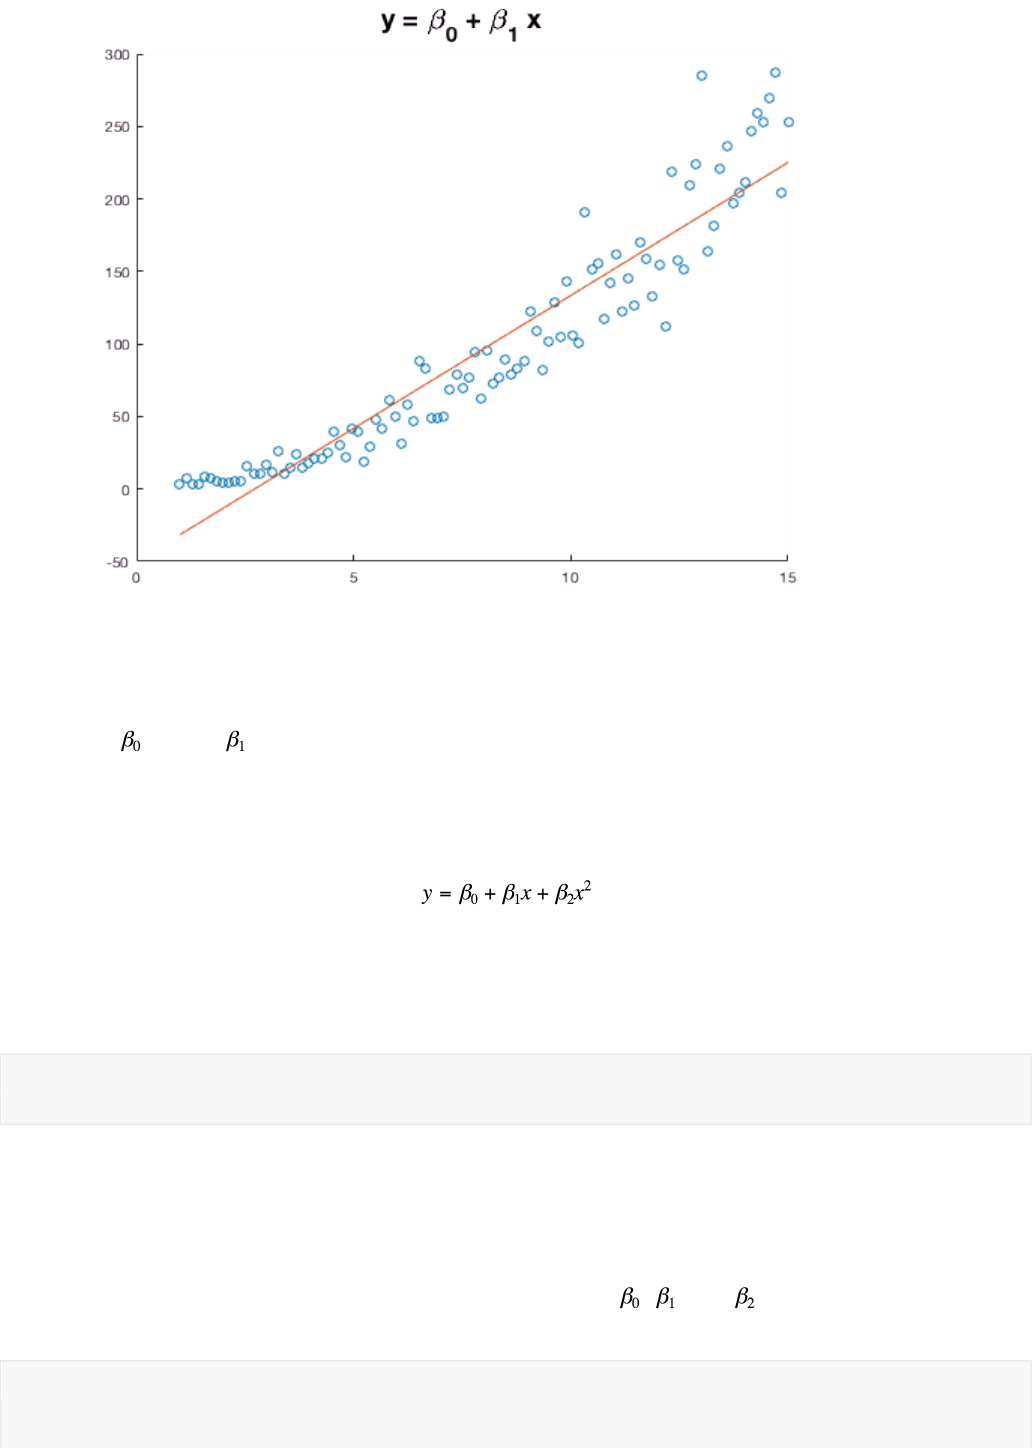
The vector b now has two entries. The first is our estimate for , the second is the estimate for .
scatter(x,y)
hold on
plot(x, X*b)
title('y = \beta_0 + \beta_1 x', 'FontSize',18)
hold off
To plot the line representing our model, we could have constructed the point manually as b(1) +
b(2).*x. Notice two things. First, Matlab indexes vectors starting at one, so b(1) is actually the
estimate for , not for . Second, Matlab distinguishes between matrix multiplication (*) and element-
by-element multiplication (.*).
This is still not a great fit. Based on the slight upward curve in the data, a quadratic model may be more
appropriate. This model would be
Fortunately, we can still fit quadratic polynomials (and, in fact, all polynomials) since all polynomials
are linear with respect to the parameters. To fit a quadratic, we add a column to the design matrix
that contains the square of each element in the vector x. (We will use the element-by-element
exponentiation operator .^ here; matrix exponentiation is completely different.)
X = [ones(size(x)) x x.^2];
b = X \ y
b =
0.3349
1.3816
1.0595
Our vector of estimates now has three entries corresponding to , , and . Let's plot the quadratic
model.
scatter(x,y)
hold on
plot(x, X*b)
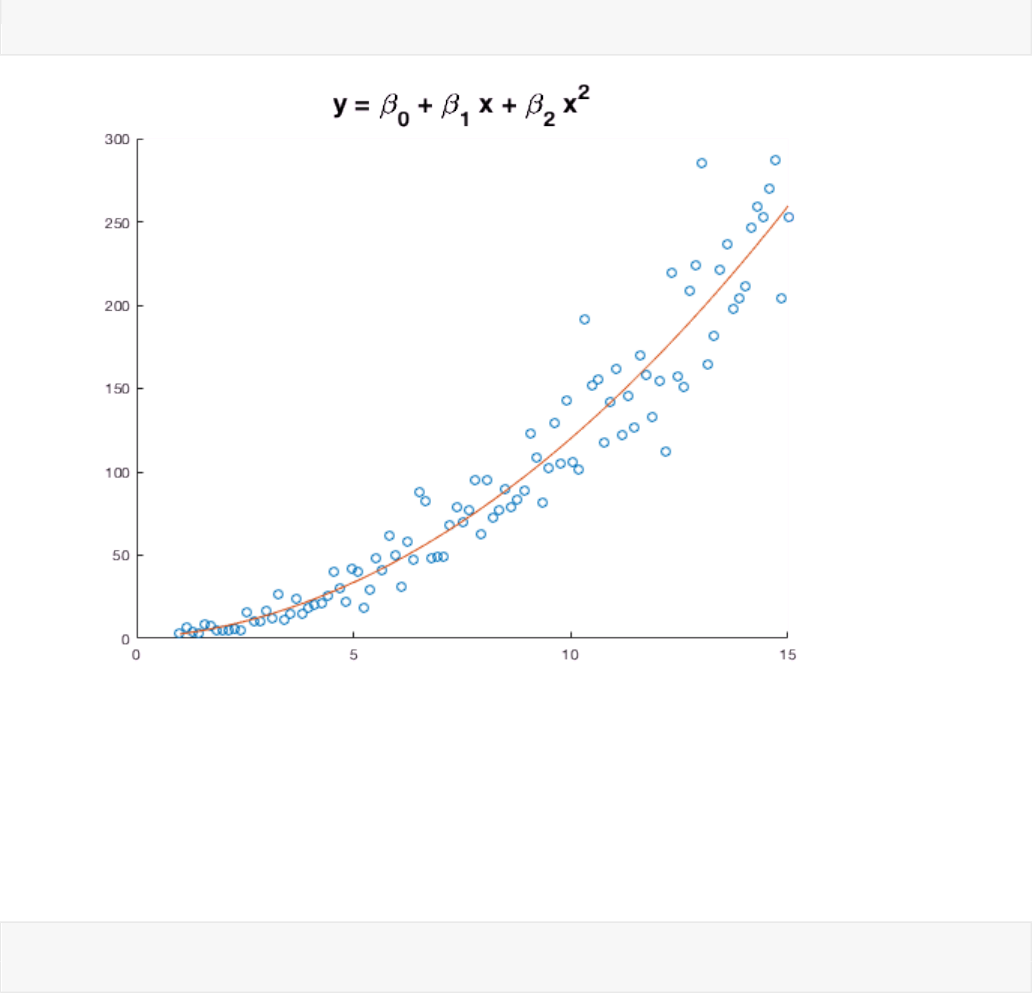
title('y = \beta_0 + \beta_1 x + \beta_2 x^2', 'FontSize',18)
hold off
That looks like a much better fit. These data appear to have a quadratic relationship.
Linear Regression with fitlm
Matlab offers an easier method for fitting linear models -- the fitlm function. To use fitlm, we start by
placing our data in a Matlab table.
tbl = table(x,y);
head(tbl) % head shows only a few entries of large tables
ans = 8×2 table
x y
______ ______
1 3.357
1.1414 7.0774
1.2828 3.6488
1.4242 2.8731
1.5657 8.2716
1.7071 7.6963
1.8485 5.3921
1.9899 4.6634
Each variable given to the table function becomes a column in the table. The names of the columns
are the names of the variables in the call to table. (If Matlab can't find the names, for example if you
call table(log(x), y+3), it names the columns "Var1", "Var2", etc.). You can change the names of
an existing table by setting tbl.Properties.VariableNames = {'name1', 'name2', ...}.

The column names are important, as we refer to variables by these names when specifying our linear
model.
Now that we have our data in a table, we call fitlm.
model1 = fitlm(tbl, 'y ~ x')
model1 =
Linear regression model:
y ~ 1 + x
Estimated Coefficients:
Estimate SE tStat pValue
________ _______ _______ __________
(Intercept) -49.817 5.7739 -8.6281 1.1389e-13
x 18.333 0.64288 28.517 3.0026e-49
Number of observations: 100, Error degrees of freedom: 98
Root Mean Squared Error: 26.2
R-squared: 0.892, Adjusted R-Squared 0.891
F-statistic vs. constant model: 813, p-value = 3e-49
The first argument to fitlm is the table containing your data. The second argument is a string
specifying the formula for the linear model. To specify a formula:
•
Use a tilde to separate the response variable ( ) from the input variables ( , , etc.).
• Do not include the names of the parameters; only the input variables. For example, we say 'y ~ x'
not 'y ~ b*x'. The fitlm function adds a parameter for each term in the model.
• fitlm always adds an intercept by default. To turn off this behavior, call fitlm with the
'intercept' option set to false, i.e. fitlm(..., 'intercept', false).
• The names of the response and input variables must match column names in the table.
The output from fitlm begins by stating the specified model. Again, no parameters appear. If an
intercept was added, it appears as a 1 (just like the column of ones in the design matrix). Next is a table
of the fit parameters -- an estimate of each coefficient in the model, including the intercept. Along with
providing the numerical value of the coefficient, fitlm also reports the standard error for the estimate.
The standard errors are calculated using the degrees of freedom left over in the data. So long as the
number of observations is greater than the number of variables, fitlm will be able to provide errors for
each coefficient.
Using the standard errors, we can construct confidence intervals around the parameter estimates. It
is important to know if the confidence interval includes zero. If so, then we cannot reject the possibility
that the true value of the parameter is zero. If the true value is zero, we should not draw any inferences
regarding the estimated coefficient, since we cannot statistically distinguish the parameter from zero.
To help identify statistically significant parameters, fitlm performs a modified t-test on the parameter
estimates. Using the t-statistic ("tStat" in the fitlm output), a p-value is calculated. Only those
estimates with p-values below out significance threshold (e.g. 0.05) should be interpreted.
fitlm also provides summary statistics on the model as a whole. The most commonly used metris is
the coefficient of determination ( ). Values near one are ideal; however, there is not widely accepted
cutoff for "good" vs. "bad" values. Instead, you should consider the F-statistic. This test measures
if the model performs better than a null model -- a model that discards the inputs and returns only a
constant value.
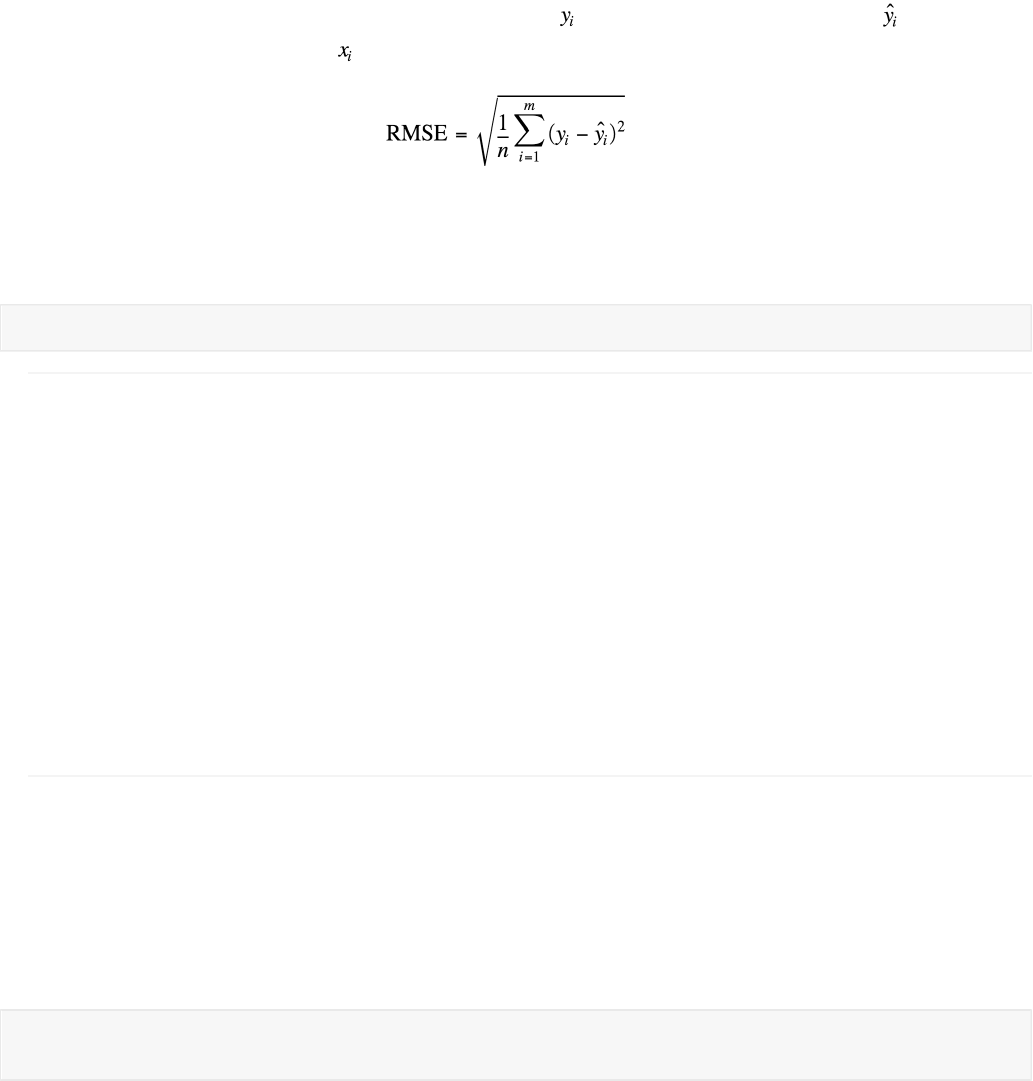
Finally, fitlm provides the root mean squared error (RMSE). This measures the accuracy of the
model and summarizes how closely estimates made with the model match the observed responses.
To calculate the RMSE, we use the observed responses ( ) and the predicted responses ( ) from our
model on the corresponing inputs ( ). Then the RMSE is
The RMSE is the square root of the average penalty (the squared error) found during the least squares
estimation.
Let's use fitlm to fit our quadratic model.
model2 = fitlm(tbl, 'y ~ x^2')
model2 =
Linear regression model:
y ~ 1 + x + x^2
Estimated Coefficients:
Estimate SE tStat pValue
________ _______ ________ __________
(Intercept) 0.33485 8.0944 0.041369 0.96709
x 1.3816 2.3069 0.59887 0.55065
x^2 1.0595 0.14057 7.537 2.5514e-11
Number of observations: 100, Error degrees of freedom: 97
Root Mean Squared Error: 20.9
R-squared: 0.932, Adjusted R-Squared 0.931
F-statistic vs. constant model: 667, p-value = 2.1e-57
For convenience, adding a quadratic term in the fitlm formula expands to include the linear term. This
behavior can be disabled using the 'purequadratic' option.
Exploratory Data Analysis with Linear Models
We can use linear modeling to identify factors that significantly affect an outcome. For example, lets use
Matlab's builtin set of simulated hospital records.
load hospital_records
hospital(1:10,:)
ans =
LastName Sex Age Weight Smoker BloodPressure
YPL-320 'SMITH' Male 38 176 true 124 93
GLI-532 'JOHNSON' Male 43 163 false 109 77
PNI-258 'WILLIAMS' Female 38 131 false 125 83
MIJ-579 'JONES' Female 40 133 false 117 75
XLK-030 'BROWN' Female 49 119 false 122 80
TFP-518 'DAVIS' Female 46 142 false 121 70
LPD-746 'MILLER' Female 33 142 true 130 88
ATA-945 'WILSON' Male 40 180 false 115 82
VNL-702 'MOORE' Male 28 183 false 115 78
LQW-768 'TAYLOR' Female 31 132 false 118 86

We want to identify any factors (sex, age, weight, or smoking) that increase blood pressure. We will
build a linear model that combines these factors to predict blood pressure. First, let's average the
systolic and diastolic blood pressures into a single value that we can use as our response variable.
hospital.meanBP = mean(hospital.BloodPressure,2);
hospital(1:10,:)
ans =
LastName Sex Age Weight Smoker BloodPressure meanBP
YPL-320 'SMITH' Male 38 176 true 124 93 108.5
GLI-532 'JOHNSON' Male 43 163 false 109 77 93
PNI-258 'WILLIAMS' Female 38 131 false 125 83 104
MIJ-579 'JONES' Female 40 133 false 117 75 96
XLK-030 'BROWN' Female 49 119 false 122 80 101
TFP-518 'DAVIS' Female 46 142 false 121 70 95.5
LPD-746 'MILLER' Female 33 142 true 130 88 109
ATA-945 'WILSON' Male 40 180 false 115 82 98.5
VNL-702 'MOORE' Male 28 183 false 115 78 96.5
LQW-768 'TAYLOR' Female 31 132 false 118 86 102
We added another column, "meanBP" to the hospital table. The second argument to mean tells the
function to calculate the means along the second dimension. This gives us the mean for each row.
Now we build and fit a linear model using fitlm.
fitlm(hospital, 'meanBP ~ Sex + Age + Weight + Smoker')
ans =
Linear regression model:
meanBP ~ 1 + Sex + Age + Weight + Smoker
Estimated Coefficients:
Estimate SE tStat pValue
__________ ________ _________ __________
(Intercept) 97.09 5.4093 17.949 2.7832e-32
Sex_Male 0.51095 2.0897 0.24451 0.80737
Age 0.058337 0.047726 1.2224 0.2246
Weight -0.0008026 0.039503 -0.020317 0.98383
Smoker_1 10.088 0.73786 13.672 3.6239e-24
Number of observations: 100, Error degrees of freedom: 95
Root Mean Squared Error: 3.41
R-squared: 0.683, Adjusted R-Squared 0.67
F-statistic vs. constant model: 51.2, p-value = 6.55e-23
Looking at the coefficient estimates, we find that only smoking is a significant predictor. The coefficient
is 10.1, so smokers on average have a blood pressure that is 10 mmHg higher than non-smokers.
Be careful in interpreting the intercept of this model. The intercept is the response value when all
inputs are zero. For this example, all zero inputs would be a female non-smoker of age zero that
weighs nothing. Instead, we can find an average blood pressure for a 30 year old, 100 pound female
nonsmoker as
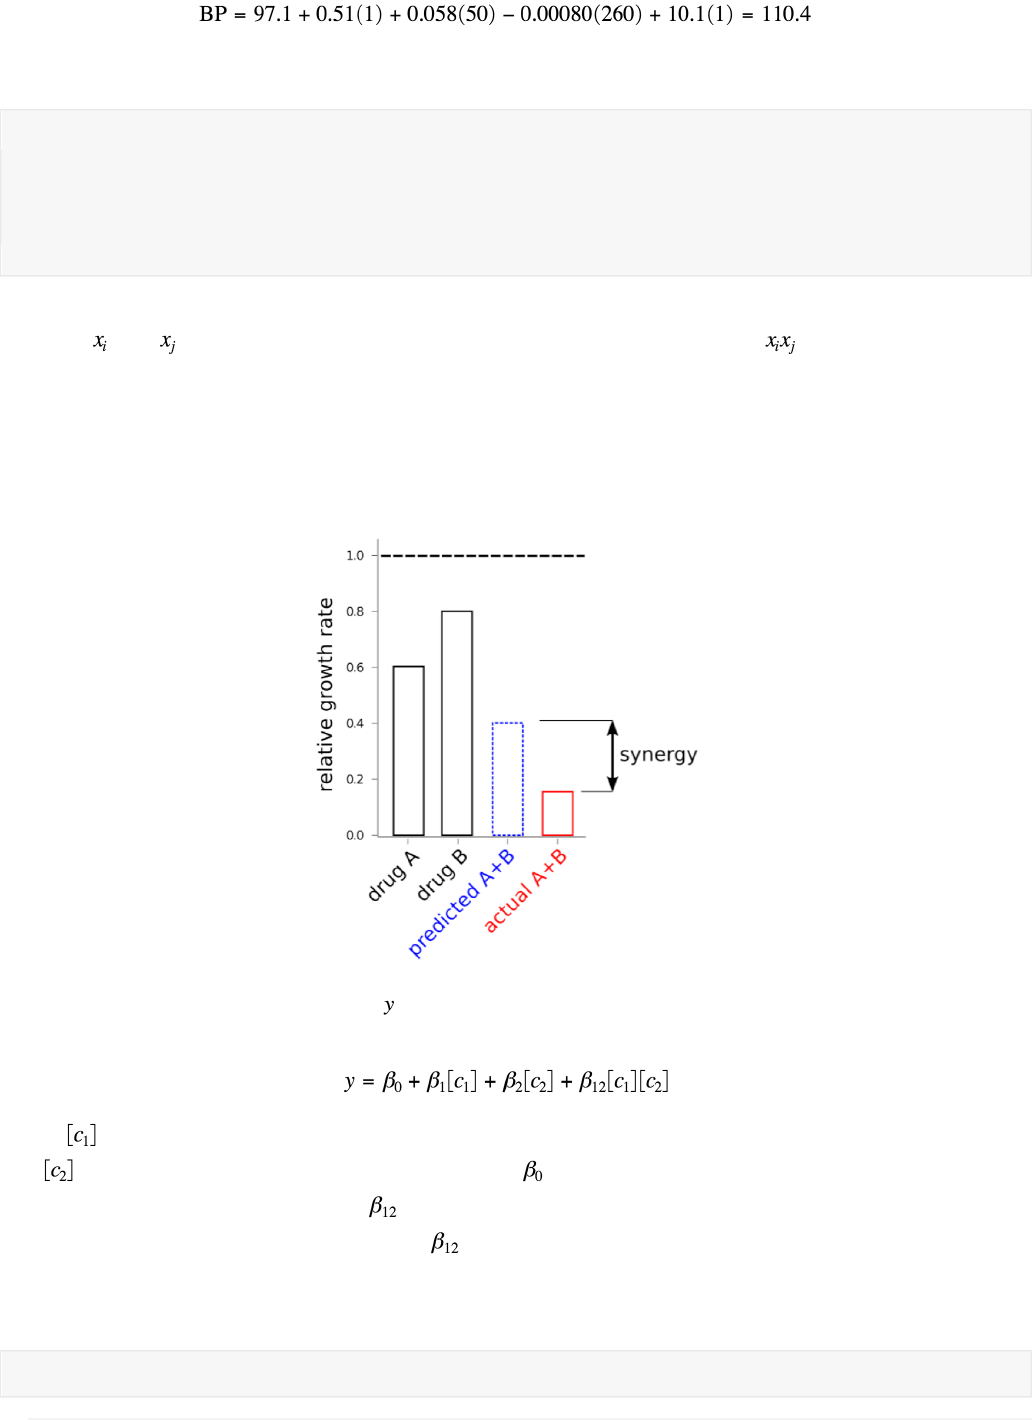
For a 50 year old, 260 pound male smoker, the estimate would be
Interactions
rng(61112);
conc_A = rand(15,1);
conc_B = rand(15,1);
response = 3.*conc_A + 4.5.*conc_B + 12.5.*conc_A.*conc_B + 0.5.*randn(15,1);
drug = table(response, conc_A, conc_B);
Linear models can test for significant interactions between variables. To include interactions between
variables and , we add a new term that is the product of the two variables ( ). We choose
multiplication to combine the variables since this interaction term will only be nonzero when both
variables are nonzero; thus, the interaction is suppressed when either variable is not observed.
Interactions are commonly used to test for synergy between drugs. For drugs to synergize, the observed
response must be greater than the expected additive effects of the two drugs alone. (If the drugs
response is lower than expected, the drugs are antagonistic.)
We modeled the response to the drug ( ) as a linear combination of the two drugs independently plus
an interaction term:
where is the concentration of drug 1 (or log-concentration, as dose responses are often log-linear),
and is the concentration of drug 2. The intercept ( ) is the basal response of the assay when
neither drug is added. The parameter corresponds to the strength of the interaction. If we fit the
above model and find a significant, nonzero term, we can conclude that some nonlinear interaction
exists between the drugs.
Let's test for synergy with the following drug response data (with concentration is log scale).
drug
drug = 15×3 table

response conc_A conc_B
________ ________ ________
2.9375 0.78812 0.056482
6.9199 0.48957 0.51783
2.6542 0.53637 0.075296
9.3316 0.32535 0.88539
8.567 0.82917 0.34905
16.306 0.98211 0.80744
1.6428 0.63671 0.017543
5.6819 0.070839 0.93119
2.5009 0.54116 0.079158
3.9707 0.89685 0.029386
2.2057 0.62384 0.043192
13.62 0.60518 0.98991
14.015 0.892 0.74739
4.924 0.37901 0.39126
4.993 0.15946 0.6222
In fitlm formulas, interactions are specified by combining the two variable names with a colon
(x1:x2). As a shortcut, we can add both linear terms and an interaction term using the * operator. The
formula response ~ x1 + x2 + x1:x2 is equivalent to the formula response ~ x1 * x2.
First, let's fit a linear model without interaction.
model_lin = fitlm(drug, 'response ~ conc_A + conc_B')
model_lin =
Linear regression model:
response ~ 1 + conc_A + conc_B
Estimated Coefficients:
Estimate SE tStat pValue
________ _______ _______ __________
(Intercept) -5.0689 0.69951 -7.2464 1.0197e-05
conc_A 10.887 0.89216 12.202 4.0126e-08
conc_B 12.378 0.64862 19.083 2.4105e-10
Number of observations: 15, Error degrees of freedom: 12
Root Mean Squared Error: 0.861
R-squared: 0.972, Adjusted R-Squared 0.967
F-statistic vs. constant model: 205, p-value = 5.28e-10
We would like to plot the data and our model. Unfortunately, the multiple input variables makes
visualization difficult. Instead, we can get a sense for our model's accuracy by plotting the observed
response values vs. the model's predicted response values. (We use the predict function to find
the predicted values from a fitted model and the original data table. We also add a diagonal line
corresponding to perfect correlation.)
scatter(drug.response, predict(model_lin,drug))
xlabel('Predicted');
ylabel('Observed');
title('Linear Terms Only');
hold on
plot([0 17], [0 17])
hold off
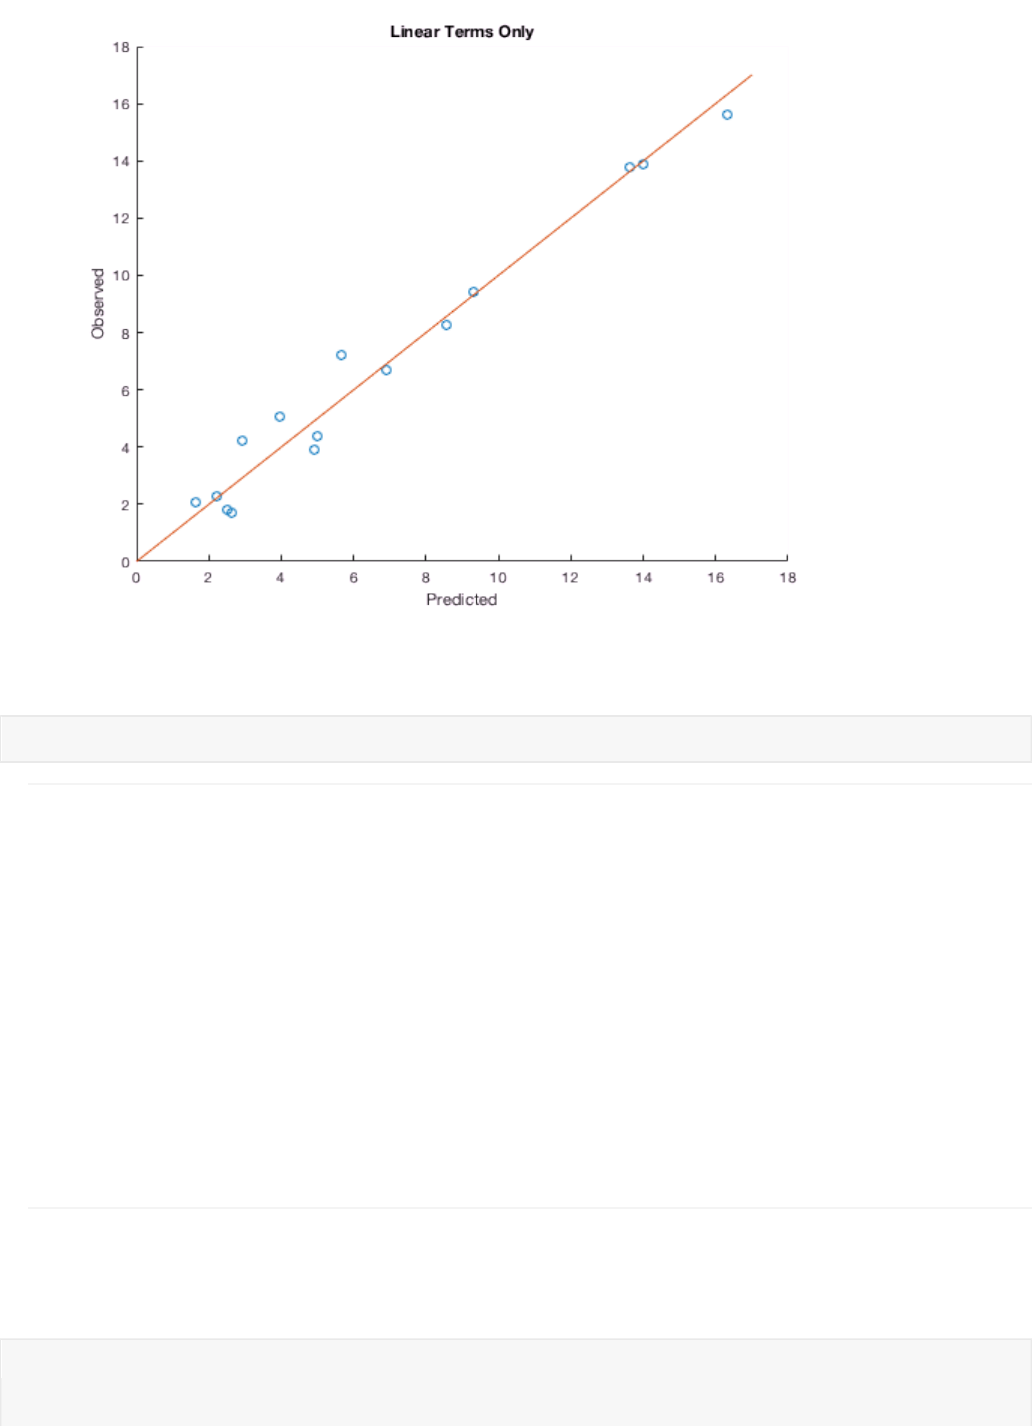
This isn't a bad model fit, but it can clearly be improved. Maybe the interaction terms will help.
model_int = fitlm(drug, 'response ~ conc_A * conc_B')
model_int =
Linear regression model:
response ~ 1 + conc_A*conc_B
Estimated Coefficients:
Estimate SE tStat pValue
________ _______ ______ __________
(Intercept) -0.94009 0.71872 -1.308 0.21755
conc_A 4.5727 1.0626 4.3034 0.0012489
conc_B 6.44 0.96668 6.662 3.5531e-05
conc_A:conc_B 9.4829 1.4631 6.4815 4.5414e-05
Number of observations: 15, Error degrees of freedom: 11
Root Mean Squared Error: 0.409
R-squared: 0.994, Adjusted R-Squared 0.992
F-statistic vs. constant model: 618, p-value = 1.55e-12
The coefficient of the interaction term is statistically significant at p < 0.05. The coefficient is also
positive, indicating synergy between the drugs. Let's see if taking the synergy into account improves our
predictions.
scatter(drug.response, predict(model_int,drug))
xlabel('Predicted');
ylabel('Observed');
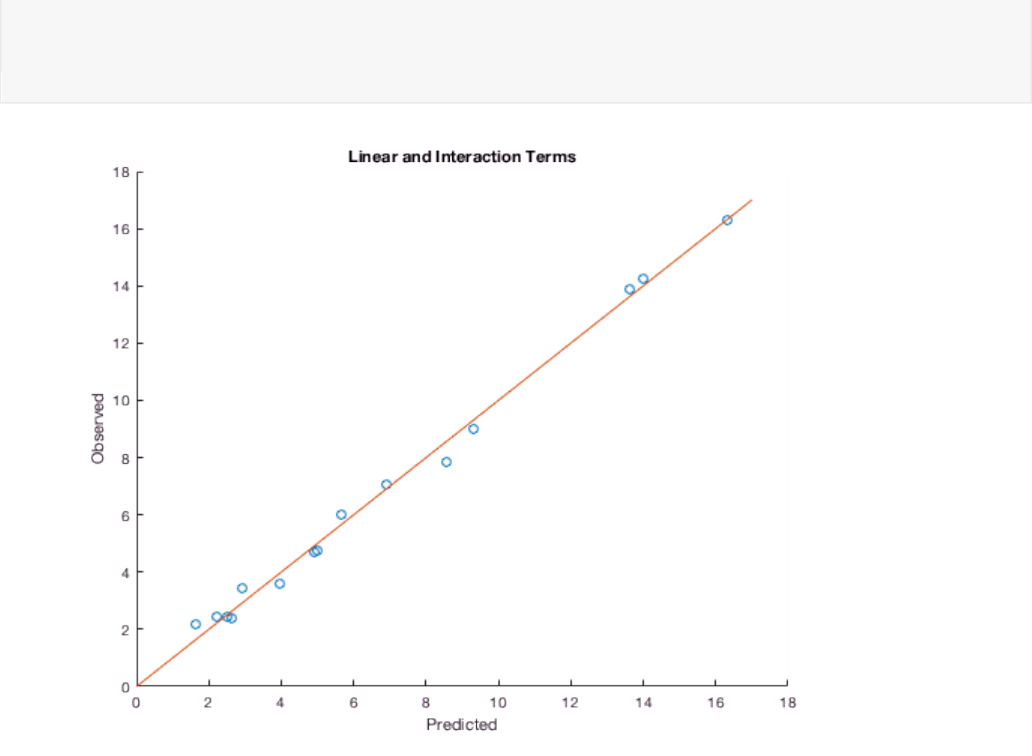
title('Linear and Interaction Terms');
hold on
plot([0 17], [0 17])
hold off
The model with the interaction term is a better predictor of the drug response.
