Development of a Data Pipeline for Sentiment and
Similarity Analysis in Stack Overflow’s
Programming Language Discussions
Spring 2024
Author: Maria Paytyan
Anahit Zakaryan
BS in Data Science
American University of Armenia
Supervisor: Arman Asryan
American University of Armenia
Abstract—This capstone project presents a data pipeline de-
velopment for sentiment and similarity analysis of programming
language discussions in the StackOverflow environment during
the month of April 2024. By employing advanced language model
technologies, the study systematically classifies emotional content
and recognizes similarities across user interactions. Selenium
and StackExchange Data Explorer were used to achieve an
automated, up-to-date data collection, with the data processing
executed in Python and stored within Google Cloud’s Big-
Query. EmoRoBERTa was employed to specify the principal
emotional tones and precise sentiments associated with distinct
programming issues. The sentiment analysis showed that 30%
of user interactions contained various emotions, including anger,
disappointment, and others. Simultaneously, the Sentence-BERT
model and cosine similarity assessments were used to take out
similar or almost identical posts to prevent the possible issue
of accidental duplicate questions. The model was able to detect
identical posts across the StackOverflow programming languages
discussions with a similarity score of above 95%. The project
improves the understanding of the community dynamic on the
StackOverflow website with the help of studies of different
algorithms and methods while revealing the potential of applying
sophisticated natural language processing techniques to complex,
real-world datasets.
I. INTRODUCTION
StackOverflow, being the biggest open-source platform for
programmers to share views, has changed the way that in-
formation is shared within the programming community to a
great extent. This two-way platform makes it easy to share
ideas and solutions at lightning speed and ultimately evolve
the software development industry. The benefits that come
from these forums can hardly be denied, but they are not left
untouched by the problems that could jeopardize any other
online community, and the main one is obviously the issue of
toxic interaction among their members.
In recent years, people have found the community very
toxic, which can lead to its users asking their questions in other
communities, therefore harming StackOverflow as a business.
Initially, everyone could ask anything; however, with the rise
of users, StackOverflow presented a new regulation tactic,
which is the rating system [9]. This rating system introduced
a very unequal distribution among users, where more than
18 million users had a reputation under 200. Moreover, this
low ranking does not allow users to have some privileges in
the community. Therefore, users with very low rankings will
mostly get answers full of sarcastic advice on how to be a
proper member of the “elite” in the community or simply get
harmful statements about their question (i.e., it is irrelevant or
“stupid”) [9].
Besides this bad treatment, another problem is the duplicate
questions. After surfing the web, developers turn to StackOver-
flow to find a solution to their problem. Nevertheless, if they
ask a similar question, it can be flagged as a duplicate and get
deleted; this is referred to as “accidental duplicates” [11].
Studies show that harmful behaviors and hostile exchanges
may hinder the spirit of cooperation and mutual support that
StackOverflow wants to create. These negative interactions are
not only detrimental to effective communication but also pose
a threat to the sense of belonging and knowledge sharing as the
users tend to avoid engagement. This might lead to a decrease
in community interactions. However, StackOverflow is one of
many cases. There is a general commonality of online hate
among various digital platforms.
The main objective of the research is to overcome the prob-
lems by employing a data pipeline to analyze the sentiments
and themes of general programming language discussions on
Stack Overflow. This paper proposes to perform sentiment
and similarity analysis in order to discover existing negative
patterns and indicate signs that may be helpful in preventing
asking questions and avoiding the “accidental duplicates”
problem.
Moreover, innovative methodologies in transformers and
computational linguistics are explored to evaluate and under-
stand the sentiments in the programming-related discussions
systematically. This research project aims to contribute to the
general field of online community management by providing
valuable insights that can help in managing a more positive
interaction space. By emphasizing these needs that should be
improved, the aim is to help StackOverflow, as well as other

platforms, enhance their community atmosphere and prevent
users from getting their questions deleted, thus providing a
healthy and productive space for everyone.
II. TOOLS AND METHODS
In the development of the analytical framework, a com-
bination of tools and methods was used to enable efficient
data retrieval, analysis, and storage. The data retrieval was
done using SQL scripts executed through Python and Bash
files, and it was facilitated by VisualStudioCode as the main
development environment. This automation of data retrieval
provided coding and debugging processes.
The data was automatically downloaded from the Stack-
Exchange website. To do so, Selenium, which is a tool for
automating web browsers, was incorporated to dynamically
generate SQL queries, which adapted to weekly data require-
ments. After retrieval, the data was stored in a CSV format and
managed using Google APIs, which allowed the automated
download of these files to Google Drive, ensuring data was
safe and readily obtainable.
After getting the data, the structure of the database was
thoroughly designed using DBDiagram.io to visualize and
plan the schema. The visualized database was implemented
in Google Cloud’s BigQuery platform. The latter provided
strong architecture to handle the insertion and management
of large datasets. PowerBI was used to show the overall
statistics about the data and users and make the report more
visually pleasing. Matplotlib and Seaborn data visualization
Python packages were also used to visualize the analysis. To
demonstrate the Pipeline Flow draw.io was used.
The environment of Google Collab was used to do both the
sentiment and similarity analysis. VADER model (for Valence
Aware Dictionary for sEntiment Reasoning) from the NLTK
library, which is “a lexicon and rule-based feeling analysis in-
strument,” was used in researching the nuances of sentiment in
the obtained StackOverflow data [12]. RoBERTa: A Robustly
Optimized BERT Pretraining Approach and EmoRoBERTa
were integrated from HuggingFace’s transformers library
for the categorization of emotions more delicately and accu-
rately [10] [14].
Sentence-BERT (SBERT) model, which analyzes words in
a text by taking into account contexts from left to right and
left to right, was used to perform similarity analysis on the
data [13].
III. DATA
A. Pipeline Flow
Implementing a data pipeline instead of depending on
periodic data downloads ensures up-to-date and accurate data
retrieval on a weekly basis, which is critical for dynamic and
up-to-date analysis, a condition not satisfied by the quarterly
updates of the Stack Exchange data dumps.
The first phase is the composition of the database with
its appropriate dimensional fact tables initialized in BigQuery
designed in dbdiagram.io 1. To perform this action, Python
scripts were created that are run with the help of a bash file and
Fig. 1: Database Design
specific authentication of Google APIs in the local terminal.
There is also the creation of a folder in Google Drive with
two subfolders, raw_data and view_data, for storing the
fetched data later. This whole process is performed only once.
The next step is the running of one bash file in the
local terminal, which initiates the automatic execution of four
distinct bash files, each with its own usage and purpose.
1) The first bash file aids in the creation of the queries,
logging into the website with the StackOverflow ac-
count, downloading the weekly data for the first query,
moving the data from downloads to the current directory,
creating a subfolder in the Google Drive with the given
name of the week, uploading the already created CSV in
the folder from the local environment to Google Drive,
while deleting from it from the first location. After, the
two CSV files are taken from the newly created folder,
forming tables in the BigQuery based on the CSV, and
the data is then inserted into the tables accordingly.
2) The second bash file does the same process for the
second query, except for the folder creation in Google
Drive.
3) The third bash file merges the two distinct tables into
one, with an additional column that represents the upload
time, as well as updates all the dimensional and fact
tables.
4) The fourth bash file creates view_post and
view_table data based on the specified week
and saves them independently in the Google Drive
view_tables folder.
The pipeline will consistently update and organize data
within the designated folders.
B. Data Description
The fetched CSV files both contain different purposes. The
first one downloads the posts in the given week range with
their corresponding comments. The second CSV file focuses
on the comments that were written in the same time span
but whose posts were documented prior to that period. All
of these posts and comments are downloaded if they include
the following tags with the most common programming lan-
guages: Python, Java, Javascript, PHP, SQL, Postgres, Rand,
Ruby, C++, C#, HTML, CSS, and R.
As of right now, the view_table folder contains
eight files, divided equally between two datasets,
view_comments, and view_posts, which collectively
have approximately 100,000 rows. These datasets are
organized into four sets each, corresponding to the weekly
data segments of April 2024: April 1-7, April 8-14, April
15-21, and April 22-28.
IV. LITERATURE REVIEW
Lately, natural language processing and machine learning
have provided novel opportunities for the exploration of textual
data across various media. With the massive amount of data
now flooding social media and technical forums like Stack
Overflow, more and more attention has been focusing on the
use of complex analytical methods to analyze these huge text
corpora.
The development of text similarity measures over the years
has tremendously enhanced how textual data is processed and
understood in different fields, including academia and industry.
Similarity analysis (which Sarkar calls Text Analytics with
Python) pertains to both lexical and semantic dimensions,
where it evaluates the proximity of the text entities to each
other either through direct syntactic similarity or deeper,
contextual relations [15] [17]. Lexical similarity is usually
achieved by simple methods like Bag of Words, while semantic
similarity addresses the meaning and contexts in text and is
often based on more complex computing methods.
The SBERT, the Sentence BERT, was born in NLP a
couple of years ago and has become a milestone in the
domain of text similarity analysis [17]. SBERT, according to
the writing of Sen and Efimov, extends BERT (Bidirectional
Encoder Representations from Transformers) by combining
the Siamese network architecture to ease the generation of
embeddings for the sentences and, therefore, overcome the
limitations of BERT in sentence embeddings [13] [18]. This
development specifically gives a chance for effective sentence
similarity measurement, which is crucial for tasks such as
semantic search, text clustering, and more dynamic interaction
systems like chatbots or recommendation systems. SBERT
enhances similarity calculations by embedding phrases such
that semantically close sentences are closer in vector space.
They do that by using cosine similarity to measure these
relationships.
By enhancing the precision and efficiency of generating
sentence embeddings, SBERT supports more nuanced and
scalable applications, enabling rapid comparisons across large
text corpora [7] [8]. This capability is particularly valuable
in fields requiring quick and accurate semantic analysis, such
as content recommendation systems or automated customer
support, where understanding and matching user queries to
relevant answers is critical. Thus, the developments in sen-
tence embedding technologies, spearheaded by innovations
like SBERT, represent a crucial evolution in the analytics of
text similarity, paving the way for more intelligent and re-
sponsive systems in information retrieval and natural language
processing [17].
One of the key research studies by Ling and Lars
´
en was cen-
tered around the sentiment in the Stack Overflow discussions
[19]. The Senti4SD was then used to evaluate the sentiment
based on different types of documents and coding languages,
classifying them as either positive, negative, or neutral. Their
results contained really high connections between sentiment
trends, the type of document, and the programming language
in use. This type of exploration would be useful in tracking
the sentiment atmosphere as a whole and thus could be used
as a basis for assessing the tone and state of health of the
interactions on these technical forums.
The next phase of the study was led by Novielli, Calefato,
and Lanubile from the University of Bari, and they did
practical research to find out the emotions in Stack Overflow’s
question-and-answer environment [20]. They aimed to achieve
this by scrutinizing the emotional lexicon of questions to be
able to comprehend how emotions influence the interactions
and engagement of users on the platform. This research con-
tributes to a more in-depth understanding of the psychological
aspects of the voting process, which in turn shows the reasons
behind the user preferences and the choice of questions.
While working on the same project, Guzman, Az
´
ocar, and
Li turned to sentiment analysis in GitHub, with attention
to committing comments in open-source projects [21]. The
author’s approach involved lexical sentiment analysis that was
used to uncover the emotions that might be embedded in
commit messages and to offer a perspective on the expressive
range and sentiment distribution across different projects.
This research is the way to find the patterns of emotional
communication among people who collaborate on software
development, and it helps in gaining a deeper understanding
of the culture and dynamics in open-source communities.
V. PRE-PROCESSING
Before the analysis of the datasets was to be per-
formed, data manipulation and planning were completed. The
view_comment was initially made in a way that a new
observation was created for each tag of the post. Since only
the tags that contained any name of the above-mentioned
programming languages were needed for the analysis, every
other tag’s irrelevant observation was filtered.
To address potential issues of data redundancy and compu-
tational inefficiency, observations differing only by tags were
merged. This approach stopped posts from being compared
to themselves and significantly lowered the time demanded to
calculate sentiments for each entry.
After processing the columns that contain the texts, code
segments were removed, and all uppercase letters were con-
verted to lowercase. Special characters were also eliminated.
Using the NLTK library, standard stopwords were removed,
and additional stopwords specific to programming terminology
were identified and excluded to refine the text further for
analysis.
Three types of tokenization were used:
• Sentence tokenization: Dividing the text into individual
sentences.
• Word tokenization: Splitting sentences into separate
words.
• Lemmatization: Converting words to their base forms.
Based on these tokenized versions, new columns were
introduced to the database.
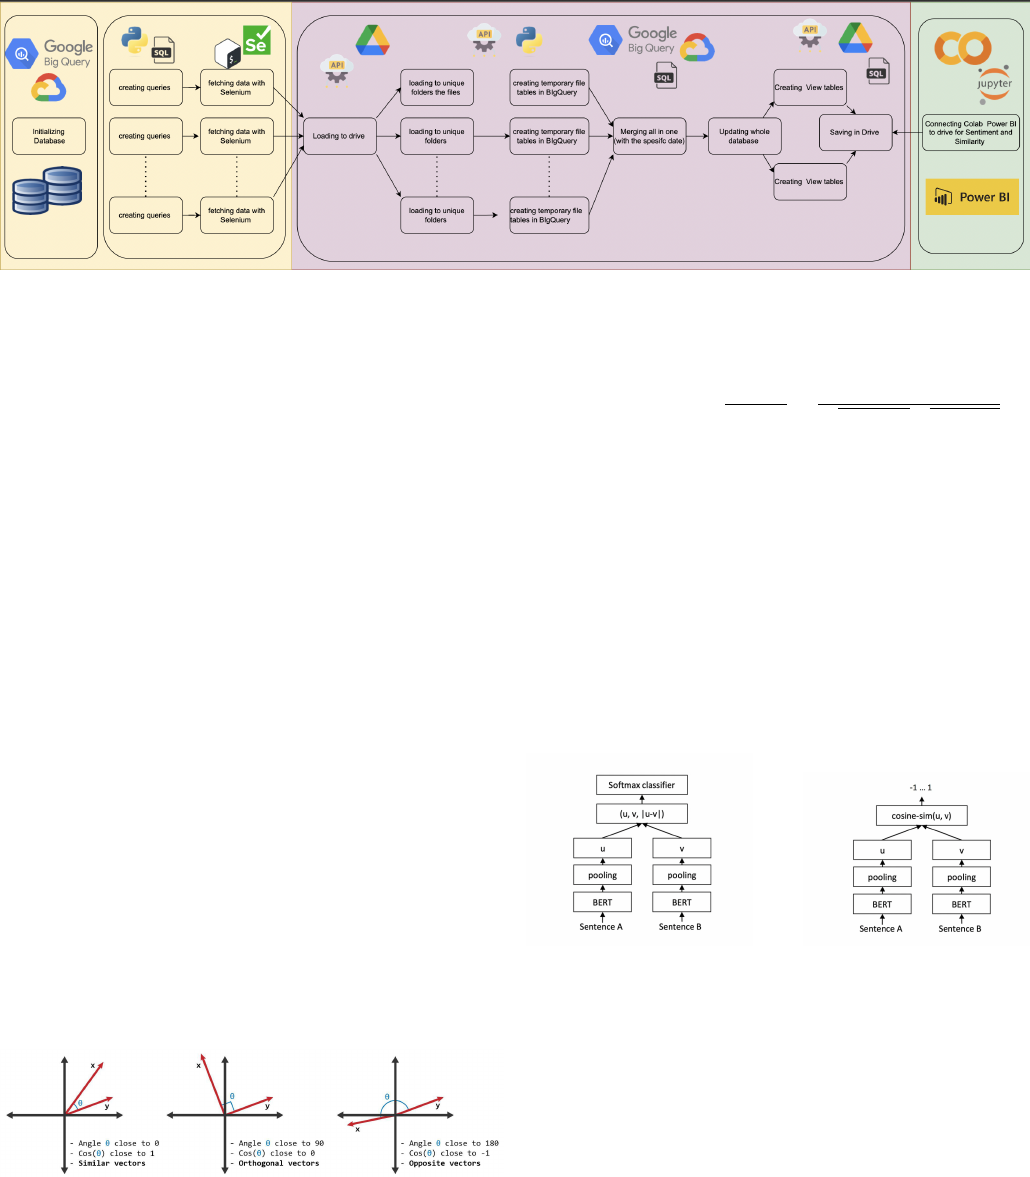
Fig. 2: The Flow of The Pipeline
VI. SIMILARITY ANALYSIS
A. Overview
The main objective of this similarity analysis is to help users
identify nearly identical previously posted queries to their
question, enabling them to receive instant answers and avoid
future possible deletions while also assisting moderators in
identifying duplicates for removal. For the similarity analysis,
the four post datasets were preferred to gauge the degree of
similarity among discussions, seeking to specify and reduce
the creation of redundant threads on Stack Overflow. The use
of SBERT allows the cleaned body texts from the dataset into
embeddings that catch the nuanced comparisons of the textual
content.
1) Cosine Similarity: Cosine Similarity provides the mea-
sure of the cosine of the angle between two terms when
they are represented as non-zero positive vectors in an inner
product space, assuming that the terms are vectorized [15].
Term vectors that are closely aligned will have similarity
scores close to 1 (cos 0°), suggesting that the vectors lie
in nearly exact directions with a tiny angle between them.
Contrarily, term vectors with a similarity score around 0 (cos
90°) define terms that are mainly unrelated, showing an almost
perpendicular orientation to each other. Term vectors with a
similarity score near -1 (cos 180°) are opposing in direction
[15]. 3 depicts this concept more clearly, where ’u’ and ’v’
express term vectors in the vector space model.
Fig. 3: Cosine similarity representations for term vectors [16]
Mathematically, the dot product can be represented as
u · v = ∥u∥∥v∥ cos(θ) where θ is the angle between u and v,
while u denotes the L2 norm for vector u and v is the L2 norm
for vector v. Therefore, the formula for the Cosine Similarity
can be derived as
cs(u, v) = cos(θ) =
u · v
∥u∥∥v∥
=
P
n
i=1
u
i
v
i
p
P
n
i=1
u
2
i
p
P
n
i=1
v
2
i
where cs(u, v) is the actual score between the two parties. In
this case, the ranges of scores were modified from -1 to +1
to from 0 to 1 because frequency vectors cannot be negative;
thus, the angle cannot exceed 90°.
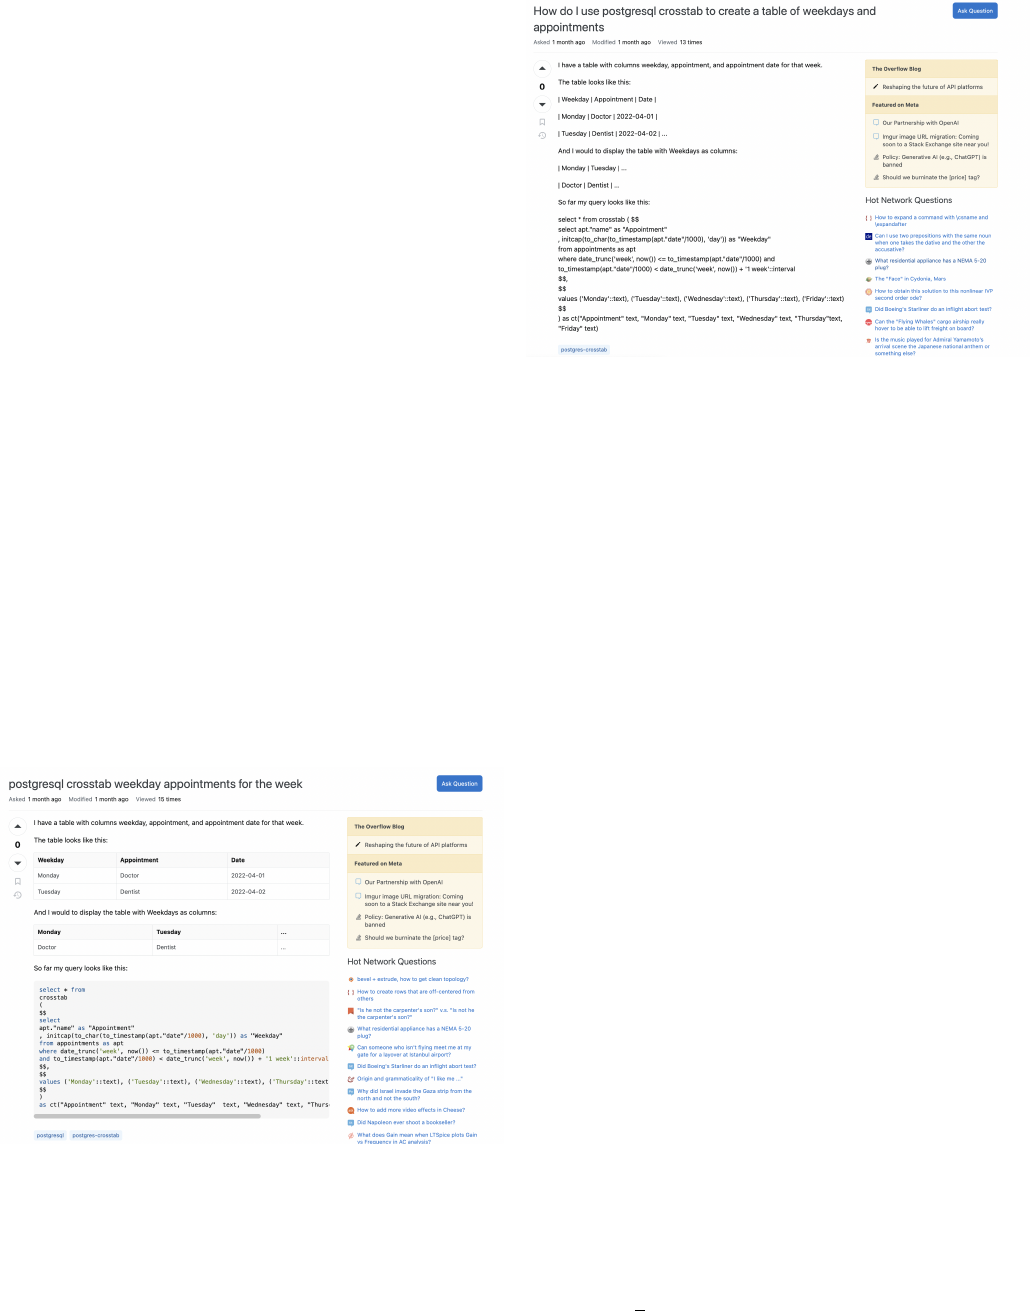
2) SBERT: SBERT is a framework for computing sentence
embeddings employing the BERT model, ”an open source
machine learning framework for natural language processing
(NLP),”which may be used for a variety of downstream
applications yet is computationally fast primarily for the usage
of Siamese Networks, a kind of network design wherein two
or more identical subnetworks are combined to create and
compare feature vectors for each input [13] [8].
(a) ”SBERT architecture with
classification objective func-
tion, e.g., for fine-tuning on
SNLI dataset. The two BERT
networks have tied weights.”
[17]
(b) SBERT architecture at in-
ference, for example, to com-
pute similarity scores. This ar-
chitecture is also used with the
regression objective function.
[17]
The model aggregates the output of BERT using a mean
pooling strategy, typically generating embeddings of 768 di-
mensions for the ’bert-base’ configuration. SBERT is specifi-
cally fine-tuned to identify sentence similarities by training on
a variety of the SNLI and Multi-Genre NLI datasets, which
together offer around one million annotated sentence pairs
across various genres of text, both spoken and written. The
workout configuration consists of a linear warm-up over 10%
of the training data, an Adam optimizer, a batch size of 16,
and a learning rate of 2e-5. Sentence similarity is effectively
captured by this technique, as proven by its better performance
on several benchmarks, such as the Argument Facet Similarity
(AFS) corpus, the STS benchmark (STSb), and a Wikipedia
dataset from Dor et al.
B. Similarity Results
The results were broken down across the data for April
and showed a real consistency of similar and duplicate posts,
even in a short timespan. The primary outcome of the analysis
was the successful labeling of nearly identical posts tagged as
similar, with a similarity score exceeding 0.9.
A pattern became apparent: identical questions were asked
across multiple posts, even though they were made by different
people. This might happen if someone makes a new account
and reposts the question in the hopes of receiving more replies
after their first post goes unanswered. This issue got as severe
as a person posting the same questions up to three or four
times.
Many posts with very parallel contexts were posted, and
each got a different reply, which can lead to misunderstanding
of the topic to third parties or the people who asked the
questions in the first place.
1) Examples:
• The following posts contain identical texts and content.
However, they are formatted differently and have different
post titles. This can be an experiment of the user in an
attempt to get more attention to the question. However,
in both cases, the questions still remained unanswered
despite being seen multiple times. These posts were
identified with an accuracy of 0.9978 similarity score,
• Questions with titles ”Connecting tips between dendro-
grams in side-by-side subplots and ”Connecting den-
drograms in matplotlib” were asking about the same
topic. However, they used different wording, thus creating
irrelevant data that can be harmful to the StackOverflow
environment, as a lot of people get irritated because of
this and start toxic conversations. These two posts were
found similar, with a score of 0.8180.
These findings illustrate that the efficiency of detection
techniques for similarity that were applied manifests them-
selves in the identification of the content that is duplicated or
almost duplicated. This is very important as it helps get rid of
repetitive posts in platforms like Stack Overflow, which in turn
makes user experience more efficient and content navigation
a seamless process. By connecting related discussions, the
community can avoid re-answering questions and, much to the
point, generate new answers. The effect is a setup for more
efficient knowledge transfer.
VII. SENTIMENT ANALYSIS
A. Overview
For the sentiment analysis, the StackOverflow data was
examined for both posts and comments throughout April 2024,
covering approximately four weeks of activity. The analysis
was done with the help of EmoRoBERTa to categorize the
sentiments into these categories:
• Neutral
• Positive Emotions: Admiration, Gratitude, Approval,
Optimism, Joy, and others.
• Negative Emotions: Confusion, Disapproval, Remorse,
Sadness, Anger, Disgust, Annoyance, and others.
The overall sentiment scores are displayed as percentages
to provide a more precise understanding of the distribution of
emotions expressed within the posts during the weeks.
The main focus of the analysis was on identifying patterns
in negative sentiments and exploring which programming
languages and contexts attracted more negative emotional
responses. The sentiment analysis function leverages the Hug-
ging Face Transformers library and NLTK for effective text
processing. It initializes a sentiment analysis pipeline and
tokenizer using the EmoRoBERTa model. To guarantee robust-
ness, the safe
sentiment function is designed to analyze senti-
ment while accounting for diverse edge cases, such as handling
non-string inputs and managing large text segments by to-
ken truncation. In addition, the add sentiments to dataframe
function involves this sentiment analysis in batches, en-
abling scalable processing of a DataFrame without overloading
memory resources. This batch-based approach enhances effi-
ciency, allowing sentiment analysis of large datasets with clear
progress indicators and a final report on total processing time.
Together, these components demonstrate a reliable strategy for
integrating sentiment analysis into DataFrame workflows.
B. Emotion Study
The assessment and classification of emotional expressions
in textual data have become a focal point of modern research,
mainly due to the increasing sophistication identified in human
emotional states [2]. Traditional sentiment taxonomies such as
those proposed by Ekman, which suggest six basic emotions
[3], and Plutchik, who presents four bipolar emotion pairs
[4], set the foundational frameworks. Conversely, Ortony and
colleagues expand upon these models by documenting twenty-
two separate emotions, incorporating complicated emotional
states such as relief and admiration into the analysis [5].
In further work, Demszky et al. presents the GoEmotions
dataset, which contains an even more extended range of
twenty-eight emotions, declaring the necessity for a more
subtle ”semantic space” of emotion recognition to better
understand modern psychological insights [6]. This wide col-
lection of emotions highlights the evolving understanding of
emotional complexity that is more aligned with the nature of
human experiences [2].
Language model-based systems, particularly Large Lan-
guage Models (LLMs), have demonstrated bright qualifica-
tions in determining these diverse emotional ”signals” embed-
ded within texts [2]. The comprehensive training on various
and expansive datasets improves their ability to distinguish
slight emotional nuances, thereby delivering a more accurate
understanding of the sentiments shared in written communi-
cation [7].
This growing technology not only emphasizes the refined
analytical ability of existing models but also highlights the
constant need for tools that can adjust to and recollect the
difficulties in human emotional expression.
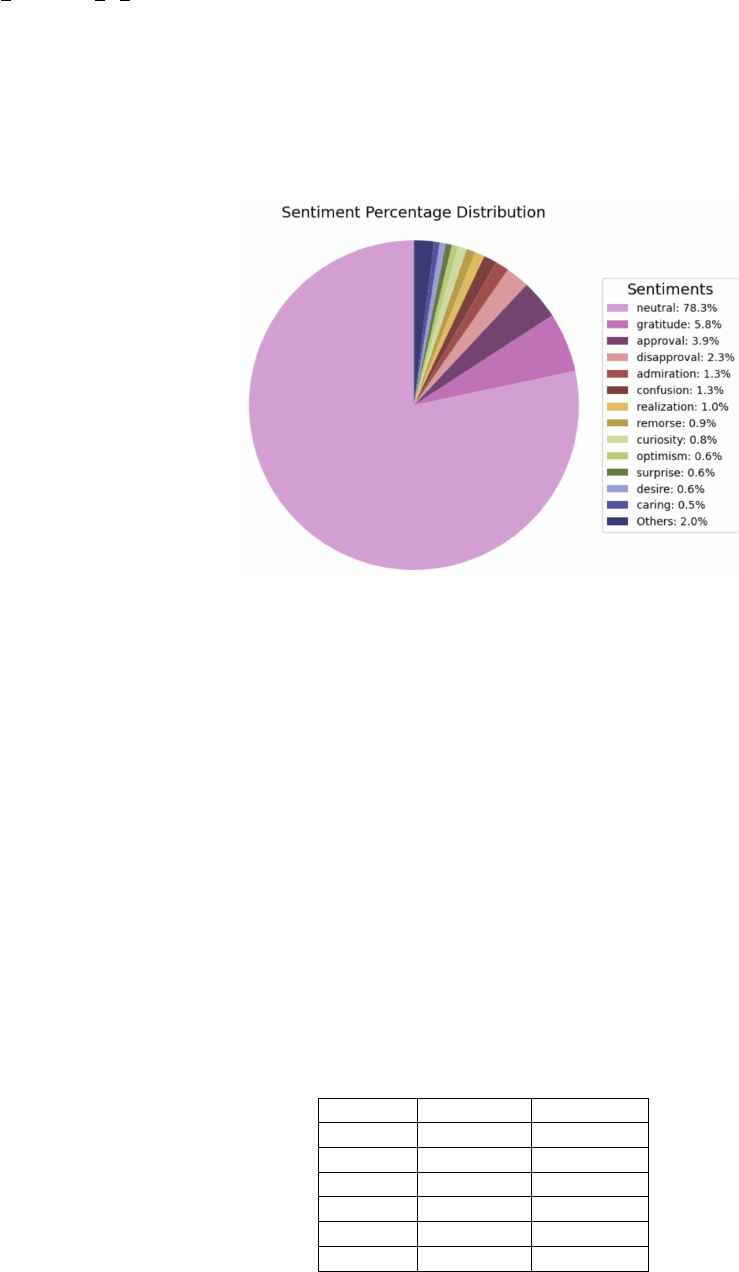
C. Sentiment Results
While the initial goal was to identify common expressions
of anger, the analysis found that Stack Overflow’s continu-
ing efforts to improve community engagement and problem-
solving help tend to reduce overt negative attitudes, resulting in
fewer instances of rage than anticipated. The analysis showed
that an extensive amount of the sentiments were neutral,
totaling for approximately 70% of the interactions on the
website. The predominance is rooted in the platform’s format,
which is a question-answer forum where some people tend
not to express their emotions. Nevertheless, the remaining
30% revealed that there were a lot of mixed emotions, which
provided a lot of insights into the community interactions.
The emotional diversity beyond the interactions that were
neutral included both negative and positive segments. Positive
emotions mainly consist of admiration, gratitude, approval,
joy, and optimism. Nevertheless, the negative emotions were
much more evident than the opposite ones. They were more
varied and pronounced, including confusion, sadness, anger,
disgust, annoyance, disapproval, and remorse. They provided
a bigger understanding that these challenges and frustrations
were a reality for some developers.
Fig. 5: The Distributions of Emotions in The Dataset
1) Negative Sentiments by Programming Language: The
analysis mainly focused on the negative emotions to identify
the specific programming languages that prompted stronger
unfavorable comments. Each week of data brought forward
a pattern of recurring negative sentiments associated with
specific programming languages I II:
• CSS: Consistently displayed sentiments of sadness and
remorse.
• JavaScript: Repeatedly associated with anger, possibly
due to its complex and dynamic nature which can lead
to challenging debugging experiences.
• PHP: Annoyance was dominant, likely originating from
its diverse old and new coding techniques and inconsis-
tencies in function naming and manners.
• SQL: Disgust appeared often, conceivably due to com-
plex queries executing poorly or vague feedback from
database systems.
TABLE I: Results of Negative Emotions from April 8 to 14
Post Tag Sentiment Percentage
C# Anger 0.881057
Ruby Annoyance 5.555556
Ruby Disgust 5.555556
C# Fear 2.643172
CSS Remorse 6.250000
C# Sadness 1.101322
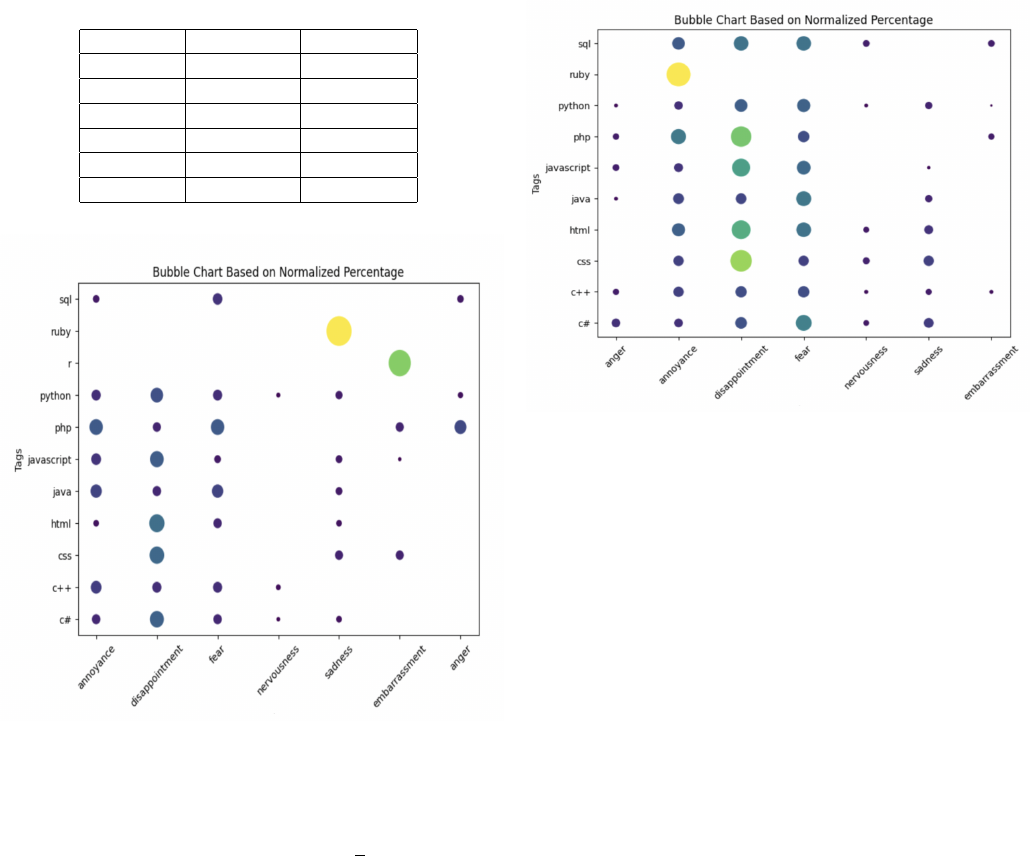
TABLE II: Results of Negative Emotions from April 14 to 21
Post Tag Sentiment Percentage
JavaScript Anger 0.534759
Ruby Annoyance 4.347826
C++ Disgust 1.882845
C++ Fear 2.928870
CSS Remorse 6.164384
HTML Sadness 1.415094
Fig. 6: Bubble Chart Based on April 1 to 7 Comment Data
2) Examples:
• For anger, comments like ”Your test input function is
completely nonsensical junk...” and ”This sucks so much.
I just don’t get how people can bear so many config
files in the project root.” reflect users’ frustration and
insensitive language.
• For disapproval, statements like ”To be honest: this code
doesn’t make any sense. You might want to take a step
back in the tutorial.” highlight the disappointment and
criticism within the community.
• For annoyance, remarks like ”Why do you create a
nested multipart message when you only have one piece
of content anyway? The new API shields you from that
kind of nonsense.” show the arrogance in the person’s
tone.
• For sadness, there are comments that included heartbro-
ken ideas like the following, ”There is sadly no general
answer to the question.Specific answer for the utopia
doesn’t exist a or an algorithm which can be applied
by anyone to anywhere.” and ”my bad.... same error.”
• For disgust, several declarations like the following one
were made ”It looks ugly... that is subjective. What is the
Fig. 7: Bubble Chart Based on April 15 to 21 Comment Data
real problem?” that demonstrated the true feelings of the
writer.
3) Possible Explanations for The Negativity:
• JavaScript’s flexibility and dynamic nature often lead to
difficult codebases and bugs that can be hard to trace.
This sophistication can provoke anger when developers
encounter errors that are challenging to understand or
resolve.
• JavaScript can conduct differently across various
browsers, directing to anger when code works in one
environment but fails in another.
• PHP has grown over decades, resulting in a mix of old
and new coding practices. Developers may convey annoy-
ance when dealing with legacy code or inconsistencies in
function naming and behavior.
• PHP is known for allowing multiple ways to achieve
the same task, leading to coding style inconsistency and
annoyance among developers who desire standardization.
• SQL queries can become rigid and complicated to opti-
mize. Developers may feel disgusted when a seemingly
simple query performs poorly due to underlying database
issues or poor indexing.
• SQL databases occasionally supply limited or unclear
error feedback, causing disgust when developers stumble
to comprehend why a query or operation failed.
4) Possible Solutions: This sentiment analys of provided
some insights that can be utilized for creating a more genuine
atmosphere of StackOverflow platform. The moderators need
to devise a more tailored intervention to foster an environment
that encourages learning rather than shaming it. The develop-
ment of advanced moderation tools could enable the automatic
flagging of posts that display extreme negative sentiments, thus
helping to prevent further escalations. Furthermore, collaborat-
ing with experts to create genuine answers and tutorials could
help users get more relieved from debugging challenges.

Moreover, the detected programming languages that are
prone to anger and irritation could have separate sessions
with specialists in the languages to lessen user confusion and
potential outbursts. Beyond technical solutions, encouraging
mental health awareness and cultural sensitivity within the
community could manage underlying challenges. These strate-
gies, reported by detailed sentiment analysis, promise not only
to omit negative experiences but also to promote the overall
quality of interactions on Stack Overflow, making it a more
welcoming space for developers worldwide.
VIII. INSIGHTS FROM POWERBI DASHBOARD
The data goes from BigQuery directly to PowerBI, where
a dashboard with two pages is created.
The first page includes an overview of the data. The primary
observations are:
• There are a total of approximately 100,000 rows divided
into comments and posts with a ratio of 70% and 30%,
respectively.
• On a daily basis, the dataset comprises approximately
1,500 posts and 3,500 comments.
• The most frequent programming languages that were
given questions about were Python, Java, and C#.
• The highest rating score for the posts was observed in
January 2024, followed by a notable decline thereafter.
The second page of the dashboard primarily focuses on
users and their reputations. The main insights include:
• The dataset contains a total of 29,000 users, with an
average reputation of 1,500. The spectrum of reputation
scores ranges from a minimum of 1 to a maximum of
744,000.
• The users from the USA, Europe, and India were the ones
to post and comment the most during the time period of
April 2024.
IX. DISCUSSION
A. Pipeline
The very first challenge that was encountered during the
realization of the project was the continuous evolvement of the
data, thus changing the preprocessing steps. However, once
the pipeline was established, the preprocessing steps were
finalized, allowing for the smoother flow of the analysis.
Another major problem was the data fetching with Sele-
nium, as the pipeline was mainly perceived as a robot and
was not able to pass human verifications. Thus, the infinite
loop was created to repeat the process until the pipeline could
move further in the flow.
One of the significant issues that tried to prevent the
project from realization was the transfer of data into the
BigQuery platform. The uploading of the data into the former
platform was only possible with environments such as the
local directory and Google Cloud. The solution included the
creation of temporary folders where the Google Drive files
were downloaded and inserted with the help of queries and
table schemas.
After the insertion of the data into the BigQuery plat-
form, another crisis arose. The initially created design of
the database was not possible due to the lack of an auto-
incrementation function, thus disabling the automatic creation
of surrogate keys. This restriction demanded an innovative
workaround to preserve the integrity of the structure of the
database. A solution using the ”time” argument was applied
to track the insertion order of the rows. By looking at the
most recently inserted row based on the ”time” argument, the
pipeline was configured to provide a unique index for each
entry. The surrogate keys were created because the method
constantly scanned the highest existing index and incremented
each subsequent row.
Moreover, the creation of the queries in the BigQuery plat-
form was disabled until a payment was made. This led to the
inability to update and merge the data or create view
tables in
the platform. Therefore, to overcome this obstacle, switching
to the paid version was inevitable.
B. Similarity Analysis
The starting point of the Similarity Analysis was deciding
on the model that was going to be used to handle an extensive
33,000-row dataset. In the beginning, the method of cosine
similarity using TF-IDF vectors, traditional BERT, and FAISS
methods was used to face the problem. However, all of these
methods failed to handle the issue for different reasons. For
example, BERT required about 50 million inference compu-
tations to discover the most similar pairs among the 10,000
sentences, which would take approximately 65 hours for each
analysis.
After thorough research, an SBERT model was employed
as the primary method for the analysis, along with cosine
similarity. With this method, the computational load was
significantly reduced by creating embeddings that prevented
the semantic meanings better than BERT and also made the
execution of weekly data that consisted of approximately 8000
rows possible in just 20-30 minutes.
The other models were mainly focused on surface-level
word implementation and did not pay attention to the mean-
ing and contexts of the posts. However, SBERT solved the
problem with context-aware embeddings that captured deeper
semantic relationships between texts. The mixture of SBERT
and cosine similarity was able to detect similar posts with
very high accuracy and identical posts with an accuracy of or
higher than 0.95 similarity scores.
C. Sentiment Analysis
The main issue of the Sentiment Analysis was the fact that
EmoRoBERTa was limited in the number of tokens it could
take, the maximum being 512. The first approach was the
division of the text into sentences, running the model for each
sentence of the text, and combining the results into one list
that was stored in a column. This was not cost-efficient, and
the final emotion of the whole comment was not clear.
The second option was not performing the sentiment anal-
ysis on the tokens that were bigger than 512, but a significant

amount of data would be lost. The third and adopted option
was storing all the comments’ data and doing save truncate,
which keeps only the first 512 tokens of the comment body.
X. CONCLUSION AND FUTURE WORK
This capstone project was successful in establishing a com-
prehensive data pipeline for sentiment and similarity analysis
on StackOverflow, giving insights into the way that users in-
teract within the selected programming language discussions.
The NLP models, such as SBERT and EmoRoBERTa, enabled
the identification of duplicate posts and the analysis of nuanced
emotional undertones hidden across those conversations. The
research highlights the potential of NLP models to improve
community management and user experience on online plat-
forms.
Subsequently, future research can further broaden the ex-
isting models by integrating real-time analysis tools for the
immediate detection and cleansing of both duplicated content
and toxic interactions as they happen on social media. More-
over, integrating a more extensive emotional analysis that is
specific to each programming language can give better insights
into the roots of the toxic behaviors. Therefore, by continuing
to get up-to-date data from the pipeline and incorporating
more dynamic models, this capstone project can broaden its
impact and foster a healthier and more engaged community
on StackOverflow and beyond.
REFERENCES
[1] heartexlabs. (2022, September). labelImg. Github. https://github.com/h
eartexlabs/labelImg
[2] B. V. Kok-Shun, J. Chan, G. Peko, and D. Sundaram, Chaining GPT
and Roberta for Emotion Detection. https://ieee-csde.org/csde2023/w
p-content/uploads/2023/10/IEEE
CSDE 1155.pdf (accessed May 8,
2024)
[3] P. Ekman, “Basic Emotions,” in Handbook of Cognition and Emotion,
Chichester, UK: John Wiley & Sons, Ltd, 2005, pp. 45–60. doi:10.100
2/0470013494.ch3 (accessed May 1, 2024)
[4] R. Plutchik, “A General Psychoevolutionary Theory of Emotion,” in
Theories of Emotion, Elsevier, 1980, pp. 3–33. doi:10.1016/B978-0-1
2-558701-3.50007-7 (accessed May 4, 2024)
[5] A. Ortony, G. L. Clore, and A. Collins, “The cognitive structure of
emotions,” Cambridge Core, https://www.cambridge.org/core/books/cog
nitive-structure-of-emotions/33FBA9FA0A8A86143DD86D84088F28
9B (accessed May 9, 2024).
[6] D. Demszky et al., “Goemotions: A dataset of fine-grained emotions,”
ACL Anthology, https://aclanthology.org/2020.acl-main.372/(accessed
May9,2024).
[7] F. A. Acheampong, H. Nunoo-Mensah, and W. Chen, (PDF) comparative
analyses of Bert, Roberta, Distilbert, and XLNet for text-based emotion
recognition, https://www.researchgate.net/publication/346443459 Com
parative Analyses of BERT RoBERTa DistilBERT and XLNet for
Text-based Emotion Recognition (accessed Apr. 4, 2024).
[8] C. Hashemi-Pour and B. Lutkevich, “What is the bert language model?:
Definition from techtarget.com,” Enterprise AI, https://www.techtarget
.com/searchenterpriseai/definition/BERT-language-model#:
∼
:text=Wha
t%20is%20BERT%3F,surrounding%20text%20to%20establish%20con
text. (accessed Apr. 9, 2024).
[9] R. Kamath, S. Eswaran, A. Ghoshal, and P. Honnavalli, An enhanced
context-based emotion detection model using Roberta — IEEE confer-
ence publication — IEEE xplore, https://ieeexplore.ieee.org/document
/9865796 (accessed Mar. 1, 2024).
[10] Roberta, https://huggingface.co/docs/transformers/main/en/model doc/r
oberta(accessed Mar. 1, 2024).
[11] J. Atwood, “Handling duplicate questions,” Stack Overflow, https://st
ackoverflow.blog/2009/04/29/handling-duplicate-questions/ (accessed
Feb. 29, 2024).
[12] S. AI, “Sentiment analysis-using NLTK Vader,” Medium, https://medium
.com/@skillcate/sentiment-analysis-using-nltk-vader-98f67f2e6130#:
∼
:text=Brief%20on%20NLTK%20Vader,communicated%20in%20web
%2Dbased%20media. (accessed Mar. 16, 2024).
[13] A. Sen, “Sbert: How to use sentence embeddings to solve real-world
problems,” Medium, https://anirbansen2709.medium.com/sbert-how-t
o-use-sentence-embeddings-to-solve-real-world-problems-f950aa300
c72 (accessed Mar. 14, 2024).
[14] A. Ghoshal, “Arpanghoshal/emoroberta · hugging face,”
arpanghoshal/EmoRoBERTa · Hugging Face, https:// hu gg in gface.
co/arpanghoshal/EmoRoBERTa (accessed Apr. 29, 2024).
[15] D. Sarkar, “Chapter 6,” in Text Analytics with Python, pp. 283–285 ht
tps://kfsyscc.github.io/attachments/IT/Text Analytics with Python.pdf
(accessed Mar. 29, 2024).
[16] Fatih Karabiber Ph.D. in Computer Engineering, Fatih Karabiber Ph.D.
in Computer Engineering, E. R. Psychometrician, and E. B. F. of
LearnDataSci, “Cosine similarity,” Learn Data Science - Tutorials,
Books, Courses, and More, https://www.learndatasci.com/glossary/
cosine-similarity/ (accessed Mar. 14, 2024).
[17] N. Reimers and I. Gurevych, Sentence-BERT: Sentence Embeddings
using Siamese BERT-Networks, http://arxiv.org/pd f/1 908 .10084
(accessed Apr. 18, 2024).
[18] V. Efimov, “Large language models: Sbert - sentence-bert,” Medium,
https://towardsdatascience.com/sbert-deb3d4aef8a4 (accessed Apr. 9,
2024).
[19] Ling, L., and Larsen, S. E. (2018). Sentiment Analysis on Stack
Overflow with Respect to Document Type and Programming Language.
KTH.http://www.diva-portal.org/smash/record.jsf?pid=diva2:1214448
(accessed Apr. 21, 2024).
[20] Novielli, N., Calefato, F., and Lanubile, F. (2014). Towards discovering
the role of emotions in stack overflow. University of Bari. https://doi.or
g/10.1145/2661685.2661689 (accessed Apr. 29, 2024).

