NOTES – Linear Equations
Linear Parent Function
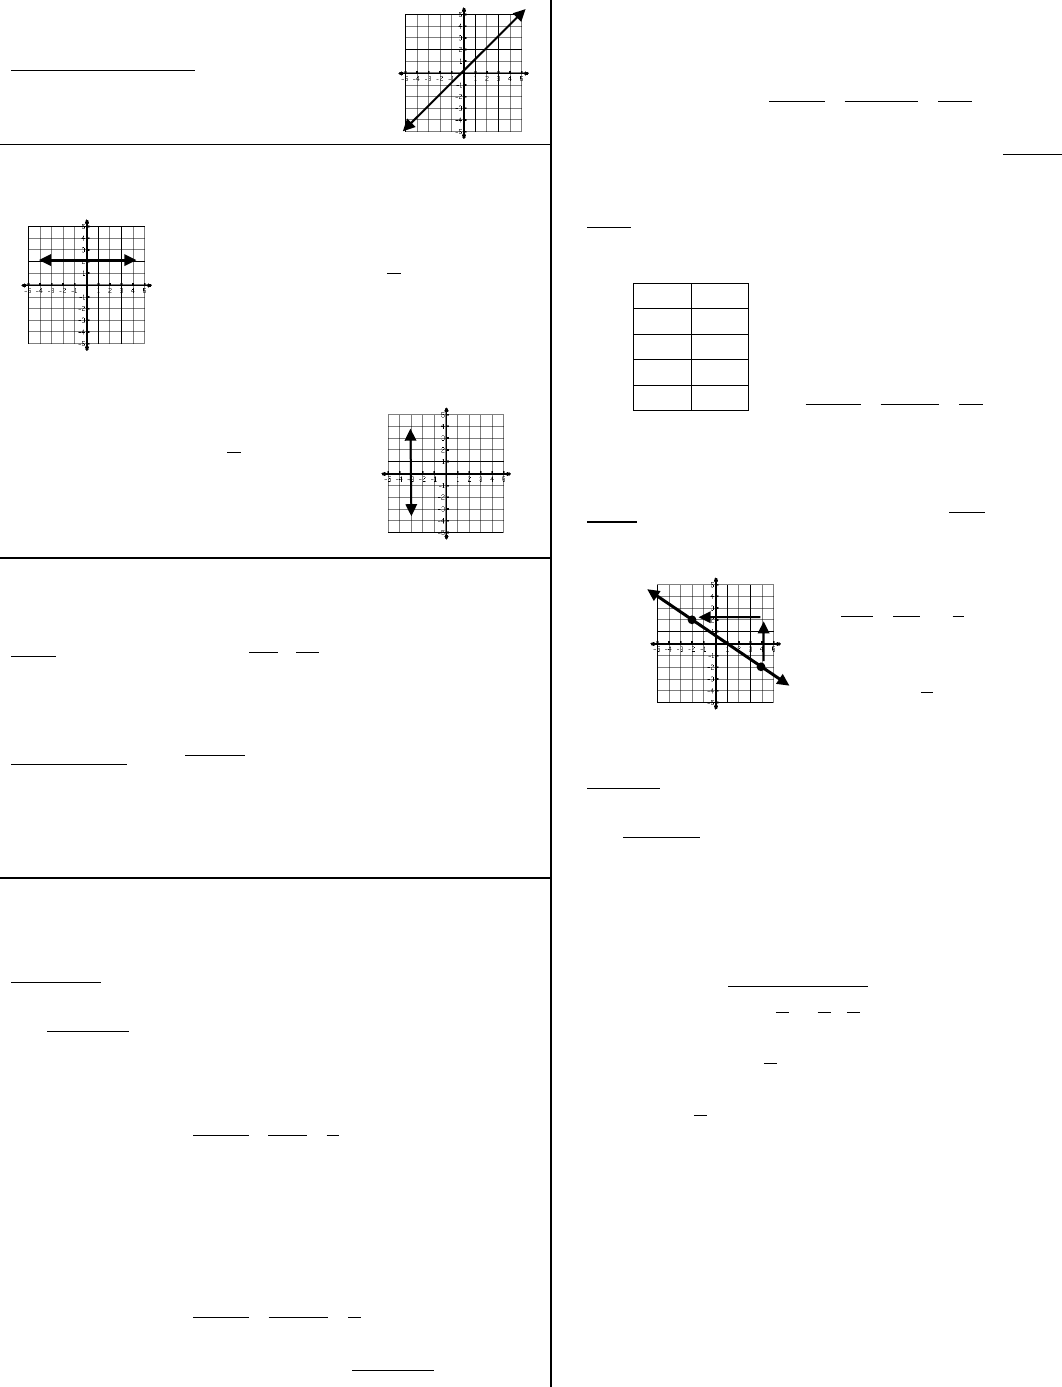
Linear Parent Function – the equation that all
other linear equations are based upon (y = x)
Horizontal and Vertical Lines (HOYY – VUXX)
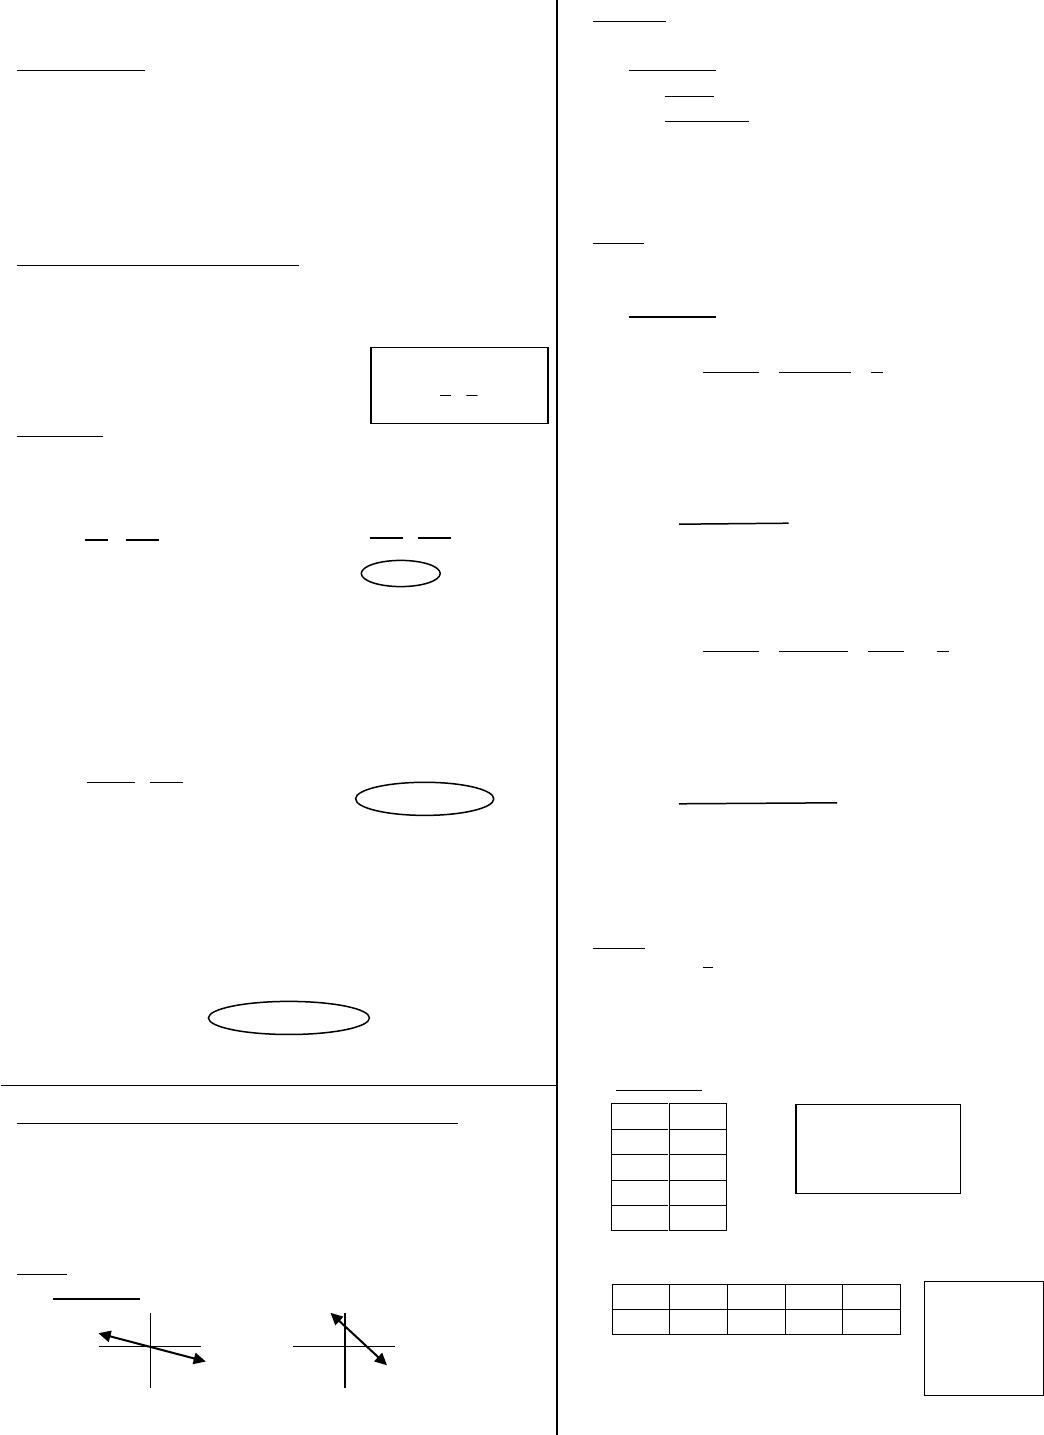
H – horizontal line
O – “0” slope;
0
#
0
m
Y – crosses the y-axis
Y – y=# (equation)
V – vertical line
U – undefined slope;
undefinedm
0
#
X – crosses the x-axis
X – x=# (equation)
Slope
Slope: is the rate of change;
x
y
run
rise
The variable, m, is used for slope.
Slope Formula:
12
12
xx
yy
m
(x
1
, y
1
) – one point
(x
2
, y
2
) – another point
How to Find the Slope From…
Two Points: Label one point as (x
1
, y
1
) and another point as
(x
2
, y
2
). Use the slope formula.
Examples:
Find the slope between the points (2, 3) and (5, 9).
(2, 3) and (5, 9)
2
3
6
25
39
12
12
xx
yy
m
The slope is 2.
Find the slope between the points (-2, 4) and (3, 4).
(-2, 4) and (3, 4)
0
5
0
)2(3
44
12
12
xx
yy
m
The slope is 0. This means it is a horizontal line.
Find the slope between the points (-2, 8) and (-2, -2).
(-2, 8) and (-2, -2)
undefined
xx
yy
m
0
10
)2(2
82
12
12
The slope is undefined. This means it is a vertical
line.
Table: Label one point as (x
1
, y
1
) and another point as (x
2
, y
2
).
Use the slope formula.
2
3
6
)2(1
42
12
12
xx
yy
m
The slope is -2.
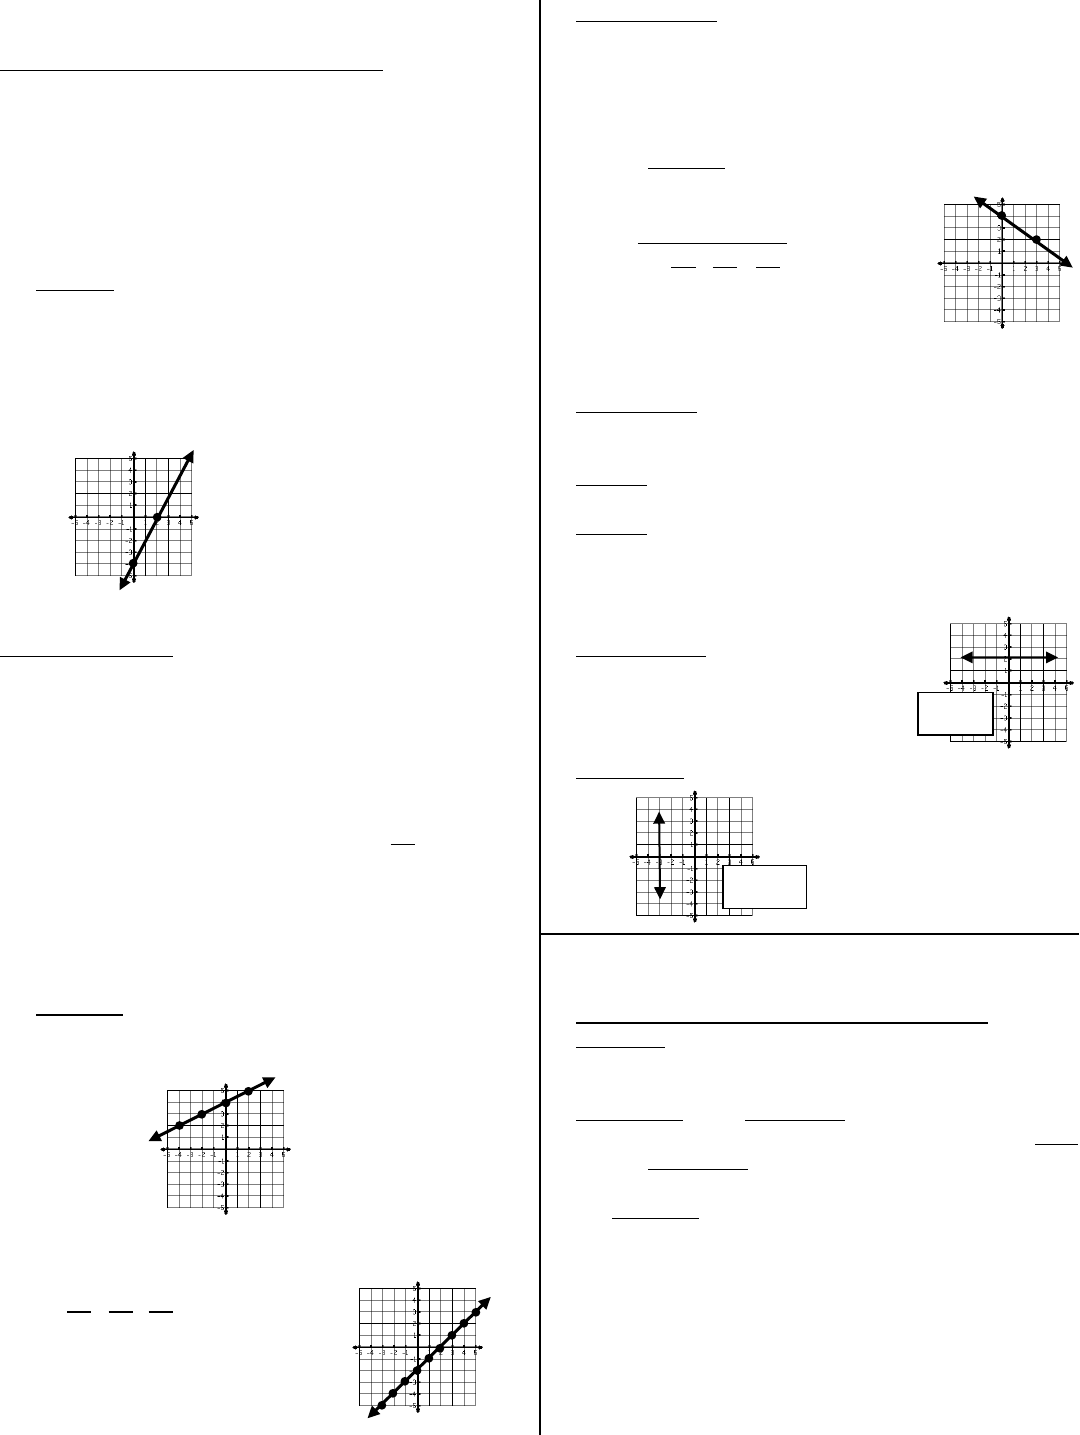
Graph: Draw two points on the line. Count
run
rise
. Note the
direction for the sign! Reduce the fraction.
3
2
6
4
run
rise
m
The slope is
3
2
.
Equation: Solve for y. The slope is the number in front of the
x. Don’t forget the sign.
Examples:
What is the slope of y = - ½ x + 5?
m = -½
What is the slope of -4x + 3y = 6
-4x + 3y = 6
+4x +4x
3y = 4x + 6
3 3 3
2
3
4
xy
m =
3
4
What is the slope of y = 7?
m = 0 (The equation can be rewritten as
y = 0x + 7. It graphs a horizontal line.)
What is the slope of x = 5?
The slope is undefined. (The equation cannot be
rewritten in y= form. It graphs a vertical line.)
x
y
-2
4
1
-2
7
-14
10
-20
x
1
y
1
x
2
y
2
x
1
y
1
x
2
y
2
x
1
y
1
x
2
y
2
x
1
x
2
y
1
y
2
DIRECT VARIATION
Direct Variation:
Two variables are directly related if their ratio remains
constant. It is a proportional relationship.
y = kx
y varies directly with x where k is the constant of variation.
(k is also the slope of the equation.) Graphs of direct
variation equations always go through the origin (0, 0).
To Solve Direct Variation Problems:
1. Use y = kx, to find the k value.
2. Write a direct variation equation to represent the
relationship, y = kx. Leave x and y as variables but
replace k with its constant.
3. Use the equation to find the unknown.
EXAMPLES:
If y varies directly with x and y = 27 when x = 6, find x
when y = 45.
y = kx y = kx y = 4.5x
27 = k(6) y = 4.5x 45 = 4.5x
6 6 4.5 4.5
4.5 = k 10 = x
Chris’s wages vary directly with the number of hours
that he works. If his wages for 5 hours are $29.75,
how much will they be for 30 hours?
Variables: x = hours
y = wages
y = kx y = kx y = 5.95x
29.75 = k(5) y = 5.95x y = 5.95(30)
5 5 y = $178.50
5.95 = k
Damian can type 45 words per minute. How many
can he type in 3 hours?
k = 45 words per minute (This is the constant.)
3 hours = 180 minutes
EQ: y = 45x
y = 45(180)
y = 8100 words
Determining if a Relationship is Direct Variation from:
Graphs
Equations
Points
Tables
Graph: A graph is direct variation if it goes through (0, 0).
EXAMPLES:
Equation: An equation is direct variation if it can be written
in the form y = kx. (Nothing can be added or subtracted.)
EXAMPLES:
Direct: y = -3x and ½ x = y
Not Direct: y = 3x + 5 and ½ x – 3 = y
Points: To see if points are directly related, create an
equation to see if can be written in the form y = kx. (See
Cluster 3 Notes on writing equations.)
EXAMPLES:
Are (-3, -5) and (-1, -3) directly related?
1
2
2
)3(1
)5(3
12
12
xx
yy
m
y – y
1
= m(x – x
1
)
y – (-5) = 1(x – (-3))
y + 5 = x + 3
-5 = -5
y = x – 2 Not Direct Variation (y = kx)
Are (36, -12) and (-6, 2) directly related?
3
1
42
14
366
)12(2
12
12
xx
yy
m
y – y
1
= m(x – x
1
)
y – (-12) = -⅓(x – 36)
y + 12 = -⅓x + 12
-12 = -12
y = -⅓x Direct Variation (y = kx)
Tables: To see if a table is direct variation, make a ratio of the
coordinates (
x
y
). If they all give the same constant value,
write an equation to see if it can be written y = kx. If so, it is
direct.
EXAMPLES:
x
y
-2
-16
-1
-8
4
32
6
48
x
-5
-2
1
5
y
7
1
-5
-13
Direct
Not Direct
Direct Variation
EQ: y = 8x
k = 8
y/x = 8
y/x = 8
y/x = 8
y/x = 8
Not Direct
since y/x is
not
constant.
y/x =
-5
y/x =
-0.5
y/x =
-1.4
y/x =
-2.6
OR—Use a Proportion
x
y
x
y
X and Y Intercepts
x-intercept: the point where the graph crosses the x-axis
y-intercept: the point where the graph crosses the y-axis
(The variable, b, is used for the y-intercept.)
EXAMPLES:
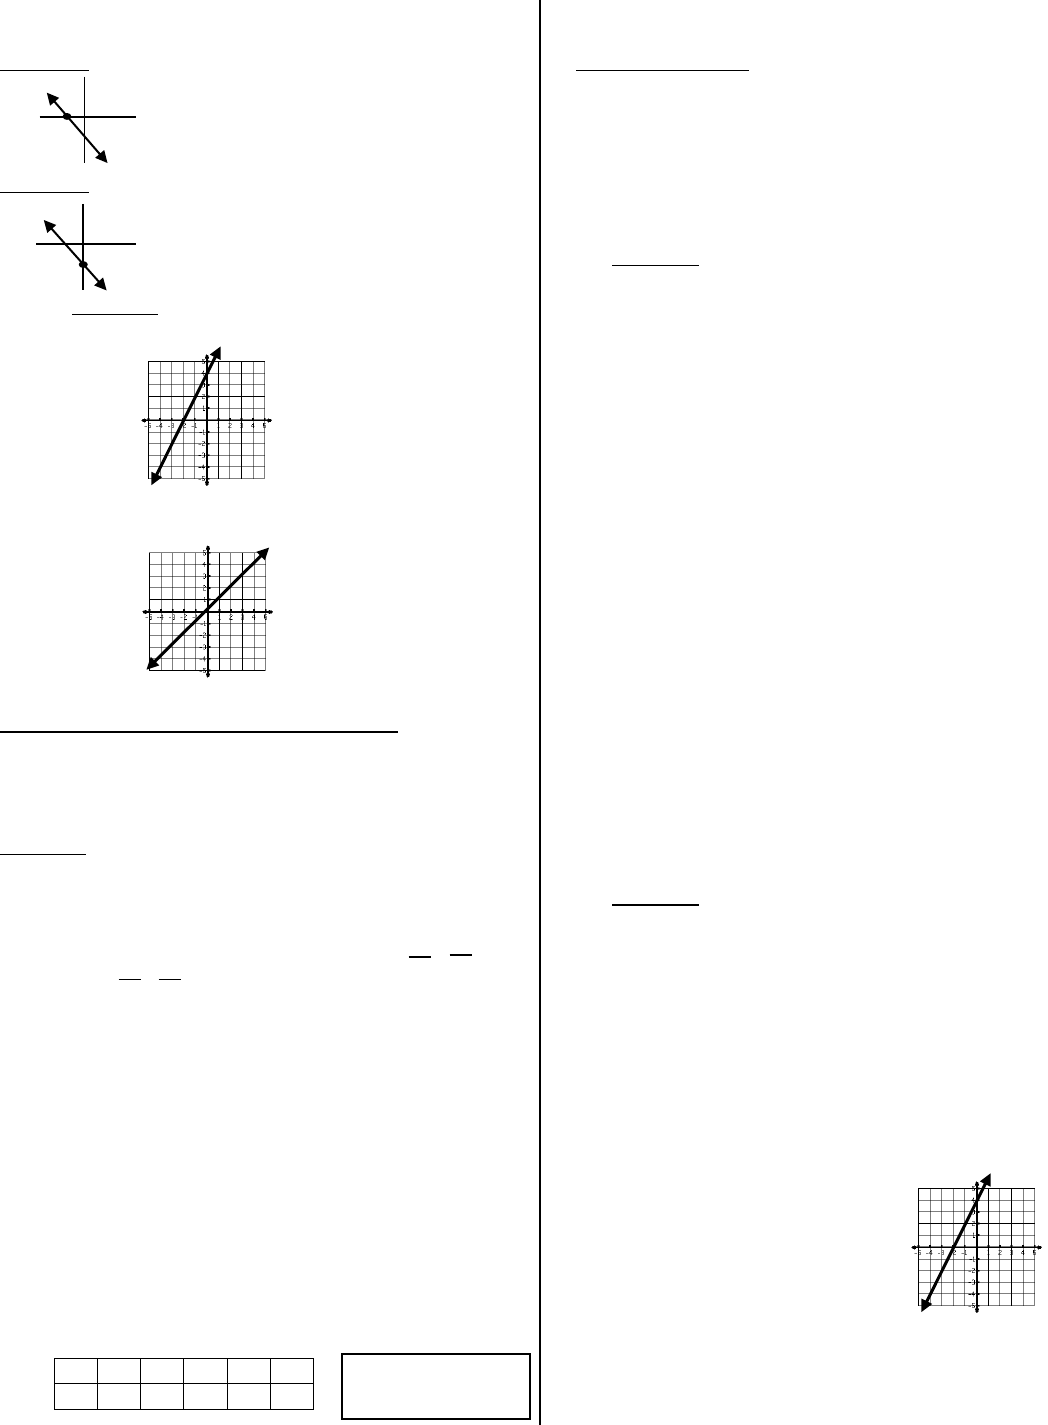
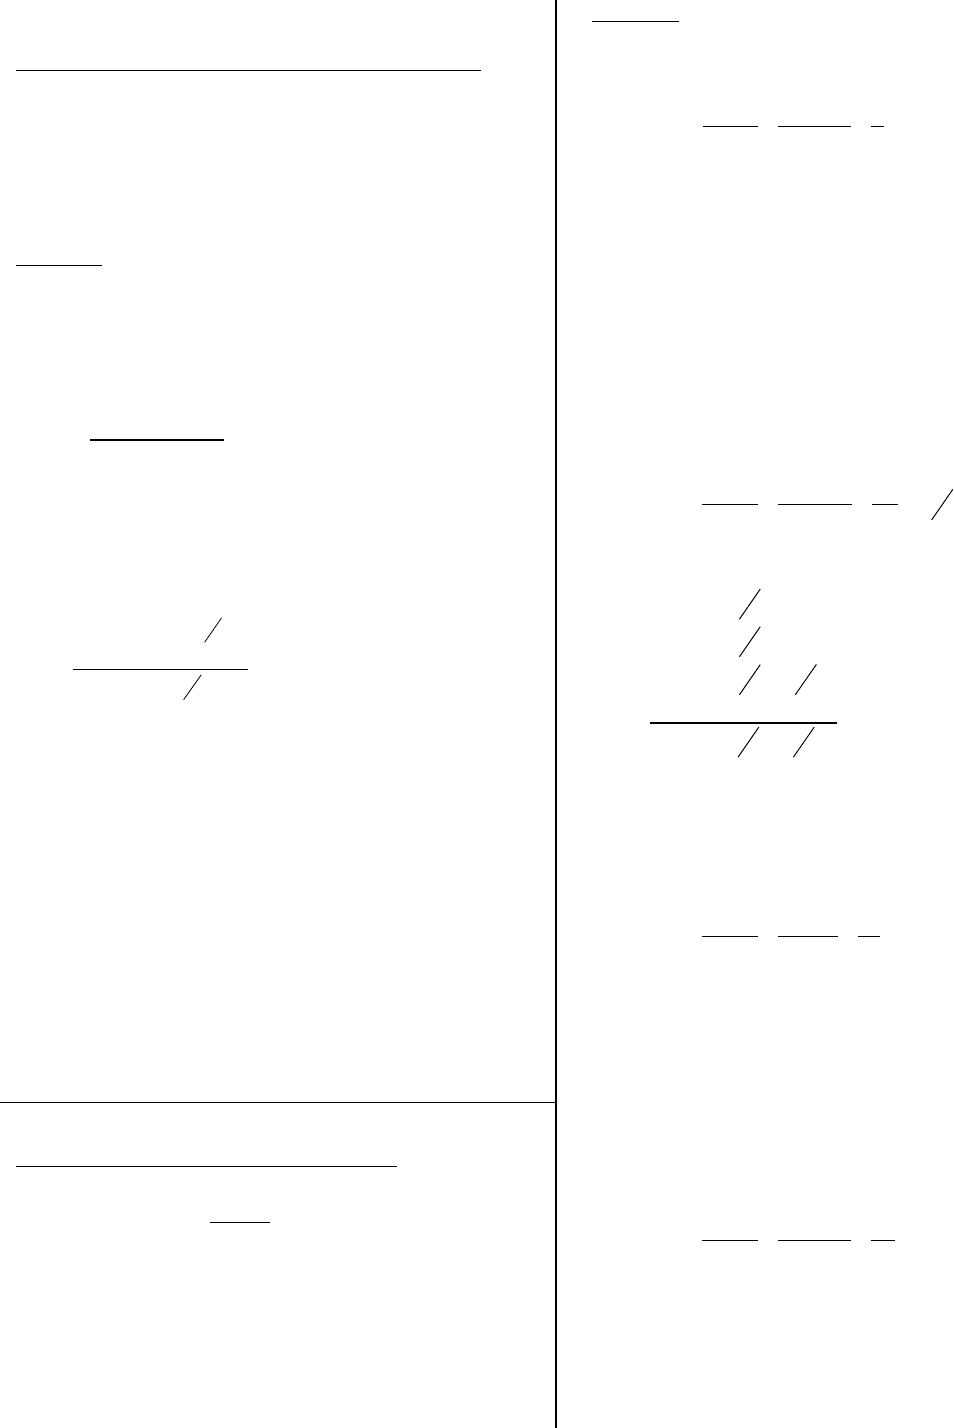
Find the intercepts from the graph.
x-intercept: (-2, 0)
y-intercept: (0, 4)
Find the intercepts from the graph.
x-intercept: (0, 0)
y-intercept: (0, 0)
Finding the x- and y- intercepts from an equation:
To find the x-intercept, put a “0” in for y and solve for x.
To find the y-intercept, put a “0” in for x and solve for y.
EXAMPLES:
Find the intercepts for 2x – 5y = 10.
2x – 5y = 10 2(0) – 5y = 10
2x – 5(0) = 10 0 – 5y = 10
2x – 0 = 10 -5y = 10
2x = 10 -5 -5
2 2 y = -2
x = 5
The x-intercept is (5, 0) and the y-intercept is (0, -2).
Find the intercepts for x = -3.
The x-intercept is (-3, 0) and there is no y-intercept
because it is a vertical line and will never
cross the y-axis.
Find the intercepts for y = 7.
The y-intercept is (0, 7) and there is no x-intercept
because it is a horizontal line and will never
cross the x-axis.
Find the intercepts from the table.
TRANSFORMATIONS OF THE SLOPE & Y-INTERCEPT
Slope-Intercept Form: y = mx + b
(where x,y is a point on the line, m is the slope, and b is the
y-intercept)
When the slope, m, is changed, the slope of the line changes.
This is the steepness and rate of change of the line. As the
|m| increases, the slope gets steeper. As the |m| decreases,
the slope gets flatter.
EXAMPLES:
What happens to the line y = ¼ x – 5 if it is changed
to y = 2x – 5?
The slope gets steeper, but the line will still cross
the y-axis at (0, -5).
What would happen to the line y= 2x +3 if the slope
was divided in half?
The line would be less steep because the slope
would change to 1.
What is the difference between y = 6x + 1 and y = ⅔
x + 1?
The line would be less steep because the absolute
value of the slope decreases. It still crosses the y-
axis at (0, 1).
What happens to the line y = -⅖ x + 3 if the slope is
changed to -4?
The line would be steeper because the absolute
value of the slope gets bigger.
When the y-intercept, b, is changed, the line moves up or
down the y-axis. As b increases, the line moves up the y-axis.
As b decreases, the line moves down the y-axis. The
steepness of the line is not affected by the y-intercept.
EXAMPLES:
What would the new equation be if the line y = 2x +4
is shifted 7 units down?
y = 2x + 4
-7
y = 2x – 3
What happens to the line y = 5x – 4 if it changes to
y = 5x + 7?
The line has the same slope but moves up 11 units.
What is the equation of this line if it is translated 5
units down?
Old Equation: y = ½ x + 4
New Equation: y = ½ x – 1
What happens to the line y = ½ x + 6 changes to
y = x – 7?
The line is steeper and moves down 13 units.
x
0
2
4
6
8
y
4
3
2
1
0
(#,0)
(0, #)
x-intercept: (8, 0)
y-intercept: (0, 4)
INTERPRETING LINEAR SITUATIONS
When interpreting a linear situation, identify the slope and y-
intercepts. Then, write an equation to represent the
situation. Use the equation to find the x-intercept. Describe
these as they apply to the situation.
EXAMPLES:
The cost to rent a car is $50 plus $0.10 per mile.
Identify the slope and the y-intercept. Then, write
an equation to represent this situation.
Slope: 0.10 (Slope is the rate of change. The
cost goes up by $0.10 per mile.)
y-intercept: 50 (The cost to rent the car is $50
even with 0 miles driven.)
Equation: c = 0.10m + 50 (Cost is “y” because it is
dependent upon the number of miles
driven. The miles driven is the “x” because
it determines the cost.)
x-intercept: (-500, 0) (The x-intercept has no
meaning in this situation
because you cannot have
-500 miles.)
The number of gallons of water left in a 5000 gallon
pool draining at a rate of 60 gallons per minute.
Slope: -60 (Slope is the rate of change. The
pool is draining water at a rate of 60 gallons
per minute. It is negative because it is
decreasing.)
y-intercept: 5000 (The pool starts, 0
minutes, with 5000 gallons of water.)
Equation: g = -60m + 5000 (The gallons left
in the pool is the “y” because it depends on
the number of minutes the pool has been
draining. The number of minutes draining is
the “x” because it determines the number
of gallons left in the pool.)
x-intercept: (83.33, 0) (The x-intercept means
that the pool will be finished draining in
83.33 minutes.)
REASONABLE DOMAIN AND RANGE
When finding the reasonable domain and range, make sure to
think about negative numbers, fractions, decimals, minimum,
and maximum values that make sense for the problem. It is
also helpful to write an equation.
Reasonable Domain: The reasonable domain is the smallest
to largest “x” values that make sense for the problem.
Reasonable Range: The reasonable range is the smallest to
largest “y” values that make sense for the problem.
EXAMPLES:
You are promoting your band. You spend $250 on
expenses and sell each CD for $10 each. What is the
reasonable domain and range for the situation if you
have 500 CD’s to sell?
Equation: p = 10c – 250 (Your profit is the amount
you make minus your expenses.)
Reasonable Domain: {0, 1, 2, … , 500}
Domain is the x-values. The number of CD’s
sold is the “x” because it determines the
profit. Since you cannot sell negative CD’s
or fractions of CD’s, the domain has to be
whole numbers from 0 to 500.
Reasonable Range: {-250, -240, -230, … , 4750}
Range is the y-values. The profit is the “y”
because it depends on the number of CD’s
sold. If you didn’t sell any CD’s, you would
still have to pay the $250 on expenses. If
you sold 1 CD, you would be at a loss of
$240. If you sold all 500 CD’s, you would
have a profit of $4750.
A hot air balloon is at 800 feet and is descending at
15 feet per minute. What is the reasonable domain
and range for this situation?
Equation: h = -15m + 800
Reasonable Domain: {0 m 53.33}
Domain is the x-values. The number of
minutes is the “x” because it determines
the height of the balloon. You cannot have
negative time, but time can be 0 minutes
(the beginning). The maximum time would
be when the balloon reaches the ground in
53.33 minutes (the x-intercept). Since time
can be fractions or decimals, it written in
inequality form.
Reasonable Range: {0 h 800}
Range is the y-values. The height of the
balloon is the “y” because it depends on the
number of minutes it has been descending.
The lowest height would be on the ground
(0 feet) and the highest height would be at
800 feet. It is written in inequality form
because height can be fractions or decimals.
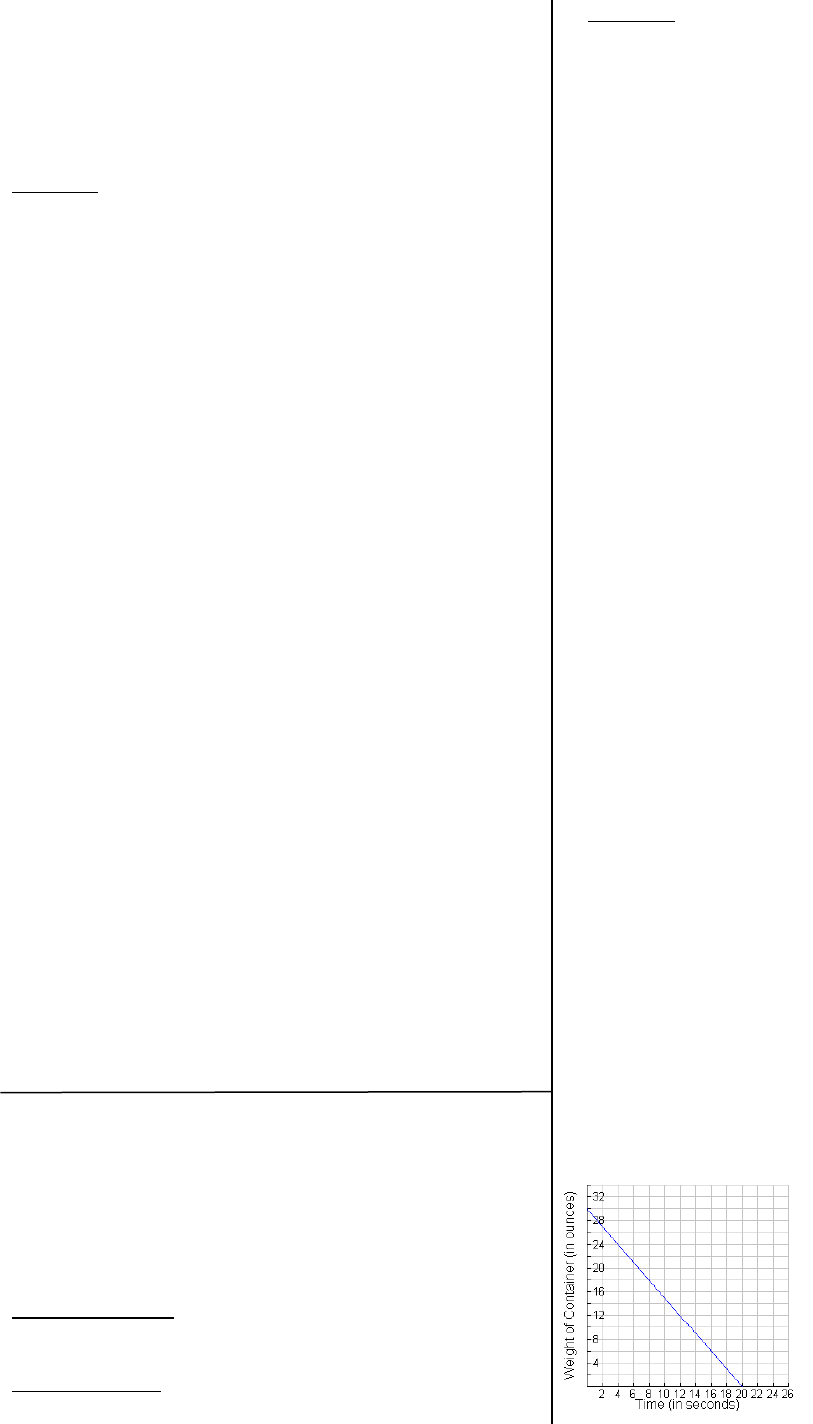
What is the reasonable domain and range for the
graph?
Domain: {0 t 20}
The domain is the x-values. The
time is between 0 and 20
seconds.
Range: {0 w 30}
The range is the y-values. The
weight is between 0 and 30
ounces.
c = 0.10m + 50
0 = 0.10m + 50
-50 = -50
-50 = 0.10m
0.10 0.10
-500 = m
GRAPHING LINEAR EQUATIONS
Graphing a linear equation using the intercepts:
1. Find the x-intercept by putting 0 in for y and solving for x.
2. Find the y-intercept by putting 0 in for x and solving for y.
3. Graph the two points on the correct axes and draw a line
through the points. Make sure to draw the line all
the way across the graph and put arrows on the
ends of the line to show that the line continues
forever in both directions.
EXAMPLE: Graph y – 2x = -4 using the intercepts.
y – 2x = -4 y – 2x = -4
0 – 2x = -4 y – 2(0) = -4
-2x = -4 y – 0 = -4
-2 -2 y = -4
x = 2
The x-intercept is (2, 0) and the y-intercept is (0, -4)
Slope-Intercept Form: y = mx + b
m is the slope and b is the y-intercept. To graph an equation
from slope-intercept form, identify the slope (m) and y-
intercept (b). Make sure to include the correct sign with each
number and change the slope to a fraction.
1. Solve for y.
2. Graph the y-intercept, b, on the y-axis.
3. From the y-intercept, use the slope to count
run
rise
to get
another point. Watch the sign for the direction.
4. Connect the points with a line. Make sure to put arrows
on the ends to show that the line continues forever
in both directions.
EXAMPLES:
Graph y = - ½ x + 4
m = - ½ and b= 4
Graph 2x – 4 = 2y.
2x – 4 = 2y
2 2 2
x – 2 = y
m = 1 and b = -2
Point-Slope Form: y – y
1
= m(x – x
1
)
m is the slope, (x
1
, y
1
) is a specific point on the line, and (x, y)
is any point on the line. To graph an equation from point-
slope form, distribute and solve for y. The equation is now in
slope-intercept form. Graph using the steps for slope-
intercept form.
EXAMPLE: Graph 3y – 6 = -2(x – 3).
3y – 6 = -2(x – 3)
3y – 6 = -2x + 6
+6 = +6
3y = -2x + 12
3 3 3
y = -⅔ x + 4
m = -⅔ and b = 4
Standard Form: Ax + By = C
(x, y) is a point on the line. You have two options to graph an
equation that is in standard form.
Option 1: Solve for y and graph like you would for slope-
intercept form.
Option 2: Graph like you would using the intercepts.
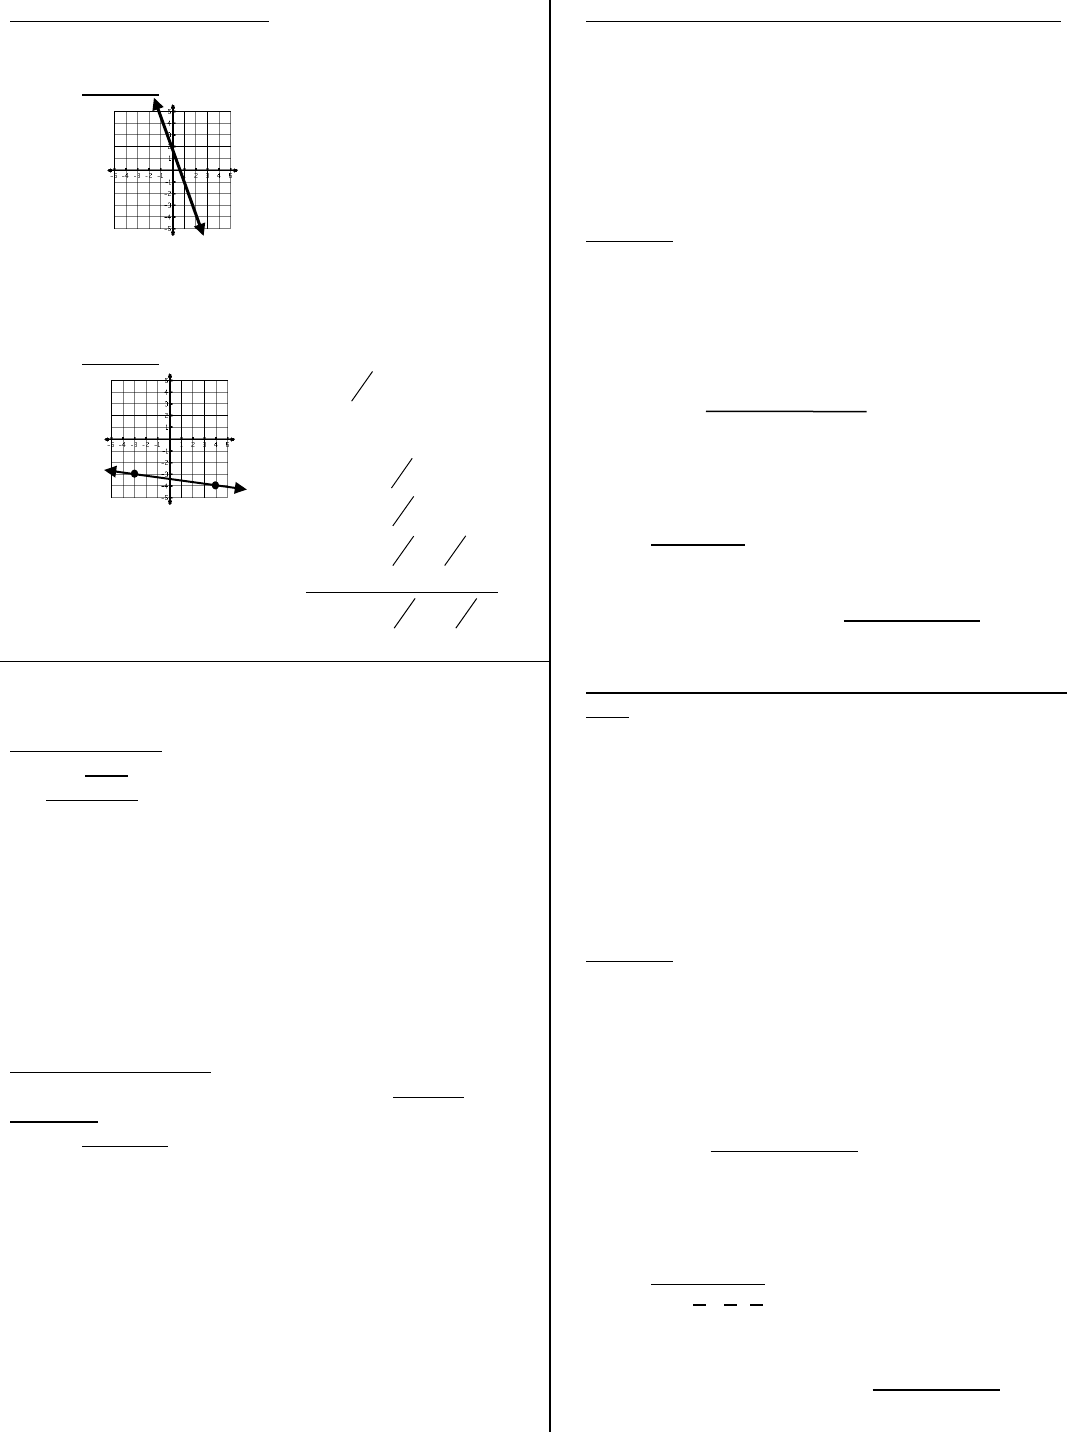
GRAPHING HORIZONTAL AND VERTICAL LINES
Horizontal Lines: Equations that only have
the y variable, graph horizontal lines.
Vertical Lines: Equations that only have the x variable,
graph vertical lines.
WRITING EQUATIONS OF LINES
Writing Equations of Lines Given the Slope and the
y-intercept:
Substitute the slope in for m and the y-intercept in for b into
the slope-intercept form: y = mx + b.
Special Cases: If the slope is zero, it is a horizontal line. The
equation is y = (the y-value of the point). If the slope
is undefined, it is a vertical line. The equation is
x = (the x-value of the point).
EXAMPLES:
Write the equation of the line that has a y-intercept
of 74 and a slope of -2.8. EQ: y = -2.8x + 74
Write the equation of the line that has a y-intercept
of 5 and a zero slope. EQ: y = 5
Write the equation of the line that has an undefined
slope and passes through (6, 0). EQ: x = 6
x = -3
y = 2
WRITING EQUATIONS OF LINES – cont.
Writing an Equation of a Line Given the Slope and a Point:
1. Substitute the slope in for m and the point in for x
1
and y
1
into the point-slope form:
y – y
1
= m(x – x
1
). Leave the x and y as variables.
2. Distribute and solve for y.
EXAMPLES:
Write the equation of the line that has a slope of 2
that passes through the point (-1, -5).
y – y
1
= m(x – x
1
)
y – (-5) = 2(x – (-1))
y + 5 = 2(x + 1)
y + 5 = 2x + 2
-5 -5
y = 2x – 3
Write the equation of the line that passes through
the point (7, -5) and has a slope of – ¼ .
y – y
1
= m(x – x
1
)
y – (-5) = - ¼ (x – 7)
y + 5 = - ¼ x +
4
7
-5 -5
y = - ¼ x –
4
13
Write the equation of the line that has an undefined
slope and passes through the point (1, 8).
x = 1 (Lines with undefined slopes are vertical
lines. The equation for vertical lines is x = #.
The # is the x-value of the point.)
Write the equation of the line that has a zero slope
and passes through the point (9, 4).
y = 4 (Lines with zero slopes are horizontal lines.
The equation for horizontal lines is y = #.
The # is the y-value of the point.)
Writing an Equation of a Line Given Two Points:
1. Find the slope between the points by using the slope
formula:
12
12
xx
yy
m
.
Remember that if the slope is “0”, it is a horizontal
line (y = the y-value). If the slope is undefined, it is a
vertical line (x = the x-value).
2. Use the slope for m and one of the points for x
1
and y
1
into
the point-slope form of an equation:
y – y
1
= m(x – x
1
). Leave the x and y as variables.
3. Distribute and solve for y.
EXAMPLES:
Find the equation of the line that passes through the
points (-3, 5) and (-2, 9).
4
1
4
)3(2
59
12
12
xx
yy
m
y – y
1
= m(x – x
1
)
y – 5 = 4(x – (-3))
y – 5 = 4(x + 3)
y – 5 = 4x + 12
+5 +5
y = 4x + 17
Find the equation of the line that passes through the
points (-2, 4) and (-8, 12).
3
4
6
8
)2(8
412
12
12
xx
yy
m
y – y
1
= m(x – x
1
)
y – 4 =
3
4
(x-(-2))
y – 4 =
3
4
(x + 2)
y – 4 =
3
4
x -
3
8
+ 4 +4
y =
3
4
x +
3
4
Find the equation of the line that passes through
(-2, 4) and (8, 4).
0
10
0
)2(8
44
12
12
xx
yy
m
y = 4 When the slope is zero, it is a horizontal
line. Horizontal line equations are y = #.
The # is the y-coordinate of the points.
Find the equation of the line that passes through the
points (-3, 4) and (-3, 0).
undefined
xx
yy
m
0
4
)3(3
40
12
12
x = -3 When the slope is undefined, it is a vertical
line. Vertical line equations are x =. The # is
the x-coordinate of the points.
x
2
y
2
x
1
y
1
x
2
y
2
x
1
y
1
x
2
y
2
x
1
y
1
x
2
y
2
x
1
y
1
Writing Equations from a Graph:
If the y-intercept is an integer, find the slope and use the
steps for writing an equation given the slope and y-intercept.
EXAMPLE:
b = 2 and m = -3
Equation: y = -3x + 2
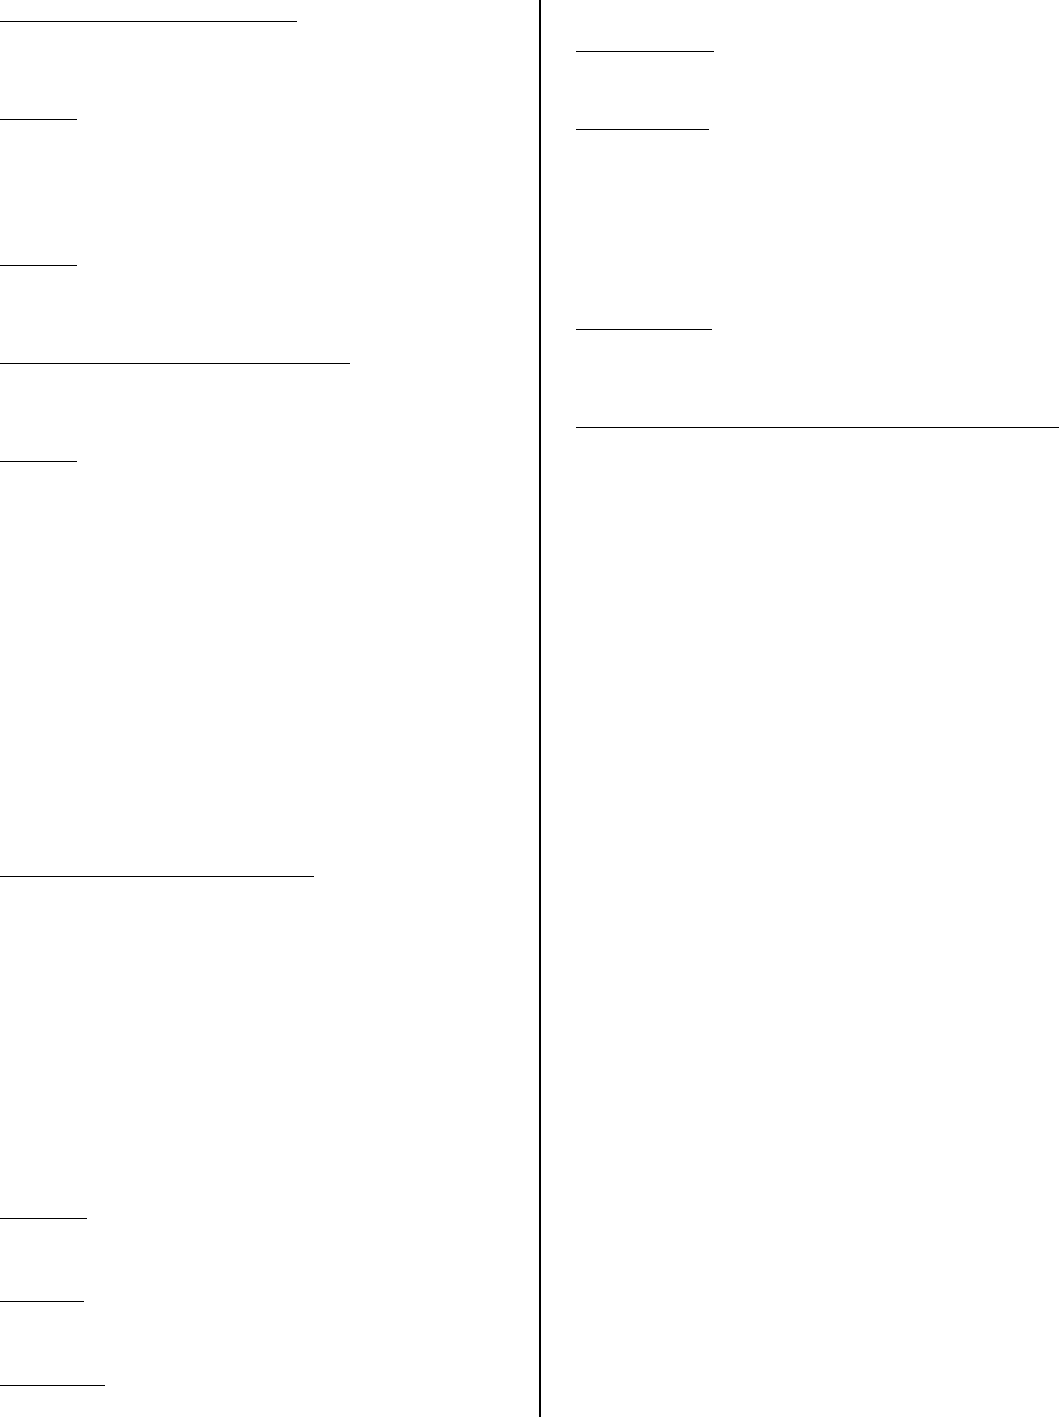
If the y-intercept is not an integer, find the slope and one
point that has integers for x and y. Then, follow the steps for
writing an equation given the slope and a point.
EXAMPLE:
m =
7
1
y – y
1
= m(x – x
1
)
))3((
7
1
)3( xy
7
3
7
1
3
)3(
7
1
3
xy
xy
-3 -3
7
24
7
1
xy
PARALLEL AND PERPENDICULAR LINES
Parallel (||) Lines: lines that never intersect. Parallel lines
have the same slope.
EXAMPLES:
What is the slope of the line parallel to y = 2.5x – 3?
||m = 2.5
What is the slope of the line parallel to 2x + 3y = 12?
2x + 3y = 12
-2x -2x
3y = 12 – 2x
3 3 3
y = 4 - ⅔ x ||m = -⅔
Perpendicular () Lines: lines that intersect at a right angle
(90). Perpendicular lines have slopes that are opposite
reciprocals (a fraction “flipped” over with the opposite sign).
EXAMPLES:
What is the slope of the line perpendicular to
y = - ½ x – 4?
m = 2
What is the slope of the line parallel to x – 3y = 6?
x – 3y = 6
-x -x
-3y = -x + 6
-3 -3 -3
y = ⅓ x – 2 m = -3
Writing Equations for a Parallel Line through a Given Point:
1. Find the slope of the given equation or points.
2. Since parallel lines have the same slope, use that slope for
your new equation.
3. Put that slope in for m and the given point in for x
1
and y
1
into the point-slope form of the equation:
y – y
1
= m(x – x
1
).
4. Solve for y.
EXAMPLES:
Write the equation of the line parallel to y = 4x – 3
that passes through the point (2, -6).
||m = 4
y – y
1
= m(x – x
1
)
y – (-6) = 4(x – 2)
y + 6 = 4x – 8
-6 -6
y = 4x - 14
Write the equation of the line parallel to x + y = 8
that passes through the point (1, 4).
x + y = 8
-x -x
y = -x + 8
||m = -1
Writing Equations for a Perpendicular Line through a Given
Point:
1. Find the slope of the given equation or points.
2. Since perpendicular lines have opposite reciprocal slopes,
make the slope a fraction, flip the fraction over, and
change the sign to get the new slope.
3. Put the new slope in for m and the given point in for x
1
and
y
1
into the point-slope form of the equation:
y – y
1
= m(x – x
1
).
4. Solve for y.
EXAMPLES:
Write the equation of the line perpendicular to
y = - ½ x – 4 that passes through (-6, -8).
m = 2
y – y
1
= m(x – x
1
)
y – (-8) = 2(x – (-6))
y + 8 = 2(x + 6)
y + 8 = 2x + 12
-8 -8
y = 2x + 4
Write the equation of the line perpendicular to
-6x + 2y = 4 that passes through (9, -2).
-6x + 2y = 4
+6x +6x
2y = 6x + 4
2 2 2
y = 3x + 2
m = -⅓
x
1
y
1
x
1
y
1
x
1
y
1
y – y
1
= m(x – x
1
)
y – 4 = -1(x – 1)
y – 4 = -x + 1
+4 +4
y = -x + 5
x
1
y
1
y – y
1
= m(x – x
1
)
y – (-2) = -⅓(x – 9)
y + 2 = -⅓x + 3
-2 -2
y = -⅓x + 1
Parallel Horizontal and Vertical Lines:
If you have a horizontal line (y = #), the parallel line is also
horizontal (y = #).
EXAMPLE: What is the equation of the line that is parallel to
y = 3 that passes through the point (-2, -4)?
y = -4
If you have a vertical line (x = #), the parallel line is also
vertical (x = #).
EXAMPLE: What is the equation of the line that is parallel to
x = 8 that passes through the point (0, 2)?
x = 0
Perpendicular Horizontal and Vertical Lines:
If you have a horizontal line (y = #), the perpendicular line is
vertical (x = #).
EXAMPLE: What is the equation of the line that is
perpendicular to y = 4 that passes through (10, 7)?
x = 10
If you have a vertical line (x = #), the perpendicular line is
horizontal (y = #).
EXAMPLE: What is the equation of the line that is
perpendicular to x = -3 that passes through (-2, -5)?
y = -5
CALCULATOR TIPS
Graphing Equations and Finding Points:
1. If you have an equation that is solved for y, you can enter
this equation into .
2. To see the line, push . But, do not use the picture
to graph the line on your paper.
3. To graph this line on your paper, push - to see
the . Graph these point to make the line.
Don’t forget to put arrows on the ends to show that
the line continues forever in both directions.
CALCULATOR (GRAPH POINTS AND CHECK FUNCTION RULE)
Enter Data: 1. –Edit; 2. Enter independent (x) values in
and dependent (y) values in
Clear Data: 1. – Edit; 2. to highlight (or ); 3.
–
Graph Points: 1. - (for ); 2. on Plot
1; 3. Highlight and turn plot on; 4.
Turn off Stat Plot: 1. - (for ); 2. on
Plot 1; 3. Highlight and turn plot off
Change Window:
X
min
= smallest x
X
max
= biggest x
X
scl
= count by #
Y
min
= smallest x
Y
max
= biggest x
Y
scl
= count by #
Original Window: 1.; 2. 6:ZStandard
Writing an Equation Given Two Points, Table, or Scatterplot:
1. –Edit;
2. Enter the x-values in and the corresponding y-values in
.
3. - - 4:LinReg -
This will give you the equation y = ax + b and values
for a and b. a is the slope and b is the y-intercept.
Put these values into the formula and this is the
equation.
4. Put the equation in . Go to the by pushing
- and check the points.
