
On June 30, 2015, China formally submitted its intended
nationally determined contribution (INDC) to the new
global climate agreement to be concluded this December
in Paris. China committed to the following actions by
2030:
• Peaking of carbon dioxide emissions around 2030
and making best efforts to peak early;
• Lowering carbon dioxide intensity (carbon dioxide
emissions per unit of GDP) by 60 to 65 percent from
the 2005 level;
• Increasing the share of non-fossil fuels in primary
energy consumption to around 20 percent; and
• Increasing the forest stock volume by around 4.5
billion cubic meters from the 2005 level.
1
Based on analysis by some of the world’s leading
energy institutes, China’s INDC represents a signicant
undertaking beyond business-as-usual and will help slow
the rise in global greenhouse gas emissions. According to
the U.S. Energy Information Administration (EIA), In-
ternational Energy Agency (IEA), Massachusetts Institute
of Technology (MIT) and Tsinghua University, peaking
carbon dioxide emissions around 2030 would reduce
China’s emissions by at least 1.7 Gt or 14 percent from
the most optimistic business-as-usual (BAU) scenario
(Figure 1).
2,3,4
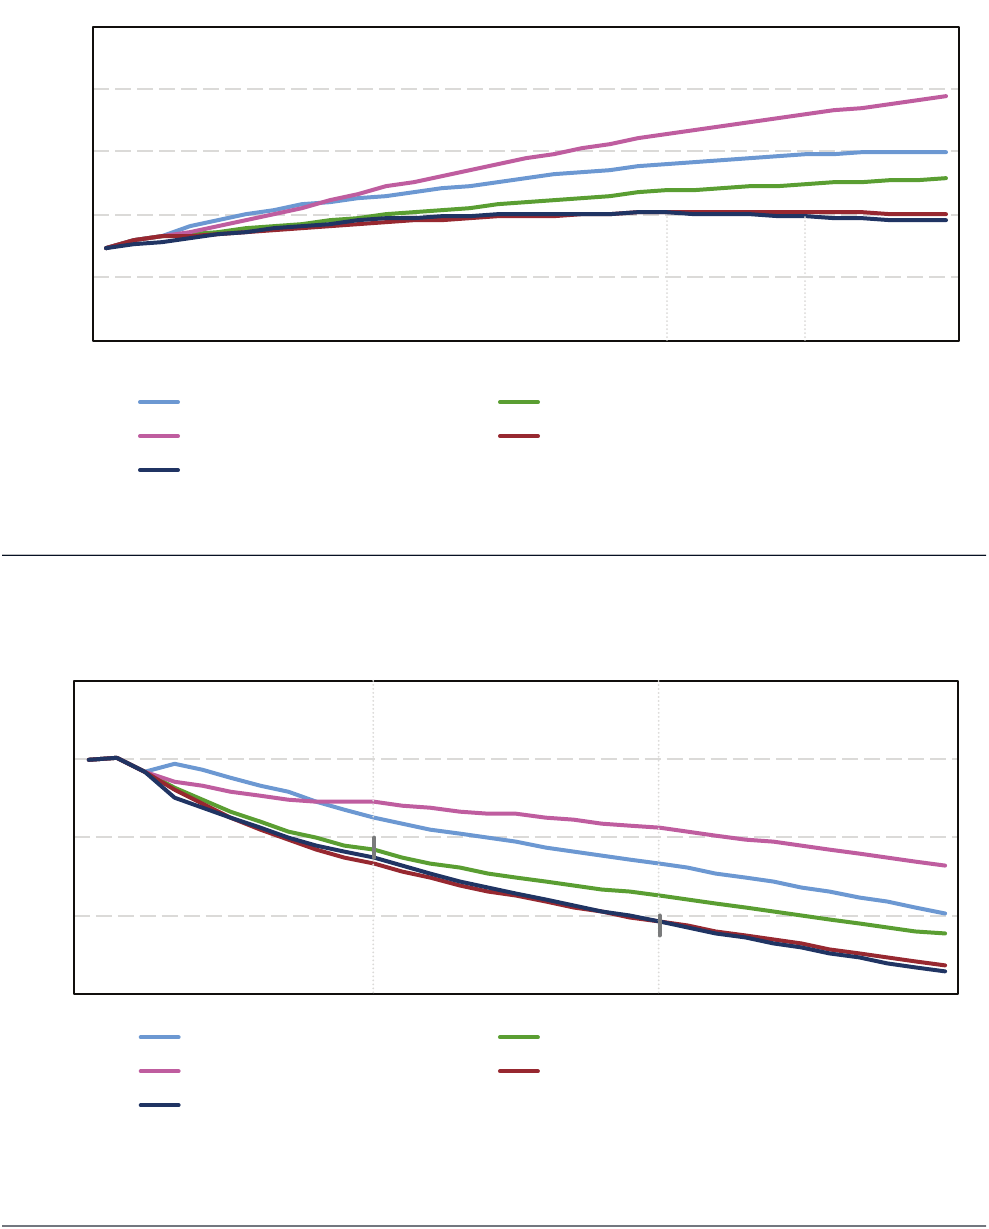
Figure 1 shows ve carbon dioxide emissions fore-
casts. The top three lines represent different views of
BAU, where no new policies are enacted and the status
quo is maintained. In these scenarios, China’s carbon
dioxide emissions continue to rise for the next 20 years
or more. By contrast, the bottom two nearly overlapping
lines represent scenarios with strengthened or new poli-
cies. As a result, emissions peak or plateau at 10 billion
metric tons about 2030, when BAU scenarios forecast
between 11.7 and 16.5 billion metric tons.
China has set goals to reduce its energy intensity in
its last two ve-year plans. Additionally, as a party to the
Copenhagen Accord, China committed to reducing its
carbon intensity (carbon dioxide emissions per unit of
GDP) 40-45 percent below its 2005 level by 2020.
5
Its
intended goal for 2030—lowering CO
2
intensity 60 to 65
percent from the 2005 level—builds on these goals.
Figure 2 shows how China’s carbon intensity generally
declines in all scenarios as it transitions from a predomi-
nantly manufacturing economy to a more service-based
economy.
6
The IEA’s “Current Policies” and “New Policies” sce-
nario, as well as the MIT/Tsinghua “Accelerated Effort”
scenario, meet or exceed China’s Copenhagen pledge,
while only the IEA’s “New Policies” and MIT/Tsinghua
“Accelerated Effort” scenarios meet the carbon intensity
target of the Paris INDC.
Meeting the Paris INDC requires signicantly greater
ambition than the most optimistic BAU scenario. China
must pursue a wide range of policies to decarbonize and
peak its emissions. Notably, China is aiming to peak its
coal consumption by 2020 and is attempting to limit the
growth of its oil consumption. It intends to grow its share
of natural gas, nuclear, hydro and other renewables.
Also, energy efciency gains must be realized across all
sectors of the economy. In reality, dozens of policies must
be successfully adopted and implemented for China to
increase the share of non-fossil fuels in primary energy
consumption to around 20 percent.
CHINA’S CONTRIBUTION TO THE PARIS CLIMATE
AGREEMENT
INTERNATIONALJULY 2015
1
Center for Climate and Energy Solutions
2
CHINA’S CONTRIBUTION TO THE PARIS CLIMATE AGREEMENT JULY 2015
FIGURE 1: Forecasting China’s Carbon Dioxide Emissions
0
5
10
15
20
25
2010 2015 2020 2025 2030 2035 2040
Billion Metric Tons Carbon Dioxide
EIA IEO 2013 "Reference Case" IEA WEO 2014 "Current Policies"
MIT/Tsinghua 2014 "No Policy" IEA WEO 2014 "New Policies"
MIT/Tsinghua 2014 "Accelerated Effort"
Peak Years
Source: U.S. Energy Information Administration, International Energy Agency, Massachusetts Institute of Technology, Tsinghua University
FIGURE 2: China’s Carbon Intensity Reduction Relative to 2005 Levels, Historic and Projected
-80%
-60%
-40%
-20%
0%
2010 2015 2020 2025 2030 2035 2040
EIA IEO 2013 "Reference Case" IEA WEO 2014 "Current Policies"
MIT/Tsinghua 2014 "No Policy" IEA WEO 2014 "New Policies"
MIT/Tsinghua 2014 "Accelerated Effort"
Copenhagen, 40–45%
Paris INDC, 60–65%
Source: U.S. Energy Information Administration, International Energy Agency, Massachusetts Institute of Technology, Tsinghua University, Organization for Eco-
nomic Cooperation and Development Long-term GDP forecast (2005 USD, PPP)

ENDNOTES
1 United Nations Framework Convention on Climate Change, “Intended Nationally Determined Contributions
(INDC) Portal.” July 2015. Available at: http://unfccc.int/focus/indc_portal/items/8766.php.
2 International Energy Agency, “World Energy Outlook 2014.” November 2014. Available at: http://www.worldener-
gyoutlook.org/publications/weo-2014/.
3 U.S. Energy Information Administration, “International Energy Outlook 2013.” July 2013. Available at: http://
www.eia.gov/forecasts/ieo/pdf/0484%282013%29.pdf.
4 Zhang, Xiliang et al., “Carbon emissions in China: How far can new efforts bend the curve?” Massachusetts
Institute of Technology and Tsinghua University. October 2014. Available at: http://globalchange.mit.edu/CECP/les/docu-
ment/MITJPSPGC_Rpt267.pdf.
5 United Nations Framework Convention on Climate Change, “Communications received from Parties in relation
to the listing in the chapeau of the Copenhagen Accord.” 2010. Available at: http://unfccc.int/meetings/copenhagen_
dec_2009/items/5276.php.
6 Organization for Economic Cooperation and Development, “Economic Outlook No 95 – May 2014 – Long-term
baseline projections.” May 2014. Available at: http://stats.oecd.org/Index.aspx?DataSetCode=EO95_LTB#.
CHINA’S CONTRIBUTION TO THE PARIS CLIMATE AGREEMENT
JULY 2015
Center for Climate and Energy Solutions
3
The Center for Climate and Energy Solutions (C2ES) is an independent nonprot
organization working to promote practical, effective policies and actions to ad-
dress the twin challenges of energy and climate change.
2101 WILSON BLVD. SUITE 550 ARLINGTON, VA 22201 703-516-4146 C2ES.ORG
