
UNITED STATES
SECURITIES AND EXCHANGE COMMISSION
WASHINGTON, D.C. 20549
FORM 10-Q
(Mark One)
☒
QUARTERLY REPORT PURSUANT TO SECTION 13 OR 15(d) OF THE SECURITIES EXCHANGE ACT OF
1934
For the quarterly period ended June 15, 2024 (24 weeks)
OR
☐
TRANSITION REPORT PURSUANT TO SECTION 13 OR 15(d) OF THE SECURITIES EXCHANGE ACT OF
1934
For the transition period from to
Commission file number 1-1183
PepsiCo, Inc.
(Exact Name of Registrant as Specified in its Charter)
North Carolina 13-1584302
(State or Other Jurisdiction of
Incorporation or Organization)
(I.R.S. Employer
Identification No.)
700 Anderson Hill Road, Purchase, New York 10577
(Address of principal executive offices and Zip Code)
(914) 253-2000
Registrant's telephone number, including area code
N/A
(Former Name, Former Address and Former Fiscal Year, if Changed Since Last Report)

Securities registered pursuant to Section 12(b) of the Securities Exchange Act of 1934:
Title of each class Trading Symbols Name of each exchange on which registered
Common Stock, par value 1-2/3 cents per share
PEP
The Nasdaq Stock Market LLC
2.625% Senior Notes Due 2026
PEP26
The Nasdaq Stock Market LLC
0.750% Senior Notes Due 2027
PEP27
The Nasdaq Stock Market LLC
0.875% Senior Notes Due 2028
PEP28
The Nasdaq Stock Market LLC
0.500% Senior Notes Due 2028
PEP28A
The Nasdaq Stock Market LLC
3.200% Senior Notes Due 2029
PEP29
The Nasdaq Stock Market LLC
1.125% Senior Notes Due 2031
PEP31
The Nasdaq Stock Market LLC
0.400% Senior Notes Due 2032
PEP32
The Nasdaq Stock Market LLC
0.750% Senior Notes Due 2033
PEP33
The Nasdaq Stock Market LLC
3.550% Senior Notes Due 2034
PEP34
The Nasdaq Stock Market LLC
0.875% Senior Notes Due 2039
PEP39
The Nasdaq Stock Market LLC
1.050% Senior Notes Due 2050
PEP50
The Nasdaq Stock Market LLC
Indicate by check mark whether the registrant (1) has filed all reports required to be filed by Section 13 or 15(d) of the
Securities Exchange Act of 1934 during the preceding 12 months (or for such shorter period that the registrant was required to
file such reports), and (2) has been subject to such filing requirements for the past 90 days. Yes ☒ No ¨
Indicate by check mark whether the registrant has submitted electronically every Interactive Data File required to be submitted
pursuant to Rule 405 of Regulation S-T (§232.405 of this chapter) during the preceding 12 months (or for such shorter period
that the registrant was required to submit such files). Yes ☒ No ¨
Indicate by check mark whether the registrant is a large accelerated filer, an accelerated filer, a non-accelerated filer, a smaller
reporting company, or an emerging growth company. See the definitions of “large accelerated filer,” “accelerated filer,”
“smaller reporting company,” and “emerging growth company” in Rule 12b-2 of the Exchange Act.
Large accelerated filer
☒
Accelerated filer
☐
Non-accelerated filer
☐
Smaller reporting company
☐
Emerging growth company
☐
If an emerging growth company, indicate by check mark if the registrant has elected not to use the extended transition period
for complying with any new or revised financial accounting standards provided pursuant to Section 13(a) of the Exchange Act.
¨
Indicate by check mark whether the registrant is a shell company (as defined in Rule 12b-2 of the Exchange
Act). Yes ☐ No ☒
Number of shares of Common Stock outstanding as of July 5, 2024 was 1,373,572,400.
PepsiCo, Inc. and Subsidiaries
Table of Contents
Page No.
Part I Financial Information
Item 1. Condensed Consolidated Financial Statements 2
Condensed Consolidated Statement of Income –
12 and 24 Weeks Ended June 15, 2024 and June 17, 2023
2
Condensed Consolidated Statement of Comprehensive Income –
12 and 24 Weeks Ended June 15, 2024 and June 17, 2023
3
Condensed Consolidated Statement of Cash Flows –
24 Weeks Ended June 15, 2024 and June 17, 2023
4
Condensed Consolidated Balance Sheet –
June 15, 2024 and December 30, 2023
6
Condensed Consolidated Statement of Equity –
12 and 24 Weeks Ended June 15, 2024 and June 17, 2023
7
Notes to the Condensed Consolidated Financial Statements
8
Item 2. Management’s Discussion and Analysis of Financial Condition and Results of
Operations
24
Report of Independent Registered Public Accounting Firm 44
Item 3. Quantitative and Qualitative Disclosures About Market Risk 45
Item 4. Controls and Procedures 45
Part II Other Information
Item 1. Legal Proceedings 46
Item 1A. Risk Factors 46
Item 2. Unregistered Sales of Equity Securities and Use of Proceeds 46
Item 5. Other Information 47
Item 6. Exhibits 47
Table of Contents
1
PART I FINANCIAL INFORMATION
ITEM 1. Condensed Consolidated Financial Statements.
Condensed Consolidated Statement of Income
PepsiCo, Inc. and Subsidiaries
(in millions except per share amounts, unaudited)
12 Weeks Ended 24 Weeks Ended
6/15/2024 6/17/2023 6/15/2024 6/17/2023
Net Revenue
$ 22,501 $ 22,322 $ 40,751 $ 40,168
Cost of sales
9,919 10,121 18,167 18,109
Gross profit
12,582 12,201 22,584 22,059
Selling, general and administrative expenses
8,534 8,542 15,819 15,771
Operating Profit
4,048 3,659 6,765 6,288
Other pension and retiree medical benefits income
56 60 114 121
Net interest expense and other
(234) (201) (436) (401)
Income before income taxes
3,870 3,518 6,443 6,008
Provision for income taxes
776 747 1,296 1,293
Net income
3,094 2,771 5,147 4,715
Less: Net income attributable to noncontrolling interests
11 23 22 35
Net Income Attributable to PepsiCo
$ 3,083 $ 2,748 $ 5,125 $ 4,680
Net Income Attributable to PepsiCo per Common Share
Basic
$ 2.24 $ 1.99 $ 3.73 $ 3.40
Diluted
$ 2.23 $ 1.99 $ 3.71 $ 3.38
Weighted-average common shares outstanding
Basic
1,375 1,378 1,375 1,378
Diluted
1,379 1,384 1,380 1,384
See accompanying notes to the condensed consolidated financial statements.
Table of Contents
2

Condensed Consolidated Statement of Comprehensive Income
PepsiCo, Inc. and Subsidiaries
(in millions, unaudited)
12 Weeks Ended 24 Weeks Ended
6/15/2024 6/17/2023 6/15/2024 6/17/2023
Net income
$ 3,094 $ 2,771 $ 5,147 $ 4,715
Other comprehensive loss, net of taxes:
Net currency translation adjustment (267) (198) (449) (433)
Net change on cash flow hedges 42 24 45 (35)
Net pension and retiree medical adjustments 9 (6) 20 (10)
Net change on available-for-sale debt securities and other
(391) 1 132 —
(607) (179) (252) (478)
Comprehensive income
2,487 2,592 4,895 4,237
Less: Comprehensive income attributable to
noncontrolling interests
11 23 22 35
Comprehensive Income Attributable to PepsiCo
$ 2,476 $ 2,569 $ 4,873 $ 4,202
See accompanying notes to the condensed consolidated financial statements.
Table of Contents
3

Condensed Consolidated Statement of Cash Flows
PepsiCo, Inc. and Subsidiaries
(in millions, unaudited)
24 Weeks Ended
6/15/2024 6/17/2023
Operating Activities
Net income
$ 5,147 $ 4,715
Depreciation and amortization
1,379 1,268
Impairment and other charges
— 97
Product recall-related impact
182 —
Cash payments for product recall-related impact
(135) —
Operating lease right-of-use asset amortization
278 248
Share-based compensation expense
183 179
Restructuring and impairment charges
170 204
Cash payments for restructuring charges
(173) (187)
Pension and retiree medical plan expenses
67 62
Pension and retiree medical plan contributions
(263) (209)
Deferred income taxes and other tax charges and credits
142 270
Tax payments related to the Tax Cuts and Jobs Act (TCJ Act)
(579) (309)
Change in assets and liabilities:
Accounts and notes receivable
(1,138) (1,330)
Inventories
(696) (851)
Prepaid expenses and other current assets
(365) (271)
Accounts payable and other current liabilities
(2,968) (1,960)
Income taxes payable
287 100
Other, net
(203) (7)
Net Cash Provided by Operating Activities
1,315 2,019
Investing Activities
Capital spending
(1,701) (1,513)
Sales of property, plant and equipment
127 122
Acquisitions, net of cash acquired, investments in noncontrolled affiliates and purchases
of intangible and other assets
(30) (83)
Other divestitures, sales of investments in noncontrolled affiliates and other assets
135 75
Short-term investments, by original maturity:
More than three months - purchases
— (435)
More than three months - maturities
— 363
Three months or less, net
1 16
Other investing, net
14 32
Net Cash Used for Investing Activities
(1,454) (1,423)
(Continued on following page)
Table of Contents
4
Condensed Consolidated Statement of Cash Flows (continued)
PepsiCo, Inc. and Subsidiaries
(in millions, unaudited)
24 Weeks Ended
6/15/2024 6/17/2023
Financing Activities
Proceeds from issuances of long-term debt
$ 1,765 $ 2,986
Payments of long-term debt
(2,882) (2,252)
Short-term borrowings, by original maturity:
More than three months - proceeds
3,080 1,660
More than three months - payments
(2,138) (26)
Three months or less, net
1,286 2,023
Cash dividends paid
(3,506) (3,199)
Share repurchases
(461) (453)
Proceeds from exercises of stock options
107 86
Withholding tax payments on restricted stock units (RSUs) and performance stock units
(PSUs) converted
(131) (119)
Other financing
(20) (16)
Net Cash (Used for)/Provided by Financing Activities
(2,900) 690
Effect of exchange rate changes on cash and cash equivalents and restricted cash
(304) (144)
Net (Decrease)/Increase in Cash and Cash Equivalents and Restricted Cash
(3,343) 1,142
Cash and Cash Equivalents and Restricted Cash, Beginning of Year
9,761 5,100
Cash and Cash Equivalents and Restricted Cash, End of Period
$ 6,418 $ 6,242
Supplemental Non-Cash Activity
Right-of-use assets obtained in exchange for lease obligations $ 541 $ 439
Debt discharged via legal defeasance $ — $ 94
See accompanying notes to the condensed consolidated financial statements.
Table of Contents
5

Condensed Consolidated Balance Sheet
PepsiCo, Inc. and Subsidiaries
(in millions except per share amounts)
(Unaudited)
6/15/2024 12/30/2023
ASSETS
Current Assets
Cash and cash equivalents
$ 6,353 $ 9,711
Short-term investments
315 292
Accounts and notes receivable, less allowance ($180 and $175, respectively)
11,942 10,815
Inventories:
Raw materials and packaging
2,635 2,388
Work-in-process
121 104
Finished goods
3,131 2,842
5,887 5,334
Prepaid expenses and other current assets
1,206 798
Total Current Assets
25,703 26,950
Property, plant and equipment
55,040 54,439
Accumulated depreciation
(27,998) (27,400)
Property, Plant and Equipment, net
27,042 27,039
Amortizable Intangible Assets, net
1,151 1,199
Goodwill
17,648 17,728
Other Indefinite-Lived Intangible Assets
13,675 13,730
Investments in Noncontrolled Affiliates
2,674 2,714
Deferred Income Taxes
4,465 4,474
Other Assets
7,175 6,661
Total Assets $ 99,533 $ 100,495
LIABILITIES AND EQUITY
Current Liabilities
Short-term debt obligations
$ 8,289 $ 6,510
Accounts payable and other current liabilities
22,859 25,137
Total Current Liabilities
31,148 31,647
Long-Term Debt Obligations
36,638 37,595
Deferred Income Taxes
3,908 3,895
Other Liabilities
8,259 8,721
Total Liabilities
79,953 81,858
Commitments and contingencies
PepsiCo Common Shareholders’ Equity
Common stock, par value 1
2
/
3
¢ per share (authorized 3,600 shares; issued, net of repurchased
common stock at par value: 1,374 shares)
23 23
Capital in excess of par value
4,203 4,261
Retained earnings
71,545 70,035
Accumulated other comprehensive loss
(15,786) (15,534)
Repurchased common stock, in excess of par value (493 shares)
(40,539) (40,282)
Total PepsiCo Common Shareholders’ Equity
19,446 18,503
Noncontrolling interests
134 134
Total Equity
19,580 18,637
Total Liabilities and Equity
$ 99,533 $ 100,495
See accompanying notes to the condensed consolidated financial statements.
Table of Contents
6

Condensed Consolidated Statement of Equity
PepsiCo, Inc. and Subsidiaries
(in millions, except per share amounts, unaudited)
12 Weeks Ended 24 Weeks Ended
6/15/2024 6/17/2023 6/15/2024 6/17/2023
Shares Amount Shares Amount Shares Amount Shares Amount
Common Stock
Balance, beginning of period
1,375 $ 23 1,378 $ 23 1,374 $ 23 1,377 $ 23
Change in repurchased common stock
(1) — (1) — — — — —
Balance, end of period
1,374 23 1,377 23 1,374 23 1,377 23
Capital in Excess of Par Value
Balance, beginning of period
4,132 3,996 4,261 4,134
Share-based compensation expense
87 85 179 179
Stock option exercises, RSUs and PSUs converted
9 5 (104) (111)
Withholding tax on RSUs and PSUs converted
(23) (3) (131) (119)
Other
(2) (1) (2) (1)
Balance, end of period
4,203 4,082 4,203 4,082
Retained Earnings
Balance, beginning of period
70,331 68,142 70,035 67,800
Net income attributable to PepsiCo
3,083 2,748 5,125 4,680
Cash dividends declared
(a)
(1,869) (1,755) (3,615) (3,345)
Balance, end of period
71,545 69,135 71,545 69,135
Accumulated Other Comprehensive Loss
Balance, beginning of period
(15,179) (15,601) (15,534) (15,302)
Other comprehensive loss attributable to PepsiCo
(607) (179) (252) (478)
Balance, end of period
(15,786) (15,780) (15,786) (15,780)
Repurchased Common Stock
Balance, beginning of period
(492) (40,260) (489) (39,518) (493) (40,282) (490) (39,506)
Share repurchases
(2) (310) (2) (292) (3) (468) (3) (466)
Stock option exercises, RSUs and PSUs converted
1 31 1 35 3 210 3 197
Other
— — — — — 1 — —
Balance, end of period
(493) (40,539) (490) (39,775) (493) (40,539) (490) (39,775)
Total PepsiCo Common Shareholders’ Equity
19,446 17,685 19,446 17,685
Noncontrolling Interests
Balance, beginning of period
143 133 134 124
Net income attributable to noncontrolling interest
11 23 22 35
Distributions to noncontrolling interests
(16) (14) (17) (15)
Other, net
(4) (2) (5) (4)
Balance, end of period
134 140 134 140
Total Equity
$ 19,580 $ 17,825 $ 19,580 $ 17,825
(a) Cash dividends declared per common share were $1.355 and $1.265 for the 12 weeks ended June 15, 2024 and June 17, 2023,
respectively, and $2.62 and $2.415 for the 24 weeks ended June 15, 2024 and June 17, 2023, respectively.
See accompanying notes to the condensed consolidated financial statements.
Table of Contents
7

Notes to the Condensed Consolidated Financial Statements
Note 1 - Basis of Presentation and Our Divisions
Basis of Presentation
When used in this report, the terms “we,” “us,” “our,” “PepsiCo” and the “Company” mean PepsiCo, Inc.
and its consolidated subsidiaries, collectively.
The accompanying unaudited condensed consolidated financial statements have been prepared in
accordance with U.S. Generally Accepted Accounting Principles (GAAP) for interim financial
information and with the rules and regulations for reporting the Quarterly Report on Form 10-Q (Form 10-
Q). Accordingly, they do not include all of the information and footnotes required by GAAP for complete
financial statements. The condensed consolidated balance sheet at December 30, 2023 has been derived
from the audited consolidated financial statements at that date, but does not include all of the information
and footnotes required by GAAP for complete financial statements. These financial statements have been
prepared on a basis that is substantially consistent with the accounting principles applied in our Annual
Report on Form 10-K for the fiscal year ended December 30, 2023 (2023 Form 10-K). This report should
be read in conjunction with our 2023 Form 10-K. In our opinion, these financial statements include all
normal and recurring adjustments necessary for a fair presentation. The results for the 12 and 24 weeks
ended June 15, 2024 are not necessarily indicative of the results expected for any future period or the full
year.
Raw materials, direct labor and plant overhead, as well as purchasing and receiving costs, costs directly
related to production planning, inspection costs and raw materials handling facilities, are included in cost
of sales. The costs of moving, storing and delivering finished product, including merchandising activities,
are included in selling, general and administrative expenses.
While our financial results in the United States and Canada (North America) are reported on a 12-week
basis, all of our international operations are reported on a monthly calendar basis for which the months of
March, April and May are reflected in our results for the 12 weeks ended June 15, 2024 and June 17,
2023, and the months of January through May are reflected in our results for the 24 weeks ended June 15,
2024 and June 17, 2023.
The preparation of our condensed consolidated financial statements requires management to make
estimates and assumptions that affect the amounts reported in our condensed consolidated financial
statements and related disclosures. Additionally, the business and economic uncertainty resulting from
volatile geopolitical conditions and the high interest rate and inflationary cost environment has made such
estimates and assumptions more difficult to calculate. Accordingly, actual results and outcomes could
differ from those estimates.
Our significant interim accounting policies include the recognition of a pro rata share of certain estimated
annual sales incentives and certain advertising and marketing costs in proportion to revenue or volume, as
applicable, and the recognition of income taxes using an estimated annual effective tax rate.
Unless otherwise noted, tabular dollars are in millions, except per share amounts. All per share amounts
reflect common per share amounts, assume dilution unless otherwise noted, and are based on unrounded
amounts. Certain reclassifications were made to the prior year’s financial statements to conform to the
current year presentation.
Table of Contents
8

Our Divisions
We are organized into seven reportable segments (also referred to as divisions), as follows:
1) Frito-Lay North America (FLNA), which includes our branded convenient food businesses in the
United States and Canada;
2) Quaker Foods North America (QFNA), which includes our branded convenient food businesses,
such as cereal, rice, pasta and other branded food, in the United States and Canada;
3) PepsiCo Beverages North America (PBNA), which includes our beverage businesses in the United
States and Canada;
4) Latin America (LatAm), which includes all of our beverage and convenient food businesses in
Latin America;
5) Europe, which includes all of our beverage and convenient food businesses in Europe;
6) Africa, Middle East and South Asia (AMESA), which includes all of our beverage and convenient
food businesses in Africa, the Middle East and South Asia; and
7) Asia Pacific, Australia and New Zealand and China region (APAC), which includes all of our
beverage and convenient food businesses in Asia Pacific, Australia and New Zealand, and China
region.
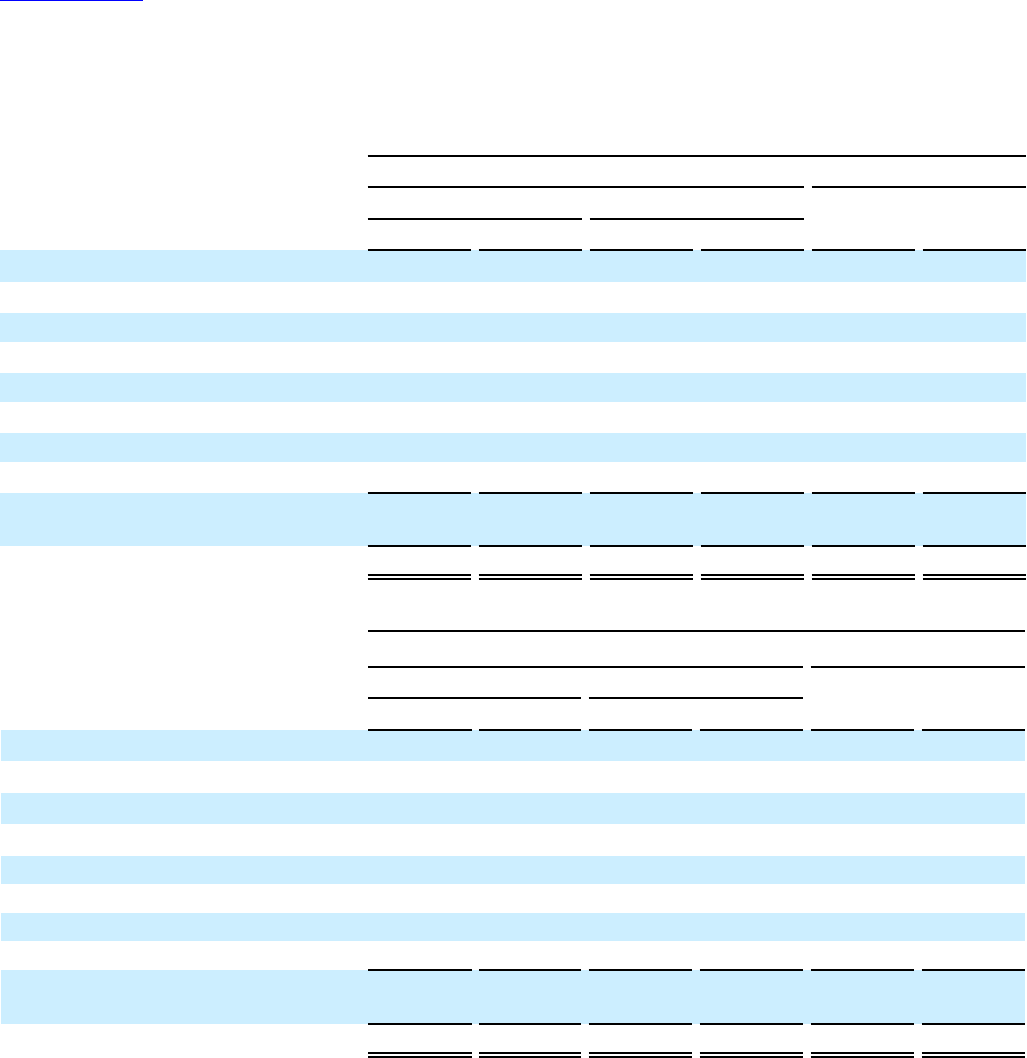
Net revenue of each division is as follows:
12 Weeks Ended 24 Weeks Ended
6/15/2024 6/17/2023 6/15/2024 6/17/2023
FLNA
$ 5,874 $ 5,904 $ 11,550 $ 11,487
QFNA
561 684 1,154 1,461
PBNA
6,811 6,755 12,685 12,553
LatAm
3,045 2,856 5,112 4,633
Europe
3,515 3,428 5,451 5,314
AMESA
1,592 1,568 2,632 2,587
APAC
1,103 1,127 2,167 2,133
Total $ 22,501 $ 22,322 $ 40,751 $ 40,168
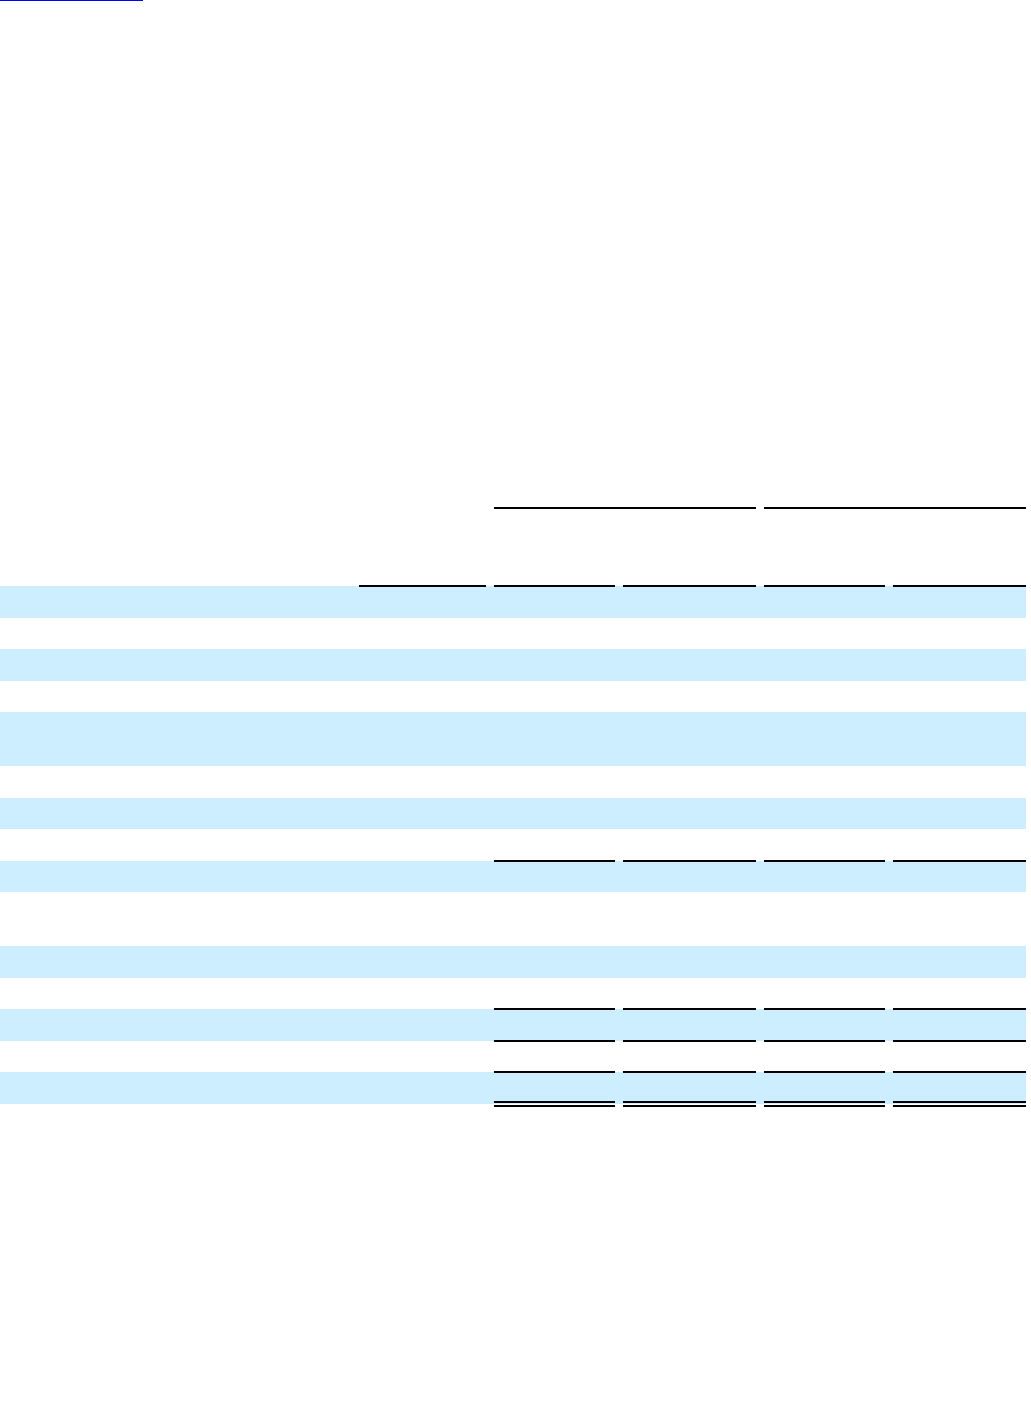
Our primary performance obligation is the distribution and sales of beverage and convenient food products
to our customers. The following tables reflect the percentage of net revenue generated between our
beverage business and our convenient food business for each of our international divisions, as well as our
consolidated net revenue:
12 Weeks Ended
6/15/2024 6/17/2023
Beverages
(a)
Convenient Foods Beverages
(a)
Convenient Foods
LatAm
10 % 90 % 9 % 91 %
Europe
48 % 52 % 49 % 51 %
AMESA
33 % 67 % 31 % 69 %
APAC
28 % 72 % 26 % 74 %
PepsiCo 43 % 57 % 42 % 58 %
Table of Contents
9

24 Weeks Ended
6/15/2024 6/17/2023
Beverages
(a)
Convenient Foods Beverages
(a)
Convenient Foods
LatAm
9 % 91 % 9 % 91 %
Europe
47 % 53 % 48 % 52 %
AMESA
33 % 67 % 31 % 69 %
APAC
21 % 79 % 21 % 79 %
PepsiCo 42 % 58 % 42 % 58 %
(a) Beverage revenue from company-owned bottlers, which primarily includes our consolidated bottling operations in our PBNA and
Europe divisions, was 36% and 35% of our consolidated net revenue in the 12 and 24 weeks ended June 15, 2024, respectively, and 37%
and 36% of our consolidated net revenue in the 12 and 24 weeks ended June 17, 2023, respectively. Generally, our finished goods
beverage operations produce higher net revenue but lower operating margin as compared to concentrate sold to authorized bottling
partners for the manufacture of finished goods beverages.
Operating profit of each division is as follows:
12 Weeks Ended 24 Weeks Ended
6/15/2024 6/17/2023 6/15/2024 6/17/2023
FLNA
$ 1,592 $ 1,647 $ 3,146 $ 3,246
QFNA
(a)
85 129 36 317
PBNA
(b)
987 723 1,497 1,206
LatAm
637 592 1,122 956
Europe
620 476 822 547
AMESA
241 250 393 418
APAC
223 223 456 450
Total divisions
4,385 4,040 7,472 7,140
Corporate unallocated expenses
(c)
(337) (381) (707) (852)
Total $ 4,048 $ 3,659 $ 6,765 $ 6,288
(a) In the 12 weeks ended June 15, 2024, we recorded a pre-tax charge of $15 million ($11 million after-tax or $0.01 per share) associated
with a previously announced voluntary recall of certain bars and cereals in our QFNA division (Quaker Recall) with $8 million recorded
in cost of sales and $7 million recorded in selling, general and administrative expenses. In the 24 weeks ended June 15, 2024, we
recorded a pre-tax charge of $182 million ($139 million after-tax or $0.10 per share) associated with the Quaker Recall, with
$175 million recorded in cost of sales related to property, plant and equipment write-offs, employee severance costs and other costs and
$7 million recorded in selling, general and administrative expenses.
(b) In the 12 and 24 weeks ended June 17, 2023, we recorded our proportionate 39% share of Tropicana Brands Group’s (TBG) impairment
of indefinite-lived intangible assets, and recorded an other-than-temporary impairment of our equity method investment, both of which
resulted in pre-tax impairment charges of $113 million ($86 million after-tax or $0.06 per share), recorded in selling, general and
administrative expenses. See Note 9 for further information.
(c) In both the 12 and 24 weeks ended June 15, 2024 and June 17, 2023, we recorded a pre-tax gain of $76 million ($57 million after-tax or
$0.04 per share) and $85 million ($65 million after-tax or $0.05 per share), respectively, in selling, general and administrative expenses
as a result of the sale of corporate assets.
Table of Contents
10

Note 2 - Recently Issued Accounting Pronouncements
Adopted
In September 2022, the Financial Accounting Standards Board (FASB) issued guidance to enhance the
transparency of supplier finance programs to allow financial statement users to understand the effect on
working capital, liquidity and cash flows. The new guidance requires disclosure of key terms of the
program, including a description of the payment terms, payment timing and assets pledged as security or
other forms of guarantees provided to the finance provider or intermediary. Other requirements include the
disclosure of the amount that remains unpaid as of the end of the reporting period, a description of where
these obligations are presented in the balance sheet and a rollforward of the obligation during the annual
period. We adopted the guidance in the first quarter of 2023, except for the rollforward, which is effective
for the current fiscal year 2024. We will adopt the rollforward guidance when it becomes effective in our
2024 annual reporting, on a prospective basis. See Note 12 for disclosures currently required under this
guidance.
Not Yet Adopted
In December 2023, the FASB issued guidance to enhance transparency of income tax disclosures. On an
annual basis, the new guidance requires a public entity to disclose: (1) specific categories in the rate
reconciliation, (2) additional information for reconciling items that are equal to or greater than 5% of the
amount computed by multiplying income (or loss) from continuing operations before income tax expense
(or benefit) by the applicable statutory income tax rate, (3) income taxes paid (net of refunds received)
disaggregated by federal (national), state, and foreign taxes, with foreign taxes disaggregated by individual
jurisdictions in which income taxes paid is equal to or greater than 5% of total income taxes paid, (4)
income (or loss) from continuing operations before income tax expense (or benefit) disaggregated between
domestic and foreign, and (5) income tax expense (or benefit) from continuing operations disaggregated
between federal (national), state and foreign. The guidance is effective for fiscal year 2025 annual
reporting, with early adoption permitted, to be applied on a prospective basis, with retrospective
application permitted. We will adopt the guidance when it becomes effective, in our 2025 annual
reporting, on a prospective basis.
In November 2023, the FASB issued guidance to enhance disclosure of expenses of a public entity’s
reportable segments. The new guidance requires a public entity to disclose: (1) on an annual and interim
basis, significant segment expenses that are regularly provided to the chief operating decision maker
(CODM) and included within each reported measure of segment profit or loss, (2) on an annual and
interim basis, an amount for other segment items (the difference between segment revenue less the
significant expenses disclosed under the significant expense principle and each reported measure of
segment profit or loss), including a description of its composition, (3) on an annual and interim basis,
information about a reportable segment’s profit or loss and assets previously required to be disclosed only
on an annual basis, and (4) the title and position of the CODM and an explanation of how the CODM uses
the reported measure(s) of segment profit or loss in assessing segment performance and how to allocate
resources. The new guidance also clarifies that if the CODM uses more than one measure of a segment’s
profit or loss, one or more of those measures may be reported and requires that a public entity that has a
single reportable segment provide all the disclosures required by the amendments in this update and all
existing segment disclosures. The guidance is effective for the current fiscal year 2024 annual reporting,
and in the first quarter of 2025 for interim period reporting, with early adoption permitted. Upon adoption,
this guidance should be applied retrospectively to all prior periods presented. We will adopt the guidance
when it becomes effective in our 2024 annual reporting.
Table of Contents
11
Note 3 - Restructuring and Impairment Charges
2019 Multi-Year Productivity Plan
We publicly announced a multi-year productivity plan on February 15, 2019 (2019 Productivity Plan) that
leverages new technology and business models to further simplify, harmonize and automate processes; re-
engineers our go-to-market and information systems, including deploying the right automation for each
market; and simplifies our organization and optimize our manufacturing and supply chain footprint. To
build on the successful implementation of the 2019 Productivity Plan, in 2022, we expanded and extended
the plan through the end of 2028 to take advantage of additional opportunities within the initiatives
described above. As a result, we expect to incur pre-tax charges of approximately $3.65 billion, including
cash expenditures of approximately $2.9 billion. These pre-tax charges are expected to consist of
approximately 55% of severance and other employee-related costs, 10% for asset impairments (all non-
cash) resulting from plant closures and related actions, and 35% for other costs associated with the
implementation of our initiatives.
The total plan pre-tax charges are expected to be incurred by division approximately as follows:
FLNA QFNA PBNA LatAm Europe AMESA APAC Corporate
Expected pre-tax charges
10 % 1 % 30 % 10 % 25 % 5 % 4 % 15 %
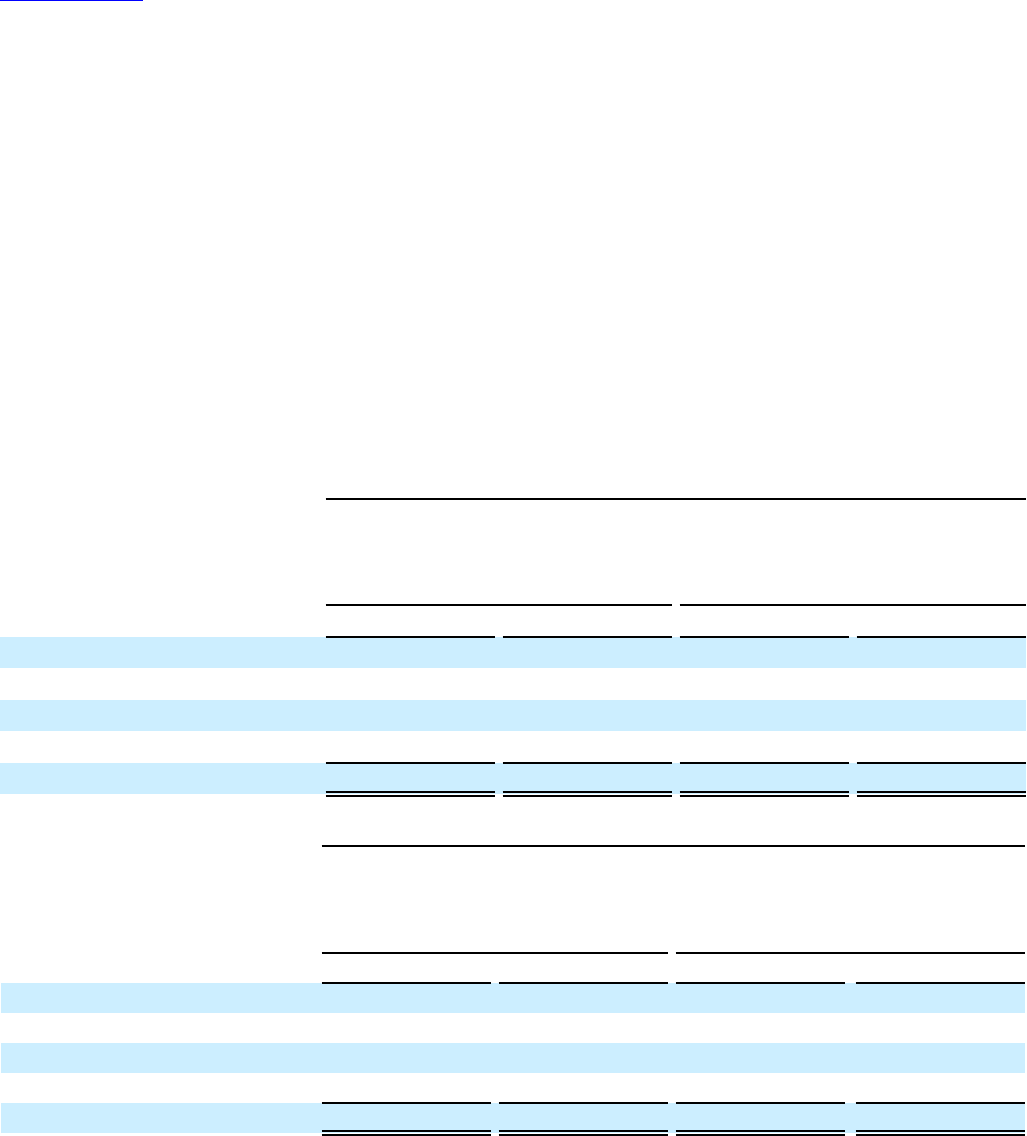
A summary of our 2019 Productivity Plan charges is as follows:
12 Weeks Ended 24 Weeks Ended
6/15/2024 6/17/2023 6/15/2024 6/17/2023
Cost of sales
$ — $ 3 $ 6 $ 6
Selling, general and administrative expenses
66 89 149 199
Other pension and retiree medical benefits expense/(income)
(a)
8 — 15 (1)
Total restructuring and impairment charges
$ 74 $ 92 $ 170 $ 204
After-tax amount
$ 54 $ 63 $ 130 $ 161
Impact on net income attributable to PepsiCo per common share
$ (0.04) $ (0.05) $ (0.09) $ (0.12)
12 Weeks Ended 24 Weeks Ended Plan-to-Date
6/15/2024 6/17/2023 6/15/2024 6/17/2023 through 6/15/2024
FLNA
$ 13 $ 6 $ 35 $ 13 $ 287
QFNA
— — 4 — 23
PBNA
5 5 15 10 282
LatAm
16 6 21 11 221
Europe
19 52 37 141 603
AMESA
3 — 3 5 100
APAC
4 4 4 5 89
Corporate
6 19 36 20 353
66 92 155 205 1,958
Other pension and retiree medical
benefits expense/(income)
(a)
8 — 15 (1) 112
Total
$ 74 $ 92 $ 170 $ 204 $ 2,070
(a) Income amount represents adjustments for changes in estimates of previously recorded amounts.
Table of Contents
12

12 Weeks Ended 24 Weeks Ended Plan-to-Date
6/15/2024 6/17/2023 6/15/2024 6/17/2023 through 6/15/2024
Severance and other employee costs $ 10 $ 50 $ 82 $ 142 $ 1,132
Asset impairments 3 — 4 — 196
Other costs 61 42 84 62 742
Total $ 74 $ 92 $ 170 $ 204 $ 2,070
Severance and other employee costs primarily include severance and other termination benefits, as well as
voluntary separation arrangements. Other costs primarily include costs associated with the implementation
of our initiatives, including consulting and other professional fees, as well as contract termination costs.
A summary of our 2019 Productivity Plan activity for the 24 weeks ended June 15, 2024 is as follows:
Severance
and Other
Employee Costs
Asset
Impairments Other Costs Total
Liability as of December 30, 2023
$ 188 $ — $ 9 $ 197
2024 restructuring charges 82 4 84 170
Cash payments
(84) — (89) (173)
Non-cash charges and translation
(11) (4) 14 (1)
Liability as of June 15, 2024
$ 175 $ — $ 18 $ 193
The majority of the restructuring accrual at June 15, 2024 is expected to be paid by the end of 2024.
Other Productivity Initiatives
There were no material charges related to other productivity and efficiency initiatives outside the scope of
the 2019 Productivity Plan.
We regularly evaluate different productivity initiatives beyond the productivity plan and other initiatives
described above.
Note 4 - Intangible Assets
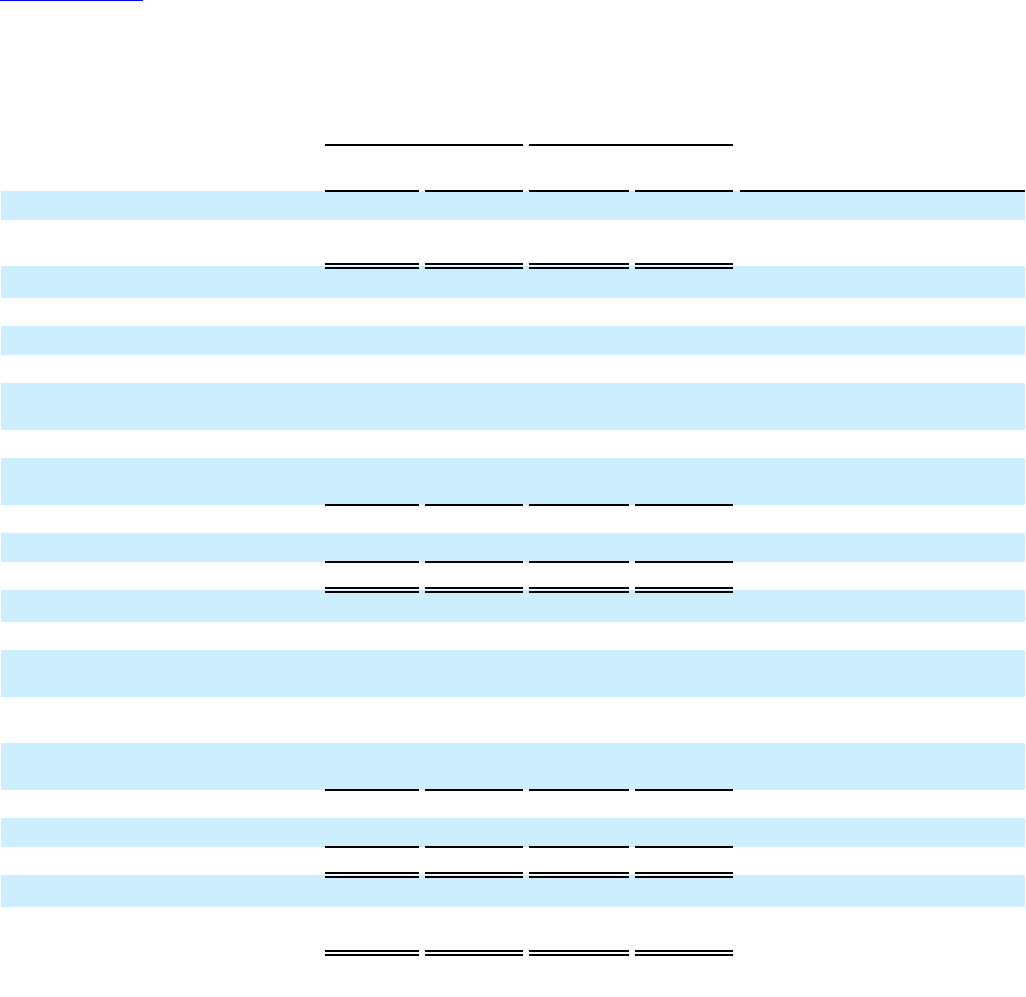
A summary of our amortizable intangible assets is as follows:
6/15/2024 12/30/2023
Gross
Accumulated
Amortization Net Gross
Accumulated
Amortization Net
Acquired franchise rights
$ 832 $ (219) $ 613 $ 840 $ (214) $ 626
Customer relationships 553 (274) 279 560 (265) 295
Brands
1,081 (986) 95 1,093 (989) 104
Other identifiable intangibles 440 (276) 164 449 (275) 174
Total $ 2,906 $ (1,755) $ 1,151 $ 2,942 $ (1,743) $ 1,199
Table of Contents
13

The change in the book value of indefinite-lived intangible assets is as follows:
Balance
12/30/2023
Translation
and Other
Balance
6/15/2024
FLNA
Goodwill
$ 453 $ (5) $ 448
Brands
251 — 251
Total
704 (5) 699
QFNA
Goodwill
189 — 189
Total
189 — 189
PBNA
Goodwill
11,961 (16) 11,945
Reacquired franchise rights
7,114 (29) 7,085
Acquired franchise rights
1,737 (5) 1,732
Brands
2,508 — 2,508
Total
23,320 (50) 23,270
LatAm
Goodwill
460 (11) 449
Brands
82 (2) 80
Total
542 (13) 529
Europe
Goodwill
3,166 (21) 3,145
Reacquired franchise rights
419 (4) 415
Acquired franchise rights
154 (4) 150
Brands
1,124 (5) 1,119
Total
4,863 (34) 4,829
AMESA
Goodwill
991 (16) 975
Brands
137 (2) 135
Total
1,128 (18) 1,110
APAC
Goodwill
508 (11) 497
Brands
204 (4) 200
Total
712 (15) 697
Total goodwill
17,728 (80) 17,648
Total reacquired franchise rights
7,533 (33) 7,500
Total acquired franchise rights
1,891 (9) 1,882
Total brands
4,306 (13) 4,293
Total
$ 31,458 $ (135) $ 31,323
Table of Contents
14

Note 5 - Income Taxes
Numerous countries have agreed to a statement in support of the Organization for Economic Co-operation
and Development (OECD) model rules that propose a global minimum tax rate of 15%. Certain countries
have enacted legislation incorporating the agreed global minimum tax effective in 2024. Legislation
enacted as of June 15, 2024 did not have a material impact on our financial statements for the 12 and 24
weeks ended June 15, 2024 and is not expected to have a material impact on our 2024 financial
statements.
Note 6 - Share-Based Compensation
The following table summarizes our total share-based compensation expense, which is primarily recorded
in selling, general and administrative expenses:
12 Weeks Ended 24 Weeks Ended
6/15/2024 6/17/2023 6/15/2024 6/17/2023
Share-based compensation expense – equity awards
$ 86 $ 86 $ 183 $ 179
Share-based compensation expense – liability awards
5 6 10 12
Restructuring charges
1 (1) (4) —
Total $ 92 $ 91 $ 189 $ 191
The following table summarizes share-based awards granted under the terms of the PepsiCo, Inc. Long-
Term Incentive Plan:
24 Weeks Ended
6/15/2024 6/17/2023
Granted
(a)
Weighted-
Average
Grant Price Granted
(a)
Weighted-
Average
Grant Price
Stock options
1.8 $ 164.25 2.0 $ 171.00
RSUs and PSUs
2.3 $ 164.25 2.1 $ 171.11
(a) In millions. All grant activity is disclosed at target.
We granted long-term cash awards to certain executive officers and other senior executives with an
aggregate target value of $19 million and $20 million during the 24 weeks ended June 15, 2024 and
June 17, 2023, respectively.
For the 12 weeks ended June 15, 2024 and June 17, 2023, our grants of stock options, RSUs, PSUs and
long-term cash awards were nominal.
Our weighted-average Black-Scholes fair value assumptions are as follows:
24 Weeks Ended
6/15/2024 6/17/2023
Expected life
7 years 7 years
Risk-free interest rate
4.2 % 4.2 %
Expected volatility 16 % 16 %
Expected dividend yield
2.9 %
2.7 %
Table of Contents
15
Note 7 - Pension and Retiree Medical Benefits
The components of net periodic benefit cost/(income) for pension and retiree medical plans are as follows:
12 Weeks Ended
Pension Retiree Medical
U.S. International
6/15/2024 6/17/2023 6/15/2024 6/17/2023 6/15/2024 6/17/2023
Service cost
$ 80 $ 75 $ 12 $ 10 $ 8 $ 7
Other pension and retiree medical benefits income:
Interest cost
135 137 36 34 8 9
Expected return on plan assets
(202) (196) (50) (46) (3) (3)
Amortization of prior service credits
(5) (6) (1) — (1) (2)
Amortization of net losses/(gains)
18 16 5 3 (6) (6)
Settlement losses
— — 2 — — —
Special termination benefits
8 — — — — —
Total other pension and retiree medical
benefits income
(46) (49) (8) (9) (2) (2)
Total
$ 34 $ 26 $ 4 $ 1 $ 6 $ 5
24 Weeks Ended
Pension Retiree Medical
U.S. International
6/15/2024 6/17/2023 6/15/2024 6/17/2023 6/15/2024 6/17/2023
Service cost
$ 160 $ 151 $ 21 $ 18 $ 15 $ 13
Other pension and retiree medical benefits income:
Interest cost
270 274 63 59 15 17
Expected return on plan assets
(403) (393) (89) (81) (6) (6)
Amortization of prior service credits
(11) (12) (1) — (2) (3)
Amortization of net losses/(gains)
36 32 9 5 (12) (12)
Settlement losses
— — 2 — — —
Special termination benefits
15 (1) — — — —
Total other pension and retiree medical
benefits income
(93) (100) (16) (17) (5) (4)
Total
$ 67 $ 51 $ 5 $ 1 $ 10 $ 9
We regularly evaluate opportunities to reduce risk and volatility associated with our pension and retiree
medical plans.
In the 24 weeks ended June 15, 2024 and June 17, 2023, we made discretionary contributions of $150
million and $125 million, respectively, to our U.S. qualified defined benefit plans, and $27 million and
$17 million, respectively, to our international defined benefit plans.
Table of Contents
16

Note 8 - Debt Obligations
In the 24 weeks ended June 15, 2024, we issued, through our wholly-owned consolidated finance
subsidiary, PepsiCo Singapore Financing I Pte. Ltd., the following notes:
(a)
Interest Rate Maturity Date Principal Amount
(b)
Floating rate February 2027 $ 300
4.650 % February 2027 $ 550
4.550 % February 2029 $ 450
4.700 % February 2034 $ 450
(a) PepsiCo Singapore Financing I Pte. Ltd. is a finance subsidiary and has no assets, operations, revenues or cash flows other than those
related to the issuance, administration and repayment of the notes and any other notes that may be issued in the future. The notes are
fully and unconditionally guaranteed by PepsiCo, Inc. on a senior unsecured basis and may be assumed at any time by PepsiCo, Inc. as
the primary and sole obligor.
(b) Excludes debt issuance costs, discounts and premiums.
The net proceeds from the issuances of the above notes were used for general corporate purposes,
including the repayment of commercial paper.
In the 24 weeks ended June 15, 2024, $1.3 billion of U.S. dollar-denominated senior notes, €1.0 billion of
euro-denominated senior notes and C$0.8 billion of Canadian dollar-denominated senior notes matured
and were paid.
As of June 15, 2024, we had $4.4 billion of commercial paper outstanding, excluding discounts.
In the 12 and 24 weeks ended June 15, 2024, we entered into a new five-year unsecured revolving credit
agreement (Five-Year Credit Agreement), which expires on May 24, 2029. The Five-Year Credit
Agreement enables us and our borrowing subsidiaries to borrow up to $5.0 billion in U.S. dollars and/or
euros, including a $0.75 billion swing line subfacility for euro-denominated borrowings permitted to be
borrowed on a same-day basis, subject to customary terms and conditions. We may request that
commitments under this agreement be increased up to $5.75 billion (or the equivalent amount in euros).
Additionally, we may, up to two times during the term of the 2024 Five-Year Credit Agreement, request
renewal of the agreement for an additional one-year period. The Five-Year Credit Agreement replaced our
$4.2 billion five-year credit agreement, dated as of May 26, 2023.
Also in the 12 and 24 weeks ended June 15, 2024, we entered into a new 364-day unsecured revolving
credit agreement (364-Day Credit Agreement), which expires on May 23, 2025. The 364-Day Credit
Agreement enables us and our borrowing subsidiaries to borrow up to $5.0 billion in U.S. dollars and/or
euros, subject to customary terms and conditions. We may request that commitments under this agreement
be increased up to $5.75 billion (or the equivalent amount in euros). We may request renewal of this
facility for an additional 364-day period or convert any amounts outstanding into a term loan for a period
of up to one year, which term loan would mature no later than the anniversary of the then effective
termination date. The 364-Day Credit Agreement replaced our $4.2 billion 364-day credit agreement,
dated as of May 26, 2023.
Funds borrowed under the Five-Year Credit Agreement and the 364-Day Credit Agreement may be used
for general corporate purposes. Subject to certain conditions, we may borrow, prepay and reborrow
amounts under these agreements. As of June 15, 2024, there were no outstanding borrowings under the
Five-Year Credit Agreement or the 364-Day Credit Agreement.
Table of Contents
17

Note 9 - Financial Instruments
We are exposed to market risks arising from adverse changes in:
• commodity prices, affecting the cost of our raw materials and energy;
• foreign exchange rates and currency restrictions; and
• interest rates.
There have been no material changes during the 24 weeks ended June 15, 2024 with respect to our risk
management policies or strategies and valuation techniques used in measuring the fair value of the
financial assets or liabilities disclosed in Note 9 to our consolidated financial statements in our 2023 Form
10-K.
Certain of our agreements with our counterparties require us to post full collateral on derivative
instruments in a net liability position if our credit rating is at A2 (Moody’s Investors Service, Inc.) or A
(S&P Global Ratings) and we have been placed on credit watch for possible downgrade or if our credit
rating falls below either of these levels. The fair value of all derivative instruments with credit-risk-related
contingent features that were in a net liability position as of June 15, 2024 was $141 million. We have
posted no collateral under these contracts and no credit-risk-related contingent features were triggered as
of June 15, 2024.
The notional amounts of our financial instruments used to hedge the above risks as of June 15, 2024 and
December 30, 2023 are as follows:
Notional Amounts
(a)
6/15/2024 12/30/2023
Commodity
$ 1.4 $ 1.7
Foreign exchange
$ 3.0 $ 3.8
Interest rate
$ 0.7 $ 1.3
Net investment
(b)
$ 2.9 $ 3.0
(a) In billions.
(b) The total notional amount of our net investment hedges consists of non-derivative debt instruments.
As of June 15, 2024, approximately 14% of total debt was subject to variable rates, compared to 9% as of
December 30, 2023.
Debt Securities
Held-to-Maturity
As of June 15, 2024, we had no investments in held-to-maturity debt securities. As of December 30, 2023,
we had $309 million of investments in commercial paper held-to-maturity debt securities recorded in cash
and cash equivalents. Held-to-maturity debt securities are recorded at amortized cost, which approximates
fair value, and realized gains or losses are reported in earnings. As of December 30, 2023, gross
unrecognized gains and losses and the allowance for expected credit losses were not material.
Available-for-Sale
There were no material impairment charges related to investments in available-for-sale debt securities in
both the 24 weeks ended June 15, 2024 and June 17, 2023. There were unrealized gains of $800 million as
of June 15, 2024 and no unrealized gains or losses as of June 17, 2023 related to investments in available-
for-sale debt securities. Related to our Level 3 (significant unobservable inputs) investment in Celsius
Holdings, Inc. (Celsius), we recorded an unrealized loss of $503 million and an unrealized gain of
$188 million in other comprehensive income during the 12 and 24 weeks ended June 15, 2024,
respectively. Additionally, we recorded a decrease in the investment of $7 million due to cash dividends
Table of Contents
18
received during the 12 and 24 weeks ended June 15, 2024. There were no Level 3 investments in
available-for-sale debt securities during the 24 weeks ended June 17, 2023.
TBG Investment
In the 12 and 24 weeks ended June 17, 2023, we recorded our proportionate 39% share of TBG’s
impairment of indefinite-lived intangible assets, and recorded an other-than-temporary impairment of our
equity method investment, both of which resulted in pre-tax impairment charges of $113 million
($86 million after-tax or $0.06 per share), recorded in selling, general and administrative expenses in our
PBNA division. We estimated the fair value of our ownership in TBG using discounted cash flows and an
option pricing model related to our liquidation preference in TBG, which we categorized as Level 3 in the
fair value hierarchy. There were no impairment charges recorded in the 24 weeks ended June 15, 2024.
Recurring Fair Value Measurements
The fair values of our financial assets and liabilities as of June 15, 2024 and December 30, 2023 are
categorized as follows:
6/15/2024 12/30/2023
Fair Value
Hierarchy
Levels
(a)
Assets
(a)
Liabilities
(a)
Assets
(a)
Liabilities
(a)
Available-for-sale debt securities
(b)
2,3
$ 1,519 $ — $ 1,334 $ —
Index funds
(c)
1
$ 315 $ — $ 292 $ —
Prepaid forward contracts
(d)
2
$ 13 $ — $ 13 $ —
Deferred compensation
(e)
2
$ — $ 493 $ — $ 477
Derivatives designated as cash
flow hedging instruments:
Foreign exchange
(f)
2
$ 14 $ 13 $ 3 $ 31
Interest rate
(f)
2
— 152 5 135
Commodity
(g)
2
23 8 10 24
$ 37 $ 173 $ 18 $ 190
Derivatives not designated as
hedging instruments:
Foreign exchange
(f)
2
$ 14 $ 14 $ 33 $ 38
Commodity
(g)
2
7 3 5 13
$ 21 $ 17 $ 38 $ 51
Total derivatives at fair value
(h)
$ 58 $ 190 $ 56 $ 241
Total
$ 1,905 $ 683 $ 1,695 $ 718
(a) Fair value hierarchy levels are categorized consistently by Level 1 (quoted prices in active markets for identical assets), Level 2
(significant other observable inputs) and Level 3 in both years. Unless otherwise noted, financial assets are classified on our balance
sheet within prepaid expenses and other current assets and other assets. Financial liabilities are classified on our balance sheet within
accounts payable and other current liabilities and other liabilities.
(b) Includes Level 2 assets of $182 million and Level 3 assets of $1,337 million as of June 15, 2024, and Level 2 assets of $178 million and
Level 3 assets of $1,156 million as of December 30, 2023. As of June 15, 2024 and December 30, 2023, $1,519 million and
$1,334 million were classified as other assets, respectively. The fair values of our Level 2 investments approximate the transaction price
and any accrued returns, as well as the amortized cost. The fair value of our Level 3 investment in Celsius is estimated using probability-
weighted discounted future cash flows based on a Monte Carlo simulation using significant unobservable inputs such as an 80%
probability that a certain market-based condition will be met and an average estimated discount rate of 5.8% and 8.1% as of June 15,
2024 and December 30, 2023, respectively, based on Celsius’ estimated synthetic credit rating. An increase in the probability that certain
market-based conditions will be met or a decrease in the discount rate would result in a higher fair value measurement, while a decrease
in the probability that certain market-based conditions will be met or an increase in the discount rate would result in a lower fair value
measurement.
Table of Contents
19
(c) Based on the price of index funds. These investments are classified as short-term investments and are used to manage a portion of market
risk arising from our deferred compensation liability.
(d) Based primarily on the price of our common stock.
(e) Based on the fair value of investments corresponding to employees’ investment elections.
(f) Based on recently reported market transactions of spot and forward rates.
(g) Primarily based on recently reported market transactions of swap arrangements.
(h) Derivative assets and liabilities are presented on a gross basis on our balance sheet. Amounts subject to enforceable master netting
arrangements or similar agreements which are not offset on our balance sheet as of June 15, 2024 and December 30, 2023 were not
material. Collateral received or posted against our asset or liability positions was not material. Exchange-traded commodity futures are
cash-settled on a daily basis and, therefore, not included in the table.
The carrying amounts of our cash and cash equivalents and short-term investments recorded at amortized
cost approximate fair value (classified as Level 2 in the fair value hierarchy) due to their short-term
maturity. The fair value of our debt obligations as of June 15, 2024 and December 30, 2023 was $41
billion, based upon prices of identical or similar instruments in the marketplace, which are considered
Level 2 inputs.
Losses/(gains) on our cash flow and net investment hedges are categorized as follows:
12 Weeks Ended
Losses/(Gains)
Recognized in
Accumulated Other
Comprehensive Loss
Losses/(Gains)
Reclassified from
Accumulated Other
Comprehensive Loss
into Income Statement
(a)
6/15/2024 6/17/2023 6/15/2024 6/17/2023
Foreign exchange
$ (1) $ 43 $ 9 $ 14
Interest rate
9 (37) 11 (30)
Commodity
(11) (15) 30 28
Net investment
(17) 71 — —
Total
$ (20) $ 62 $ 50 $ 12
24 Weeks Ended
Losses/(Gains)
Recognized in
Accumulated Other
Comprehensive Loss
Losses/(Gains)
Reclassified from
Accumulated Other
Comprehensive Loss
into Income Statement
(a)
6/15/2024 6/17/2023 6/15/2024 6/17/2023
Foreign exchange
$ (15) $ 59 $ 18 $ 15
Interest rate
34 (26) 35 (27)
Commodity
28 50 51 37
Net investment
(69) 108 — —
Total
$ (22) $ 191 $ 104 $ 25
(a) Foreign exchange derivative losses/(gains) are included in net revenue and cost of sales. Interest rate derivative losses/(gains) are
included in selling, general and administrative expenses. Commodity derivative losses/(gains) are included in either cost of sales or
selling, general and administrative expenses, depending on the underlying commodity. See Note 11 for further information.
Based on current market conditions, we expect to reclassify net losses of $55 million related to our cash
flow hedges from accumulated other comprehensive loss within common shareholders’ equity into net
income during the next 12 months.
Table of Contents
20

Losses/(gains) recognized in the income statement related to our non-designated hedges are categorized as
follows:
12 Weeks Ended
6/15/2024 6/17/2023
Cost of sales
Selling, general
and
administrative
expenses Total Cost of sales
Selling, general
and
administrative
expenses Total
Foreign exchange $ — $ 24 $ 24 $ — $ 44 $ 44
Commodity (14) 5 (9) 5 3 8
Total $ (14) $ 29 $ 15 $ 5 $ 47 $ 52
24 Weeks Ended
6/15/2024 6/17/2023
Cost of sales
Selling, general
and
administrative
expenses Total Cost of sales
Selling, general
and
administrative
expenses Total
Foreign exchange $ — $ 42 $ 42 $ (1) $ 39 $ 38
Commodity (15) (20) (35) 36 53 89
Total $ (15) $ 22 $ 7 $ 35 $ 92 $ 127
Note 10 - Net Income Attributable to PepsiCo per Common Share
The computations of basic and diluted net income attributable to PepsiCo per common share are as
follows:
12 Weeks Ended
6/15/2024 6/17/2023
Income Shares
(a)
Income Shares
(a)
Basic net income attributable to PepsiCo per common share
$ 2.24 $ 1.99
Net income available for PepsiCo common shareholders
$ 3,083 1,375 $ 2,748 1,378
Dilutive securities:
Stock options, RSUs, PSUs and other
(b)
— 4 — 6
Diluted
$ 3,083 1,379 $ 2,748 1,384
Diluted net income attributable to PepsiCo per common share
$ 2.23 $ 1.99
24 Weeks Ended
6/15/2024 6/17/2023
Income Shares
(a)
Income Shares
(a)
Basic net income attributable to PepsiCo per common share
$ 3.73 $ 3.40
Net income available for PepsiCo common shareholders
$ 5,125 1,375 $ 4,680 1,378
Dilutive securities:
Stock options, RSUs, PSUs and other
(b)
— 5 — 6
Diluted
$ 5,125 1,380 $ 4,680 1,384
Diluted net income attributable to PepsiCo per common share
$ 3.71 $ 3.38
(a) Weighted-average common shares outstanding (in millions).
(b) The dilutive effect of these securities is calculated using the treasury stock method.
Table of Contents
21

The weighted-average amount of antidilutive securities excluded from the calculation of diluted earnings
per common share was 4 million for the 12 and 24 weeks ended June 15, 2024, and was immaterial for the
12 and 24 weeks ended June 17, 2023.
Note 11 - Accumulated Other Comprehensive Loss Attributable to PepsiCo
The changes in the balances of each component of accumulated other comprehensive loss attributable to
PepsiCo are as follows:
Currency
Translation
Adjustment
Cash Flow
Hedges
Pension
and Retiree
Medical
Available-for-
Sale Debt
Securities and
Other
(a)
Accumulated Other
Comprehensive
Loss Attributable
to PepsiCo
Balance as of December 30, 2023
(b)
$ (13,255) $ (31) $ (2,719) $ 471 $ (15,534)
Other comprehensive (loss)/income before
reclassifications
(c)
(168) (47) 4 685 474
Amounts reclassified from accumulated other
comprehensive loss — 51 9 — 60
Net other comprehensive (loss)/income (168) 4 13 685 534
Tax amounts (14) (1) (2) (162) (179)
Balance as of March 23, 2024
(b)
(13,437) (28) (2,708) 994 (15,179)
Other comprehensive (loss)/income before
reclassifications
(d)
(295) 3 (1) (511) (804)
Amounts reclassified from accumulated other
comprehensive loss
— 53 12 — 65
Net other comprehensive (loss)/income (295) 56 11 (511) (739)
Tax amounts 28 (14) (2) 120 132
Balance as of June 15, 2024
(b)
$ (13,704) $ 14 $ (2,699) $ 603 $ (15,786)
(a) The movements during the quarters primarily represent fair value changes in available-for-sale debt securities, including our investment
in Celsius convertible preferred stock. See Note 9 for further information.
(b) Pension and retiree medical amounts are net of taxes of $1,282 million as of December 30, 2023, $1,280 million as of March 23, 2024
and $1,278 million as of June 15, 2024.
(c) Currency translation adjustment primarily reflects depreciation of the South African rand, Canadian dollar and Russian ruble.
(d) Currency translation adjustment primarily reflects depreciation of the Egyptian pound.
Currency
Translation
Adjustment
Cash Flow
Hedges
Pension and
Retiree
Medical
Available-for-
Sale Debt
Securities and
Other
Accumulated Other
Comprehensive
Loss Attributable
to PepsiCo
Balance as of December 31, 2022
(a)
$ (12,948) $ 1 $ (2,361) $ 6 $ (15,302)
Other comprehensive (loss) before reclassifications
(b)
(350) (92) (9) (1) (452)
Amounts reclassified from accumulated other
comprehensive loss
(c)
108 13 5 — 126
Net other comprehensive (loss) (242) (79) (4) (1) (326)
Tax amounts 7 20 — — 27
Balance as of March 25, 2023
(a)
(13,183) (58) (2,365) 5 (15,601)
Other comprehensive (loss)/income before
reclassifications
(d)
(215) 19 (14) 1 (209)
Amounts reclassified from accumulated other
comprehensive loss — 12 5 — 17
Net other comprehensive (loss)/income (215) 31 (9) 1 (192)
Tax amounts 17 (7) 3 — 13
Balance as of June 17, 2023
(a)
$ (13,381) $ (34) $ (2,371) $ 6 $ (15,780)
(a) Pension and retiree medical amounts are net of taxes of $1,184 million as of both December 31, 2022 and March 25, 2023 and
$1,187 million as of June 17, 2023.
(b) Currency translation adjustment primarily reflects depreciation of the Egyptian pound and Russian ruble.
(c) Release of currency translation adjustment is in relation to the sale of a non-strategic brand and an investment within our AMESA
division.
(d) Currency translation adjustment primarily reflects depreciation of the Russian ruble.
Table of Contents
22
The reclassifications from accumulated other comprehensive loss to the income statement are summarized
as follows:
12 Weeks Ended 24 Weeks Ended
6/15/2024 6/17/2023 6/15/2024 6/17/2023
Affected Line Item in the
Income Statement
Currency translation:
Divestitures $ — $ — $ — $ 108
Selling, general and
administrative expenses
Cash flow hedges:
Foreign exchange contracts $ — $ (1) $ — $ (3) Net revenue
Foreign exchange contracts 9 15 18 18 Cost of sales
Interest rate derivatives 14 (30) 35 (27)
Selling, general and
administrative expenses
Commodity contracts 30 28 51 38 Cost of sales
Commodity contracts — — — (1)
Selling, general and
administrative expenses
Net losses before tax 53 12 104 25
Tax amounts (14) (3) (27) (7)
Net losses after tax $ 39 $ 9 $ 77 $ 18
Pension and retiree medical items:
Amortization of prior service
credits $ (7) $ (8) $ (14) $ (15)
Other pension and retiree medical
benefits income
Amortization of net losses 17 13 33 25
Other pension and retiree medical
benefits income
Settlement losses 2 — 2 —
Other pension and retiree medical
benefits income
Net losses before tax 12 5 21 10
Tax amounts (2) (1) (4) (2)
Net losses after tax $ 10 $ 4 $ 17 $ 8
Total net losses reclassified, net of tax $ 49 $ 13 $ 94 $ 134
Note 12 - Supply Chain Financing Arrangements
We maintain voluntary supply chain finance agreements with several participating global financial
institutions. Under these agreements, our suppliers, at their sole discretion, may elect to sell their accounts
receivable with PepsiCo to these participating global financial institutions. As of June 15, 2024 and
December 30, 2023, $1.6 billion and $1.7 billion, respectively, of our accounts payable are to suppliers
participating in these financing arrangements. For further information on the key terms of these supply
chain financing programs, see Note 14 to our consolidated financial statements in our 2023 Form 10-K.
Table of Contents
23

Item 2. Management’s Discussion and Analysis of Financial Condition and Results of Operations.
FINANCIAL REVIEW
Our discussion and analysis is intended to help the reader understand our results of operations and
financial condition and is provided as an addition to, and should be read in connection with, our
condensed consolidated financial statements and the accompanying notes. Unless otherwise noted,
tabular dollars are presented in millions, except per share amounts. All per share amounts reflect
common stock per share amounts, assume dilution unless otherwise noted, and are based on unrounded
amounts. Percentage changes are based on unrounded amounts.
Our Critical Accounting Policies and Estimates
The critical accounting policies and estimates below should be read in conjunction with those outlined in
our 2023 Form 10-K.
Total Marketplace Spending
We offer sales incentives and discounts through various programs to customers and consumers. Total
marketplace spending includes sales incentives, discounts, advertising and other marketing activities.
Sales incentives and discounts are primarily accounted for as a reduction of revenue. A number of our
sales incentives, such as bottler funding to independent bottlers and customer volume rebates, are based on
annual targets, and accruals are established during the year, as products are delivered, for the expected
payout, which may occur after year end once reconciled and settled.
These accruals are based on contract terms and our historical experience with similar programs and
require management judgment with respect to estimating customer and consumer participation and
performance levels. Differences between estimated expense and actual incentive costs are normally
insignificant and are recognized in earnings in the period such differences are determined. In addition,
certain advertising and marketing costs are also based on annual targets and recognized during the year as
incurred.
For interim reporting, our policy is to allocate our forecasted full-year sales incentives for most of our
programs to each of our interim reporting periods in the same year that benefits from the programs. The
allocation methodology is based on our forecasted sales incentives for the full year and the proportion of
each interim period’s actual gross revenue or volume, as applicable, to our forecasted annual gross
revenue or volume, as applicable. Based on our review of the forecasts at each interim period, any changes
in estimates and the related allocation of sales incentives are recognized beginning in the interim period
that they are identified. In addition, we apply a similar allocation methodology for interim reporting
purposes for certain advertising and other marketing activities.
Income Taxes
In determining our quarterly provision for income taxes, we use an estimated annual effective tax rate
which is based on our expected annual income, statutory tax rates and tax structure and transactions,
including transfer pricing arrangements, available to us in the various jurisdictions in which we operate.
Significant judgment is required in determining our annual tax rate and in evaluating our tax positions.
Subsequent recognition, derecognition and measurement of a tax position taken in a previous period are
separately recognized in the quarter in which they occur.
Our Business Risks
This Form 10-Q contains statements reflecting our views about our future performance that constitute
“forward-looking statements” within the meaning of the Private Securities Litigation Reform Act of 1995
(Reform Act). Statements that constitute forward-looking statements within the meaning of the Reform Act
Table of Contents
24

are generally identified through the inclusion of words such as “aim,” “anticipate,” “believe,” “drive,”
“estimate,” “expect,” “expressed confidence,” “forecast,” “future,” “goal,” “guidance,” “intend,”
“may,” “objective,” “outlook,” “plan,” “position,” “potential,” “project,” “seek,” “should,”
“strategy,” “target,” “will” or similar statements or variations of such words and other similar
expressions. All statements addressing our future operating performance, and statements addressing
events and developments that we expect or anticipate will occur in the future, are forward-looking
statements within the meaning of the Reform Act. These forward-looking statements are based on
currently available information, operating plans and projections about future events and trends. They
inherently involve risks and uncertainties that could cause actual results to differ materially from those
predicted in any such forward-looking statement. Such risks and uncertainties include, but are not limited
to: the risks associated with the deadly conflict in Ukraine; future demand for PepsiCo’s products;
damage to PepsiCo’s reputation or brand image; product recalls or other issues or concerns with respect
to product quality and safety; PepsiCo’s ability to compete effectively; PepsiCo’s ability to attract,
develop and maintain a highly skilled and diverse workforce or effectively manage changes in our
workforce; water scarcity; changes in the retail landscape or in sales to any key customer; disruption of
PepsiCo’s manufacturing operations or supply chain, including continued increased commodity,
packaging, transportation, labor and other input costs; political, social or geopolitical conditions in the
markets where PepsiCo’s products are made, manufactured, distributed or sold; PepsiCo’s ability to grow
its business in developing and emerging markets; changes in economic conditions in the countries in
which PepsiCo operates; future cyber incidents and other disruptions to our information systems; failure
to successfully complete or manage strategic transactions; PepsiCo’s reliance on third-party service
providers and enterprise-wide systems; climate change or measures to address climate change and other
sustainability matters; strikes or work stoppages; failure to realize benefits from PepsiCo’s productivity
initiatives; deterioration in estimates and underlying assumptions regarding future performance of our
business or investments that can result in impairment charges; fluctuations or other changes in exchange
rates; any downgrade or potential downgrade of PepsiCo’s credit ratings; imposition or proposed
imposition of new or increased taxes aimed at PepsiCo’s products; imposition of limitations on the
marketing or sale of PepsiCo’s products; changes in laws and regulations related to the use or disposal of
plastics or other packaging materials; failure to comply with personal data protection and privacy laws;
increase in income tax rates, changes in income tax laws or disagreements with tax authorities; failure to
adequately protect PepsiCo’s intellectual property rights or infringement on intellectual property rights of
others; failure to comply with applicable laws and regulations; potential liabilities and costs from
litigation, claims, legal or regulatory proceedings, inquiries or investigations; and other risks and
uncertainties including those described in “Item 1A. Risk Factors” and “Item 7. Management’s
Discussion and Analysis of Financial Condition and Results of Operations – Our Business Risks,”
included in our 2023 Form 10-K and in “Item 2. Management’s Discussion and Analysis of Financial
Condition and Results of Operations – Our Business Risks” of this Form 10-Q. Investors are cautioned
not to place undue reliance on any such forward-looking statements, which speak only as of the date they
are made. We undertake no obligation to update any forward-looking statement, whether as a result of
new information, future events or otherwise.
Risks Associated with Commodities and Our Supply Chain
During the 12 and 24 weeks ended June 15, 2024, we continued to experience higher operating costs,
including on transportation and labor costs, which may continue for the remainder of 2024. Many of the
commodities used in the production and transportation of our products are purchased in the open market.
The prices we pay for such items are subject to fluctuation, and we manage this risk through the use of
fixed-price contracts and purchase orders, pricing agreements and derivative instruments, including swaps
and futures. A number of external factors, including the ongoing conflict in Ukraine, the inflationary cost
environment, adverse weather conditions, supply chain disruptions and labor shortages, have impacted and
Table of Contents
25

may continue to impact transportation and labor costs. When prices increase, we may or may not pass on
such increases to our customers, which may result in reduced volume, revenue, margins and operating
results.
See Note 9 to our condensed consolidated financial statements in this Form 10-Q and Note 9 to our
consolidated financial statements in our 2023 Form 10-K for further information on how we manage our
exposure to commodity prices.
Risks Associated with Climate Change
Certain jurisdictions in which our products are made, manufactured, distributed or sold have either
imposed, or are considering imposing, new or increased legal and regulatory requirements to reduce or
mitigate the potential effects of climate change, including regulation of greenhouse gas emissions and
potential carbon pricing programs. These new or increased legal or regulatory requirements, along with
initiatives to meet our sustainability goals, could result in significant increased costs and additional
investments in facilities and equipment. However, we are unable to predict the scope, nature and timing of
any new or increased environmental laws and regulations and therefore cannot predict the ultimate impact
of such laws and regulations on our business or financial results. We continue to monitor existing and
proposed laws and regulations in the jurisdictions in which our products are made, manufactured,
distributed and sold and to consider actions we may take to potentially mitigate the unfavorable impact, if
any, of such laws or regulations.
Risks Associated with International Operations
In the 12 weeks ended June 15, 2024, our financial results outside of North America reflect the months of
March, April and May. In the 24 weeks ended June 15, 2024, our financial results outside of North
America reflect the months of January through May. In the 24 weeks ended June 15, 2024, our operations
outside of the United States generated 42% of our consolidated net revenue, with Mexico, Canada, Russia,
China, the United Kingdom, Brazil and South Africa comprising approximately 24% of our consolidated
net revenue. As a result, we are exposed to foreign exchange risk in the international markets in which our
products are made, manufactured, distributed or sold. In the 12 and 24 weeks ended June 15, 2024,
unfavorable foreign exchange reduced net revenue growth by 1 percentage point primarily due to declines
in the Russian ruble and Egyptian pound, partially offset by an appreciation of the Mexican peso.
Currency declines against the U.S. dollar which are not offset could adversely impact our future financial
results.
In addition, volatile economic, political, social and geopolitical conditions, civil unrest and wars and other
military conflicts, acts of terrorism and natural disasters and other catastrophic events in certain markets in
which our products are made, manufactured, distributed or sold, including in Argentina, Brazil, China,
Mexico, the Middle East, Pakistan, Russia, Turkey and Ukraine, continue to result in challenging
operating environments and have resulted in and could continue to result in changes in how we operate in
certain of these markets. Debt and credit issues, currency controls or fluctuations in certain of these
international markets (including restrictions on the transfer of funds to and from certain markets), as well
as the threat or imposition of new or expanded tariffs, sanctions or export controls have also continued to
impact our operations in certain of these international markets. We continue to closely monitor the
economic, operating and political environment in the markets in which we operate, including risks of
additional impairments or write-offs and currency devaluation, and to identify actions to potentially
mitigate any unfavorable impacts on our future results. Our operations in Russia accounted for 4% of our
consolidated net revenue for both the 12 and 24 weeks ended June 15, 2024. Russia accounted for 4% of
our consolidated assets, including 11% of our consolidated cash and cash equivalents, and 34% of our
accumulated currency translation adjustment loss as of June 15, 2024.
Table of Contents
26

See Note 9 to our condensed consolidated financial statements in this Form 10-Q for the fair values of our
financial instruments as of June 15, 2024 and December 30, 2023 and Note 9 to our consolidated financial
statements in our 2023 Form 10-K for a discussion of these items.
Imposition of Taxes and Regulations on our Products
Certain jurisdictions in which our products are made, manufactured, distributed or sold have either
imposed, or are considering imposing, new or increased taxes or regulations on the manufacture,
distribution or sale of our products or their packaging, ingredients or substances contained in, or attributes
of, our products or their packaging, commodities used in the production of our products or their packaging
or the recyclability or recoverability of our packaging. These taxes and regulations vary in scope and form.
For example, some taxes apply to all beverages, including non-caloric beverages, while others apply only
to beverages with a caloric sweetener (e.g., sugar). Further, some regulations apply to all products using
certain types of packaging (e.g., plastic), while others are designed to increase the sustainability of
packaging, encourage waste reduction and increased recycling rates or facilitate the waste management
process or restrict the sale of products in certain packaging.
We sell a wide variety of beverages and convenient foods in more than 200 countries and territories and
the profile of the products we sell, the amount of revenue attributable to such products and the type of
packaging used vary by jurisdiction. Because of this, we cannot predict the scope or form potential taxes,
regulations or other limitations on our products or their packaging may take, and therefore cannot predict
the impact of such taxes, regulations or limitations on our financial results. In addition, taxes, regulations
and limitations may impact us and our competitors differently. We continue to monitor existing and
proposed taxes and regulations in the jurisdictions in which our products are made, manufactured,
distributed and sold and to consider actions we may take to potentially mitigate the unfavorable impact, if
any, of such taxes, regulations or limitations, including advocating alternative measures with respect to the
imposition, form and scope of any such taxes, regulations or limitations.
OECD Global Minimum Tax
Numerous countries have agreed to a statement in support of the OECD model rules that propose a global
minimum tax rate of 15%. Certain countries have enacted legislation incorporating the agreed global
minimum tax effective in 2024. Legislation enacted as of June 15, 2024 is not expected to have a material
impact on our 2024 financial statements. More countries are expected to enact similar legislation, with
widespread implementation of a global minimum tax by 2025. As legislation becomes effective in more
countries in which we do business, our taxes could increase and negatively impact our provision for
income taxes. We will continue to monitor pending legislation and implementation by countries and
evaluate the potential impact on our business in future periods.
Retail Landscape
Our industry continues to be affected by disruption of the retail landscape, including the continued growth
in sales through e-commerce websites and mobile commerce applications, including through subscription
services, the integration of physical and digital operations among retailers and the international expansion
of hard discounters. We have seen and expect to continue to see a further shift to e-commerce, online-to-
offline and other online purchasing by consumers. We continue to monitor changes in the retail landscape
and seek to identify actions we may take to build our global e-commerce and digital capabilities, such as
expanding our direct-to-consumer business, and distribute our products effectively through all existing and
emerging channels of trade and potentially mitigate any unfavorable impacts on our future results.
The retail industry also continues to be impacted by the actions and increasing power of retailers,
including as a result consolidation of ownership resulting in large retailers or buying groups with
increased purchasing power, particularly in North America, Europe and Latin America. We have seen and
Table of Contents
27

expect to continue to see retailers and buying groups impact our ability to compete in these jurisdictions.
We continue to monitor our relationships with retailers and buying groups and seek to identify actions we
may take to maintain mutually beneficial relationships and resolve any significant disputes and potentially
mitigate any unfavorable impacts on our future results.
Cautionary statements included above and in “Item 1A. Risk Factors” and “Item 7. Management’s
Discussion and Analysis of Financial Condition and Results of Operations – Our Business Risks” in our
2023 Form 10-K should be considered when evaluating our trends and future results.
Results of Operations – Consolidated Review
Consolidated Results
Volume
Physical or unit volume is one of the key metrics management uses internally to make operating and
strategic decisions, including the preparation of our annual operating plan and the evaluation of our
business performance. We believe volume provides additional information to facilitate the comparison of
our historical operating performance and underlying trends and provides additional transparency on how
we evaluate our business because it measures demand for our products at the consumer level. See “Item 7.
Management’s Discussion and Analysis of Financial Condition and Results of Operations – Our Financial
Results – Volume” included in our 2023 Form 10-K for further information on volume. Unit volume
growth adjusts for the impacts of acquisitions and divestitures. Acquisitions and divestitures, when used in
this report, reflect mergers and acquisitions activity, as well as divestitures and other structural changes,
including changes in ownership or control in consolidated subsidiaries and nonconsolidated equity
investees. Further, unit volume growth excludes the impact of an additional week of results every five or
six years (53
rd
reporting week), where applicable.
We report all of our international operations on a monthly calendar basis. The 12 weeks ended June 15,
2024 and June 17, 2023 include volume outside of North America for the months of March, April and
May. The 24 weeks ended June 15, 2024 and June 17, 2023 include volume outside of North America for
the months of January through May.
Consolidated Net Revenue and Operating Profit
12 Weeks Ended 24 Weeks Ended
6/15/2024 6/17/2023 Change 6/15/2024 6/17/2023 Change
Net revenue
$ 22,501 $ 22,322 1 % $ 40,751 $ 40,168 1.5 %
Operating profit
$ 4,048 $ 3,659 11 % $ 6,765 $ 6,288 8 %
Operating margin
18.0 % 16.4 % 1.6 16.6 % 15.7 % 0.9
See “Results of Operations – Division Review” for a tabular presentation and discussion of key drivers of
net revenue.
12 Weeks
Operating profit increased 11% and operating margin increased 1.6 percentage points. Operating profit
growth was primarily driven by effective net pricing, productivity savings and a 3-percentage-point impact
of prior-year impairment charges related to our TBG investment. These impacts were partially offset by
certain operating cost increases and a decline in organic volume.
Table of Contents
28

24 Weeks
Operating profit increased 8% and operating margin increased 0.9 percentage points. Operating profit
growth was primarily driven by effective net pricing and productivity savings. These impacts were
partially offset by certain operating cost increases and a decline in organic volume.
Other Consolidated Results
12 Weeks Ended 24 Weeks Ended
6/15/2024 6/17/2023 Change 6/15/2024 6/17/2023 Change
Other pension and retiree medical benefits
income
$ 56 $ 60 $ (4) $ 114 $ 121 $ (7)
Net interest expense and other
$ 234 $ 201 $ 33 $ 436 $ 401 $ 35
Tax rate
20.1 % 21.3 % 20.1 % 21.5 %
Net income attributable to PepsiCo
$ 3,083 $ 2,748 12 % $ 5,125 $ 4,680 10 %
Net income attributable to PepsiCo per
common share – diluted
$ 2.23 $ 1.99 13 % $ 3.71 $ 3.38 10 %
12 Weeks
Other pension and retiree medical benefits income decreased $4 million, primarily reflecting the
recognition of special termination benefits due to restructuring actions as part of our 2019 Productivity
Plan, partially offset by the recognition of gains on plan assets and impact of discretionary plan
contributions.
Net interest expense and other increased $33 million, due to higher interest rates on debt, higher average
debt balances and lower gains on the market value of investments used to economically hedge a portion of
our deferred compensation liability, partially offset by higher average cash balances and higher interest
rates on average cash balances.
The reported tax rate decreased 1.2 percentage points, primarily as a result of the release of a valuation
allowance in a foreign jurisdiction in the current year, partially offset by the unfavorable impact of
reserves for international unrecognized tax benefits.
24 Weeks
Other pension and retiree medical benefits income decreased $7 million, primarily reflecting the
recognition of special termination benefits due to restructuring actions as part of our 2019 Productivity
Plan, partially offset by the recognition of gains on plan assets and impact of discretionary plan
contributions.
Net interest expense and other increased $35 million, due to higher interest rates on debt, higher average
debt balances and lower gains on the market value of investments used to economically hedge a portion of
our deferred compensation liability, partially offset by higher average cash balances and higher interest
rates on average cash balances.
The reported tax rate decreased 1.4 percentage points, primarily reflecting the release of a valuation
allowance in a foreign jurisdiction in the current year.
Results of Operations – Division Review
While our financial results in North America are reported on a 12-week basis, all of our international
operations are reported on a monthly calendar basis for which the months of March, April and May are
reflected in our results for the 12 weeks ended June 15, 2024 and June 17, 2023, and the months January
through May are reflected in our results for the 24 weeks ended June 15, 2024 and June 17, 2023.
Table of Contents
29

In the discussions of net revenue and operating profit below, “effective net pricing” reflects the year-over-
year impact of discrete pricing actions, sales incentive activities and mix resulting from selling varying
products in different package sizes and in different countries.
See “Our Business Risks,” “Non-GAAP Measures” and “Items Affecting Comparability” for a discussion
of items to consider when evaluating our results and related information regarding measures not in
accordance with GAAP.
Net Revenue and Organic Revenue Growth
Organic revenue growth is a non-GAAP financial measure. For further information on this measure, see
“Non-GAAP Measures.”
12 Weeks Ended 6/15/2024
Impact of Impact of
Reported
% Change,
GAAP
Measure
Foreign
exchange
translation
Acquisitions
and
divestitures
Organic
% Change,
Non-GAAP
Measure
(a)
Organic
volume
(b)
Effective
net
pricing
FLNA (0.5) % — — — % (4) 3
QFNA
(c)
(18) % — — (18) % (17) (1)
PBNA 1 % — — 1 % (3.5) 5
LatAm 7 % (5) — 2 % (5) 6
Europe 2.5 % 5 — 7 % 2 5
AMESA 2 % 11 (1) 12 % 1 11
APAC (2) % 3 — 1 % — 1.5
Total 1 % 1 — 2 % (3) 5
24 Weeks Ended 6/15/2024
Impact of Impact of
Reported
% Change,
GAAP
Measure
Foreign
exchange
translation
Acquisitions
and
divestitures
Organic
% Change,
Non-GAAP
Measure
(a)
Organic
volume
(b)
Effective
net
pricing
FLNA 0.5 % — — 1 % (3) 3
QFNA
(c)
(21) % — — (21) % (20) (1)
PBNA 1 % — — 1 % (4) 5
LatAm 10 % (6) — 4 % (3) 7
Europe 3 % 5.5 — 8 % 2 6
AMESA 2 % 8 — 10 % 2 7
APAC 2 % 4 — 6 % 5 0.5
Total 1.5 % 1 — 2 % (2) 5
(a) Amounts may not sum due to rounding.
(b) Excludes the impact of acquisitions and divestitures. In certain instances, the impact of organic volume on net revenue growth differs
from the unit volume change disclosed in the following divisional discussions due to the impacts of product mix, nonconsolidated joint
venture volume, and, for our franchise-owned beverage businesses, temporary timing differences between bottler case sales and
concentrate shipments and equivalents (CSE). We report net revenue from our franchise-owned beverage businesses based on CSE. The
volume sold by our nonconsolidated joint ventures has no direct impact on our net revenue.
(c) Net revenue decline was impacted by the Quaker Recall.
Table of Contents
30

Operating Profit, Operating Profit Adjusted for Items Affecting Comparability and Operating Profit
Performance Adjusted for Items Affecting Comparability on a Constant Currency Basis
Operating profit adjusted for items affecting comparability and operating profit performance adjusted for
items affecting comparability on a constant currency basis are both non-GAAP financial measures. For
further information on these measures, see “Non-GAAP Measures” and “Items Affecting Comparability.”
Operating Profit and Operating Profit Adjusted for Items Affecting Comparability
12 Weeks Ended 6/15/2024
Items Affecting Comparability
(a)
Reported, GAAP
Measure
Mark-to-market
net impact
Restructuring and
impairment
charges
Product recall-
related impact
Core, Non-GAAP
Measure
FLNA
$ 1,592 $ — $ 13 $ — $ 1,605
QFNA
85 — — 15 100
PBNA
987 — 5 — 992
LatAm
637 — 16 — 653
Europe
620 — 19 — 639
AMESA
241 — 3 — 244
APAC
223 — 4 — 227
Corporate unallocated expenses
(337) (8) 6 — (339)
Total
$ 4,048 $ (8) $ 66 $ 15 $ 4,121
12 Weeks Ended 6/17/2023
Items Affecting Comparability
(a)
Reported,
GAAP
Measure
Mark-to-market
net impact
Restructuring
and impairment
charges
Acquisition and
divestiture-related
charges
(b)
Impairment and other
charges/credits
(b)
Core, Non-
GAAP
Measure
FLNA
$ 1,647 $ — $ 6 $ — $ — $ 1,653
QFNA
129 — — — — 129
PBNA
723 — 5 8 113 849
LatAm
592 — 6 — 2 600
Europe
476 — 52 (2) (5) 521
AMESA
250 — — 1 — 251
APAC
223 — 4 — — 227
Corporate unallocated expenses
(381) (9) 19 — — (371)
Total
$ 3,659 $ (9) $ 92 $ 7 $ 110 $ 3,859
24 Weeks Ended 6/15/2024
Items Affecting Comparability
(a)
Reported,
GAAP
Measure
Mark-to-
market net
impact
Restructuring
and impairment
charges
Acquisition and
divestiture-related
charges
Product recall-
related impact
Core,
Non-GAAP
Measure
FLNA
$ 3,146 $ — $ 35 $ — $ — $ 3,181
QFNA
36 — 4 — 182 222
PBNA
1,497 — 15 2 — 1,514
LatAm
1,122 — 21 — — 1,143
Europe
822 — 37 — — 859
AMESA
393 — 3 — — 396
APAC
456 — 4 — — 460
Corporate unallocated expenses
(707) (44) 36 — — (715)
Total
$ 6,765 $ (44) $ 155 $ 2 $ 182 $ 7,060
Table of Contents
31

24 Weeks Ended 6/17/2023
Items Affecting Comparability
(a)
Reported,
GAAP
Measure
Mark-to-market
net impact
Restructuring
and impairment
charges
Acquisition and
divestiture-related
charges
(b)
Impairment and other
charges/credits
(b)
Core,
Non-GAAP
Measure
FLNA
$ 3,246 $ — $ 13 $ — $ — $ 3,259
QFNA
317 — — — — 317
PBNA
1,206 — 10 10 113 1,339
LatAm
956 — 11 — 2 969
Europe
547 — 141 (2) (5) 681
AMESA
418 — 5 1 (13) 411
APAC
450 — 5 — — 455
Corporate unallocated expenses
(852) 62 20 — — (770)
Total
$ 6,288 $ 62 $ 205 $ 9 $ 97 $ 6,661
(a) See “Items Affecting Comparability” for further information.
(b) Income amounts represent adjustments for changes in estimates of previously recorded amounts.
Operating Profit Performance and Operating Profit Performance Adjusted for Items Affecting
Comparability on a Constant Currency Basis
12 Weeks Ended 6/15/2024
Impact of Items Affecting Comparability
(a)
Impact of
Reported
%
Change,
GAAP
Measure
Mark-to-
market
net
impact
Restructuring
and
impairment
charges
Acquisition
and
divestiture-
related
charges
Impairment
and other
charges/
credits
Product
recall-
related
impact
Core
% Change,
Non-
GAAP
Measure
(b)
Foreign
exchange
translation
Core
Constant
Currency
% Change,
Non-GAAP
Measure
(b)
FLNA
(3) % — — — — — (3) % — (3) %
QFNA
(34) % — (1) — — 12 (23) % — (23) %
PBNA
37 % — — (1) (18) — 17 % — 17 %
LatAm
8 % — 1 — — — 9 % (7) 2 %
Europe
30 % — (9) — 1.5 — 23 % 6 29 %
AMESA
(4) % — 1 — — — (3) % 6 3 %
APAC
— % — 1 — — — — % 4 4 %
Corporate unallocated
expenses
(11) % — 3 — — — (9) % — (9) %
Total 11 % — (1) — (3) 0.5 7 % 0.5 7 %
24 Weeks Ended 6/15/2024
Impact of Items Affecting Comparability
(a)
Impact of
Reported
%
Change,
GAAP
Measure
Mark-to-
market
net
impact
Restructuring
and
impairment
charges
Acquisition
and
divestiture-
related
charges
Impairment
and other
charges/
credits
Product
recall-
related
impact
Core
% Change,
Non-
GAAP
Measure
(b)
Foreign
exchange
translation
Core
Constant
Currency
% Change,
Non-GAAP
Measure
(b)
FLNA
(3) % — 1 — — — (2) % — (2) %
QFNA
(89) % — 1 — — 58 (30) % — (30) %
PBNA
24 % — 0.5 (1) (11) — 13 % — 13 %
LatAm
17 % — 1 — — — 18 % (8) 10 %
Europe
50 % — (26) — 1 — 26 % 8 34 %
AMESA
(6) % — (0.5) — 3 — (4) % 5 1 %
APAC
1 % — — — — — 1 % 4 6 %
Corporate unallocated
expenses
(17) % 12 (2) — — — (7) % — (7) %
Total 8 % (2) (1) — (2) 4 6 % — 6 %
(a) See “Items Affecting Comparability” for further information.
(b) Amounts may not sum due to rounding.
Table of Contents
32

FLNA
12 Weeks
Net revenue decreased 0.5%, primarily driven by a decrease in organic volume, partially offset by
effective net pricing.
Unit volume declined 4%, primarily driven by mid-single-digit declines in trademark Cheetos, trademark
Doritos and trademark Lay’s, partially offset by double-digit growth in trademark Chester’s.
Operating profit decreased 3%, primarily reflecting certain operating cost increases, including strategic
initiatives, and the decrease in organic volume. These impacts were partially offset by the effective net
pricing, productivity savings, and a 2-percentage-point favorable impact of lower commodity costs,
primarily driven by cooking oil.
24 Weeks
Net revenue increased 0.5%, primarily driven by effective net pricing, partially offset by a decrease in
organic volume.
Unit volume declined 3%, primarily driven by mid-single-digit declines in trademark Lay’s, trademark
Cheetos and trademark Tostitos, partially offset by double-digit growth in trademark Chester’s.
Operating profit decreased 3%, primarily reflecting certain operating cost increases, including strategic
initiatives, and the decrease in organic volume. These impacts were partially offset by the effective net
pricing and productivity savings.
QFNA
12 Weeks
Net revenue decreased 18%, primarily driven by a decrease in organic volume, which was negatively
impacted by the loss of sales from products included in the Quaker Recall.
Unit volume declined 17%, primarily driven by double-digit declines in bars, pancake syrup and mix,
oatmeal and ready-to-eat cereals. The unit volume decline in bars and ready-to-eat cereals was negatively
impacted by the loss of sales from products included in the Quaker Recall.
Operating profit decreased 34%, primarily reflecting the net revenue performance, certain operating cost
increases, a 12-percentage-point impact of charges associated with the Quaker Recall and a 6-percentage-
point unfavorable impact of commodity costs, partially offset by productivity savings and lower
advertising and marketing expenses.
24 Weeks
Net revenue decreased 21%, primarily driven by a decrease in organic volume, which was negatively
impacted by the loss of sales from products included in the Quaker Recall.
Unit volume declined 20%, primarily driven by double-digit declines in bars, ready-to-eat cereals, pancake
syrup and mix and oatmeal. The unit volume decline in bars and ready-to-eat cereals was negatively
impacted by the loss of sales from products included in the Quaker Recall.
Operating profit decreased 89%, reflecting a 58-percentage-point impact of charges associated with the
Quaker Recall, the net revenue performance, certain operating cost increases and a 4-percentage-point
unfavorable impact of commodity costs, partially offset by productivity savings and lower advertising and
marketing expenses.
Table of Contents
33

PBNA
12 Weeks
Net revenue increased 1%, primarily driven by effective net pricing, partially offset by a decrease in
organic volume.
Unit volume declined 3%, driven by a 5% decline in non-carbonated beverage (NCB) volume and a 2%
decline in carbonated soft drink (CSD) volume. The NCB volume decline primarily reflected mid-single-
digit declines in our overall water portfolio and our juice and juice drinks portfolio, a low-single-digit
decline in Gatorade sports drinks and a high-single-digit decline in our Lipton ready-to-drink tea portfolio,
partially offset by double-digit growth in our energy portfolio.
Operating profit increased 37%, primarily driven by productivity savings, the effective net pricing and an
18-percentage-point impact of prior-year impairment charges related to our TBG investment. These
impacts were partially offset by certain operating cost increases and the decrease in organic volume.
24 Weeks
Net revenue increased 1%, primarily driven by effective net pricing, partially offset by a decrease in
organic volume.
Unit volume declined 4%, driven by a 6% decline in NCB volume and a 2% decline in CSD volume. The
NCB volume decline primarily reflected mid-single-digit declines in Gatorade sports drinks and our
overall water portfolio and a high-single-digit decline in our Lipton ready-to-drink tea portfolio, partially
offset by double-digit growth in our energy portfolio.
Operating profit increased 24%, primarily driven by the effective net pricing and productivity savings.
Additionally, impairment charges related to our TBG investment and net unfavorable insurance
adjustments in the prior year contributed 11 percentage points and 4 percentage points, respectively, to
operating profit growth. These impacts were partially offset by certain operating cost increases, the
decrease in organic volume and a 4-percentage-point impact of higher commodity costs.
LatAm
12 Weeks
Net revenue increased 7%, primarily reflecting effective net pricing and a 5-percentage-point impact of
favorable foreign exchange, partially offset by a net decline in organic volume.
Convenient foods unit volume declined 6%, primarily reflecting double-digit declines in Peru and
Argentina, partially offset by low-single-digit growth in Brazil. Additionally, Mexico experienced a mid-
single-digit decline.
Beverage unit volume grew 2%, primarily reflecting mid-single-digit growth in Mexico and Brazil and
high-single-digit growth in Guatemala, partially offset by double-digit declines in Colombia, Argentina
and Peru and a mid-single-digit decline in Chile.
Operating profit increased 8%, primarily reflecting the effective net pricing, productivity savings and a 7-
percentage-point impact of favorable foreign exchange. These impacts were partially offset by certain
operating cost increases, the net decline in organic volume and higher advertising and marketing expenses.
24 Weeks
Net revenue increased 10%, primarily reflecting effective net pricing and a 6-percentage-point impact of
favorable foreign exchange, partially offset by a net decline in organic volume.
Table of Contents
34

Convenient foods unit volume declined 4%, primarily reflecting double-digit declines in Peru and
Argentina, partially offset by low-single-digit growth in Brazil. Additionally, Mexico experienced a low-
single-digit decline.
Beverage unit volume grew 2%, primarily reflecting mid-single-digit growth in Mexico and Brazil and
high-single-digit growth in Guatemala, partially offset by a double-digit decline in Colombia, a high-
single-digit decline in Argentina, a mid-single-digit decline in Peru and a low-single-digit decline in Chile.
Operating profit increased 17%, primarily reflecting the effective net pricing, productivity savings, an 8-
percentage-point impact of favorable foreign exchange and a 3-percentage-point favorable impact of lower
commodity costs. These impacts were partially offset by certain operating cost increases, the net decline in
organic volume and higher advertising and marketing expenses.
Europe
12 Weeks
Net revenue increased 2.5%, primarily reflecting effective net pricing and organic volume growth,
partially offset by a 5-percentage-point impact of unfavorable foreign exchange.
Convenient foods unit volume grew 5%, primarily reflecting double-digit growth in Russia and high-
single-digit growth in Turkey, partially offset by a low-single-digit decline in the Netherlands.
Additionally, the United Kingdom experienced low-single-digit growth and France experienced mid-
single-digit growth.
Beverage unit volume grew 1%, primarily reflecting mid-single-digit growth in Russia and low-single-
digit growth in the United Kingdom, partially offset by mid-single-digit declines in Germany and France
and a low-single-digit decline in Turkey.
Operating profit increased 30%, primarily reflecting the net revenue growth, productivity savings and a 9-
percentage-point favorable impact of lower restructuring charges. These impacts were partially offset by
certain operating cost increases, a 6-percentage-point impact of unfavorable foreign exchange and a 6-
percentage-point impact of higher commodity costs.
24 Weeks
Net revenue increased 3%, primarily reflecting effective net pricing and organic volume growth, partially
offset by a 5.5-percentage-point impact of unfavorable foreign exchange.
Convenient foods unit volume grew 4%, primarily reflecting double-digit growth in Russia and high-
single-digit growth in Turkey, partially offset by a high-single-digit decline in France and a low-single-
digit decline in the Netherlands. Additionally, the United Kingdom experienced low-single-digit growth.
Beverage unit volume grew 3%, primarily reflecting double-digit growth in Russia and mid-single-digit
growth in Turkey and the United Kingdom, partially offset by a double-digit decline in France and a slight
decline in Germany.
Operating profit increased 50%, primarily reflecting the net revenue growth, a 26-percentage-point
favorable impact of lower restructuring charges and productivity savings. These impacts were partially
offset by certain operating cost increases, a 9-percentage-point impact of higher commodity costs and an
8-percentage-point impact of unfavorable foreign exchange.
Table of Contents
35

AMESA
12 Weeks
Net revenue increased 2%, primarily reflecting effective net pricing and organic volume growth, partially
offset by an 11-percentage-point impact of unfavorable foreign exchange, driven primarily by the
weakening of the Egyptian pound.
Convenient foods unit volume grew 1%, primarily reflecting double-digit growth in India and low-single-
digit growth in South Africa, partially offset by a double-digit decline in the Middle East and a low-single-
digit decline in Pakistan.
Beverage unit volume grew 2%, primarily reflecting double-digit growth in India, partially offset by a
high-single-digit decline in Pakistan, a low-single-digit decline in the Middle East and a mid-single-digit
decline in Nigeria.
Operating profit decreased 4%, primarily reflecting certain operating cost increases, a 28-percentage-point
impact of higher commodity costs, primarily packaging materials, potatoes and sweeteners, largely driven
by transaction-related foreign exchange, and a 6-percentage-point impact of unfavorable foreign exchange
translation. These impacts were partially offset by the net revenue growth and productivity savings.
24 Weeks
Net revenue increased 2%, primarily reflecting effective net pricing and organic volume growth, partially
offset by an 8-percentage-point impact of unfavorable foreign exchange.
Convenient foods unit volume grew 2%, primarily reflecting double-digit growth in India and low-single-
digit growth in South Africa, partially offset by a double-digit decline in the Middle East. Additionally,
Pakistan experienced slight growth.
Beverage unit volume grew 2%, primarily reflecting double-digit growth in India, partially offset by a
double-digit decline in Pakistan and a low-single-digit decline in Nigeria. Additionally, the Middle East
experienced low-single-digit growth.
Operating profit decreased 6%, primarily reflecting certain operating cost increases, a 24-percentage-point
impact of higher commodity costs, primarily packaging materials, potatoes and sweeteners, largely driven
by transaction-related foreign exchange, and a 5-percentage-point impact of unfavorable foreign exchange
translation. These impacts were partially offset by the net revenue growth and productivity savings.
APAC
12 Weeks
Net revenue decreased 2%, primarily reflecting a 3-percentage-point impact of unfavorable foreign
exchange, partially offset by effective net pricing.
Convenient foods unit volume declined 1%, primarily reflecting a mid-single-digit decline in China,
partially offset by mid-single-digit growth in Australia and Thailand.
Beverage unit volume grew 1%, primarily reflecting mid-single-digit growth in Vietnam and the
Philippines and high-single-digit growth in Thailand, partially offset by a low-single-digit decline in
China.
Operating profit decreased slightly, primarily reflecting certain operating cost increases, partially offset by
productivity savings.
Table of Contents
36

24 Weeks
Net revenue increased 2%, primarily reflecting organic volume growth and effective net pricing, partially
offset by a 4-percentage-point impact of unfavorable foreign exchange.
Convenient foods unit volume grew 6%, primarily reflecting high-single-digit growth in China and mid-
single-digit growth in Australia. Additionally, Thailand experienced mid-single-digit growth.
Beverage unit volume grew slightly, primarily reflecting high-single-digit growth in Vietnam, double-digit
growth in Thailand and mid-single-digit growth in the Philippines, partially offset by a low-single-digit
decline in China.
Operating profit increased 1%, primarily reflecting the net revenue growth, productivity savings and a 3-
percentage-point favorable impact of lower commodity costs. These impacts were partially offset by
certain operating cost increases, higher advertising and marketing expenses and a 4-percentage-point
impact of unfavorable foreign exchange.
Non-GAAP Measures
Certain financial measures contained in this Form 10-Q adjust for the impact of specified items and are
not in accordance with GAAP. We use non-GAAP financial measures internally to make operating and
strategic decisions, including the preparation of our annual operating plan, evaluation of our overall
business performance and as a factor in determining compensation for certain employees. We believe
presenting non-GAAP financial measures in this Form 10-Q provides additional information to facilitate
comparison of our historical operating results and trends in our underlying operating results and provides
additional transparency on how we evaluate our business. We also believe presenting these measures in
this Form 10-Q allows investors to view our performance using the same measures that we use in
evaluating our financial and business performance and trends.
We consider quantitative and qualitative factors in assessing whether to adjust for the impact of items that
may be significant or that could affect an understanding of our ongoing financial and business
performance or trends. Examples of items for which we may make adjustments include: amounts related
to mark-to-market gains or losses (non-cash); charges related to restructuring plans; charges associated
with acquisitions and divestitures; gains associated with divestitures; asset impairment charges (non-cash);
product recall-related impact; pension and retiree medical-related amounts, including all settlement and
curtailment gains and losses; charges or adjustments related to the enactment of new laws, rules or
regulations, such as tax law changes; amounts related to the resolution of tax positions; tax benefits related
to reorganizations of our operations; debt redemptions, cash tender or exchange offers; and
remeasurements of net monetary assets. See below and “Items Affecting Comparability” for a description
of adjustments to our GAAP financial measures in this Form 10-Q.
Non-GAAP information should be considered as supplemental in nature and is not meant to be considered
in isolation or as a substitute for the related financial information prepared in accordance with GAAP. In
addition, our non-GAAP financial measures may not be the same as or comparable to similar non-GAAP
measures presented by other companies.
The following non-GAAP financial measures contained in this Form 10-Q are discussed below:
Cost of sales, gross profit, selling, general and administrative expenses, other pension and retiree medical
benefits income, provision for income taxes, net income attributable to noncontrolling interests and net
income attributable to PepsiCo, each adjusted for items affecting comparability, operating profit and net
income attributable to PepsiCo per common share – diluted, each adjusted for items affecting
comparability and the corresponding constant currency growth rates
These measures exclude the net impact of mark-to-market gains and losses on centrally managed
Table of Contents
37

commodity derivatives that do not qualify for hedge accounting, restructuring and impairment charges
related to our 2019 Productivity Plan, charges associated with our acquisitions and divestitures,
impairment and other charges/credits, product recall-related impact and the impact of settlement losses
related to pension and retiree medical plans (see “Items Affecting Comparability” for a detailed
description of each of these items). We also evaluate performance on operating profit and net income
attributable to PepsiCo per common share – diluted, each adjusted for items affecting comparability on a
constant currency basis, which measure our financial results assuming constant foreign currency exchange
rates used for translation based on the rates in effect for the comparable prior-year period. In order to
compute our constant currency results, we multiply or divide, as appropriate, our current-year U.S. dollar
results by the current-year average foreign exchange rates and then multiply or divide, as appropriate,
those amounts by the prior-year average foreign exchange rates. We believe these measures provide useful
information in evaluating the results of our business because they exclude items that we believe are not
indicative of our ongoing performance or that we believe impact comparability with the prior year.
Organic revenue growth
We define organic revenue growth as a measure that adjusts for the impacts of foreign exchange
translation, acquisitions and divestitures and where applicable, the impact of the 53
rd
reporting week. We
believe organic revenue growth provides useful information in evaluating the results of our business
because it excludes items that we believe are not indicative of ongoing performance or that we believe
impact comparability with the prior year.
See “Net Revenue and Organic Revenue Growth” in “Results of Operations – Division Review” for
further information.
Free cash flow
We define free cash flow as net cash from operating activities less capital spending, plus sales of property,
plant and equipment. Since net capital spending is essential to our product innovation initiatives and
maintaining our operational capabilities, we believe that it is a recurring and necessary use of cash. As
such, we believe investors should also consider net capital spending when evaluating our cash from
operating activities. Free cash flow is used by us primarily for acquisitions and financing activities,
including debt repayments, dividends and share repurchases. Free cash flow is not a measure of cash
available for discretionary expenditures since we have certain non-discretionary obligations such as debt
service that are not deducted from the measure.
See “Free Cash Flow” in “Our Liquidity and Capital Resources” for further information.
Items Affecting Comparability
Our reported financial results in this Form 10-Q are impacted by the following items in each of the
following periods:
12 Weeks Ended 6/15/2024
Cost of
sales
Gross
profit
Selling, general
and
administrative
expenses
Operating
profit
Other pension
and retiree
medical benefits
income
Provision
for
income
taxes
(a)
Net income
attributable to
noncontrolling
interests
Net income
attributable
to PepsiCo
Reported, GAAP Measure
$ 9,919
$ 12,582
$ 8,534 $ 4,048 $ 56 $ 776 $ 11 $ 3,083
Items Affecting Comparability
Mark-to-market net impact
19 (19) (11) (8) — (1) — (7)
Restructuring and impairment charges
— — (66) 66 8 20 (1) 55
Product recall-related impact
(8) 8 (7) 15 — 4 — 11
Pension and retiree medical-related impact
— — — — 2 — — 2
Core, Non-GAAP Measure
$ 9,930
$ 12,571
$ 8,450 $ 4,121 $ 66 $ 799 $ 10 $ 3,144
Table of Contents
38

12 Weeks Ended 6/17/2023
Cost of sales Gross profit
Selling, general
and administrative
expenses
Operating
profit
Provision for
income taxes
(a)
Net income
attributable to
PepsiCo
Reported, GAAP Measure
$ 10,121 $ 12,201 $ 8,542 $ 3,659 $ 747 $ 2,748
Items Affecting Comparability
Mark-to-market net impact
1 (1) 8 (9) (2) (7)
Restructuring and impairment charges (3) 3 (89) 92 29 63
Acquisition and divestiture-related charges
— — (7) 7 1 6
Impairment and other charges/credits
1 (1) (111) 110 28 82
Core, Non-GAAP Measure
$ 10,120 $ 12,202 $ 8,343 $ 3,859 $ 803 $ 2,892
24 Weeks Ended 6/15/2024
Cost of
sales
Gross
profit
Selling, general
and
administrative
expenses
Operating
profit
Other pension
and retiree
medical
benefits
income
Provision
for
income
taxes
(a)
Net income
attributable to
noncontrolling
interests
Net income
attributable
to PepsiCo
Reported, GAAP Measure
$ 18,167
$ 22,584
$ 15,819 $ 6,765 $ 114 $ 1,296 $ 22 $ 5,125
Items Affecting Comparability
Mark-to-market net impact
32 (32) 12 (44) — (10) — (34)
Restructuring and impairment charges
(6) 6 (149) 155 15 40 (1) 131
Acquisition and divestiture-related
charges
— — (2) 2 — 1 — 1
Product recall-related impact
(175) 175 (7) 182 — 43 — 139
Pension and retiree medical-related
impact
— — — — 2 — — 2
Core, Non-GAAP Measure
$ 18,018
$ 22,733
$ 15,673 $ 7,060 $ 131 $ 1,370 $ 21 $ 5,364
24 Weeks Ended 6/17/2023
Cost of
sales
Gross
profit
Selling, general
and
administrative
expenses
Operating
profit
Other
pension and
retiree
medical
benefits
income
Provision
for
income
taxes
(a)
Net income
attributable to
noncontrolling
interests
Net income
attributable
to PepsiCo
Reported, GAAP Measure
$ 18,109 $ 22,059 $ 15,771 $ 6,288 $ 121 $ 1,293 $ 35 $ 4,680
Items Affecting Comparability
Mark-to-market net impact
(13) 13 (49) 62 — 15 — 47
Restructuring and impairment charges
(6) 6 (199) 205 (1) 43 1 160
Acquisition and divestiture-related
charges
— — (9) 9 — 2 — 7
Impairment and other charges/credits
5 (5) (102) 97 — 28 — 69
Core, Non-GAAP Measure
$ 18,095 $ 22,073 $ 15,412 $ 6,661 $ 120 $ 1,381 $ 36 $ 4,963
(a) Provision for income taxes is the expected tax charge/benefit on the underlying item based on the tax laws and income tax rates applicable to the
underlying item in its corresponding tax jurisdiction.
Table of Contents
39

12 Weeks Ended 24 Weeks Ended
6/15/2024 6/17/2023 Change 6/15/2024 6/17/2023 Change
Net income attributable to PepsiCo per
common share – diluted, GAAP
measure
$ 2.23 $ 1.99 13 % $ 3.71 $ 3.38 10 %
Mark-to-market net impact
— — (0.02) 0.03
Restructuring and impairment charges
0.04 0.05 0.09 0.12
Acquisition and divestiture-related
charges
— — — —
Impairment and other charges/credits
— 0.06 — 0.05
Product recall-related impact
0.01 — 0.10 —
Pension and retiree medical-related impact
— — — —
Core net income attributable to PepsiCo
per common share – diluted, non-
GAAP measure
$ 2.28 $ 2.09
(a)
9 % $ 3.89
(a)
$ 3.59
(a)
8 %
Impact of foreign exchange translation
1 —
Growth in core net income attributable to
PepsiCo per common share – diluted,
on a constant currency basis, non-
GAAP measure
10 % 9 %
(a)
(a) Does not sum due to rounding.
Mark-to-Market Net Impact
We centrally manage commodity derivatives on behalf of our divisions. These commodity derivatives
include agricultural products, energy and metals. Commodity derivatives that do not qualify for hedge
accounting treatment are marked to market each period with the resulting gains and losses recorded in
corporate unallocated expenses as either cost of sales or selling, general and administrative expenses,
depending on the underlying commodity. These gains and losses are subsequently reflected in division
results when the divisions recognize the cost of the underlying commodity in operating profit. Therefore,
the divisions realize the economic effects of the derivative without experiencing any resulting mark-to-
market volatility, which remains in corporate unallocated expenses.
Restructuring and Impairment Charges
2019 Multi-Year Productivity Plan
The 2019 Productivity Plan, publicly announced on February 15, 2019, leverages new technology and
business models to further simplify, harmonize and automate processes; re-engineers our go-to-market and
information systems, including deploying the right automation for each market; and simplifies our
organization and optimize our manufacturing and supply chain footprint. To build on the successful
implementation of the 2019 Productivity Plan, in 2022, we expanded and extended the plan through the
end of 2028 to take advantage of additional opportunities within the initiatives described above. As a
result, we expect to incur pre-tax charges of approximately $3.65 billion, including cash expenditures of
approximately $2.9 billion. Plan-to-date through June 15, 2024, we have incurred pre-tax charges of $2.1
billion, including cash expenditures of $1.6 billion. For the remainder of 2024, we expect to incur pre-tax
charges and cash expenditures of approximately $325 million each. These charges will be funded
primarily through cash from operations. We expect to incur the majority of the remaining pre-tax charges
and cash expenditures through 2025, with the balance to be incurred through 2028. Charges include
severance and other employee costs, asset impairments and other costs.
Table of Contents
40

See Note 3 to our condensed consolidated financial statements in this Form 10-Q, as well as Note 3 to our
consolidated financial statements in our 2023 Form 10-K, for further information related to our 2019
Productivity Plan.
We regularly evaluate productivity initiatives beyond the productivity plan and other initiatives discussed
above and in Note 3 to our condensed consolidated financial statements.
Acquisition and Divestiture-Related Charges
Acquisition and divestiture-related charges primarily include costs associated with divestitures, primarily
consulting, advisory and other professional fees.
Impairment and Other Charges/Credits
We recognized impairment charges related to our investment in TBG. We also recognized adjustments to
charges recorded in prior years from changes in estimates of previously recorded amounts.
Product Recall-Related Impact
We recognized property, plant and equipment write-offs, employee severance costs and other costs in our
QFNA division associated with a previously announced voluntary recall of certain bars and cereals.
See Note 1 to our condensed consolidated financial statements for further information.
Pension and Retiree Medical-Related Impact
Pension and retiree medical-related impact includes settlement charges related to lump sum distributions
exceeding the total of annual service and interest cost.
See Note 7 to our condensed consolidated financial statements for further information.
Our Liquidity and Capital Resources
We believe that our cash generating capability and financial condition, together with our revolving credit
facilities, working capital lines and other available methods of debt financing, such as commercial paper
borrowings and long-term debt financing, will be adequate to meet our operating, investing and financing
needs, including with respect to our net capital spending plans. Our primary sources of liquidity include
cash from operations, proceeds obtained from issuances of commercial paper and long-term debt, and cash
and cash equivalents. These sources of cash are available to fund cash outflows that have both a short- and
long-term component, including debt repayments and related interest payments; payments for acquisitions;
operating leases; purchase, marketing, and other contractual commitments, including capital expenditures
and the transition tax liability under the TCJ Act. In addition, these sources of cash fund other cash
outflows including anticipated dividend payments and share repurchases. We do not have guarantees or
off-balance sheet financing arrangements, including variable interest entities, that we believe could have a
material impact on our liquidity. See “Our Business Risks” and Note 8 to our condensed consolidated
financial statements included in this Form 10-Q and “Item 1A. Risk Factors,” “Item 7. Management’s
Discussion and Analysis of Financial Condition and Results of Operations – Our Business Risks” and
Note 8 to our consolidated financial statements included in our 2023 Form 10-K for further information.
As of June 15, 2024, cash, cash equivalents and short-term investments in our consolidated subsidiaries
subject to currency controls or currency exchange restrictions were not material.
The TCJ Act imposed a one-time mandatory transition tax on undistributed international earnings. As of
June 15, 2024, our mandatory transition tax liability was $1.7 billion, which must be paid through 2026
under the provisions of the TCJ Act. See “Our Liquidity and Capital Resources” and Note 5 to our
consolidated financial statements included in our 2023 Form 10-K for further discussion of the TCJ Act.
Table of Contents
41

Supply chain financing arrangements did not have a material impact on our liquidity or capital resources
in the periods presented and we do not expect such arrangements to have a material impact on our
liquidity or capital resources for the foreseeable future. See Note 12 to our condensed consolidated
financial statements for further discussion of supply chain financing arrangements.
Operating Activities
During the 24 weeks ended June 15, 2024, net cash provided by operating activities was $1.3 billion,
compared to net cash provided by operating activities of $2.0 billion in the prior-year period. The decrease
in operating cash flow primarily reflects unfavorable working capital comparisons.
Investing Activities
During the 24 weeks ended June 15, 2024, net cash used for investing activities was $1.5 billion, primarily
reflecting net capital spending.
We regularly review our plans with respect to net capital spending and believe that we have sufficient
liquidity to meet our net capital spending needs.
Financing Activities
During the 24 weeks ended June 15, 2024, net cash used for financing activities was $2.9 billion,
primarily reflecting the return of operating cash flow to our shareholders through dividend payments and
share repurchases of $4.0 billion, as well as payments of long-term debt of $2.9 billion, partially offset by
net proceeds of short-term borrowings of $2.2 billion and proceeds from the issuances of long-term debt
of $1.8 billion.
We annually review our capital structure with our Board of Directors, including our dividend policy and
share repurchase activity. On February 10, 2022, we announced a share repurchase program providing for
the repurchase of up to $10.0 billion of PepsiCo common stock which commenced on February 11, 2022
and will expire on February 28, 2026. In addition, on February 9, 2024, we announced a 7% increase in
our annualized dividend to $5.42 per share from $5.06 per share, effective with the dividend paid in June
2024. We expect to return a total of approximately $8.2 billion to shareholders in 2024, comprising
dividends of approximately $7.2 billion and share repurchases of approximately $1.0 billion.
Free Cash Flow
The table below reconciles net cash provided by operating activities, as reflected on our cash flow
statement, to our free cash flow. Free cash flow is a non-GAAP financial measure. For further information
on free cash flow, see “Non-GAAP Measures.”
24 Weeks Ended
6/15/2024 6/17/2023
Net cash provided by operating activities, GAAP measure
$ 1,315 $ 2,019
Capital spending
(1,701) (1,513)
Sales of property, plant and equipment
127 122
Free cash flow, non-GAAP measure
$ (259) $ 628
We use free cash flow primarily for acquisitions and financing activities, including debt repayments,
dividends and share repurchases. We expect to continue to return free cash flow to our shareholders
primarily through dividends while maintaining Tier 1 commercial paper access, which we believe will
facilitate appropriate financial flexibility and ready access to global capital and credit markets at favorable
interest rates. See “Our Business Risks” included in this Form 10-Q and “Item 1A. Risk Factors” and
“Item 7. Management’s Discussion and Analysis of Financial Condition and Results of Operations – Our
Table of Contents
42

Business Risks,” included in our 2023 Form 10-K, for certain factors that may impact our credit ratings or
our operating cash flows.
Any downgrade of our credit ratings by a credit rating agency, especially any downgrade to below
investment grade, whether or not as a result of our actions or factors which are beyond our control, could
increase our future borrowing costs and impair our ability to access capital and credit markets on terms
commercially acceptable to us, or at all. In addition, any downgrade of our current short-term credit
ratings could impair our ability to access the commercial paper market with the same flexibility that we
have experienced historically, and therefore require us to rely more heavily on more expensive types of
debt financing. See Note 8 to our condensed consolidated financial statements and “Our Business Risks”
included in this Form 10-Q, as well as “Item 1A. Risk Factors” and “Item 7. Management’s Discussion
and Analysis of Financial Condition and Results of Operations – Our Business Risks” included in our
2023 Form 10-K for further information.
Changes in Line Items in Our Condensed Consolidated Financial Statements
Changes in line items in the income statement are discussed in “Results of Operations – Consolidated
Review,” “Results of Operations – Division Review” and “Items Affecting Comparability.”
Changes in line items in the cash flow statement are discussed in “Our Liquidity and Capital Resources.”
Changes in line items in the balance sheet are discussed below:
Total Assets
As of June 15, 2024, total assets were $99.5 billion, compared to $100.5 billion as of December 30, 2023.
The change in total assets is primarily driven by the following line items:
(Decrease)/Increase
(a)
Cash and cash equivalents
(b)
$ (3.4)
Accounts and notes receivable, less allowance
(c)
$ 1.1
Total Liabilities
As of June 15, 2024, total liabilities were $80.0 billion, compared to $81.9 billion as of December 30,
2023. The change in total liabilities is primarily driven by the following line items:
(Decrease)/Increase
(a)
Short-term debt obligations
(d)
$ 1.8
Accounts payable and other current liabilities
(e)
$ (2.3)
(a) In billions.
(b) Refer to the cash flow statement for further information.
(c) Primarily reflects favorable operating performance.
(d) See Note 8 to our condensed consolidated financial statements for further information.
(e) Primarily reflects timing of payments, combined with a decrease in production and capital expenditure payables across our divisions.
Total Equity
See the equity statement and Notes 9 and 11 to our condensed consolidated financial statements.
Table of Contents
43

Report of Independent Registered Public Accounting Firm
To the Shareholders and Board of Directors
PepsiCo, Inc.:
Results of Review of Interim Financial Information
We have reviewed the Condensed Consolidated Balance Sheet of PepsiCo, Inc. and subsidiaries (the
Company) as of June 15, 2024, the related Condensed Consolidated Statements of Income,
Comprehensive Income, and Equity for the twelve and twenty-four weeks ended June 15, 2024 and
June 17, 2023, the related Condensed Consolidated Statement of Cash Flows for the twenty-four weeks
ended June 15, 2024 and June 17, 2023, and the related notes (collectively, the consolidated interim
financial information). Based on our reviews, we are not aware of any material modifications that should
be made to the consolidated interim financial information for it to be in conformity with U.S. generally
accepted accounting principles.
We have previously audited, in accordance with the standards of the Public Company Accounting
Oversight Board (United States) (PCAOB), the Consolidated Balance Sheet of the Company as of
December 30, 2023, and the related Consolidated Statements of Income, Comprehensive Income, Cash
Flows, and Equity for the fiscal year then ended (not presented herein); and in our report dated February 8,
2024, we expressed an unqualified opinion on those consolidated financial statements. In our opinion, the
information set forth in the accompanying Condensed Consolidated Balance Sheet as of December 30,
2023, is fairly stated, in all material respects, in relation to the Consolidated Balance Sheet from which it
has been derived.
Basis for Review Results
This consolidated interim financial information is the responsibility of the Company’s management. We
are a public accounting firm registered with the PCAOB and are required to be independent with respect
to the Company in accordance with the U.S. federal securities laws and the applicable rules and
regulations of the Securities and Exchange Commission and the PCAOB.
We conducted our reviews in accordance with the standards of the PCAOB. A review of consolidated
interim financial information consists principally of applying analytical procedures and making inquiries
of persons responsible for financial and accounting matters. It is substantially less in scope than an audit
conducted in accordance with the standards of the PCAOB, the objective of which is the expression of an
opinion regarding the financial statements taken as a whole. Accordingly, we do not express such an
opinion.
/s/ KPMG LLP
New York, New York
July 10, 2024
Table of Contents
44

ITEM 3. Quantitative and Qualitative Disclosures About Market Risk.
See “Item 2. Management’s Discussion and Analysis of Financial Condition and Results of Operations –
Our Business Risks.” In addition, see “Item 1A. Risk Factors,” “Item 7. Management’s Discussion and
Analysis of Financial Condition and Results of Operations – Our Business Risks” and Note 9 to our
consolidated financial statements in our 2023 Form 10-K.
ITEM 4. Controls and Procedures.
As of the end of the period covered by this report, we carried out an evaluation under the supervision and
with the participation of our management, including our Chief Executive Officer and Chief Financial
Officer, of the effectiveness of the design and operation of our disclosure controls and procedures, as such
term is defined in Rules 13a-15(e) and 15d-15(e) of the Securities Exchange Act of 1934, as amended (the
Exchange Act). Based upon that evaluation, our Chief Executive Officer and Chief Financial Officer
concluded that as of the end of the period covered by this report our disclosure controls and procedures
were effective to ensure that information required to be disclosed by us in reports we file or submit under
the Exchange Act is (1) recorded, processed, summarized and reported within the time periods specified in
SEC rules and forms, and (2) accumulated and communicated to our management, including our Chief
Executive Officer and Chief Financial Officer, as appropriate, to allow timely decisions regarding required
disclosure.
During the 12 weeks ended June 15, 2024, we continued migrating certain of our financial processing
systems to an Enterprise Resource Planning (ERP) system. These systems implementations are part of our
ongoing global business transformation initiative, and we plan to continue implementing such systems
throughout other parts of our businesses in phases over the next several years. In connection with these
ERP implementations, we are updating and will continue to update our internal control over financial
reporting, as necessary, to accommodate modifications to our business processes and accounting
procedures. During the 12 weeks ended June 15, 2024, we continued implementing these systems,
resulting in changes that materially affected our internal control over financial reporting. These system
implementations did not have an adverse effect, nor do we expect will have an adverse effect, on our
internal control over financial reporting. In addition, in connection with our 2019 multi-year productivity
plan, we continue to migrate to shared business models across our operations to further simplify,
harmonize and automate processes. In connection with this multi-year productivity plan and resulting
business process changes, we continue to enhance the design and documentation of our internal control
over financial reporting processes to maintain effective controls over our financial reporting. These
business process changes have not materially affected, and we do not expect them to materially affect, our
internal control over financial reporting.
Except with respect to the continued implementation of ERP systems, there have been no changes in our
internal control over financial reporting during the 12 weeks ended June 15, 2024 that have materially
affected, or are reasonably likely to materially affect, our internal control over financial reporting. We will
continue to assess the impact on our internal control over financial reporting as we continue to implement
our ERP solution and our 2019 multi-year productivity plan.
Table of Contents
45

PART II OTHER INFORMATION
ITEM 1. Legal Proceedings.
The following information should be read in conjunction with the discussion set forth under Part I,
“Item 3. Legal Proceedings” in our 2023 Form 10-K.
On June 20, 2024, the Mayor and City Council of Baltimore, Maryland filed a lawsuit against PepsiCo,
Inc., Frito-Lay, Inc. and Frito-Lay North America, Inc., and several other unrelated parties, (the Baltimore
Matter) asserting claims for littering and improper disposal of our packaging, public nuisance, deceptive
acts or practices in the conduct of business, design defects rendering our packaging unsafe for the
environment and failure to warn that our packaging was a potential source of plastic pollution, allegedly
resulting in plastic pollution in Baltimore City. This matter is pending in the Circuit Court for Baltimore
City, Maryland. The lawsuit does not specify the amount of damages sought and we believe we have
strong defenses to each of these claims. In addition, we and our subsidiaries are party to a variety of
litigation, claims, legal or regulatory proceedings, inquiries and investigations. While the results of the
Baltimore Matter, the NYS Matter (as defined in our 2023 Form 10-K) and each such other litigation,
claim, legal or regulatory proceeding, inquiry and investigation cannot be predicted with certainty,
management believes that the final outcome of the foregoing will not have a material adverse effect on our
financial condition, results of operations or cash flows. See also “Item 1. Business – Regulatory Matters”
and “Item 1A. Risk Factors” in our 2023 Form 10-K.
ITEM 1A. Risk Factors.
There have been no material changes with respect to the risk factors disclosed in our 2023 Form 10-K.
ITEM 2. Unregistered Sales of Equity Securities and Use of Proceeds.
A summary of our common stock repurchases (in millions, except average price per share) during the 12
weeks ended June 15, 2024 is set forth in the table below.
Issuer Purchases of Common Stock
Period
Total
Number of
Shares
Repurchased
(a)
Average
Price
Paid Per
Share
Total Number
of Shares
Purchased as
Part of Publicly
Announced
Plans or
Programs
Maximum
Number (or
Approximate
Dollar Value) of
Shares That
May Yet Be
Purchased
Under the Plans
or Programs
3/23/2024 $ 7,342
3/24/2024 - 4/20/2024 0.7 $ 170.23 0.7 (124)
7,218
4/21/2024 - 5/18/2024 0.4 $ 178.80 0.4 (71)
7,147
5/19/2024 - 6/15/2024 0.7 $ 172.20 0.7 (115)
Total 1.8 $ 172.87 1.8 $ 7,032
(a) All shares were repurchased in open market transactions pursuant to the $10 billion share repurchase program authorized
by our Board of Directors and publicly announced on February 10, 2022, which commenced on February 11, 2022 and will
expire on February 28, 2026. Shares repurchased under this program may be repurchased in open market transactions, in
privately negotiated transactions, in accelerated stock repurchase transactions or otherwise.
Table of Contents
46

ITEM 5. Other Information.
During the 12 weeks ended June 15, 2024, none of our directors or executive officers adopted, modified or
terminated a “Rule 10b5-1 trading arrangement” or a “non-Rule 10b5-1 trading arrangement” as such
terms are defined under Item 408 of Regulation S-K.
ITEM 6. Exhibits.
See “Index to Exhibits” on page 48.
Table of Contents
47

INDEX TO EXHIBITS
ITEM 6
EXHIBIT
Exhibit 3.1 Amended and Restated Articles of Incorporation of PepsiCo, Inc., effective as of May 1,
2019, which are incorporated herein by reference to Exhibit 3.1 to PepsiCo, Inc.’s Current
Report on Form 8-K filed with the Securities and Exchange Commission on May 3, 2019.
Exhibit 3.2 By-Laws of PepsiCo, Inc., as amended and restated, effective as of April 15, 2020, which
are incorporated herein by reference to Exhibit 3.2 to PepsiCo, Inc.’s Current Report on
Form 8-K filed with the Securities and Exchange Commission on April 16, 2020.
Exhibit 15 Letter re: Unaudited Interim Financial Information.
Exhibit 22 Subsidiary Issuer of Guaranteed Securities.
Exhibit 31 Certifications of Chief Executive Officer and Chief Financial Officer pursuant to Section
302 of the Sarbanes-Oxley Act of 2002.
Exhibit 32 Certifications of Chief Executive Officer and Chief Financial Officer pursuant to Section
906 of the Sarbanes-Oxley Act of 2002.
Exhibit 99.1 364-Day Credit Agreement, dated as of May 24, 2024, among PepsiCo, as borrower, the
lenders named therein, and Citibank, N.A., as administrative agent, which is incorporated
by reference to Exhibit 99.1 to PepsiCo, Inc.’s Current Report on Form 8-K filed with the
Securities and Exchange Commission on May 24, 2024.
Exhibit 99.2 Five-Year Credit Agreement, dated as of May 24, 2024, among PepsiCo, as borrower, the
lenders named therein, and Citibank, N.A., as administrative agent, which is incorporated
by reference to Exhibit 99.2 to PepsiCo, Inc.’s Current Report on Form 8-K filed with the
Securities and Exchange Commission on May 24, 2024.
Exhibit 101 The following materials from PepsiCo, Inc.’s Quarterly Report on Form 10-Q for the
quarter ended June 15, 2024 formatted in iXBRL (Inline eXtensible Business Reporting
Language): (i) the Condensed Consolidated Statement of Income, (ii) the Condensed
Consolidated Statement of Comprehensive Income, (iii) the Condensed Consolidated
Statement of Cash Flows, (iv) the Condensed Consolidated Balance Sheet, (v) the
Condensed Consolidated Statement of Equity, and (vi) Notes to the Condensed
Consolidated Financial Statements.
Exhibit 104 The cover page from the Company’s Quarterly Report on Form 10-Q for the quarter ended
June 15, 2024, formatted in iXBRL and contained in Exhibit 101.
Table of Contents
48

SIGNATURES
Pursuant to the requirements of the Securities Exchange Act of 1934, the registrant has duly caused this
report to be signed on its behalf by the undersigned thereunto duly authorized.
PepsiCo, Inc.
(Registrant)
Date: July 10, 2024 /s/ Marie T. Gallagher
Marie T. Gallagher
Senior Vice President and Controller
(Principal Accounting Officer)
Date: July 10, 2024 /s/ David Flavell
David Flavell
Executive Vice President, General
Counsel and Corporate Secretary
(Duly Authorized Officer)
Table of Contents
49

EXHIBIT 15
Accountant’s Acknowledgement
To the Shareholders and Board of Directors
PepsiCo, Inc.:
We hereby acknowledge our awareness of the use of our report dated July 10, 2024 included within the Quarterly Report on Form 10-Q of
PepsiCo, Inc. for the twelve and twenty-four weeks ended June 15, 2024, and incorporated by reference in the following Registration
Statements and in the related Prospectuses:
Description, Registration Statement Number
Form S-3
• PepsiCo Automatic Shelf Registration Statement, 333-277003
• PepsiCo Automatic Shelf Registration Statement, 333-266332
• PepsiCo Automatic Shelf Registration Statement, 333-234767
• PepsiCo Automatic Shelf Registration Statement, 333-216082
• PepsiCo Automatic Shelf Registration Statement, 333-197640
• PepsiCo Automatic Shelf Registration Statement, 333-177307
• PepsiCo Automatic Shelf Registration Statement, 333-154314
• PepsiCo Automatic Shelf Registration Statement, 333-133735
• PepsiAmericas, Inc. 2000 Stock Incentive Plan, 333-165176
• PBG 2004 Long Term Incentive Plan, PBG 2002 Long Term Incentive Plan, PBG Long Term Incentive Plan, The Pepsi Bottling
Group, Inc. 1999 Long Term Incentive Plan and PBG Stock Incentive Plan, 333-165177
Form S-8
• The PepsiCo Savings Plan, 333-76204, 333-76196, 333-150867 and 333-150868
• PepsiCo, Inc. 2007 Long-Term Incentive Plan, 333-142811, 333-166740 and 333-279335
• PepsiCo, Inc. 2003 Long-Term Incentive Plan, 333-109509
• PepsiCo SharePower Stock Option Plan, 33-29037, 33-35602, 33-42058, 33-51496, 33-54731, 33-66150 and 333-109513
• Director Stock Plan, 33-22970 and 333-110030
• 1979 Incentive Plan and the 1987 Incentive Plan, 33-19539
• 1994 Long-Term Incentive Plan, 33-54733
• PepsiCo, Inc. 1995 Stock Option Incentive Plan, 33-61731, 333-09363 and 333-109514
• 1979 Incentive Plan, 2-65410
• PepsiCo, Inc. Long Term Savings Program, 2-82645, 33-51514 and 33-60965
• PepsiCo 401(k) Plan, 333-89265
• Retirement Savings and Investment Plan for Union Employees of Tropicana Products, Inc. and Affiliates (Teamster Local Union
#173) and the Retirement Savings and Investment Plan for Union Employees of Tropicana Products, Inc. and Affiliates, 333-65992
• The Quaker Long Term Incentive Plan of 1990, The Quaker Long Term Incentive Plan of 1999 and The Quaker Oats Company Stock
Option Plan for Outside Directors, 333-66632
• The Quaker 401(k) Plan for Salaried Employees and The Quaker 401(k) Plan for Hourly Employees, 333-66634
• The PepsiCo Share Award Plan, 333-87526
• PBG 401(k) Savings Program, PBG 401(k) Program, PepsiAmericas, Inc. Salaried 401(k) Plan and PepsiAmericas, Inc. Hourly 401(k)
Plan, 333-165106
• PBG 2004 Long Term Incentive Plan, PBG 2002 Long Term Incentive Plan, PBG Long Term Incentive Plan, The Pepsi Bottling
Group, Inc. 1999 Long Term Incentive Plan, PBG Directors’ Stock Plan, PBG Stock Incentive Plan and PepsiAmericas, Inc. 2000
Stock Incentive Plan, 333-165107
Pursuant to Rule 436 under the Securities Act of 1933 (the Act), such report is not considered part of a registration statement prepared or
certified by an independent registered public accounting firm, or a report prepared or certified by an independent registered public
accounting firm within the meaning of Sections 7 and 11 of the Act.
/s/ KPMG LLP
New York, New York
July 10, 2024
Subsidiary Issuer of Guaranteed Securities
As of June 15, 2024, PepsiCo, Inc. fully and unconditionally guaranteed on a senior
unsecured basis the following unsecured registered notes issued by PepsiCo Singapore Financing
I Pte. Ltd., PepsiCo Inc.’s wholly-owned consolidated finance subsidiary incorporated as a
private company limited by shares in the Republic of Singapore:
1. Floating Rate Notes due 2027
2. 4.650% Senior Notes due 2027
3. 4.550% Senior Notes due 2029
4. 4.700% Senior Notes due 2034
Exhibit 22

EXHIBIT 31
CERTIFICATION
I, Ramon L. Laguarta, certify that:
1. I have reviewed this quarterly report on Form 10-Q of PepsiCo, Inc.;
2. Based on my knowledge, this report does not contain any untrue statement of a material fact or omit to state a material fact
necessary to make the statements made, in light of the circumstances under which such statements were made, not
misleading with respect to the period covered by this report;
3. Based on my knowledge, the financial statements, and other financial information included in this report, fairly present in
all material respects the financial condition, results of operations and cash flows of the registrant as of, and for, the periods
presented in this report;
4. The registrant’s other certifying officer and I are responsible for establishing and maintaining disclosure controls and
procedures (as defined in Exchange Act Rules 13a-15(e) and 15d-15(e)) and internal control over financial reporting (as
defined in Exchange Act Rules 13a-15(f) and 15d-15(f)) for the registrant and have:
a) Designed such disclosure controls and procedures, or caused such disclosure controls and procedures to be designed
under our supervision, to ensure that material information relating to the registrant, including its consolidated
subsidiaries, is made known to us by others within those entities, particularly during the period in which this report is
being prepared;
b) Designed such internal control over financial reporting, or caused such internal control over financial reporting to be
designed under our supervision, to provide reasonable assurance regarding the reliability of financial reporting and the
preparation of financial statements for external purposes in accordance with generally accepted accounting principles;
c) Evaluated the effectiveness of the registrant’s disclosure controls and procedures and presented in this report our
conclusions about the effectiveness of the disclosure controls and procedures, as of the end of the period covered by
this report based on such evaluation; and
d) Disclosed in this report any change in the registrant’s internal control over financial reporting that occurred during the
registrant’s most recent fiscal quarter (the registrant’s fourth fiscal quarter in the case of an annual report) that has
materially affected, or is reasonably likely to materially affect, the registrant’s internal control over financial reporting;
and
5. The registrant’s other certifying officer and I have disclosed, based on our most recent evaluation of internal control over
financial reporting, to the registrant’s auditors and the audit committee of the registrant’s board of directors (or persons
performing the equivalent functions):
a) All significant deficiencies and material weaknesses in the design or operation of internal control over financial
reporting which are reasonably likely to adversely affect the registrant’s ability to record, process, summarize and
report financial information; and
b) Any fraud, whether or not material, that involves management or other employees who have a significant role in the
registrant’s internal control over financial reporting.
Date: July 10, 2024 /s/ Ramon L. Laguarta
Ramon L. Laguarta
Chairman of the Board of Directors and
Chief Executive Officer

CERTIFICATION
I, James T. Caulfield, certify that:
1. I have reviewed this quarterly report on Form 10-Q of PepsiCo, Inc.;
2. Based on my knowledge, this report does not contain any untrue statement of a material fact or omit to state a material fact
necessary to make the statements made, in light of the circumstances under which such statements were made, not
misleading with respect to the period covered by this report;
3. Based on my knowledge, the financial statements, and other financial information included in this report, fairly present in
all material respects the financial condition, results of operations and cash flows of the registrant as of, and for, the periods
presented in this report;
4. The registrant’s other certifying officer and I are responsible for establishing and maintaining disclosure controls and
procedures (as defined in Exchange Act Rules 13a-15(e) and 15d-15(e)) and internal control over financial reporting (as
defined in Exchange Act Rules 13a-15(f) and 15d-15(f)) for the registrant and have:
a) Designed such disclosure controls and procedures, or caused such disclosure controls and procedures to be designed
under our supervision, to ensure that material information relating to the registrant, including its consolidated
subsidiaries, is made known to us by others within those entities, particularly during the period in which this report is
being prepared;
b) Designed such internal control over financial reporting, or caused such internal control over financial reporting to be
designed under our supervision, to provide reasonable assurance regarding the reliability of financial reporting and the
preparation of financial statements for external purposes in accordance with generally accepted accounting principles;
c) Evaluated the effectiveness of the registrant’s disclosure controls and procedures and presented in this report our
conclusions about the effectiveness of the disclosure controls and procedures, as of the end of the period covered by
this report based on such evaluation; and
d) Disclosed in this report any change in the registrant’s internal control over financial reporting that occurred during the
registrant’s most recent fiscal quarter (the registrant’s fourth fiscal quarter in the case of an annual report) that has
materially affected, or is reasonably likely to materially affect, the registrant’s internal control over financial reporting;
and
5. The registrant’s other certifying officer and I have disclosed, based on our most recent evaluation of internal control over
financial reporting, to the registrant’s auditors and the audit committee of the registrant’s board of directors (or persons
performing the equivalent functions):
a) All significant deficiencies and material weaknesses in the design or operation of internal control over financial
reporting which are reasonably likely to adversely affect the registrant’s ability to record, process, summarize and
report financial information; and
b) Any fraud, whether or not material, that involves management or other employees who have a significant role in the
registrant’s internal control over financial reporting.
Date: July 10, 2024 /s/ James T. Caulfield
James T. Caulfield
Chief Financial Officer

EXHIBIT 32
CERTIFICATION PURSUANT TO
SECTION 906 OF THE SARBANES-OXLEY ACT OF 2002
In connection with the Quarterly Report of PepsiCo, Inc. (the “Corporation”) on Form 10-Q for the quarterly period ended
June 15, 2024 as filed with the Securities and Exchange Commission on the date hereof (the “Report”), I, Ramon L. Laguarta,
Chairman of the Board of Directors and Chief Executive Officer of the Corporation, certify to my knowledge, pursuant to
Section 906 of the Sarbanes-Oxley Act of 2002 (18 U.S.C. Section 1350), that:
1. The Report fully complies with the requirements of Section 13(a) or 15(d) of the Securities Exchange Act of 1934; and
2. The information contained in the Report fairly presents, in all material respects, the financial condition and results of
operations of the Corporation.
Date: July 10, 2024 /s/ Ramon L. Laguarta
Ramon L. Laguarta
Chairman of the Board of Directors and
Chief Executive Officer
CERTIFICATION PURSUANT TO
SECTION 906 OF THE SARBANES-OXLEY ACT OF 2002
In connection with the Quarterly Report of PepsiCo, Inc. (the “Corporation”) on Form 10-Q for the quarterly period ended
June 15, 2024 as filed with the Securities and Exchange Commission on the date hereof (the “Report”), I, James T. Caulfield,
Chief Financial Officer of the Corporation, certify to my knowledge, pursuant to Section 906 of the Sarbanes-Oxley Act of
2002 (18 U.S.C. Section 1350), that:
1. The Report fully complies with the requirements of Section 13(a) or 15(d) of the Securities Exchange Act of 1934; and
2. The information contained in the Report fairly presents, in all material respects, the financial condition and results of
operations of the Corporation.
Date: July 10, 2024 /s/ James T. Caulfield
James T. Caulfield
Chief Financial Officer
