
Interim Report
Q2 2023|January–June 2023

39 909
Total sales, MSEK
6.6%
Operating margin
2.05
Earnings per share, SEK
April–June
2023
• Total sales MSEK 39 909 (30 535)
• Organic sales growth 11 percent (6)
• Operating income before amortization MSEK 2 620 (1 760)
• Operating margin 6.6 percent (5.8)
• Items affecting comparability (IAC) MSEK –311 (–226),
relating to the previously announced transformation
programs and the acquisition of STANLEY Security
• Earnings per share before and after dilution SEK 2.05
(2.32)*
• Earnings per share before and after dilution, before IAC,
SEK 2.46 (2.77)*
• Cash flow from operating activities 46 percent (53)
CONTENTS
Comments from the President and CEO
January–June summary
Group development
Development in the Group’s business segments
Cash flow
Capital employed and financing
Acquisitions and divestitures
Other significant events
Risks and uncertainties
Parent Company operations
Signatures of the Board of Directors
Review report
Consolidated financial statements
Segment overview
Notes
Parent Company
Financial information
* Number of shares outstanding has been adjusted for the rights issue completed on October 11, 2022.
For further information refer to Data per share on page 21.
** Includes STANLEY Security’s 12 months adjusted estimated EBITDA.
JANUARY–JUNE 2023
• Total sales MSEK 77 660 (59 133)
• Organic sales growth 11 percent (5)
• Operating income before
amortization MSEK 4 800 (3 212)
• Operating margin 6.2 percent (5.4)
• Items affecting comparability (IAC)
MSEK –592 (–360), relating to the
previously announced transform-
ation programs and the acquisition
ofSTANLEY Security
• Earnings per share before and after
dilution SEK 3.71 (4.24)*
• Earnings per share before and after
dilution, before IAC, SEK 4.49 (4.91)*
• Reported net debt/EBITDA 3.7 (2.2),
adjusted net debt/EBITDA 3.7**
• Cash flow from operating activities
29percent (25)
2Securitas ABInterim ReportQ2 2023|January–June 2023

“Strong margin development
inNorthAmerica and Europe”
Comments from
thePresident and CEO
In a period of global macroeconomic
uncertainty, we delivered yet another
strong quarter with 11 percent (6)
organic sales growth and an oper-
ating margin of 6.6 percent (5.8). We
recorded 12 percent real sales growth
in our technology and solutions busi-
ness, excluding STANLEY Security,
demonstrating that we are on the right
track. Overall, organic sales growth
in the Group continued to be driven
primarily by price increases, although
volume growth was good within tech-
nology and solutions and inthe airport
security business.
The operating margin improved to
6.6percent (5.8), driven by North
America and Europe with the contri-
bution from the STANLEY Security
acquisition and related cost benefits,
together with strong growth and margin
development in our technology and
solutions business.
Our integration and value creation
processes with STANLEY Security are
progressing according to plan. We
have realized substantial cost benefits
in our Technology business primarily
in North America, and expect further
benefits over the coming quarters.
Wesee significant client interest in our
strengthened offering and have mate-
rial commercial synergy opportunities
in our sales pipeline.
Within our security services business
we maintain sharp focus on quality
and actively managing contracts with
lower profitability. These efforts are
progressing well throughout the Group,
and especially in Europe the profit-
ability improved as a result. In Europe,
we saw strong margin development,
also compared to the first quarter of
2023, as start-up costs in the airport
security business were reduced and
cost control improved. Furthermore,
wewere on par with price increases
andwage costs in the Group in the first
halfyear.
During the summer we were glad to
announce that we have extended and
expanded our global secur ity services
contract and partnership with a leading
global technology company.
The Group’s operating cash flow was
46 percent (53) of the operating result
in the second quarter. Thefirst half
year is normally weaker from a season-
ality perspective, and we continue to
have a high cash flow focus across the
business to ensure a healthy full-year
outcome.
TRANSFORMING IN LINE WITH
OURSTRATEGY
Leadership in technology and solutions
as well as in digital capabilities are
core to the execution of our strategy.
With STANLEY Security we are number
two in the global security technology
market and the combined solutions
offering is truly unique. The transform-
ation programs we have implemented
in North America and are implementing
in Europe and Ibero-America funda-
mentally shift our digital capabilities
as a company, digitalizing our clients,
people, operational and financial
processes end-to-end.
A central part of the transformation
program in Europe is the creation of
aspecial ized solutions organization
that is now in place, delivering solutions
sales and profit growth. As communi-
cated earlier, we have decided to delay
parts of the program that relate to
systems integration with the STANLEY
integration to maximize cost efficiency
and benefits. We expect to conclude
these activities during 2024.
On July 25, we divested our entire
oper ation in Argentina due to the
weak macro economic prospects and
challenging business environment in
combination with a limited opportunity
to execute our long-term strategy with
healthy financial performance. As part
of our strategy we continue to assess
our business mix and presence to
further sharpen our performance and
position as the leading security solu-
tions and technology company.
We are executing according to plan
while at the same time going through
a period of extensive transformation –
with modernization and digitalization of
our business, integration of STANLEY
Security and further sharpening the
business. We still have a lot of work
ahead of us but with our new capabil-
ities, we are very well positioned to
deliver superior value as the new
Securitas.
Magnus Ahlqvist
President and CEO
3Securitas ABInterim ReportQ2 2023|January–June 2023
January–June summary
ACQUISITION OF STANLEY SECURITY
The acquisition of STANLEY Security
has a significant impact on Securitas’
reporting that should be considered
when reading this report.
STANLEY Security was consolidated as
of July 22, 2022, and is consequently in-
cluded in the first half year 2023 income
statement. There are no income items
relating to STANLEY Security in the
first half year com para tives except for
transaction costs incurred by the Group
prior to the date of acqui sition. In the
January–December 2022 income state-
ment STANLEY Security is included
from the date of consolidation.
STANLEY Security is according to
Securitas’ definition of organic sales
growth excluded from the calcu lation of
this key ratio during the first 12 months
from July 22, 2022. When organic
sales growth for STANLEY Security
is referred to, this is an estimate of
how the acquired business is growing
organically but this contri bution is
excluded from Securitas’ organic sales
growth. Real sales growth includes the
contribution from STANLEY Security
as acquired sales are included in the
determination of this key ratio.
In the balance sheet STANLEY Security
is included as of June 30, 2023, but not
in the first half year 2022 comparative.
STANLEY Security is included in the
balance sheet as of December 31, 2022.
STANLEY Security is included in the
operating and free cash flow in thefirst
half year 2023, but not in the first half
year 2022 comparative. In the full year
2022 operating and free cash flow
thecontribution from STANLEY Security
is attributable to the period July 22 to
December 31, 2022.
In our segment reporting STANLEY
Security is included in Securitas North
America and Securitas Europe.
FINANCIAL SUMMARY
MSEK
Q2 Change, % H1 Change, % Full year Change, %
2023 2022 Total Real 2023 2022 Total Real 2022 Total
Sales
Organic sales growth, % 11 6 11 5 7
Operating income before
amortization
Operating margin, % 6.6 5.8 6.2 5.4 6.0
Amortization of acquisition-
related intangible assets – – – – –
Acquisition-related costs – – – – –
Items affecting comparability
1)
– – – – –
Operating income after
amortization
Financial income and expenses – – – – –
Income before taxes
Net income for the period
Earnings per share, SEK
2)
. . – – . . – – .
Earnings per share, before items
affecting comparability, SEK
2)
. . – – . . – – .
Cash flow from operating
activities, % 46 53 29 25 71
Free cash flow – –
Net debt to EBITDA ratio – – 3.7 2.2 4.0
1)
Refer to note 7 on page 28 for further information.
2)
Number of shares outstanding has been adjusted for the rights issue completed on October 11, 2022. For further information refer to Data per share on page 21.
4Securitas ABInterim ReportQ2 2023|January–June 2023
ORGANIC SALES GROWTH AND OPERATING MARGIN DEVELOPMENT PER BUSINESS SEGMENT*
%
Organic sales growth Operating margin
Q2 H1 Q2 H1
2023 2022 2023 2022 2023 2022 2023 2022
Securitas North America – – . . . .
Securitas Europe . . . .
Securitas Ibero-America . . . .
Group . . . .
* The business segments have been renamed as of May 3, 2023.
FINANCIAL SUMMARY PER BUSINESS LINE
Business line
Sales,
MSEK
Real sales growth,
%
Operating income
before amort iza tion,
MSEK
Operating margin,
% % of Group sales
% of Group
operating income
before amortization
Q2 2023 H1 2023 Q2 2023 H1 2023 Q2 2023 H1 2023 Q2 2023 H1 2023 Q2 2023 H1 2023 Q2 2023 H1 2023
Security services . .
Technology and
solutions * * . .
Risk management
services and costs
for Group functions – – – – – – – –
Group . .
*
Excluding STANLEY Security real sales growth was 12 percent in the second quarter and 12 percent for the first half year.
For further information regarding the revenue from the Group’s business lines, refer to note 3.
5Securitas ABInterim ReportQ2 2023|January–June 2023 January–June summary
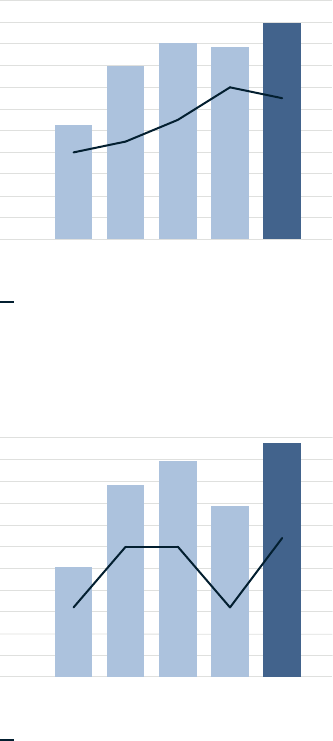
Organic sales growth, %
QUARTERLY SALES DEVELOPMENT
20 000
24 000
28 000
32 000
36 000
40 000
Q2
2023
Q1
2023
Q4
2022
Q3
2022
Q2
2022
M
SEK
30 535
36 013
38 091
37 751
39 9 0 9
–2
2
6
10
14
18
%
Operating margin, %
QUARTERLY OPERATING INCOME
DEVELOPMENT
1 000
1 3 0 0
1 6 0 0
1 9 0 0
2 20 0
2 5 0 0
Q2
2023
Q1
2023
Q4
2022
Q3
2022
Q2
2022
M
SEK
1760
2330
2491
2180
2 62 0
5.0
5.5
6.0
6.5
7.0
7.5
%
Group development
APRIL–JUNE 2023
SALES DEVELOPMENT
Sales amounted to MSEK 39 909
(30535) and organic sales growth to
11percent (6).
Securitas North America had 7 percent
(–1) organic sales growth driven by
the Guarding business unit. Securitas
Europe showed 13 percent (9), with
strong price increases across the busi-
ness and good growth within the air-
port security business and technology
and solutions. Securitas Ibero-America
reported 24 percent (17), driven by
price increases in the hyperinflationary
environment in Argentina. Extra sales in
the Group amounted to 13 percent (13)
of total sales.
Real sales growth, including acqui-
sitions and adjusted for changes in
exchange rates, was 25 percent (6).
Technology and solutions sales
amounted to MSEK 12 764 (7 095) or
32 percent (23) of total sales in the
quarter. Real sales growth, including
acquisitions and adjusted for changes
in exchange rates, was 73 percent (13)
with the acquired STANLEY Security
as the main contributor. Excluding
STANLEY Security, real sales growth
was 12 percent.
OPERATING INCOME
BEFORE AMORTIZATION
Operating income before amortization
was MSEK 2 620 (1 760) which, adjusted
for changes in exchange rates, repre-
sented a real change of 42 percent (8).
The Group’s operating margin was
6.6percent (5.8), an improvement
mainly driven by Securitas North
America where the business unit
Technology, including the acquired
STANLEY Security, was the main
contributor. The operating margin in
Securitas Europe improved primarily
through growth within technology and
solutions including STANLEY Security
and active portfolio management.
TheSecuritas Ibero-America operating
margin was on par with lastyear.
OPERATING INCOME
AFTER AMORTIZATION
Amortization of acquisition-related in-
tangible assets amounted to MSEK–157
(–61), whereof MSEK –92 (0) related to
the STANLEY Security acquisition.
Acquisition-related costs totaled
MSEK–2 (–15). For further information
refer to Acquisitions and divestitures
onpage 13 and note 6.
Items affecting comparability were
MSEK –311 (–226), whereof MSEK –170
(–57) related to the acquisition of
STANLEY Security and MSEK –141 (–169)
were related to the transformation
programs in Europe and Ibero-America.
For further information refer to note 7.
FINANCIAL INCOME AND EXPENSES
Financial income and expenses
amounted to MSEK –541 (–61), whereof
MSEK –402 (0) related to financing
of the STANLEY Security acquisition.
The impact from IAS 29 hyperinflation
was MSEK 26 (30) relating to the net
monetary gain. For further information
refer to note 8. Financial income and
expense also include foreign currency
gains, net, of MSEK 23 (16). Interest
income and expense excluding the
financing related to STANLEY Security
increased due to increased interest
rates.
INCOME BEFORE TAXES
Income before taxes amounted to
MSEK 1 609 (1 397).
TAXES, NET INCOME AND
EARNINGS PER SHARE
The Group’s tax rate was 26.8 percent
(27.0). The tax rate before tax on
items affecting comparability was
26.5 percent (25.0).
Net income was MSEK 1 178 (1 020).
Earnings per share before and after
dilution amounted to SEK 2.05 (2.32).
Earnings per share before and after
dilution and before items affecting
comparability amounted to SEK2.46
(2.77).
6Securitas ABInterim ReportQ2 2023|January–June 2023
JANUARY–JUNE 2023
SALES DEVELOPMENT
Sales amounted to MSEK 77 660
(59133) and organic sales growth to
11percent (5).
Securitas North America had 7 percent
(–1) organic sales growth driven by
the Guarding business unit. Securitas
Europe showed 13 percent (9), coming
from strong price increases across
the business, good portfolio growth
in the airport security business and
within solutions, and increased instal-
lation sales. Securitas Ibero-America
reported 24 percent (15), driven by
price increases in the hyperinflationary
environment in Argentina. Extra sales in
the Group amounted to 12 percent (13)
of total sales.
Real sales growth, including acqui-
sitions and adjusted for changes in
exchange rates, was 26 percent (5).
Technology and solutions sales
amounted to MSEK 24 785 (13 660) or
32 percent (23) of total sales in the first
half year. Real sales growth, including
acquisitions and adjusted for changes
in exchange rates, was 75 percent (11)
with the acquired STANLEY Security
as the main contributor. Excluding
STANLEY Security, real sales growth
was 12 percent.
OPERATING INCOME
BEFORE AMORTIZATION
Operating income before amortization
was MSEK 4 800 (3 212) which, adjusted
for changes in exchange rates, repre-
sented a real change of 42 percent (8).
The Group’s operating margin was
6.2percent (5.4), an improvement
mainly driven by Securitas North
America where the business unit
Technology, including the acquired
STANLEY Security, was the main
contributor. Theoperating margin in
Securitas Europe improved, supported
by growth within technology and
solutions including STANLEY Security
and active portfolio management.
InSecuritas Ibero-America the oper-
ating margin was on par with last year.
Price increases in the Group were on
par with wage cost increases in thefirst
six months.
OPERATING INCOME
AFTER AMORTIZATION
Amortization of acquisition-related in-
tangible assets amounted to MSEK–311
(–122), whereof MSEK –182 (0) related to
the STANLEY Security acquisition.
Acquisition-related costs totaled
MSEK–3 (–25). For further information
refer to Acquisitions and divestitures
onpage 13 and note 6.
Items affecting comparability were
MSEK –592 (–360), whereof MSEK–285
(–70) related to the acquisition of
STANLEY Security and MSEK –307
(–290) were related to the transform-
ation programs in Europe and Ibero-
America. For further information refer
to note 7.
FINANCIAL INCOME AND EXPENSES
Financial income and expenses
amounted to MSEK –969 (–156),
whereof MSEK –712 (0) related to
financing of the STANLEY Security
acqui sition. The impact from IAS 29
hyper inflation was MSEK 77 (42) relating
to the net monetary gain. For further
information refer to note 8. Financial
income and expense also include
foreign currency gains, net, of MSEK36
(20). Interest income and expense
excluding the financing related to
STANLEY Security increased due to
increased interest rates.
INCOME BEFORE TAXES
Income before taxes amounted to
MSEK 2 925 (2 549).
TAXES, NET INCOME AND
EARNINGS PER SHARE
The Group’s tax rate was 26.8 percent
(27.0). The tax rate before tax on
items affecting comparability was
26.6 percent (25.9).
Net income was MSEK 2 141 (1 861).
Earnings per share before and after
dilution amounted to SEK 3.71 (4.24).
Earnings per share before and after
dilution and before items affecting
comparability amounted to SEK 4.49
(4.91).
7Securitas ABInterim ReportQ2 2023|January–June 2023 Group development
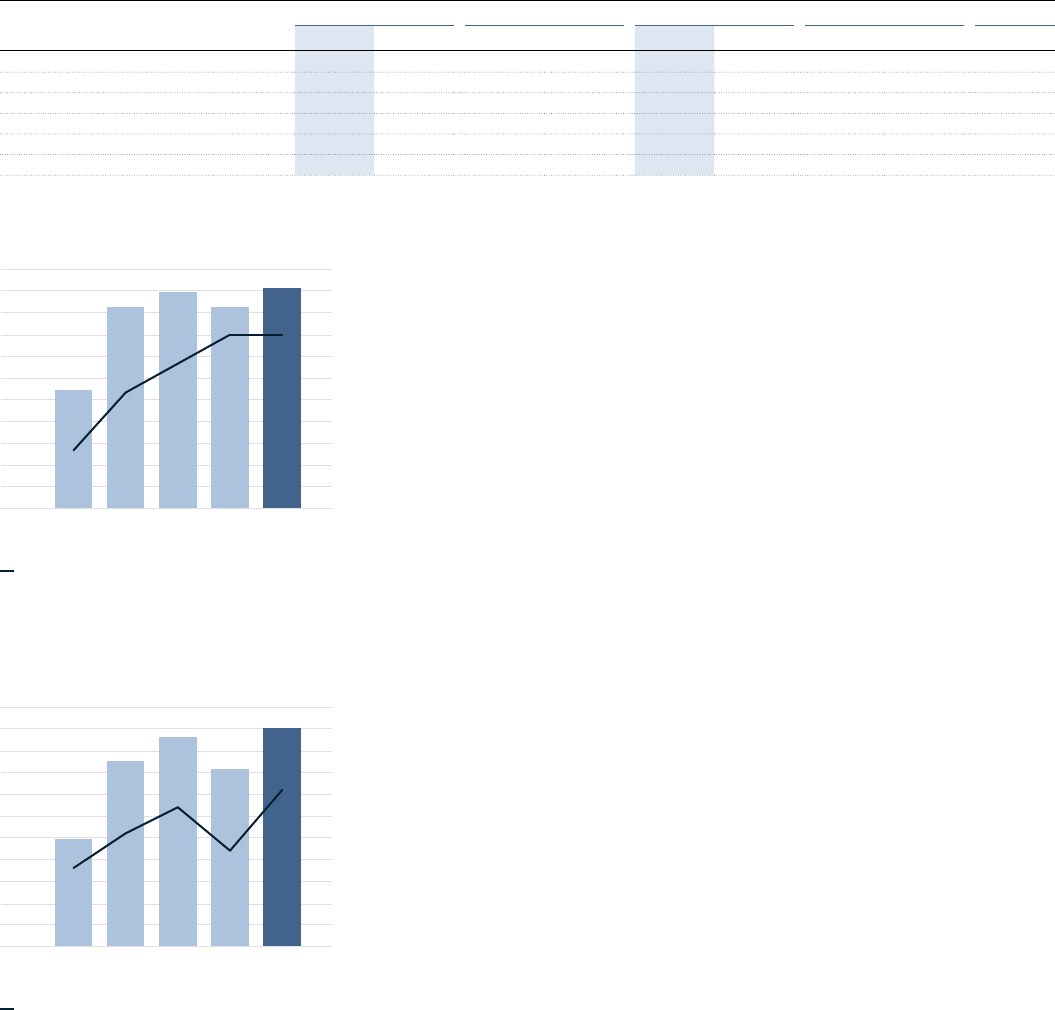
Organic sales growth, %
QUARTERLY SALES DEVELOPMENT
8 000
10 000
12 000
14 000
16 000
18 000
Q2
2023
Q1
2023
Q4
2022
Q3
2022
Q2
2022
13 434
17 281
17 986
17 2 90
1 8 145
M
SEK
–5
–2
1
4
7
10
%
Operating margin, %
QUARTERLY OPERATING INCOME
DEVELOPMENT
500
700
900
1 1 0 0
1 3 0 0
1 5 0 0
Q2
2023
Q1
2023
Q4
2022
Q3
2022
Q2
2022
M
SEK
994
1352
1463
1 3 1 8
1 5 0 4
6.5
7.0
7.5
8.0
8.5
9.0
%
Development in the Group’s
business segments
Securitas North America
Securitas North America provides protective services in the US, Canada and Mexico. The operations
in the US are organized in four specialized units – Guarding, Technology, Pinkerton Corporate Risk
Management and Critical Infrastructure Services. There is a unit for global and national clients as well as
specialized client segment units, such as aviation, healthcare, manufacturing, and oil and gas.
MSEK
Q2 Change, % H1 Change, % Full year
2023 2022 Total Real 2023 2022 Total Real 2022
Total sales
Organic sales growth, % 7 –1 7 –1 1
Share of Group sales, % 45 44 46 44 46
Operating income before amortization
Operating margin, % 8.3 7.4 8.0 6.9 7.5
Share of Group operating income, % 57 56 59 56 57
APRIL–JUNE 2023
Organic sales growth was 7 percent
(–1), primarily from strong growth in the
Guarding business unit driven by price
increases, good portfolio new sales and
a significant global guarding contract
renewed and expanded, as previously
com muni cated. By comparison, the
second quarter last year was hampered
by the termin ation of two significant
security contracts. The Technology
business unit also supported organic
sales growth with improved installation
sales and a continued healthy backlog.
Technology and solutions sales
accounted for MSEK 5 668 (2 586) or
31percent (19) of total sales in the busi-
ness segment, with real sales growth
of 111 percent (10) in the second quar-
ter. The acquired STANLEY Security
business in North America was the
main contributor to real sales growth,
although double-digit real sales growth
within solutions also supported.
The operating margin was 8.3 percent
(7.4), driven by the acquired STANLEY
Security business and strong cost syn-
ergies within the Technology business
unit. The operating margin in Guarding
was stable, supported by active port-
folio manage ment and leverage from
the strong topline growth but burdened
by cost of risk and medical expenses.
The Swedish krona exchange rate
weakened against the US dollar, which
had a positive impact on operating
income in Swedish kronor. Thereal
change was 44 percent (3) in the
second quarter.
JANUARY–JUNE 2023
Organic sales growth was 7 percent (–1),
driven by the business unit Guarding with
support from price increases, good port-
folio new sales and a signifi cant guarding
contract renewed and expanded, as
previously communicated. By com-
parison, the first six months last year
were hampered by the termination of two
significant security contracts. Organic
sales growth was also supported by the
Technology business unit from improved
installation sales and a con tinued healthy
backlog. The client retention rate was
88percent (85).
Technology and solutions sales
accounted for MSEK 11 083 (4 875) or
31 percent (19) of total sales in the busi-
ness segment, with real sales growth
of 118 percent (6) in the first half year.
Theacquired STANLEY Security business
in North America was the main con-
tri bu tor to real sales growth, although
double-digit real sales growth within
solutions also supported.
The operating margin was 8.0 percent
(6.9), driven by the acquired STANLEY
Security business within the business
unit Technology. The operating margin in
Guarding improved supported by active
portfolio management and leverage from
the strong topline growth, and Pinkerton
also improved in the first half year.
The Swedish krona exchange rate
weakened against the US dollar, which
had a positive impact on operating income
in Swedish kronor. The real change was
48 percent (5) in the first halfyear.
8Securitas ABInterim ReportQ2 2023|January–June 2023
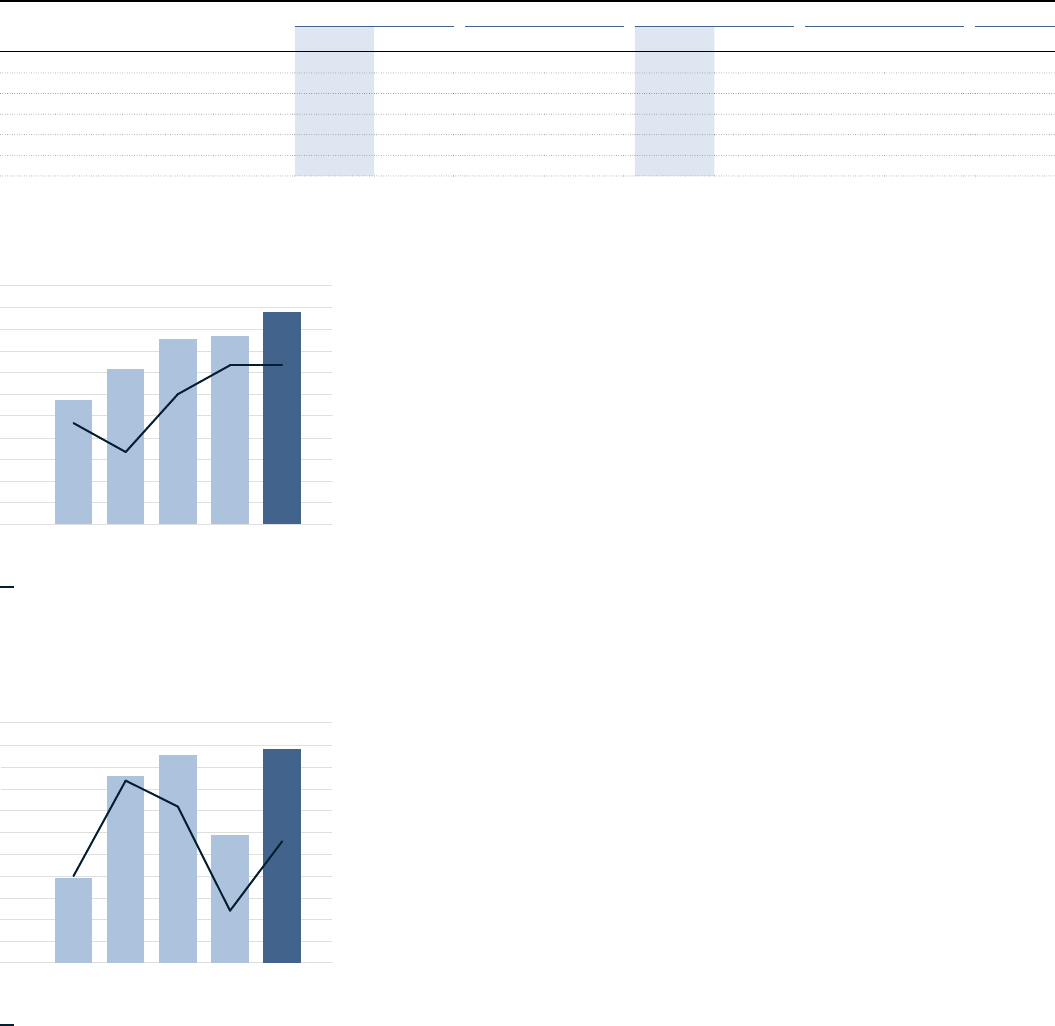
Organic sales growth, %
QUARTERLY SALES DEVELOPMENT
7 000
9 000
11 000
13 000
15 000
17 000
Q2
2023
Q1
2023
Q4
2022
Q3
2022
Q2
2022
12 715
14 152
15 530
1 5 7 04
16 7 8 4
M
SEK
2
5
8
11
14
17
%
Operating margin, %
QUARTERLY OPERATING INCOME
DEVELOPMENT
500
600
700
800
900
1 000
Q2
2023
Q1
2023
Q4
2022
Q3
2022
Q2
2022
M
SEK
695
930
978
794
992
4.5
5.0
5.5
6.0
6.5
7.0
%
Securitas Europe
Securitas Europe provides protective services in 21 countries. The full range of protective services
includes on-site, mobile and remote guarding, technology, fire and safety services and corporate
risk management. In addition, there are three specialized units for global clients, technology and
securitysolutions.
MSEK
Q2 Change, % H1 Change, % Full year
2023 2022 Total Real 2023 2022 Total Real 2022
Total sales
Organic sales growth, % 13 9 13 9 9
Share of Group sales, % 42 42 42 42 41
Operating income before amortization
Operating margin, % 5.9 5.5 5.5 5.2 5.9
Share of Group operating income, % 38 39 37 40 40
APRIL–JUNE 2023
Organic sales growth was 13 percent(9)
in the quarter, driven by strong price
increases, including the impact of
the hyperinflationary environment in
Türkiye. Organic sales growth was
also supported by a positive portfolio
development within the airport security
business and in solutions, as well as
increased installation sales.
Technology and solutions sales
accounted for MSEK 5 610 (3 210) or
33 percent (25) of total sales in the busi-
ness segment, with real sales growth of
68 percent (15) in the second quarter.
The acquired STANLEY Security
business in Europe was the main con -
tribu tor to real sales growth, although
double-digit real sales growth within
solutions also supported.
The operating margin was 5.9 percent
(5.5), an improvement primarily from
growth within technology and solu-
tions, including STANLEY Security
and active portfolio management.
However, increased costs related to
labor shortage, such as higher costs for
subcontracting, continued to hamper
the operating margin.
The Swedish krona exchange rate
weakened primarily against the euro
but was partly offset by the develop-
ment of the Turkish lira, which had
apositive impact on operating income
in Swedish kronor. The real change in
operating income was 37 percent (10)
inthe second quarter.
JANUARY–JUNE 2023
Organic sales growth was 13 percent (9)
in the first six months, driven by strong
price increases, including the impact
of the hyperinflationary environment in
Türkiye. Positive portfolio development
within the airport security business and
in solutions, as well as increased instal-
lation sales, also supported organic
sales growth. The client retention rate
was 90 percent (91).
Technology and solutions sales
accounted for MSEK 10 823 (6 269)
or 33 percent (25) of total sales in the
business segment, with real sales
growth of 68 percent (15) in the first half
year. Theacquired STANLEY Security
business in Europe was the main con-
tributor to real sales growth, although
double-digit real sales growth within
solutions also supported.
The operating margin was 5.5 percent
(5.2), an improvement mainly from
growth within technology and solu-
tions, including STANLEY Security and
active portfolio management. However,
the operating margin was hampered by
start-up costs within theairport secur-
ity business, increased costs related to
labor shortage, such as higher costs for
subcontracting, and negative leverage.
The Swedish krona exchange rate
weakened primarily against the euro
but was partly offset by the develop-
ment of the Turkish lira, which had
apositive impact on operating income
in Swedish kronor. The real change in
operating income was 33 percent (9)
inthe first half year.
9Securitas ABInterim ReportQ2 2023|January–June 2023 Development in the Group’s business segments
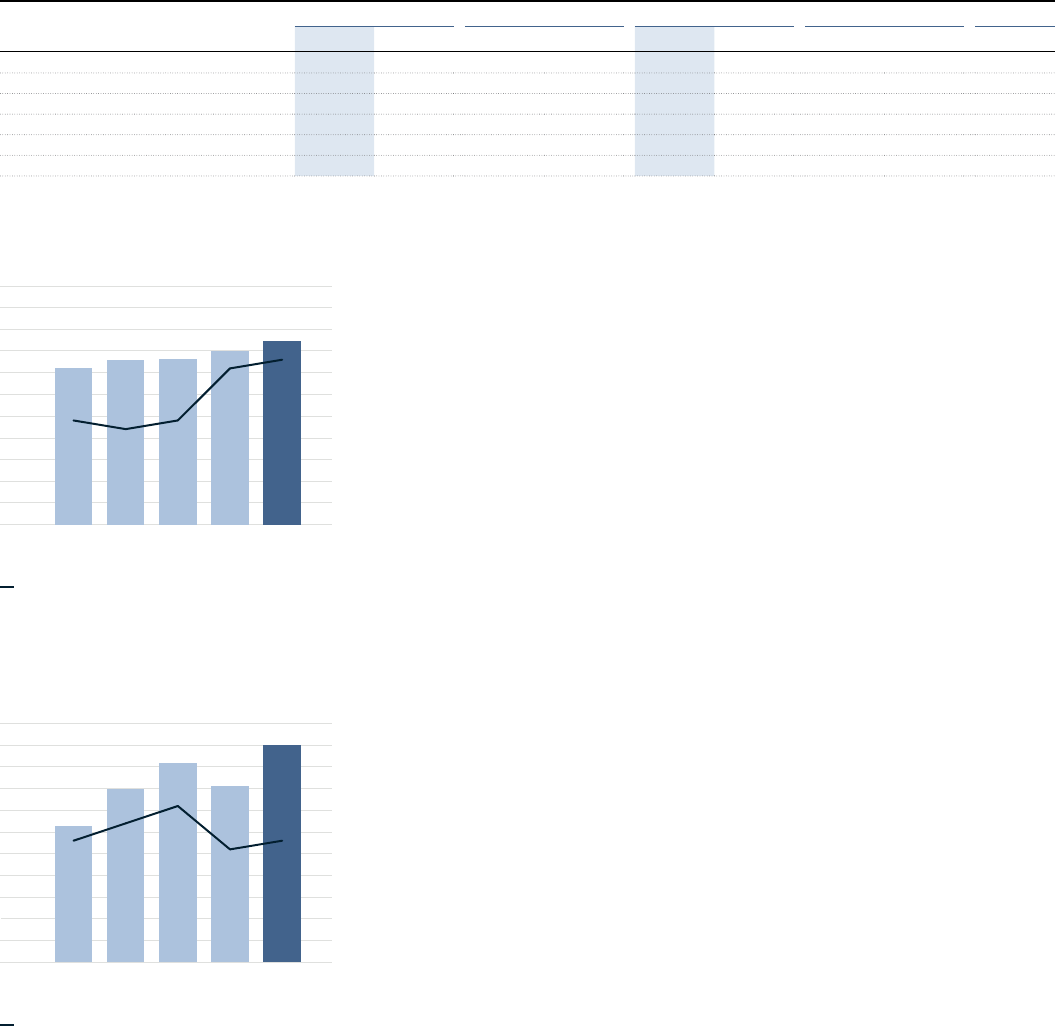
Organic sales growth, %
QUARTERLY SALES DEVELOPMENT
0
1 000
2 000
3 000
4 000
5 000
Q2
2023
Q1
2023
Q4
2022
Q3
2022
Q2
2022
M
SEK
3 609
3 790
3819
4 0 02
4 2 3 3
5
10
15
20
25
30
%
Operating margin, %
QUARTERLY OPERATING INCOME
DEVELOPMENT
150
170
190
210
230
250
Q2
2023
Q1
2023
Q4
2022
Q3
2022
Q2
2022
MSEK
213
230
242
231
250
4.5
5.0
5.5
6.0
6.5
7.0
%
Securitas Ibero-America
Securitas Ibero-America provides protective services in seven Latin American countries as well as
in Portugal and Spain in Europe. The offered services include on-site, mobile and remote guarding,
technology, fire and safety services, and corporate risk management.
MSEK
Q2 Change, % H1 Change, % Full year
2023 2022 Total Real 2023 2022 Total Real 2022
Total sales
Organic sales growth, % 24 17 24 15 16
Share of Group sales, % 11 12 11 12 11
Operating income before amortization
Operating margin, % 5.9 5.9 5.8 5.8 6.0
Share of Group operating income, % 10 12 10 13 11
APRIL–JUNE 2023
Organic sales growth was 24 percent
(17), driven by price increases primarily
in the hyperinflationary environment
in Argentina. Organic sales growth in
Spain was 3 percent (10), supported by
price increases and improved instal-
lation sales, but held back by active
portfolio management and a stronger
comparative figure. In Latin America,
organic sales growth continued on
ahigh level driven by price increases.
Technology and solutions sales
accounted for MSEK 1 305 (1 068) or
31percent (30) of total sales in the busi-
ness segment, with real sales growth of
17 percent (11) in the second quarter.
The operating margin was 5.9 percent
(5.9), supported by higher margin
technology and solutions sales and
portfolio management. Continued
wage pressure in Spain hampered, but
the situation improved compared to
the first quarter of 2023. The operating
margin in Latin America declined com-
pared to last year due to negative port-
folio development in a few countries.
The Swedish krona exchange rate
weakened primarily against the euro,
but was partly offset by the develop-
ment of the Argentinian peso, which
had a positive impact on oper ating
income in Swedish kronor. Thereal
change in the segment was 15percent
(25) in the second quarter.
JANUARY–JUNE 2023
Organic sales growth was 24 percent
(15), driven by price increases mainly
in the hyperinflationary environment
in Argentina. Organic sales growth in
Spain was 5 percent (10), supported by
price increases and improved instal-
lation sales, but held back by active
portfolio management and a stronger
comparative figure. Organic sales
growth continued on a high level in
Latin America driven by price increases.
The client retention rate was 92 percent
(92).
Technology and solutions sales
accounted for MSEK 2 529 (2 078) or
31percent (30) of total sales in the busi-
ness segment, with real sales growth of
17 percent (10) in the first half year.
The operating margin was 5.8 percent
(5.8), supported by higher margin tech-
nology and solutions sales and port-
folio management, but hampered by
wage pressure in Spain. The operating
margin in Latin America declined com-
pared to last year due to negative port-
folio development in a few countries.
The Swedish krona exchange rate
weakened primarily against the euro,
but was partly offset by the develop-
ment of the Argentinian peso, which
had a positive impact on oper ating
income in Swedish kronor. Thereal
change in the segment was 14percent
(24) in the first half year.
10Securitas ABInterim ReportQ2 2023|January–June 2023 Development in the Group’s business segments
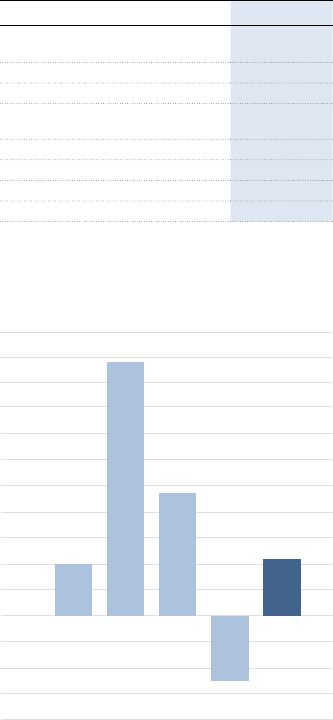
QUARTERLY FREE CASH FLOW
–1 000
–500
0
500
1 000
1 5 0 0
2 000
2 5 0 0
Q2
2023
Q1
2023
Q4
2022
Q3
2022
Q2
2022
MSEK
496
542
2438
1 175
–627
FREE CASH FLOW
MSEK Jan–Jun 2023
Operating income before
amortization
Net investments –
Change in accounts receivable –
Change in other operating capital
employed –
Cash flow from operating activities
Financial income and expenses paid –
Current taxes paid –
Free cash flow –
Cash flow
APRIL–JUNE 2023
Cash flow from operating activities
amounted to MSEK 1 199 (927), equiva-
lent to 46 percent (53) of operating
income before amortization.
The impact from changes in accounts
receivable was MSEK –1 283 (–873) and
was negatively impacted by organic
sales growth. Changes in other oper-
ating capital employed were MSEK 86
(191).
Free cash flow was MSEK 542 (496),
equivalent to 33 percent (39) of
adjusted income.
Cash flow from investing activities,
acquisitions and divestitures, was
MSEK–23 (–31). Refer to note 6 for
further information.
Cash flow from items affecting
compar ability amounted to MSEK–344
(–241). Refer to note 7 for further infor-
mation.
Cash flow from financing activities
was MSEK –92 (–646) due to dividend
paid of MSEK –1 003 (–1 604) and a net
increase in borrowings of MSEK 911
(958).
Cash flow for the period was MSEK 83
(–422).
JANUARY–JUNE 2023
Cash flow from operating activities
amounted to MSEK 1 386 (798), equiva-
lent to 29 percent (25) of operating
income before amortization.
The impact from changes in accounts
receivable was MSEK –1 892 (–1 321)
and was negatively impacted by
organic sales growth. Changes in
other oper ating capital employed were
MSEK–1229 (–899).
Financial income and expenses paid
was MSEK –872 (–273) reflecting the
increased interest cost relating mainly
to the acquisition of STANLEY Security.
Current taxes paid was MSEK –599
(–716).
Cash flow from operating activities
includes net investments in non-current
tangible and intangible assets, amount-
ing to MSEK –293 (–194), also including
capital expenditures in equipment for
solutions contracts. The net invest-
ments are the result of investments of
MSEK –2 066 (–1 588) and reversal of
depreciation of MSEK 1 773 (1 394).
Free cash flow was MSEK –85 (–191),
equivalent to –3 percent (–8) of
adjusted income.
Cash flow from investing activities,
acquisitions and divestitures, was
MSEK–28 (–38). Refer to note 6 for
further information.
Cash flow from items affecting compar-
ability amounted to MSEK –680 (–508).
Refer to note 7 for further information.
Cash flow from financing activities
was MSEK –70 (–843) due to dividend
paid of MSEK –1 003 (–1 604) and a net
increase in borrowings of MSEK 933
(761). A second dividend payment of
MSEK–974 will be made during the
fourth quarter compared to last year
when the total dividend amount was
paid in the second quarter. The total
dividend amounts to MSEK 1 977 (1 604).
Cash flow for the period was MSEK –863
(–1 580). The closing balance for liquid
funds after translation differences of
MSEK 31 was MSEK 5 491 (6 323 as of
December 31, 2022).
11Securitas ABInterim ReportQ2 2023|January–June 2023
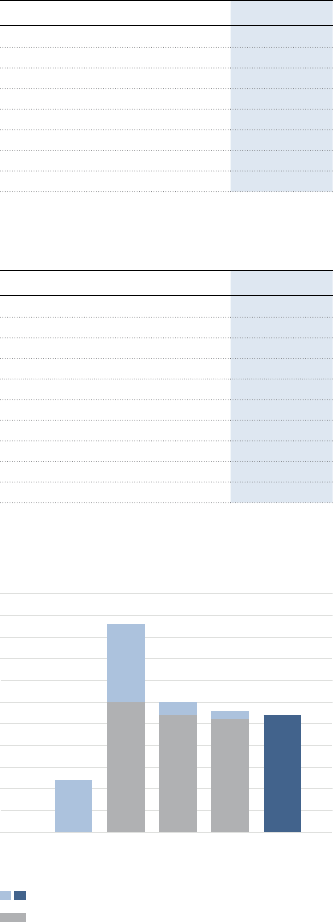
REPORTED NET DEBT/EBITDA
1.0
2.0
3.0
4.0
5.0
6.0
Q2
2023
Q1
2023
Q4
2022
Q3
2022
Q2
2022
2.2
4.0
4.0
3.7
3.8
3.7
3.6
5.8
Reported net debt/EBITDA
Adjusted net debt/EBITDA
Capital employed
andfinancing
CAPITAL EMPLOYED AS OF
JUNE 30, 2023
The Group’s operating capital
employed was MSEK 21 147 (18 377 as
of December 31, 2022), correspond-
ing to 13 percent of sales (13 as of
December 31, 2022), adjusted for the
full-year sales figures of acquired units.
Thetranslation of foreign operating
capital employed to Swedish kronor
increased the Group’s operating capital
employed by MSEK 652.
The Group’s total capital employed was
MSEK 81 683 (76 972 as of December
31, 2022). The translation of foreign
capital employed to Swedish kronor
increased the Group’s capital employed
by MSEK2 577. The return on capital
employed was 10 percent (9asof
December 31, 2022).
FINANCING AS OF JUNE 30, 2023
The Group’s net debt amounted to
MSEK 43 779 (40 534 as of Decem-
ber31, 2022). The net debt was
impacted mainly by a dividend of
MSEK–1 003, paid to the shareholders
in May 2023, translation differences
of MSEK –1 480, payments for items
affecting com par ability of MSEK –680,
free cash flow of MSEK –85 and lease
liabilities of MSEK27.
The net debt to EBITDA ratio was3.7
(2.2). The adjusted net debt to EBITDA
ratio was 3.7*. The free cash flow to
netdebt ratio amounted to 0.08 (0.14).
The interest coverage ratio amounted
to 5.3(14.7).
On June 30, 2023, Securitas had a
Revolving Credit Facility with its eleven
key relationship banks. The size of
thefacility amounted to MEUR 1 029,
ma tur ing 2027. The facility was un-
drawn on June 30, 2023.
A Swedish Commercial Paper Program
amounts to MSEK 5 000. MSEK 1 620
was outstanding as of June 30, 2023.
A debt bridge facility was used to
partly fund the acquisition of STANLEY
Security. The original debt bridge
facility amounted to MUSD 2 385and
has afinal maturity date of July 22,
2024. Inthe first quarter of 2023
amajority of the bridge was refinanced
through aMUSD 75 6-year Private
Placement, aMEUR 1 100 term loan
and a MEUR300 Schuldschein loan.
An additional MEUR 600 was repaid
on April4, 2023, from the proceeds of
a4-year Eurobond issue, reducing the
bridge facility balance to MUSD159
equivalent at end of June 2023. InJuly,
2023, the remaining balance of
MUSD159 of the debt bridge facility of
MUSD2385 raised for the acquisition
of STANLEY Security was repaid.
Standard & Poor’s rating of Securitas is
BBB- with stable outlook.
Further information regarding financial
instruments and credit facilities is
provided in note 9.
Shareholders’ equity amounted to
MSEK 37 904 (36 438 as of Decem-
ber31, 2022). The translation of foreign
assets and liabilities into Swedish
kronor increased shareholders’ equity
by MSEK 1 097. Refer to the statement
of comprehensive income on page 18
for further information.
The total adjusted number of shares
amounted to 572 917 552 (438 441 802)
as of June 30, 2023. Refer to page 21
forfurther information.
*
Includes STANLEY Security’s 12months adjusted estimated EBITDA.
CAPITAL EMPLOYED AND FINANCING
MSEK Jun 30, 2023
Operating capital employed
Goodwill
Acquisition-related intangible assets
Shares in associated companies
Capital employed
Net debt
Shareholders' equity
Financing
NET DEBT DEVELOPMENT
MSEK Jan–Jun 2023
Jan 1, 2023 –
Free cash flow –
Acquisitions/divestitures –
Items affecting comparability –
Dividend paid –
Lease liabilities
Change in net debt –
Revaluation
Translation –
Jun 30, 2023 –
12Securitas ABInterim ReportQ2 2023|January–June 2023

Acquisitions
and divestitures
DIVESTITURES AFTER
THE SECOND QUARTER
On July 25, 2023, the divestment of
Securitas Argentina to local manage-
ment was completed. Securitas is
exitingthe country due the weak macro -
economic prospects and challenging
business environment with limited
opportunity to execute our long-term
strategy and provide quality services
to our clients with healthy profit-
ability. Last12month’s sales based on
June 2023 of Securitas Argentina was
BSEK2.5,with an oper ating margin of
below average in Securitas Ibero-America.
Thedivestment will result in acapital
loss that is estimated to approximately
BSEK3.5, which will be recognized as an
item affecting compar ability inthethird
quarter of 2023. The estimated capital
loss mainly comprises accumulated
foreign currency losses. This impact is net
neutral in Group equity. The divestiture
has limited cash flow impact.
ACQUISITIONS AND DIVESTITURES JANUARY–JUNE 2023 (MSEK)
Company Business segment
1)
Included
from
Acquired
share
2)
Annual
sales
3)
Enterprise
value
4,7)
Goodwill
Acq. related
intangible
assets
Opening balance
Other acquisitions and divestitures
, )
– –
Total acquisitions and divestitures
January –June 2023
Amortization of acquisition-related intangible assets – –
Translation differences and remeasurement for
hyperinflation
Closing balance
1)
Refers to business segment with main responsibility for the acquisition.
2)
Refers to voting rights for acquisitions in the form of share purchase agreements. For asset deals no voting rights are stated.
3)
Estimated annual sales.
4)
Purchase price paid/received plus acquired/divested net debt but excluding any deferred considerations.
5)
Related to other acquisitions for the period and updated previous year acquisition calculations for the following entities: STANLEY Security, related to adjustments for several countries within
NorthAmerica and Europe, Draht+Schutz, Germany, Bewachungen ALWA (contract portfolio), Austria, DAK, Türkiye and Complete Security Integration, Australia. Related also to additional payment
received for the divestiture of Securitas Egypt as well as to deferred considerations paid in the US, Türkiye, Spain and Australia.
6)
Deferred considerations have been recognized mainly based on an assessment of the future profitability development in the acquired entities for an agreed period. The net of new deferred
considerations, payments made from previously recognized deferred considerations and revaluation of deferred considerations in the Group was MSEK –16. Total deferred considerations, short-term
and long-term, in the Group’s balance sheet amount to MSEK 110.
7)
Cash flow from acquisitions and divestitures amounts to MSEK –28, which is the sum of enterprise value MSEK –25 and acquisition-related costs paid MSEK –3.
All acquisition calculations are final-
ized no later than one year after the
acquisition is made. Transactions with
non-controlling interests are specified
in the statement of changes in share-
holders’ equity on page 21. Transaction
costs and revaluation of deferred con-
siderations can be found in note 6 on
page 27. Additional information regard-
ing the acquisition of STANLEY Security
can be found in note 13.
13Securitas ABInterim ReportQ2 2023|January–June 2023
Other significant
events
For critical estimates and judgments,
provisions and contingent liabilities
refer to the 2022 Annual Report and
to note 12 on page 30. If no significant
events have occurred relating to
theinformation in the Annual Report
no further comments are made in
theInterim Report for the respective
case.
OTHER SIGNIFICANT EVENTS
AFTERTHE BALANCE SHEET DATE
DIVESTMENT OF
SECURITASARGENTINA
On July 25, 2023, the divestment of
Securitas Argentina to local manage-
ment was completed. Last12month’s
sales based on June 2023 of Securitas
Argentina was BSEK2.5, with an
operating margin of below average
Risks and
uncertainties
Risk management is necessary for
Securitas to be able to fulfill its strat-
egies and achieve its corporate object-
ives. Securitas’ risks fall into three main
categories: operational risks, financial
risks and strategic risks and opportun-
ities. Securitas’ approach to enterprise
risk management is described in more
detail in the Annual Report for 2022.
In the preparation of financial reports,
the Board of Directors and Group
Management make estimates and
judgments. These impact the state-
ment of income and balance sheet as
well as disclosures such as contingent
liabilities. The actual outcome may
differ from these estimates and judg-
ments under different circumstances
and conditions.
Risks related to the general macro-
economic environment with the
increase in inflation, interest rates,
deterior ating insurance market, labor
shortages and supply chain issues
together with the changed geopolit-
ical situation in the world and lingering
effects from the corona pandemic
makes it difficult to predict the
economic development of the different
markets and geographies in which we
operate.
On July 22, 2022, Securitas completed
the acquisition of STANLEY Security.
The acquisition and integration of
new companies always carries certain
risks. The profitability of the acquired
company may be lower than expected
and/or certain costs in connection
with the acquisition may be higher than
expected.
Our transformation program in Europe
is being executed, although with
adelay into 2024, as we are currently
cali brating the program with the
STANLEY Security integration plan to
ensure we are maximising the cost and
benefit realization. The corresponding
program in Ibero-America is progress-
ing according to plan. The implemen-
tation and rollout of new systems and
platforms to support this transform-
ation naturally carries a risk in terms of
potential disruptions to our operations
that could result in a negative impact
on our result, cash flow and financial
position. This is mitigated by solid
change management and a phased
rollout on a country by country basis
over a longer period.
The geopolitical situation in the world
has changed radically with Russia’s
invasion of Ukraine at the end of
February 2022. We have no operations
either in Russia or in Ukraine but we
follow the development closely and con
-
tribute to a safer society where we can.
For the forthcoming six-month period,
the financial impact of the general
macro-economic environment
described above, the acquisition
and integration of STANLEY Security
including increased interest rates for
the acquisition-funding, the implemen
-
tation of new platforms as part of our
transformation programs, as well as
certain items affecting comparability,
provisions and contingent liabilities,
as described in the Annual Report for
2022 and, where applicable, under the
heading Other significant events above,
may vary from the current financial esti
-
mates and provisions made by manage-
ment. This could affect the Group’s
profitability and financial position.
inSecuritas Ibero-America. The divest-
ment will result in acapital loss that is
estimated to approxi mately BSEK3.5,
which will be recognized as an item
affecting compar ability inthethird
quarter of 2023. The estimated capital
loss mainly comprises accumulated
foreign currency losses. This impact
isnet neutral in Group equity. The
divesti ture has limited cash flow
impact.
14Securitas ABInterim ReportQ2 2023|January–June 2023
Parent Company
operations
JANUARY–JUNE 2023
The Parent Company’s income amounted to MSEK 982 (862) and mainly relates to
license fees and other income from subsidiaries.
Financial income and expenses amounted to MSEK 20 (5 299). The decrease
compared with last year is mainly explained by lower dividends received from
subsidiaries. Income before taxes amounted to MSEK 6 (5 601).
AS OF JUNE 30, 2023
The Parent Company’s non-current assets amounted to MSEK 66 680 (66 354 as
of December 31, 2022) and mainly comprise shares in subsidiaries of MSEK64076
(64040 as of December 31, 2022). Current assets amounted to MSEK 13 855
(11813as of December 31, 2022) of which liquid funds accounted for MSEK 2 725
(2376 as of December 31, 2022).
Shareholders’ equity amounted to MSEK 46 474 (48 282 as of December 31, 2022).
Total dividend amounts to MSEK 1 977 (1 604), whereof MSEK 1 003 (1 604) was paid
to the shareholders in May 2023. A second dividend payment will be made during
fourth quarter 2023 and has been reported as a non-interest-bearing current
liability.
The Parent Company’s liabilities and untaxed reserves amounted to MSEK 34 061
(29 885 as of December 31, 2022) and mainly consist of interest-bearing debt.
For further information, refer to the Parent Company’s condensed financial
statements on page 32.
The Group’s Parent Company,
Securitas AB, is not involved in any
operating activities. Securitas AB
consists of Group Management and
support functions for the Group.
15Securitas ABInterim ReportQ2 2023|January–June 2023
Signatures of the Board
of Directors
The Board of Directors and the President and CEO certify that the interim report gives a true and fair overview of
theParentCompany’s and Group’s operations, their financial position and results of operations, and describes significant
risks and uncertainties facing the Parent Company and other companies in the Group.
Stockholm, July 28, 2023
Jan Svensson
Chair
Åsa Bergman
Member
Ingrid Bonde
Member
John Brandon
Member
Fredrik Cappelen
Member
Gunilla Fransson
Member
Sofia Schörling Högberg
Member
Harry Klagsbrun
Member
Johan Menckel
Member
Åse Hjelm
Employee representative
Mikael Persson
Employee representative
Jan Prang
Employee representative
Magnus Ahlqvist
President and Chief Executive Officer
16Securitas ABInterim ReportQ2 2023|January–June 2023
Review report
This is a translation from the Swedish original
INTRODUCTION
We have reviewed the condensed interim report for Securitas AB as at June30,
2023, and for the six months period then ended. The Board of Directors and
thePresident and CEO are responsible for the preparation and presentation of this
interim report in accordance with IAS 34 and the Swedish Annual AccountsAct.
Ourresponsibility is to express a conclusion on this interim report based on
our review.
SCOPE OF REVIEW
We conducted our review in accordance with the International Standard on Review
Engagements, ISRE 2410 Review of Interim Financial Statements Performed
by theIndependent Auditor of the Entity. A review consists of making inquiries,
primarily of persons responsible for financial and accounting matters, and applying
analytical and other review procedures. A review is substantially less in scope than
an audit conducted in accordance with International Standards on Auditing and
other generally accepted auditing standards in Sweden.
The procedures performed in a review do not enable us to obtain assurance that
we would become aware of all significant matters that might be identified in an
audit. Accordingly, we do not express an audit opinion.
CONCLUSION
Based on our review, nothing has come to our attention that causes us to believe
that the interim report is not prepared, in all material respects, in accordance with
IAS 34 and the Swedish Annual Accounts Act regarding the Group, and in accord-
ance with the Swedish Annual Accounts Act regarding the Parent Company.
Stockholm, July 28, 2023
Ernst & Young AB
Rickard Andersson
Authorized Public Accountant
Securitas AB (publ), corporate identity
number 556302-7241
17Securitas ABInterim ReportQ2 2023|January–June 2023
Consolidated
financial statements
STATEMENT OF INCOME
MSEK Note Apr–Jun 2023 Apr–Jun 2022 Jan–Jun 2023 Jan–Jun 2022 Jan–Dec 2022
Sales
Sales, acquired business
Total sales
Organic sales growth, % 4 11 6 11 5 7
Production expenses – – – – –
Gross income
Selling and administrative expenses – – – – –
Other operating income
Share in income of associated companies
Operating income before amortization
Operating margin, % 6.6 5.8 6.2 5.4 6.0
Amortization of acquisition-related intangible assets – – – – –
Acquisition-related costs – – – – –
Items affecting comparability – – – – –
Operating income after amortization
Financial income and expenses , – – – – –
Income before taxes
Net margin, % 4.0 4.6 3.8 4.3 4.3
Current taxes – – – – –
Deferred taxes –
Net income for the period
Whereof attributable to:
Equity holders of the Parent Company
Non-controlling interests
Earnings per share before and after dilution (SEK)
1)
. . . . .
Earnings per share before and after dilution and
before items affecting comparability (SEK)
1)
. . . . .
1)
Number of shares outstanding has been adjusted for the rights issue completed on October 11, 2022. For further information refer to Data per share on page 21.
STATEMENT OF COMPREHENSIVE INCOME
MSEK Note Apr–Jun 2023 Apr–Jun 2022 Jan–Jun 2023 Jan–Jun 2022 Jan–Dec 2022
Net income for the period
Other comprehensive income for the period
Items that will not be reclassified to the statement of income
Remeasurements of defined benefit pension plans net of tax
Total items that will not be reclassified to
the statement of income
Items that subsequently may be reclassified to
the statement of income
Remeasurement for hyperinflation net of tax
Cash flow hedges net of tax – – –
Cost of hedging net of tax – – – – –
Net investment hedges net of tax – – – – –
Other comprehensive income from associated companies,
translation differences
Translation differences
Total items that subsequently may be reclassified to
the statement of income
Other comprehensive income for the period
Total comprehensive income for the period
Whereof attributable to:
Equity holders of the Parent Company
Non-controlling interests
18Securitas ABInterim ReportQ2 2023|January–June 2023
STATEMENT OF CASH FLOW
Operating cash flow MSEK Note Apr–Jun 2023 Apr–Jun 2022 Jan–Jun 2023 Jan–Jun 2022 Jan–Dec 2022
Operating income before amortization
Investments in non-current tangible and intangible assets – – – – –
Reversal of depreciation
Change in accounts receivable – – – – –
Change in other operating capital employed – –
Cash flow from operating activities
Cash flow from operating activities, % 46 53 29 25 71
Financial income and expenses paid – – – – –
Current taxes paid – – – – –
Free cash flow – –
Free cash flow, % 33 39 –3 –8 57
Cash flow from investing activities, acquisitions and divestitures – – – – –
Cash flow from items affecting comparability – – – – –
Cash flow from financing activities – – – –
Cash flow for the period – – –
Change in net debt MSEK Note Apr–Jun 2023 Apr–Jun 2022 Jan–Jun 2023 Jan–Jun 2022 Jan–Dec 2022
Opening balance – – – – –
Cash flow for the period – – –
Change in lease liabilities – – –
Change in loans – – – – –
Change in net debt before revaluation and translation
differences – – – – –
Revaluation of financial instruments 9 – – – –
Translation differences – – – – –
Change in net debt – – – – –
Closing balance – – – – –
Cash flow MSEK Note Apr–Jun 2023 Apr–Jun 2022 Jan–Jun 2023 Jan–Jun 2022 Jan–Dec 2022
Cash flow from operations
Cash flow from investing activities – – – – –
Cash flow from financing activities – – – –
Cash flow for the period – – –
Change in liquid funds MSEK Note Apr–Jun 2023 Apr–Jun 2022 Jan–Jun 2023 Jan–Jun 2022 Jan–Dec 2022
Opening balance
Cash flow for the period – – –
Translation differences
Closing balance
19Securitas ABInterim ReportQ2 2023|January–June 2023 Consolidated financial statements
CAPITAL EMPLOYED AND FINANCING
MSEK Note Jun 30, 2023 Jun 30, 2022 Dec 31, 2022
Operating capital employed
Operating capital employed as % of sales 13 12 13
Return on operating capital employed, % 42 47 49
Goodwill
Acquisition-related intangible assets
Shares in associated companies
Capital employed
Return on capital employed, % 10 13 9
Net debt – – –
Shareholders’ equity
Net debt equity ratio, multiple 1.15 0.78 1.11
BALANCE SHEET
MSEK Note Jun 30, 2023 Jun 30, 2022 Dec 31, 2022
ASSETS
Non-current assets
Goodwill
Acquisition-related intangible assets
Other intangible assets
Right-of-use assets
Other tangible non-current assets
Shares in associated companies
Non-interest-bearing financial non-current assets
Interest-bearing financial non-current assets
Total non-current assets
Current assets
Non-interest-bearing current assets
Other interest-bearing current assets
Liquid funds
Total current assets
TOTAL ASSETS
MSEK Note Jun 30, 2023 Jun 30, 2022 Dec 31, 2022
SHAREHOLDERS’ EQUITY AND LIABILITIES
Shareholders’ equity
Attributable to equity holders of the Parent Company
Non-controlling interests
Total shareholders’ equity
Equity ratio, % 31 34 32
Long-term liabilities
Non-interest-bearing long-term liabilities
Long-term lease liabilities
Other interest-bearing long-term liabilities
Non-interest-bearing provisions
Total long-term liabilities
Current liabilities
Non-interest-bearing current liabilities and provisions
Current lease liabilities
Other interest-bearing current liabilities
Total current liabilities
TOTAL SHAREHOLDERS’ EQUITY AND LIABILITIES
20Securitas ABInterim ReportQ2 2023|January–June 2023 Consolidated financial statements
CHANGES IN SHAREHOLDERS’ EQUITY
MSEK
Jun 30, 2023 Jun 30, 2022 Dec 31, 2022
Attributable
to equity
holders of
the Parent
Company
Non-
controlling
interests Total
Attributable
to equity
holders of
the Parent
Company
Non-
controlling
interests Total
Attributable
to equity
holders of
the Parent
Company
Non-
controlling
interests Total
Opening balance January 1, 2023/2022
Total comprehensive income
for the period
Transactions with non-controlling interests – – – – – –
Share-based incentive schemes – – –
1)
– – – – – –
Rights issue – – – – – – –
Dividend to the shareholders
of the Parent Company
2)
– – – – – – – – –
Closing balance
June 30/December 31, 2023/2022
1)
Refers to an adjustment of non-vested shares of MSEK 2 related to Securitas’ short-term share-based incentive scheme 2021. Refers also to shares awarded under Securitas’ long-term share-based
incentive scheme 2020/2022 of MSEK
–33.
2)
Total dividend amounts to MSEK –1 977, whereof MSEK –1 003 was paid to the shareholders in May 2023. A second dividend payment of MSEK –974 will be made during the fourth quarter 2023.
DATA PER SHARE
SEK Apr–Jun 2023 Apr–Jun 2022 Jan–Jun 2023 Jan–Jun 2022 Jan–Dec 2022
Share price, end of period
1)
. . . . .
Earnings per share before and after dilution
1,2,3)
. . . . .
Earnings per share before and after dilution and
before items affecting comparability
1,2,3)
. . . . .
Dividend – – – – 3.45
5)
P/E-ratio after dilution and before items affecting comparability – – – –
Share capital (SEK)
Number of shares outstanding
1,2)
Average number of shares outstanding
1,2,4)
Treasury shares
1)
Share price, number of shares outstanding and the average number of shares outstanding have been adjusted for the rights issue completed on October 11, 2022. The bonus element of
therightsissue has in accordance with IAS 33 §64 been calculated and the number of shares are represented based on the fair value per share immediately before the exercise of the rights divided
by thetheorethical ex-rights fair value per share (SEK 85.72/SEK 71.28). The number of shares outstanding on October 11, 2022, increased by 208 333 655 shares in total and the total number of
outstanding shares on that date was 572 917 552 shares. Total number of shares, including treasury shares, as per the same date was 573 392 552 shares with a share capital of SEK 573 392 552.
2)
There are no convertible debenture loans. Consequently there is no difference before and after dilution regarding earnings per share and number of shares.
3)
Number of shares used for calculation of earnings per share includes shares related to the Group’s share based incentive schemes that have been hedged through swap agreements.
4)
Used for calculation of earnings per share.
5)
Dividend 2022 to be distributed to the shareholders in two payments of SEK 1.75 per share and SEK 1.70 per share, respectively. The first dividend of SEK 1.75 per share was distributed to
theshareholders inMay,2023. The second dividend payment will be made during the fourth quarter 2023.
21Securitas ABInterim ReportQ2 2023|January–June 2023 Consolidated financial statements

APRIL–JUNE 2023
MSEK
Securitas
North America
Securitas
Europe
Securitas
Ibero-America Other Eliminations Group
Sales, external –
Sales, intra-group – –
Total sales –
Organic sales growth, % 7 13 24 – – 11
Operating income before amortization – –
of which share in income of associated companies 3 0 – 14 – 17
Operating margin, % 8.3 5.9 5.9 – – 6.6
Amortization of acquisition-related intangible assets – – – – – –
Acquisition-related costs – – – – – –
Items affecting comparability – – – – – –
Operating income after amortization – –
Financial income and expenses – – – – – –
Income before taxes – – – – –
APRIL–JUNE 2022
MSEK
Securitas
North America
Securitas
Europe
Securitas
Ibero-America Other Eliminations Group
Sales, external –
Sales, intra-group – –
Total sales –
Organic sales growth, % –1 9 17 – – 6
Operating income before amortization – –
of which share in income of associated companies 2 – – 11 – 13
Operating margin, % 7.4 5.5 5.9 – – 5.8
Amortization of acquisition-related intangible assets – – – – – –
Acquisition-related costs – – – – –
Items affecting comparability – – – – – –
Operating income after amortization – –
Financial income and expenses – – – – – –
Income before taxes – – – – –
Segment overview
April–June 2023and2022
22Securitas ABInterim ReportQ2 2023|January–June 2023

JANUARY–JUNE 2023
MSEK
Securitas
North America
Securitas
Europe
Securitas
Ibero-America Other Eliminations Group
Sales, external –
Sales, intra-group – –
Total sales –
Organic sales growth, % 7 13 24 – – 11
Operating income before amortization – –
of which share in income of associated companies 4 0 – 24 – 28
Operating margin, % 8.0 5.5 5.8 – – 6.2
Amortization of acquisition-related intangible assets – – – – – –
Acquisition-related costs – – – – – –
Items affecting comparability – – – – – –
Operating income after amortization – –
Financial income and expenses – – – – – –
Income before taxes – – – – –
JANUARY–JUNE 2022
MSEK
Securitas
North America
Securitas
Europe
Securitas
Ibero-America Other Eliminations Group
Sales, external –
Sales, intra-group – –
Total sales –
Organic sales growth, % –1 9 15 – – 5
Operating income before amortization – –
of which share in income of associated companies 3 – – 19 – 22
Operating margin, % 6.9 5.2 5.8 – – 5.4
Amortization of acquisition-related intangible assets – – – – – –
Acquisition-related costs – – – – –
Items affecting comparability – – – – – –
Operating income after amortization – –
Financial income and expenses – – – – – –
Income before taxes – – – – –
Segment overview
January–June 2023and2022
23Securitas ABInterim ReportQ2 2023|January–June 2023

NOTE 1
Accounting principles
This interim report has been prepared in accordance with IAS 34 Interim
Financial Reporting and the Swedish Annual Accounts Act.
Securitas’ consolidated financial statements are prepared in
accordance with International Financial Reporting Standards (IFRS) as
endorsed by the European Union, the Swedish Annual Accounts Act and
the Swedish Financial Reporting Board’s standard RFR 1 Supplementary
Accounting Rules for Groups. The most important accounting principles
under IFRS, which is the basis for the preparation of this interim report,
can be found in note 2 on pages 67 to 73 in the Annual Report for 2022.
Theaccounting principles are also available on the Group’s website
www.securitas.com under the section Investors – Financial data –
Accounting Principles.
The Parent Company’s financial statements are prepared in accordance
with theSwedish Annual Accounts Act and the Swedish Financial Reporting
Board’s standard RFR 2 Accounting for Legal Entities. The most important
accounting principles used by the Parent Company can be found in note 41
on page 122 intheAnnual Report for 2022.
Introduction and effect of new and revised IFRS 2023
None of the published standards and interpretations that are mandatory for
the Group’s financial year 2023 are assessed to have any significant impact
on the Group’s financial statements.
Introduction and effect of new and revised IFRS 2024 or later
The effect on the Group’s financial statements from standards and
interpretations that are mandatory for the Group’s financial year 2024 or later
remain to be assessed.
Usage of key ratios not defined in IFRS
For definitions and calculations of key ratios not defined in IFRS, refer to
notes 4and5 in this interim report as well as to note 3 in the Annual Report
2022.
Notes
NOTE 2
Events after the balance sheet date
On July 25, 2023, the divestment of Securitas Argentina to local management
was completed. Securitas is exiting the country due the weak macro-
economic prospects and challenging business environment with limited
opportunity to execute our long-term strategy and provide quality services
to our clients with healthy profitability. Last12month’s sales based on June
2023 of Securitas Argentina was BSEK2.5, with an operating margin of below
average in Securitas Ibero-America. The divestment will result in acapital
loss that is estimated to approximately BSEK3.5, which will be recognized as
an item affecting comparability inthethird quarter of 2023. The estimated
capital loss comprises mainly accumulated foreign currency losses. This
impact is net neutral in Group equity. The divestiture has limited cash flow
impact.
There have been no other significant events with effect on the financial
reporting after the balance sheet date.
24Securitas ABInterim ReportQ2 2023|January–June 2023
NOTE 3
Revenue
MSEK Apr–Jun 2023 % Apr–Jun 2022 % Jan–Jun 2023 % Jan–Jun 2022 % Jan–Dec 2022 %
Security services
1)
Technology and solutions
Risk management services
1)
Total sales
Other operating income
Total revenue
1)
Comparatives have been restated for a move of certain ancillary business from Risk management services to Security services.
Security services
This comprises on-site and mobile guarding, which are services with
thesame revenue recognition pattern. Revenue is recognized over time,
astheservices are rendered by Securitas and simultaneously consumed
bythe client. Such services cannot be reperformed.
Technology and solutions
This comprises two broad categories regarding technology and solutions.
Technology consists of the sale of alarm, access control and video
installations comprising design, installation and integration (time, material
and related expenses). Revenue is recognized as per the contract, either
upon completion of the conditions inthe contract, or over time based
on thepercentage of completion. Remote guarding (in the form of alarm
monitoring services), that is sold separately and not as part of a solution,
is also included in this category. Revenue recognition is over time as this is
also a service that is rendered by Securitas and simultaneously consumed
by the clients. The category further includes maintenance services, that are
either performed upon request (time and material) with revenue recognition
at a point in time (when the work has been performed), or over time if part
of a service level contract with a subscription fee. Finally, there are also
product sales (alarms and components) without any design or installation.
Therevenue recognition is at a point in time (upon delivery).
Solutions are a combination of services such as on-site and / or mobile
guarding and/or remote guarding. These services are combined with
atechnology component in terms of equipment owned and managed by
Securitas and used in the provision of services. The equipment is installed
atthe client site. The revenue recognition pattern is over time, as theservices
are rendered by Securitas and simultaneously consumed by theclient.
Asolution normally constitutes one performance obligation.
Risk management services
This comprises various types of risk management services that are either
recognized over time or at a point in time depending on the type of service.
These services include risk advisory, security management, executive
protection, corporate investigations, due diligence and similar services.
Other operating income
Other operating income consists mainly of trade mark fees for the use of
theSecuritas brand name.
Revenue per segment
The disaggregation of revenue by segment is shown in the tables below. Totalsales agree to total sales in the segment overviews.
MSEK
Securitas
North America
Securitas
Europe
Securitas
Ibero-America Other Eliminations Group
Apr–Jun
2023
Apr–Jun
2022
Apr–Jun
2023
Apr–Jun
2022
Apr–Jun
2023
Apr–Jun
2022
Apr–Jun
2023
Apr–Jun
2022
Apr–Jun
2023
Apr–Jun
2022
Apr–Jun
2023
Apr–Jun
2022
Security services
1)
– –
Technology and
solutions – –
Risk management
services
1)
– – – – – – – –
Total sales – –
Other operating
income – – – – – – – –
Total revenue – –
1)
Comparatives have been restated for a move of certain ancillary business from Risk management services to Security services.
MSEK
Securitas
North America
Securitas
Europe
Securitas
Ibero-America Other Eliminations Group
Jan–Jun
2023
Jan–Jun
2022
Jan–Jun
2023
Jan–Jun
2022
Jan–Jun
2023
Jan–Jun
2022
Jan–Jun
2023
Jan–Jun
2022
Jan–Jun
2023
Jan–Jun
2022
Jan–Jun
2023
Jan–Jun
2022
Security services
1)
– –
Technology and
solutions – –
Risk management
services
1)
– – – – – – – –
Total sales – –
Other operating
income – – – – – – – –
Total revenue – –
1)
Comparatives have been restated for a move of certain ancillary business from Risk management services to Security services.
25Securitas ABInterim ReportQ2 2023|January–June 2023 Notes

NOTE 4
Organic sales growth and currency changes
The calculation of real and organic sales growth and the specification of currency changes on operating income before and after amortization,
incomebeforetaxes, netincomeand earnings per share are specified below. The impact from remeasurement for hyperinflation due to theapplication
ofIAS29 is included in currency change.
MSEK Apr–Jun 2023 Apr–Jun 2022 % Jan–Jun 2023 Jan–Jun 2022 %
Total sales
Currency change from 2022 – – – –
Real sales growth, adjusted for changes in exchange rates
Acquisitions/divestitures – – – –
Organic sales growth
Operating income before amortization
Currency change from 2022 – – – –
Real operating income before amortization, adjusted for
changes in exchange rates
Operating income after amortization
Currency change from 2022 – – – –
Real operating income after amortization, adjusted for
changes in exchange rates
Income before taxes
Currency change from 2022 – – – –
Real income before taxes, adjusted for changes in exchange rates
Net income for the period
Currency change from 2022 – – – –
Real net income for the period, adjusted for changes in exchange rates
Net income attributable to equity holders of the Parent Company
Currency change from 2022 – – – –
Real net income attributable to equity holders of the Parent Company,
adjusted for changes in exchange rates
Average number of shares outstanding
1)
Real earnings per share, adjusted for changes in exchange rates . . – . . –
Net income attributable to equity holders of the Parent Company
Items affecting comparability net of taxes
Net income attributable to equity holders of the Parent Company,
adjusted for items affecting comparability
Currency change from 2022 – – – –
Real net income attributable to equity holders of the Parent Company,
adjusted for items affecting comparability and changes in exchange rates
Average number of shares outstanding
1)
Real earnings per share, adjusted for items affecting comparability and
changes in exchange rates . . – . . –
1)
Comparatives have been adjusted for the rights issue completed on October 11, 2022. For further information refer to Data per share on page 21.
26Securitas ABInterim ReportQ2 2023|January–June 2023 Notes
NOTE 5
Definitions and calculation of key ratios
The calculations below relate to the period January–June 2023.
Interest coverage ratio
Operating income before amortization (rolling 12 months) plus interest
income (rolling 12 months) in relation to interest expenses (rolling 12 months).
Calculation: (9 621 + 132) / 1 840 = 5.3
Cash flow from operating activities, %
Cash flow from operating activities as a percentage of operating income
before amortization.
Calculation: 1 386 / 4 800 = 29%
Free cash flow as % of adjusted income
Free cash flow as a percentage of adjusted income (operating income
before amortization adjusted for financial income and expenses, excluding
revaluation of financial instruments, and current taxes).
Calculation: –85 / (4 800 – 969 – 4 – 816) = –3%
Free cash flow in relation to net debt
Free cash flow (rolling 12 months) in relation to closing balance net debt.
Calculation: 3 528 / 43 779 = 0.08
Net debt to EBITDA ratio
Net debt in relation to operating income after amortization (rolling 12 months)
plus amortization of acquisition-related intangible assets (rolling 12 months)
and depreciation (rolling12months).
Calculation: 43 779 / (7 673 + 603 + 3 499) = 3.7
Operating capital employed as % of total sales
Operating capital employed as a percentage of total sales adjusted for
thefull-year sales of acquired and divested entities.
Calculation: 21 147 / 158 281 = 13%
Return on operating capital employed
Operating income before amortization (rolling 12 months) plus items
affecting comparability (rolling 12 months) as a percentage of the average
balance of operatingcapitalemployed.
Calculation: (9 621 – 1 318) / ((21 147 + 18 377) / 2) = 42%
Return on capital employed
Operating income before amortization (rolling 12 months) plus items
affecting comparability (rolling 12 months) as a percentage of closing
balance of capital employed.
Calculation: (9 621 – 1 318) / 81 683 = 10%
Net debt equity ratio
Net debt in relation to shareholders’ equity.
Calculation: 43 779 / 37 904 = 1.15
NOTE 6
Acquisition-related costs and cash flow from acquisitions and divestitures
MSEK Apr–Jun 2023 Apr–Jun 2022 Jan–Jun 2023 Jan–Jun 2022 Jan–Dec 2022
Restructuring and integration costs – – –
Transaction costs – – –
Revaluation of deferred considerations – – – – –
Total acquisition-related costs – – – – –
Cash flow impact from acquisitions and divestitures
Purchase price payments – – – – –
Assumed net debt – –
Acquisition-related costs paid – – – – –
Total cash flow impact from acquisitions and divestitures – – – – –
For further information regarding the Group’s acquisitions, refer to the section Acquisitions and divestitures and in addition relating to acquisition-related
costs for the acquisition of STANLEY Security to note 7 and 13.
27Securitas ABInterim ReportQ2 2023|January–June 2023 Notes
NOTE 7
Items affecting comparability
MSEK Apr–Jun 2023 Apr–Jun 2022 Jan–Jun 2023 Jan–Jun 2022 Jan–Dec 2022
Recognized in the statement of income
Transformation programs, Group
1)
– – – – –
Acquisition of STANLEY Security
2)
– – – – –
Total recognized in operating income after amortization – – – – –
Financial income and expenses
3)
– – – – –
Total recognized in income before taxes – – – – –
Taxes
4)
Total recognized in net income for the period – – – – –
Cash flow impact
Transformation programs, Group
1)
– – – – –
Cost-savings program, Group
5)
– – – – –
Cost-savings program, Securitas Europe
6)
– –
Acquisition of STANLEY Security
2)
– – – – –
Total cash flow impact – – – – –
1)
Related to the previously announced business transformation program in Securitas North America, Securitas Europe and Securitas Ibero-America, aswellasthe previously announced global
IS/IT transformation program. The business transformation program in Securitas North America and the global IS/IT transformation program were finalized in 2021 but stillimpacted cash flow 2022.
2)
Related to transaction costs, restructuring and integration costs.
3)
Interest expense and fees relating to the MUSD 915 bridge facility repaid on October 18, 2022. This financing cost is considered as an item affecting comparability as it is repaid by the proceeds
fromthe rights issue and will consequently not result in any further impact in the statement of income after October 18, 2022. The cost recognized above relates to the period July 22, 2022,
toOctober18, 2022.
4)
Including reversal of a tax provision in Spain of MSEK 151 in 2022.
5)
Related to the cost savings program in the Group that was communicated in 2020. Includes costs related to exit of business operations while cash flow related to exit of business operations
isaccounted for as cash flow from investing activities. This program was finalized in 2021 but still impacts cash flow.
6)
Related to the cost savings program in Securitas Europe. This program was finalized in 2018 but still impacts cash flow.
NOTE 8
Remeasurement for hyperinflation
The Group’s subsidiaries in countries that according to IAS 29 Financial reporting in hyperinflationary economies are classified as hyperinflationary economies
are accounted for in the Group’s financial statements after remeasurement for hyperinflation. Securitas’ operations accounted for according to IAS 29 are
Argentina and, as from the second quarter of 2022, Türkiye.
The impact on the consolidated statement of income and other comprehensive income from the remeasurement according to IAS 29 is illustrated below.
Theindex used by Securitas fortheremeasurement of the financial statements is the consumer price index with base period January 2003 for Argentina and
base period January 2005 forTürkiye.
EXCHANGE RATES AND INDEX
Jun 30, 2023 Jun 30, 2022 Dec 31, 2022
Exchange rate Argentina, SEK/ARS . . .
Index, Argentina . . .
Exchange rate Türkiye, SEK/TRY . . .
Index, Türkiye . . .
NET MONETARY GAIN RECOGNIZED IN THE CONSOLIDATED STATEMENT OF INCOME
MSEK Apr–Jun 2023 Apr–Jun 2022 Jan–Jun 2023 Jan–Jun 2022 Jan–Dec 2022
Net monetary gain, Argentina
Net monetary gain, Türkiye
Total financial income and expenses
REMEASUREMENT IMPACT RECOGNIZED IN OTHER COMPREHENSIVE INCOME
MSEK Apr–Jun 2023 Apr–Jun 2022 Jan–Jun 2023 Jan–Jun 2022 Jan–Dec 2022
Remeasurement, Argentina
Remeasurement, Türkiye
Total remeasurement impact recognized in other comprehensive income
28Securitas ABInterim ReportQ2 2023|January–June 2023 Notes
NOTE 9
Financial instruments and credit facilities
Revaluation of financial instruments
Revaluation of financial instruments is recognized in the statement of income on the line financial income and expenses. Revaluation of cash flow hedges
(andthe subsequent recycling into the statement of income) is recognized in other comprehensive income on the line cash flow hedges. Cost of hedging
(andthe subsequent recyclinginto the state ment of income) is recognized on the corresponding line in other comprehensive income.
The amount disclosed in the specification of change in net debt is the total revaluation before tax in the table below.
MSEK Apr–Jun 2023 Apr–Jun 2022 Jan–Jun 2023 Jan–Jun 2022 Jan–Dec 2022
Recognized in the statement of income
Revaluation of financial instruments –
Deferred tax – – – – –
Impact on net income –
Recognized in the statement of comprehensive income
Cash flow hedges – – –
Cost of hedging – – – – –
Deferred tax
Total recognized in the statement of comprehensive income – – – –
Total revaluation before tax – – – –
Total deferred tax
Total revaluation after tax – – – –
Fair value hierarchy
The methods and assumptions used by the Group in estimating the fair value of the financial instruments are disclosed in note 7 in the Annual Report 2022.
Further information regarding the accounting principles for financial instruments is disclosed in note 2 in the Annual Report 2022.
There have been no transfers between any of the the valuation levels duringthe period.
MSEK
Quoted
market prices
Valuation techniques
using observable
marketdata
Valuation techniques
using non-observable
market data Total
June 30, 2023
Financial assets at fair value through profit or loss – –
Financial liabilities at fair value through profit or loss – – – –
Derivatives designated for hedging with positive fair value – –
Derivatives designated for hedging with negative fair value – – – –
December 31, 2022
Financial assets at fair value through profit or loss – –
Financial liabilities at fair value through profit or loss – – – –
Derivatives designated for hedging with positive fair value – –
Derivatives designated for hedging with negative fair value – – – –
Financial instruments by category – carrying and fair values
For financial assets and liabilities other than those disclosed in thetable below, fair value is deemed to approximate the carrying value.
Afullcomparison of fair value and carryingvalue for all financial assets andliabilities is disclosed in note 7 in the Annual Report for 2022.
MSEK
Jun 30, 2023 Dec 31, 2022
Carrying value Fair value Carrying value Fair value
Long-term loan liabilities
Short-term loan liabilities – –
Total financial instruments by category
29Securitas ABInterim ReportQ2 2023|January–June 2023 Notes
SUMMARY OF DEBT FINANCING AS OF JUNE 30, 2023
Type Currency
Total amount
(million)
Available amount
(million) Maturity
Multicurrency Term Facilities
1)
USD
EMTN Eurobond, 1.125% fixed EUR
EMTN private placement, fixed USD
EMTN private placement, fixed USD
EMTN private placement, floating SEK
EMTN private placement, floating SEK
EMTN Eurobond, 1.25% fixed EUR
Schuldschein dual currency facility EUR
Revolving Credit Facility EUR
EMTN private placement, fixed USD
EMTN private placement, fixed USD
Dual currency Term Facilities EUR
EMTN Eurobond, .25% fixed EUR UR
Schuldschein dual currency facility EUR
EMTN Eurobond, 0.25% fixed EUR
EMTN private placement, fixed USD
Commercial Paper (uncommitted) SEK n/a
1)
The original debt bridge facility amounted to MUSD 2 385 and has afinal maturity date of July 22, 2024. Inthe first quarter of 2023 a majority of the bridge was refinanced through a MUSD 75 6-year
Private Placement, a MEUR 1 100 term loan and a MEUR 300 Schuldschein loan. An additional MEUR 600 was repaid on April4, 2023, from the proceeds of a4-year Eurobond issue, reducing the bridge
facility balance to MUSD 159 equivalent at end of June 2023. In July, 2023, the remaining balance of MUSD 159 of the debt bridge facility of MUSD 2 385 raised for the acquisition of STANLEY Security
was repaid.
For further information regarding Multicurrency Term Facilities refer to Capital employed and financing on page 12.
NOTE 10
Deferred tax on other comprehensive income
MSEK Apr–Jun 2023 Apr–Jun 2022 Jan–Jun 2023 Jan–Jun 2022 Jan–Dec 2022
Deferred tax on remeasurements of defined benefit pension plans – – – – –
Deferred tax on remeasurement for hyperinflation – – – – –
Deferred tax on cash flow hedges –
Deferred tax on cost of hedging
Deferred tax on net investment hedges
Deferred tax on net investment hedges included in translation differences – – – – –
Total deferred tax on other comprehensive income – – –
NOTE 11
Pledged assets
MSEK Jun 30, 2023 Jun 30, 2022 Dec 31, 2022
Pension balances, defined contribution plans
1)
Total pledged assets
1)
Refers to assets relating to insured pension plans excluding social benefits.
NOTE 12
Contingent liabilities
MSEK Jun 30, 2023 Jun 30, 2022 Dec 31, 2022
Guarantees – – –
Guarantees related to discontinued operations
Total contingent liabilities
For critical estimates and judgments, provisions and contingent liabilities, refer to note 4 and note 39 in the Annual Report 2022 as well as to the section
Othersignificant events in this report.
30Securitas ABInterim ReportQ2 2023|January–June 2023 Notes
NOTE 13
Acquisition of STANLEY Security
Consolidation
On December 8, 2021, Securitas announced that it had signed an agreement
to acquire the Electronic Security Solutions business from Stanley
Black&DeckerInc. (“STANLEY Security”) for a purchase price of MUSD3200
onadebt and cash free basis. All regulatory conditions were approved as
communicated on July14, 2022. The transaction was completed on July22,
2022, and consolidated into Securitas as of the same date.
Preliminary purchase price allocation
The purchase price paid on July22, 2022, amounted to MSEK32 783 and
thepreliminary purchase price allocation includes goodwill of MSEK23771.
The final purchase price will depend on the final outcome of net working
capital reconciliation and adjustments for net debt. As of the date of the
publication of this report this reconciliation was still ongoing.
In the preliminary purchase price allocation identifiable assets and
liabilities are valued at fair value. Acquisition-related intangible assets
have been identified in the preliminary allocation for customer-related,
brand-related and technology-related intangible assets. Brand-related
intangible assets are deemed to have an indefinite useful life and is not
subject to amortization but will be tested yearly for impairment. Brand-
related intangible assets amount to MSEK 417 out of a total of acquisition-
related intangible assets of MSEK 5 450. Acquisition-related intangibles
that are subject to amortization have a useful life estimated from eight to
15years. Amortization amounted to MSEK –92 (0) for the second quarter and
MSEK–182 (0) for the first six months 2023.
Deferred taxes have been considered where applicable and where
identified tax losses carried forward have been valued when it is judged
thatthere will be taxable future income for which the tax losses can
beutilized.
The difference between the purchase price and the acquired net
assets including acquisition-related intangible assets is accounted for
asgoodwill. Goodwill is not subject to amortization but will be tested yearly
for impairment. Goodwill is made up of a number of components such as
synergies (commercial and cost synergies), trained workforce and the
increased geographical footprint.
The purchase price allocation has been based on available information
and will be subject to adjustments both in relation to the final purchase price
that will be adjusted for net debt and net working capital but also as further
information regarding facts and circumstances in existence as of July22,
2022, relating to the acquired entities becomes known, adjustments will be
made both in relation to acquired net assets, acquisition-related intangible
assets, taxes and consequently goodwill. Adjustments related to 2023 are
disclosed in the table below.
The acquisition is a combination of share purchase transactions and to
alesser extent asset transactions. In all share purchases the acquired share
corresponds to 100percent.
Transaction costs
Total transaction costs incurred from 2021 to June 30, 2023, amounted to
MSEK –253, whereof MSEK–0
(–) in the second quarter and MSEK –11
(–) for the first six months 2023. Transaction costs areincluded in items
affecting comparability. For further information see note 7.
ADJUSTMENTS OF PURCHASE PRICE ALLOCATION
ASOFJULY 22, 2022
MSEK
Fair value
acquisition
balance
Operating non-current assets –
Accounts receivable –
Other current assets –
Other liabilities
Total operating capital employed –
Goodwill
Acquisition-related intangible assets –
Total capital employed –
Net debt –
Total acquired net assets –
Purchase price paid –
Liquid funds in accordance with acquisition analysis –
Total impact on the Group’s liquid funds –
31Securitas ABInterim ReportQ2 2023|January–June 2023 Notes
STATEMENT OF INCOME
MSEK Jan–Jun 2023 Jan–Jun 2022 Jan–Dec 2022
License fees and other income
Gross income
Administrative expenses – – –
Operating income
Financial income and expenses
Income after financial items
Appropriations – – –
Income before taxes
Taxes –
Net income for the period
BALANCE SHEET
MSEK Jun 30, 2023 Jun 30, 2022 Dec 31, 2022
ASSETS
Non-current assets
Shares in subsidiaries
Shares in associated companies
Other non-interest-bearing non-current assets
Interest-bearing financial non-current assets
Total non-current assets
Current assets
Non-interest-bearing current assets
Other interest-bearing current assets
Liquid funds
Total current assets
TOTAL ASSETS
SHAREHOLDERS’ EQUITY AND LIABILITIES
Shareholders’ equity
Restricted equity
Non-restricted equity
Total shareholders’ equity
Untaxed reserves
Long-term liabilities
Non-interest-bearing long-term liabilities/provisions
Interest-bearing long-term liabilities
Total long-term liabilities
Current liabilities
Non-interest-bearing current liabilities
Interest-bearing current liabilities
Total current liabilities
TOTAL SHAREHOLDERS’ EQUITY AND LIABILITIES
Parent Company
32Securitas ABInterim ReportQ2 2023|January–June 2023
Securitas AB (publ.)
P.O. Box 12307, SE-102 28 Stockholm,
Sweden
Visiting address:
Lindhagensplan 70
Telephone: +46 10 470 30 00
Corporate registration number:
556302–7241
www.securitas.com
PRESENTATION OF THE INTERIM REPORT
Analysts and media are invited to participate in a telephone conference
onJuly28, 2023, at 2.30 p.m. (CEST) where President and CEO Magnus Ahlqvist
and CFOAndreas Lindback will present the report and answer questions.
The telephone conference will also be audio cast live via Securitas’ website
www.securitas.com
To follow the audio cast of the telephone conference via the web, please follow
thelink www.securitas.com/en/investors/webcasts-and-audiocasts/
A recorded version of the audio cast will be available at
www.securitas.com/en/investors/webcasts-and-audiocasts/
after the telephoneconference.
For further information, please contact:
Micaela Sjökvist, Vice President, Investor Relations +46 76 116 7443
ABOUT SECURITAS
Securitas is a world-leading safety and security solutions partner that helps
make your world a safer place. Almost nine decades of deep experience means
wesee what others miss. By leveraging technology in partnership with our clients,
combined with an innovative, holistic approach, we’re transforming the security
industry. With 358 000 employees in 45 markets, we see a different world and
create sustainable value for our clients by protecting what matters most – their
people and assets.
Group financial targets
Securitas has four financial targets:
• 8–10 percent technology and solutions annual average real sales growth
• 8 percent Group operating margin by year-end 2025, with a >10 percent
long-term operating margin ambition
• A net debt to EBITDA ratio below 3.0x
• An operating cash flow of 70–80 percent of operating income before
amortization
Financial information
FINANCIAL INFORMATION CALENDAR
November 7, 2023, app. 1.00 p.m. (CET)
Interim Report
January–September 2023
February 7, 2024, 8 a.m. (CET)
Full-Year Report
January–December 2023
For further information regarding
Securitas’ IR activities, refer to
www.securitas.com/en/investors/
financial-calendar/
This is information that Securitas AB is obliged to make public pursuant to the EU Market Abuse Regulation.
The information was submitted for publication, through the agency of the contact person set out above,
at 1.00 p.m. (CEST) on Friday, July 28, 2023.
33Securitas ABInterim ReportQ2 2023|January–June 2023
