1 (21)
YEAR-END REPORT 2023
Q4
Improved operating margin and strong cash flow for the year
Fourth quarter 2023
• Net sales decreased by 17% to SEK 8,605m (10,353).
Changes in exchange rates impacted with -1%. Planned
exits of low-margin petrol-powered business impacted
with -2%.
• Organic sales declined by 15%.
• Operating income was SEK -983m (-1,737) and the
operating margin was -11.4% (-16.8).
• Excluding items affecting comparability, the operating
income amounted to SEK -168m (-13) and the operating
margin was -1.9% (-0.1).
• Items affecting comparability amounted to
SEK -815m (-1,724), and was mainly related to the
expansion of the Group’s cost savings initiatives,
announced in October 2023 and a write-down related to
the acceleration of the strategic transformation,
announced in October 2022, see page 17.
• Earnings per share before dilution amounted to
SEK -1.77 (-2.44) and earnings per share after dilution
amounted to SEK -1.77 (-2.43).
• Cash flow from operations and investments amounted to
SEK -743m (-2,845). Direct operating cash flow was
SEK 523m (-1,261).
• Husqvarna Construction Division acquired Total Diamond
Products, based in the UK, see page 8.
January – December 2023
• Net sales decreased by 1% to SEK 53,261m (54,037).
Changes in exchange rates contributed with 5%.
Planned exits impacted with -1%.
• Organic sales declined by 5%.
• Operating income was SEK 3,880m (3,043) and the
operating margin was 7.3% (5.6).
• Excluding items affecting comparability, the operating
income amounted to SEK 4,970m (4,853) and the
operating margin was 9.3% (9.0).
• Items affecting comparability amounted to
SEK -1,090m (-1,810), and was mainly related to the
expansion of the Group’s cost savings initiatives,
announced in October 2023 and a write-down related to
the acceleration of the strategic transformation,
announced in October 2022, see page 17.
• Earnings per share before dilution amounted to
SEK 3.81 (3.39) and earnings per share after dilution
amounted to SEK 3.81 (3.38).
• Cash flow from operations and investments was
SEK 4,414m (-4,009). Direct operating cash flow was
SEK 6,541m (-572).
• The CO
2
emissions across the value chain have been
reduced by -44% (-32) compared to the 2015 base line.
• The Board of Directors will propose a dividend for 2023
of SEK 3.00 per share (3.00) to the Annual General
Meeting.
Financial summary
Q4 Q4 Jan-Dec Jan-Dec
2023
2022 ∆%
2023
2022 ∆%
Net sales
8,605 10,353 -17 53,261 54,037 -1
Organic growth*, % -15 8 -5 -1
Operating income (EBIT) -983 -1,737 43 3,880 3,043 28
Operating margin, % -11.4 -16.8 7.3 5.6
Operating income excl. items affecting comparability* -168 -13 4,970 4,853 2
Operating margin excl. items affecting comparability*, % -1.9 -0.1 9.3 9.0
Income after financial items -1,272 -1,963 35 2,878 2,581 12
Net income for the period -1,011 -1,392 27 2,177 1,932 13
Earnings per share before dilution, SEK -1.77 -2.44 27 3.81 3.39 12
Earnings per share after dilution, SEK -1.77 -2.43 27 3.81 3.38 13
Direct operating cash flow* 523 -1,261 141 6,541 -572
Operating working capital / net sales*, % 36.9 30.6 36.9 30.6
*Alternative Performance Measure, refer to "Definitions".
Group, SEKm
Husqvarna Group / Year-end report 2023
2 (21)
Improved operating margin and strong cash flow for the year
“During the year we continued to deliver on our
strategy, reinforced our positions in key segments as
well as achieved an improved operating margin and a
strong cash flow.
Challenging market conditions in the fourth quarter
The fourth quarter was characterized by a continuous
challenging market situation with lower demand. Group
net sales declined by 15% organically and operating
income, excluding items affecting comparability,
amounted to SEK -168m (-13).
In the Husqvarna Forest & Garden Division, sales of
professional robotic mowers and battery-powered
products were strong. However, sales of petrol-
powered wheeled products decreased significantly due
to lower demand and that we proactively are exiting
parts of this segment.
The Gardena Division delivered good growth in
Europe, driven by the watering category, but sales in
Orbit in North America declined. In the Husqvarna
Construction Division, the performance was solid in
emerging markets, however we experienced weaker
development in Europe and in North America in the
fourth quarter. We achieved an improved operating
income and operating margin, excluding items affecting
comparability, for both the Gardena and Construction
divisions driven by solid execution of cost savings as
well as operational efficiency measures.
Improved operating margin in all divisions for the year
For the full-year, Group net sales declined by 1%. The
operating margin, excluding items affecting
comparability, increased to 9.3% (9.0). This was driven
by our cost savings program, which delivered
SEK 380m as well as contribution from price increases
and lower costs for logistics. We improved the
operating margin for all three divisions. Direct operating
cash flow increased to SEK 6.5bn (-0.6), driven by
inventory reductions. The Board will propose to the
Annual General Meeting an unchanged dividend of
SEK 3.00 (3.00) for the year.
We are delivering on our strategic transformation
As part of our transformational journey, we are
focusing on growing in the areas of robotic mowers,
battery-powered products, watering and solutions for
the professional market. During the year, we
progressed on our operational ambitions, increasing
sales of robotic mowers to SEK 8.1bn (6.3), our share
of electrified solutions expanded to some 42% (34) of
our motorized products sales, and the number of
connected devices rose to 4.5m (3.6). With an
increased focus and new innovations, we have
strengthened our market positions in these segments
compared to the previous year. These product
segments have a high future growth potential and now
account for a larger share of our net sales.
The electrification ambition is the major driver to
consistently reduce our carbon footprint. To date, we
have reduced CO₂ emissions (Scope 1, 2 and 3) by
-44% compared with the base year of 2015. At present,
we have thus exceeded our target of a -35% reduction
by 2025. Our commitment to reducing CO₂ emission is
continuing, including our exploration of products using
alternative fuels.
I would like to express my gratitude to all colleagues
and partners for their hard work, exceptional
engagement and contribution this year. We are
dedicated to building a stronger Group while navigating
through ongoing market uncertainties. We have cost
savings and inventory management programs in place,
and we are prepared for 2024, backed by a strong
product lineup featuring many exciting innovative
product launches.”
Pavel Hajman, CEO

Husqvarna Group / Year-end report 2023
3 (21)
Financial Performance
Financial targets and performance
Husqvarna Group has three financial targets; organic
sales growth, operating margin and capital efficiency.
Fourth quarter
Net sales
Net sales for the fourth quarter decreased by 17% to
SEK 8,605m (10,353). Planned exits impacted with
-2% and changes in exchange rates impacted with
-1%. Organic sales declined 15%. Sales growth was
good for professional robotic mowers and battery-
powered products as well as aftermarket parts and
accessories. Sales for petrol-powered wheeled
products declined significantly during the quarter.
Operating income
Operating income for the fourth quarter amounted to
SEK -983m (-1,737) and the operating margin was
-11.4% (-16.8). Excluding items affecting comparability,
operating income decreased to SEK -168m (-13) and
the operating margin was -1.9% (-0.1). The decline
was mainly a result of lower volumes. This was partly
offset by cost savings, price increases and lower costs
for logistics. Acquisition related amortizations
amounted to SEK -58m (-58).
Changes in exchange rates had a negative impact of
approximately SEK 105m compared to last year,
mainly related to a stronger SEK.
Financial items net
Financial items net amounted to SEK -289m (-226).
The increase was related to higher interest rates.
Income after financial items
Income after financial items amounted to SEK -1,272m
(-1,963).
Taxes
Income tax amounted to SEK 261m (571).
Earnings per share
Net income for the period attributable to equity holders
of the Parent Company amounted to SEK -1,011m
(-1,390), corresponding to SEK -1.77 (-2.43) per share
after dilution.
January – December
Net sales
Net sales for the period decreased by 1% to
SEK 53,261m (54,037). Planned exits impacted with
-1% and changes in exchange rates contributed with
5%. Organic sales declined 5%. Sales growth was
strong for robotic mowers both for the residential and
professional segments as well as for battery-powered
products.
Operating income
Operating income for the period amounted to
SEK 3,880m (3,043) and the operating margin was
7.3% (5.6). Excluding items affecting comparability,
operating income increased to SEK 4,970m (4,853)
and was driven by price increases, lower costs for
logistics and cost savings. The operating margin
excluding items affecting comparability was 9.3% (9.0),
with improved operating margin in all divisions.
Acquisition related amortizations amounted to
SEK -230m (-225).
Changes in exchange rates had a negative effect of
approximately SEK 35m compared to last year.
Financial items net
Financial items net amounted to SEK -1,002m (-461).
The change was related to higher interest rates.
Income after financial items
Income after financial items amounted to SEK 2,878m
(2,581).
Taxes
Income tax amounted to SEK -702m (-649),
corresponding to an effective tax rate of 24.4% (25.1).
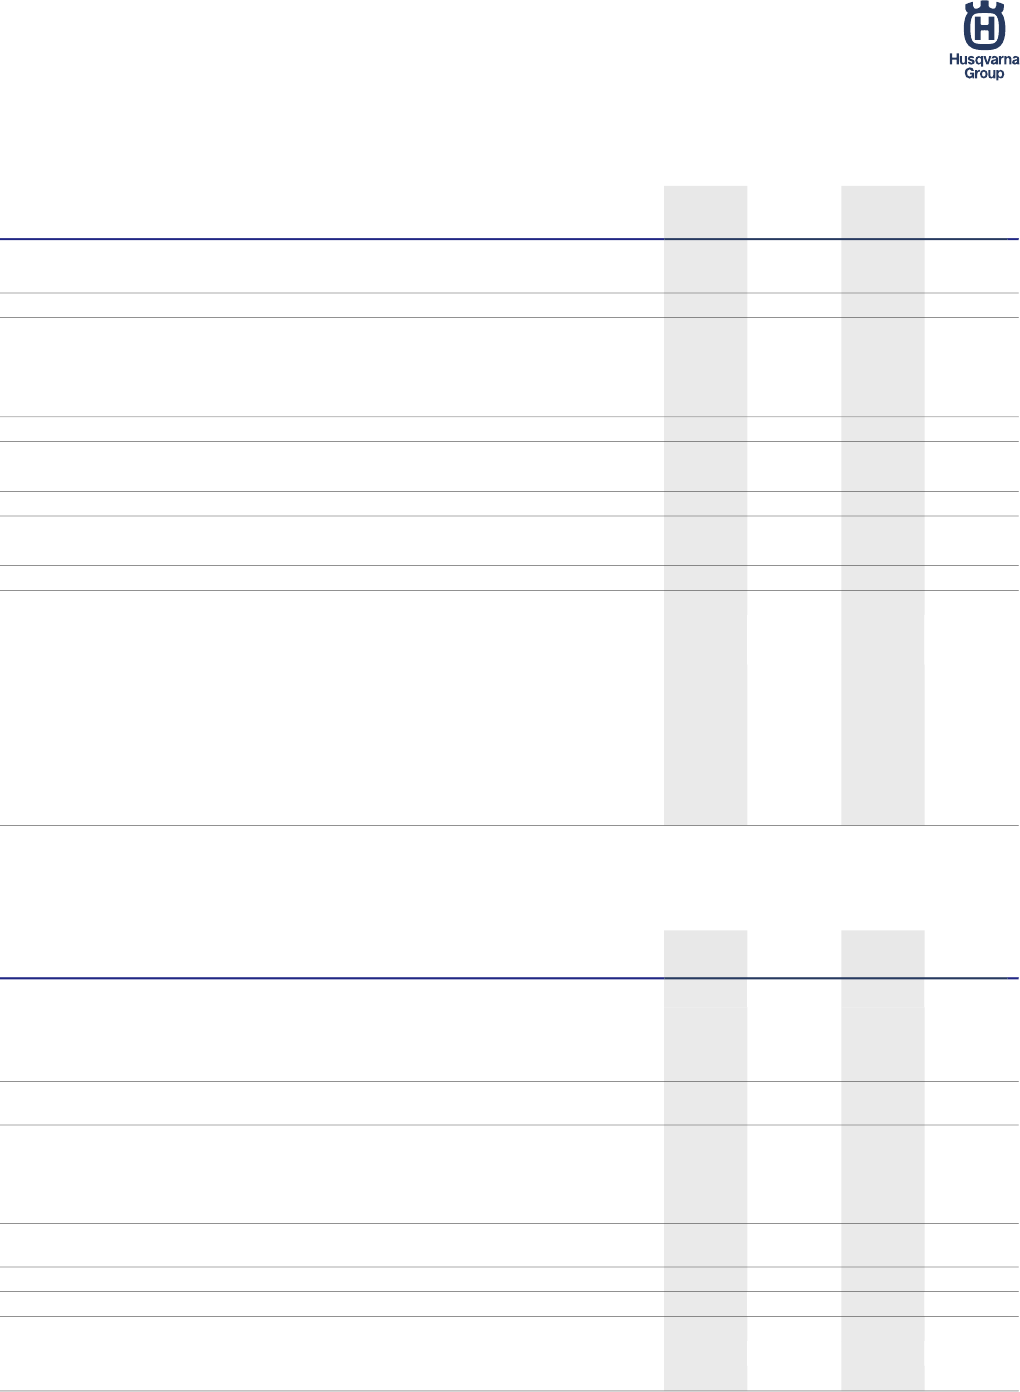
Metric
Financial
targets
Achievement
2022
Achievement
2023
Organic growth 5% -1% -5%
Operating margin* 13% 9.0% 9.3%
Capital efficiency** 20% 30.6% 36.9%
*Excluding items affecting comparability
**Operating working capital / net sales, rolling 12-months
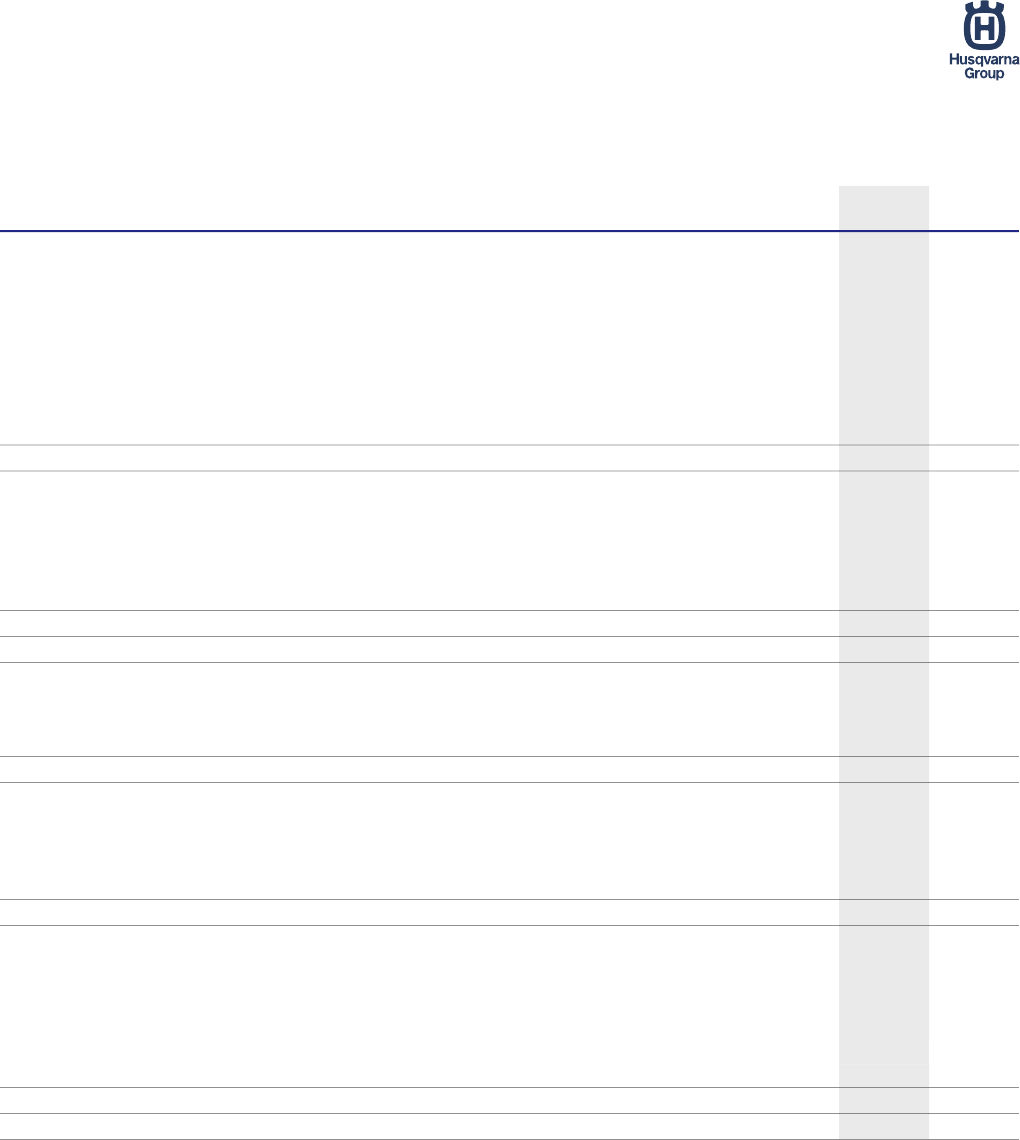
Net sales, SEKm
Operating income excl. IAC, SEKm
Operating margin excl. IAC
8,234
10,353
8,605
0
10,000
20,000
30,000
40,000
50,000
60,000
70,000
80,000
0
3,000
6,000
9,000
12,000
15,000
18,000
Q4-21
Q1-22
Q2-22
Q3-22
Q4-22
Q1-23
Q2-23
Q3-23
Q4-23
LTM
-180
-13
-168
-4,000
-2,000
0
2,000
4,000
6,000
8,000
10,000
12,000
-1,000
-500
0
500
1,000
1,500
2,000
2,500
3,000
Q4-21
Q1-22
Q2-22
Q3-22
Q4-22
Q1-23
Q2-23
Q3-23
Q4-23
LTM
-2.2%
-0.1%
-1.9%
-10%
-5%
0%
5%
10%
15%
20%
-10%
-5%
0%
5%
10%
15%
20%
Q4-21
Q1-22
Q2-22
Q3-22
Q4-22
Q1-23
Q2-23
Q3-23
Q4-23
LTM
Husqvarna Group / Year-end report 2023
4 (21)
Earnings per share
Net income for the period attributable to equity holders
of the Parent Company amounted to SEK 2,177m
(1,935), corresponding to SEK 3.81 (3.38) per share
after dilution.
Cash flow
Cash flow from operations and investments for the year
amounted to SEK 4,414m (-4,009). Direct operating
cash flow was SEK 6,541m (-572). The improvement
was related to a higher operating income and improved
cash flow from working capital changes. Cash flow from
change in inventories amounted to SEK 1,918m
(-3,832), cash flow from change in trade receivables
amounted to SEK 917m (-1,511) and cash flow from
change in trade payables amounted to
SEK -1,579m (-336).
Due to the seasonal build-up of working capital, cash
flow is normally weaker in the first quarter, followed
by stronger cash flow in the second and third quarters.
Cash flow in the fourth quarter is usually negatively
impacted by the pre-season production for the next
year.
Financial position
Group equity as of December 31, 2023, excluding non-
controlling interests, decreased to SEK 23,770m
(24,002), corresponding to SEK 41.6 (41.9) per share
after dilution. Net debt decreased to SEK 15,640m
(17,709). The decrease was mainly related to the strong
cash flow. The net pension liability increased to
SEK 1,994m (1,431). Other interest-bearing liabilities
decreased to SEK 17,245m (19,897) and liquid funds
and other interest-bearing assets decreased to
SEK 3,600m (3,618).
The net debt/EBITDA ratio, excluding items affecting
comparability, increased to 2.1 (1.8), mainly due to
higher borrowings on average. The equity/assets ratio
was 41% (39).
Husqvarna Forest & Garden Division
5 (21)
Financial summary
Fourth quarter 2023
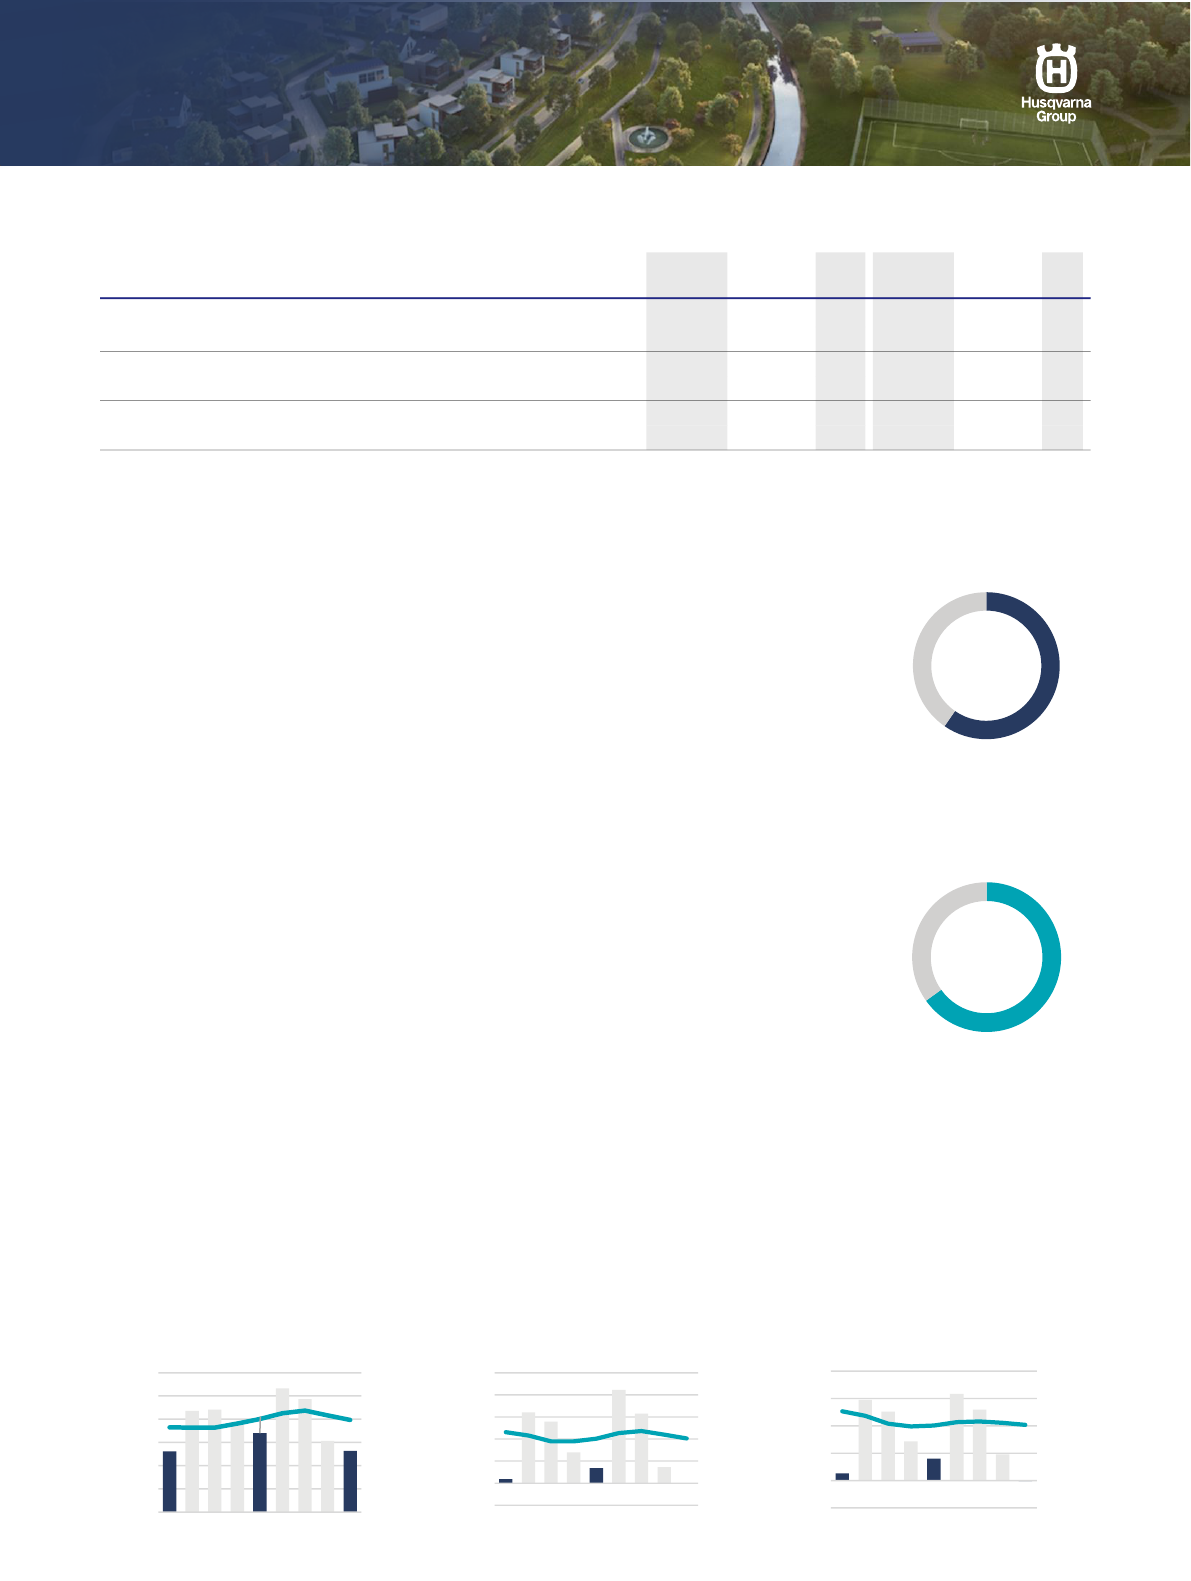
Net sales decreased by 23% to SEK 5,257m (6,793) during the quarter. Planned exits
impacted with -3% and changes in exchange rates contributed with 1%. Organic sales
declined by 21%. The segment for professional robotic mowers achieved a strong growth,
supported by an expanded product range. Sales of residential robotic mowers were lower
during the quarter compared to last year, which was positively impacted by an improved
supply situation and backlog deliveries in the second half of 2022. However, robotic mower
sales in the fourth quarter this year was above the same quarter in previous years. Sales of
petrol-powered wheeled products decreased significantly as a result of lower demand and
that the Group is proactively exiting parts of the segment in North America.
Operating income amounted to SEK -379m (-1,252) and the operating margin was
-7.2% (-18.4). Excluding items affecting comparability, operating income was SEK -7m
(273) and the operating margin was -0.1% (4.0). The decrease was mainly related to lower
volumes and partly offset by cost savings and lower costs for logistics. Changes in
exchange rates had a positive contribution of approximately SEK 10m compared with the
preceding year.
January - December 2023
Net sales decreased by 1% to SEK 31,759m (32,082). Planned exits impacted with -1%
and changes in exchange rates contributed with 4%. Organic sales declined by 4%. Sales
of robotic mowers and battery-powered products were strong during the year, supported by
the fact that a growing number of customers are choosing robotic mowers rather than
traditional wheeled lawn mowers. Growth was solid in the professional segment of robotic
mowers, including Husqvarna CEORA™. Husqvarna Automower® NERA was launched as
the Group’s first robotic mower to offer virtual boundary technology for the residential market.
Operating income amounted to SEK 2,706m (1,807) and the operating margin was 8.5% (5.6). Excluding items
affecting comparability, operating income amounted to SEK 3,236m (3,224) and the operating margin to 10.2%
(10.0). The improvement was mainly related to price increases, cost savings and lower logistics costs. Changes in
exchange rates had a positive contribution of approximately SEK 80m compared with the preceding year.
Q4 Q4 Jan-Dec Jan-Dec
SEKm
2023
2022 ∆%
2023
2022 ∆%
Net sales 5,257 6,793 -23 31,759 32,082 -1
Organic growth*, % -21 15 -4 0
Operating income -379 -1,252 70 2,706 1,807 50
Operating margin, % -7.2 -18.4 8.5 5.6
Operating income excl. items affecting comparability* -7 273 102 3,236 3,224 0
Operating margin excl. items affecting comparability*, % -0.1 4.0 10.2 10.0
* Alternative Performance Measure, refer to "Definitions".
Net sales, SEKm
Operating income excl. IAC, SEKm
Operating margin excl. IAC
Share of Group
net sales, LTM
Share of Group operating
income excl. IAC, LTM
5,231
6,793
5,257
0
8,000
16,000
24,000
32,000
40,000
48,000
0
2,000
4,000
6,000
8,000
10,000
12,000
Q4-21
Q1-22
Q2-22
Q3-22
Q4-22
Q1-23
Q2-23
Q3-23
Q4-23
LTM
70
273
-7
-1,600
0
1,600
3,200
4,800
6,400
8,000
-400
0
400
800
1,200
1,600
2,000
Q4-21
Q1-22
Q2-22
Q3-22
Q4-22
Q1-23
Q2-23
Q3-23
Q4-23
LTM
1.3%
4.0%
-0.1%
-5%
0%
5%
10%
15%
20%
-5%
0%
5%
10%
15%
20%
Q4-21
Q1-22
Q2-22
Q3-22
Q4-22
Q1-23
Q2-23
Q3-23
Q4-23
LTM
60%
65%
Gardena Division
6 (21)
Financial summary
Fourth quarter 2023
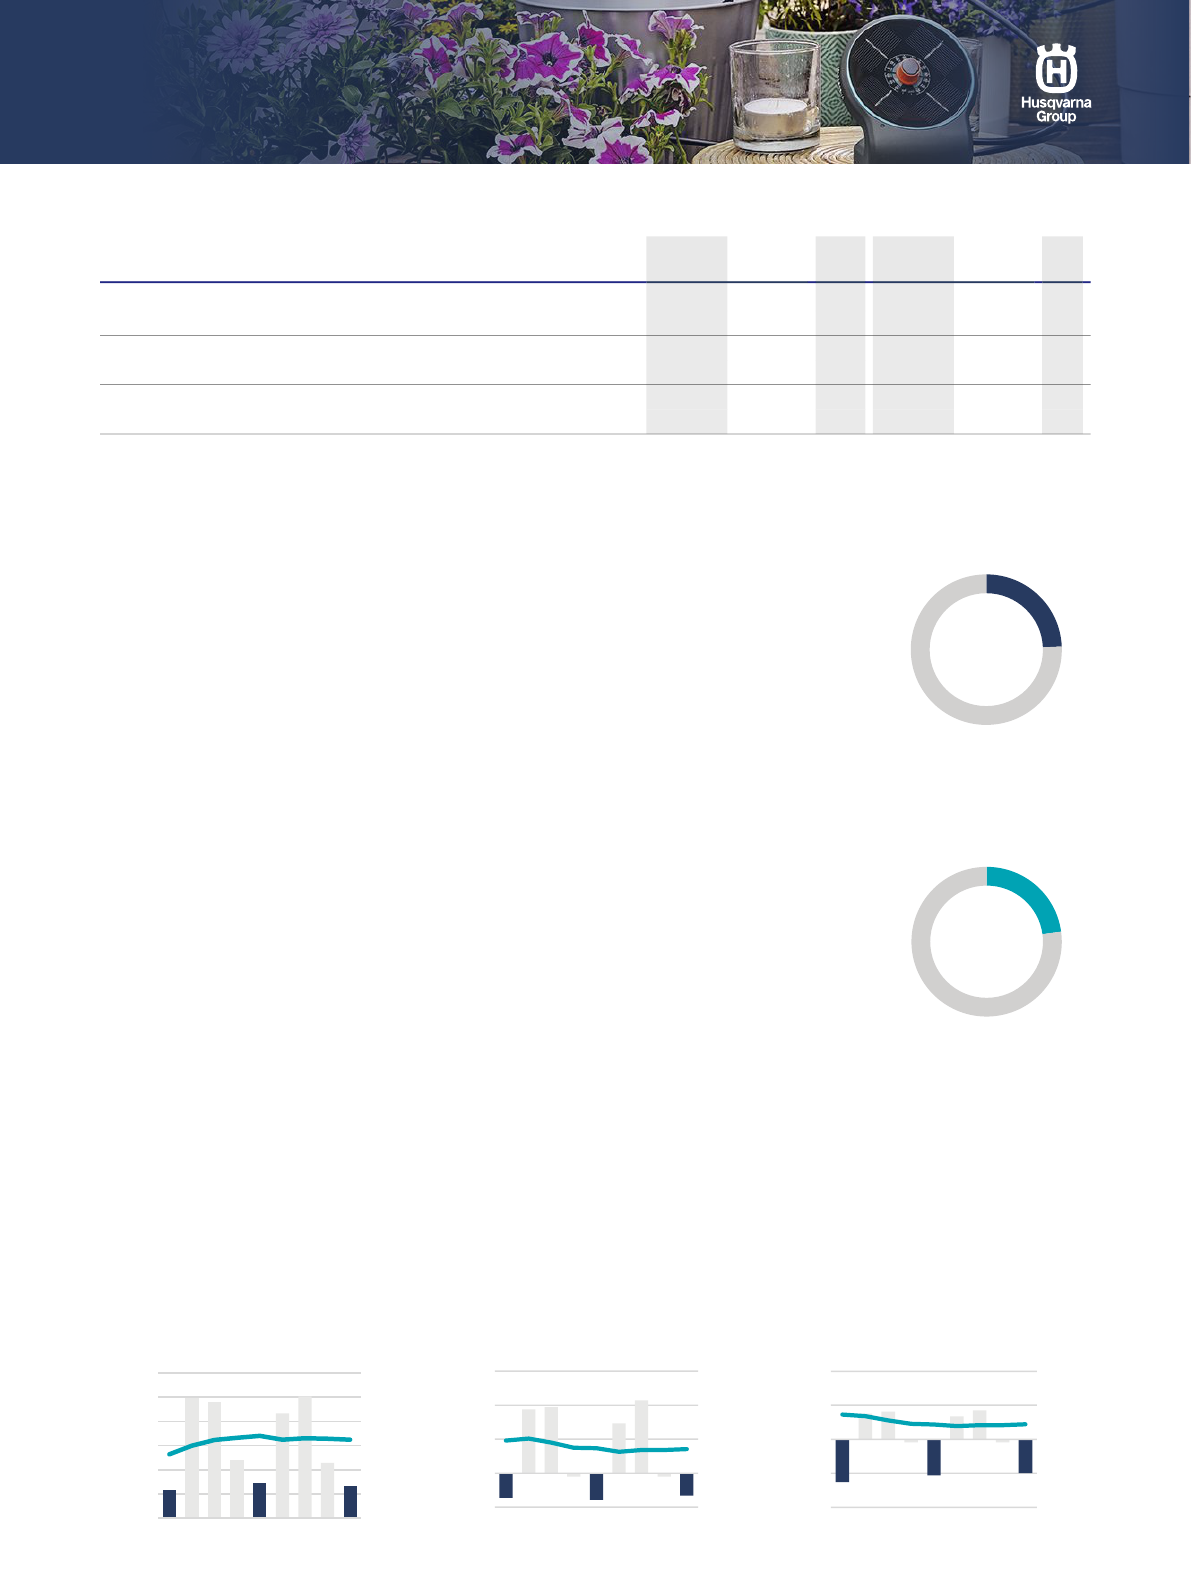
Net sales decreased by 10% to SEK 1,326m (1,470). Changes in exchange rates impacted
by -6%. Organic sales declined by 4%, with growth in the watering category in Europe, but
sales in Orbit in North America declined.
Operating income was SEK -407m (-468) and the operating margin was -30.7% (-31.8).
Excluding items affecting comparability, operating income improved to SEK -264m (-314)
and the operating margin was -19.9% (-21.4). Good cost control and cost savings as well
as lower logistics costs had a positive contribution. An improved operating income was
achieved despite that changes in exchange rates had an impact of approximately
SEK -145m compared with the preceding year.
Net sales growth for the acquired Orbit Irrigation was lower than the development for the
division overall but an improved operating margin was achieved. Orbit had an accretive
effect on the division of +5.1 ppts on the operating margin, excluding acquisition-related
amortization, which amounted to SEK -30m (-30).
January - December 2023
Net sales decreased by 5% to SEK 12,964m (13,606). Currency effects contributed with
5%. Organic sales declined by 10%.
Operating income was SEK 950m (918) and the operating margin amounted to 7.3% (6.8).
Excluding items affecting comparability, operating income amounted to SEK 1,136m
(1,173) and the operating margin improved to 8.8% (8.6). Price increases, good cost
control and lower logistics costs had a positive impact, while lower volumes had a negative
impact. The dilution effect from Orbit Irrigation was 0.3 ppts on the operating margin,
excluding acquisition-related amortization, which amounted to SEK -121m (-115). Changes in exchange rates had an
impact of approximately SEK -265m compared with the preceding year.
Q4 Q4 Jan-Dec Jan-Dec
SEKm
2023
2022 ∆%
2023
2022 ∆%
Net sales 1,326 1,470 -10 12,964 13,606 -5
Organic growth*, % -4 -11 -10 -7
Operating income -407 -468 13 950 918 3
Operating margin, % -30.7 -31.8 7.3 6.8
Operating income excl. items affecting comparability* -264 -314 16 1,136 1,173 -3
Operating margin excl. items affecting comparability*, % -19.9 -21.4 8.8 8.6
* Alternative Performance Measure, refer to "Definitions".
Net sales, SEKm
Operating income excl. IAC, SEKm
Operating margin excl. IAC
Share of Group
net sales, LTM
Share of Group operating
income excl. IAC, LTM
1,148
1,470
1,326
0
4,000
8,000
12,000
16,000
20,000
24,000
0
1,000
2,000
3,000
4,000
5,000
6,000
Q4-21
Q1-22
Q2-22
Q3-22
Q4-22
Q1-23
Q2-23
Q3-23
Q4-23
LTM
-290
-314
-264
-1,600
0
1,600
3,200
4,800
-400
0
400
800
1,200
Q4-21
Q1-22
Q2-22
Q3-22
Q4-22
Q1-23
Q2-23
Q3-23
Q4-23
LTM
-25.3%
-21.4%
-19.9%
-40%
-20%
0%
20%
40%
-40%
-20%
0%
20%
40%
Q4-21
Q1-22
Q2-22
Q3-22
Q4-22
Q1-23
Q2-23
Q3-23
Q4-23
LTM
24%
23%
Husqvarna Construction Division
7 (21)
Financial summary
Fourth quarter 2023
Net sales decreased by 5% to SEK 1,968m (2,071). Changes in exchange rates
contributed with 1%. Organic sales decreased by 6%, with growth in emerging markets but
a decline in Europe and North America.
Operating income amounted to SEK -4m (80) and the operating margin was -0.2% (3.9).
Excluding items affecting comparability, operating income increased to SEK 180m (127)
and the operating margin improved to 9.1% (6.1). The margin improvement was driven by
price increases, cost control and lower logistics costs. Acquisition-related amortization
amounted to SEK -26m (-26). Changes in exchange rates had a positive contribution of
approximately SEK 30m compared to preceding year. During the quarter, Total Diamond
Products, in the UK was acquired to strengthen our distribution capacity in the UK market.
The company has a yearly net sales of around GBP 1m.
January – December 2023
Net sales increased by 2% to SEK 8,398m (8,232). Changes in exchange rates and
acquisitions contributed with 5%. Organic sales declined by 3%. The division has expanded
its range of battery-powered products.
Operating income was SEK 755m (713) and the operating margin was 9.0% (8.7).
Excluding items affecting comparability, operating income increased to SEK 1,002m (854)
and the operating margin was 11.9% (10.4). The margin improvement was supported by
price increases, good cost control and lower logistics costs. Acquisition-related
amortization amounted to SEK -103m (-104). Changes in exchange rates had a positive
contribution of approximately SEK 150m compared to preceding year.
Q4 Q4 Jan-Dec Jan-Dec
SEKm
2023
2022 ∆%
2023
2022 ∆%
Net sales 1,968 2,071 -5 8,398 8,232 2
Organic growth*, % -6 -1 -3 2
Operating income -4 80 105 755 713 6
Operating margin, % -0.2 3.9 9.0 8.7
Operating income excl. items affecting comparability* 180 127 42 1,002 854 17
Operating margin excl. items affecting comparability*, % 9.1 6.1 11.9 10.4
* Alternative Performance Measure, refer to "Definitions".
Net sales, SEKm
Operating income excl. IAC, SEKm
Operating margin excl. IAC
Share of Group
net sales, LTM
Share of Group operating
income excl. IAC, LTM
1,830
2,071
1,968
0
2,000
4,000
6,000
8,000
10,000
0
500
1,000
1,500
2,000
2,500
Q4-21
Q1-22
Q2-22
Q3-22
Q4-22
Q1-23
Q2-23
Q3-23
Q4-23
LTM
144
127
180
0
200
400
600
800
1,000
1,200
1,400
0
50
100
150
200
250
300
350
Q4-21
Q1-22
Q2-22
Q3-22
Q4-22
Q1-23
Q2-23
Q3-23
Q4-23
LTM
7.9%
6.1%
9.1%
0%
4%
8%
12%
16%
20%
0%
4%
8%
12%
16%
20%
Q4-21
Q1-22
Q2-22
Q3-22
Q4-22
Q1-23
Q2-23
Q3-23
Q4-23
LTM
16%
20%

Husqvarna Group / Year-end report 2023
8 (21)
Additional information
Sustainovate 2025
Sustainovate 2025 is designed to maximize the
Group’s contribution to tackle climate change and
resource scarcity. The five-year framework covers
three opportunities and associated targets to 2025.
2025 targets & status
• Reduce absolute CO
2
emissions across the value
chain by -35% – current result is -44%.
• Launch 50 circular innovations – the number of
approved innovations are now 27.
• Empower 5 million People to make sustainable
choices – achieved so far is 1.9 million.
Carbon – drive the transition to low-carbon solutions
As of the fourth quarter 2023, the Group has further
reduced its CO
2
emissions of -4 percentage points
compared to Q3 2023 and exceeded the 2025 target.
The reduction is primarily linked to the product mix
driven by the electrification of the industry.
The CO
2
KPI is absolute and in direct relation to
volume performance which implies a rather volatile
behavior. Despite the clear long-term reduction trend,
fluctuations between quarters are expected to
continue.
Circular – rethink and redesign for a resource-smart
customer experience
The circular innovations will make smarter use of
materials and will extend product lifecycles. The target
addresses resource impacts across the value chain,
from suppliers and operations to product use and end-
of-life.
Five circular innovations were approved in the fourth
quarter:
• Husqvarna’s All Season Chain Oil is now made of
30% high quality re-refined oils, reducing the
consumption of virgin oil.
• New low-noise Gardena garden pumps, with
integrated scheduling function, reduces raw
material, water and energy consumption
compared to preceding solutions.
• Recycling of magnesium-rich industrial waste from
our production that now is used as an input
material in alloy production at Stena Aluminium,
reducing the need for virgin magnesium.
• A new robotic diagnostic tool enables advanced
diagnostics that facilitates repair and the
avoidance of replacement of functioning
components.
• In core drilling equipment, the diamond tools
naturally experience wear and occasional
breakage over extended usage. Retipping is the
remanufacturing of core drills where new
segments are brazed onto the old drill tube,
extending product lifetime and enabling cost
efficiency while reducing waste.
People – inspire actions that make a lasting
difference
During the fourth quarter, the Group has continued its
communication campaigns promoting sales of another
140 000 products qualified as Sustainable Choices.
Parent Company
Net sales for January – December 2023 for the Parent
Company, Husqvarna AB (publ), amounted to
SEK 23,454m (23,308), of which SEK 18,358m
(18,195) referred to sales to Group companies and
SEK 5,096m (5,113) to external customers. Income
after financial items increased to SEK 1,711m (1,378).
The administrative costs have increased mainly due to
a Group internal transaction. Income for the period
increased to SEK 1,525m (507). Investments in
property, plant and equipment and intangible assets
amounted to SEK 1,915m (3,423). Cash and cash
equivalents amounted to SEK 136m (410) at the end
of the quarter. Undistributed earnings in the Parent
Company amounted to SEK 29,042m (29,250).
Significant events
Changes to Group Management
As announced in October 2023, efforts were initiated
to increase organizational and operational efficiency.
As a result of this, the Group Strategy & Innovation
function was distributed into the existing Group
function management structures and Erik Winberg,
Executive Vice President Strategy & Innovation, left
Husqvarna Group on December 31, 2023.
Husqvarna Construction acquired Total
Diamond Products
Husqvarna Construction Division acquired Total
Diamond Products, in the UK. The company has a
yearly net sales of around GBP 1m.
Significant events after the quarter
Changes to Group Management
Pär Åström, President of the Gardena Division, has
decided to take a position outside of Husqvarna
Group. His last day at Husqvarna Group is planned to
be June 30, 2024.

Husqvarna Group / Year-end report 2023
9 (21)
Dividend
The Board of Directors will propose a dividend for
2023 of SEK 3.00 (3.00) per share to the 2024 Annual
General Meeting, corresponding to a total dividend
payment of SEK 1,715m (1,714). It is proposed that
the dividend is to be paid in two installments, the first
of SEK 1.00 per share with record date on April 22 and
the second of SEK 2.00 per share with record date on
October 22, 2024.
Risks and uncertainty factors
A number of factors may affect Husqvarna Group’s
operations in terms of operational and financial risks.
Geopolitical uncertainties and war, can have a
significant impact on Husqvarna Group’s operations,
both in terms of difficulties of supply of raw materials
and components as well as difficulties to purchase
transportation and logistics services and related cost
increases. It can also affect demand of Husqvarna
Group’s products and solutions. Operational risks
include general economic conditions, as well as trends
in consumer and professional spending, particularly in
North America and Europe, where the majority of the
Group’s products are sold. An economic downturn in
these markets may have an adverse effect on Group
sales and earnings. Shifts in product technology as
well as shifts in distribution structure and sales
channels could also have a negative impact, as will
fluctuations in prices of sourced raw materials and
components. Short term, demand for the Group’s
products is impacted by weather conditions. The Group’s
production processes and supply chain are therefore
adapted to respond to changes in weather conditions. In
the ordinary course of business, the Group is exposed to
legal risks such as commercial, product liability and other
disputes and provides for them as appropriate. Financial
risks refer primarily to currency exchange rates,
interest rates, financing, tax and credit risks. Risk
management within Husqvarna Group is regulated by
a financial policy established by the Board of
Directors. For further information on risks and
uncertainty factors, see the Annual Report 2022 which
is available at www.husqvarnagroup.com.
Accounting Principles
This year-end report has been prepared in accordance
with IAS 34, Interim financial reporting and
the Swedish Annual Accounts Act. The financial
statement of the Parent Company has been prepared
in accordance with the Swedish Annual Accounts Act,
chapter 9 and the Swedish Financial Reporting
Board’s standard RFR 2 Accounting for Legal Entities.
The accounting policies adopted are consistent with
those presented in the Annual Report of 2022, which
is available at www.husqvarnagroup.com.
Auditors’ review report
This year-end report has not been subject to review by
the auditors.
Stockholm, February 2, 2024
Pavel Hajman
CEO
10 (21)
Husqvarna Group / Year-end report 2023
Condensed consolidated income statement
Condensed consolidated comprehensive income statement
Q4 Q4 Jan-Dec Jan-Dec
SEKm 2023 2022 2023 2022
Net sales
8,605 10,353 53,261 54,037
Cost of goods sold
-6,836 -9,085 -37,136 -39,424
Gross income
1,769 1,268 16,125 14,613
Gross margin, %
20.6 12.3 30.3 27.0
Selling expenses
-2,020 -2,197 -9,034 -8,770
Administrative expenses
-736 -810 -3,211 -3,001
Other operating income/expense
4 2 0 202
Operating income
-983 -1,737 3,880 3,043
Operating margin, %
-11.4 -16.8 7.3 5.6
Financial items, net
-289 -226 -1,002 -461
Income after financial items
-1,272 -1,963 2,878 2,581
Margin, %
-14.8 -19.0 5.4 4.8
Income tax
261 571 -702 -649
Net income for the period
-1,011 -1,392 2,177 1,932
Net income for the period attributable to:
Equity holders of the Parent Company
-1,011 -1,390 2,177 1,935
Non-controlling interest
0 -2 -1 -2
Earnings per share:
Before dilution, SEK
-1.77 -2.44 3.81 3.39
After dilution, SEK
-1.77 -2.43 3.81 3.38
Weighted average number of shares outstanding:
Before dilution, millions
571.5 570.5 570.9 570.4
After dilution, millions
572.2 573.0 571.6 573.0
Q4 Q4 Jan-Dec Jan-Dec
SEKm 2023 2022 2023 2022
Net income for the period
-1,011 -1,392 2,177 1,932
Other comprehensive income
Items that will not be reclassified to the income statement:
Remeasurements on defined benefit pension plans, net of tax
-473 -210 -426 436
Total items that will not be reclassified to the income statement, net of tax
-473 -210 -426 436
Items that may be reclassified to the income statement:
Translation differences
-1,758 -1,421 -839 2,728
Net investment hedge, net of tax
824 754 403 -916
Cash flow hedges, net of tax
118 -215 238 -89
Total items that may be reclassified to the income statement, net of tax
-816 -882 -197 1,723
Other comprehensive income, net of tax
-1,289 -1,092 -622 2,159
Total comprehensive income for the period
-2,300 -2,484 1,554 4,091
Total comprehensive income attributable to:
Equity holders of the Parent Company
-2,301 -2,483 1,555 4,094
Non-controlling interest
0 -1 -1 -2
11 (21)
Husqvarna Group / Year-end report 2023
Condensed consolidated balance sheet
Assets
Property, plant and equipment
7,205 7,151
Right of use assets
2,068 2,288
Goodwill
9,920 10,187
Other intangible assets
8,400 8,408
Investments in associated companies
14 16
Derivatives
0 53
Other non-current assets
843 913
Deferred tax assets
2,143 1,834
Total non-current assets
30,592 30,849
Inventories
17,184 19,334
Trade receivables
5,289 6,267
Derivatives
1,604 795
Current tax receivables
242 524
Other current assets
1,171 1,538
Cash and cash equivalents
1,527 2,328
Total current assets
27,018 30,787
Total assets
57,610 61,636
Equity and liabilities
Equity attributable to equity holders of the Parent Company
23,770 24,002
Non-controlling interests
2 10
Total equity
23,772 24,011
Borrowings
8,556 8,927
Lease liabilities
1,436 1,708
Deferred tax liabilities
2,334 2,056
Provisions for pensions and other post-employment benefits
2,209 1,681
Other provisions
620 700
Total non-current liabilities
15,155 15,072
Trade payables
5,487 7,111
Current tax liabilities
662 667
Other liabilities
3,866 4,097
Borrowings
6,031 7,700
Lease liabilities
648 649
Derivatives
575 912
Other provisions
1,415 1,416
Total current liabilities
18,683 22,553
Total equity and liabilities
57,610 61,636
Dec 31
2023
Dec 31
2022
SEKm
12 (21)
Husqvarna Group / Year-end report 2023
Condensed consolidated cash flow statement
Q4 Q4 Jan-Dec Jan-Dec
2023
2022
2023
2022
Cash flow from operations
Operating income -983 -1,737 3,880 3,043
Non cash items
1,276 2,239 3,586 3,979
Cash items
Paid restructuring expenses
-274 -111 -565 -222
Net financial items, received/paid
-315 -108 -862 -247
Taxes paid/received
431 -305 -493 -2,318
Cash flow from operations, excluding change in
operating assets and liabilities
135 -22 5,546 4,234
Operating assets and liabilities
Change in inventories
-852 -2,014 1,918 -3,832
Change in trade receivables
1,057 508 917 -1,511
Change in trade payables
645 338 -1,579 -336
Change in other operating assets/liabilities
-747 -876 264 -264
Cash flow from operating assets and liabilities
103 -2,043 1,521 -5,943
Cash flow from operations
238 -2,066 7,067 -1,709
Investments
Acquisitions of subsidiaries/operations
-9 - -9 -85
Proceeds from sale of property, plant and equipment
-21 26 5 240
Investments in property, plant and equipment and intangible assets
-959 -801 -2,627 -2,344
Investments and divestments of financial assets
7 -4 -22 -112
Cash flow from investments
-981 -779 -2,652 -2,301
Cash flow from operations and investments
-743 -2,845 4,414 -4,009
Financing
Dividend paid to shareholders
-1,143 -1,141 -1,714 -1,711
Dividend paid to non-controlling interests
0 - -2 -2
Proceeds/repayment of borrowings
1,392 4,677 -2,066 8,253
Other financing activities
-119 -701 -1,380 -2,566
Cash flow from financing
130 2,834 -5,161 3,975
Total cash flow
-612 -11 -746 -35
Cash and cash equivalents at the beginning of the period
2,196 2,423 2,328 2,208
Exchange rate differences referring to cash and cash equivalents
-57 -84 -55 154
Cash and cash equivalents at the end of the period
1,527 2,328 1,527 2,328
SEKm
Q4 Q4 Jan-Dec Jan-Dec
2023
2022
2023
2022
EBITDA excl. items affecting comparability
631 707 7,911 7,450
Change in inventories
-852 -2,014 1,918 -3,832
Change in trade receivables
1,057 508 917 -1,511
Change in trade payables
645 338 -1,579 -336
Investments in property, plant and equipment and intangible assets
-959 -801 -2,627 -2,344
Direct operating cash flow
523 -1,261 6,541 -572
Direct operating cash flow, SEKm
13 (21)
Husqvarna Group / Year-end report 2023
Key performance indicators
Income statement
Organic growth*
Net sales, fourth quarter
Net sales, January - December
Q4 Q4 Jan-Dec Jan-Dec
EBITDA*, SEKm
2023
2022
2023
2022
Operating income
-983 -1,737 3,880 3,043
Reversals
Depreciation
543 500 1,992 1,769
Amortization
248 214 931 821
Impairment
160 735 182 753
Depreciation, amortization and impairment
951 1,449 3,105 3,342
EBITDA*
-32 -287 6,985 6,385
Excl. items affecting comparability* 631 707 7,911 7,450
EBITDA margin, % -0.4 -2.8 13.1 11.8
Excl. items affecting comparability*, % 7.3 6.8 14.9 13.8
SEKm
Reported Net
sales
Acquisitions /
divestments
Planned exits
Organic net sales before
currency translation
Currency
translation
Organic net sales
2023 8,605 8,605 8,605
2022 10,353 -184 10,170 -74 10,096
Growth -1,748 -1,564 -1,490
Growth, % -17 -15 -15
SEKm
Reported Net
sales
Acquisitions /
divestments
Planned exits
Organic net sales before
currency translation
Currency
translation
Organic net sales
2023 53,261 -39 53,221 53,221
2022 54,037 -462 53,575 2,597 56,173
Growth -776 -354 -2,951
Growth, % -1 -1 -5
*Alternative Performance Measure, refer to "Definitions".
14 (21)
Husqvarna Group / Year-end report 2023
Other Key performance indicators
Operating working capital, SEKm
16,986 18,490
Operating working capital / net sales*, %
36.9 30.6
Return on capital employed, %
8.4 7.3
Excl. items affecting comparability*, %
10.8 11.6
Return on equity, %
8.5 7.9
Excl. items affecting comparability*, %
11.8 13.6
Capital turn-over rate, times
1.3 1.4
Equity/assets ratio, %
41 39
Equity per share after dilution, SEK
41.6 41.9
Average number of employees
13,755 14,416
Dec 31
2023
Dec 31
2022
Key data
Net pension liability
1,994 1,431
Other interest-bearing liabilities
17,245 19,897
Less: Liquid funds and other interest-bearing assets
-3,600 -3,618
Net debt*
15,640 17,709
Net debt/equity ratio
0.66 0.74
Net debt/EBITDA excl. items affecting comparability*
2.1 1.8
Dec 31
2022
Dec 31
2023
Net debt*, SEKm
Total equity and liabilities 57,610 61,636
Deduction; Non interest bearing liabilities: -14,383 -16,047
Deferred tax liabilities -2,334 -2,056
Other provisions -2,035 -2,116
Trade payables -5,487 -7,111
Current tax liabilities -662 -667
Other liabilities -3,866 -4,097
Capital employed* 43,227 45,589
Capital employed* (LTM Average) 45,956 41,710
Operating income, LTM 3,880 3,043
Return on capital employed*, % 8.4 7.3
Operating income excl. items affecting comparability*, LTM 4,970 4,853
Return on capital employed excl. items affecting comparability*, % 10.8 11.6
* Alternative Performance Measure, refer to "Definitions".
Dec 31
2023
Dec 31
2022
Return on capital employed*, SEKm
15 (21)
Husqvarna Group / Year-end report 2023
Change in Group equity, condensed
Fair value of financial instruments
The Group’s financial instruments carried at fair value are derivatives. Derivatives belong to Level 2 in the fair value
hierarchy. Future cash flows have been discounted using current quoted market interest rates and exchange rates for
similar instruments. Further information about the accounting principles for financial instruments and methods used for
estimating the fair value of the financial instruments are described in note 1 and note 20, respectively, in the Annual
Report 2022. The carrying value approximates fair value for all financial instruments.
SEKm
Attributable to equity
holders of the
Parent Company
Non-controlling
interests
Total equity
Opening balance January 1, 2022 21,633 14
21,646
Share-based payment 78 -
78
Hedge for LTI-programs -92 -
-92
Dividend -1,711 -
-1,711
Total comprehensive income 4,094 -2
4,091
Dividend to non-controlling interest - -2
-2
Closing balance December 31, 2022 24,002 10
24,011
Opening balance January 1, 2023 24,002 10
24,011
Share-based payment -79 - -79
Shareholder contribution from non-controlling interest - 1 1
Dividend -1,714 - -1,714
Total comprehensive income 1,555 -1 1,554
Acquistion of non-controlling interest 5 -5 0
Dividend to non-controlling interest - -2
-2
Closing balance December 31, 2023 23,770 2
23,772
16 (21)
Husqvarna Group / Year-end report 2023
Net sales and income by division and quarter
SEKm 2021
Group
Q4 Q3 Q2 Q1 Q4 Q3 Q2 Q1 Q4
Net sales
8,605 10,512 16,976 17,167 10,353 12,206 15,792 15,685 8,234
Net sales, LTM*
53,261 55,009 56,703 55,519 54,037 51,918 49,892 48,714 47,059
Operating income
-983 398 2,101 2,364 -1,737 555 2,065 2,159 -132
Operating margin, % -11.4 3.8 12.4 13.8 -16.8 4.5 13.1 13.8 -1.6
Operating income excl. IAC* -168 415 2,313 2,410 -13 601 2,075 2,190 -180
Operating margin excl. IAC*, % -1.9 3.9 13.6 14.0 -0.1 4.9 13.1 14.0 -2.2
Operating income, LTM*
3,880 3,126 3,283 3,247 3,043 4,647 5,018 5,612 5,746
Operating margin, LTM*, % 7.3 5.7 5.8 5.8 5.6 9.0 10.1 11.5 12.2
Operating income, LTM excl. IAC* 4,970 5,125 5,311 5,073 4,853 4,686 5,011 5,580 5,684
Operating margin, LTM excl. IAC*, % 9.3 9.3 9.4 9.1 9.0 9.0 10.0 11.5 12.1
Net income for the period
-1,011 125 1,411 1,653 -1,392 269 1,417 1,638 146
Husqvarna Forest & Garden
Q4 Q3 Q2 Q1 Q4 Q3 Q2 Q1 Q4
Net sales
5,257 6,123 9,722 10,656 6,793 7,761 8,826 8,701 5,231
Net sales, LTM*
31,759 33,295 34,933 34,037 32,082 30,519 29,089 29,099 29,217
Operating income
-379 291 1,123 1,670 -1,252 560 1,107 1,392 70
Operating margin, % -7.2 4.8 11.6 15.7 -18.4 7.2 12.5 16.0 1.3
Operating income excl. IAC* -7 293 1,260 1,690 273 555 1,113 1,283 70
Operating margin excl. IAC*, % -0.1 4.8 13.0 15.9 4.0 7.2 12.6 14.7 1.3
Operating income, LTM*
2,706 1,833 2,101 2,085 1,807 3,129 3,127 3,554 3,699
Operating margin, LTM*, % 8.5 5.5 6.0 6.1 5.6 10.3 10.8 12.2 12.7
Operating income, LTM excl. IAC* 3,236 3,516 3,779 3,631 3,224 3,021 3,024 3,447 3,701
Operating margin, LTM excl. IAC*, % 10.2 10.6 10.8 10.7 10.0 9.9 10.4 11.8 12.7
Gardena
Q4 Q3 Q2 Q1 Q4 Q3 Q2 Q1 Q4
Net sales
1,326 2,287 5,031 4,321 1,470 2,400 4,775 4,960 1,148
Net sales, LTM*
12,964 13,108 13,222 12,966 13,606 13,284 12,915 11,991 10,537
Operating income
-407 -46 818 585 -468 -93 773 706 -277
Operating margin, % -30.7 -2.0 16.3 13.5 -31.8 -3.9 16.2 14.2 -24.1
Operating income excl. IAC* -264 -41 857 584 -314 -42 776 752 -290
Operating margin excl. IAC*, % -19.9 -1.8 17.0 13.5 -21.4 -1.7 16.3 15.2 -25.3
Operating income, LTM*
950 889 842 797 918 1,109 1,398 1,603 1,552
Operating margin, LTM*, % 7.3 6.8 6.4 6.2 6.8 8.3 10.8 13.4 14.7
Operating income, LTM excl. IAC* 1,136 1,086 1,085 1,005 1,173 1,197 1,434 1,627 1,529
Operating margin, LTM excl. IAC*, % 8.8 8.3 8.2 7.7 8.6 9.0 11.1 13.6 14.5
Husqvarna Construction
Q4 Q3 Q2 Q1 Q4 Q3 Q2 Q1 Q4
Net sales
1,968 2,061 2,192 2,177 2,071 2,024 2,157 1,981 1,830
Net sales, LTM*
8,398 8,500 8,463 8,428 8,232 7,992 7,763 7,511 7,210
Operating income
-4 225 272 262 80 183 299 152 144
Operating margin, % -0.2 10.9 12.4 12.0 3.9 9.0 13.9 7.7 7.9
Operating income excl. IAC* 180 225 308 289 127 182 300 245 144
Operating margin excl. IAC*, % 9.1 10.9 14.1 13.3 6.1 9.0 13.9 12.4 7.9
Operating income, LTM*
755 839 796 823 713 778 826 787 840
Operating margin, LTM*, % 9.0 9.9 9.4 9.8 8.7 9.7 10.6 10.5 11.7
Operating income, LTM excl. IAC* 1,002 948 905 897 854 871 920 880 840
Operating margin, LTM excl. IAC*, % 11.9 11.2 10.7 10.6 10.4 10.9 11.9 11.7 11.7
Group Common
Q4 Q3 Q2 Q1 Q4 Q3 Q2 Q1 Q4
Net sales
54 41 31 13 20 22 34 43 26
Operating income
-193 -72 -112 -154 -97 -95 -114 -90 -69
Operating income excl. IAC* -76 -62 -112 -154 -98 -95 -114 -90 -104
The majority of net sales are recognized at a certain point in time.
*Alternative Performance Measure, refer to "Definitions".
2022
2023
17 (21)
Husqvarna Group / Year-end report 2023
Items affecting comparability
The fourth quarter 2023 included items affecting comparability of SEK -815m. This was mainly related to the expansion of
the Group’s cost saving initiatives (announced in October 2023), including the consolidation of operations and brands
from previous acquisitions, a write-down of inventory related to exits of petrol-powered, low-margin consumer wheeled
products (announced in October 2022), as well as non-recurring costs related to Russia.
Classification in the income statement
Net assets by division ¹
SEKm
Restructuring costs
Impairment of non-current assets -153 -730 -163 -745
Write-down of inventory -205 -221 -272 -249
Other restructuring costs -371 -811 -567 -858
Non-recurring costs relating to Russia
Write-down / reversal of current assets 15 3 15 -59
Write-down / reversal of inventory 0 101 0 -11
Other restructuring costs -102 -67 -102 -67
Other
Sale of property - - - 178
Total items affecting comparability
-815 -1,724 -1,090 -1,810
Jan-Dec
2022
Jan-Dec
2023
Q4
2022
Q4
2023
SEKm
Cost of goods sold -482 -1,433 -725 -1,610
Selling expenses -167 -189 -172 -277
Administrative expenses -166 -103 -193 -103
Other operating income/expense - - - 178
Total items affecting comparability -815 -1,724 -1,090 -1,810
Jan-Dec
2022
Jan-Dec
2023
Q4
2022
Q4
2023
SEKm
Dec 31
2023
Dec 31
2022
Dec 31
2023
Dec 31
2022
Dec 31
2023
Dec 31
2022
Husqvarna Forest & Garden
24,433 26,228 6,354 8,041 18,078 18,187
Gardena 17,763 20,010 2,940 3,213 14,823 16,798
Husqvarna Construction 8,722 9,058 1,614 1,724 7,107 7,334
Other ² 2,878 2,471 3,475 3,070 -597 -599
Total 53,795 57,767 14,383 16,047 39,412 41,720
¹ Liquid assets, other interest-bearing assets, interest-bearing liabilities and equity are not included in the table above.
² Other includes tax items, associates and common Group functions such as Treasury and Risk Management.
Assets
Liabilities
Net Assets
18 (21)
Husqvarna Group / Year-end report 2023
Parent Company
Condensed income statement
Q4 Q4 Jan-Dec Jan-Dec
2023
2022
2023
2022
Net sales 3,785 5,302 23,454 23,308
Cost of goods sold -4,617 -4,991 -18,366 -17,250
Gross income -832 312 5,089 6,057
Selling expense -456 -586 -2,129 -1,911
Administrative expense -1,156 -565 -2,721 -1,849
Other operating income/expense -1 0 -1 0
Operating income -2,445 -839 238 2,298
Financial items, net 2,089 813 1,474 -920
Income after financial items -356 -27 1,711 1,378
Appropriations -197 -728 -266 -858
Income before taxes -553 -755 1,445 521
Tax on profit for the year 360 149 80 -14
Income for the period -193 -606 1,525 507
SEKm
Condensed balance sheet
Non-current assets 50,263 41,563
Current assets 15,616 19,759
Total assets 65,880 61,322
Equity 32,030 32,054
Untaxed reserves 1,424 1,400
Provisions 542 408
Non-current liabilities 8,406 8,749
Current liabilities 23,478 18,710
Total equity and liabilities 65,880 61,322
Dec 31
2022
Dec 31
2023
SEKm
Number of shares
Number of shares as of December 31, 2022
110,106,194 460,347,003 5,890,581 576,343,778
Conversion of A-shares into B-shares -654,745 654,745 -
Shares allocated to 2020 LTI-program 1,065,384 -1,065,384 -
Number of shares as of December 31, 2023 109,451,449 462,067,132 4,825,197 576,343,778
¹ All repurchased B-shares are included in a third party share swap agreement.
Outstanding
A-shares
Outstanding
B-shares
Repurchased
B-shares ¹
Total

Husqvarna Group / Year-end report 2023
19 (21)
Definitions
This report includes financial measures as required
by the financial reporting framework applicable to
Husqvarna Group, which is based on IFRS. In addition,
there are other measures (Alternative Performance
Measures) used by management and other
stakeholders to analyze trends and performance of
the Group’s operations that cannot be directly read
or derived from the financial statements. Husqvarna
stakeholders should not consider these as substitutes,
but rather as additions, to the financial reporting
measures prepared in accordance with IFRS. Please
note that the Alternative Performance Measures as
defined, may not be comparable to similarly titled
measures used by other companies. Refer below for
a list of definitions of all measures and indicators used,
referred to and presented in this report.
Computation of average amounts
The computation of key ratios is based on averages
of affected balance sheet items the last 12 months.
Roundings
All items are stated in SEKm and, accordingly,
rounding differences can occur.
Last twelve months (LTM)
Last twelve months rolling has been included to assist
stakeholders in their analysis of the seasonality that
Husqvarna Group's business is exposed to.
Earnings per share, after dilution
Earnings per share is expressed as net income
attributable to equity holders of the Parent Company
divided by the weighted average number of shares
outstanding (net of treasury shares), after dilution.
Earnings per share is a good measure of the
company’s profitability and is used to determine the
value of the company’s outstanding shares.
Growth measures
Net sales growth
Change in net sales compared to previous period
in percent.
Organic growth
Change in net sales, adjusted for acquisitions,
divestments, planned exits and currency translation
effects. The measure is important in order to
understand the underlying performance of the
operations and increases the comparability between
periods.
Profitability measures
EBITDA
EBITDA is a measure of earnings before interest,
taxes, depreciation, amortization and impairment
charges. EBITDA measures Husqvarna Group's
operating performance and the ability to generate cash
from operations, without considering the capital
structure of the Group or its fiscal environment. For a
reconciliation of EBITDA refer to section Key
Performance Indicators.
EBITDA margin
EBITDA as a percentage of net sales.
Gross margin
Gross income as a percentage of net sales.
Operating margin
Operating income as a percentage of net sales.
Return on capital employed
Operating income during the last twelve months as a
percentage of average capital employed. A central ratio
for measuring return on capital tied up in operations.
Return on equity
Net income attributable to equity holders of the Parent
Company last twelve months as a percentage of
average equity attributable to equity holders of the
Parent Company. The indicator shows how share
holders’ capital yields interest during the period.
Share-based measures
Equity per share, after dilution
Equity attributable to equity holders of the Parent
Company divided by the weighted average number of
shares outstanding (net of treasury shares), after dilution.
A measure of the amount of equity that exists per
outstanding share and is used for measuring the share
against the share price.
Capital indicators
Capital employed
Total equity and liabilities less non-interest-bearing
debt including deferred tax liabilities. This measure
shows the amount of capital that is used in the
operations and is an important component for
measuring the return from operations.
Capital expenditure
Investments in property, plant and equipment, right of
use assets and intangible assets.
Interest bearing liabilities
Long-term and short-term borrowings, net pension
liability and fair value derivative liabilities.

Husqvarna Group / Year-end report 2023
20 (21)
Liquid funds
Cash and cash equivalents, short-term investments
and fair value derivative assets.
Net assets
Total assets excluding liquid funds and interest-bearing
assets less operating liabilities, non-interest-bearing
provisions and deferred tax liabilities.
Net debt
Net debt describes the Group’s gearing and its ability
to repay its debts from cash generated from the
Group´s ordinary business, if they were all due today. It
is also used to analyze how future net interest costs
will impact earnings. Net debt is defined as total
interest-bearing liabilities plus dividend payable, less
liquid funds and interest-bearing assets.
Operating working capital
Inventories and trade receivables less trade payables.
This measure shows how much working capital is tied
up in the operations and can be put in relation to sales
to understand how efficient working capital is
managed.
Capital measures
Equity/assets ratio
Equity attributable to equity holders of the Parent
Company as a percentage of total assets. A measure
for showing financial risk, expressing the percentage of
total assets that is financed by the owners.
Capital turnover rate
Net sales last twelve months divided with average
net assets. Shows how effectively capital is managed
and is a key measure for monitoring value creation.
Net debt/EBITDA excl. items affecting comparability
Average net debt in relation to EBITDA last twelve
months, excluding items affecting comparability. Shows
the company’s capacity to repay its debt, adjusted for
the impact of items affecting comparability.
Net debt/equity ratio
Net debt in relation to total equity. Shows financial risk
and is a useful measure to monitor the level of the
company’s indebtedness.
Operating working capital/net sales
Average operating working capital as a percentage of
net sales last twelve months. This measure is an
important indicator for how efficient working capital is
managed.
Other measures
Direct operating cash flow
EBITDA, excluding items affecting comparability,
adjusted for change in trade payables, inventory and
trade receivables and investments in property, plant
and equipment and intangible assets. For a
reconciliation of direct operating cash flow refer to the
table below the cash flow statement. Direct operating
cash flow provides a measure of the cash generated by
the Groups operating business.
Items affecting comparability (IAC)
Under Items affecting comparability, Husqvarna
includes items that have the character of being non-
recurring, such as restructuring costs, and are relevant
when comparing earnings for one period with those of
another. Separate reporting of items affecting
comparability between periods provides a better
understanding of the company’s underlying operating
activities.

21 (21)
Webcast presentation and telephone conference
A webcast presentation of the Q4 report hosted by Pavel Hajman, CEO
and Terry Burke, CFO will be held at 10:00 CET on February 2, 2024.
To view the presentation, please use the link:
husqvarnagroup.creo.se/fa23e10e-c3d3-440d-8d99-8c463cbab7de
The dial-in to the telephone conference (in order to ask questions):
+46 (0) 8 505 100 31 (Sweden) or +44 207 107 06 13 (UK).
Dates for Financial Reports 2024
April 18 Annual General Meeting 2024
April 24 Interim report for January-March 2024
July 18 Interim report for January-June 2024
October 23 Interim report for January-September 2024
Contacts
Terry Burke, CFO and Executive Vice President, Finance, IR & Communication
+46 8 738 90 00
Johan Andersson, Vice President, Investor Relations
+46 702 100 451
Husqvarna AB (publ), P.O. Box 7454, SE-103 92 Stockholm
Regeringsgatan 28, +46 8 738 90 00, www.husqvarnagroup.com
Reg. Nr: 556000-5331
NASDAQ OMX Stockholm: HUSQ A, HUSQ B
This report contains insider information that Husqvarna AB is required to disclose under the EU
Market Abuse Regulation and the Securities Markets Act. The information was submitted for
publication, through the contact person set out above, at 07.00 CET on February 2, 2024.
Factors affecting forward-looking statements
This report contains forward-looking statements in the sense referred to in the American Private
Securities Litigation Reform Act of 1995. Such statements comprise, among other things, financial
goals, goals of future business and financial plans. These statements are based on present
expectations and are subject to risks and uncertainties that may give rise to major deviations in the
result due to several aspects. These aspects include, among other things: consumer demand and
market conditions in the geographical areas and lines of business in which Husqvarna operates, the
effects of currency fluctuations, downward pressure on prices due to competition, a material reduction
in sales by important distributors, success in developing new products and in marketing, outcome of
product responsibility litigation, progress in terms of reaching the goals set for productivity and efficient
use of capital, successful identification of growth opportunities and acquisition objects, integration of
these into the existing business and successful achievement of goals for making the supply chain more
efficient.
