
- 3 -
2. Summary of Results
(1) Vital Statistics including foreigners in Japan in 2013
Live births decreased
Live births were 1,042,813 in 2013 decreasing by 7,902 from the previous year. Of these,
babies for whom “at least one parent, either father or mother, is a foreigner” were 32,529
(3.1% of the total live births in Japan).
General mortality increased
Deaths were 1,275,163 increasing by 12,088 over the previous year. Of these, foreigners
dying in Japan were 6,727 (0.5% of the total deaths in Japan).
Marriages decreased
Marriages were 663,740, decreasing by 8,549 from the previous year. Of these, marriages
in which “at least either the bride or groom is a foreigner” were 24,615 (3.7% of the total
marriages in Japan).
Divorces decreased
Divorces were 232,821 and decreased by 4,175 from the previous year. Of these, divorces in
which “at least either the wife or husband is a foreigner” were 16,634 (7.1% of the total
divorces in Japan).
Table 1. Trends in indexes of vital statistics, 2012-2013
Percentage
(%)
Year 2013 Year 2012
Changes from
the previous
year
Year 2013
Live births
Total
1 042 813 1 050 715 △ 7 902 100.0
Japanese in Japan
1 029 816 1 037 231 △ 7 415 98.8
Japanese parents
*)
1 010 284 1 016 695 △ 6 411 96.9
One parent is foreigner
19 532 20 536 △ 1 004 1.9
Foreigners in Japan
*)
12 997 13 484 △ 487 1.2
(Regrouped)
at least one parent, either father or
mother, is a foreigner
32 529 34 020 △ 1 491 3.1
Deaths
Total
1 275 163 1 263 075 12 088 100.0
Japanese in Japan
1 268 436 1 256 359 12 077 99.5
Foreigners in Japan
6 727 6 716 11 0.5
(Regrouped)
Total
2 227 2 332 △ 105 100.0
Japanese in Japan
2 185 2 299 △ 114 98.1
Foreigners in Japan
42 33 9 1.9
Foetal deaths
Total
24 528 25 241 △ 713 100.0
Japanese in Japan
24 102 24 800 △ 698 98.3
Foreigners in Japan
426 441 △ 15 1.7
Marriages
Total
663 740 672 289 △ 8 549 100.0
Japanese in Japan
660 613 668 869 △ 8 256 99.5
Japanese couple
639 125 645 212 △ 6 087 96.3
One of couple is foreigner
21 488 23 657 △ 2 169 3.2
Foreigners in Japan
3 127 3 420 △ 293 0.5
(Regrouped)
at least either the bride or groom is
a foreigner
24 615 27 077 △ 2 462 3.7
Divorces
Total
232 821 236 996 △ 4 175 100.0
Japanese in Japan
231 383 235 406 △ 4 023 99.4
Japanese couple
216 187 219 118 △ 2 931 92.9
One of couple is foreigner
15 196 16 288 △ 1 092 6.5
Foreigners in Japan
1 438 1 590 △ 152 0.6
(Regrouped)
at least either the wife or husband
is a foreigner
16 634 17 878 △ 1 244 7.1
*: inclusive live births born out of wedlock
Number
Infant deaths
( under 1 year )
- 4 -
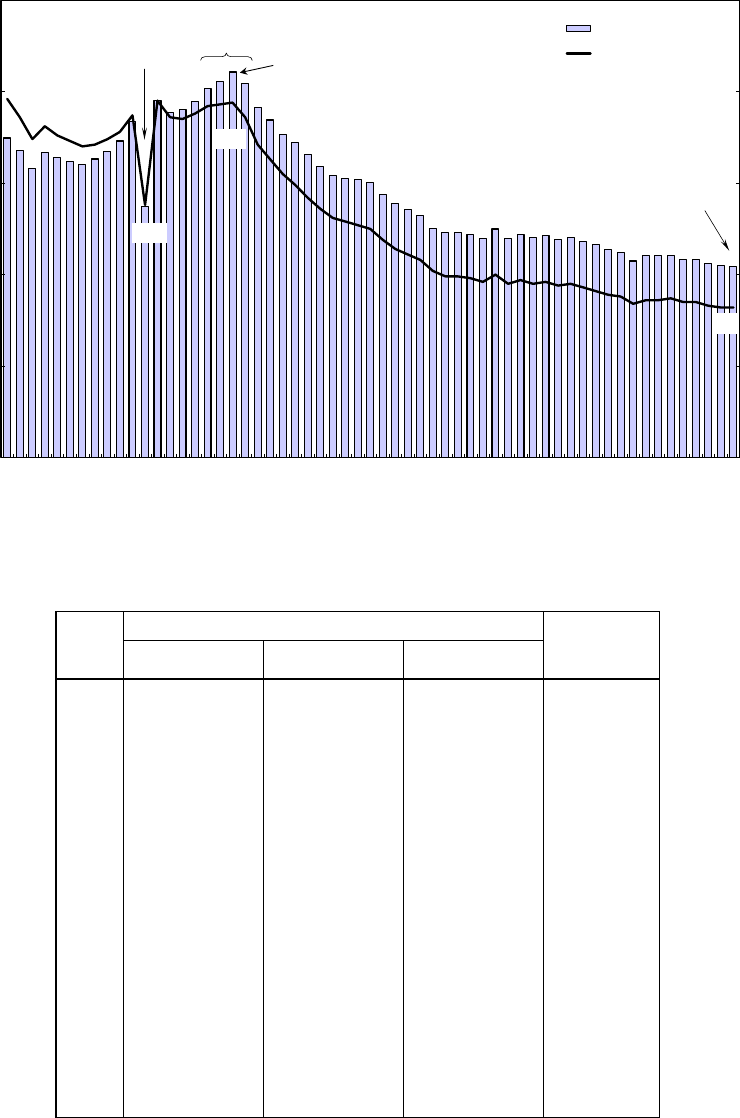
(2) Natality
With regard to trends in natality, number of live births have been decreasing after the
peak of 2,106,523 in 1973 during the second baby boom. Live births reached 1,042,813 in
2013, decreasing by half during those 40 years. Live birth rates (per 1,000 population) have
been on a downward trend after they equaled 19.4 in 1973 during the second baby boom and
reached 8.2 in 2013 (Figure 1, Table 2).
Figure 1. Trends in live births and live birth rates, 1955-2013
0
5
10
15
20
25
0
50
100
150
200
250
1955 '60 '65 '70 '75 '80 '85 '90 '95 2000 '05 '10 '13
Live birth rates (per 1,000 population)
Live births
(Ten thousands)
Live births
Live birth rates
Year 1966
Hinoeuma
137
2013
104
1971-1974
Second baby boom
1973
211
19.4
13.8
8.2
Table 2. Trends in live births by sex and live birth rates, 1955-2013
Live births (persons)
Total Male Female
1955 1 746 299 897 797 848 502 19.6
1960 1 619 175 831 572 787 603 17.3
1965 1 837 476 942 493 894 983 18.7
1970 1 947 944 1 007 462 940 482 18.8
1975 1 914 707 985 995 928 712 17.1
1980 1 588 632 817 410 771 222 13.6
1985 1 437 375 738 257 699 118 11.9
1990 1 229 044 630 863 598 181 9.9
1995 1 197 427 613 907 583 520 9.5
2000 1 202 761 618 374 584 387 9.5
2005 1 073 915 550 879 523 036 8.4
2006
1 104 862 566 692 538 170 8.6
2007
1 103 247 566 781 536 466 8.6
2008
1 105 232 566 731 538 501 8.7
2009
1 082 384 555 406 526 978 8.5
2010
1 083 615 557 101 526 514 8.5
2011
1 062 224 544 307 517 917 8.3
2012
1 050 715 538 790 511 925 8.2
2013
1 042 813 534 320 508 493 8.2
Live birth rates
(per 1,000
population)
Year
- 5 -
Live births in 2013 were 1,042,813, of which those of Japanese (including parents
whose either mother or father is Japanese) were 1,029,816, accounting for 98.8 % of the total.
Observing by parent nationalities, foreign father was 1.9 % and foreign mother was 2.2 %
(Table 3).
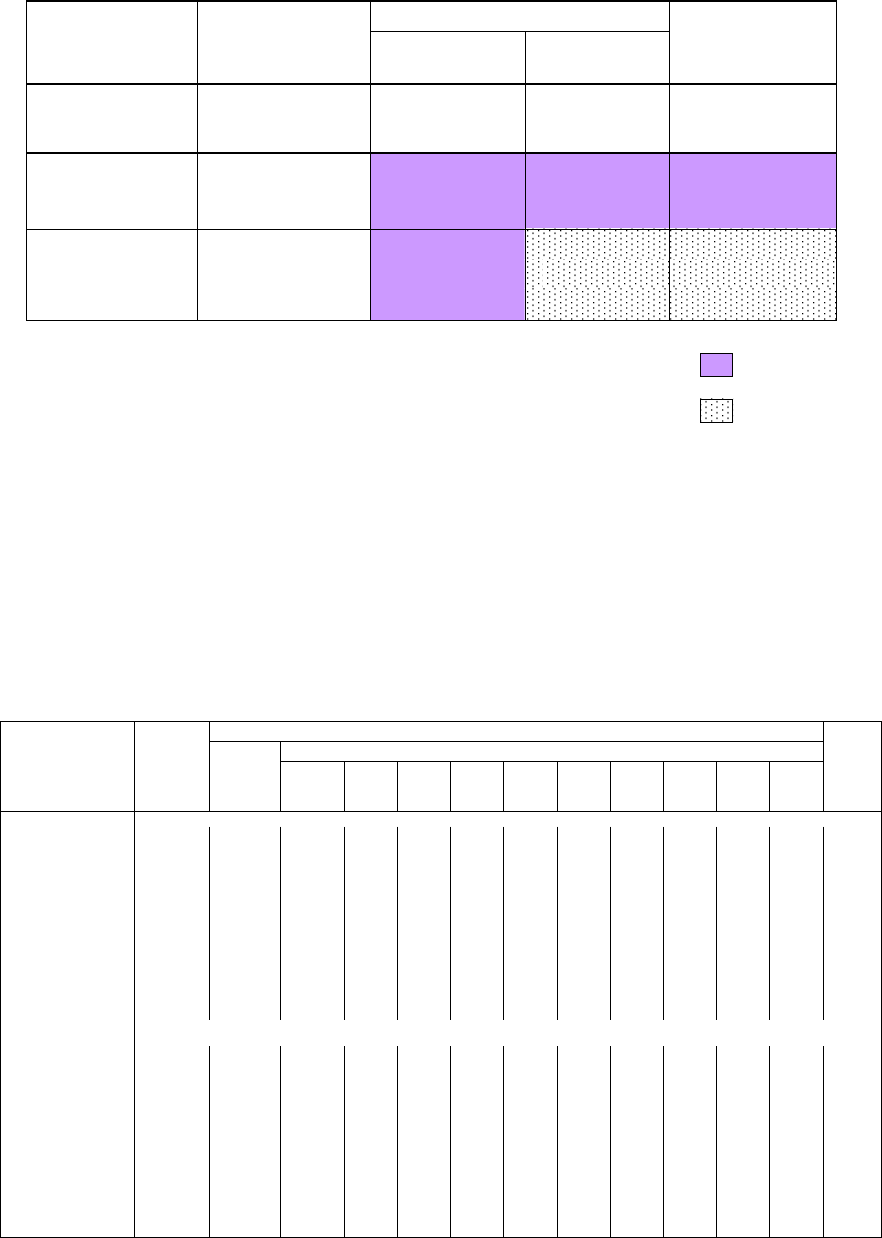
Table 3. Live births and percent distribution by nationality of father and mother
(Japanese or Foreigner), 2013
Nationality of father
Japan
1 042 813 997 513 20 208
100.0% 95.7% 1.9% 2.4%
(96.9%)
1 019 797 987 494 9 513
97.8% 94.7% 0.9% 2.2%
(99.0%) (95.9%) (0.9%) (2.2%)
23 016 10 019 10 695
2.2% 1.0% 1.0% 0.2%
(1.0%)
Notes:
1) Live births of Japanese in Japan: 1,029,816 persons (98.8% of total births)
( )
2) Figures in parentheses indicate percent distributions to live births of Japanese in Japan.
3) Live births of Foreigners in Japan: 12,997 persons (1.2% of total births)
( )
Nationality of
mother
Total
Japan
Foreign countries
22 790
2 302
Total
Born out of
wedlock
Foreign
countries
25 092
Observing distributions of nationalities of fathers according to the nationality of
mothers, the case in which the mother is Japanese and the father is also Japanese,
accounted for 96.8 % of the cases. The case in which the mother is a foreigner and the
father is Japanese accounted for 43.5 % and father is foreigner accounted for 46.5 %. For
the case in which the mother is Korean, Filipino, Thai or English, children whose father is
Japanese accounted for more than half. And for the case in which the mother is Chinese,
American, Brazilian or Peruvian, the combination in which the father is the same
nationality as the mother was the most common (Table 4).
Table 4. Live births and percent distribution by nationality of father and mother, 2013
Nationality of father
Foreign countries
Total Korea China
Philippines
Thailand U.S.A
United
Kingdom
Brazil Peru
Other
foreign
countries
Total 1 042 813 997 513 20 208 3 367 5 701 803 118 1 872 519 1 608 444 5 776 25 092
Japan 1 019 797 987 494 9 513 2 384 1 223 227 79 1 583 470 395 120 3 032 22 790
Foreign countries 23 016 10 019 10 695 983 4 478 576 39 289 49 1 213 324 2 744 2 302
Korea 2 977 1 850 997 912 17 - - 21 5 1 - 41 130
China 8 628 3 872 4 547 47 4 432 5 1 13 4 4 1 40 209
Philippines 3 735 2 138 717 6 3 564 - 20 - 67 14 43 880
Thailand 452 346 59 - 3 1 37 2 2 4 3 7 47
U.S.A 349 130 208 1 - 1 - 188 3 1 - 14 11
United Kingdom 71 40 29 - 3 - - 3 17 - - 6 2
Brazil 1 930 245 1 122 - 2 4 - 6 - 1 062 24 24 563
Peru 644 107 328 - 2 - - 1 - 44 262 19 209
Other foreign countries
4 230 1 291 2 688 17 16 1 1 35 18 30 20 2 550 251
Percent distribution of father’s nationality by nationality of mother (%)
Total 100.0 95.7 1.9 0.3 0.5 0.1 0.0 0.2 0.0 0.2 0.0 0.6 2.4
Japan 100.0 96.8 0.9 0.2 0.1 0.0 0.0 0.2 0.0 0.0 0.0 0.3 2.2
Foreign countries 100.0 43.5 46.5 4.3 19.5 2.5 0.2 1.3 0.2 5.3 1.4 11.9 10.0
Korea 100.0 62.1 33.5 30.6 0.6 - - 0.7 0.2 0.0 - 1.4 4.4
China 100.0 44.9 52.7 0.5 51.4 0.1 0.0 0.2 0.0 0.0 0.0 0.5 2.4
Philippines 100.0 57.2 19.2 0.2 0.1 15.1 - 0.5 - 1.8 0.4 1.2 23.6
Thailand 100.0 76.5 13.1 - 0.7 0.2 8.2 0.4 0.4 0.9 0.7 1.5 10.4
U.S.A 100.0 37.2 59.6 0.3 - 0.3 - 53.9 0.9 0.3 - 4.0 3.2
United Kingdom 100.0 56.3 40.8 - 4.2 - - 4.2 23.9 - - 8.5 2.8
Brazil 100.0 12.7 58.1 - 0.1 0.2 - 0.3 - 55.0 1.2 1.2 29.2
Peru 100.0 16.6 50.9 - 0.3 - - 0.2 - 6.8 40.7 3.0 32.5
Other foreign countries
100.0 30.5 63.5 0.4 0.4 0.0 0.0 0.8 0.4 0.7 0.5 60.3 5.9
Born out
of wedlock
Live births (persons)
Nationality of mother
Total
Japan
- 6 -
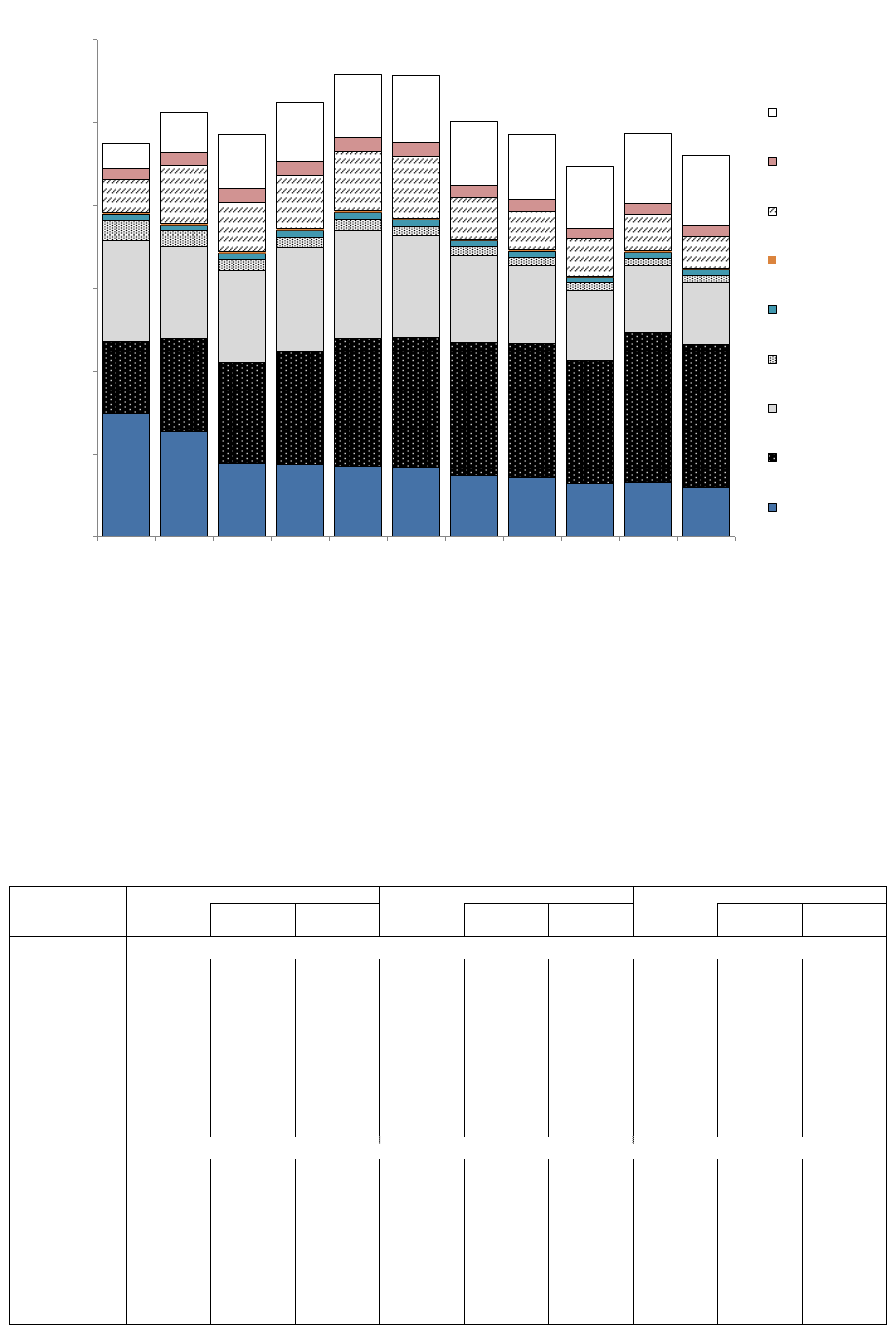
For live births by nationality of foreign mother after 1995, in recent years the
distributions have been highest for Chinese mother (Figure 2).
Figure 2. Trends in live births by nationality of foreign mother,
1995, 2000 and 2005-2013
0
5000
10000
15000
20000
25000
30000
1995 2000 2005 2006 2007 2008 2009 2010 2011 2012 2013
Other foreign
countries
Peru
Brazil
United Kingdom
U.S.A
Thailand
Philippines
China
Korea
(Persons)
23,016
23,734
25,610
24,257
26,228
27,903
27,858
24,301
25,056
22,340
24,309
Live births
Observing trends in live births in 2013 by legitimacy status in the case of Japanese in
Japan, born in wedlock accounted for 97.8 % and born out of wedlock accounted for 2.2 %.For
the case of foreigners in Japan, born in wedlock accounted for 82.3 % and born out of wedlock
accounted for 17.7 %. Analyzing these data by the age group of the mother, for mother age
19 and under, 30.2 % of Japanese in Japan and 72.7 % of foreigners in Japan were born out
of wedlock (Table 5).
Table5. Live births and percent distribution by Japanese and Foreigners in Japan,
legitimacy status and age of mother (5-years age groups), 2013
Total Japanese in Japan Foreigners in Japan
Born in wedlock
Born out of
wedlock
Born in wedlock
Born out of
wedlock
Born in wedlock
Born out of
wedlock
Live births (persons)
Total 1 042 813 1 017 721 25 092 1 029 816 1 007 026 22 790 12 997 10 695 2 302
~19Years 13 250 9 124 4 126 12 964 9 046 3 918 286 78 208
20~24 92 926 87 214 5 712 91 250 86 028 5 222 1 676 1 186 490
25~29 286 831 281 862 4 969 282 794 278 368 4 426 4 037 3 494 543
30~34 369 858 365 143 4 715 365 404 361 210 4 194 4 454 3 933 521
35~39 231 732 227 817 3 915 229 741 226 181 3 560 1 991 1 636 355
40~44 47 070 45 505 1 565 46 546 45 155 1 391 524 350 174
45 and over 1 144 1 055 89 1 116 1 038 78 28 17 11
Not stated 2 1 1 1 - 1 1 1 -
Percent distribution (%)
Total 100.0 97.6 2.4 100.0 97.8 2.2 100.0 82.3 17.7
~19Years 100.0 68.9 31.1 100.0 69.8 30.2 100.0 27.3 72.7
20~24 100.0 93.9 6.1 100.0 94.3 5.7 100.0 70.8 29.2
25~29 100.0 98.3 1.7 100.0 98.4 1.6 100.0 86.5 13.5
30~34 100.0 98.7 1.3 100.0 98.9 1.1 100.0 88.3 11.7
35~39 100.0 98.3 1.7 100.0 98.5 1.5 100.0 82.2 17.8
40~44 100.0 96.7 3.3 100.0 97.0 3.0 100.0 66.8 33.2
45 and over 100.0 92.2 7.8 100.0 93.0 7.0 100.0 60.7 39.3
Age
- 7 -
(3) General mortality
Regarding trends in mortality, the number of deaths fluctuated around 700,000 per
year until around 1980 and death rates (per 1,000 population) had gradually declined since
1957, recording the lowest rate of 6.0 in 1979 and 1982. Since this time, deaths have
demonstrated an upward trend, and death rates have been growing, reflecting the aging of
the population (Figure 3, Table 6).
Figure 3. Trends in deaths and death rates, 1955-2013
8.3
1966
67
1979
69
1982
72
Great Hanshin/Awaji
Earthquake
1995
93
2013
128
Year1957
76
6.8
6.0
6.0
7.4
9.9
10.0
0
2
4
6
8
10
12
14
0
20
40
60
80
100
120
140
160
1955 '60 '65 '70 '75 '80 '85 '90 '95 2000 '05 '10 '13
Death rates(per 1,000 population)
Deaths
(Ten thousands)
Deaths
Death rates
Great East Japan
Earthquake
2011
126
Table 6. Trends in deaths and death rates by sex, 1955-2013
Deaths (persons)
Total Male Female
1955 697 398 367 936 329 462 7.8
1960 710 737 380 535 330 202 7.6
1965 704 100 381 359 322 741 7.2
1970 716 643 390 570 326 073 6.9
1975 705 874 380 355 325 519 6.3
1980 726 632 393 330 333 302 6.2
1985 756 440 410 515 345 925 6.2
1990 824 866 446 679 378 187 6.7
1995 927 709 504 803 422 906 7.4
2000 967 195 529 314 437 881 7.6
2005 1 089 843 588 533 501 310 8.5
2006 1 090 419 584 901 505 518 8.5
2007 1 114 472 596 396 518 076 8.7
2008 1 148 653 612 344 536 309 9.0
2009 1 148 057 612 617 535 440 9.0
2010 1 203 437 637 350 566 087 9.4
2011 1 259 680 660 211 599 469 9.9
2012 1 263 075 659 288 603 787 9.9
2013
1 275 163 662 449 612 714 10.0
Death rates
(per 1,000
population)
Year
- 8 -
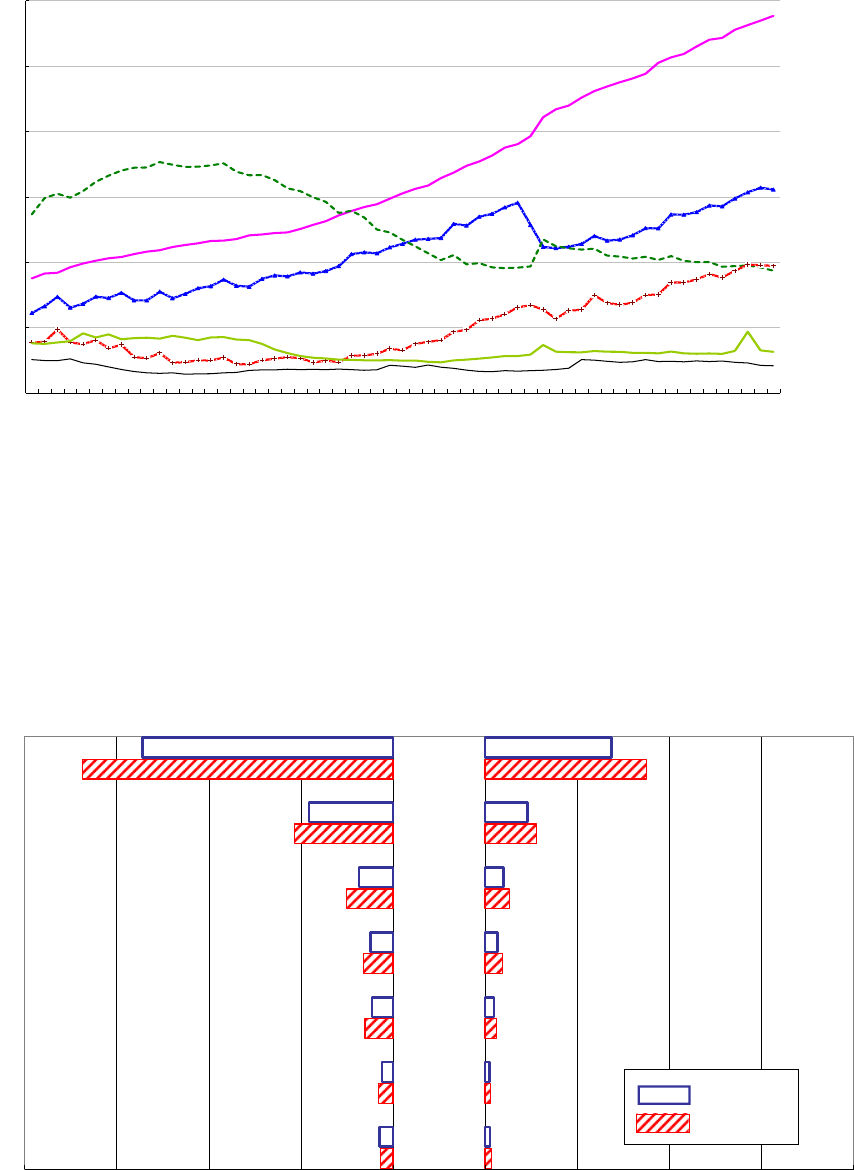
Observing death rates by causes of death, cerebrovascular diseases, malignant
neoplasms, and heart diseases were high, in descending order, around 1960. Since this
time, the number of deaths due to cerebrovascular diseases have decreased and the number
of deaths due to pneumonia have increased, while those due to malignant neoplasms, heart
diseases, and pneumonia have increased, in descending order, since 2011 (Figure 4).
Figure 4. Trends in death rates by causes of deaths, 1955-2013
288.2
155.4
93.4
97.0
31.3
20.7
0
50
100
150
200
250
300
1955 '60 '65 '70 '75 '80 '85
'90
'95 2000 '05 '10 '13
Death rates(per 100,000 population)
Cerebrovascular diseases
Malignant neoplasms
Heart diseases
Pneumonia
Accidents
Suicide
Note: The declining of heart diseases in 1994-1995 was believed to be due to the effect of revision of death certificates.
Comparing the age-adjusted death rates in 2010 by nationalities, figures for foreigners
were higher for the all causes of death, except for suicide by males (Figure 5).
Figure 5. Comparison of age-adjusted death rates by causes of death
according to nationality (Japanese and Foreigner), 2010
544.3
674.4
182.4
214.3
74.2
100.4
49.5
63.4
46.0
60.7
24.2
31.8
29.8
27.5
274.9
349.6
92.2
112.1
39.7
53.4
26.9
37.1
18.9
24.2
10.0
11.9
10.9
14.8
-1000 -800 -600 -400 -200 0 200 400 600 800
Total
Malignant
neoplasms
Heart
diseases
Cerebrovas-
-cular
diseases
Pneumonia
Accidents
Suicide
Male
Female
800 600 400 200 0
Japanese
Foreigner
Note: Age-adjusted death rates are indices calculated by applying death rates by age group to a certain standard population (model population in 1985)
to compare death rates among groups having different population composition.
(Per 100,000 population)
(Per 100,000 population)
- 9 -
(4) Infant mortality
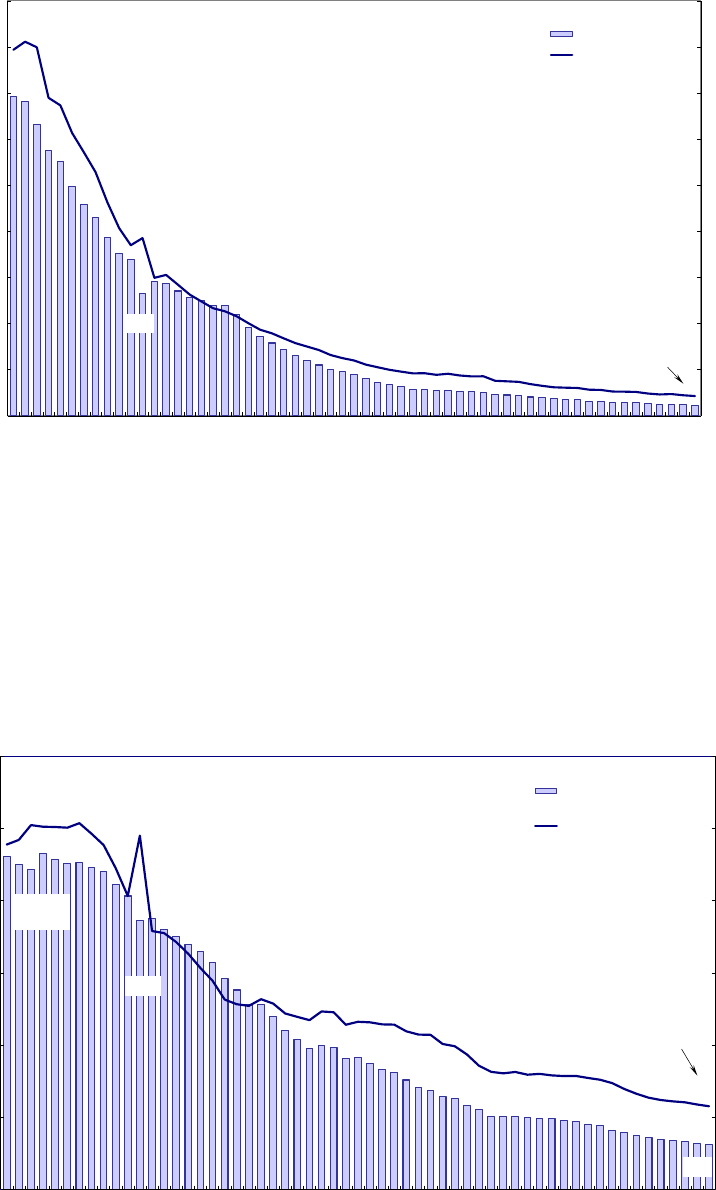
As observed from trends in infant mortality, both infant deaths and infant mortality
rates decreased drastically until around 1970, and have been moderately improving in
recent years (Figure 6).
Figure 6. Trends in infant deaths and infant mortality rates, 1955-2013
6.8
2.6
Year1956
40.6
1966
19.3
2013
2.1
2thousands
0
5
10
15
20
25
30
35
40
45
0
1
2
3
4
5
6
7
8
9
1955 '60 '65 '70 '75 '80 '85 '90 '95 2000 '05 '10 '13
Infant mortality rates(per 1,000 live births)
Infant deaths
(Ten thousands)
Infant deaths
Infant mortality rates
(5) Foetal mortality
With regard to trends in foetal mortality, number of foetal deaths decreased after the
peak in 1958 and have been recently remaining around 25 thousand. Although foetal death
rates unusually changed in 1966 due to the decrease in births, they have been on a
downward trend since 1961 (Figure 7).
Figure 7. Trends in foetal deaths and foetal death rates, 1955-2013
Year1958
18.6
14.9
2.5
1961
101.4
1966
Hinoeuma
98.0
2013
23.0
0
20
40
60
80
100
120
0
4
8
12
16
20
24
1955 '60 '65 '70 '75 '80 '85 '90 '95 2000 '05 '10 '13
Foetal death rates(per 1,000 births inclusive of foetal deaths)
Foetal deaths
(Ten thousands)
Foetal deaths
Foetal death rates
- 10 -
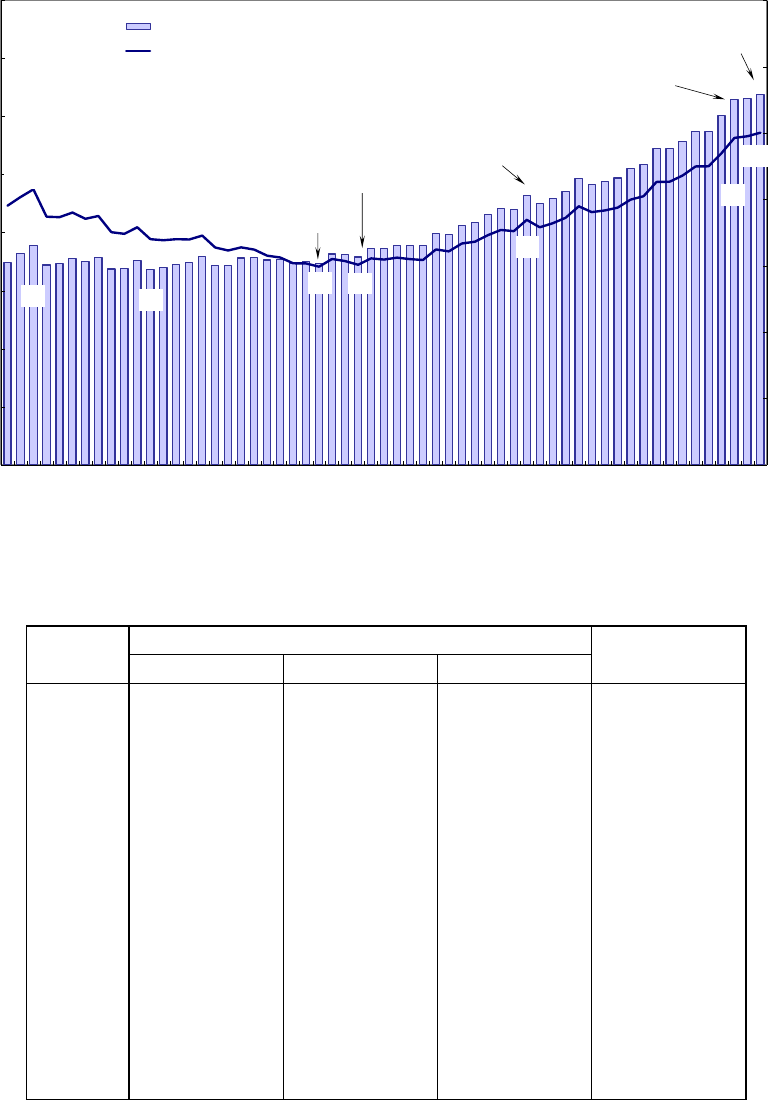
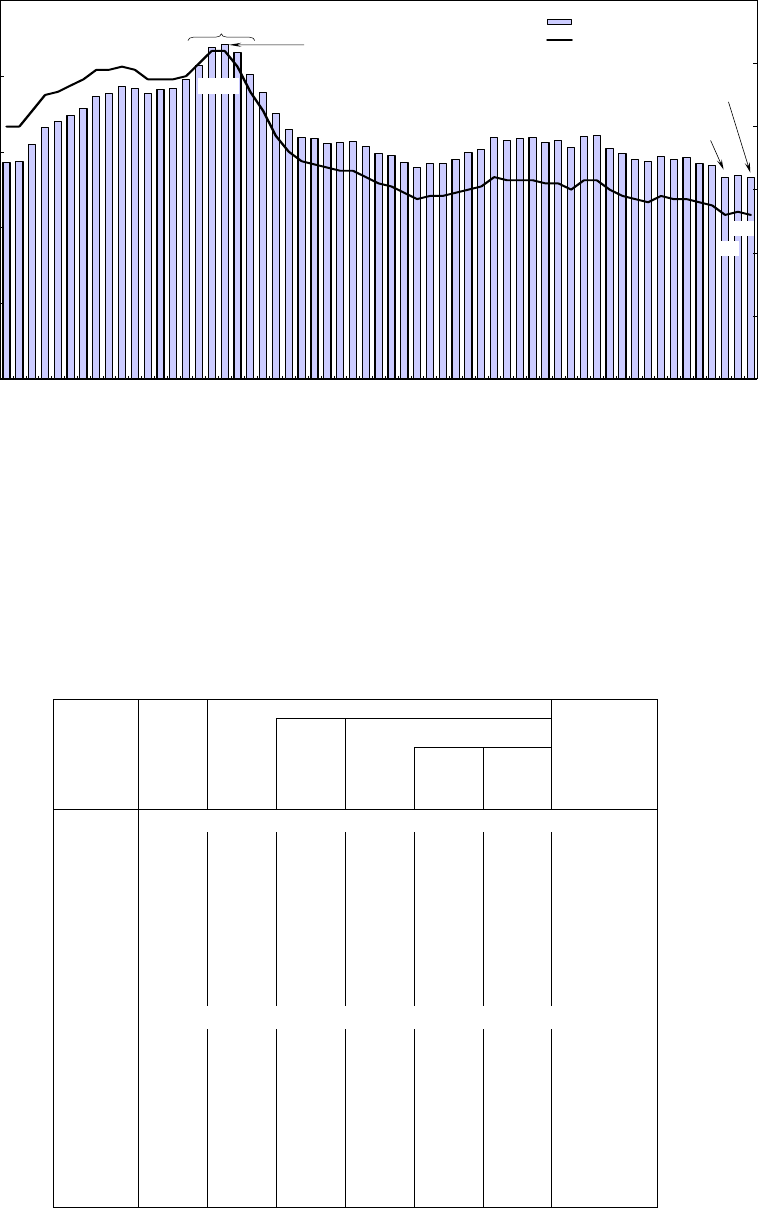
(6) Marriages
Regarding trends in marriages, number of marriages and marriage rates had rapidly
declined after the second marriage boom during 1970-1973, and the marriage rates of 10.4
(per 1,000 population) in 1971 and 1972 decreased by half to 5.2 in 2013 (Figure 8).
Figure 8. Trends in marriages and marriage rates, 1955-2013
Observing distributions of marriages in Japan between Japanese and foreigners, the
percentages of marriages in which “one of couple is foreigner” have been declining since 2007.
In 2013, the percentage of marriages for “Japanese groom and foreign bride” was 2.3 %,
“Japanese bride and foreign groom” was 0.9 % (Table 7).
Table 7. Trends in marriages and percent distribution by nationality of groom and bride
(Japanese or Foreigner), 2000,2005-2013
0
2
4
6
8
10
12
0
25
50
75
100
125
1955 '60 '65 '70 '75 '80 '85 '90 '95 2000 '05 '10 '13
Marriage rates (per 1,000 population)
Marriages
(Ten thousands)
Marriages
Marriage rates
1970-1973
Second marriage boom
5.2
Year 2013
66
10.4
1972
110
2011
67
5.2
Japanese in Japan
Japanese
couple
One of couple is foreigner
Japanese
groom and
foreign bride
Japanese
bride and
foreign
groom
Marriages (couples)
2000 801 466 798 138 761 875 36 263 28 326 7 937 3 328
2005 718 102 714 265 672 784 41 481 33 116 8 365 3 837
2006 735 132 730 971 686 270 44 701 35 993 8 708 4 161
2007 724 169 719 822 679 550 40 272 31 807 8 465 4 347
2008 730 473 726 106 689 137 36 969 28 720 8 249 4 367
2009 711 511 707 734 673 341 34 393 26 747 7 646 3 777
2010 703 943 700 214 670 007 30 207 22 843 7 364 3 729
2011 665 393 661 895 635 961 25 934 19 022 6 912 3 498
2012 672 289 668 869 645 212 23 657 17 198 6 459 3 420
2013 663 740 660 613 639 125 21 488 15 442 6 046 3 127
Percent distribution (%)
2000 100.0 99.6 95.1 4.5 3.5 1.0 0.4
2005 100.0 99.5 93.7 5.8 4.6 1.2 0.5
2006 100.0 99.4 93.4 6.1 4.9 1.2 0.6
2007 100.0 99.4 93.8 5.6 4.4 1.2 0.6
2008 100.0 99.4 94.3 5.1 3.9 1.1 0.6
2009 100.0 99.5 94.6 4.8 3.8 1.1 0.5
2010 100.0 99.5 95.2 4.3 3.2 1.0 0.5
2011 100.0 99.5 95.6 3.9 2.9 1.0 0.5
2012 100.0 99.5 96.0 3.5 2.6 1.0 0.5
2013 100.0 99.5 96.3 3.2 2.3 0.9 0.5
Year
Total
Foreigners
in Japan

- 11 -
(7) Divorces
Regarding trends in divorces, number of divorces fluctuated around 70,000, and divorce
rates (per 1,000 population) between 0.7 and 0.8 during 1955-1964. In 2002, both divorces
and divorce rates hit a record high of 291,476 couples and divorce rate of 2.29, but they have
been on a downward trend in recent years (Figure 9).
Figure 9. Trends in divorces and divorce rates, 1955-2013
0.73
1983
18
2013
23
Year 1963
7
1.51
2.29
0.0
0.5
1.0
1.5
2.0
2.5
3.0
3.5
0
5
10
15
20
25
30
35
1955 '60 '65 '70 '75 '80 '85 '90 '95 2000 '05 '10 '13
Divorce rates (per 1,000 population)
Divorces
(Ten thousands)
Divorces
Divorce rates
1.83
2002
29
Observing the distributions of divorces in Japan by Japanese and by foreigners, the
percentage of divorces in which “one of couple is foreigner” has been declining since 2010.
In 2013, the percentage of divorces for “Japanese husband and foreign wife” was 5.1%,
“Japanese wife and foreign husband“ was 1.4% (Table 8).
Table 8. Trends in divorces and percent distribution by nationality of husband and wife
(Japanese or Foreigner), 2000,2005-2013
Japanese in Japan
Japanese
couple
One of couple is foreigner
Japanese
husband and
foreign wife
Japanese
wife and
foreign
husband
Divorces (couples)
2000 265 752 264 246 251 879 12 367 9 607 2 760 1 506
2005 263 163 261 917 246 228 15 689 12 430 3 259 1 246
2006 258 778 257 475 240 373 17 102 13 713 3 389 1 303
2007 256 308 254 832 236 612 18 220 14 784 3 436 1 476
2008 252 669 251 136 232 362 18 774 15 135 3 639 1 533
2009 255 092 253 353 233 949 19 404 15 570 3 834 1 739
2010 253 135 251 378 232 410 18 968 15 258 3 710 1 757
2011 237 358 235 719 217 887 17 832 14 224 3 608 1 639
2012 236 996 235 406 219 118 16 288 12 892 3 396 1 590
2013 232 821 231 383 216 187 15 196 11 887 3 309 1 438
Percent distribution (%)
2000 100.0 99.4 94.8 4.7 3.6 1.0 0.6
2005 100.0 99.5 93.6 6.0 4.7 1.2 0.5
2006 100.0 99.5 92.9 6.6 5.3 1.3 0.5
2007 100.0 99.4 92.3 7.1 5.8 1.3 0.6
2008 100.0 99.4 92.0 7.4 6.0 1.4 0.6
2009 100.0 99.3 91.7 7.6 6.1 1.5 0.7
2010 100.0 99.3 91.8 7.5 6.0 1.5 0.7
2011 100.0 99.3 91.8 7.5 6.0 1.5 0.7
2012 100.0 99.3 92.5 6.9 5.4 1.4 0.7
2013 100.0 99.4 92.9 6.5 5.1 1.4 0.6
Year
Total
Foreigners
in Japan
