Bill de Blasio
Mayor
Vincent Sapienza, P.E.
Commissioner
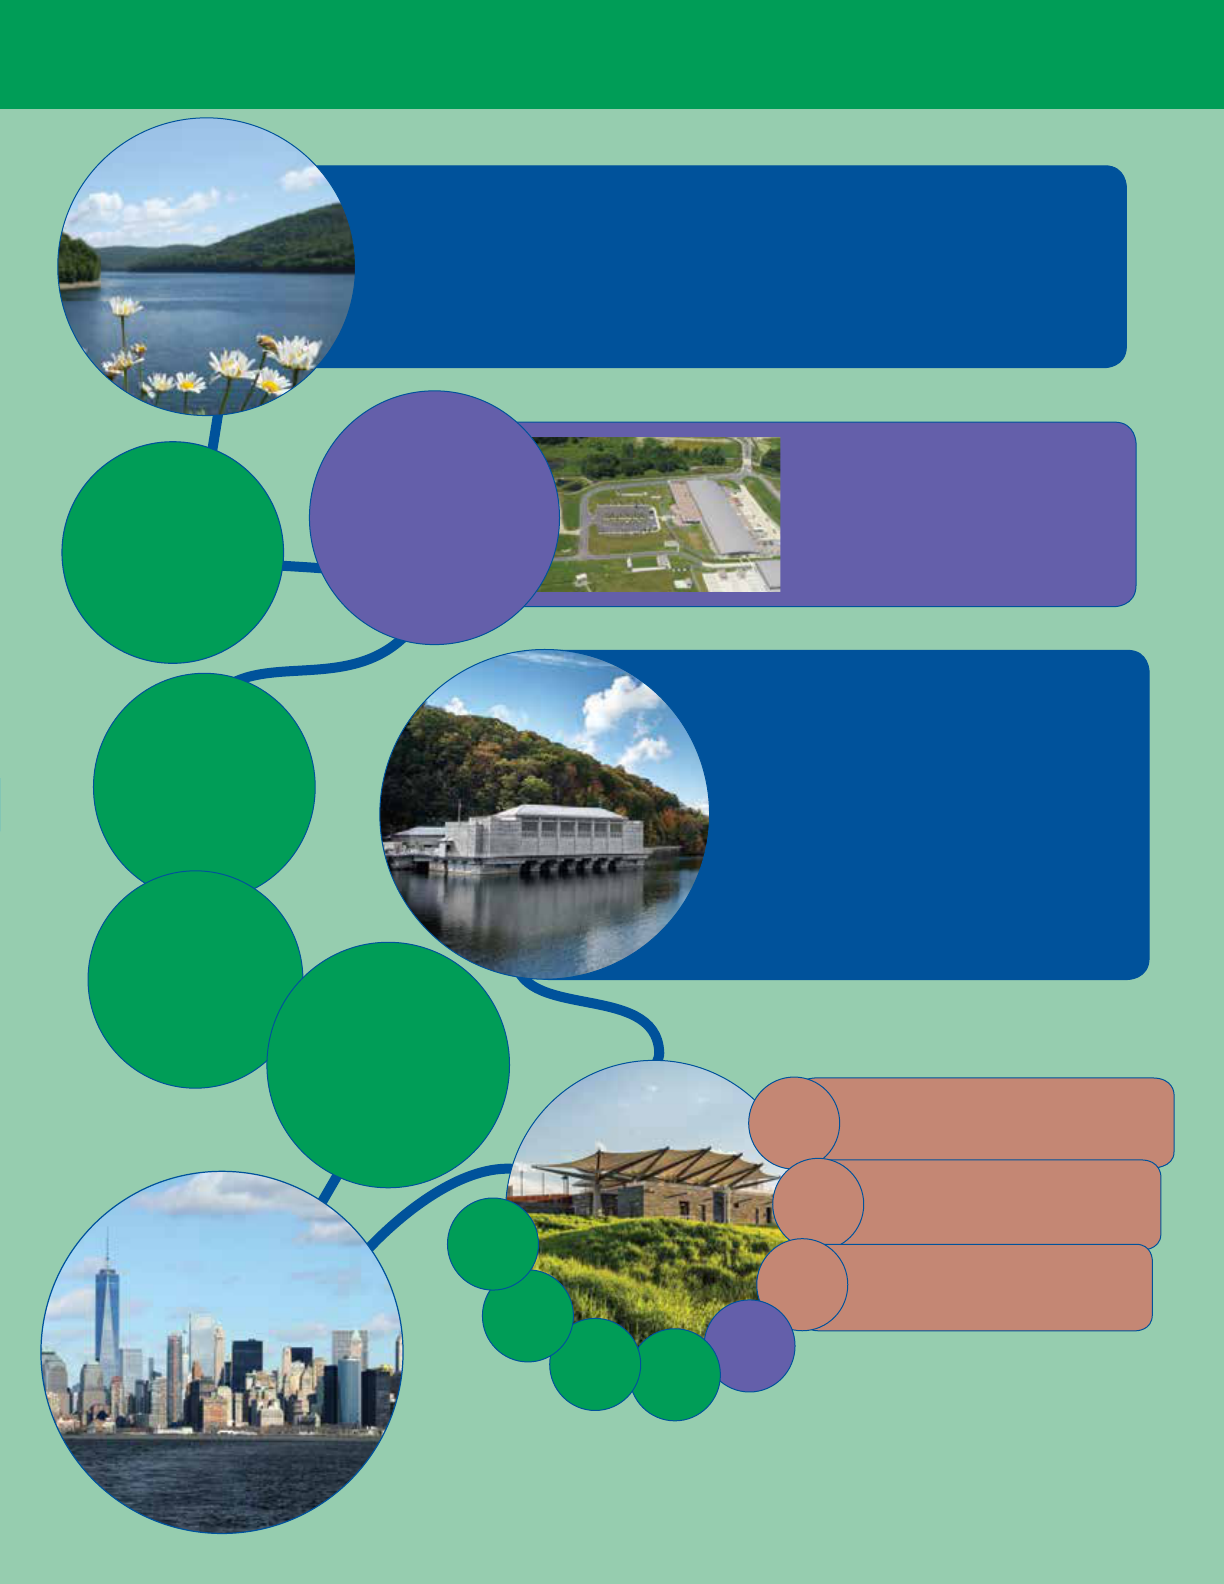
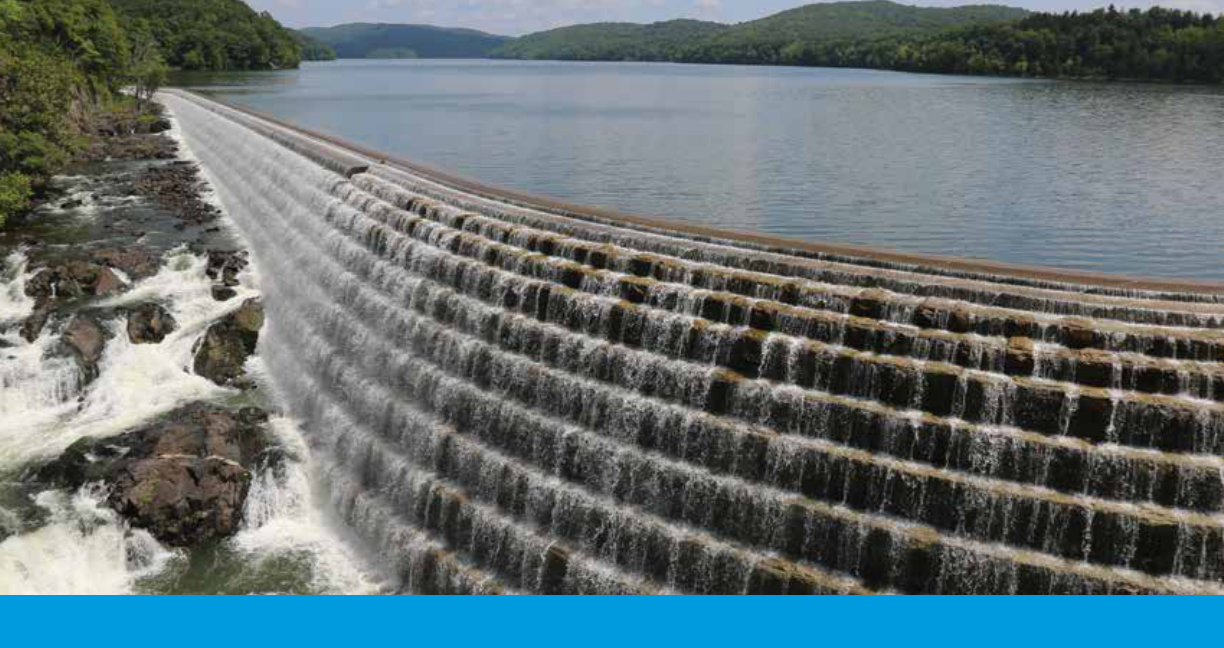
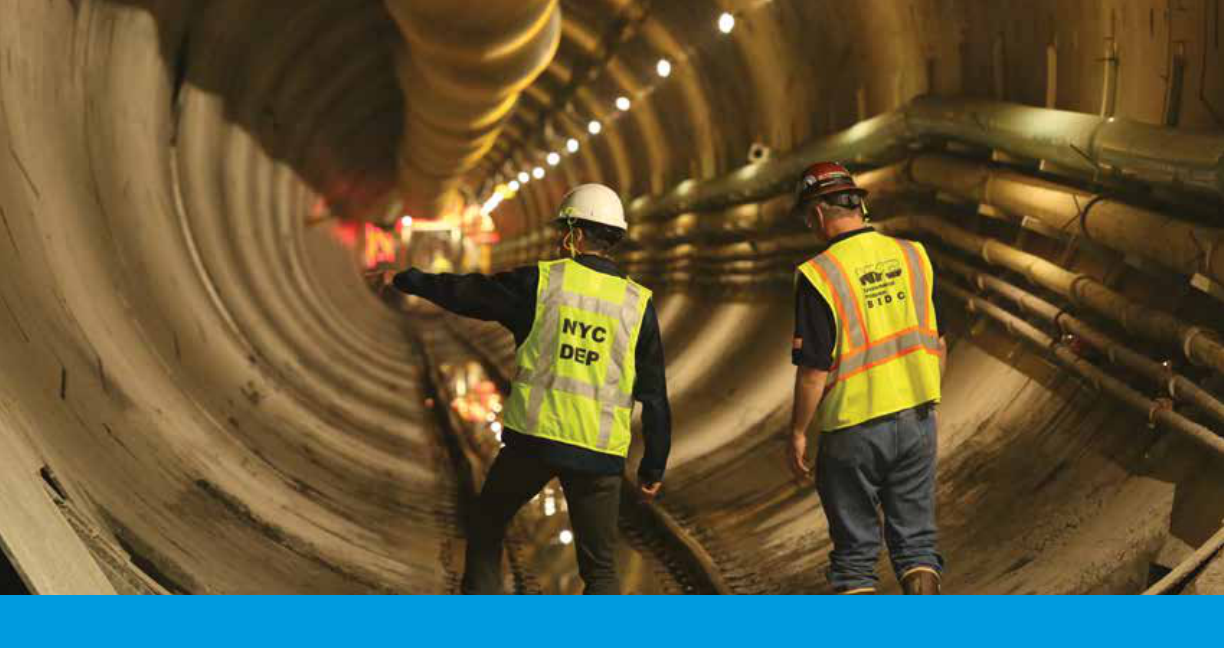
Tunneling through at Schoharie Reservoir
New York City
2018 Drinking Water
Supply and Quality
Report
Esopus
Creek
S
h
a
n
d
a
k
en
Tu
n
n
e
l
PENNSYLVANIA
NEW YORK
NEW JERSEY
CONNECTICUT
CONNECTICUT
NEW YORK
MASSACHUSETTS
New York
Bay
Delaware
River
Hudson
River
Long Island Sound
Delaware Aqueduct
N
ew Crot
o
n
A
q
u
e
d
uct
DELAWARE
COUNTY
SCHOHARIE
COUNTY
GREENE
COUNTY
ULSTER
COUNTY
SULLIVAN
COUNTY
DUTCHESS
COUNTY
ORANGE
COUNTY
NASSAU
COUNTY
CHENANGO
COUNTY
OTSEGO
COUNTY
ALBANY
COUNTY
RENSSELAER
COUNTY
COLUMBIA
COUNTY
PUTNAM
COUNTY
ROCKLAND
COUNTY
WESTCHESTER
COUNTY
West Branch
Reservoir
New Croton
Reservoir
Kensico
Reservoir
Neversink
Reservoir
Pepacton
Reservoir
Ashokan
Reservoir
Schoharie
Reservoir
Rondout
Reservoir
Cannonsville
Reservoir
H
u
dson
R
i
v
e
r
Hillview
Reservoir
N
e
v
e
r
s
i
n
k
R
i
v
e
r
West Branch
Delaware
East Branch
Delaware
Oneonta
Gilboa
Deposit
Liberty
Kingston
Poughkeepsie
Ellenville
White
Plains
Delhi
Walton
Hunter
Phoenicia
Downsville
East Delaware Tunnel
West Delaware Tunnel
Neversink
Tunnel
2
5
M
i
l
e
s
(
f
r
o
m
C
i
t
y
H
a
l
l
)
5
0
M
i
l
e
s
7
5
M
i
l
e
s
1
0
0
M
i
l
e
s
1
2
5
M
i
l
e
s
Croton
Watershed
Croton
Watershed
Atlantic Ocean
Catskill/Delaware
Watersheds
Catskill/Delaware
Watersheds
East Branch
Reservoir
Bog Brook
Reservoir
Croton Falls
Reservoir
Boyds Corner
Reservoir
Diverting
Reservoir
Lake
Gleneida
Muscoot
Reservoir
Middle
Branch
Reservoir
Titicus
Reservoir
Amawalk
Reservoir
Cross River
Reservoir
Lake
Gilead
Kirk
Lake
C
a
t
s
k
i
l
l
D
e
l
a
w
a
r
e
Jerome Park
Reservoir
City Tunnel No. 3
Silver Lake Park
(Underground Storage Tanks)
Manhattan
n
Richmond Tunnel
Brooklyn
Staten
Island
Bronx
Queens
C
a
t
s
k
i
l
l
A
q
u
e
d
u
c
t
BROOKLYN
STATEN
ISLAND
Long Island Sound
East River
Hudson River
Lower
New York
Bay
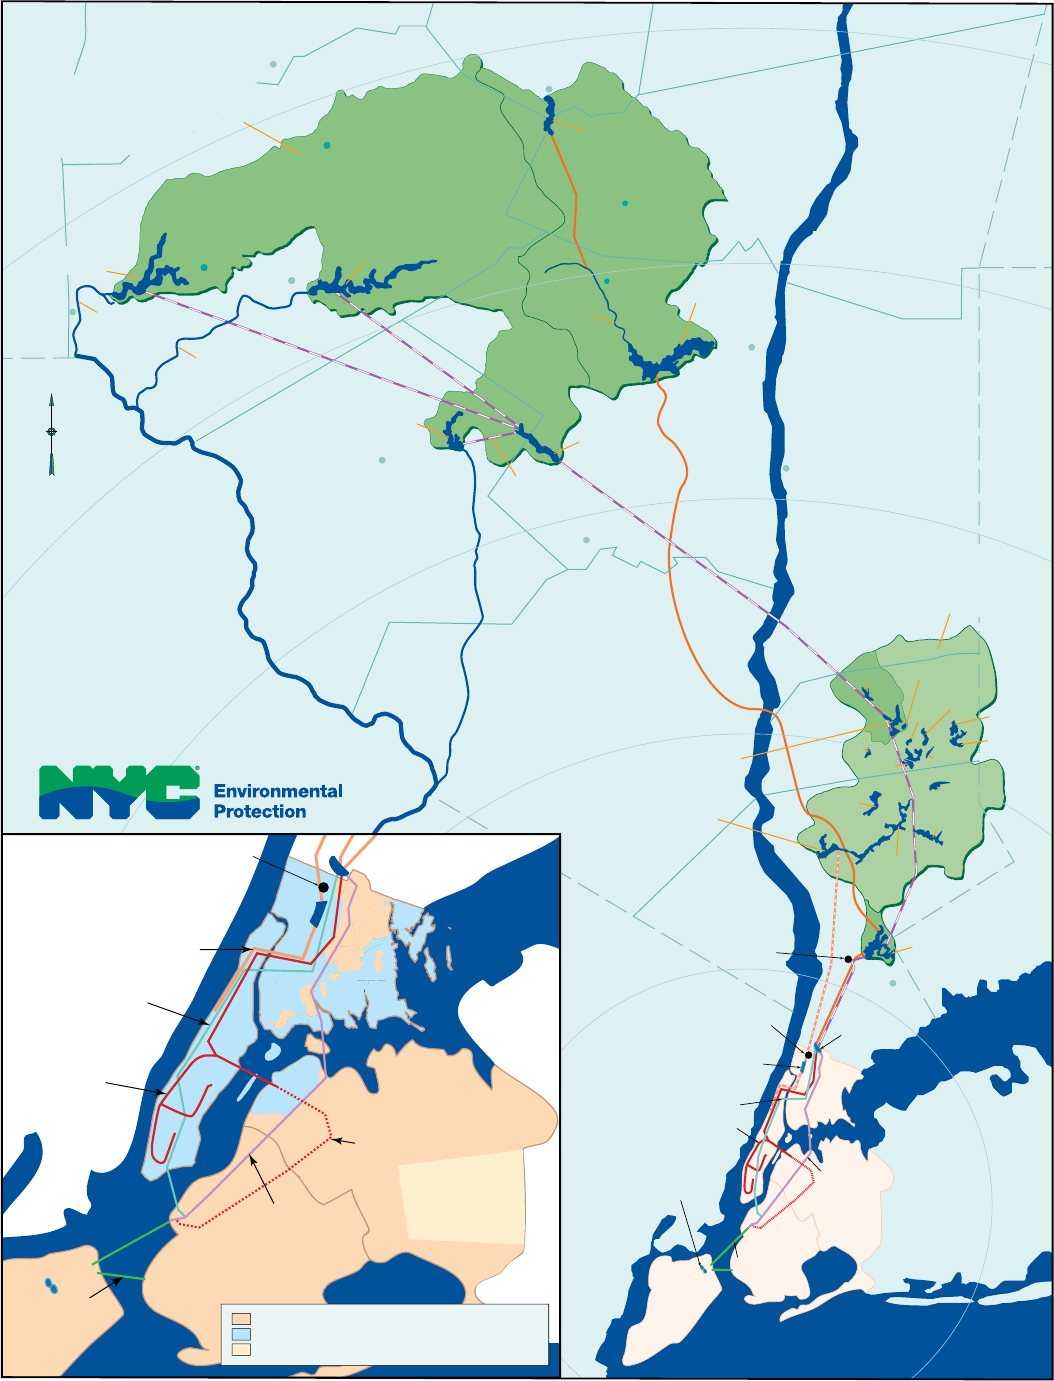
NEW YORK CITY
WATER TUNNELS AND
DISTRIBUTION AREAS
NY City Line
Catskill/Delaware water service area
Croton and Catskill/Delaware blended water service area
Groundwater supply system (offline)
Richmond Tunnel
City Tunnel No. 3
City Tunnel No. 1
City Tunnel No. 2
Hillview
Reservoir
BRONX
MANHATTAN
Jerome Park
Reservoir
QUEENS
Silver Lake Park
(Underground Storage Tanks)
New Croton
Aqueduct
City Tunnel No. 3 (Stage 2)
Queens/Brooklyn Leg
(Activation Ready)
City Tunnel No. 1
MAP NOT TO SCALE
Croton Water
Filtration Plant
City Tunnel No. 2
Croton Water
Filtration Plant
Cat/Del
UV Facility
Staten Island
Siphon
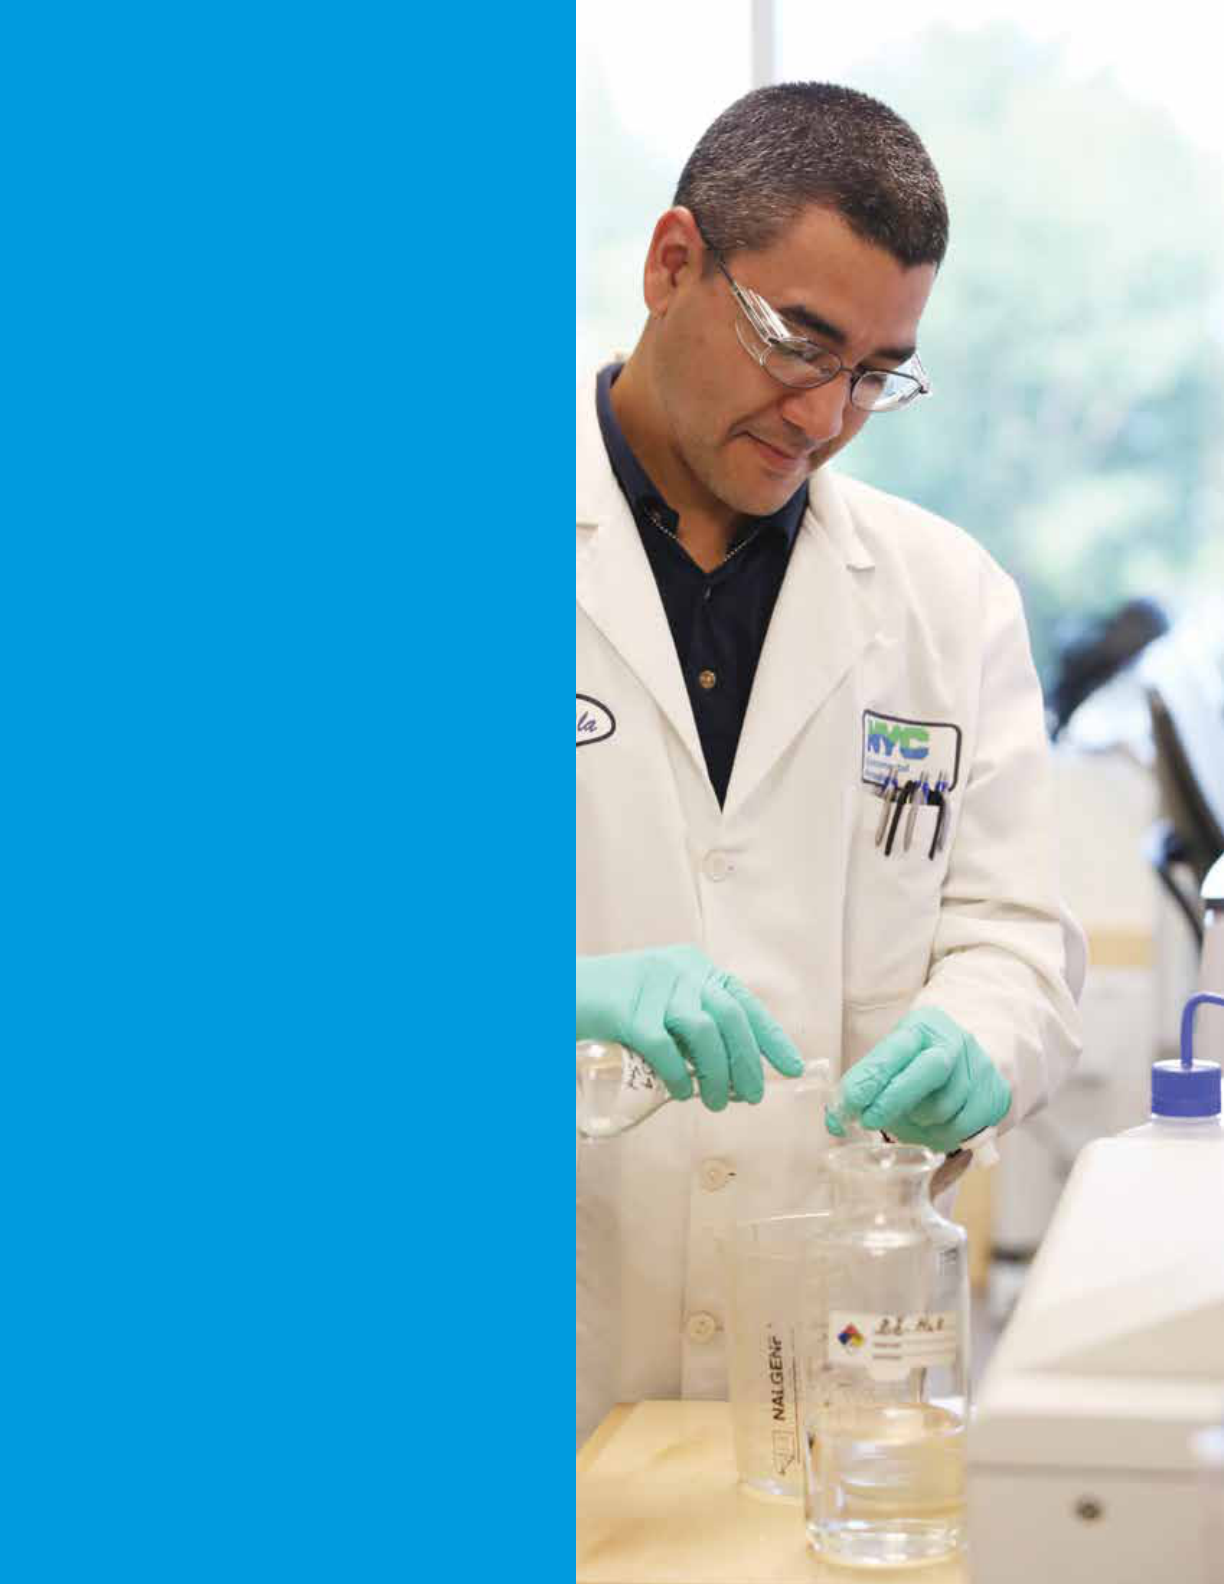
Dear Friends:
On behalf of my nearly 6,000 colleagues at the Department of Environmental Protection
(DEP), I am proud to report that New York City continues to enjoy some of the best tap
water in the world. In 2018, we continued to deliver more than 1 billion gallons of clean
and delicious drinking water to nearly 10 million people every day.
Many communities throughout the United States remain concerned about the safety of
their public water supplies. Here in New York, we are fortunate to have a water supply that
is well protected and operated by dedicated scientists, engineers and other professionals
who have earned admiration among their colleagues throughout the world.
The evidence of New York City’s high-quality drinking water is in the numbers and on
your taste buds.
In this report, you will see that New York City’s drinking water continued to meet or sur-
pass every national and state standard for quality. These data are based on 53,200 sam-
ples that were collected by DEP scientists throughout our reservoir system, and at nearly
1,000 street-side sampling stations in every neighborhood across the City. Those samples
were analyzed 654,000 times by scientists working in our four water quality laboratories.
Robotic monitoring stations on our reservoirs provided another 1.3 million tests to ensure
DEP was sending the best-quality water to New York City at all times.
The excellent scientic results were validated last summer by our customers and other
New Yorkers. In 2018, New York City earned rst place in the New York State Tap Water
Taste Test competition. That honor was based on hundreds of people who lined up in
New York City and at the state fair in Syracuse to taste water from dozens of cities, towns,
and villages. In the end, New York City earned the blue ribbon for our great-tasting water.
None of these good results happen by accident. Our drinking water system relies on
vast reservoirs, large dams, hundreds of miles of aqueducts, and thousands of miles of
water mains. Steady and focused investment in drinking water infrastructure is key to the
future of New York City. That is why you will also nd in this report news about a number
of infrastructure investments DEP is making now and in the decades ahead. In 2018, we
announced a $1.2 billion tunneling project in Westchester County to improve opera-
tional resiliency and exibility between a key reservoir and treatment facility. The largest
repair project in the history of our water supply system, the $1 billion Delaware Aqueduct
Bypass Tunnel, continued to make steady progress last year as a tunneling machine exca-
vated toward the Hudson River. You will nd details about these and other projects in the
pages that follow.
As we look forward to 2019 and beyond, I want to thank you for entrusting DEP with the
operation, protection, and maintenance of your drinking water supply. We take great
pride in delivering the best water to millions of New Yorkers every day.
Sincerely,
Vincent Sapienza, P.E.
Commissioner
Vincent Sapienza, P.E.
Commissioner
2
New York City 2018 Drinking Water Supply and Quality Report
WHERE DOES NEW YORK
CITY’S DRINKING WATER
COME FROM?
New York City gets its drinking
water from 19 reservoirs and three
controlled lakes spread across a
nearly 2,000-square-mile water-
shed. The watershed is not located
in New York City, but rather upstate,
in portions of the Hudson Valley and
Catskill Mountains that are as far as
125 miles north of the City. A map
of the watershed and reservoirs can
be found on the inside of the front
cover of this report. The New York
City Water Supply System, Public
Water System Identication Num-
ber (PWSID) NY7003493, consists
of three individual water supplies
called the Catskill/Delaware supply,
Pepacton Reservoir
located in Delaware, Greene, Schoha-
rie, Sullivan, and Ulster counties; the
Croton supply, New York City’s origi-
nal upstate supply, in Putnam, West-
chester, and Dutchess counties; and a
groundwater supply in southeastern
Queens. Although the Department of
Environmental Protection (DEP) has
a permit to operate the groundwater
supply, water from that system has
not been delivered to customers in
many years.
In 2018, New York City received a
blend of drinking water from the
Catskill/Delaware and Croton sup-
plies. The Catskill/Delaware supply
provided approximately 94 percent of
the water, and approximately six per-
cent was supplied by Croton.
NEW YORK CITY’S WATER SUPPLY
The New York City Water Supply System provides approximately one
billion gallons of safe drinking water daily to more than 8.6 million resi-
dents of New York City, and to the millions of tourists and commuters
who visit the City throughout the year. The water supply system also
provides about 105 million gallons a day to approximately one mil-
lion people living in the counties of Westchester, Putnam, Orange, and
Ulster. In all, the New York City Water Supply System provides nearly half
the population of New York State with high-quality drinking water.
3
Croton Water Supply located in Putnam, Westchester, and
Dutchess counties
The Croton supply is filtered by the Croton Water
Filtration Plant, located underground in the Bronx. The
plant has the ability to filter up to 290 million gallons
of drinking water each day, which helps to ensure
a sufficient supply of water for the City in the event
of drought, and increases the flexibility of New York
City’s supply against the potential effects of climate
change. The Croton Water Filtration Plant first began
operating in May 2015. In 2018, it was in operation from
May 17 to August 15, September 26 to October 14, and
October 17 until December 31, 2018.
Chlorine
Water is disinfected
with chlorine which is
a common disinfectant
added to kill germs and
stop bacteria from
growing on pipes.
Catskill/Delaware Ultraviolet
(UV) Disinfection Facility
It is the largest of its kind in the world
located in Westchester County. The
facility is designed to disinfect more
than 2 billion gallons of water per day.
NYC Distribution
to the Customer
Other
Treatment
Disinfection
Disinfection
* During 2018, only 0.3 percent of the water produced by Catskill/Delaware supply was not fluoridated.
** During 2018, only 0.06 percent of the water produced by the Croton Water Filtration Plant was not fluoridated.
Catskill/Delaware Supply located in Delaware, Greene, Schoharie, Sullivan, and Ulster counties
Due to the very high quality of our Catskill/Delaware supply, New York City is one of only five
large cities in the country with a surface drinking water supply that does not utilize filtration as
a form of treatment. Rather, the Catskill/Delaware supply operates under a Filtration Avoidance
Determination (FAD), and the water from the supply is treated using two forms of disinfection to
reduce microbial risk.
UV Light
At the UV Disinfection
Facility exposure to UV
light inactivates potentially
harmful microorganisms. UV
treatment does not change
the water chemically, as
nothing is added except
energy.
Other
Treatment
Croton Water
Filtration Plant
Filtration
Chemicals are added to untreated water,
causing particulates to bunch together
and become larger particles called floc.
Coagulation
Fluoride*
Added to water
to improve dental
protection, it is effective
in preventing cavities at
a federally approved
level of 0.7 mg/L.
Sodium
Hydroxide
Added to raise the pH,
it reduces corrosion of
household plumbing.
Food Grade
Phosphoric Acid
Added because it creates
a protective film on pipes
that reduces the release
of metals, such as lead,
from service lines and
household plumbing.
Dissolved
Air
Flotation
Injected air bubbles float the floc to
the top where it is skimmed off.
Sand
Filtration
The water flows through a bed of sand
removing any remaining particles.
UV Light
Chlorine
Food
Grade
Phosphoric
Acid
Sodium
Hydroxide
Fluoride**
HOW DOES NEW YORK CITY TREAT ITS WATER SUPPLIES?
4
New York City 2018 Drinking Water Supply and Quality Report
REGULATION OF
DRINKING WATER
The sources of drinking water (both
tap water and bottled water) include
rivers, lakes, streams, ponds, reser-
voirs, springs, and wells. As water
travels over the surface of the land
or through the ground, it dissolves
naturally-occurring minerals and,
in some cases, radioactive material,
and can pick up substances result-
ing from the presence of animals
or from human activities. Con-
taminants that may be present in
source water include: microbial con-
taminants, inorganic contaminants,
pesticides and herbicides, organic
chemical contaminants, and radio-
active contaminants.
To ensure that tap water is safe to
drink, the New York State Depart-
ment of Health (NYSDOH) and
the United States Environmental
Protection Agency (EPA) prescribe
regulations that limit the amount
of certain contaminants in water
provided by public water systems.
The NYSDOH and the federal Food
and Drug Administration’s (FDA)
regulations establish limits for con-
taminants in bottled water, which
must provide the same protection
for public health. The presence of
contaminants does not necessarily
indicate that water poses a health
risk. These regulations also establish
the minimum amount of testing and
monitoring that each system must
undertake to ensure that the tap
water is safe to drink.
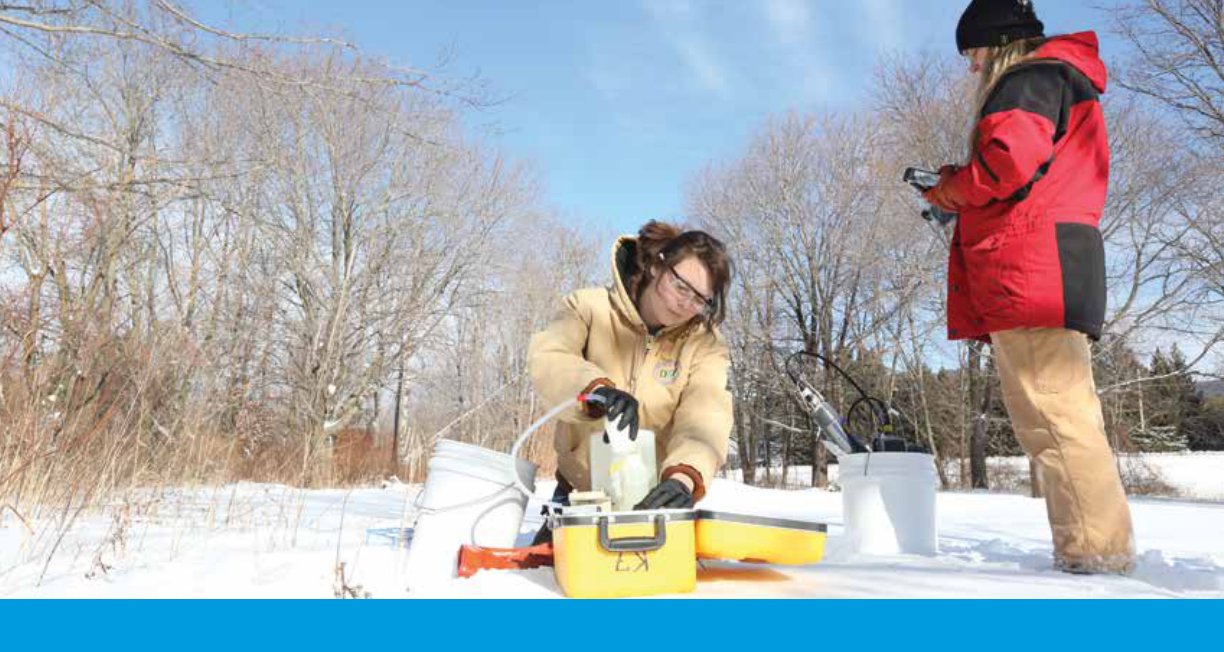
DEP’s water quality monitoring
program – far more extensive than
required by law – demonstrates that
the quality of New York City’s drink-
ing water remains high and meets
all state and federal drinking water
standards. Additional information
concerning drinking water can be
found at: www.epa.gov/safewater or
www.health.ny.gov.
DRINKING WATER
SAMPLING AND
MONITORING
DEP monitors the water in the dis-
tribution system, upstate reservoirs
and feeder streams, and wells that
are sources for New York City’s drink-
ing water supply. To accomplish this
goal, throughout the watershed and
as the water enters the distribution
system, DEP continuously monitors
and conducts analyses for certain
water quality parameters, includ-
ing microbiological, chemical, and
physical measures. DEP also regu-
larly tests water quality at nearly
1,000 water quality sampling sta-
tions throughout New York City. In
2018, DEP performed approximately
414,000 analyses on 37,500 samples
from the distribution system, meet-
ing all state and federal monitoring
requirements. These data are sum-
marized in tables starting on page
10. Additionally, DEP performed
approximately 240,000 analyses on
15,700 samples from the upstate
reservoir watersheds, and took close
to 1.3 million robotic monitoring
measurements to support Filtration
Avoidance Determination (FAD)
watershed protection programs and
to optimize water quality.
DEP scientists in the watershed
DRINKING WATER QUALITY
5
New York City 2018 Drinking Water Supply and Quality Report
New York City’s water is healthy and safe to drink. It is deliv-
ered virtually lead free from our upstate reservoir system
to more than nine million New Yorkers. However, some
older homes may contain lead plumbing that releases small
amounts of lead into the water. Fortunately, residents can
take simple steps to minimize their exposure.
What Are The Health Impacts of Lead?
Lead is a metal that can be harmful, especially to young
children and pregnant women. It is a neurotoxin that can
impact a young child's development, behavior, and ability
to learn. Lead exposure during pregnancy may contribute to
low birth weight and developmental delays in infants. There
are many sources of lead in the environment, most notably
peeling paint, and it is important to reduce exposure to lead
as much as possible.
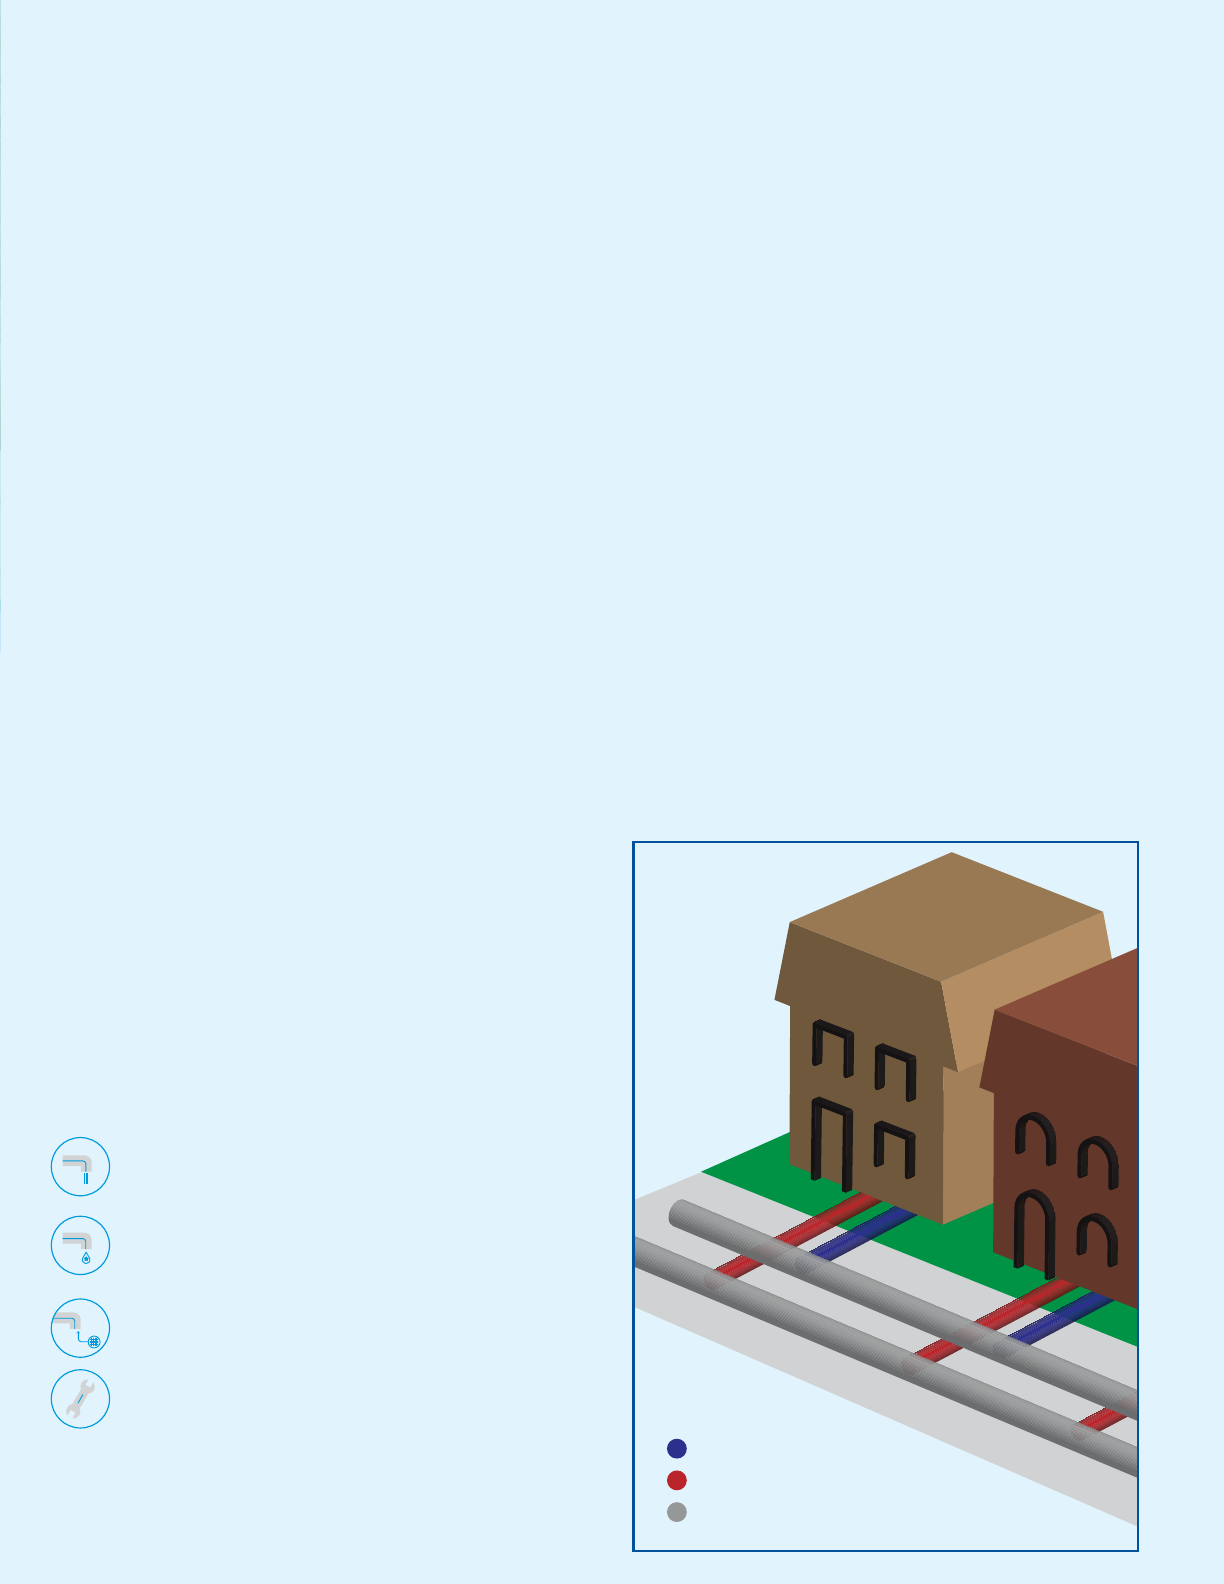
Can Lead Get In My Drinking Water?
Lead can be released when drinking water is in contact
with older plumbing materials that contain lead, like pipes,
solder, faucets, ttings, and valves. If water has not been
used for several hours, such as overnight, more lead can be
released into the water. DEP treats NYC’s water supply to
reduce this release, and our frequent testing conrms that
it is eective. Nonetheless, that treatment cannot always
reduce lead in every faucet to a safe level all of the time.
Monitoring Drinking Water for Lead
The federal Lead and Copper Rule was established in the
1990s to require all municipalities to regularly test drinking
water for these two metals, and to take protective measures
if standards are not met. DEP analyzes the drinking water
from hundreds of homes each year, and these samples con-
rm that drinking water meets the federal standards. These
results are presented in the table on page 13 of this report.
How Can I Limit My Lead Exposure?
DEP recommends you take the following steps when using
drinking water for drinking or cooking to reduce lead
exposure:
Run your water for at least 30 seconds or until it gets
cold. Once the water is cold, run it for 15 seconds more.
Use cold water for cooking, drinking, or preparing
infant formula. Hot water is more likely to contain lead
and other metals.
Remove and clean the faucet screen (also called an aer-
ator) monthly, where small particles can get trapped.
Hire a licensed plumber to identify and replace plumb-
ing xtures and/or service lines that contain lead.
How Do I Get My Water Tested for Lead?
If you are concerned about lead in your drinking water, you
can have your home’s water tested at no cost. DEP oers
free testing kits, with prepaid postage, to all New York City
residents. DEP’s Free Residential Testing Program is the larg-
est of its kind in the nation. DEP has distributed approxi-
mately 130,000 sample collection kits since the start of the
program. Call 311 or visit www.nyc.gov/apps/311 to request a
free lead test kit.
Who Can I Contact?
For health-related questions:
Õ Call NYC Health Department – Healthy Homes at
(646) 632-6023
Õ Visit www.nyc.gov/health - Healthy Homes, Lead Poisoning
Prevention
Õ Contact your health care provider if you need a blood test
for you or your child
For questions about lead in drinking water:
Õ Call DEP Lead Unit at (718) 595-5364 or
Õ Email DEPLeadUn[email protected]v
Õ Visit www.nyc.gov/dep/leadindrinkingwater
Õ Call the Safe Drinking Water Hotline (1-800-426-4791) or
visit www.epa.gov/safewater/lead.
Sewer Main
Water Main
Homeowner’s Water Service Line
Homeowner’s Sewer Line
DEP Water and Sewer Mains
LEAD IN DRINKING WATER
6
New York City 2018 Drinking Water Supply and Quality Report
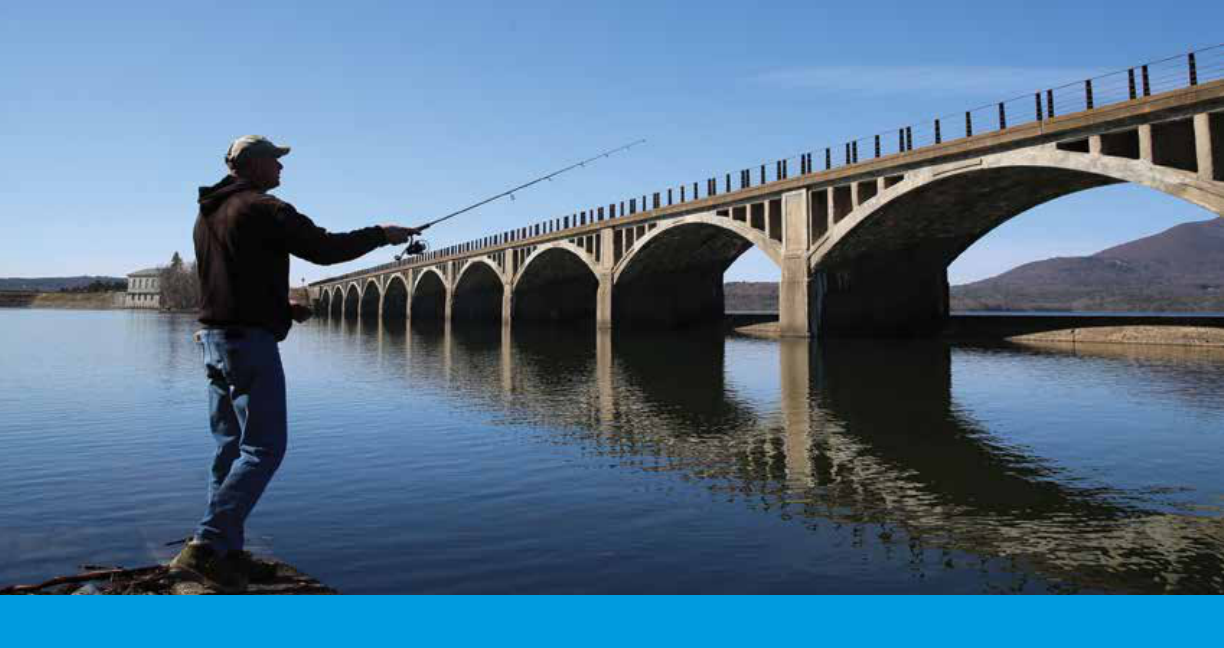
Fishing in the watershed
WATERSHED PROTECTION
AND POLLUTION
PREVENTION PROGRAMS
Source Water Assessment Program
Federal regulations require states
to develop and implement source
water assessment programs to iden-
tify the areas that supply public tap
water, inventory contaminants, assess
water system susceptibility to con-
tamination, and inform the public
of the results. The states are given
a great deal of exibility on how to
implement source water assessment
programs. These assessments are
created using available information
to help estimate the potential for
source water contamination. Higher
susceptibility ratings do not mean
that source water contamination has
occurred or will occur in the water
supply; rather, they indicate the need
for water suppliers to implement
additional precautionary measures.
In 1993, New York City secured its
rst FAD for its Catskill/Delaware
supply. That was followed in 1997
by the historic New York City Water-
shed Memorandum of Agreement,
which was signed by the City, state,
and federal regulators, watershed
communities, and environmental
advocates. Since that time, DEP has
been implementing a series of pro-
grams to protect our reservoirs and
the streams that feed them from a
variety of contaminants. These ongo-
ing programs operate under the close
scrutiny of both the NYSDOH and
EPA. Because of these eorts, which
are reported in the Watershed Water
Quality Annual Report, NYSDOH does
not deem it necessary to perform a
source water assessment on the New
York City Water Supply. To view the
DEP Watershed Water Quality Annual
Report, visit www1.nyc.gov/html/dep/
pdf/reports/fad_5.1_watershed_monitor-
ing_program-2017-watershed_water_qual-
ity_annual_report_07-18.pdf.
MAINTAINING NEW
YORK CITY’S WORLD-
RENOWNED WATER
SUPPLY
10-Year Filtration Avoidance
Determination
DEP funds and administers a number
of watershed protection and pollu-
tion prevention programs to maintain
the high quality of our drinking water.
These science-based strategies are
designed to protect New York City’s
drinking water at its source by keep-
ing pollution out of our reservoirs
and the streams, creeks, and rivers
that feed them.
In 2017, NYSDOH issued a new
10-year FAD that allows DEP to con-
tinue operating its Catskill/Delaware
supply without ltration through at
least 2027. DEP will commit an esti-
mated $1 billion over the coming
decade to comply with the FAD. That
funding will go toward preserving
watershed lands, upgrading waste-
water infrastructure, implementing
clean water strategies on watershed
farms, and managing streams, for-
ests, and other natural resources that
aect water quality.
Including the new FAD, DEP has com-
mitted more than $2.7 billion toward
its watershed protection programs
since 1993, when the EPA rst issued
the City a waiver from the federal
requirement to lter tap water that
comes from surface sources such as
reservoirs. DEP’s watershed programs
are based on the premise that it is
most cost-eective and environmen-
tally sound to protect the quality
of drinking water at its source. The
ltration waiver allows DEP to avoid
construction of a large ltration plant

7
New York City 2018 Drinking Water Supply and Quality Report
for the Catskill/Delaware supply. Such a
facility is estimated to cost more than $10
billion to construct, which would make
it the largest public works project in the
City’s history.
Over the past 25 years, DEP’s pro-
grams in the watershed have become
a national and international model for
protecting water at its source. Each
year, water utility managers and public
health professionals come from around
the globe to study DEP programs. DEP
has welcomed visitors from Australia,
Canada, Chile, China, Colombia, India,
Singapore, the United Kingdom, and
others who aimed to solve water-quality
challenges by replicating part of New
York City’s protection eorts.
DEP’s source water protection initiatives
and achievements include:
Õ Land acquisition: DEP has preserved
more than 152,000 acres of land
since 1997, in addition to the nearly
45,000 acres of land surrounding its
reservoirs previously owned by the
City. The State of New York owns and
permanently protects 210,000 acres as
parkland or forestland, and other enti-
ties have preserved more than 27,000
acres in the watershed. In all, nearly 40
percent of the watershed is now pre-
served as open space.
Õ Agricultural program: The not-for-
prot Watershed Agricultural Council,
one of DEP’s watershed partners, has
completed more than 450 “whole
farm” plans that incorporate pollution
prevention into the business opera-
tions of local farms. Those plans are
complemented by the installation of
more than 7,800 best management
practices that control runo from
farms and minimize the amount of
nutrients or potential contaminants
entering local streams.
Õ Wastewater treatment plant upgrades:
DEP has completed upgrades on all
private and public wastewater treat-
ment plants in the Catskill/Delaware
watershed.
Õ Septic system repair: The Catskill
Watershed Corporation (CWC),
another partner organization funded
by the City, has invested in the repair
of failing septic systems across the
watershed, with more than 5,500
repairs completed through 2018.
Õ Stream management: DEP has imple-
mented a comprehensive stream
management program to restore the
natural stability and ood resiliency
of streams that feed the reservoir
system. Through 2018, the program
has funded more than 375 projects to
restore stream stability and streamside
vegetation along approximately 44
miles of waterways in the Catskills.
Õ Land management and recreation:
DEP has developed a comprehen-
sive plan to manage the forests on
City-owned land, which naturally
lter the water as it moves toward
the reservoirs. DEP has also opened
nearly 137,000 acres of City-owned
property for shing, hiking, and other
types of low-impact recreation in the
watershed.
Õ Regulatory program: While balanc-
ing the goals of watershed protection
with the needs of the region, DEP
administers a regulatory program to
review and approve new development
proposals in the watershed and works
with local communities to identify
and invest in projects that mitigate
ooding.
The new FAD requires DEP to continue
these core programs. It also requires DEP
fund new eorts to collect and process
wastewater, preserve streams and their
buer lands, and expand our work with
watershed farmers. In addition, the FAD
includes an expert review of the City’s
source water protection programs by
the National Academies of Sciences,
Engineering, and Medicine, which is
expected to be complete in 2020.
More information about the FAD can be
found on the NYSDOH website at:
www.health.ny.gov/environmental/water/
drinking/nycfad.
More information about New York City’s
watershed protection programs can be
found at: www.nyc.gov/watershed.
KENSICO-EASTVIEW
CONNECTION
DEP last year announced plans
for a $1.2 billion tunneling project
in Westchester County that will
improve operational resiliency and
exibility between facilities that
are vital to the treatment of New
York City’s drinking water.
The centerpiece of the project –
known as the Kensico-Eastview
Connection (KEC) – will be a
2-mile-long tunnel between Ken-
sico Reservoir and the Catskill/
Delaware UV Disinfection Facility.
The new aqueduct will provide an
additional conveyance between
these vital components of the
water supply, giving DEP the ability
to take other facilities out of ser-
vice for periodic maintenance or
inspection.
The KEC project will include con-
struction of the new tunnel, facili-
ties to draw water from Kensico
Reservoir and move water into the
UV plant, and other infrastructure
work. DEP has already begun to
collect soil and bedrock samples
from the area to support the
design of the project. Construction
on the rst parts of the KEC project
are expected to start in approxi-
mately ve years; work on the
tunnel itself will start around 2025.
DEP expects to nish the project
around 2035.
The nished tunnel will measure
approximately 27 feet in diam-
eter and run 400-500 feet below
ground. It will be large enough to
carry a maximum of 2.6 billion gal-
lons of water each day. Its design
accounts for future growth in New
York City and Westchester County,
the potential addition of treat-
ment facilities in the future, and
the need to periodically take other
aqueducts out of service for main-
tenance or inspection.
8
New York City 2018 Drinking Water Supply and Quality Report
To advance New York City’s position as a global leader
in sustainability, DEP continues to track and reduce
greenhouse gas (GHG) emissions to meet citywide
climate change objectives. DEP’s water supply, storm-
water, and wastewater management facilities cur-
rently account for 17 percent of total GHG emissions
from New York City government buildings. To oset
our emissions and provide indirect energy co-ben-
ets, DEP has invested in a number of sustainability
programs, including water demand management.
DEP’s commitment to achieving the Mayor’s OneNYC
goal of reducing GHG emissions 80 percent by 2050
(relative to the 2005 baseline) is driving changes in
the way DEP operates. DEP recently measured the
amount of GHG emissions produced by several of our
traditional facilities, including wastewater resource
recovery facilities (WRRFs). However, DEP did not have
a way to measure the inuence water conservation
and demand management has on the agency’s over-
all GHG portfolio.
To improve our data, DEP began in 2016 a Water-
Energy Nexus Study to calculate the relationship
between decreasing water demand and reducing
GHG emissions. The study was based on a simple
premise – if New York City is using less drinking water,
it must also be using less energy and chemicals to
treat its water and wastewater. The goal was to gure
out how these reductions aected our GHG emis-
sions. As part of the study, experts developed a tool
that accurately estimates the GHG emissions that
are avoided as New Yorkers curtail their demand for
water, allowing DEP to use less energy for treatment.
Utilizing the Water Energy Nexus Tool, DEP discov-
ered that its water eciency programs have also
successfully reduced GHG emissions. As of May 2018,
DEP’s water eciency programs have led to a reduc-
tion of 68 metric tons (MT) CO
2
equivalent (CO
2
e) per
year, resulting from retrots of xtures in 400 schools,
replacing 400 spray showers in City parks, and replac-
ing 12,637 toilets in multi-family residential buildings.
Overall, DEP’s sustainability programs have reduced
carbon emissions by over 480 MT CO
2
e per year,
which is equivalent to 131 standard passenger cars
(10,000 miles per year) or 6,406 60-watt lightbulbs
(used for 8 hours per day, every day).
NEW YORK CITY’S WATER ENERGY NEXUS
– LINKING WATER SUSTAINABILITY TO
GREENHOUSE GAS REDUCTIONS
Water quality testing
8
9
New York City 2018 Drinking Water Supply and Quality Report
HOW TO READ THE NEW YORK CITY DRINKING WATER QUALITY TESTING RESULTS
The following section of the Drinking Water Supply and Quality Report compares the quality of your tap water to
federal and state standards for each parameter (if applicable). The monitoring results show that New York City’s
drinking water met all drinking water standards in 2018.
Table 1 reects the compliance monitoring results for all regulated and non-regulated parameters, the number of
samples collected, the range of values detected, the average of the values detected, and the possible sources of
the parameters, unless otherwise footnoted. The monitoring frequency of each parameter varies and is parameter
specic. Data presented are for the Catskill/Delaware and Croton supplies, which were the only sources of water in
2018. Table 2 represents those parameters monitored for, but not detected in any sample.
Most of our data are representative of 2018 testing; concentrations of parameters or contaminants do not change
frequently. For previous years' results you can view our reports at: www.nyc.gov/waterquality.
DEFINITIONS
Action Level (AL):
The concentration of a contaminant, which, if exceeded, triggers treatment or other requirements that a water system must
follow. An exceedance occurs if more than 10 percent of the samples exceed the Action Level.
Maximum Contaminant Level (MCL):
The highest level of a contaminant that is allowed in drinking water. MCLs are set as close to the MCLGs as feasible, using the best
available treatment technology.
Maximum Contaminant Level Goal (MCLG):
The level of a contaminant in drinking water below which there is no known or expected risk to health. MCLGs allow for a margin
of safety.
Maximum Residual Disinfectant Level (MRDL):
The highest level of a disinfectant allowed in drinking water. The addition of a disinfectant is necessary for control of microbial
contaminants.
Maximum Residual Disinfectant Level Goal (MRDLG):
The level of a drinking water disinfectant below which there is no known or expected risk to health. MRDLGs do not reect the
benets of the use of disinfectants to control microbial contamination.
Treatment Technique (TT):
A required process intended to reduce the level of a contaminant in drinking water.
90
Th
Percentile Value:
The values reported for lead and copper represent the 90
th
percentile. A percentile is a value on a scale of 100 that indicates the
percent of a distribution that is equal to or below the value. The 90
th
percentile is equal to or greater than 90 percent of the lead
and copper values detected at your water system.
UNITS & ABBREVIATIONS
CaCO
3
= calcium carbonate
CFU/mL = colony forming units per milliliter
/cm = per centimeter
o
F = degrees Fahrenheit
µg/L = micrograms per liter (10
-6
grams per liter)
µS/cm = microsiemens per centimeter
mg/L = milligrams per liter (10
-3
grams per liter)
MPN/100mL = most probable number per 100 milliliters
ND = lab analysis indicates parameter is not detected
NDL = no designated limits
NTU = nephelometric turbidity units
/50L = per 50 liters
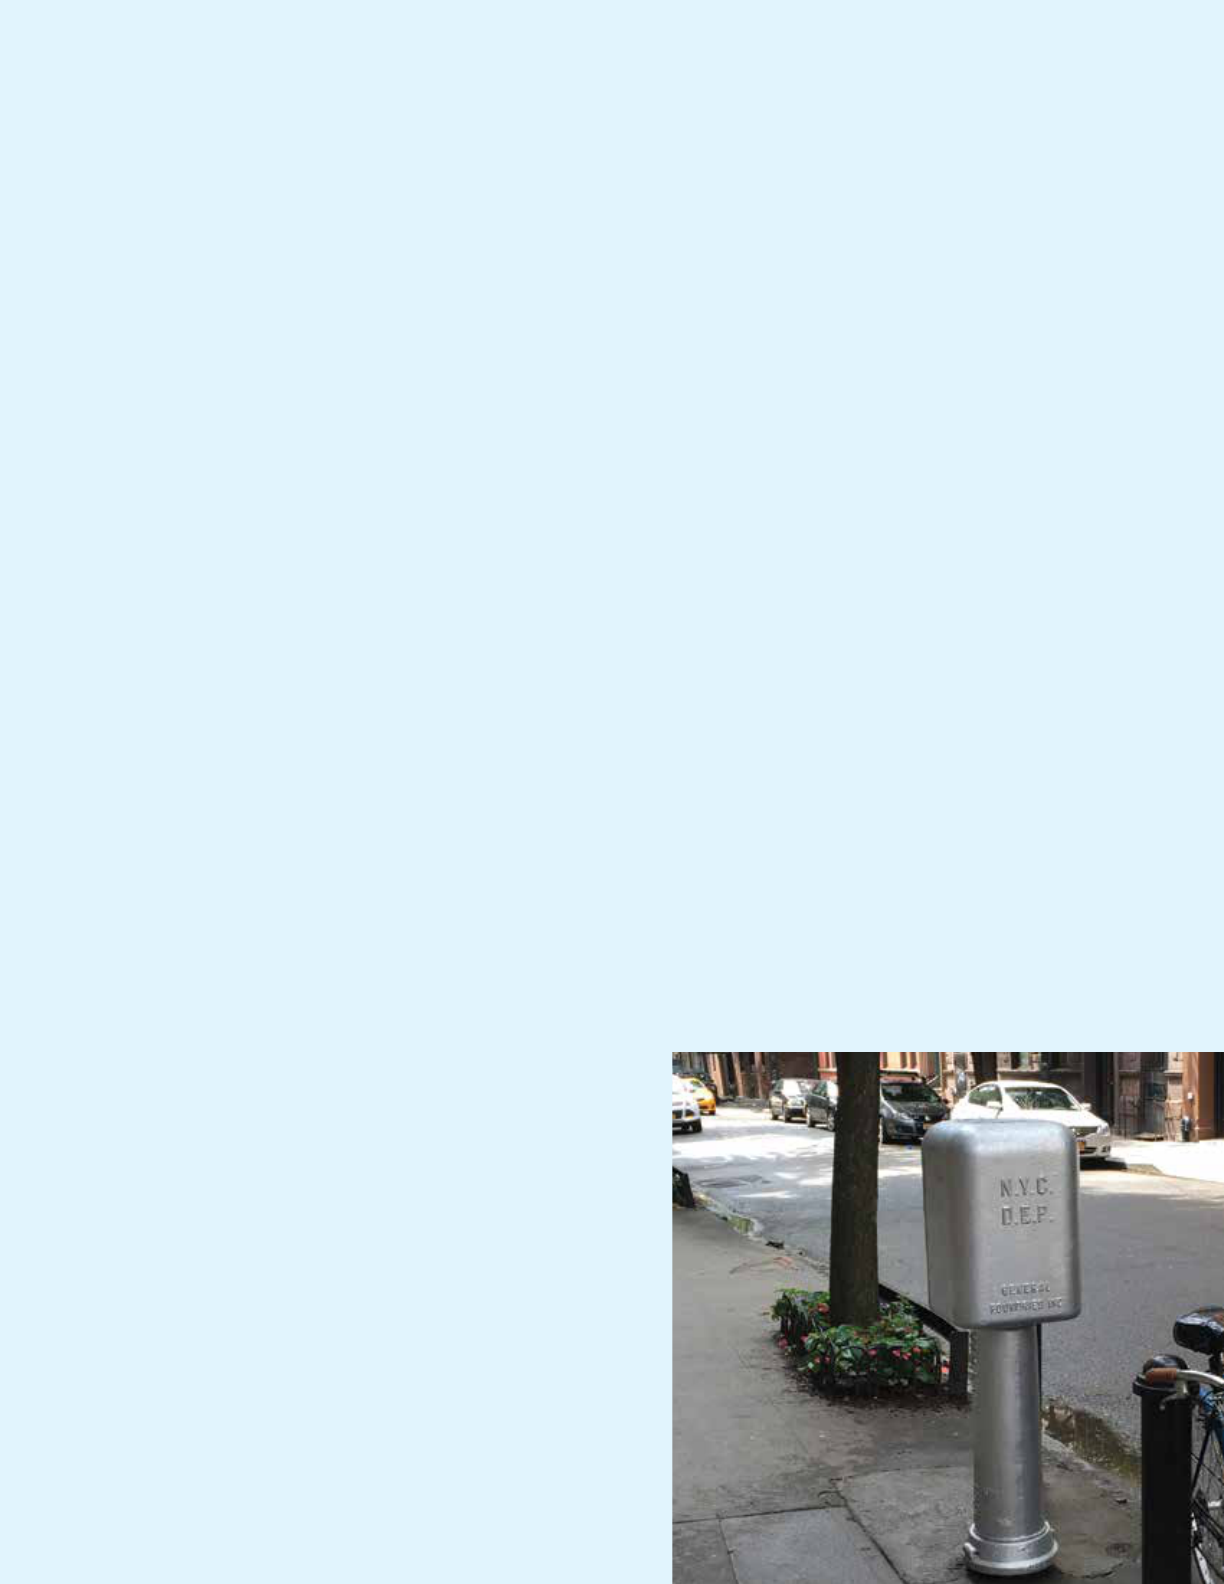
THE NEW YORK CITY 2018 DRINKING WATER
QUALITY TESTING RESULTS
Water sampling station
10
New York City 2018 Drinking Water Supply and Quality Report
TABLE 1: DETECTED PARAMETERS
THIS TABLE SUMMARIZES MONITORING RESULTS FOR ALL DETECTED PARAMETERS IN 2018
CONVENTIONAL PHYSICAL AND CHEMICAL PARAMETERS
PARAMETER
NYSDOH MCL
(Highest Level
Allowed)
EPA MCLG
(Ideal
Goal)
# SAMPLES RANGE AVERAGE
MCL
VIOLATION
LIKELY SOURCES IN
DRINKING WATER
Alkalinity (mg/L CaCO
3
) - - 309 14 - 80 21 No Erosion of natural deposits
Aluminum (µg/L) 50 - 200
(1)
- 464 7 - 54 21 No Erosion of natural deposits
Barium (mg/L) 2 2 464 0.01 - 0.05 0.02 No Erosion of natural deposits
Bromide (µg/L) -
(2)
- 6 8 - 35 20.4 No Naturally occurring
Calcium (mg/L) - - 464 5.4 - 29.8 7.6 No Erosion of natural deposits
Chlorate (mg/L) -
(2)
- 32 ND - 0.2 0.06 No
By-product of drinking water
chlorination using sodium
hypochlorite
Chloride (mg/L) 250 - 309 12 - 101 20 No Naturally occurring; road salt
Chlorine Residual, Free (mg/L) 4
(3)
- 16,033 0.0 - 1.3 0.6
(3)
No Water additive for disinfection
Chromium (µg/L) 100 - 464 ND - 3 ND No Erosion of natural deposits
Chromium VI (µg/L) -
(2)
- 32 ND - 0.06 0.04 No Erosion of natural deposits
Color - distribution system
(color units - apparent)
- - 14,700 3 - 35
(4)
6 No
Presence of iron, manganese,
and organics in water
Color - entry points
(color units - apparent)
15
(5)
- 1,333 3 - 14 6 No
Presence of iron, manganese,
and organics in water
Copper (mg/L) 1.3
(6)
1.3 464 0.002 - 0.088 0.008 No
Corrosion of household plumb-
ing; erosion of natural deposits
Corrosivity (Langelier index) -
(7)
- 308 -2.74 to - 0.96 -2.2 No
Fluoride (mg/L) 2.2
(5)
4 2,103 ND - 0.9 0.7 No
Water additive which promotes
strong teeth; erosion of natural
deposits
Hardness (mg/L CaCO
3
) - - 464 18 - 116 27 No Erosion of natural deposits
Hardness (grains/gallon[US]
CaCO
3
)
(8)
- - 464 1.1 - 6.7 1.5 No Erosion of natural deposits
Iron (µg/L) 300
(5) (9)
- 464 ND - 197 32 No Naturally occurring
Lead (µg/L) 15
(6)
0 464 ND - 1 ND No
Corrosion of household plumb-
ing; erosion of natural deposits
Magnesium (mg/L) - - 464 1.1 - 10 1.9 No Erosion of natural deposits
Manganese (µg/L) 300
(5) (9)
- 476 ND - 93 17 No Naturally occurring
Continued on next page
11
New York City 2018 Drinking Water Supply and Quality Report
TABLE 1: DETECTED PARAMETERS (CONTINUED)
THIS TABLE SUMMARIZES MONITORING RESULTS FOR ALL DETECTED PARAMETERS IN 2018
PARAMETER
NYSDOH MCL
(Highest Level
Allowed)
EPA MCLG
(Ideal
Goal)
# SAMPLES RANGE AVERAGE
MCL
VIOLATION
LIKELY SOURCES IN
DRINKING WATER
Nickel (µg/L) - - 464 ND - 2 ND No Erosion of natural deposits
Nitrate (mg/L nitrogen) 10 10 309 0.06 - 0.48 0.13 No
Runoff from fertilizer use; leach-
ing from septic tanks, sewage;
erosion of natural deposits
Nitrite (mg/L nitrogen) 1 1 305 ND - 0.002
(10)
ND No
Runoff from fertilizer use; leach-
ing from septic tanks, sewage;
erosion of natural deposits
pH (pH units) 6.8 - 8.2
(11)
- 16,034 7.0 - 10.8 7.4 No
Phosphate, Ortho- (mg/L) 1-4
(11)
- 16,032 0.3 - 2.6 2.1 No
Water additive for corrosion
control
Potassium (mg/L) - - 464 0.5 - 2.8 0.7 No Erosion of natural deposits
Silica [silicon oxide] (mg/L) - - 308 1.7 - 7.5 2.5 No Erosion of natural deposits
Sodium (mg/L) NDL
(5) (12)
- 464 9 - 57 13 No
Naturally occurring; road salt;
water softeners; animal waste
Specific Conductance (µS/cm) - - 16,032 82 - 530 120 No
Strontium (µg/L) - - 464 19 - 99 26 No Erosion of natural deposits
Sulfate (mg/L) 250 - 309 3.5 - 21 5.2 No Naturally occurring
Temperature (°F) - - 16,034 33 - 80 53 No
Total Dissolved Solids (mg/L) 500
(1)
- 310 37 - 295
(13)
72 No
Metals and salts naturally
occurring in the soil; organic
matter
Total Organic Carbon (mg/L) - - 459 1.3 - 2.6
(14)
1.7 No
Organic matter naturally present
in the environment
Total Organic Carbon - source
water (mg/L)
-
(2)
- 6 2.1 - 4.2 3.1 No
Organic matter naturally present
in the environment
Turbidity
(15)
- distribution system
(NTU)
5
(16)
- 14,700 ND - 33.8 1
(16)
No Soil runoff
Turbidity
(15)
- source water (NTU) 5
(17)
- - - 1.6
(17)
No Soil runoff
Turbidity
(15)
- filtered water (NTU) TT
(18)
- - - 0.23
(18)
No Soil runoff
UV 254 Absorbency (cm
-1
) - - 309 0.025 - 0.045 0.032 No
Organic matter naturally present
in the environment
Zinc (mg/L) 5
(5)
- 464 ND - 0.016 ND No Naturally occurring
CONVENTIONAL PHYSICAL AND CHEMICAL PARAMETERS (continued)
Continued on next page
12
New York City 2018 Drinking Water Supply and Quality Report
ORGANIC PARAMETERS
PARAMETER
NYSDOH MCL
(Highest Level
Allowed)
-EPA MCLG
(Ideal
Goal)
#
SAMPLES
RANGE AVERAGE
MCL
VIOLATION
LIKELY SOURCES IN
DRINKING WATER
Bromochloroacetic Acid (µg/L) 50 - 365 ND - 4.0 1.5 No By-product of drinking water chlorination
Bromodichloroacetic Acid (µg/L) 50 - 60 1.7 - 5.1 2.6 No By-product of drinking water chlorination
Chlorodibromoacetic Acid (µg/L) 50 - 60 ND - 0.6 ND No By-product of drinking water chlorination
Chloropicrin (µg/L) 50 - 27 ND - 0.5 0.1 No By-product of drinking water chlorination
Chloral Hydrate (µg/L) 50 - 24 1.5 - 11.2 5.7 No By-product of drinking water chlorination
Dalapon (µg/L) 50 - 309 ND - 1.08
(10)
ND No By-product of drinking water chlorination
1,2-Dibromo-3-chloropropane 50 - 27 ND - 0.09 ND No Used to make fire resistant materials
Diethylphthalate 50 - 93 ND - 7.5
(10)
ND No
Plasticizer used in toothbrushes, toys,
cosmetics, food packaging and aspirin
Haloacetic Acid 5 (HAA5) (µg/L) 60
(19)
- 365 19 - 77 49
(19)
No By-product of drinking water chlorination
Haloacetic Acid 6 (HAA6Br) (µg/L) -
(2)
- 60 2.2 - 9.3 4.3 No By-product of drinking water chlorination
Haloacetic Acid 9 (HAA9) (µg/L) -
(2)
- 60 31 - 82 54 No By-product of drinking water chlorination
Haloacetonitriles (HANs) (µg/L) 50 - 27 1.1 - 2.9 2.1 No By-product of drinking water chlorination
Halogenated Ketones (HKs) (µg/L) 50 - 27 1.2 - 4.5 2.8 No By-product of drinking water chlorination
Hexachlorocyclopentadiene 50 - 25 ND - 0.064
(10)
ND No Discharge from chemical factories
Total Organic Halogen (µg/L) - - 283 98 - 281 153 No By-product of drinking water chlorination
Total Trihalomethanes (TTHM)
(µg/L)
80
(19)
- 304 10 - 64 48
(19)
No By-product of drinking water chlorination
1,4-Dioxane
(10)
50
(2)
- 16 ND - 0.08
(10)
ND No
By-product present in paint strippers,
dyes, greases, deodorants, shampoos
and cosmetics
TABLE 1: DETECTED PARAMETERS (CONTINUED)
THIS TABLE SUMMARIZES MONITORING RESULTS FOR ALL DETECTED PARAMETERS IN 2018
Continued on next page
13
New York City 2018 Drinking Water Supply and Quality Report
MICROBIAL PARAMETERS
PARAMETER
NYSDOH MCL
(Highest Level
Allowed)
EPA MCLG
(Ideal
Goal)
# SAMPLES RANGE
# SAMPLES
POSITIVE
AVERAGE
HIGHEST
MONTH %
POSITIVE
MCL
VIOLATION
LIKELY SOURCES IN
DRINKING WATER
Total Coliform Bacteria
(% of samples positive/
month)
5% 0 9,754 - 25 - 0.7% No
Naturally present in the
environment
E. coli (MPN/100mL) -
(20)
0 9,754 - 1 - 0.1% No Animal fecal waste
Heterotrophic Plate Count
(CFU/mL)
TT - 12,640 ND - 2,972 217 1 - No
Naturally present in the
environment
CRYPTOSPORIDIUM AND GIARDIA SAMPLING FROM SOURCE WATER AND RESERVOIR OUTFLOWS
(21)
:
JANUARY TO DECEMBER 2018
PARAMETER
RESERVOIR
OUTFLOW
# SAMPLES
# SAMPLES
POSITIVE
RANGE LIKELY SOURCES IN DRINKING WATER
Cryptosporidium (oocysts/50L)
Kensico 53 5 0 - 1
Animal fecal wasteHillview 53 5 0 - 2
Jerome Park 2 0 0
Giardia (cysts/50L)
Kensico 53 37 0 - 6
Animal fecal waste
Hillview 53 9 0 - 4
Jerome Park 2 0 0
LEAD AND COPPER RULE SAMPLING AT RESIDENTIAL WATER TAPS
PARAMETER NYSDOH AL
EPA MCLG
(Ideal
Goal)
90% OF
YOUR LEVELS
WERE LESS
THAN
RANGE
# SAMPLES
EXCEEDING AL
EXCEEDANCE LIKELY SOURCES IN DRINKING WATER
Copper (mg/L) 1.3 1.3 0.185 0.004 - 0.483 0 out of 481 No Corrosion of household plumbing
Lead (µg/L) 15 0 11 ND - 277 26 out of 481 No Corrosion of household plumbing
TABLE 1: DETECTED PARAMETERS (CONTINUED)
THIS TABLE SUMMARIZES MONITORING RESULTS FOR ALL DETECTED PARAMETERS IN 2018
14
New York City 2018 Drinking Water Supply and Quality Report
TABLE 2: NOT-DETECTED PARAMETERS
THE FOLLOWING PARAMETERS WERE MONITORED FOR,
BUT NOT DETECTED IN ANY SAMPLE IN 2018
CONVENTIONAL PHYSICAL AND CHEMICAL PARAMETERS
Antimony, Arsenic, Asbestos*, Beryllium, Bismuth-212*, Bismuth-214*, Cadmium, Cesium-134*, Cesium-137*, Cyanide, Gross Alpha*, Gross Beta*, Lead-212*,
Lead-214*, Lithium, Mercury, Potassium-40*, Radium-226*, Radium-228*, Selenium, Silver, Thallium, Thallium-208*, Thorium-234*, Uranium*, Uranium-235*
ORGANIC PARAMETERS
Principal Organic Contaminants:
Benzene, Bromobenzene, Bromochloromethane, Bromomethane, n-Butylbenzene, sec-Butylbenzene, tert-Butylbenzene, Carbon tetrachloride, Chlorobenzene,
Chloroethane, Chloromethane, 2-Chlorotoluene, 4-Chlorotoluene, Dibromomethane, 1,2-Dichlorobenzene, 1,3-Dichlorobenzene, 1,4-Dichlorobenzene,
Dichlorodifluoromethane, 1,1-Dichloroethane, 1,2-Dichloroethane, 1,1-Dichloroethene, cis-1,2-Dichloroethylene, trans-1,2-Dichloroethylene, 1,2-Dichloropropane,
1,3-Dichloropropane, 2,2-Dichloropropane, 1,1-Dichloropropene, cis-1,3-Dichloropropene, trans-1,3-Dichloropropene, Ethylbenzene, Hexachlorobutadiene,
Isopropylbenzene, p-Isopropyltoluene, Methylene chloride, n-Propylbenzene, Styrene, 1,1,1,2-Tetrachloroethane, 1,1,2,2-Tetrachloroethane, Tetrachloroethylene,
Toluene, 1,2,3-Trichlorobenzene, 1,2,4-Trichlorobenzene, 1,1,1-Trichloroethane, 1,1,2-Trichloroethane, Trichloroethene, Trichlorofluoromethane, 1,2,3-Trichloropropane,
1,2,4-Trimethylbenzene, 1,3,5-Trimethylbenzene, m-Xylene, o-Xylene, p-Xylene
Specified Organic Contaminants:
Alachlor, Aldicarb (Temik), Aldicarb sulfone, Aldicarb sulfoxide, Aldrin, Atrazine, Benzo(a)pyrene, Butachlor, Carbaryl, Carbofuran (Furadan), Chlordane,
2,4-D,Dicamba, Dieldrin, Di(2-ethylhexyl)adipate, Di(2-ethylhexyl)phthalate, Dinoseb, Diquat, Endothall, Endrin, Ethylene dibromide (EDB), Glyphosate, Heptachlor,
Heptachlor epoxide, Hexachlorobenzene, 3-Hydroxycarbofuran, Lindane, Methomyl, Methoxychlor, Methyl-tertiary-butyl-ether (MTBE), Metolachlor, Metribuzin,
Oxamyl (Vydate), Pentachlorophenol, Picloram, Polychlorinated biphenyls (PCBs), Propachlor, Simazine, Toxaphene, 2,4,5-TP (Silvex), 2,3,7,8-TCDD (Dioxin), Vinyl chloride
Unspecified Organic Contaminants:
Acenaphthene, Acenaphthylene, Acetochlor, Acetone, Acifluorfen, Allyl chloride, Ametryn, tert-Amyl ethyl ether, tert-Amyl methyl ether, Anthracene, Bentazon,
Benzo[a]anthracene, Benzo[a]pyrene, Benzo[b]fluoranthene, Benzo[k]fluoranthene, Benzo[g,h,i]perylene, alpha-BHC, beta-BHC, delta-BHC, Bromacil,
2-Butanone (MEK), Butylate, Butylbenzylphthalate, tert-Butyl alcohol, tert-Butyl ethyl ether, Caffeine, Carbon Disulfide, Carboxin, Chloramben, alpha-Chlordane,
gama-Chlordane, Chlorobenzilate, 2-Chlorobiphenyl, 1-Chlorobutane, Chloroneb, Chlorothalonil (Draconil, Bravo), Chlorpropham, Chlorpyrifos (Dursban), Chrysene,
Cycloate, 2,4-DB, DCPA(Dacthal), DCPA (total mono & diacid degradate), 4,4'-DDD, 4,4'-DDE, 4,4'-DDT, DEF(Merphos), Diazinon, Dibenz[a,h]anthracene,
Di-n-Butylphthalate, 3,5-Dichlorobenzoic acid, 2,3-Dichlorobiphenyl, Dichlorprop, Dichlorvos (DDVP), Diethyl ether, Di-isopropyl ether, Dimethoate, Dimethylphthalate,
2,4-Dinitrotoluene, 2,6-Dinitrotoluene, Di-N-octylphthalate, Diphenamid, Disulfoton, Endosulfan I, Endosulfan II, Endosulfan sulfate, Endrin aldehyde, EPTC, Ethoprop,
Ethyl methacrylate, Etridiazole, Fenamiphos, Fenarimol, Fluoranthene, Fluorene, Fluridone, alpha-HCH, beta-HCH, delta-HCH, 2,2',3,3',4,4',6-Heptachlorobiphenyl,
Heptachlor epoxide (isomer B), 2,2',4,4',5,6'-Hexachlorbiphenyl, Hexachloroethane, Hexazinone, Indeno[1,2,3-cd]pyrene, Isophorone, Malathion, Methiocarb,
Methyl acetate, Methyl iodide, Methyl paraoxon, 4-Methyl-2-pentanone (MIBK), Mevinphos, MGK264-isomer a, MGK264-isomer b, Molinate, Naphthalene,
Napropamide, 4-Nitrophenol, cis-Nonachlor, trans-Nonachlor, Norflurzon, 2,2',3,3',4,5',6,6'-Octachlorobiphenyl, Paraquat, Parathion, Pebulate, Pendimethalin,
2,2',3',4,6-Pentachlorobiphenyl, Pentachloroethane, Permethrin (cis- & trans-), Phenanthrene, Prometryn, Pronamide, Propazine, Propoxur (Baygon), Pyrene,
2,4,5-T, Simetryn, Stirofos, Tebuthiuron, Terbacil, Terbufos, Terbuthylazine, Terbutryn, 2,2',4,4'-Tetrachlorobiphenyl, Tetrahydrofuran, Thiobencarb, Triademefon,
2,4,5-Trichlorobiphenyl, Trichlorotrifluoroethane (Freon 113), Tricyclazole, Trifluralin, Vernolate
Unregulated Contaminant Monitoring Rule (UCMR3) Parameters:
(2)
Androstenedione, Bromochloromethane, Bromomethane, 1,3-Butadiene, Chlorodifluoromethane, Chloromethane, Cobalt, 1,1-Dichloroethane, Equilin, Estradiol,
Estriol, Estrone, Ethynylestradiol, Molybdenum, Perfluorobutanesulfonic acid (PFBS), Perfluoroheptanoic acid (PFHpA), Perfluorohexanesulfonic acid (PFHxS),
Perfluorononanoic acid (PFNA), Perfluorooctanesulfonic acid (PFOS), Perfluorooctanoic acid (PFOA), Testosterone, 1,2,3-Trichloropropane, Vanadium
Unregulated Contaminant Monitoring Rule (UCMR4) Parameters:
(2)
Anatoxin-a, 1-Butanol, Butylated hydroxyanisole, Chlorpyrifos, Cylindrospermopsin, Dimethipin, Ethoprop, alpha-HCH, Germanium Total ICAP/MS, 2-Methoxyethanol,
Monobromoacetic acid, Monochloroacetic acid, Oxyfluorfen, Profenofos, 2-Propen-1-ol, Quinoline, Tebuconazole, o-Toluidine, Total Microcystins,
Total Permethrin (cis & trans), Tribromoacetic acid, Tribufos

15
New York City 2018 Drinking Water Supply and Quality Report
(1) EPA Secondary MCL: NYSDOH has not set an MCL for
this parameter.
(2) Monitored for under the Unregulated Contaminant
Monitoring Rule (UCMR), UCMR3 in 2013 to 2016 and
UCMR4 in 2018. UCMR3 included chlorate and chromium
VI, and UCMR4 included bromide and total organic carbon
in source water. No MCL has been established for any of
these parameters and the NYSDOH chromium MCL is for
chromium (total).
(3) Value represents MRDL, which is a level of disinfectant
added for water treatment that may not be exceeded at
the consumer's tap without an unacceptable possibility of
adverse health eects. The MRDL is enforceable in the same
manner as an MCL and is the calculated running annual
average. Data presented are the range of individual
sampling results and the highest of the four quarterly
running annual averages.
(4) An unusual maximum color value of 240 units was
measured at site 52050 (Port Richmond, 10302) on 1/16/18
which was not believed to be representative of normal
conditions. The next sample collected at this site on 1/29/18
had a value of 6 color units.
(5) Determination of MCL violation: If a sample exceeds the
MCL, a second sample must be collected from the same
location within two weeks, or as soon as practical. If the
average of the two results exceeds the MCL, then an MCL
violation has occurred.
(6) Action Level (not an MCL) applies to samples measured
at-the-tap. The data presented in this table were collected
from sampling stations at the street curb. For at-the-tap
monitoring, see the Lead and Copper Rule Sampling at
Residential Water Taps table.
(7) A Langelier Index of less than zero indicates corrosive
tendencies.
(8) Hardness of up to 3 grains per gallon is considered soft
water; between 3 and 9 is moderately hard water.
(9) If iron and manganese are present, the total concentration
of both should not exceed 500 µg/L.
(10) Only detected in one sample: nitrite was detected from
site 47550 (Seaside, 11694) on 10/3/18; dalapon was
detected from site 37950 (East Village, 10003) on 11/7/18;
diethylphthalate and hexachlorocyclopentadiene were
detected from site 1S03A (Wakeeld, 10466) on 5/21/18.
The single detection of diethylphthalate by the contract
laboratory was questionable due to the lab's inability to
reproduce the analysis and an extensive historical record
of non-detection by multiple labs, thus it is believed to be
from sample contamination. The low level detection of
hexachlorocyclopentadiene in the same sample was below
the NYS required reporting limit of 0.1 µg/L. Resampling
and split sampling between two labs on 8/20/18 produced
non-detects for these parameters. 1,4-Dioxane was
detected in only one sample collected for the UCMR3 on
12/8/15 from site 1SCL1 (Van Cortlandt Village, 10463). In all
other samples the parameters were not detected.
(11) NYSDOH established Optimal Water Quality Parameters
(OWQP) under the Lead and Copper Rule which includes
a range for pH and ortho-phosphate which are presented
here. The reported average value for pH is the median
value. The pH was elevated in four samples collected from
site 3ISL4 (Randalls Island, 10035) between 6/20/18 and
12/12/18; in two samples collected from site 51550 (Arden
Heights, 10312) on 7/25/18 and 8/5/18; in two samples
collected from site 23900 (Highland Park, 11207) on
10/24/18 and 11/15/18; in one sample collected from site
56000 (Prince's Bay, 10309) on 11/28/18; and in one sample
collected from site 79450 (South Ozone Park, 11420) on
7/6/18. Ortho-phosphate was below range in one sample
collected at site 3ISL4 (Randalls Island, 10035) on 12/12/18.
(12) Water containing more than 20 mg/L of sodium should
not be used for drinking by people on severely restricted
sodium diets. Water containing more than 270 mg/L of
sodium should not be used for drinking by people on
moderately restricted sodium diets.
(13) An unrealistically low value for TDS of 13 mg/L was
measured from site 10250 (High Bridge, 10452) on 1/3/18;
resample was 49 mg/L on 1/11/18.
(14) An unrealistically high value for TOC of 22.9 mg/L was
measured from site 1S03A (Wakeeld, 10466) on 1/16/18;
resample was 1.56 mg/L on 2/6/18.
(15) Turbidity is a measure of cloudiness of the water. Turbidity
is monitored because it is a good indicator of water quality,
because high turbidity can hinder the eectiveness of
disinfection, and because it is a good indicator of the
eectiveness of our ltration system.
(16) This MCL for turbidity is the monthly average rounded o
to the nearest whole number. Data presented are the range
of individual sampling results and the highest monthly
average from distribution sites.
(17) This MCL for turbidity is on individual readings taken every
four hours at the unltered Catskill/Delaware source water
entry point. Value presented is the highest individual
sampling result.
(18) This is a Treatment Technique performance standard for the
Croton Filtration Plant. The value presented is the highest
single combined lter euent turbidity measurement
which occurred on 12/5/18. In 2018, 100% of turbidity
results were <0.3 NTU while the Croton Filtration Plant was
in operation.
(19) The MCLs for HAA5 and TTHMs are the calculated locational
running annual average. The data in the Range column
are the minimum and maximum values of all sample
sites monitored in the distribution system whether for
compliance purposes or not. The values in the Average
column are the highest locational running annual
averages under the Stage 2 Disinfectant and Disinfection
By-Products Rule.
(20) If a sample and its repeat sample are both positive for
coliform bacteria and one of the two samples is positive for
E. coli, then an MCL violation has occurred.
(21) Samples are collected prior to nal disinfection or ltration
(Jerome Park). Positive results indicate (oo)cyst detection,
not viability or infectivity.
* NYSDOH allows monitoring for these contaminants
less frequently than once per year. These data, though
representative, are from 2016.
FOOTNOTES
16
New York City 2018 Drinking Water Supply and Quality Report
CRYPTOSPORIDIUM AND
GIARDIA
In 1992, DEP started a comprehen-
sive program to monitor its source
waters and watersheds for the pres-
ence of Cryptosporidium and Giardia,
microscopic organisms (pathogens)
that can cause disease. In 2018, DEP
collected weekly samples from the
outow of the Kensico Reservoir,
prior to chlorination and UV disin-
fection, and the outow of Hillview
Reservoir, prior to secondary disin-
fection with chlorine. The outow of
the Jerome Park Reservoir prior to
ltration was also sampled twice in
2018 to complete sampling require-
ments under the Long Term 2
Enhanced Surface Water Treatment
Rule. Samples were analyzed using
EPA Method 1623.1. The Cryptospo-
ridium and Giardia data for Kensico,
Hillview, and Jerome Park Reservoir
outows are presented in the table
on page 13 of this report.
The presence of low levels of Cryp-
tosporidium and Giardia detected
in the source water required no
action on the part of DEP. DEP’s
Cryptosporidium and Giardia data
from 1992 to the present can be
viewed on the DEP website at
www.nyc.gov/waterquality.
While there is no evidence that any
cases of cryptosporidiosis or giar-
diasis have been caused by the New
York City water supply, federal and
state law requires all water suppliers
to notify their customers about the
potential risks from Cryptosporidium
and Giardia. Cryptosporidiosis and
giardiasis are intestinal illnesses
caused by microscopic patho-
gens, which can be waterborne.
Symptoms of infection include
nausea, diarrhea, and abdominal
cramps. Some people may be
more vulnerable to disease caus-
ing microorganisms, or pathogens,
in drinking water than the general
population. Immuno-compromised
persons, such as persons with can-
cer undergoing chemotherapy,
persons who have undergone
organ transplants, people with HIV/
AIDS or other immune system dis-
orders, some elderly individuals,
and infants, can be particularly at
risk from infections. These people
should seek advice from their health
care providers about their drink-
ing water. EPA/CDC guidelines on
appropriate means to lessen the
risk of infection by Cryptosporidium,
Giardia, and other microbial con-
taminants are available from EPA’s
Safe Drinking Water Hotline at
1-800-426-4791.
DEP’s Waterborne Disease Risk
Assessment Program conducts
disease surveillance for cryptospo-
ridiosis and giardiasis to track the
disease incidence, and syndromic
surveillance for gastrointestinal ill-
ness to identify potential citywide
gastrointestinal outbreaks. Persons
diagnosed with cryptosporidiosis
are interviewed concerning poten-
tial exposures, including tap water
consumption. Disease and syn-
dromic surveillance indicates that
there were no outbreaks of crypto-
sporidiosis or giardiasis attributed to
tap water consumption in New York
City in 2018.
New Croton Reservoir

17
New York City 2018 Drinking Water Supply and Quality Report
CROTON WATER
Did you know that even the cleanest
waters can have dierent chemical
and physical properties?
Water hardness is one such attribute
that DEP receives many questions
about when New Yorkers are installing
dishwashers, water heaters, and other
equipment that use water. Hardness
is a measure of the natural minerals –
specically calcium and magnesium
– that dissolve into water as it passes
through soil and rocks. The more dis-
solved natural minerals, the harder
the water.
Neighborhoods in New York City
receive their drinking water from
reservoirs in the Catskill/Delaware
watershed, the Croton watershed, or a
blend from both locations. Water from
the Croton supply is considered “mod-
erately hard,” while the Catskill/Dela-
ware supply is considered “soft” or
“slightly hard.” Citywide average hard-
ness is about 1.5 grains/gallon (CaCO
3
).
In areas of the City where Catskill/
Delaware and Croton water supplies
are blended, the hardness can reach
6.8 grains/gallon (CaCO
3
).
In 2018, DEP increased use of the Cro-
ton System because other parts of the
water supply were temporarily shut
down for infrastructure upgrades.
As a result, water in several areas of
the City may have become harder.
The water is still of excellent quality
and safe to drink. Water hardness,
however, may aect the eciency of
some equipment. Consult the owner’s
manual for the device being operated.
DEP has also compiled some addi-
tional information on water hardness
and its eects at: www.nyc.gov/dep/
water-hardness.
To help homeowners and building
managers determine whether they
are in an area of the City that could
receive moderately hard water, DEP
has posted maps of the water distribu-
tion system that can be found at: www.
nyc.gov/html/dep/html/drinking_water/
croton-water-distribution-maps.shtml.
ADMINISTRATIVE ORDERS
Hillview Reservoir is the nal stop for
drinking water from the Catskill/Dela-
ware System before it enters the City’s
distribution system. On May 24, 2010,
New York City and EPA entered into
an Administrative Order on Consent
that set forth a milestone schedule
to install a cover over the Hillview
Reservoir by mid-2028. The City has
a parallel Administrative Order with
NYSDOH. The EPA Administrative
Order required the City to issue a
notice to proceed to commence site
preparation work by January 30, 2017
at the Hillview Reservoir Site. The
City advised EPA and the NYSDOH
that it was not undertaking that work
pending EPA’s review of the Long
Term 2 Enhanced Surface Water Treat-
ment Rule; thereafter EPA declined
to revise that rule. EPA and the City
are in discussions concerning revised
milestones.
WATER CONSERVATION
DEP operates the largest combined
water supply and wastewater utility
in the United States. DEP employees
work hard to ensure that a reliable
supply of high-quality water is deliv-
ered to about 9.6 million customers
each day, and that about 1.3 billion
gallons of wastewater from the ve
boroughs is collected and treated
every day. Although New York City
has grown by more than 1.6 million
people since 1980, its demand for
water has dropped by approximately
35 percent during that time – making
it one of the most water-ecient large
cities in the country.
The average single-family household
in New York City uses approximately
80,000 gallons of water each year at
a cost of $3.90 per 100 cubic feet of
water (748 gallons), or about $417 a
year. Since nearly all customers receive
wastewater collection and treatment
services in addition to water service,
the combined annual water and sewer
charge for the typical New York City
household using 80,000 gallons per
UPGRADES AT
SCHOHARIE RESERVOIR
DEP continued to make steady
progress on a $400 million pro-
gram to upgrade infrastructure at
Schoharie Reservoir, the northern-
most reservoir in New York City’s
vast water supply system.
Workers this winter “holed
through” on the nal segment
of a 2,118-foot-long tunnel that
will give DEP the ability to release
water downstream from the
reservoir into Schoharie Creek.
The new release works will help
DEP facilitate dam maintenance,
respond to potential emergencies,
mitigate ood risk for downstream
communities, and enhance down-
stream habitat for sh and wildlife.
Construction of the valve chamber
and other elements of the release
works will continue for the next
two years.
DEP also made considerable
progress on its rehabilitation of
the Shandaken Tunnel Intake
Chamber, which draws the City’s
drinking water from Schoharie
Reservoir. Work at the intake
chamber includes the replace-
ment of eight sluice gates that
control the ow of water into the
tunnel by opening and closing
large waterways. Last year, skilled
divers descended about 130 feet
into a ooded shaft to take precise
measurements of the gates and
the grooves that guide them. The
divers will begin to remove and
replace those gates in 2019.
Schoharie Reservoir
18
New York City 2018 Drinking Water Supply and Quality Report
year is $1,080, consisting of $417 for
water service and $663 for wastewa-
ter services, calculated at scal year
2019 rates.
With the creation of an Automated
Leak Notication Program, which
sends alerts to property owners if
there is an unusual spike in water
consumption, more than 290,000
customers have signed up to quickly
nd and x leaks on their property.
To sign up, go to: www.nyc.gov/dep/
leak-notication.
NYC Water Conservation Eorts
Did you know that the average New
Yorker has reduced his or her water
use by nearly half over the past 40
years? Thanks to strategic invest-
ments in our water delivery system
and advances in technology, New
York City is quickly becoming one of
the most water-ecient large cities
in the world.
The proof is in the numbers. The per-
capita demand for water in New York
City peaked in 1979 at 213 gallons
per day. That per-capita demand
by water consumers, however, has
dropped steadily since the 1990s,
falling all the way to the current level
of 117 gallons per day.
So how did New York City shift from
chugging water to sipping it? Two
factors have been key to reducing
our demand for water over time.
Advances in technology have played
a key role. Low-ow xtures that
came onto the market starting in
the 1990s helped the average New
Yorker use less water. Toilets that
ushed with four gallons of water
were replaced by those that ushed
with one gallon or fewer. Low-ow
showerheads, washing machines
and dishwashers also played a role.
DEP has also partnered with other
City agencies, colleges and busi-
nesses to help conserve water.
Recent investments have reduced
overall demand for water by 10 mil-
lion gallons per day, and DEP is work-
ing on plans to conserve another 10
million gallons per day over the next
ve years.
Drinking water conservation eorts
benet the City in many ways. For
one, they have helped to reduce
greenhouse gas emissions related to
operating our water and wastewater
systems by 68 metric tons annually,
as well as limiting sewer overows
into local waterways during rain
events. Reducing the demand for
water also means that New York City
is better protected against future
droughts, as the water stored in our
reservoirs will last longer during
periods of dry weather. And it gives
DEP the exibility to shut down
parts of our water supply system
for repairs, including the 6-month
shutdown of the Delaware Aqueduct
that is planned for 2022-2023 to n-
ish repairing a leak in the world’s
longest tunnel.
A comprehensive report on the City’s
water-conservation eorts, One
Water NYC: 2018 Water Demand Man-
agement Plan can be found at: www.
nyc.gov/html/dep/pdf/conservation/2018-
water-demand-management-plan.pdf.
Some highlights of our work in
recent years include:
Delaware Aqueduct Bypass Tunnel
19
New York City 2018 Drinking Water Supply and Quality Report
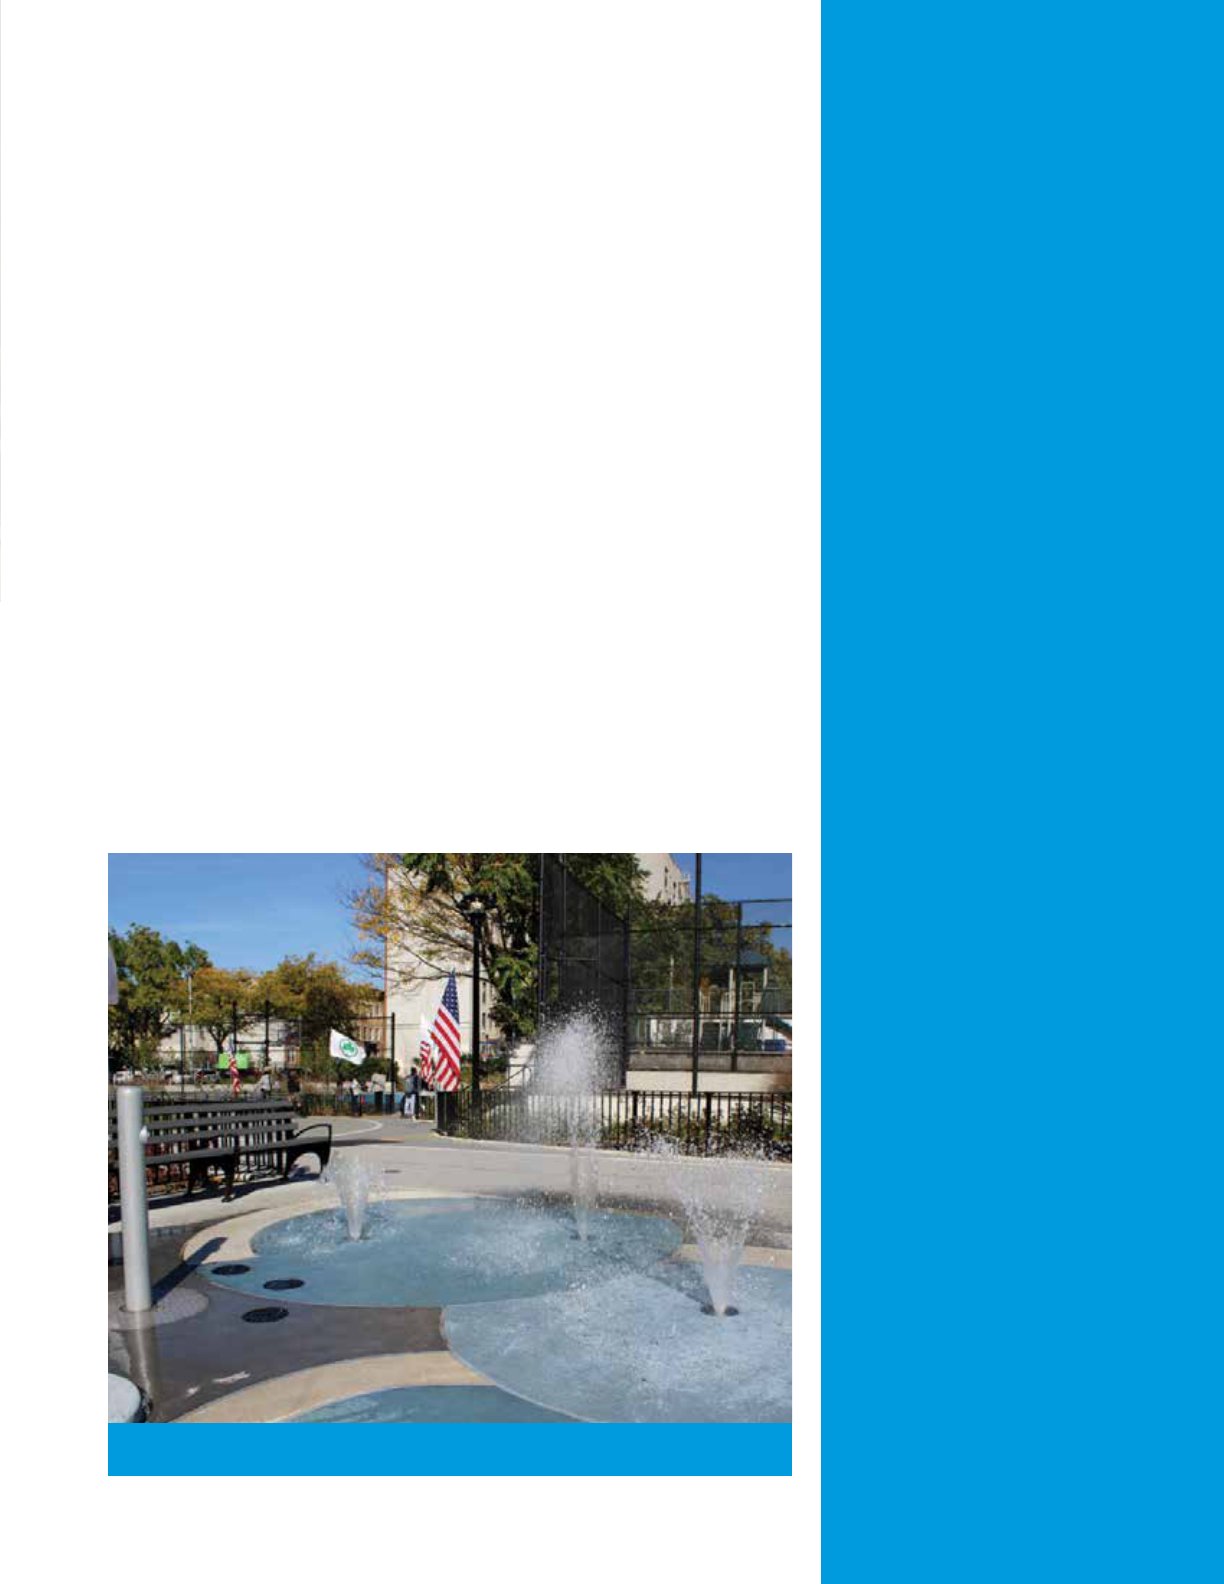
Õ The installation of timers on 400
spray showers in NYC Parks Depart-
ment playgrounds, saving 1.1 mil-
lion gallons per day in the summer.
Õ Upgrading 30,000 inecient bath-
room xtures in New York City
public schools, saving 3.3 million
gallons per day.
Õ Capital upgrades and modications
of treatment procedures at DEP’s
14 wastewater resource recovery
facilities (WRRFs), saving 1.83 million
gallons per day.
Õ The installation of 500 ecient
toilets and 280 urinals in 10 City
University of New York buildings,
saving 40,000 gallons of water
per day.
Õ Construction of a water reuse facil-
ity at the New York City Fire Depart-
ment’s Randall’s Island Training
Facility, saving 30,000 gallons of
water per day.
Õ Replacement of more than 13,900
inecient toilets in private resi-
dences, saving 560,000 gallons of
water per day.
Õ Distribution of nearly 100,000 home
water saving kits to promote con-
servation, saving 400,000 gallons
per day.
Õ The installation of water meters
and ecient toilets, urinals, show-
erheads, faucets, ice machines and
dishwashers at NYC Health + Hos-
pitals/Harlem, saving more than
90,000 gallons of water per day.
Õ Voluntary challenges with colleges,
hotels, restaurants, and hospitals
throughout the City, each with the
goal of cutting their water use by 5
percent.
Õ Partnering with 10 of its largest
wholesale customers, DEP is devel-
oping and implementing water
demand management plans, under
the Wholesale Customers Water
Demand Management Program.
Implementation of all plans will con-
tinue through October 2022, and
achieve an estimated demand sav-
ings of 4.6 million gallons per day.
DELAWARE AQUEDUCT
BYPASS TUNNEL
DEP has now excavated more than 60
percent of a tunnel needed for the larg-
est repair in the 177-year history of the
New York City Water Supply System.
Workers made substantial progress
on the Delaware Aqueduct Bypass
Tunnel in 2018. The $1 billion project
will repair two leaking sections of the
85-mile-long Delaware Aqueduct, the
longest tunnel in the world. The Dela-
ware Aqueduct delivers about 50 per-
cent of New York City’s drinking water
each day.
The centerpiece of the repair is a
2.5-mile-long bypass tunnel that will
carry water around the largest leak,
which is located in Newburgh, N.Y.
That tunnel is being constructed 600
feet below the Hudson River from
Newburgh to Wappinger. Once n-
ished, both ends of the bypass tunnel
will be connected to structurally sound
portions of the existing Delaware
Aqueduct to carry water around the
leaking section.
After tunneling began late in 2017, DEP
successfully excavated more than two-
thirds of the new tunnel last year. More
than 7,000 linear feet of the tunnel has
been driven through bedrock, and
workers are on schedule to nish exca-
vation by the end of 2019.
Once tunneling is completed, the
bypass will be reinforced with 9,200 lin-
ear feet of steel. The steel liner is made
from 230 individual sections that look
like gigantic soup cans. Each section
of the liner weighs 80,000 pounds and
measures 40 feet long and 16 feet in
diameter. Once tunneling is completed,
segments of the liner will be moved
into the tunnel and welded together
one at a time.
The Delaware Aqueduct will be shut
down for 5-8 months in 2022 to con-
nect the bypass tunnel to structurally
sound portions of the existing aque-
duct. The City’s other surface water
supplies, Catskill and Croton, will meet
the needs of water consumers in New
York City during the shutdown. Repairs
to the Delaware Aqueduct are planned
to be nished in 2023.
Spray showers in NYC park
20
New York City 2018 Drinking Water Supply and Quality Report
FREQUENTLY ASKED QUESTIONS
MY WATER IS A RUSTY BROWN COLOR. WHAT CAUSES THIS?
Brown or discolored water is often related to plumbing corrosion problems inside buildings and from
rusting water heaters. If you have an ongoing problem with brown water, it may be due to rusty pipes.
You should run your cold water for 2-3 minutes if it has not been used for a long period of time. This
will ush the line.
If your water suddenly looks discolored, it might be because of a disturbance to nearby water
mains, including breaks or repairs. This can also happen if there is construction near your building.
Additionally, the use of re hydrants for reghting can temporarily cause brown water. Because the
water mains are pressurized, a disturbance may stir up or resuspend sediments, which causes the
water to be discolored. Discoloration is a temporary condition most often from iron and manganese
particles that have settled to the bottom of the water pipes buried under the roadways. Any sudden
change in the ow of water within the pipes — or outside vibration — may loosen or resuspend the
brownish/red/orange particles of iron into the water. This temporary problem is generally resolved or
reduced when DEP ushes water from nearby hydrants.
SOMETIMES I THINK MY WATER HAS THE TASTE OR ODOR OF CHLORINE?
You may, at times, nd your water tastes or smells like chlorine. DEP is required to maintain a chlorine
residual in the distribution system to prevent the growth of microorganisms. Chlorine is a very
effective disinfectant, and is not considered hazardous or harmful in the amounts used to treat the
water supply.
Chlorine odors may be more noticeable when the weather is warmer. The following are ways you can
remove the chlorine and its odor from your drinking water:
4
Fill a pitcher and let it stand in the refrigerator overnight. (This is the best way.)
4
Fill a glass or jar with water and let it stand in sunlight for 30 minutes.
4
Pour water from one container to another about 10 times.
4
Heat the water to about 100 degrees Fahrenheit.
4
Once you remove the chlorine, be sure to refrigerate the water to limit bacterial growth.
WHY DOES MY DRINKING WATER LOOK CLOUDY SOMETIMES?
Air becomes trapped in the water as it makes its long trip from the upstate reservoirs to the City. As
a result, bubbles of air can sometimes cause water to appear cloudy or milky. This condition is not a
public health concern. The cloudiness is temporary and clears quickly after water is drawn from the
tap and the excess air is released.
SHOULD I BUY BOTTLED WATER?
You do not need to buy bottled water for health reasons in New York City since our water meets all
federal and state health-based drinking water standards. Also, bottled water costs up to 1,000 times
more than the City's drinking water. When purchasing bottled water, consumers should look for the
NYSHD CERT#. Consumers can access additional information on New York State certied bottled
water facilities within the entire United States that can be sold within New York State at
www.health.ny.gov/environmental/water/drinking/bulk_bottle/bottled.htm.
WHERE TO GO FOR ADDITIONAL INFORMATION
Drinking water, including bottled water, may reasonably be expected to contain at least small amounts of some
contaminants. The presence of contaminants does not necessarily indicate that water poses a health risk. More
information about contaminants and potential health eects can be obtained by calling EPA’s Safe Drinking
Water Hotline at 800-426-4791.
( Questions about water and sewer billing
DEP Customer Service – 718-595-7000
www.nyc.gov/dep - Customer Service
( Report unusual water characteristics
In NYC dial 311
Outside of NYC, 212-NEW YORK (639-9675)
TTY Services 212-504-4115
Visit 311 Online at:
www.nyc.gov/apps/311
( Request a free kit to test for lead in drinking water
In NYC dial 311
Outside of NYC, 212-NEW YORK (639-9675)
TTY Services 212-504-4115
Visit 311 Online at:
www.nyc.gov/apps/311 – Search lead test kit
( Cryptosporidium and Giardia
DOHMH – Bureau of Communicable Diseases – 347-396-2600
In NYC dial 311
Outside of NYC, 212-NEW YORK (639-9675)
TTY Services 212-504-4115.
Visit 311 Online at:
www.nyc.gov/apps/311
( Water supply health-related questions
DOHMH
In NYC dial 311
Outside of NYC, 212-NEW YORK (639-9675)
TTY Services 212-504-4115.
Visit 311 Online at: www.nyc.gov/apps/311
NYSDOH – Bureau of Water Supply Protection – 518-402-7650
www.health.ny.gov
( Report pollution, crime or terrorism activity occurring
in the watershed
DEP Police and Security – 888-H2O-SHED (426-7433)
www.nyc.gov/dep
( Request additional copies of this report, and view the
2018 Drinking Water Supply and Quality Report
In NYC dial 311
Outside of NYC, 212-NEW YORK (639-9675)
TTY Services 212-504-4115.
www.nyc.gov/waterquality
Do run the dishwasher & washing
machine only when full.
Don’t let the water run while
washing dishes. Kitchen faucets
use 2 to 3 gallons a minute. Filling
a basin only takes 10 gallons to
wash and rinse.
Do take shorter showers and
ll the tub halfway.
Don’t run water while washing
your hands & brushing your teeth.
Do install water-saving xtures.
Don't ignore water leaks.
Turn taps o tightly.
Do use a self-closing nozzle on
your hose.
Don’t open re hydrants.
BATHROOM
KITCHEN & LAUNDRY
4
4
4
4
6
6
6
6
In or out of a drought, every New Yorker can
save hundreds of gallons of water each week
by following these simple water-saving tips.
EVERYWHERE
OUTDOORS
REPORT LEAKS & WATER WASTE
Call 311
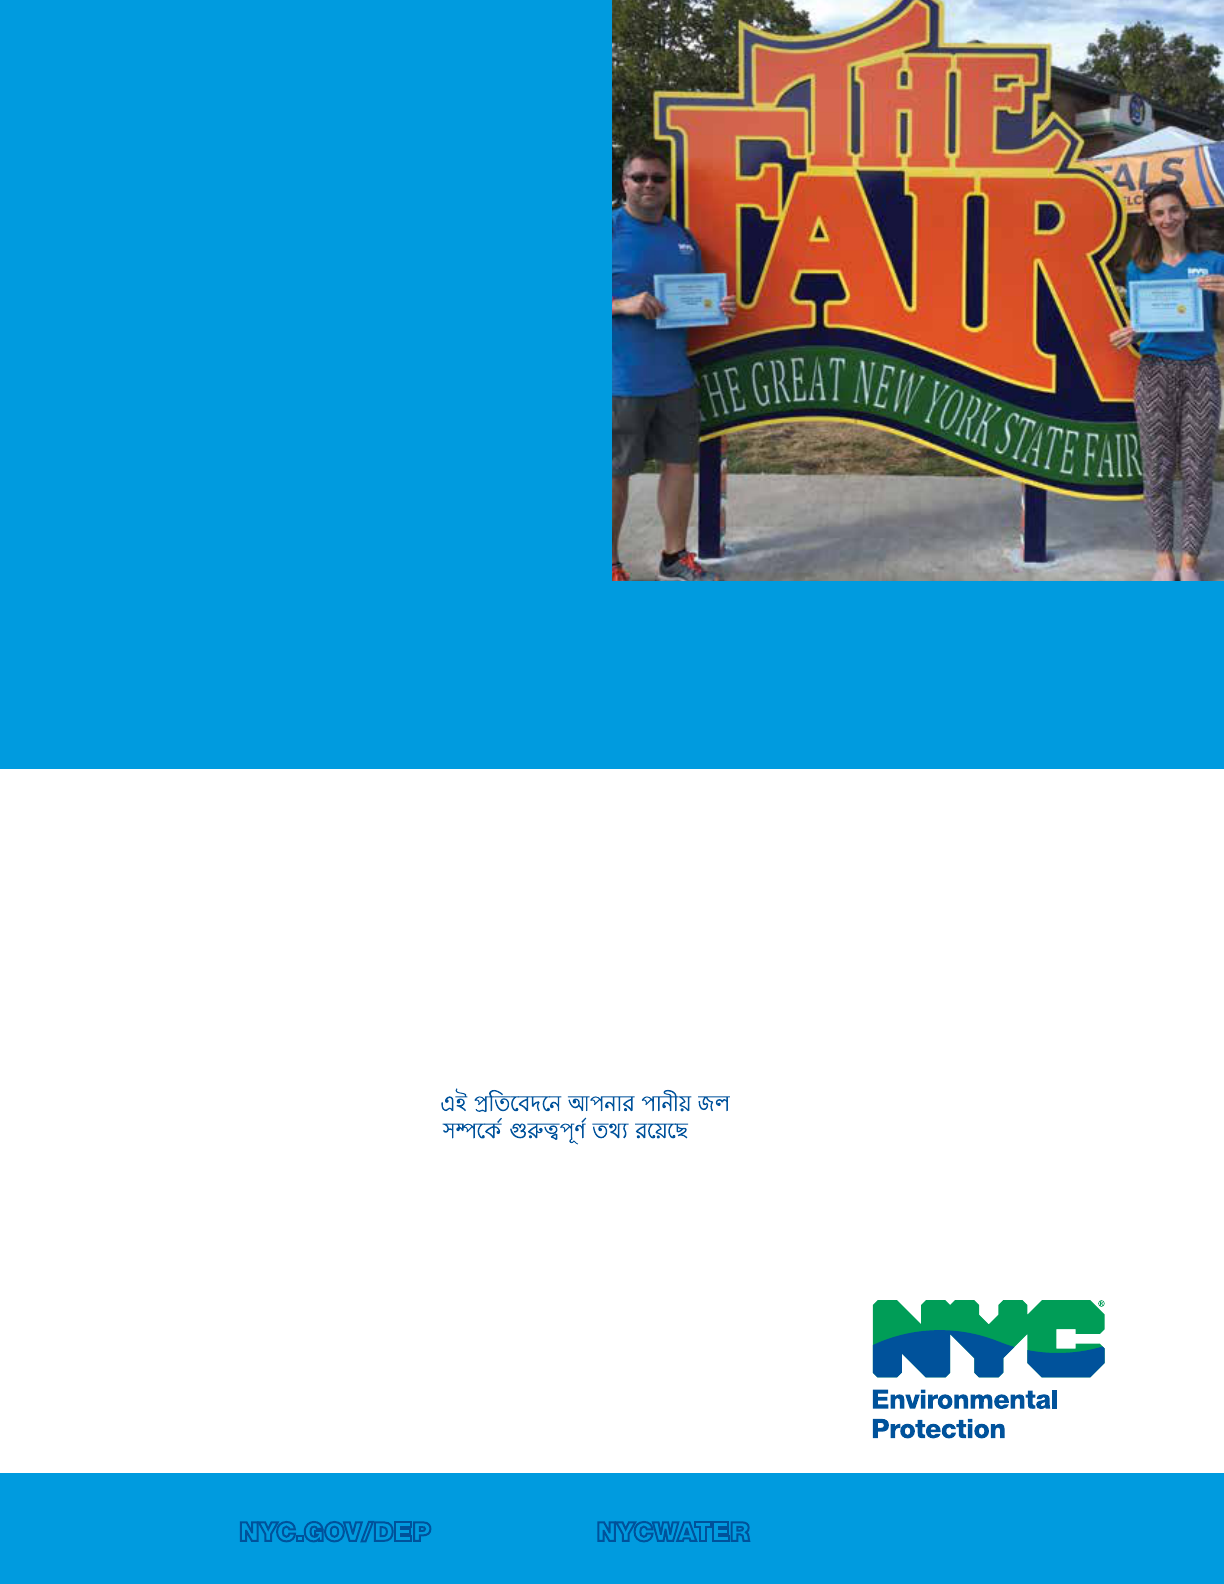
VISIT US AT NYC.GOV/DEP • FOLLOW NYCWATER ON FACEBOOK AND TWITTER
Este reporte contiene información muy
importante sobre el agua que usted
toma. Vea una copia de este informe
en español en www.nyc.gov/waterquality,
o llame al 311 para solicitar una copia.
Ten raport zawiera bardzo istotną
informacje o twojej wodzie pitnej.
Kopię raportu w języku polskim
można przejrzeć na www.nyc.gov/
waterquality lub zażądać jej dzwoniąc
pod numer 311.
В этом материале содержится важная
информация относительно вашей
питьевой воды. Читайте версию
этого доклада на русском языке в
Интернете www.nyc.gov/waterquality или
закажите печатный экземпляр по
телефону 311.
이 보고셔는 귀하의 식수에 관한 매우 중요한
정보를 포함하고 있습니다. 이 보고서의 사본
을 한국어로 보려면 www.nyc.gov/waterquality
를 클릭하거나 사본을 신청하시려면 311번으
로 연락하십시오.
這個報告中包含有關你的飲用
水的重要信息 。用中文看此报
告:www.nyc.gov/waterquality,或
者拨打 311 索取报告文本。
Ce rapport contient des informations
importantes sur votre eau potable.
Pour voir ce rapport en français, visitez:
www.nyc.gov/waterquality, ou demandez
une copie en appelant le 311.
Rapò sa a gen enfòmasyon ki
enpòtan anpil sou dlo w’ap bwè a.
Gade yonkopi rapò sa a an kreyòl
nan www.nyc.gov/waterquality, oswa
pou mande yon kopi rele 311.
www.nyc.gov/waterquality
311
311
www.nyc.gov/waterquality
This report contains important
information about your drinking
water. To view this report go to
www.nyc.gov/waterquality, or to
request a copy call 311.
.
.
311
www.nyc.gov/waterquality
(Spanish)
(French)
(Russian)
(Haitian Creole)
(Arabic)
(Korean)
(Polish)
(Urdu)
(Chinese)
(Bengali)
NEW YORK CITY DRINKING WATER EARNS
TOP PRIZE AT STATEWIDE TASTE TEST
New Yorkers have spoken – the Big Apple has the best
tasting water in the entire state.
New York City earned rst place in the 2018 New York
State Tap Water Taste Test competition. The event began
with 30 water suppliers competing in regional competi-
tions. Winners from each region competed in August at
the New York State Fair in Syracuse, where hundreds of
fairgoers lined up to sample drinking water from each of
the nalists.
The taste test competition is organized by the New York
State Water and Wastewater Education and Outreach
Committee, which aims to protect public health and the
environment throughout the state by promoting the
sound operation and maintenance of water and waste-
water systems. New York City reached the nals after
winning the metro-region competition at the American
Museum of Natural History, which included water utilities
from Nassau, Orange, Suolk and Westchester counties.
The victory underscored the high quality and great taste of New York City’s drinking water. That’s good news for other cit-
ies, towns, and villages throughout the state. More than 70 communities in Orange, Putnam, Ulster and Westchester coun-
ties are connected to New York City’s water supply system, and many use the City’s supply as their primary source of water.
