Motorcycles: 2021 Data 1
U.S. Department of Transportation NHTSA’s National Center for Statistics and Analysis
1200 New Jersey Avenue SE, Washington, DC 20590
DOT HS 813 466 June 2023 (Revised)
Motorcycles
The following definitions apply to terms in this fact sheet:
• For the purposes of this fact sheet, motorcycles include two- and three-
wheeled motorcycles, off-road motorcycles, mopeds, motor scooters,
minibikes, and pocket bikes.
• The motorcycle rider is the person operating the motorcycle; the
passenger is a person seated on, but not operating, the motorcycle; the
motorcyclist is a general term referring to either the rider or passenger.
• Drivers or motorcycle riders are considered to be alcohol-impaired when
their blood alcohol concentrations (BACs) are .08 grams per deciliter
(g/dL) or higher.
Key Findings
• In 2021 there were 5,932 motorcyclists killed, 14 percent of all traffic
fatalities. This is the highest number of motorcyclists killed since FARS
started data collection in 1975.
• The number of motorcyclist fatalities in 2021 increased by 8 percent
from 2020, from 5,506 to 5,932.
• An estimated 82,686 motorcyclists were injured in 2021, a 5-percent
increase from 78,944 motorcyclists injured in 2020.
• Per vehicle miles traveled in 2021, the fatality rate for motorcyclists
(30.20) was almost 24 times the passenger car occupant fatality rate
(1.26).
• Thirty-six percent of motorcycle riders involved in fatal crashes in 2021
were riding without valid motorcycle licenses.
• In 2021 motorcycle riders involved in fatal crashes had higher
percentages of alcohol impairment than drivers of any other motor
vehicle type (28% for motorcycles, 24% for passenger cars, 20% for
light trucks, and 3% for large trucks).
• Forty-three percent of motorcycle riders who died in single-vehicle
crashes in 2021 were alcohol-impaired.
• Motorcycle riders killed in traffic crashes at night were three times more
frequently found to be alcohol-impaired than those killed during the day
(42% and 16%) in 2021.
• In States without universal helmet laws, 55 percent of motorcyclists
killed in 2021 were not wearing helmets, as compared to 9 percent in
States with universal helmet laws.
In this fact sheet for 2021
the information is
presented as follows.
• Overview
• Crash Characteristics
• Crash Involvement
• Motorcyclists
Age
Motorcycle Engine
Size
Speeding
Licensing and
Previous Driving
Records
Alcohol
• Helmet Use and
Effectiveness
• State
• Important Safety
Reminders
2021 Data

Motorcycles: 2021 Data 2
U.S. Department of Transportation NHTSA’s National Center for Statistics and Analysis
1200 New Jersey Avenue SE, Washington, DC 20590
This fact sheet contains information on fatal motor vehicle traffic crashes based on data from the Fatality Analysis
Reporting System (FARS) and non-fatal motor vehicle traffic crashes from the National Automotive Sampling
System (NASS) General Estimates System (GES) and Crash Report Sampling System (CRSS). A change
instituted with the release of 2020 data is rounding estimates to the nearest whole number instead of the nearest
thousand for all police-reported crashes, including injury estimates. Refer to the end of this publication for more
information on FARS, NASS GES, and CRSS.
Due to a vehicle classification change, the 2020 and later-year vehicle type classifications are not
comparable to 2019 and earlier-year vehicle type classifications. This change affects any analysis with a
vehicle component to it. Refer to the end of this publication for more information on Product Information
Catalog and Vehicle Listing (vPIC).
A motor vehicle traffic crash is defined as an incident that involved one or more motor vehicles in-transport that
originated on or had a harmful event (injury or damage) on a public trafficway, such as a road or highway.
Crashes that occurred on private property not regularly used by the public for transport, including some parts of
parking lots and driveways, are excluded. The terms “motor vehicle traffic crash” and “traffic crash” are used
interchangeably in this document.
Overview
In 2021:
• There were 5,932 motorcyclists killed in motor vehicle traffic crashes – higher than the 5,506
motorcyclists killed in 2020 and the highest number of motorcyclists killed since FARS started data
collection in 1975.
• Motorcyclists accounted for 14 percent of all traffic fatalities and 17 percent of all motor vehicle occupant
(driver and passenger) fatalities.
• Of the 5,932 motorcyclists killed in traffic crashes, 95 percent (5,636) were riders and 5 percent (296)
were passengers.
• T
here were an estimated 82,686 motorcyclists injured, a 5
-p
ercent increase from 78,944 motorcyclists
injured in 2020.
T
able 1 presents information about motorcyclists killed and injured from 2012 to 2021. From 2020 to 2021
motorcyclist fatalities increased by 8 percent. The number of registered motorcycles and motorcycle vehicle miles
traveled (VMT) are also presented in Table 1, along with the respective fatality and injury rates.
Table 1. Motorcyclists Killed and Injured, and Fatality and Injury Rates, 2012–2021
Year
Killed
Registered Vehicles
Fatality Rate per 100,000
Registered Vehicles
VMT (millions)
Fatality Rate per
100 Million VMT
2012 4,986 8,454,939 58.97 21,385 23.32
2013 4,692 8,404,687 55.83 20,366 23.04
2014 4,594 8,417,718 54.58 19,970 23.00
2015 5,029 8,600,936 58.47 19,606 25.65
2016 5,337 8,679,380 61.49 20,445 26.10
2017 5,226 8,664,108 60.32 20,149 25.94
2018 5,038 8,659,741 58.18 20,076 25.09
2019 5,044 8,596,314 58.68 19,688 25.62
2020 5,506 8,347,435 65.96 17,947 30.68
2021 5,932 9,881,414 60.03 19,642 30.20

Motorcycles: 2021 Data 3
U.S. Department of Transportation NHTSA’s National Center for Statistics and Analysis
1200 New Jersey Avenue SE, Washington, DC 20590
Year Injured Registered Vehicles
Injury Rate per 100,000
Registered Vehicles
VMT (millions)
Injury Rate per 100
Million VMT
2012 93,251 8,454,939 1,103 21,385 436
2013 88,760 8,404,687 1,056 20,366 436
2014 91,987 8,417,718 1,093 19,970 461
2015 88,738 8,600,936 1,032 19,606 453
2016
†
104,442 8,679,380 1,203 20,445 511
2017
†
88,592 8,664,108 1,023 20,149 440
2018
†
81,859 8,659,741 945 20,076 408
2019
†
83,814 8,596,314 975 19,688 426
2020
†
78,944 8,347,435 946 17,947 440
2021
†
82,686 9,881,414 837 19,642 421
Sources: FARS 2012-2020 Final File, 2021 Annual Report File (ARF); NASS GES 2012-2015; CRSS 2016-2021; VMT and Registered
Vehicles – Federal Highway Administration (FHWA)
†
CRSS estimates and NASS GES estimates are not comparable due to different sample designs. Refer to end of document for more
information about CRSS.
Note: Due to a vehicle classification change, the 2020 and later year data are not comparable to 2019 and earlier years.
Motorcycles made up 3.5 percent of all registered vehicles in the United States in 2021 and accounted for only 0.6
percent of all VMT. Per 100,000 registered vehicles in 2021, the fatality rate for motorcyclists (60.03) was nearly
5 times the fatality rate for passenger car occupants (12.53) and 8 times the fatality rate for light-truck occupants
(7.52), as shown in Table 2. The injury rate for motorcyclists (837) was lower than the injury rate for passenger
car occupants (1,027), but higher than the injury rate of light-truck occupants (578).
Per 100 million VMT in 2021, the fatality rate for motorcyclists (30.20) was almost 24 times the passenger car
occupant fatality rate (1.26) and 40 times the fatality rate for light-truck occupants (0.76). The motorcyclist injury
rate (421) was 4 times the injury rate of passenger car occupants (103) and 7 times the injury rate of light-truck
occupants (58).
Table 2. Occupant* Fatality and Injury Rates, by Vehicle Type, 2020 and 2021
Rate
Vehicle Type
Motorcycles
Passenger Cars
Light Trucks
Fatality
Rate
Injury
Rate
Fatality
Rate
Injury
Rate
Fatality
Rate
Injury
Rate
2020
Per 100,000 Registered Vehicles 65.96 946 11.42 924 6.87 539
Per 100 Million VMT 30.68 440 1.22 99 0.73 58
2021
Per 100,000 Registered Vehicles 60.03 837 12.53 1,027 7.52 578
Per 100 Million VMT 30.20 421 1.26 103 0.76 58
Sources: FARS 2020 Final File, 2021 ARF; CRSS 2020–2021; Registered Motorcycles and Motorcycle VMT– FHWA; Registered
Passenger Cars and Light Trucks – Polk data from S&P Global Mobility, Copyright © R.L. Polk & Co.; Passenger Car and Light-Truck
VMT – FHWA, revised by NHTSA
*Includes both riders/drivers and passengers.
Crash Characteristics
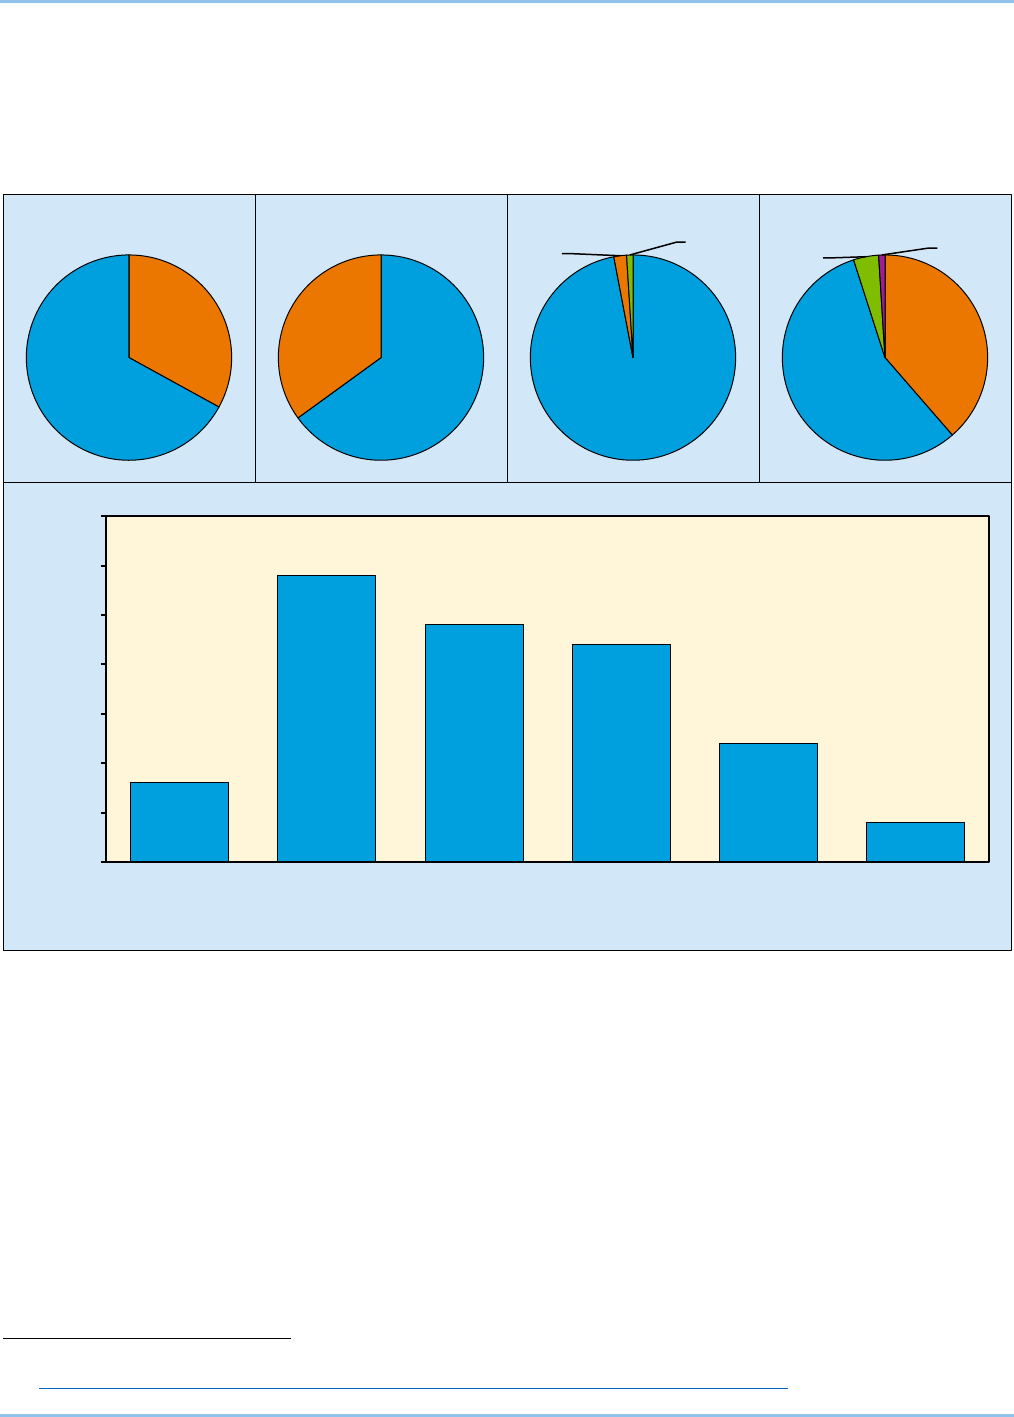
Figure 1 displays information about the environment surrounding the motorcyclist fatalities in 2021 including
land use, motorcyclist location, light condition, weather, and functional system. In 2021 (based on known values):
• 67 percent of the motorcycle fatalities occurred in urban areas compared to 33 percent in rural areas;
• 65 percent occurred at locations that were not intersections compared to 35 percent at intersections;
• 97 percent occurred in clear/cloudy conditions compared to 2 percent in rain conditions and 1 percent in
snow/sleet, fog, or other conditions;
Motorcycles: 2021 Data 4
U.S. Department of Transportation NHTSA’s National Center for Statistics and Analysis
1200 New Jersey Avenue SE, Washington, DC 20590
• 57 percent occurred during daylight compared to 39 percent in the dark, 4 percent during dusk, and 1
percent during dawn; and
• 92 percent occurred on non-interstate roads compared to 8 percent on interstates.
Figure 1. Motorcyclist Fatalities in Relation to Land Use, Motorcyclist Location, Weather, Light
Condition, and Functional System
1
, 2021
Rural
33%
Urban
67%
Land Use
Not At
Intersection
65%
At
Intersection
35%
Motorcyclist Location
Clear/Cloudy
97%
Rain
2%
Other
1%
Weather
Dark
39%
Daylight
57%
Dusk
4%
Dawn
1%
Light Condition
8%
29%
24%
22%
12%
4%
0%
5%
10%
15%
20%
25%
30%
35%
Interstate Non-Interstate
Principal Arterial
Non-Interstate
Minor Arterial
Non-Interstate
Collector
Non-Interstate
Local
Non-Interstate
Freeway/Expressway
Percentage of Motorcyclist Fatalities
Functional System
1
Source: FARS 2021 ARF
Notes: Unknowns were removed before calculating percentages. Percentages may not add up to 100 percent due to independent rounding.
Crash Involvement
The most harmful events in 2021 for 3,471 (57%) of the 6,082 motorcycles involved in fatal crashes were
collisions with motor vehicles in transport.
In two-vehicle crashes, 75 percent of the motorcycles involved in fatal crashes were struck in the front. Only 8
percent were struck in the rear.
Motorcycles were more frequently involved in fatal collisions with fixed objects than other vehicle types.
Twenty-four percent of motorcycles involved in fatal crashes in 2021 collided with fixed objects, compared to 17
percent for passenger cars, 12 percent for light trucks, and 4 percent for large trucks.
1
Definitions for the different functional system can be found at
www.fhwa.dot.gov/planning/processes/statewide/related/highway_functional_classifications/fcauab.pdf

Motorcycles: 2021 Data 5
U.S. Department of Transportation NHTSA’s National Center for Statistics and Analysis
1200 New Jersey Avenue SE, Washington, DC 20590
In 2021 there were 3,052 fatal two-vehicle crashes each involving a motorcycle and another type of vehicle. In 43
percent (1,315) of these crashes, the other vehicles were turning left while the motorcycles were going straight,
passing, or overtaking other vehicles. Both vehicles were going straight in 640 crashes (21%).
Motorcyclists
Age
From 2020 to 2021 motorcyclist fatalities among the 15-to-20 age group increased by 35 percent, from 218 to
294. Motorcyclist fatalities in the 40-to-44 age group increased 23 percent from 432 in 2020 to 531 in 2021. In
2021 the average age of motorcycle riders killed in traffic crashes was 43.
Weekday is defined as Monday 6 a.m. to Friday 5:59 p.m. and weekend is defined as Friday 6 p.m. to Monday
5:59 a.m. Table 3 shows that in 2020 and 2021 roughly half the motorcyclists were killed in traffic crashes during
the weekend versus weekday. Additionally, motorcyclist fatalities on weekdays have increased by 11 percent
from 2,736 in 2020 to 3,039 in 2021.
Table 3. Motorcyclist Fatalities, by Age Group and Day of Week, 2020 and 2021
Age Group
2020
2021
Weekday
Weekend
Total*
Weekday
Weekend
Total*
<15 7 6 13 6 5 11
15-20 119 99 218 179 115 294
21-24 270 219 489 267 204 472
25-29 337 357 695 384 309 693
30-34 330 350 680 363 337 700
35-39 235 251 487 271 296 568
40-44 218 213 432 248 280 531
45-49 223 264 488 264 271 535
50-54 221 281 505 255 296 552
55-59 270 263 534 255 281 537
60-64 202 225 427 219 213 433
65+ 302 231 533 328 270 598
Total* 2,736 2,762 5,506 3,039 2,885 5,932
Source: FARS 2020 Final File, 2021 ARF
Weekday — Monday 6 a.m. to Friday 5:59 p.m. (4.5 days)
Weekend — Friday 6 p.m. to Monday 5:59 a.m. (2.5 days)
*Includes unknown age and unknown day of week.
Motorcycle Engine Size
Table 4 presents motorcyclist fatalities by the engine size (displacement) of the motorcycles from 2020 to 2021.
Of the motorcyclists killed in traffic crashes in 2021, there were 35 percent riding on motorcycles with engine
sizes of 501 to 1,000 cubic centimeters (cc), followed by 27 percent on motorcycles with engine sizes of 1,501 cc
or higher, 23 percent on motorcycles with engine sizes of 1,001 to 1,500 cc, and 8 percent on motorcycles with
engine sizes up to 500 cc.
The number of motorcyclist fatalities on motorcycles with engine sizes up to 500 cc increased by 10 percent
(from 429 to 470) during this time, while the motorcyclist fatalities on motorcycles with engine sizes from 501 to
1,000 cc increased by 8 percent (from 1,942 to 2,088). Motorcyclist fatalities on motorcycles with engine sizes
from 1,001 to 1,500 cc increased by 8 percent (from 1,263 to 1,361), while the number of motorcyclists killed on
motorcycles with engine sizes 1,501 cc or higher increased by 12 percent (from 1,427 to 1,602).

Motorcycles: 2021 Data 6
U.S. Department of Transportation NHTSA’s National Center for Statistics and Analysis
1200 New Jersey Avenue SE, Washington, DC 20590
Table 4. Motorcyclist Fatalities, by Engine Size* (cc), 2020–2021
Year
Engine Size (cc)
Total
Up to 500
501–1,000
1,001–1,500
1,501 & Higher
Unknown
Number
Percent
Number
Percent
Number
Percent
Number
Percent
Number
Percent
Number
Percent
2020
429
8%
1,942
35%
1,263
23%
1,427
26%
445
8%
5,506
100%
2021
470
8%
2,088
35%
1,361
23%
1,602
27%
411
7%
5,932
100%
Source: FARS 2020 Final File, 2021 ARF
*Based on data from NHTSA's Product Information Catalog and Vehicle Listing (vPIC).
Notes: Other motorcycle characteristics beside engine size (displacement) influence power and speed capability. NHTSA has not
determined that there is a causal relationship between displacement and fatality risk.
Speeding
NHTSA considers a crash to be speeding-related if the driver was charged with a speeding-related offense or if an
investigating police officer indicated that racing, driving too fast for conditions, or exceeding the posted speed
limit was a contributing factor in the crash. Thirty-three percent of all motorcycle riders involved in fatal crashes
in 2021 were speeding, compared to 22 percent for passenger car drivers, 15 percent for light-truck drivers, and 7
percent for large-truck drivers. As shown in Table 5, motorcycle riders 21 to 24 years old involved in fatal crashes
had the highest speeding involvement at 49 percent.
Table 5. Motorcycle Riders Involved in Fatal Crashes, by Age Group and Speeding Involvement,
2021
Age Group
Speeding Involvement
Total
Speeding
Not Speeding
Number
Percent
Number
Percent
Number
Percent
<15
1
20%
4
80%
5
100%
15-20
127
43%
165
57%
292
100%
21-24
240
49%
248
51%
488
100%
25-29
333
46%
388
54%
721
100%
30-34
317
44%
406
56%
723
100%
35-39
226
38%
366
62%
592
100%
40-44
173
32%
361
68%
534
100%
45-49
174
32%
377
68%
551
100%
50-54
160
28%
421
72%
581
100%
55-59
122
22%
423
78%
545
100%
60-64
75
17%
367
83%
442
100%
65+
77
13%
515
87%
592
100%
Total*
2,026
33%
4,054
67%
6,080
100%
Source: FARS 2021 ARF
*Includes unknown age.
Licensing and Previous Driving Records
Thirty-six percent of motorcycle riders involved in fatal crashes in 2021 were riding without valid motorcycle
licenses at the time of the crashes, while only 17 percent of passenger vehicle (passenger cars and light trucks)
drivers in fatal crashes did not have valid licenses. A valid motorcycle license includes a rider having a valid
driver license (non-CDL license status) with a motorcycle endorsement or a motorcycle-only license.
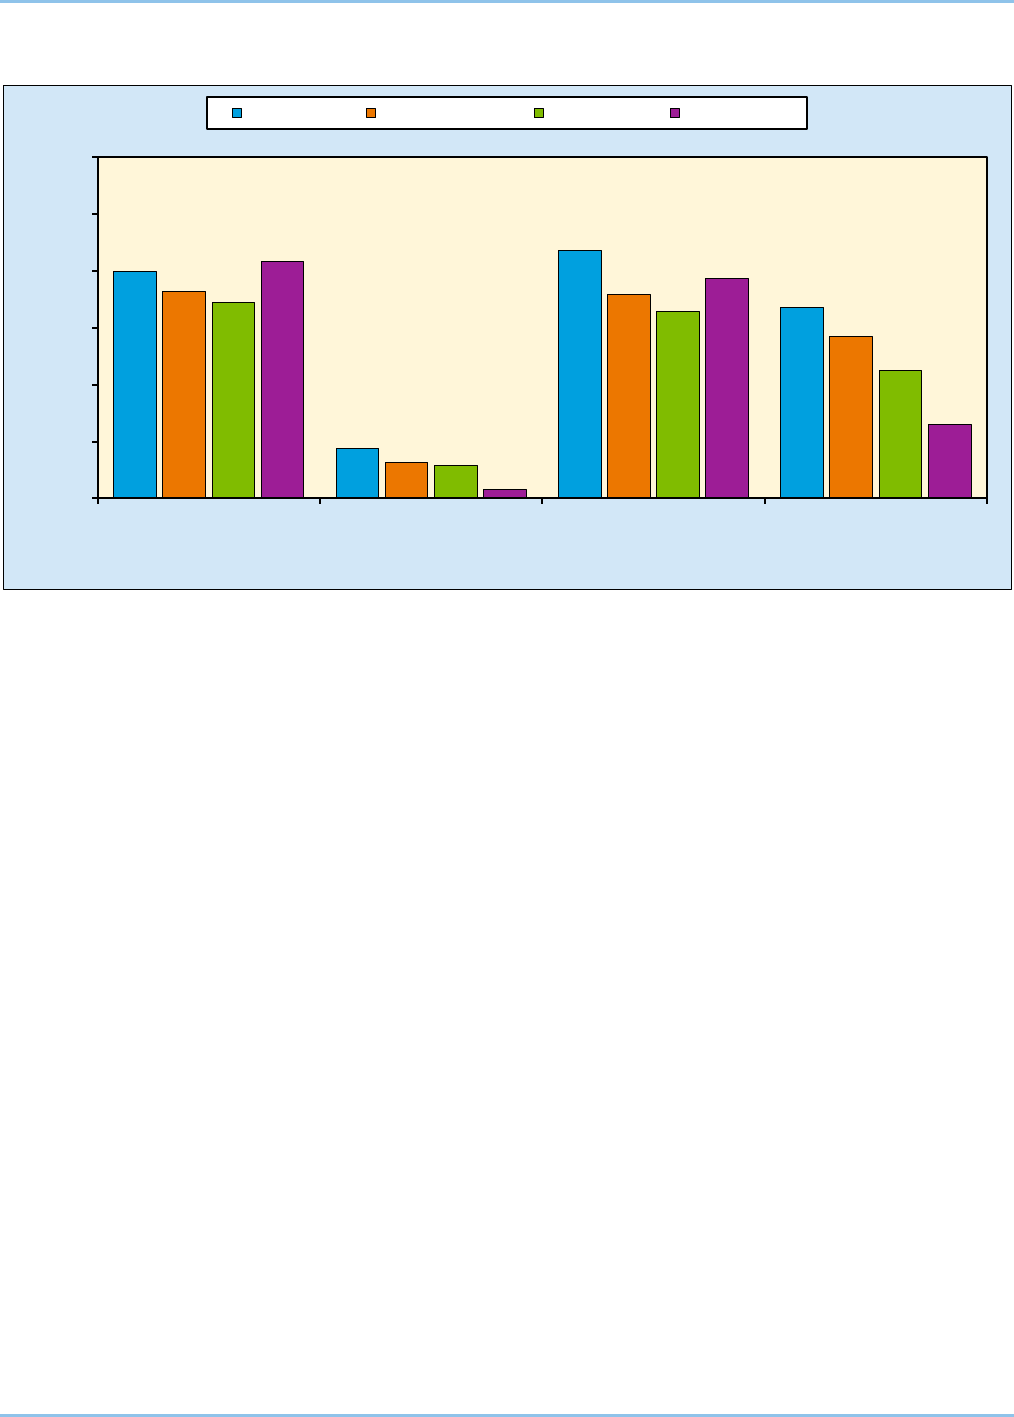
As shown in Figure 2, motorcycle riders involved in fatal crashes had the highest percentages of drivers with
previous driving records as compared to other vehicle drivers. Motorcycle riders involved in fatal crashes were
1.2 times more likely than passenger car drivers to have previous license suspensions or revocations (16.8% and
14.2%, respectively). Note that FARS records drivers’ previous driving records that occurred within 5 years from
the crash date.
Motorcycles: 2021 Data 7
U.S. Department of Transportation NHTSA’s National Center for Statistics and Analysis
1200 New Jersey Avenue SE, Washington, DC 20590
Figure 2. Percentage of Previous 5-Year Driving Records of Drivers Involved in Fatal Crashes,
By Vehicle Type, 2021
19.9%
4.4%
21.8%
16.8%
18.2%
3.2%
17.9%
14.2%
17.2%
2.9%
16.4%
11.2%
20.8%
0.8%
19.3%
6.5%
0%
5%
10%
15%
20%
25%
30%
Recorded Crashes DWI Convictions Speeding Convictions Recorded Suspensions or
Revocations
Percentage of Drivers Involved
Previous Driving Record
Motorcycles Passenger Cars Light Trucks Large Trucks
Source: FARS 2021 ARF
Note: Excludes all drivers with previous records that were unknown.
Alcohol
In 2021 there were 5,636 motorcycle riders killed in traffic crashes compared to 5,199 in 2020. Of the 5,636 in
2021, there were 1,624 (29%) who were alcohol-impaired (BAC of .08 g/dL or higher). In 2020 there were 1,362
(26%) who were alcohol-impaired. There were 402 (7%) motorcycle riders killed in 2021 who had lower alcohol
levels (BACs of .01 to .07 g/dL).
Motorcycle riders involved (killed or survived) in fatal crashes in 2021 had higher percentages of alcohol
impairment than any other type of motor vehicle driver (28% for motorcycle riders, 24% for passenger car
drivers, 20% for light-truck drivers, and 3% for large-truck drivers).
In 2021 the highest percentages of alcohol-impaired motorcycle rider fatalities were in the 35-to-39 and 40-to-44
age groups (35% each) followed by the 30-to-34 and 50-to-54 age groups (33% each), 45-to-49 age group (32%)
and 25-to-29 age group (30%), when compared to other age groups.
Forty-three percent of the 2,170 motorcycle riders who died in single-vehicle crashes in 2021 were alcohol-
impaired as compared to 20 percent of the 3,466 motorcycle riders who died in multiple-vehicle crashes, as shown
in Table 6. Forty-six percent of those killed in single-vehicle crashes on weekends in 2021 were alcohol-impaired
compared to 43 percent in 2020.

Motorcycles: 2021 Data 8
U.S. Department of Transportation NHTSA’s National Center for Statistics and Analysis
1200 New Jersey Avenue SE, Washington, DC 20590
Table 6. Alcohol-Impaired Motorcycle Riders Killed, by Crash Type and Day of Week, 2020 and
2021
Crash Type and
Day of Week
2020
2021
Total Motorcycle
Riders Killed
Alcohol-Impaired
Total Motorcycle
Riders Killed
Alcohol-Impaired
Number
Percent
Number
Percent
Single-Vehicle
Weekday 945 304 32% 968 377 39%
Weekend
1,175 506 43% 1,197 552 46%
Total* 2,124 812 38% 2,170 931 43%
Multiple-Vehicle
Weekday 1,668 225 13% 1,953 325 17%
Weekend
1,405 325 23% 1,511 368 24%
Total*
3,075
550
18%
3,466
693
20%
Total
Weekday 2,613 528 20% 2,921 701 24%
Weekend
2,580 831 32% 2,708 920 34%
Total*
5,199
1,362
26%
5,636
1,624
29%
Source: FARS 2020 Final File, 2021 ARF
Weekday — Monday 6 a.m. to Friday 5:59 p.m. (4.5 days)
Weekend — Friday 6 p.m. to Monday 5:59 a.m. (2.5 days)
*Includes riders involved in fatal crashes when day of week was unknown.
Notes: Percentages are computed based on unrounded estimates. NHTSA estimates BACs when alcohol test results are unknown.
Motorcycle riders killed in traffic crashes at night were three times more frequently alcohol-impaired than those
killed during the day (42% and 16%).
The reported helmet use rate for alcohol-impaired motorcycle riders killed in traffic crashes in 2021 was 52
percent as compared to 66 percent for those with no alcohol (BAC=.00 g/dL).
Helmet Use and Effectiveness
NHTSA estimates that helmets saved the lives of 1,872 motorcyclists in 2017. If all motorcyclists had worn
helmets, an additional 749 lives could have been saved (latest data available).
2
Helmets are estimated to be 37-percent effective in preventing fatalities to motorcycle riders and 41 percent for
motorcycle passengers. In other words, for every 100 motorcycle riders killed in crashes while not wearing
helmets, 37 of them could have been saved had all 100 worn helmets.
2
All motorcycle helmets sold in the United States are required to meet Federal Motor Vehicle Safety Standard
(FMVSS) 218, the performance standard that establishes the minimum level of protection for helmets designed
for use by motorcyclists. According to results from the National Occupant Protection Use Survey (NOPUS), the
overall rate of DOT-compliant motorcycle helmet use in the United States was 64.9 percent in 2021. Helmet use
continued to be significantly higher in States that required all motorcyclists to be helmeted than in other States.
3
2
National Center for Statistics and Analysis. (2019, December). Lives and costs saved by motorcycle helmets, 2017 (Traffic Safety Facts
Crash•Stats Report No. DOT HS 812 867). National Highway Traffic Safety Administration.
https://crashstats.nhtsa.dot.gov/Api/Public/ViewPublication/812867
3
National Center for Statistics and Analysis. (2022, March). Motorcycle helmet use in 2021 – Overall results (Traffic Safety Fact Research
Note. Report No. DOT HS 813 270). National Highway Traffic Safety Administration.
https://crashstats.nhtsa.dot.gov/Api/Public/ViewPublication/813270
Motorcycles: 2021 Data 9
U.S. Department of Transportation NHTSA’s National Center for Statistics and Analysis
1200 New Jersey Avenue SE, Washington, DC 20590
State
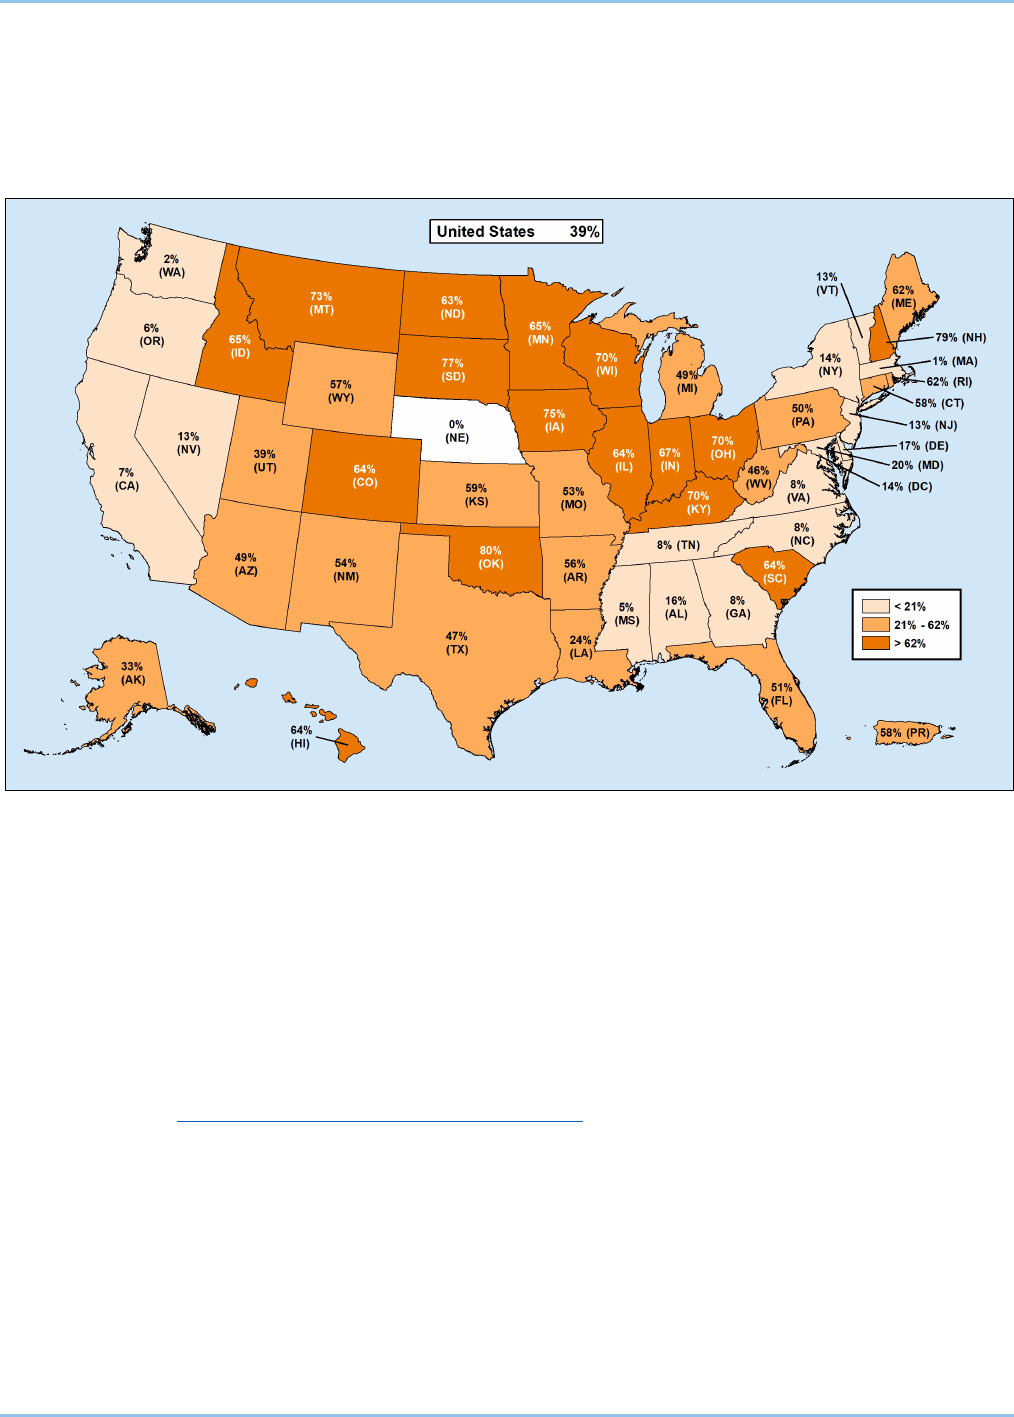
Reported helmet use rates for motorcyclists killed in 2021 were 61 percent for riders and 47 percent for
passengers, compared with 62 percent and 47 percent, respectively, in 2020. Figure 3 presents the percentage of
motorcyclists killed who were not helmeted by each State in 2021, based on known helmet use.
Figure 3. Percentage of Known Unhelmeted* Motorcyclists Killed, 2021
Source: FARS 2021 ARF
*Based on known helmet use.
In 2021 only 18 States, the District of Columbia, and Puerto Rico required helmet use for all motorcyclists.
Excluding the District of Columbia and Puerto Rico, the known helmet use percentages in fatal crashes ranged
from 54 percent (West Virginia) to 100 percent (Nebraska) for these 18 States.
In 29 States helmet use was required for only a subset of motorcyclists (typically, motorcyclists under age 18),
and 3 States (Illinois, Iowa, and New Hampshire) did not require helmet use for motorcyclists of any age. The
known helmet use percentages in fatal crashes ranged from 20 percent (Oklahoma) to 83 percent (Delaware) for
these 32 States.
The most current information on helmet use laws is available on the Governors Highway Safety Association
(GHSA) website at www.ghsa.org/state-laws/issues/motorcyclists
. In States without universal helmet laws, 55
percent of motorcyclists killed in 2021 were not wearing helmets, as compared to 9 percent in States with
universal helmet laws. According to NOPUS, in 2021 DOT-compliant motorcycle helmet use in States requiring
all to use helmets was 86.1 percent compared to 53.4 percent in other States.
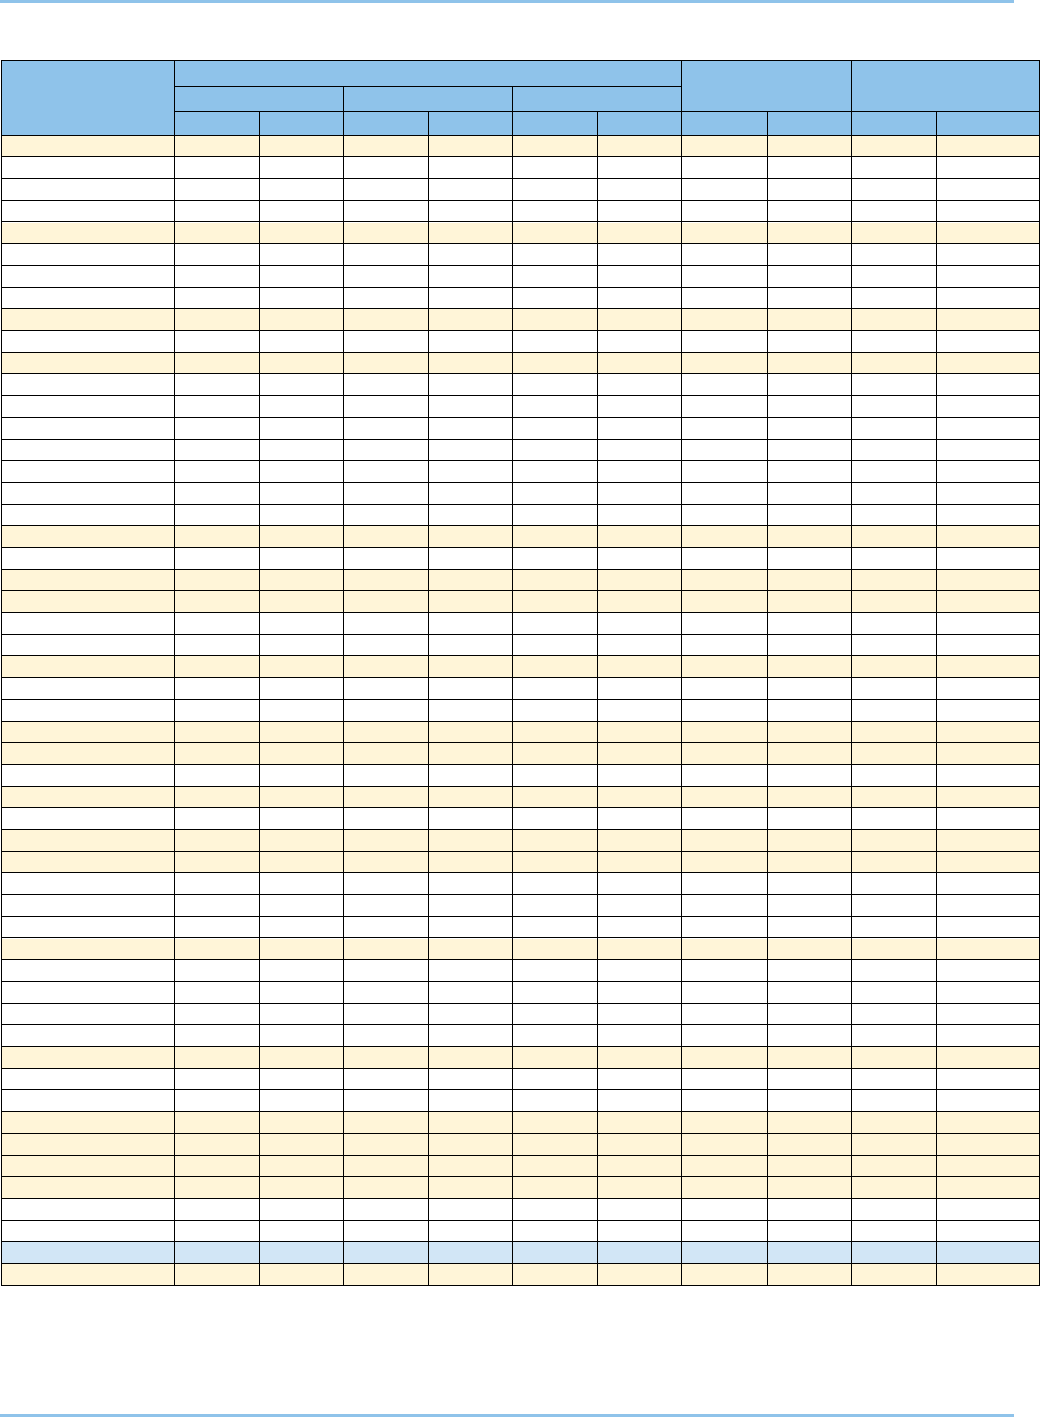
Table 7 shows that 39 pe
rcent of the 5,932 motorcyclists killed nationwide in traffic crashes in 2021 were not
helmeted, based on known helmet use. The State-level unhelmeted percentages ranged from a high of 80 percent
(Oklahoma) to a low of 0 percent (Nebraska), based on known use.
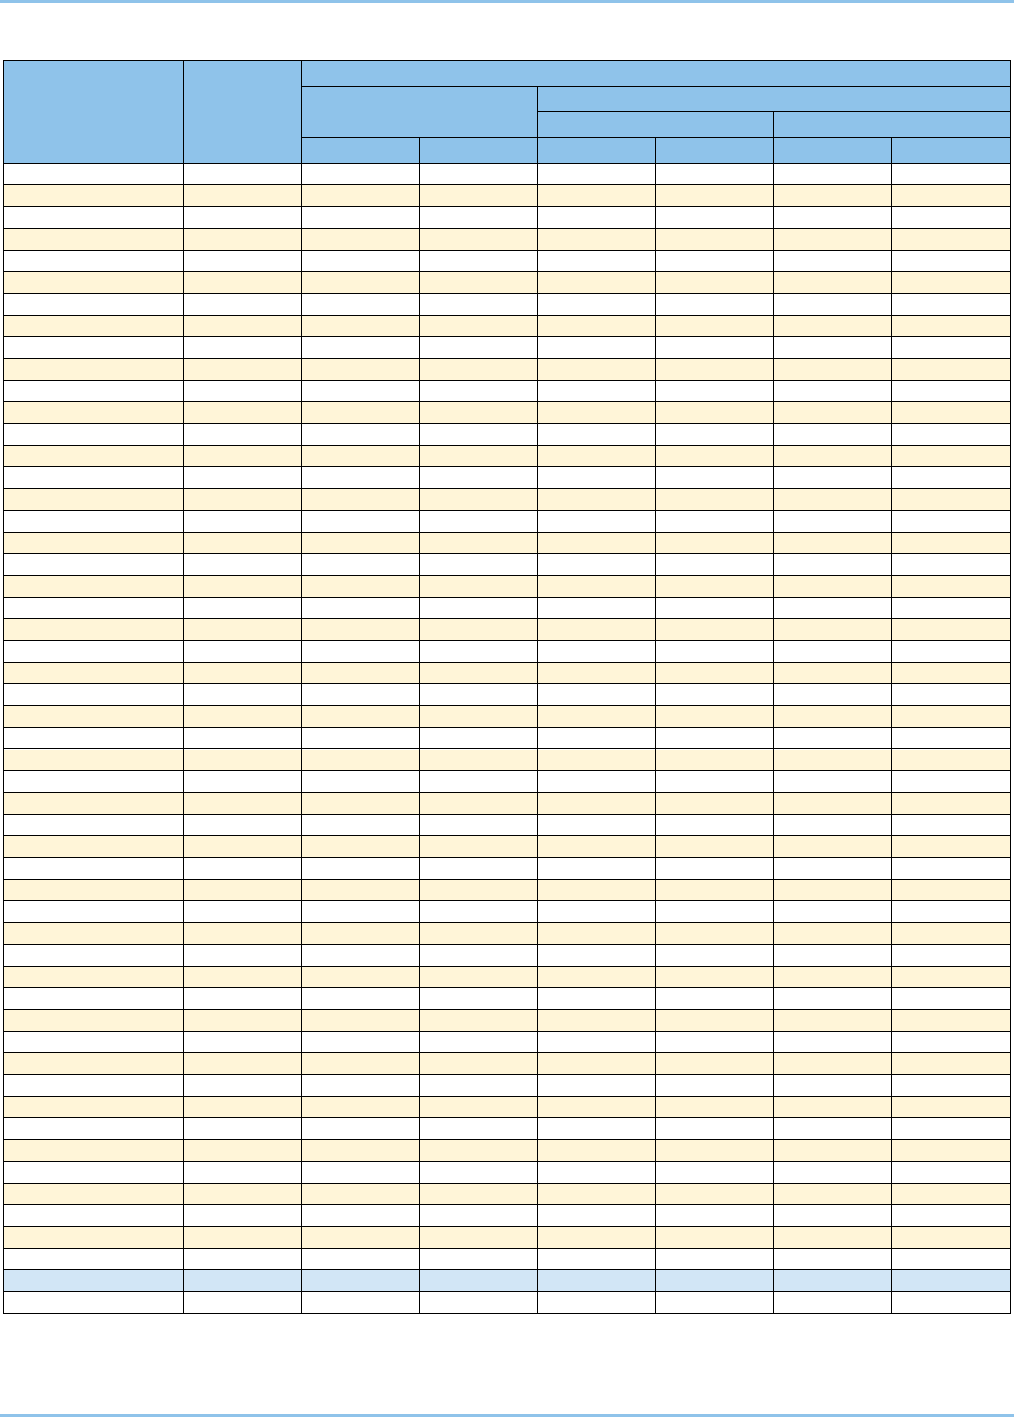
Table 8 presents the percentage of motorcycle riders killed who were alcohol-impaired, by State where the
crashes occurred in 2021. The percentages ranged from a low of 15 percent (South Dakota) to a high of 41 percent
(Wyoming), compared to the national average of 29 percent.
Motorcycles: 2021 Data 10
U.S. Department of Transportation NHTSA’s National Center for Statistics and Analysis
1200 New Jersey Avenue SE, Washington, DC 20590
Table 7. Motorcyclist Fatalities, by State and Helmet Use, 2021
State
Helmet Use
Total
Percent Based on
Known Helmet Use
Helmeted
Unhelmeted
Unknown
Number
Percent
Number
Percent
Number
Percent
Number
Percent
Helmeted
Unhelmeted
Alabama
62
81%
12
16%
3
4%
77
100%
84%
16%
Alaska
4
67%
2
33%
0
0%
6
100%
67%
33%
Arizona
72
48%
70
47%
8
5%
150
100%
51%
49%
Arkansas
41
43%
53
55%
2
2%
96
100%
44%
56%
California
516
91%
37
7%
12
2%
565
100%
93%
7%
Colorado
48
36%
84
62%
3
2%
135
100%
36%
64%
Connecticut
25
38%
35
54%
5
8%
65
100%
42%
58%
Delaware
19
83%
4
17%
0
0%
23
100%
83%
17%
District of Columbia
6
86%
1
14%
0
0%
7
100%
86%
14%
Florida
314
48%
328
50%
9
1%
651
100%
49%
51%
Georgia
165
89%
14
8%
6
3%
185
100%
92%
8%
Hawaii
12
36%
21
64%
0
0%
33
100%
36%
64%
Idaho
11
35%
20
65%
0
0%
31
100%
35%
65%
Illinois
62
36%
108
62%
4
2%
174
100%
36%
64%
Indiana
42
31%
86
64%
6
4%
134
100%
33%
67%
Iowa
17
25%
51
75%
0
0%
68
100%
25%
75%
Kansas
18
38%
26
55%
3
6%
47
100%
41%
59%
Kentucky
32
30%
73
70%
0
0%
105
100%
30%
70%
Louisiana
61
73%
19
23%
3
4%
83
100%
76%
24%
Maine
8
38%
13
62%
0
0%
21
100%
38%
62%
Maryland
61
79%
15
19%
1
1%
77
100%
80%
20%
Massachusetts
66
92%
1
1%
5
7%
72
100%
99%
1%
Michigan
77
44%
74
43%
23
13%
174
100%
51%
49%
Minnesota
24
35%
44
64%
1
1%
69
100%
35%
65%
Mississippi
35
92%
2
5%
1
3%
38
100%
95%
5%
Missouri
71
45%
80
51%
7
4%
158
100%
47%
53%
Montana
7
27%
19
73%
0
0%
26
100%
27%
73%
Nebraska
19
90%
0
0%
2
10%
21
100%
100%
0%
Nevada
63
72%
9
10%
15
17%
87
100%
88%
13%
New Hampshire
5
19%
19
73%
2
8%
26
100%
21%
79%
New Jersey
83
84%
12
12%
4
4%
99
100%
87%
13%
New Mexico
23
45%
27
53%
1
2%
51
100%
46%
54%
New York
181
83%
30
14%
7
3%
218
100%
86%
14%
North Carolina
209
91%
18
8%
3
1%
230
100%
92%
8%
North Dakota
3
38%
5
63%
0
0%
8
100%
38%
63%
Ohio
66
30%
154
69%
3
1%
223
100%
30%
70%
Oklahoma
15
19%
59
74%
6
8%
80
100%
20%
80%
Oregon
76
90%
5
6%
3
4%
84
100%
94%
6%
Pennsylvania
107
48%
108
49%
7
3%
222
100%
50%
50%
Rhode Island
5
38%
8
62%
0
0%
13
100%
38%
62%
South Carolina
64
36%
112
63%
1
1%
177
100%
36%
64%
South Dakota
5
23%
17
77%
0
0%
22
100%
23%
77%
Tennessee
144
87%
13
8%
9
5%
166
100%
92%
8%
Texas
266
52%
232
45%
17
3%
515
100%
53%
47%
Utah
23
59%
15
38%
1
3%
39
100%
61%
39%
Vermont
13
87%
2
13%
0
0%
15
100%
87%
13%
Virginia
100
90%
9
8%
2
2%
111
100%
92%
8%
Washington
85
94%
2
2%
3
3%
90
100%
98%
2%
West Virginia
14
52%
12
44%
1
4%
27
100%
54%
46%
Wisconsin
36
30%
83
69%
2
2%
121
100%
30%
70%
Wyoming
6
35%
8
47%
3
18%
17
100%
43%
57%
U.S. Total
3,487
59%
2,251
38%
194
3%
5,932
100%
61%
39%
Puerto Rico
28
42%
39
58%
0
0%
67
100%
42%
58%
Source: FARS 2021 ARF
Note: Shading indicates requiring helmet use for all motorcyclists.
Motorcycles: 2021 Data 11
U.S. Department of Transportation NHTSA’s National Center for Statistics and Analysis
1200 New Jersey Avenue SE, Washington, DC 20590
Table 8. Motorcycle Rider Fatalities, by State and Their BACs, 2021
State
Total
Fatalities
Motorcycle Rider Fatalities, by Their BACs
BAC=.01+ g/dL
Alcohol-Impaired
BAC=.08+ g/dL
BAC=.15+ g/dL
Number
Percent
Number
Percent
Number
Percent
Alabama
72
21
29%
17
23%
8
11%
Alaska
6
2
33%
2
33%
2
33%
Arizona
144
44
31%
37
25%
23
16%
Arkansas
93
33
36%
28
30%
16
17%
California
552
197
36%
160
29%
94
17%
Colorado
128
55
43%
43
33%
28
22%
Connecticut
64
29
45%
21
32%
14
21%
Delaware
22
5
22%
5
22%
4
16%
District of Columbia
7
4
57%
2
26%
2
23%
Florida
612
201
33%
168
27%
99
16%
Georgia
183
64
35%
49
27%
32
18%
Hawaii
32
15
46%
9
29%
6
18%
Idaho
31
12
39%
11
36%
10
32%
Illinois
163
67
41%
54
33%
37
23%
Indiana
123
40
33%
33
27%
19
15%
Iowa
64
30
47%
22
35%
12
19%
Kansas
44
11
25%
9
21%
6
14%
Kentucky
96
25
26%
19
19%
13
14%
Louisiana
81
36
44%
27
33%
17
21%
Maine
19
8
43%
5
27%
3
18%
Maryland
75
31
41%
25
33%
16
21%
Massachusetts
66
27
40%
23
34%
13
19%
Michigan
167
48
29%
38
23%
25
15%
Minnesota
67
22
33%
18
27%
11
16%
Mississippi
35
7
20%
6
17%
4
10%
Missouri
151
50
33%
42
28%
28
18%
Montana
25
11
43%
9
38%
4
17%
Nebraska
21
7
33%
6
27%
3
13%
Nevada
84
30
35%
19
22%
9
11%
New Hampshire
22
10
44%
9
39%
5
24%
New Jersey
95
32
34%
27
29%
22
23%
New Mexico
49
17
34%
13
27%
7
15%
New York
212
72
34%
58
27%
37
17%
North Carolina
212
63
30%
48
23%
26
12%
North Dakota
4
1
25%
1
25%
1
25%
Ohio
202
92
45%
70
35%
46
23%
Oklahoma
75
27
35%
22
30%
19
26%
Oregon
78
27
34%
21
27%
15
19%
Pennsylvania
211
72
34%
55
26%
32
15%
Rhode Island
13
6
46%
5
38%
4
31%
South Carolina
167
66
40%
54
32%
30
18%
South Dakota
19
5
26%
3
15%
1
6%
Tennessee
156
47
30%
34
22%
20
13%
Texas
496
206
42%
172
35%
112
23%
Utah
38
9
24%
8
21%
5
13%
Vermont
15
5
34%
5
34%
3
20%
Virginia
107
38
36%
30
28%
16
15%
Washington
85
35
41%
26
31%
15
18%
West Virginia
26
13
50%
10
39%
6
22%
Wisconsin
112
46
41%
41
36%
21
19%
Wyoming
15
6
42%
6
41%
5
30%
U.S. Total
5,636
2,026
36%
1,624
29%
1,004
18%
Puerto Rico
65
32
49%
22
34%
14
22%
Source: FARS 2021 ARF
Notes: Percentages are computed based on unrounded estimates. NHTSA estimates BACs when alcohol test results are unknown.
Motorcycles: 2021 Data 12
U.S. Department of Transportation NHTSA’s National Center for Statistics and Analysis
1200 New Jersey Avenue SE, Washington, DC 20590
Important Safety Reminders
For Motorcyclists:
• Wearing a helmet is the single most effective way to protect yourself from a head injury. Use a
motorcycle helmet for every ride, and ensure your passengers also use a helmet.
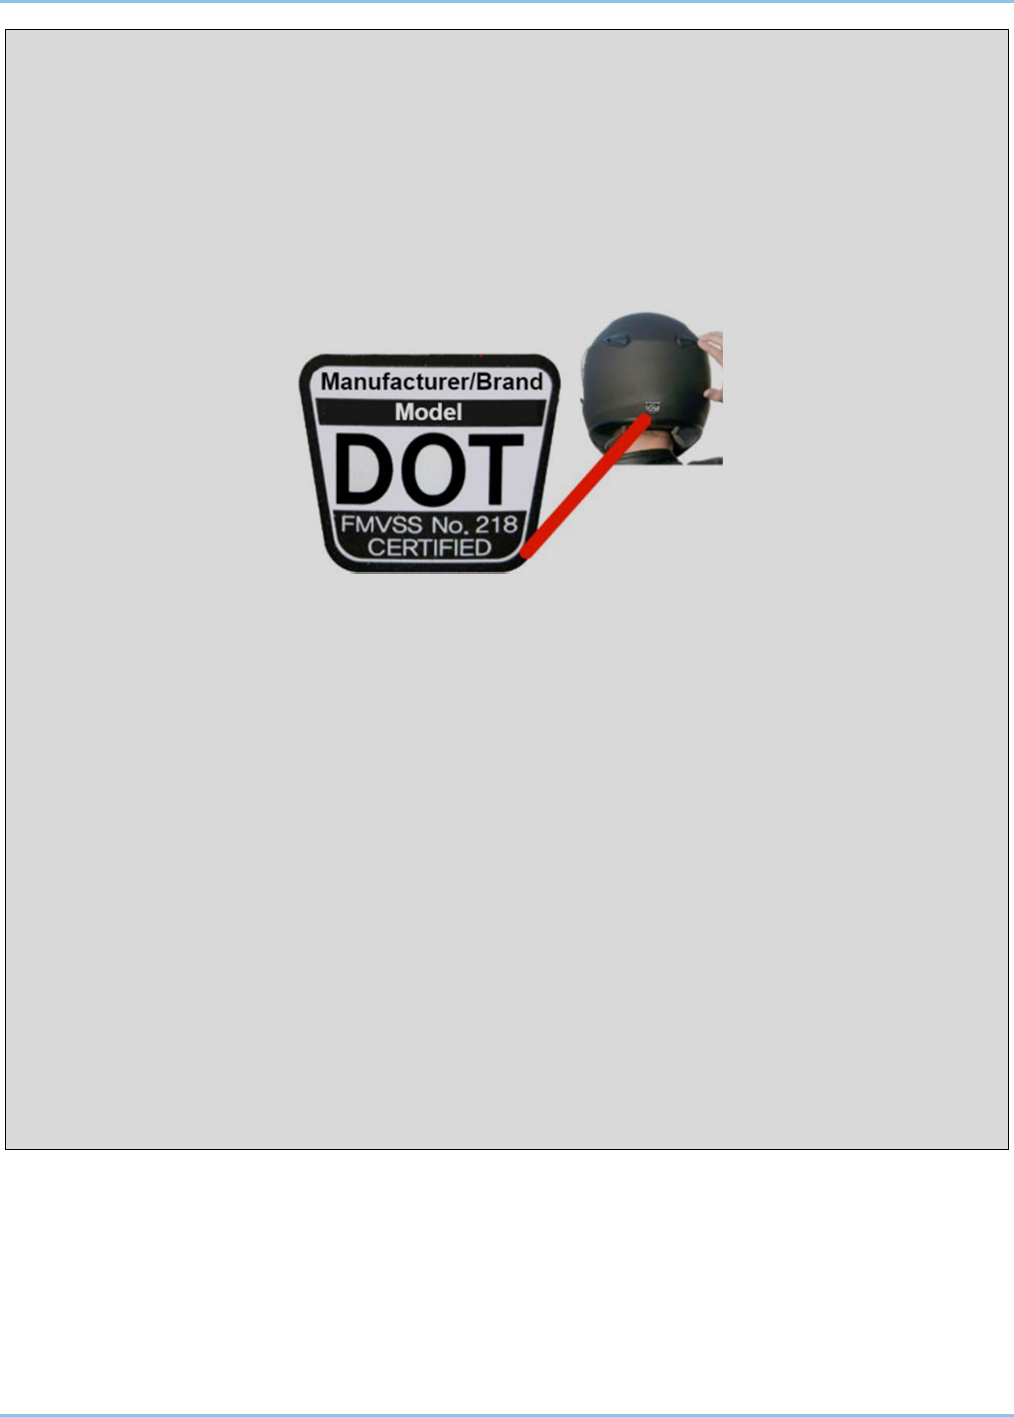
• Make sure your helmet has a valid U.S. Department of Transportation (DOT) label; the label means the
helmet meets the Federal Motor Vehicle Safety Standards – this is also known as the FMVSS 218
standard. Novelty helmets without this label may not meet the same standard and will not provide the best
protection needed in a crash.
• Check the fit of your helmet to ensure optimal protection.
• Wear protective gear like a sturdy jacket, pants, boots, and gloves; safety gear provide protection in case
of falls or crashes, and improves comfort during the ride.
• Make yourself visible by using high-visibility colors and retro-reflective materials to maximize the ability
of drivers to see you.
• Motorcycle riding requires full attention, skill, and coordination. Avoid combining riding with drinking
alcohol or using other impairing drugs.
For Drivers:
• Always be on the look-out for motorcyclists.
• A motorcycle’s smaller size means it can be hidden in your vehicle’s blind spot.
• A motorcycle’s size and narrow profile can make it difficult to judge its distance and speed. Take extra
care when judging when to turn or merge.
• Keep a safe distance from the motorcycle in front of you; motorcyclists can slow their motorcycles by
downshifting instead of using their brakes. This means the brake lights won’t come on.
• Remember that motorcyclists sometimes change positions in their lane to avoid debris on the road.
— NHTSA’s Research and Program Development

Motorcycles: 2021 Data 13
U.S. Department of Transportation NHTSA’s National Center for Statistics and Analysis
1200 New Jersey Avenue SE, Washington, DC 20590
Fatality Analysis Reporting System
FARS contains data on every fatal motor vehicle traffic crash within the 50 States, the District of Columbia,
and Puerto Rico. To be included in FARS, a traffic crash must involve a motor vehicle traveling on a
trafficway customarily open to the public, and must result in the death of a vehicle occupant or a nonoccupant
within 30 days of the crash. The Annual Report File (ARF) is the FARS data file associated with the most
recent available year, which is subject to change when it is finalized the following year to the final version
known as the Final File. The additional time between the ARF and the Final File provides the opportunity for
submission of important variable data requiring outside sources, which may lead to changes in the final
counts. More information on FARS can be found at www.nhtsa.gov/crash-data-systems/fatality-analysis-
reporting-system.
The updated final counts for the previous data year will be reflected with the release of the recent year’s ARF.
For example, along with the release of the 2021 ARF, the 2020 Final File was released to replace the 2020
ARF. The final fatality count in motor vehicle traffic crashes for 2020 was 39,007, which was updated from
38,824 in the 2020 ARF. The number of motorcycle fatalities from the 2020 Final File was 5,506, which was
updated from 5,579 from the 2020 ARF.
Crash Report Sampling System
NHTSA’s National Center for Statistics and Analysis (NCSA) redesigned the nationally representative
sample of police-reported traffic crashes, which estimates the number of police-reported injury and property-
damage-only crashes in the United States. CRSS replaced the National Automotive Sampling System (NASS)
General Estimates System (GES) in 2016. More information on CRSS can be found at www.nhtsa.gov/crash-
data-systems/crash-report-sampling-system-crss.
Product Information Catalog and Vehicle Listing (vPIC) Vehicle Classification
Historically, vehicle type classifications (e.g., passenger cars, light trucks, large trucks, motorcycles, buses)
from FARS, NASS GES, and CRSS used for analysis and data reporting were based on analyst-coded vehicle
body type. NHTSA did not have manufacturer authoritative data to assist in vehicle body type coding. NCSA
has developed a Product Information Catalog and Vehicle Listing (vPIC) dataset that is being used to decode
VINs (Vehicle Identification Numbers) and extract vehicle information. Details of vehicles (make, model,
body class, etc.) involved in crashes are obtained from vPIC via VIN-linkage. The VIN-derived information
from vPIC uses the manufacturer’s classification of body class, which allows for more accurate vehicle type
analysis.
The vPIC-based analysis data are available beginning with 2020 FARS and CRSS data files. Starting with the
release of 2021 FARS and CRSS data, all vehicle-related analysis for 2020 and later years will be based on
vPIC vehicle classification. As a result, the 2020 and later-year vehicle type classifications are not comparable
to 2019 and earlier-year vehicle type classifications. This change affects any analysis with a vehicle
component to it. More information on vPIC can be found at https://vpic.nhtsa.dot.gov/.

Motorcycles: 2021 Data 14
U.S. Department of Transportation NHTSA’s National Center for Statistics and Analysis
1200 New Jersey Avenue SE, Washington, DC 20590
The suggested APA format citation for this document is:
National Center for Statistics and Analysis. (2023, June, Revised). Motorcycles: 2021 data (Traffic Safety Facts.
Report No. DOT HS 813 466). National Highway Traffic Safety Administration.
15973-062723-v3
For More Information:
Motor vehicle traffic crash data are available from the National Center for Statistics and Analysis (NCSA),
NSA-230. NCSA can be contacted at [email protected] or 800-934-
8517. NCSA programs can be
found at www.nhtsa.gov/data. To report a motor vehicle safety-related problem or to inquire about safety
information, contact the Vehicle Safety Hotline at 888-327-4236 or www.nhtsa.gov/report-a-safety-problem.
The following data tools and resources can be found at https://cdan.nhtsa.gov/.
• Fatal Motor Vehicle Traffic Crash Data Visualizations
• Motor Vehicle Traffic Crash Databook
• Fatality and Injury Reporting System Tool (FIRST)
• State Traffic Safety Information (STSI)
• Traffic Safety Facts Annual Report Tables
• FARS Data Tables (FARS Encyclopedia)
• Crash Viewer
• Product Information Catalog and Vehicle Listing (vPIC)
• FARS, NASS GES, CRSS, NASS Crashworthiness Data System (CDS), and Crash Investigation
Sampling System (CISS) data can be downloaded for further analysis.
Other fact sheets available from NCSA:
• Alcohol-Impaired Driving
• Bicyclists and Other Cyclists
• Children
• Large Trucks
• Occupant Protection in Passenger Vehicles
• Older Population
• Passenger Vehicles
• Pedestrians
• Rural/Urban Comparison of Motor Vehicle Traffic Fatalities
• School-Transportation-Related Crashes
• Speeding
• State Alcohol-Impaired-Driving Estimates
• State Traffic Data
• Summary of Motor Vehicle Traffic Crashes
• Young Drivers
Detailed data on motor vehicle traffic crashes are published annually in Traffic
Safety Facts: A Compilation of Motor Vehicle Traffic Crash Data. The fact sheets
and Traffic Safety Facts annual report can be found at
https://crashstats.nhtsa.dot.gov/
.
