
VizLinc: Integrating information extraction, search, graph
analysis, and g eo-location for the visual exploration of
larg e data sets
∗
Joel C. Acevedo-Aviles, William M. Campbell, Daniel C. Halbert, Kara Greenfield
MIT Lincoln Laboratory, Human Language Technology Group, Lexington, MA, USA
{joel, wcampbell, daniel.halbert, kara.greenfield}@ll.mit.edu
ABSTRACT
In this demo paper we introduce VizLinc; an open-source
software suite that integrates automatic information extrac-
tion, search, graph analysis, and geo-location for interactive
visualization and exploration of large data sets. VizLinc
helps users in: 1) understanding the type of information
the data set under study might contain, 2) finding patterns
and connections between entities, and 3) narrowing down
the corpus to a small fraction of relevant documents that
users can quickly read. We apply the tools offered by Vi-
zLinc to a subset of the New York Times Annotated Corpus
and present use cases that demonstrate VizLinc’s search and
visualization features.
Keywords
VizLinc, visualization, visual analytics, graph analysis, data
exploration, information extraction, search, geo-location
1. INTRODUCTION
Information extraction refers to the task of automatically
extracting structured information from unstructured docu-
ments. Sub-tasks like named entity, relationship, and ter-
minology extraction are extremely useful to characterize the
content of large text corpora and give data analysts a sense
of what information might be present in such corpora. For
many applications, characterizing individual documents is
not enough. Linking relevant information across documents
is the key to harnessing the informative power of a large
heterogeneous corpus.
In this paper we introduce VizLinc; an open-source soft-
ware suite that integrates automatic information extraction,
search, graph analysis, and geo-location for interactive visu-
alization and exploration of large data sets. VizLinc helps
users in: 1) understanding the type of information the data
set under study might contain, 2) finding patterns and con-
nections between entities, and 3) narrowing down the cor-
pus to a small fraction of relevant documents that users
can quickly read. VizLinc is self-contained, does not re-
quire connections to online components, and scales to tens
of thousands of documents. All software is publicly available
through GitHub.
1
∗
This work was sponsored by the Defense Advanced Re-
search Projects Agency under Air Force Contract FA8721-
05-C-0002. Opinions, interpretations, conclusions, and rec-
ommendations are those of the authors and are not neces-
sarily endorsed by the United States Government.
1
https://github.com/mitll/vizlinc
According to the survey presented in [11] a large num-
ber of data analysis and visualization tools are available for
analyzing structured data, but tools for modeling and visu-
alizing semi- or unstructured data are still underrepresented.
Commercial visual analytics (VA) systems such as Tableau
2
and Spotfire Desktop
3
are designed to connect to a variety
of structured data sources. VizLinc, on the other hand, is
designed with the purpose of characterizing and exploring
large collections of unstructured documents. Like Visual
Analytics
4
and Centrifuge
5
, VizLinc uses graph modeling
techniques to represent relationships between data items; a
feature not present in most of the systems studied in [11].
Palantir
6
features a super set of the main visualizations
that VizLinc uses (geographical map and network) and it is
also suitable for unstructured data.[10] VizLinc, however, is
an extensible open-source, and free software suite whereas
Palantir is a commercial product. Contrary to most open-
source and commercial VA tools, VizLinc does not offer the
uni-variate or bi-variate statistical analysis tools often found
in software of its kind.[4][11] This is something that will be
addressed in future releases.
The rest of this paper is organized as follows. Sections 2
and 3 present an overview of the main components of the
VizLinc software suite and the technology used to implement
it. Sections 4 to 6, offer a look into VizLinc’s features and
usage. Lastly, we apply our techniques to a data set and
present use cases to demonstrate VizLinc’s capabilities in
section 7.
2. SYSTEM OVERVIEW
VizLinc is a software suite composed of two main applica-
tions: the Ingestion Tool and the User Interface (UI). The
Ingestion Tool takes a set of documents as input, extracts in-
formation from unstructured text, and stores the extracted
information in the format that the UI needs to allow users to
search, visualize, and explore the documents’ content. The
process of converting the input documents into information-
rich data structures, or simply the ingestion process, will
be covered in detail in section 3. For now, it suffices to
say that data ingestion is carried out entirely by the In-
https://github.com/mitll/vizlinc db
https://github.com/mitll/vizlinc ingester
2
http://www.tableausoftware.com/
3
http://spotfire.tibco.com/discover-spotfire/spotfire-
overview/spotfire-desktop
4
http://www.visualanalytics.com/
5
http://centrifugesystems.com/
6
http://www.palantir.com/
10
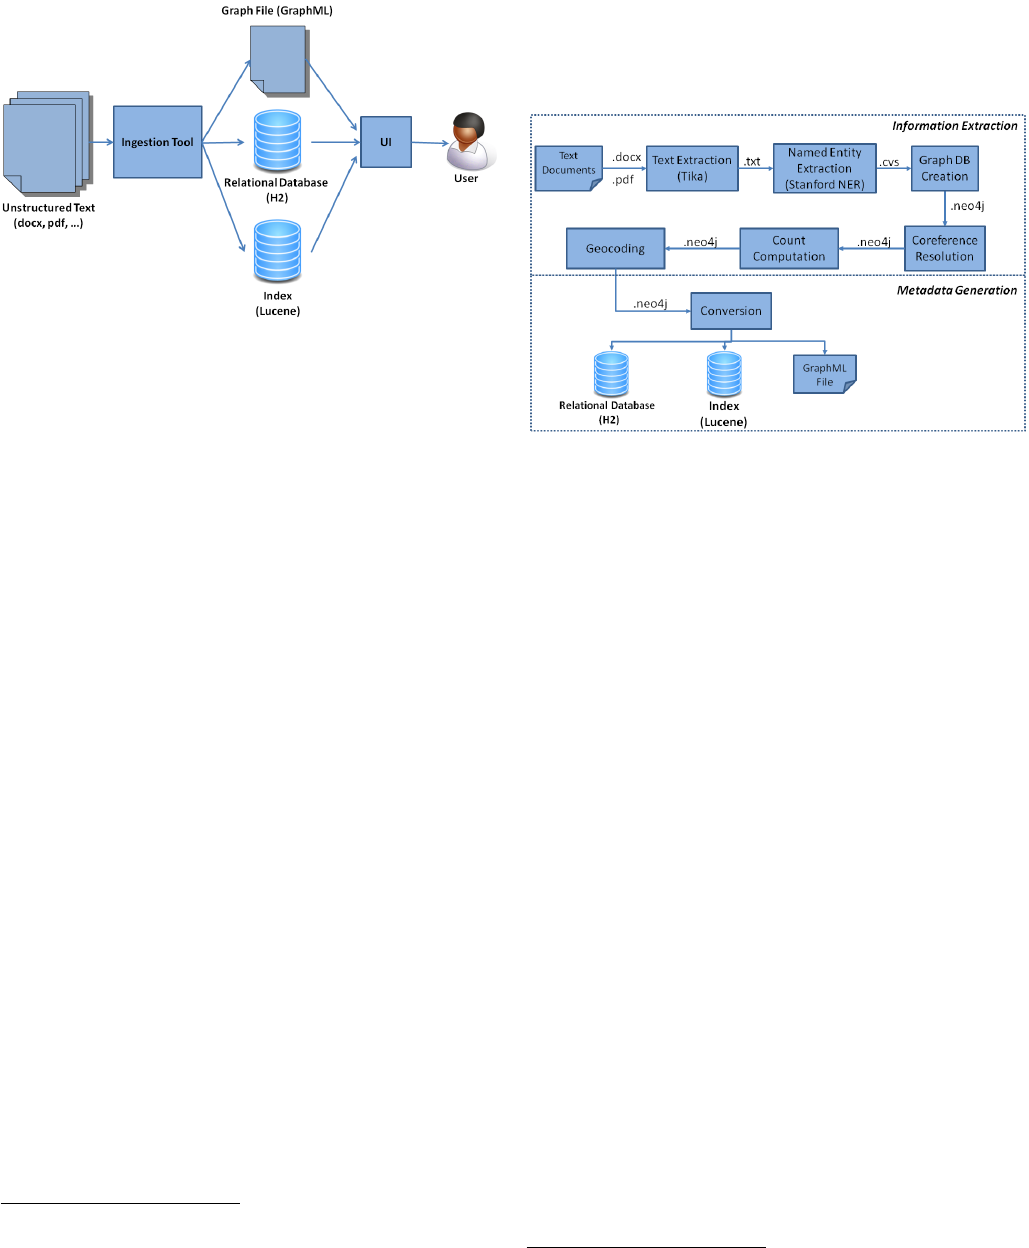
Figure 1: VizLinc main components. The Inges-
tion Tool processes text in a variety of formats and
produces the metadata the UI requires as input for
search and visualization.
gestion Tool in two major stages: Information Extraction
and Metadata Generation. During Information Extraction,
mentions of people, locations, and organizations are iden-
tified in text. Once identified, locations are geo-coded and
people are linked based on their co-occurrence patterns in
the data set. In addition, the text is indexed for search and
retrieval. The metadata generation step takes the extracted
information and stores it in an H2
7
relational database, a
GraphML
8
graph file, and a Lucene
9
index. The UI takes
the database, graph file, and index as inputs and presents a
graphical user interface for interactive visualization and ex-
ploration of the original data set. For the rest of this paper,
we will refer to the UI simply as VizLinc. Figure 1 depicts
the interaction between the aforementioned components.
The Ingestion Tool is written in the Groovy programming
language. Groovy is an agile and dynamic language for the
Java Virtual Machine
10
. The graph database we use for
data ingestion has a robust implementation in Groovy thus
making it an ideal choice for the Ingestion Tool. For ease
of use, we have developed a graphical user interface in Java
Swing that calls the appropriate Gro ovy classes as needed.
As the reader probably inferred by this point, the UI is
written in the Java programming language. Specifically, the
UI is a Gephi
11
plugin. Gephi is an interactive visualization
and exploration platform for large graphs [1] and powers all
graph-related features in the UI. Gephi, in turn, is based
on the Netbeans Platform
12
, a generic framework for rapid
development of Java Swing applications. One of the key
distinctions of software built upon the NetBeans Platform
is modularity [2]. This distinction made the integration of
VizLinc’s UI with Gephi a seamless one. For the rest of this
paper, we will refer to the UI component simply as VizLinc.
3. DATA INGESTION
7
http://www.h2database.com/
8
http://graphml.graphdrawing.org/
9
http://lucene.apache.org/
10
http://groovy.codehaus.org/
11
http://gephi.org/
12
https://netbeans.org/features/platform/
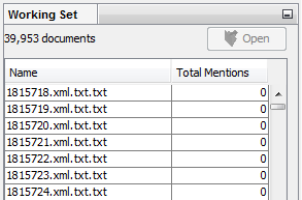
Data ingestion refers to the sequence of processing steps
that generate the necessary metadata for later visualization
and exploration in VizLinc. Figure 2 shows what these steps
are and the order in which they are executed.
Figure 2: The data ingestion process.
VizLinc admits text in a variety of formats including Mi-
crosoft Office formats(.docx, .doc, .xls, ...), Portable Doc-
ument Format (PDF) and HyperText Markup Language
(HTML).
13
For this reason, the first step in the ingestion
pipeline is extracting the text contained in the input docu-
ments. We use the tools provided by Apache Tika
14
for this
purpose. Other content, such as images, is ignored.
Once text is extracted, we perform named entity recog-
nition on each document using the Stanford NER [3] recog-
nizer. During this step named entities, specifically people,
locations, and organizations, are identified and extracted.
Each instance of an entity in a text is called a mention.
All mentions, information about the documents in which
they appear, and their positions within those documents
are stored in a Neo4j
15
graph database. The need to store
and retrieve links between the metadata that will b e gener-
ated in subsequent steps, makes this data representation an
intuitive and efficient one for our purposes [7]. The graph
database is augmented as ingestion progresses and, by the
end of the pipeline, stores the results of all the steps per-
formed during this process.
Mentions can have different forms yet refer to the same en-
tity. For instance, the person entity John Fitzgerald Kennedy
might be referred to as “John F. Kennedy”, “Kennedy”, and
“JFK”. VizLinc aims at discovering interesting patterns in
text by unveiling connections between the entities mentioned.
To this end, it is critical to find all the mentions of an en-
tity both within a document and across documents in the
corpus. The task of finding all expressions that refer to the
same entity is denominated coreference resolution and is the
goal of the fourth step in the ingestion pipeline. In VizLinc,
approximate string matching and a simple set of rules are
brought together to: 1) find all mentions of an entity within
a document(e.g., “John F. Kennedy”, “Kennedy”) and assign
them a single canonical form (e.g., “John F. Kennedy”) that
13
For a list of all supported formats, see
https://tika.apache.org/1.4/formats.html.
14
http://tika.apache.org/
15
http://www.neo4j.org/
11
is then used to 2) link all mentions of the same entity across
documents.
Ingestion proceeds by calculating the number of times
each entity is mentioned in the entire data set and the num-
ber of documents in which each appears. These values are
stored in the graph database for later presentation in the
graphical user interface.
One of VizLinc’s main features is a map that displays the
locations mentioned in a selected subset of the document
set under analysis. To render this possible, locations have
to be resolved to latitude/longitude coordinates that can
be then highlighted in the map. This is precisely what the
Geocoding step depicted in figure 2 does. Internally, we have
used a number of approaches to carry out this step for our
data sets of interest. In the version that we have publicly
released, the user can point the Ingestion To ol to an online
geocoding server. The Geocoding step marks the end of the
Information Extraction stage.
During the Metadata Generation stage, particular data
structures are created and saved to disk. Most of the meta-
data generated is stored in an H2 database. H2 is an open
source database engine written in the Java programming
language
7
. Its speed, ability to run without a server, and
seamless integration with Java applications were the main
reasons why we chose it over other database engines.
Co-occurrences of person entities in documents are en-
coded in the form of edges between nodes of a graph. For
that reason, we store this information in a GraphML file.
GraphML is a comprehensive file format for graphs which
consists of a language core to describe the structural prop-
erties of a graph and a flexible extension mechanism to add
application-specific data
8
. Each node in the graph repre-
sents a p erson entity mentioned in the data set. An edge
exists between a pair of nodes if the corresp onding entities
co-occur in more than two do cuments. Co-occurrence is a
symmetric relation therefore edges in the graph are undi-
rected. In sections 5.5 and 7 we will discuss how this co-
occurrence network can be used to find coherent groups and
“important” people [5].
Lastly, Lucene is used to generate an index that stores
the entire text content of the input documents in a for-
mat suitable for string searching. Apache Lucene is a high-
performance, full-featured text search engine library written
entirely in Java. Lucene is an open source project available
for free download
9
.
4. VIZLINC INPUT
When run for the first time, VizLinc prompts the user
for the system paths of the database, index, and graph file
generated by the Ingestion Tool. Additionally, VizLinc re-
quires a tile source to populate its map. Two tile source
types are supported in the current version. If users have
pre-generated tiles and saved them as images, the directory
in which they were saved can be specified. Otherwise, an
HTTP map server can be specified through a URL. Once
the input is specified and loaded, users can visualize and ex-
plore their data sets. At any point, users can point VizLinc
to a different data set or tile source.
5. DATA CHARACTERIZATION
Upon loading our data in VizLinc we can immediately
get a sense of the composition of our text corpus. Figure
Figure 4: Working Set view
3 shows a snapshot of the UI’s main components or views.
In the following sub-sections we describe each of these views
and how they can be used for data exploration.
5.1 Working Document Set
The working set is the set of documents currently being
visualized in VizLinc. At first, this set consists of all docu-
ments in the data set but as search queries are applied, this
set gets narrowed down to a relevant subset of the corpus
(see section 6). Keep in mind that one of the main goals
of VizLinc is to empower users to quickly filter out those
documents that might not contain relevant information.
The Working Document Set view lists the specific docu-
ments that are part of the working set. This view is shown
in figure 4.
At any point in time, the number shown across the top of
the view represents how many documents are b eing analyzed
and represented in all views. The entries under the Total
Mentions column will be explained in section 6.
5.2 Document Viewer
Ultimately, users should be able to easily read the infor-
mative sections of a document, as determined by the search
query, and draw relevant conclusions. Selecting a document
name in the Working Set view and clicking on the Open
button will show the document’s content in the Document
Viewer. This view displays the text extracted from the se-
lected document in its raw form. All formatting informa-
tion, other than capitalization and spacing, is discarded in
the ingestion process. Figure 5 shows this view.
If the Highlight All check box is selected, the Document
Viewer highlights all the mentions found in the document. A
color code is used to distinguish between people, locations,
and organizations. If this check box is not selected only
those mentions that match the search query are highlighted.
5.3 Search View
Figure 6 shows the Search View. As the name implies
the Search view allows users to search for particular terms
or entities in the data set. However, that is not its sole
utility. This view also lists all the people, locations, and
organizations automatically extracted during the ingestion
process. The number that appears next to the entity type is
the number of entities of that type present in the working set.
Each entity is shown along with its mention and document
count. The mention count is the number of times an entity
is referred to in the working set whereas the document count
is the number of documents in which an entity is mentioned.
Both counts are shown in this view only as it pertains to the
current working set, i.e., for all the documents that match
12
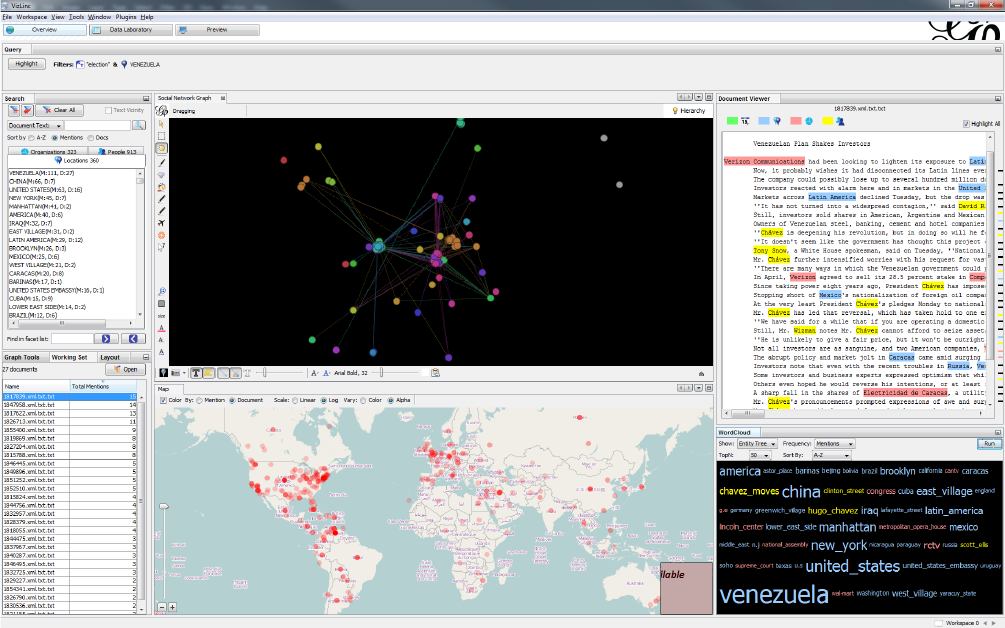
Figure 3: VizLinc: user interface
13
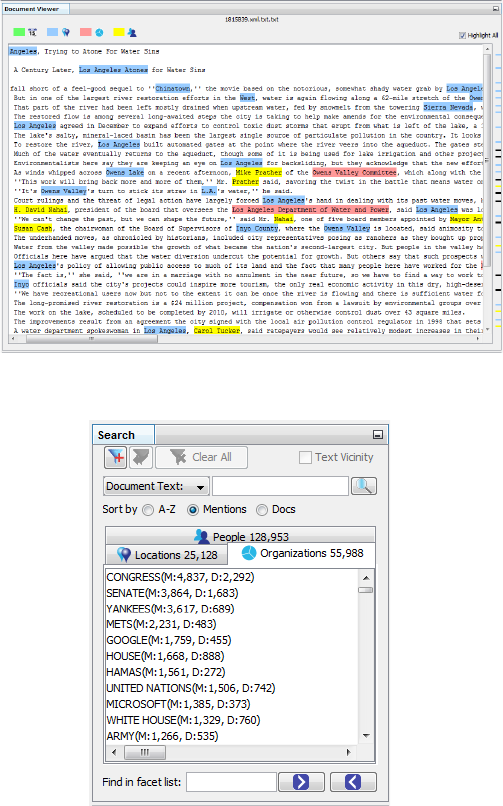
Figure 5: Document Viewer
Figure 6: Search view. Here we show the most men-
tioned organizations in the New York Times dataset
as extracted by VizLinc’s Ingestion Tool.
the current query. If there is no query the counts correspond
to the whole data set. All lists can be sorted alphabetically,
by decreasing mention count, or decreasing document count.
The search-related features of this view will be covered in
section 6. Figure 6 shows the list of organizations extracted
from the New York Times data set (see section 7.1) sorted
by mention count.
5.4 Map
The Map view places the locations present in the working
set on a geographic map. A small circular waypoint is drawn
for each location. Users can navigate the map by zooming
and panning. The color or alpha value of each circle can rep-
resent either the mention or the document frequency of the
corresponding location. Adjusting the alpha value of way-
points based on frequency is particularly useful when there
are a large number of locations in the working set. The most
frequent locations become clearly visible whereas locations
with few mentions/documents fade into the background.
5.5 Graph
The Graph view shows the co-occurrence network of all
the people mentioned in the working set. Nodes in the graph
represent p erson entities and edges represent document co-
occurrence between the linked entities. This is a direct vi-
sualization of the graph generated during data ingestion.
VizLinc contains all of Gephi’s visualization, analysis, and
exploration capabilities In addition, we have made some use-
ful graph analytics accessible through the Graph Tools view.
The following sections describe those analytics.
Node Centrality
The centrality of a node measures its relative importance
within a graph. In the context of VizLinc, centrality can
be an indicator of how important a p erson is in the social
structures described in the working set. We have included
two centrality metrics: Eigenvector Centrality and PageR-
ank[6]. Both metrics are based on the concept that connec-
tions to high-scoring nodes contribute more to the score of
the node in question than equal connections to low-scoring
nodes. Users can choose to represent the nodes’ centrality
score through modifying their size and/or color.
Clustering
The clustering feature groups related nodes in a graph and
colors them accordingly. Clustering is based on the In-
foMap algorithm which attempts to find community struc-
ture based on the flow of information in the graph.[8]
N-Hop Network
Highlighting a node in the graph and clicking on the 1-Hop
Network button displays a network consisting of the selected
node, all of its neighbors, and all the edges that exist be-
tween them. Note that this graph would not necessarily
contain all the people in the working document set as nor-
mally as the “seed”node does not need to be one of the terms
in the search query. Similarly, clicking on the 2-Hop Net-
work button would generate and display a graph containing
all the neighbors of the nodes in the 1-hope network and the
edges b etween all of them.
5.6 Word Cloud
The Word Cloud provides an aggregated view of the most
frequent entities. The canonical names of the N most fre-
quent entities are laid out in a grid and their font size is
adjusted so that it is proportional to their mention or doc-
ument count.
6. SEARCH
So far, we have discussed how VizLinc can be used to in-
gest documents containing text, summarize the entities men-
tioned in those documents, and visualize their co-occurrence
patterns and geographical placement. In this section we will
talk about how VizLinc can direct users to relevant sections
of a document through searching.
A search query acts as a document filter and can contain
one or more terms. Documents that match all the terms in
the query are kept in the working set whereas those that
don’t are eliminated. As a result, all views are updated
to display only those entities present in the new working
set. Narrowing down the working set and updating all views
14
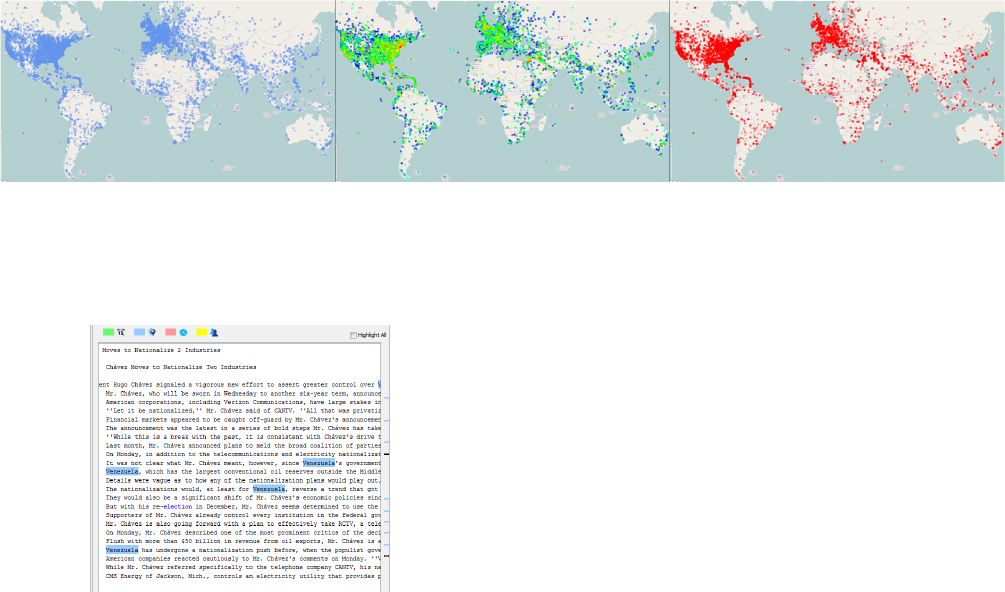
Figure 7: Map showing three different parameter settings: a waypoint per location (left); color scale rep-
resenting the location’s mention count, where blue correspond to the lowest value and red to the highest
(center); and alpha value representing mention count, where the highest frequency locations are rendered
solid and the lowest frequency locations are not drawn.
Figure 8: Document content showing the matches
to the query String:elections & Location:Venezuela
accordingly constitutes the basis of discovering patterns and
relevant information in VizLinc.
Not only can users target a sub-set of all documents but
they can also quickly navigate to the sections within those
documents where the target entities are mentioned. This
is done by opening one of the documents in the working
set. The Document Viewer then shows the content of that
document and highlights all the instances of the query terms
using different colors for each term type. In addition, color-
coded markers for each line containing a match are shown
along the right side of the Document Viewer for quick access
to the relevant document sections (see figure 8).
In the following sections, we discuss the two search fea-
tures VizLinc offers.
6.1 String Search
String search refers to the process of finding all the doc-
uments that contain a specific string. Lucene is used both
for indexing the text during ingestion and to search the doc-
uments through VizLinc. Matching documents become the
working set and all views are updated to reflect the entities
mentioned in them. The nature of this type of search implies
that its results could mixed documents referring to different
entities. For instance a search for the string “washington”
will return documents mentioning Washington D.C. (loca-
tion), George Washington (person), and Washington State
University (organization).
6.2 Entity Search
An entity-based search query contains one or more named
entities (i.e., locations, persons, and organizations) and re-
turns all the documents that mention those entities. This
type of search differs from string search in that a query entity
could resolve to several different strings if they are all dif-
ferent ways to mention the same entity. This is the result of
within/across document co-referencing during ingestion. For
instance, a search for Person:John M. Smith might resolve
to mentions ”John Smith”, ”John”, or ”Mr. Smith”. This
feature might represent a significant advantage over string
searching if users have a particular entity in mind. For in-
stance, if we are interested in those documents that mention
the state of Washington, a search for Location:Washington
will exclude documents that mention President Washington
and not the location.
There are many ways to execute an entity search in Vi-
zLinc. In the Search view, users can select an entity from the
list and click the Add Filter button on the view’s toolbar.
Alternatively, users can drag the entity name from the list
and drop it in the Query view. Entities can also be added
to a query from the graph, map or word cloud by right-
clicking on their representation (node, waypoint, or label,
respectively) and selecting Add to Query from the context
menu.
7. CASE STUDY
In this section, we present a few hypothetical use cases
based on the results obtained by processing and analyzing
real data with VizLinc. These use cases and results should
give readers some insight about the type of patterns and in-
formation VizLinc can reveal. All hypotheses drawn from
our visualization and stated in this section were later con-
firmed by examining the content of the appropriate docu-
ments.
7.1 New York Times Articles (2007)
The New York Times Annotated Corpus [9] contains over
1.8 million articles written and published by the New York
Times between January 1, 1987 and June 19, 2007 with
article metadata. The data set we processed is a subset
composed of all articles written in the year 2007. This subset
is composed of 39,953 documents containing thousands of
entities.
Figure 9 shows the map, graph, and word cloud for the
whole New York Times 2007 data set. The map shows that
most location mentions are concentrated in the U.S.A. and
Western Europe. It is hard to make sense of the graph when
it contains so many nodes. Upon closer examination thanks
15
to VizLinc’s graph navigation and clustering features, we can
see that clusters b elong to different categories. Politicians,
artists and sports personalities all have their own clusters.
The word cloud shows the 50 most salient terms in the data
set. Not surprisingly, locations New York, United States,
New York City, Iraq, Manhattan and Washington are heav-
ily mentioned. Organizations like Congress, Senate, Yankees
(New York Yankees), and Google also form part of the list
of most mentioned entities.
We will rely on a hypothetical use case and potential ac-
tion path to illustrate VizLinc search capabilities on the New
York Times data set. Let us say that we are interested in
elections around the world. A first approach would be to
do a search for the string “elections”. The working set de-
creases from nearly 40,000 to 834 documents that contain
that string. The list of documents can now b e sorted by the
total number of mentions and we could browse the contents
of the top hits. Instead, we will take a look at the map and
location list to see what locations co-occur the most with the
term “elections”. The reader should keep in mind that, after
executing a query, all views are updated to show different
visualizations of the content of the matching do cument set
only i.e., the new working set. The entity list in the Search
view shows that “Iraq”, “United States”, and “Israel” are the
most mentioned locations in conjunction with “elections”.
Examining the map shows activity in many other parts of
the world including the major countries in South America.
Let us say that Venezuela piques our interest, so we add
Location:Venezuela to the query from the map view.
The working set now contains 12 documents that could be
browsed within minutes if so desired. The resulting graph
shows the people mentioned in these documents and it is
much more suitable for visual analysis than the original one.
To get a sense of the importance of each individual in
the working set as described by the co-occurrence relation
defined in previous sections, we re-size the nodes in the graph
according to their centrality score. Also, we can cluster this
new sub-graph to reveal any community structures present.
Figure 10 shows part of the resulting graph.
The graph suggests that one of the most central people is
Hugo Chavez. Hugo Chavez was the president of Venezuela
in 2007 and had been re-elected the previous year. This
is not new information but it demonstrates VizLinc’s abil-
ity to find central people with respect to some user-defined
context. Clustering resulted in three major communities;
a subset is shown in Figure 10. Upon examination, it can
be noticed that the three clusters illustrated group three
different types of actors: USA political and media figures
(top-left), South American political figures (top-right) and
artists (bottom-left). From this point on, if we were inter-
ested in the sentiment and opinions of U.S. politicians to-
wards the government of Venezuela we could add members
of that community to the query. If what is relevant to us is
stories about South American leaders and the government of
Venezuela we would add members of the second community
to my query and examine the resulting documents. Authors
and entertainers appear in the graph due to spurious co-
occurrences in articles that contain lists spanning a variety
of unrelated topics.
8. CONCLUSIONS AND FUTURE WORK
In this paper, we have introduced VizLinc and described
how it combines information extraction, graph analysis, and
geo-location for visualization and exploration of text cor-
pora. We have also presented a case study, centered on a
compilation of articles from the New York Times, to demon-
strate VizLinc’s features.
Now that we have achieved our principal goal of creating
a complete framework for data ingestion, visualization, and
exploration, our future work will focus on making each com-
ponent more generic and robust. Modules such as the ones
that generate the graph and perform coreference resolution,
yielded reasonable results on the data for which VizLinc was
initially intended. However, these mo dules turned out to be
rather simplistic for most of the text genres we have tested
so far. Multiple-term searches could also be improved by
restricting the distance at which both terms can appear in
a document. This will avoid documents in which terms co-
occur but are in fact unrelated. Expanding queries to sup-
port “and” and “or” operations is also a subject for future
work. With a platform in place, we can now take a task cen-
tric approach and assess whether the techniques and user in-
teractions VizLinc enables are appropriate to the successful
completion of a particular task. Finally, we understand that
user-defined algorithms and entity types will be required to
analyze certain data sets efficiently. Therefore we would like
to include a mechanism that would allow users to add these
custom components with ease.
9. REFERENCES
[1] M. Bastian, S. Heymann, M. Jacomy, et al. Gephi: an
open source software for exploring and manipulating
networks. ICWSM, 8:361–362, 2009.
[2] T. Boudreau, J. Tulach, and R. Unger. Decoupled
design: building applications on the netbeans
platform. In Companion to the 21st ACM SIGPLAN
symposium on Object-oriented programming systems,
languages, and applications, pages 631–631. ACM,
2006.
[3] J. R. Finkel, T. Grenager, and C. Manning.
Incorporating non-local information into information
extraction systems by gibbs sampling. In Proceedings
of the 43rd Annual Meeting on Association for
Computational Linguistics, pages 363–370. Association
for Computational Linguistics, 2005.
[4] J. R. Harger and P. J. Crossno. Comparison of
open-source visual analytics toolkits. In IS&T/SPIE
Electronic Imaging, pages 82940E–82940E.
International Society for Optics and Photonics, 2012.
[5] A.
¨
Ozg
¨
ur, B. Cetin, and H. Bingol. Co-occurrence
network of reuters news. International Journal of
Modern Physics C, 19(05):689–702, 2008.
[6] L. Page, S. Brin, R. Motwani, and T. Winograd. The
pagerank citation ranking: Bringing order to the web.
1999.
[7] M. A. Rodriguez and P. Neubauer. The graph
traversal pattern. arXiv preprint arXiv:1004.1001,
2010.
[8] M. Rosvall and C. T. Bergstrom. Maps of random
walks on complex networks reveal community
structure. In Proceedings of the National Academy of
Sciences, page 1118, 2001.
[9] E. Sandhaus. The new york times annotated corpus
ldc2008t19. Linguistic Data Consortium, 2008.
[10] B. Wright, J. Payne, M. Steckman, and S. Stevson.
16
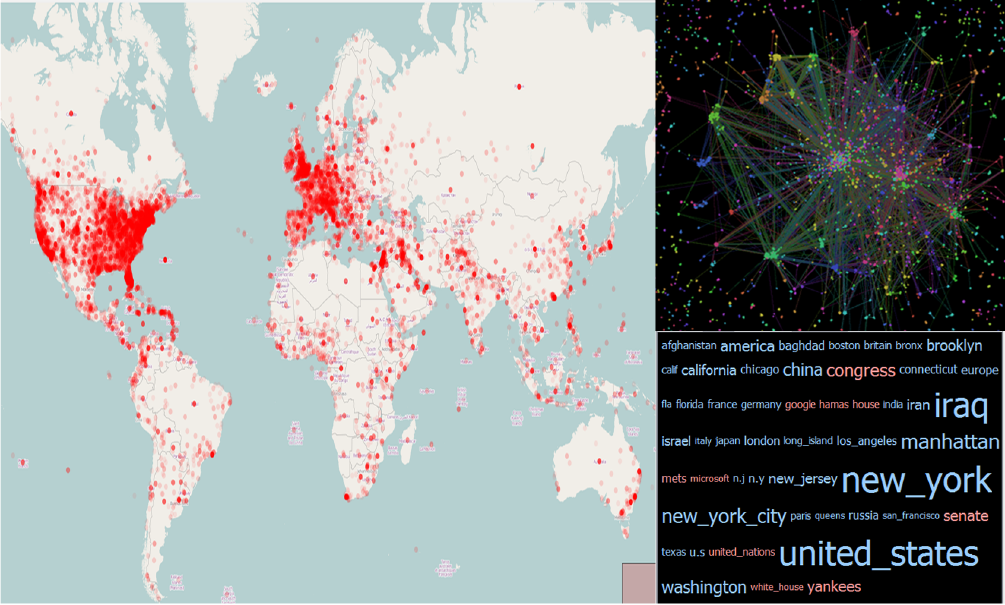
Figure 9: Map, co-occurrence graph, and word cloud for the New York Times 2007 data set.
Palantir: A visualization platform for real-world
analysis. In Visual Analytics Science and Technology,
2009. VAST 2009. IEEE Symposium on. IEEE, 2009.
[11] L. Zhang, A. Stoffel, M. Behrisch, S. Mittelstadt,
T. Schreck, R. Pompl, S. Weber, H. Last, and
D. Keim. Visual analytics for the big data eraˆa
˘
A
ˇ
Ta
comparative review of state-of-the-art commercial
systems. In Visual Analytics Science and Technology
(VAST), 2012 IEEE Conference on, pages 173–182.
IEEE, 2012.
17

Figure 10: Section of the graph after executing the query String:elections & Location:Venezuela The nodes
have been re-sized according to their centrality scores and clustering has been run on this sub-graph. Clusters
shown group three types of people: USA political figures (top-left), South American political figures (top-
right) and artists (bottom-left)
18
