Phase 2 Project Report
Attitudes and Trust in Leveraging Integrated Sociotechnical
Systems for Enhancing Community Adaptive Capacity:
Phase II
Prepared for Teaching Old Models New Tricks (TOMNET) Transportation Center
By,
Katherine Idziorek
Email: [email protected]
Cynthia Chen
Email: qzchen@uw.edu
Daniel B. Abramson
Email: abramson@uw.edu
Department of Civil & Environmental Engineering
Department of Urban Design & Planning
University of Washington
Seattle, WA 98105
September 2019

TECHNICAL REPORT DOCUMENTATION PAGE
1. Report No.
N/A
2. Government Accession No.
N/A
3. Recipient's Catalog No.
N/A
4. Title and Subtitle
Attitudes and Trust in Leveraging Integrated Sociotechnical Systems for
Enhancing Community Adaptive Capacity: Phase II
5. Report Date
September 2019
6. Performing Organization Code
N/A
7. Author(s)
Katherine Idziorek, https://orcid.org/0000-0002-8130-0536
Cynthia Chen, https://orcid.org/0000-0002-1110-8610
Daniel B. Abramson, https://orcid.org/0000-0002-5070-8619
8. Performing Organization Report No.
N/A
9. Performing Organization Name and Address
University of Washington
PO Box 352700
Seattle, WA 98195
10. Work Unit No. (TRAIS)
N/A
11. Contract or Grant No.
69A3551747116
12. Sponsoring Agency Name and Address
U.S. Department of Transportation,
University Transportation Centers Program,
1200 New Jersey Ave, SE, Washington, DC 20590
13. Type of Report and Period Covered
Research Report
(2018 – 2019)
14. Sponsoring Agency Code
USDOT OST-R
15. Supplementary Notes
N/A
16. Abstract
The project described in this report explores relationships between social attitudes and community-scale disaster
preparedness. Specifically, we are interested in respondents’ knowledge of local resources and their willingness to share
their own resources with others. We report on data gathered from a pilot sample survey focused on community resilience
in an earthquake scenario that was implemented in a Seattle, WA neighborhood. We find that respondents’ willingness to
share resources also depends upon the nature of their social ties to those in need. We look specifically at access to health
care services via different modes of transportation to better understand how people’s means of seeking health care might
change in a disaster scenario. Findings relevant to transportation planning include general uncertainty among respondents
about what transportation options might be available in the event of a disaster such as an earthquake, and few respondents
were prepared with alternative transportation options. This information could be used by municipalities and transit
agencies to help inform community outreach and education efforts relevant to disaster planning. We seek to implement
the survey more broadly across the Pacific Northwest in order to help inform resource matching for disaster preparedness
at a range of scales.
17. Key Words
Community Resilience, Sample Survey, Disaster Preparedness, Resource
Sharing, Social Networks
18. Distribution Statement
No restrictions.
19. Security Classif.(of this report)
Unclassified
20. Security Classif.(of this page)
Unclassified
21. No. of Pages
49
22. Price
N/A
Form DOT F 1700.7 (8-72)
Reproduction of completed page authorized
DISCLAIMER
The contents of this report reflect the views of the authors, who are responsible for the facts and
the accuracy of the information presented herein. This document is disseminated in the interest of
information exchange. The report is funded, partially or entirely, by a grant from the U.S.
Department of Transportation’s University Transportation Centers Program. However, the U.S.
Government assumes no liability for the contents or use thereof.
ACKNOWLEDGMENTS
This study was funded by a grant from A USDOT Tier 1 University Transportation Center,
supported by USDOT through the University Transportation Centers program. The authors would
like to thank the Center for Teaching Old Models New Tricks (TOMNET) and USDOT for their
support of university-based research in transportation, and especially for the funding provided in
support of this project. TOMNET is focused on advancing the state of the art and the state of the
practice in measuring and understanding traveler attitudes, values, perceptions, and preferences,
and using such data to improve the ability of travel demand forecasting models to predict activity-
travel behavior, mobility choices, and time use patterns under a wide variety of future scenarios.
This project is also supported by volunteers from Laurelhurst Earthquake Action Preparedness
(LEAP), who helped to guide the survey development by providing a community organization
perspective. LEAP members John Temple, Amy Fouke, Clair Hector, Louise Luthy and Nancy
Woods provided review feedback that was invaluable to the project.
The team would also like to acknowledge and thank the following additional reviewers: Patricia
Mokhtarian, Georgia Tech Civil and Environmental Engineering; Vicki Sakata, Northwest
Healthcare Response Network ; Carina Elsenboss, Seattle & King County Public Health; John
Scott, University of Washington Telehealth; Maximilian Dixon, Washington State Military
Department Emergency Management Division; Matt Auflick, City of Seattle Office of Emergency
Management; Stephen Burges, University of Washington Department of Civil and Environmental
Engineering; Xiangyang Guan, University of Washington Department of Civil and Environmental
Engineering.
The community workshop activities detailed in this report were facilitated by the authors as well
as by UW doctoral student Lan T. Nguyen and students in Prof. Abramson’s Fall 2018 community
resilience urban planning studio: Helen Stanton, Pegah Jalali, Lauren Kerber, Catharina Depari,
Sreya Sreenivasan and Charlotte Dohrn.
4
TABLE OF CONTENTS
DISCLAIMER ................................................................................................................................ 3
ACKNOWLEDGMENTS .............................................................................................................. 3
EXECUTIVE SUMMARY ............................................................................................................ 7
INTRODUCTION .......................................................................................................................... 8
CHAPTER 1: LITERATURE REVIEW ........................................................................................ 9
CHAPTER 2: PILOT STUDY SITE AND REGIONAL CONTEXT ......................................... 12
CHAPTER 3: METHODS ............................................................................................................ 13
3.1 Community Workshop .................................................................................................... 13
3.2 Pilot Sample Survey ........................................................................................................ 14
CHAPTER 4: PILOT SURVEY FINDINGS ........................................................................... 16
4.1 Transportation Preparedness and Level of Concern ................................................... 16
4.2 Willingness to share.................................................................................................... 17
4.3 Transportation, disaster, and health care services ........................................................... 18
CHAPTER 5: DISCUSSION AND CONCLUSIONS ................................................................. 21
REFERENCES ............................................................................................................................. 23
APPENDIX 1: COMMUNITY WORKSHOPS THROUGH APPRECIATIVE INQUIRY
METHOD ..................................................................................................................................... 28
Introduction and Purpose .......................................................................................................... 28
Partners and Background .......................................................................................................... 29
Workshop Methodology ........................................................................................................... 29
Workshop Activities ................................................................................................................. 30
Activity 1: Asset Mapping .................................................................................................... 30
Asset mapping discussion themes ............................................................................................................ 32
Activity 2: Zone Mapping ..................................................................................................... 33
Activity 3: Disaster Preparedness Resource Matching game ............................................... 35
Workshop summary ................................................................................................................................. 37
APPENDIX 2: PILOT SURVEY QUESTIONNAIRE ................................................................ 39
5
LIST OF TABLES
Table 1. Where respondents would turn for transportation resources in the case of an emergency ........... 17
LIST OF FIGURES
Figure 1. Relative levels of concern about carrying out everyday activities in a disaster scenario ............ 16
Figure 2. Respondent preparedness for carrying out everyday activities in a disaster scenario ................ 17
Figure 3. Willingness to share resources in the case of disaster according to strength of social ties ......... 18
Figure 4. Distribution of distance traveled to primary health care providers ............................................. 19
Figure 5. Distribution of distance traveled to pharmacy ............................................................................. 19
Figure 6. Distribution of number of transportation modes used to access health care services .................. 20
6
7
EXECUTIVE SUMMARY
The project described in this report explores relationships between social attitudes and community-
scale disaster preparedness. Specifically, we are interested in respondents’ knowledge of local
resources and their willingness to share their own resources with others. We report on data gathered
from a pilot sample survey focused on community resilience in an earthquake scenario that was
implemented in a Seattle, WA neighborhood. We find that respondents’ willingness to share
resources also depends upon the nature of their social ties to those in need. We look specifically at
access to health care services via different modes of transportation to better understand how
people’s means of seeking health care might change in a disaster scenario. Findings relevant to
transportation planning include general uncertainty among respondents about what transportation
options might be available in the event of a disaster such as an earthquake, and few respondents
were prepared with alternative transportation options. This information could be used by
municipalities and transit agencies to help inform community outreach and education efforts
relevant to disaster planning. We seek to implement the survey more broadly across the Pacific
Northwest in order to help inform resource matching for disaster preparedness at a range of scales.
8
INTRODUCTION
Although much has been written about the likelihood of the survival or failure of physical
transportation infrastructure in disaster situations (for example, see Faturechi & Miller-Hooks,
2014; Soltani-Sobh et al., 2016; or Chang et al., 2012), little research has focused on the
community social and contextual factors that might shape the ways in which transportation systems
transform in both configuration and function as the result of a disaster. In this paper we explore,
through a pilot survey project, the integration of social factors such as attitudes, trust and
willingness to share into a community-level assessment of disaster preparedness with a specific
focus on transportation access to health care services. This research examines transportation-
related issues as they pertain to community-scale disaster preparedness. Given multiple
uncertainties about what kinds of transportation will be useful in a disaster scenario, it is helpful
for community members and disaster preparedness planners to better understand what kinds of
transportation resources are communities equipped with, how might they serve residents in gaining
access to vital resources such as health care services in the case of a large-scale disaster.
The first section of the paper explains the motivation behind such a research agenda,
including a brief discussion of infrastructural interdependency and the place-based nature of
disaster. Because the effects of disaster, especially earthquakes, are inherently geographical (Henry,
2018), we posit that research is needed at the scale of the community in order to better understand
how different places may or may not be equipped to deal with disaster. The second section
specifically discusses the effects of disaster events on trasnportation networks and the varying
roles that transportation infrastructure services play in a disaster scenario. The following section
describes our study site, an urban neighborhood in earthquake-prone Seattle, WA, where we have
partnered with a local organization focused on disaster preparedness to help shape the research
from a community perspective. We then discuss the findings from our pilot survey, followed by
discussion and next steps for advancing a community-scale research agenda.
This work makes two distinct contributions: 1) it introduces a novel, mixed methods
approach to understanding disaster preparedness that integrates community social factors and
attitudes, such as social trust and willingness to share; and 2) it constitutes a first step in the
development of a flexible but rigorous community-scale research methodology that can be adapted
for use in different community contexts. In addition, this work identifies potential gaps that might
be addressed through community education, organization, and outreach to improve disaster
preparedness.
9
CHAPTER 1: LITERATURE REVIEW
The increasing incidence of disaster
In the U.S., disasters are actually quite common, and their impact is increasing (Elliott & Howell,
2017). According to FEMA, the U.S. declared more than 1,000 disasters between 2007 and 2017.
In the fall of 2017 alone, more than 25.8 million Americans are estimated to have been impacted
by Hurricanes Harvey, Irma and Maria (FEMA Ready.gov, 2018). The growing number of people
affected by disasters has led to an increased need for individual and family self-reliance during
and following a disaster. The public health consequences of disasters persist long after the event
itself, revealing weaknesses in infrastructure and medical services that often produce many more
casualties than the direct impacts of the event, and creating long-term challenges for communities,
health providers and transportation planners.
The social characteristics of disaster have been widely documented (Quarantelli & Dynes,
1977; Heinberg, 2017; Henry, 2018; Elliott & Howell, 2017; Adger et al., 2005). When physical
infrastructure fails, social relationships serve as a substitute or “backup” to help people survive
and cope with the consequences of the disruption (Freitag et al., 2014; Ritchie, 2017; Klinenberg,
2018). For example, if transportation services were disrupted, people in a community might share
what resources are available locally or provide people with social support that they would
otherwise need transportation (and/or communication) services to access.
Although we recognize that preparing for a disaster involves a great deal of uncertainty, it
is clear that both social connectedness and access to a variety of local resources can help
communities to cope with the consequences of disaster events. In this paper, we explore, via a pilot
survey, the relationship between disaster preparedness and community social networks with a
specific focus on transportation connections to health care services. We also explore how social
attitudes like trust and willingness to share might affect access to different kinds of resources
within a community in a disaster scenario.
The place-based nature of disaster
Disasters are inherently geographical (Henry, 2018). The growing number of people affected by
disasters has led to an increased need for individual and family self-reliance during and following
a disaster. In Washington State, the Emergency Management Division encourages individuals and
families to be prepared to spend up to two weeks without outside assistance after a disaster
(Washington State Emergency Management Division, 2017). Likewise, communities are often cut
off from outside resources and must rely upon internal resources – the collective strengths, skills,
knowledge and material goods - to survive and recover. Most immediate emergency assistance
after a disaster is provided by people within their own communities long before outside help is
available (Henry, 2018). Place-specific factors, such as land use patterns, segregation, violence,
microclimate, poverty, and age of population, can affect the ability of communities to deal with
circumstances caused by disaster (Klinenberg, 2015). Length of residence and knowledge of place
play key roles in how people adapt to disturbances (Connon, 2017), and community organizations
and institutions play an important role in facilitating adaptive actions (Klinenberg, 2015; Henry,
2018).
The interdependency of transportation infrastructure
Disasters affect people and the physical infrastructures upon which they rely due to the
interconnected nature of social and technological systems (Townsend, 2013; Graham & Marvin,
2002); in fact, physical and institutional infrastructures often remain “invisible” until their failures
10
produce social consequences (Graham & Marvin, 2002; Klinenberg, 2015). Deteriorating
infrastructure systems and lack of maintenance have left communities in the U.S. more susceptible
to risk and hazards (Little, 2004a; Flynn & Burke, 2011). Furthermore, the increasing complexity
and interconnectedness of infrastructure systems increases risk of failure (Little, 2004b; Flynn &
Burke, 2011).
In disasters, many of the impacts experienced by communities comprise direct impacts of
failed infrastructural systems (e.g., disruptions in electricity, cellular communications, or
transportation) and indirect impacts, such as the disruption of social and institutional support
systems. Many people are not well-served by these systems in normal, “blue skies” circumstances,
and existing social inequities are highlighted and exacerbated during times of disaster, leading to
inequitable outcomes for the most socially vulnerable (Klinenberg, 2015). This is not to downplay
the extraordinary ways in which communities can come together during a disaster, as described in
Rebecca Solnit’s book, A Paradise Built in Hell (2010); rather, it is to recognize that physical and
technological infrastructure play an important, but often invisible, role in the structure of social
support systems that reinforce everyday community life.
The effects of a disaster can be understood as departures from the “normal” social patterns
of daily life manifested at multiple scales (Chen et al., 2013). At the scale of the community,
emergency response activities become urgent and paramount; at the household level, a new set of
needs, perhaps ensuring the safety of loved ones and procuring basic necessities, replace the set of
“everyday” needs that were previously important (Ibid). Thus, access to transportation services
and the range of people’s daily needs will both change significantly in the case of a disaster, leading
to a new set of conditions under which a community must function by leveraging and matching
locally available resources.
Many people use transportation services on a daily basis to help them accomplish a range
of necessary activities. Transportation services enable people to travel to get to work, to get to
school, to run errands or do shopping, to access services such as day care or health care, and to
participate in recreational or leisure activities. Many transportation activities are organized or
facilitated by information and communications technologies (ICTs), which also enable the
communication necessary to complete a range of tasks, from the transportation-related items noted
above to carrying out work-related tasks to accessing social support.
Although there are many options for combining or substituting transportation and
communications technologies (Salomon, 1986; Mokhtarian, 1990; Lyons, 2009), both often rely
on infrastructure that is susceptible to systemwide failure in the event of a disruption, such as
cellular or transportation networks. In addition, access to many of the transportation services that
facilitate daily activities relies upon the provision of private services and participation in digital
society. In a relatively contained emergency situation that limits transportation options but not
communication services (such as a transit strike, flood, or large planned events) the substitution of
travel by ICT becomes much more attractive, and ICT can accommodate many work, commerce
and social functions if needed (Mokhtarian, 2009). However, the range of scenarios for
transportation and communication technology use and substitution would likely change
significantly in the case of a larger disruption. In the next section, we discuss specifically the
effects of disasters on transportation systems.
Transportation networks and disasters
A functional and resilient transportation infrastructure is necessary for supporting the everyday
needs of society. Disruptions such as disasters, which are uncertain and often unpredictable, can
11
have severely negative impacts on the transportation infrastructure that supports basic societal
functions (Soltani-Sobh et al., 2016). Transportation systems are vulnerable to many kinds of
hazards, including natural events, technological disruptions, and intentional malicious actions
(Faturechi & Miller-Hooks, 2014).
Extreme events like earthquakes are nearly impossible to predict, and their impacts tend to
be underestimated (Kermanshah & Derrible, 2016). Each disaster brings with it unique
consequences, shaped by the magnitude and character of the disaster itself as well as the
geographical, infrastructural and social context in which it occurs. Disasters can involve an array
of different kinds of disruptions; for example, an earthquake might also cause fires, facilitate the
spread of disease, or result in exposure to toxic chemicals (Litman, 2006). Transportation network
damage from earthquakes results from a combination of factors, including ground failure (e.g.,
landslides or ground cracks), faulting (e.g., movement in the horizontal and/or vertical plane of the
roadbed), vibration, and, in coastal areas, tsunami (Kermanshah & Derrible, 2016).
In any large-scale disaster, transportation systems are very likely to be affected, limiting
the availability of service. The impacts that disasters have on transportation systems have
intensified because transportation systems are increasingly complex and interdependent (Faturechi
& Miller-Hooks, 2014). Damaged transportation networks lead to traffic congestion, transit delays,
fuel supply problems, and disruptions to logistics operations (Litman, 2006; Ishfaq, 2012). The
failure of mobile phone and electricity networks can in turn cause the failure of complementary
ICT mobility services as well as more basic transportation infrastructure like stoplights (deJong,
2017). Disrupted transportation systems also result in damage to economic and social systems
(Faturechi & Miller-Hooks, 2014).
The role of transportation in disasters
Transportation systems enable access to critical resources for daily activities as well as in
emergency scenarios, where they can support evacuation, rescue operations, reconstruction, and
recovery. (Faturechi & Miller-Hooks, 2014). Transportation networks and services play different
roles in different types of disasters, including evacuation; delivery of emergency supplies and
services; search and rescue operations; quarantine; and transportation infrastructure repair (Litman,
2006). The success of disaster recovery efforts is often influenced by the relative ease with which
resources can be transported into and out of a community (Soltani-Sobh et al., 2016).
Transportation infrastructure might be appropriated for uses other than their intended
purpose in the case of a disaster. For example, after the 2017 Mexico City earthquake, when
separated bus rapid transit lanes served as emergency transportation corridors because they were
not congested with traffic. In the days following the earthquake, walking, biking and motorcycles
become the primary means of transportation, providing a mobility option for navigating obstructed
streets, enabling the trasnportation of medicines and supplies, and enabling responders to scout
heavily damaged areas (deJong, 2017).
12
CHAPTER 2: PILOT STUDY SITE AND REGIONAL CONTEXT
The setting for this pilot study is an urban neighborhood in the Pacific Northwest, a region recently
attuned to the potential impact and uncertainty of natural hazard events. Although Seattle is
susceptible to several different types of hazards, we focus here on the likely impact of earthquakes,
which in the region might range from more frequent and smaller disturbances to a potential
magnitude 9.0 earthquake as detailed in the highly visible New Yorker article, “The Really Big
One: Earthquake Preparedness in The Pacific Northwest” (Schulz, 2015). A massive Cascadia
Subduction Zone earthquake such as the one described by Schulz and anticipated by the disaster
science community would have a devastating impact on communities throughout the region, both
urban and rural.
The pilot community of Laurelhurst is a relatively wealthy and well-connected urban
neighborhood in Seattle of approximately 4,000 residents. In response to increasing concern about
the potential effects of a Cascadia Subduction Zone earthquake, a group of Laurelhurst residents
have self-organized to form a disaster preparedness organization, Laurelhurst Emergency Action
Plan (LEAP). The highly educated and mobile residents of Laurelhurst have access to a range of
health care services across the city, including world-class specialist care. Located near the
University of Washington’s Seattle campus, the neighborhood is within close range of the
University of Washington Medical Center, a nationally renowned hospital. Located within the
neighborhood is the main campus of Seattle Children’s Hospital, one of the nation’s top children’s
hospitals, as well as a handful of smaller private businesses and clinics offering a range of health
care services.
LEAP, a community-initiated organization, regularly engages with existing City of Seattle
disaster planning personnel and hosts preparedness events in the neighborhood providing
instruction on a range of topics from how to put together an emergency preparedness kit to how to
stop a bleeding victim from hemorrhaging. LEAP is attempting to organize the entire Laurelhurst
neighborhood into approximately 20-household clusters, each with a cluster captain that can help
to facilitate their group’s preparation for disaster by building stronger social connections within
the cluster. To date, LEAP has not coordinated its efforts with the local health care and wellness
community.
While Laurelhurst is not representative of Seattle neighborhoods, it provides an interesting
test case for comparative purposes. The objective of future research along this line is to engage
additional communities along spectra of both urban-ness and economic status. In addition, the goal
of this research endeavor is not to seek out one-size-fits-all solutions; rather, it is to understand the
ways in which community context and social factors uniquely shape disaster preparedness and
capacity for response. For example, comparing the types resources available between communities
of different economic status could be informative for disaster preparedness planning.
13
CHAPTER 3: METHODS
The research methodology comprised two main components: a public workshop with community
members, and a pilot sample survey. The research team first connected with LEAP members in the
fall of 2016, at which time the two groups discussed their mutual interest in community-scale
disaster preparedness. Discussions focused on better understanding how community assets can be
leveraged to enable resilience in the face of disruptions (such as earthquakes) or other long-term
changing conditions, in ways that also improve everyday community well-being. The research
team began to join LEAP meetings, which led to collaboration on the design of a community
workshop to learn more about assets and values within the Laurelhurst neighborhood.
3.1 Community Workshop
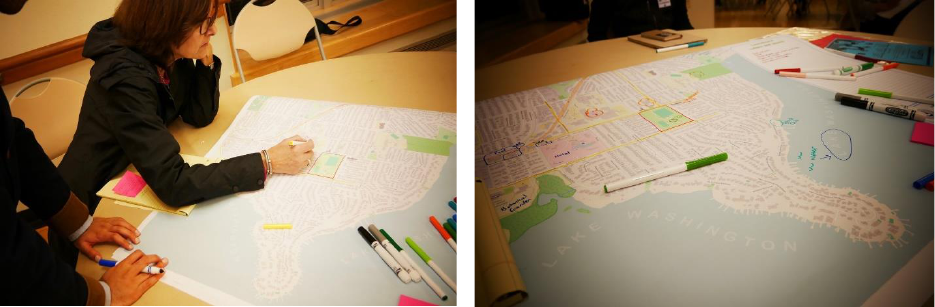
On November 7, 2018, LEAP and the UW research team co-hosted a public workshop at the
Laurelhurst Community Center, creating a forum for neighborhood stakeholders to discuss, via
participatory group activities, the qualities that contribute to a resilient community. The purpose
of the workshop was twofold: 1) to help LEAP recruit new members by spreading the word about
community emergency preparedness; and 2) to build a better understanding of the unique
community values and assets that might contribute to strengthening community resilience in
Laurelhurst. Fifteen community members (including five LEAP members) and the UW team
participated in the workshop.
Working together in small groups, participants were asked to map community assets in
response to the following questions:
• What values or assets make your community unique?
• What are Laurelhurst’s strengths as a neighborhood?
• What characteristics of the neighborhood contribute to everyday quality of life?
Participants were encouraged to think broadly about what might constitute a community
strength or asset. The Community Capitals Framework developed by Emery and Flora (2006) was
used as a prompt for participants to consider natural, cultural, human, social, political, financial
and built capital in the exercise. Transportation-related assets identified by participants included a
nearby light rail station, “lots of bikes,” the road network and access to water and boats via
neighborhood-adjacent Lake Washington. The presence of Children’s Hospital within the
neighborhood was identified as an asset. Social network assets include the fact that many
generations live within the neighborhood; a strong sense of community; people knowing their
neighbors; helpful and caring neighbors; respectful, “dogs on leashes” behavior within the
neighborhood, and low residential turnover resulting in stable neighbors. Transportation emerged
as a primary concern following a potential disaster. Participants voiced their uncertainty about
what transportation infrastructure and travel options would be viable following an earthquake;
some suggested that all-terrain vehicles or bicycles might be more easily used than cars if extensive
damage to roads were incurred.
Gathering this information in the workshop helped the research team to better understand
Laurelhurst’s unique neighborhood context, which in turn helped to shape the survey instrument.
For example, the different neighborhood “zones” outlined on a map contained within the survey
instrument were created using guidance from a workshop conversation about how LEAP might
organize its 20-household clusters into larger zones that could collaborate internally on disaster
preparedness efforts. We were also able to learn about which places or establishments within the
14
community are important to community members and might serve as resources in a time of need.
The information gathered during the workshop also helped with interpretation of survey responses,
particularly in providing context for answers to some of the open-ended questions. After the
workshop, the research team met with LEAP to review the survey instrument and received helpful
feedback that was integrated into the questionnaire for the pilot study.
3.2 Pilot Sample Survey
The pilot survey comprises a random sample of 200 Laurelhurst households. Residential properties
were sampled from within the boundaries of the Laurelhurst neighborhood as defined by the
Laurelhurst Community Club.
Potential respondents were first contacted in April of 2019 via a letter explaining the
importance of the project and directing them to an online survey website. Survey materials were
designed using guidance from Dillman’s Tailored Design Method (2007), and multiple contacts
were made with each potential respondent. Each recipient was given a unique identification
number for logging in to the survey website, and contact information was provided for those who
preferred to request a paper survey. A reminder was sent after two weeks, again highlighting the
online survey website. Finally, after another two weeks, those who had not yet completed the
online survey were mailed a paper copy of the survey booklet. A total of 44 people completed the
online survey, while 34 people completed the paper survey. Three incomplete responses were
discarded for a total of 75 complete and useable responses between the paper and online surveys,
a 37.5% response rate. Responses were collected through June of 2019.
As part of the pilot survey, the research team tested two different incentives: 1) a one-time,
two-dollar cash incentive included in the initial mailing; and 2) a five-dollar e-gift card, which
required respondents to provide their email address. Twenty-seven people who received the two-
dollar incentive completed the web survey, compared to sixteen people who received the five-
dollar incentive. Twelve people who received the two-dollar incentive completed the paper survey
compared to twenty people who received the five-dollar incentive. We found that although the
two-dollar incentive prompted a higher initial response, it was only offered to respondents once,
in the initial mailing, while it was possible to offer the five-dollar incentive with each mailed
communication. In addition, not all respondents who were offered the five-dollar incentive chose
to request it.
The survey instrument was reviewed by members of the City of Seattle’s Office of
Emergency Management, the Northwest Healthcare Response Network, Washington State’s
Emergency Management Division, and the University of Washington Medical Center, as well as
being reviewed by members of LEAP. Some questions from a previous City of Seattle survey on
disaster preparedness were adapted and used as part of the survey instrument.
The survey comprises 35 items, which were a mix of multiple selection and open-ended
questions and took respondents approximately 20 minutes to complete. The survey was divided
into four modules: disaster preparedness, access to health care, neighborhood connections, and
background information.
The disaster preparedness module asks respondents what preparedness items they have,
what daily activities they are most concerned about carrying out if utility services are lost, and
where they would go to get essential items in a disaster scenario, among other general disaster
preparedness questions. The second module asks respondents specifically about how they access
health care services via different modes of transportation and communication, how far they travel
to access health care services, and how their choice of health care provider might change from a
15
normal, “blue skies” day to an emergency (disaster) scenario.
The third module focuses on neighborhood context and social connections. Respondents
were asked to provide the number of core and distant connections within different areas of the
neighborhood (the neighborhood “zones” defined with help from LEAP). This module also
includes a place attachment scale (adapted from Fornara et al., 2010), a social trust scale adapted
from the General Social Survey, and a measure of the number of hours respondents spent engaged
in neighborhood activities each month.
The final module was designed to collect respondent background and demographic
information, including household size and makeup, ethnicity, age, education, income, and rent/own
status. This module also includes questions related to transportation behavior such as number of
commute days per week, commute distance, number of household cars and bikes, and the number
of people in the household with mobility limitations for different modes.
Together, the information gathered from the four survey modules helps to paint a picture
of the ways in which community members have prepared for a potential disaster, what unique
assets are located within the community that might serve as resources in the case of a disaster, a
profile of neighborhood social connectivity, and the ways in which everyday travel behavior relates
to health care access normally as well as during a potential disaster.
Sample Size Calculation
In this survey, key variables such as travel modes, household preparedness measures and
willingness to share are measured in terms of proportions of the survey population.
Within in the study area, there are 1,512 single-family homes and 63 apartments (1,575 households
within the two strata). Assuming 25% variance, specifying a 95% confidence level and accepting
a 5% margin of error for a proportion estimation, the base sample size would be 300 households:
n
0
= .25(1 - .75)/(.05/2)
2
= 300
Adjusting for the finite population correction, we reduce the sample size to 252 households:
n = n
0
/(1 + n
0
/N) n = 300/(1+300/1,575) = 252
Assuming a 20% response rate and a 10% undeliverable) rate, we increase our sample size to
252/.2/.9 = 1400 households. For the full survey, we will sample all 63 multifamily units and 1,337
units from the single-family household stratum to achieve the desired sample size of 1400
households.
For the pilot survey, a random sample of 200 single-family households was drawn without
replacement from the sampling frame using the sample() function in R.
16
CHAPTER 4: PILOT SURVEY FINDINGS
The mean age of respondents was 57, with 48% of respondents identifying as female and 45% as
male (7% preferred not to answer). The neighborhood is very well-off and educated; 65% of
households surveyed have an annual income of more than $150,000, and 63% of respondents had
completed a bachelor’s degree or higher. Just over half of the households speak English only (57%).
An overwhelming majority of respondents (93%) live in a stand-alone house, and 85% own their
homes. The mean tenure of respondents in their current home is 17.0 years, and 20.1 years living
in the Laurelhurst neighborhood. On average, respondents log 2.8 work travel days per week with
a mean commute distance of 5.0 miles. Households have two drivers on average, and just over two
vehicles (2.1).
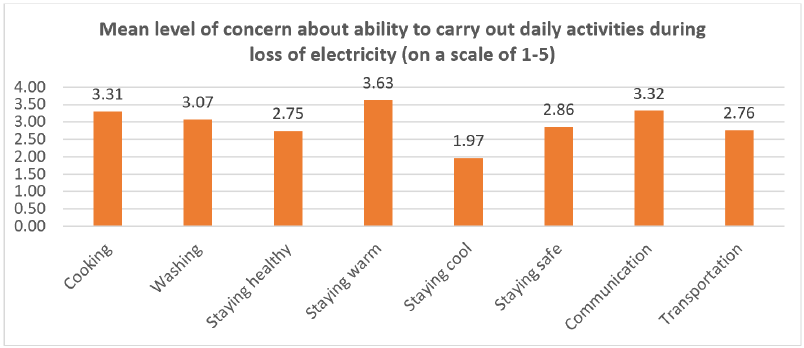
4.1 Transportation Preparedness and Level of Concern
In the survey, we asked respondents how concerned they were about being able carry out a variety
of everyday activities in the case of a major utility outage due to a disaster like an earthquake,
including: cooking, bathing/washing, staying healthy, staying dry and warm in winter, staying cool
in summer, staying safe and secure, communicating with family and friends, and using
transportation to get around. On a five-point Likert scale of “not at all concerned,” “slightly
concerned,” “somewhat concerned,” “moderately concerned,” and “extremely concerned,” the
average response was 2.76/5, or between “slightly” and “somewhat” concerned. Among the eight
everyday needs we asked about, transportation fell sixth in terms of level of concern (see Figure
1).
Figure 1. Relative levels of concern about carrying out everyday activities in a disaster scenario
We also asked respondents how prepared they are to survive on their own regarding ten different
preparedness items if there were an extended utility outage in the event of an earthquake (see
Figure 2). Answering on a four-point scale of 0 = “not at all prepared,” 1 = “prepared for 1-3 days,”
2 = “prepared for 4-6 days,” and 3 = “prepared for 7+ days,” the mean level of response for
transportation was 2.55, or preparedness for three to four days. Of the ten items in the question,
transportation fell third in terms of what people felt they were most prepared with, behind warmth
and medications. Every household surveyed had at least one vehicle, and the mean number of
bicycles was 2.5/household, suggesting that people may feel secure in being able to use their
vehicle or a bicycle in the event of a disaster, thus the relatively low level of concern compared to
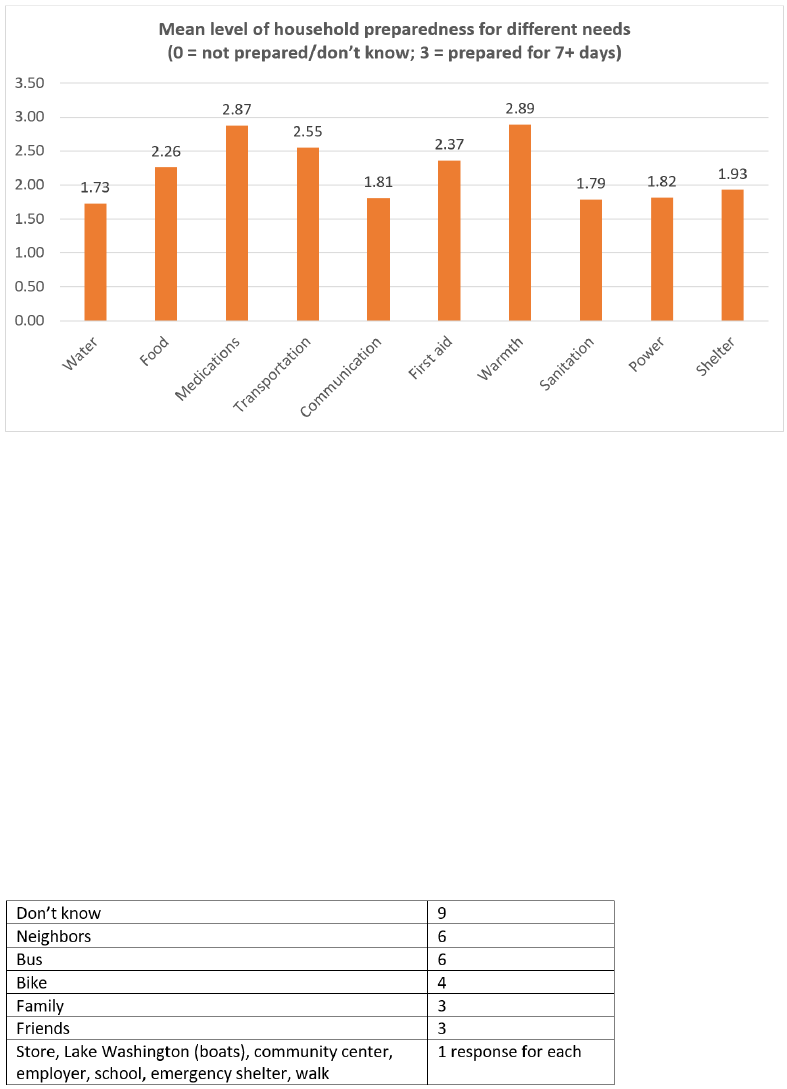
17
other everyday activities.
Figure 2. Respondent preparedness for carrying out everyday activities in a disaster scenario
When asked in an open-ended question where they would go to get transportation resources if they
found themselves without a means of getting around in a disaster, many people responded that they
“don’t know” where they would go to obtain transportation (see Table 1). Of the ten items people
were asked about (water, medications, food, shelter, communication, transportation, warmth,
sanitation, power, and first aid supplies), only transportation and sanitation received more “don’t
know” answers than any other answer, suggesting that people may be at a loss in terms of finding
alternative transportation. Only six people said they would turn to neighbors, while another six
thought they might be able to rely on bus service, which limited in the neighborhood even on a
normal day. Walking and biking received relatively few responses. Although in the previous
questions reviewed, people felt relatively little concern about transportation in a disaster scenario
and felt relatively well-prepared, the answers to this question suggest that people may not know
what to do if their own transportation resources (e.g., cars, bikes) cannot be used in the event of a
disaster. We do note that this question had a high rate of non-response, we believe due to its open-
ended nature, thus the relatively minimal response relative to the 75 total respondents.
Table 1. Where respondents would turn for transportation resources in the case of an emergency
4.2 Willingness to share
Because communities often need to rely on internal resources in the case of a disaster, we were
interested to know how willing people might be to share different kinds of resources in the event
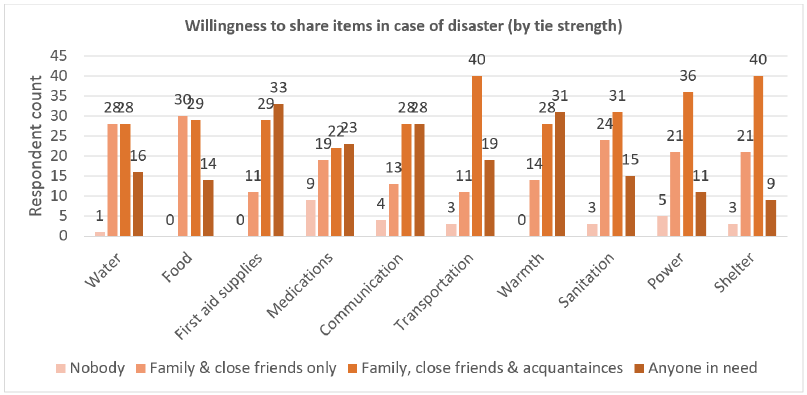
18
of a disaster, and how the strength of social ties might affect that willingness to share. People seem
willing to share transportation with family, friends and acquaintances, but somewhat less with
anyone in need (see Figure 3. Of the 75 total respondents, 51 (68%) indicated that they would
require some kind of social tie in order to share transportation resources with others in their
community (three people indicated they would not share with anyone, 19 indicated they would
share with everyone regardless of social ties, and two did not respond). We did not find a significant
correlation between social trust and willingness to share.
Figure 3. Willingness to share resources in the case of disaster according to strength of social ties
4.3 Transportation, disaster, and health care services
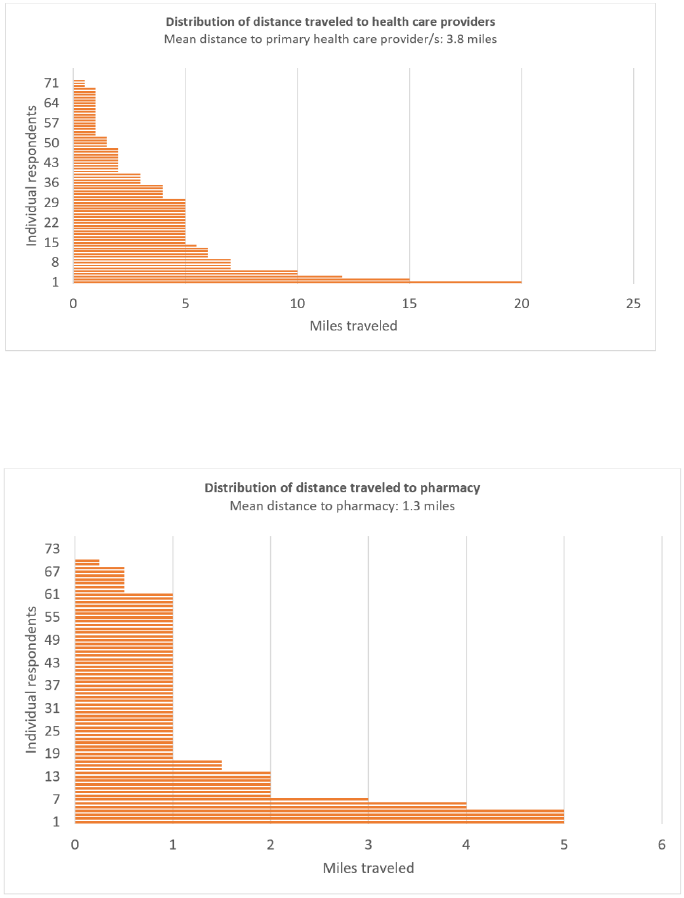
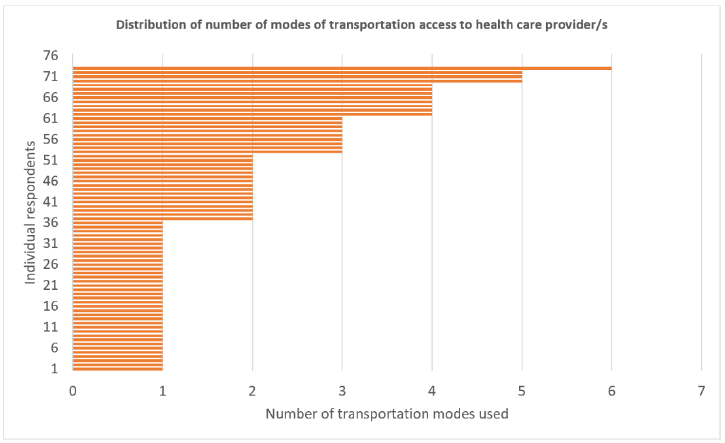
On average, respondents typically travel 3.8 miles to reach health care services and 1.3 miles to
reach their pharmacy. We found that the majority of respondents (76%) travel less than one mile
to their pharmacy, while only 26% travel less than one mile to their primary care provider. This
suggests that it may be feasible for people to reach their usual pharmacy in the case of a disaster,
but likely not their usual primary care provider (see Figures 4 and 5). However, people felt very
prepared with medications because prescriptions tend to provide several weeks’ worth of
medications at one time. We also found that 68% of respondents felt that they would travel to the
same emergency care provider in both normal and disaster circumstances. Whether or not health
care facilities and pharmacies would be functioning in the case of a disaster, however, is highly
uncertain.
19
Figure 4. Distribution of distance traveled to primary health care providers
Figure 5. Distribution of distance traveled to pharmacy
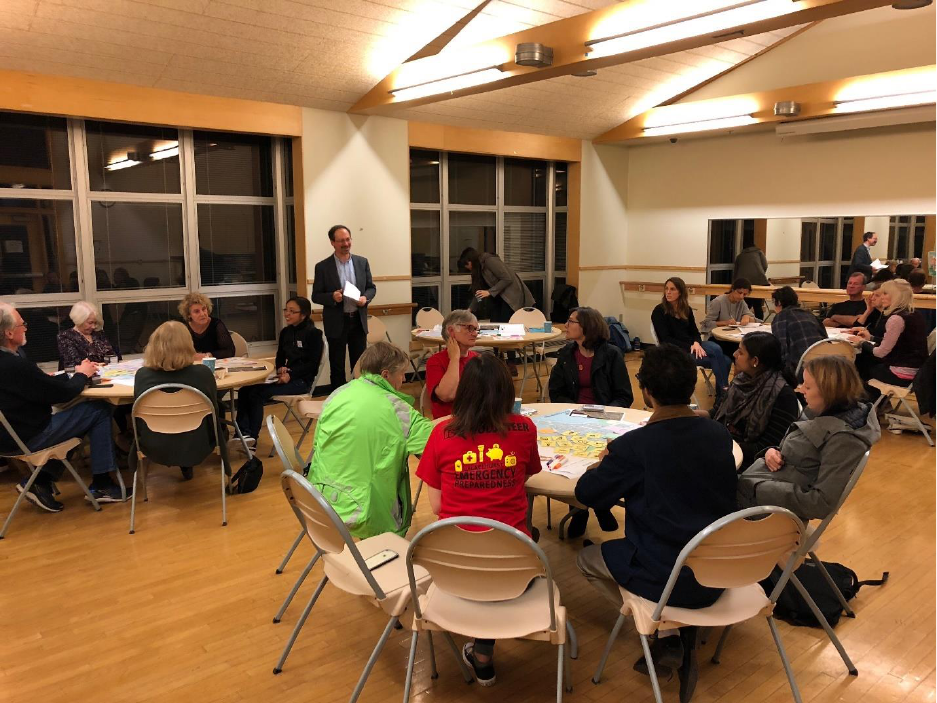
Approximately half (51%) of respondents typically use more than one mode of transportation to
access health care services (we asked about automobile, transit, ride-hailing, car sharing,
carpooling, bicycling and walking), suggesting that familiar alternative modes of transportation
may be available to some people in a disaster scenario (see Figure 6). Just over half of the
respondents (53%) indicated that they have some first aid skills, which might provide an important
community resource if access to health care facilities were limited.
20
Figure 6. Distribution of number of transportation modes used to access health care services
21
CHAPTER 5: DISCUSSION AND CONCLUSIONS
In a very general sense, few everyday activities are completed without leveraging some kind of
transportation resource. The ability to leverage community resources via local knowledge and
social ties is likely to play a significant role in helping people carry out everyday tasks following
a disaster. The literature reviewed suggests that robust social ties serve a critical function when
access to everyday resources is limited (Klinenberg, 2015). As noted previously, disasters are
place-based phenomena, with the implication that characteristics of place will influence the
composition of internal resources available at the community level and levels of interpersonal trust
and connection at the individual level. Because the community capacity necessary to avoid or
recover from a disaster is typically only apparent after a disruption, planning for disaster mitigation
involves a great deal of uncertainty.
Predicting the behavior of sociotechnical systems (such as transportation networks) when they
experience significant disturbance (such as a disaster) is a massively complex endeavor and a task
that remains elusive (Vespignani, 2009). Disaster preparedness planning is rife with uncertainties,
and although models can provide a partial illustration by identifying less stable ground, where the
faults lie, and what infrastructure might be more susceptible to damage, the specificity of the post-
earthquake landscape is largely unknowable.
It is important for planners and communities to be flexible and to think about contingencies in their
earthquake preparedness planning. Despite all the uncertainties involving the built environment in
a disaster scenario, we do know from past experience and research that the social environment of
communities is very important in the hours, days and weeks following a disaster (Freitag et al.,
2014). Social connections often substitute for infrastructural connections when needed (Ritchie,
2017; Klinenberg, 2018), and knowledge of local resources can be critical when communities are
cut off from the outside world. Helping communities to build social ties and enhancing local access
to a diversity of resources is one constructive approach to planning for disasters despite great
uncertainty.
While Laurelhurst, a well-connected urban neighborhood, experiences few if any barriers to
obtaining access to health care and wellness resources on an everyday basis, it will face unique
context-specific challenges in the event of a disaster. Because neighborhood residents have many
options for health care services and are quite mobile, they may have a lack of familiarity with local
health care facilities. In addition, the hospital that is located within the neighborhood provides
specialty care to children and youth, while the population of the neighborhood itself is older than
average, with many retirees. A next step might involve talking to health care institutions about
what they expect to happen in a disaster and about any community outreach plans or actions
regarding disaster preparedness. The steep topography and non-intuitive urban form of the
neighborhood (the community’s meandering streets are so mazelike that public buses often get lost
in the area) are also likely to pose challenges to emergency access, hindering reconnaissance and
rescue efforts in the event of a disaster.
The findings suggest that although people have relatively little concern about transportation in a
disaster scenario compared to other everyday needs, they would not know where to turn for
alternative trasnportation if they could not supply it themselves. Addressing this disparity may
involve education efforts regarding what transportation systems may or may not be available in
22
the event of an earthquake (for example, some people felt that the bus network could serve as an
alternative transportation resource, but this is unlikely due to the nature of earthquake damage).
Community events and activities encouraging the construction and strengthening of social
connections could help to make community members more aware of the disaster preparedness
resources available in their neighborhood (and where the gaps might be).
Remaining gaps and next steps
Mitigation strategies associated with earthquakes have traditionally overlooked the important role
played by transportation systems after disasters (Soltani-Sobh et al., 2016). Research on
transportation in extreme events has also focused on technological applications without revisiting
the fundamental principles of the transportation industry (e.g., design concepts, supporting
technological systems, functionality requirements, capacity) and the ways it is challenged to cope
with risks and uncertainties (Kaewunruen et al., 2016), resulting in a series of repeat failures (with
societal consequences) in the face of extreme events without significant change. Our findings
suggest that incorporating community social factors into transportation planning could provide
helpful information for both “everyday” transportation planning and transportation planning for
disaster preparedness and mitigation.
In addition, another major gap is understanding the needs of vulnerable populations, such as people
who are dependent on transit, in disaster planning and mitigation (Litman, 2006). An approach to
disaster preparedness planning that recognizes the diverse needs of people in poverty, those with
various physical or mental disabilities, those with language barriers and children is required,
pointing to the need for community-scale awareness and research to create inventories of special
needs, available resources, and gaps. It is our hope that moving forward with a research agenda
that integrates community social factors can help to address some of these gaps. Next steps include
testing the workshop and survey protocol in a range of other neighborhoods along spectra of urban-
ness and economic status to better illustrate regional variation in disaster preparedness planning
needs and gaps.

23
REFERENCES
Adger, W. N., T.P. Hughes, C. Folke, S.R. Carpenter, & J. Rockström. (2005). Social-ecological
resilience to coastal disasters. Science, 2005. 309(5737): 1036-1039.
Chang, L., A. S. Elnashai, & B. F. Spencer Jr. Post-earthquake modelling of transportation
networks. Structure and Infrastructure Engineering, 2012. 8(10): 893-911.
Chen, C., D. Neal, & M. Zhou, M. Understanding the evolution of a disaster—a Framework for
Assessing Crisis in a System Environment (FACSE). Natural hazards, 2013. 65(1): 407-422.
Connon, I. L. C. Extreme weather, complex spaces and diverse rural places: An intra-community
scale analysis of responses to storm events in rural Scotland, UK. Journal of Rural Studies, 2017.
54: 111-125.
de Jong, F. Parks and bicycles were lifelines after Mexico City’s earthquake. CityLab, 2017.
Accessed March 20, 2019 at https://www.citylab.com/environment/2017/09/parks-and-bicycles-
were-lifelines-after-mexico-citys-earthquake/541320/
Dillman, D. A. Mail and Internet surveys: The tailored design method--2007 Update with new
Internet, visual, and mixed-mode guide. John Wiley & Sons, Inc., Hoboken, 2007.
Elliott, J. R., & J. Howell, J. Beyond disasters: a longitudinal analysis of natural hazards’ unequal
impacts on residential instability. Social Forces, 2017. 95(3): 1181-1207.
Emery, M. & C.B. Flora. Spiraling-Up: Mapping Community Transformation with Community
Capitals Framework. Community Development: Journal of the Community Development Society,
2006. 37: 19-35.

24
Faturechi, R., & E. Miller-Hooks. Measuring the performance of transportation infrastructure
systems in disasters: A comprehensive review. Journal of Infrastructure Systems, 2014. 21(1):
04014025-1 - 04014025-15.
FEMA Ready.gov. Important Things to Know Before a Disaster, 2018, February 26. Retrieved
from: https://www.fema.gov/media-library/assets/videos/159970#. Accessed July 15, 2019.
Flynn, S., & S. Burke. Brittle infrastructure, community resilience, and national security. TR News,
2011. 275: 4-11.
Fornara, F., M. Bonaiuto, & M. Bonnes. Cross-validation of abbreviated perceived residential
environment quality (PREQ) and neighborhood attachment (NA)indicators. Environment and
Behavior, 2010. 42(2): 171-196.
Freitag, R. C., D. B. Abramson, M. Chalana, & M. Dixon. Whole community resilience: An asset-
based approach to enhancing adaptive capacity before a disruption. Journal of the American
Planning Association, 2014. 80(4): 324-335.
Graham, S., & S. Marvin. Splintering urbanism: networked infrastructures, technological
mobilities and the urban condition. Routledge, New York, 2002.
Heinberg, R. 8 Lessons for Building Resiliency After the California Wildfires. Citylab, 2017,
November 1. Retrieved from https://www.citylab.com/environment/2017/11/8-lessons-for-
building-resiliency-after-the-california-wildfires/544679/. Accessed July 15, 2019.
Henry, A. How to Prepare Your Community for a Disaster. The New York Times, 2018, February
15. Retrieved from https://www.nytimes.com/2018/02/15/smarter-living/prepare-your-

25
community-for-a-disaster.html. Accessed January 11, 2019.
Ishfaq, R. Resilience through flexibility in transportation operations. International Journal of
Logistics Research and Applications, 2012. 15(4): 215-229.
Kaewunruen, S., J. M. Sussman, & A. Matsumoto. Grand challenges in transportation and transit
systems. Frontiers in the Built Environment, 2016. 2(4): 1-5.
Kermanshah, A., & S. Derrible. A geographical and multi-criteria vulnerability assessment of
transportation networks against extreme earthquakes. Reliability Engineering & System Safety,
2016. 153: 39-49.
Klinenberg, E. Heat wave: A social autopsy of disaster in Chicago. University of Chicago Press,
Chicago, 2015.
Klinenberg, E. Palaces for the people: How social infrastructure can help fight inequality,
polarization, and the decline of civic life. Crown, New York, 2018.
Litman, T. Lessons from Katrina and Rita: What major disasters can teach transportation planners.
Journal of Transportation Engineering, 2006. 132(1): 11-18.
Little, R. A socio-technical systems approach to understanding and enhancing the reliability of
interdependent infrastructure systems. International Journal of Emergency Management, 2004a.
2(1-2): 98-110.
Little, R. G. The role of organizational culture and values in the performance of critical
infrastructure systems. In IEEE International Conference on Systems, Man and Cybernetics (IEEE
Cat. No. 04CH37583), 2004b. 5:4047-4052).

26
Lyons, G. The reshaping of activities and mobility through new technologies. Editorial for special
issue on ICT and the shaping of access, mobility and everyday life. Journal of Transport
Geography, 2009. 17(2): 81-82.
Mokhtarian, P. L. A typology of relationships between telecommunications and transportation.
Transportation Research Part A: General, 1990. 24(3): 231-242.
Mokhtarian, P. If telecommunication is such a good substitute for travel, why does congestion
continue to get worse? Transportation Letters, 2009. 1(1): 1-17.
Quarantelli, E. L., & R. R. Dynes. Response to social crisis and disaster. Annual review of
sociology, 1977. 3(1): 23-49.
Ritchie, L. Social Capital and Transportation: Critical Assets in Community Resilience. TR News,
2017. 311: 27-32.
Salomon, I. Telecommunications and travel relationships: a review. Transportation Research Part
A: General, 1986. 20(3): 223-238.
Schulz, K. The really big one. The New Yorker, 2015. 20(07).
Solnit, R. A paradise built in hell: The extraordinary communities that arise in disaster. Penguin,
New York, 2010.
Soltani-Sobh, A., K. Heaslip, P. Scarlatos, & E. Kaisar. Reliability based pre-positioning of
recovery centers for resilient transportation infrastructure. International Journal of Disaster Risk
Reduction, 2016. 19: 324-333.
Townsend, A. Smart cities: Buggy and brittle. Places Journal, 2013. Retrieved from:

27
https://placesjournal.org/article/smart-cities. Accessed March 3, 2019.
Vespignani, A. Predicting the behavior of techno-social systems. Science, 2009. 325(5939): 425-
8.
Washington State Emergency Management Division. Individuals, Families, & Pets. 2017.
Retrieved from https://mil.wa.gov/emergency-management-division/preparedness/personal.
Accessed February 22, 2019.
28
APPENDIX 1: COMMUNITY WORKSHOPS THROUGH APPRECIATIVE INQUIRY
METHOD
Introduction and Purpose
As part of this project and besides the quantitative survey described in Chapter 3, the team also
conducted community workshops as a qualitative means to understand how a community’s
sociotechnical resources can be integrated for enhancing community adaptive capacity.
Prof. Abramson introduces the workshop activities and provides some background information on
the ongoing UW/LEAP partnership on November 7, 2018.
On November 7, 2018, Laurelhurst Earthquake Action Preparedness (LEAP) and a
multidisciplinary research team from the University of Washington (UW) co-hosted a public
workshop at the Laurelhurst Community Center, creating a forum for neighborhood stakeholders
to discuss, via participatory group activities, the qualities that contribute to a resilient community.
The purpose of the workshop was to build a better understanding of the unique community values
and assets that might contribute to strengthening community resilience in Laurelhurst. Several
community members, a handful of LEAP team members and the UW team participated in the
workshop.

29
Partners and Background
LEAP is a community-based organization in Seattle’s Laurelhurst neighborhood that works to
increase awareness, knowledge, and connections within the community to help minimize the
potential for injury and damage in the case of a major disruptive event, such as an earthquake.
The multidisciplinary UW research team is led by Prof. Dan Abramson (Urban Design &
Planning) and Prof. Cynthia Chen (Civil & Environmental Engineering). Other UW team members
included doctoral student TAs Katherine Idziorek and Lan Nguyen as well as students in Prof.
Abramson’s Fall 2018 community resilience urban planning studio: Helen Stanton, Pegah Jalali,
Lauren Kerber, Catharina Depari, Sreya Sreenivasan and Charlotte Dohrn. The students helped to
facilitate the workshop activities.
LEAP and UW have been working together since the fall of 2017 to better understand how
community assets can be leveraged to enable adaptive capacity in the face of disruptions (such as
earthquakes) or other long-term changing conditions, in ways that also improve everyday
community well-being.
Workshop Methodology
The team adopts the appreciative inquiry-based method for community engagement. Unlike in
most risk assessment efforts, mitigation planning processes, or even pre-disaster recovery plans,
an appreciative inquiry-based community engagement protocol does not begin with presentations
of exposure and vulnerability. Rather, we first ask participants to list the sources of human well-
being (HWB) in their community. What do they like about their community? What makes their
community unique? How do they define quality of life in their community, and what aspects of
their community support quality of life? What brings them joy? Only then do we present the hazard,
or “change agent,” for discussion on how the community might prepare for it, respond to it, recover,
and rebuild. We present recovery as a broad process that depends on built, natural, and social forms
of capital, similar to NOAA’s Roadmap for Adapting to Coastal Risk, which has participants
develop a profile of “the local population” (“societal”), “the built environment” (“infrastructure”)
and “important natural resources” (“ecosystem”). However, the NOAA Roadmap describes a
hazard scenario in detail first and seeks to identify vulnerabilities and strengths primarily in the
context of that specific hazard scenario. Our approach differs significantly in that we present the
hazard or “change agent” only after the participants have profiled the unique attributes of their
respective communities using HWB categories. Moreover, instead of cataloging dysfunctions or
vulnerabilities, we ask questions that lead from the community’s strengths. In effect, we are
applying principles of asset-based community development to disaster planning (Green & Haines,
2012), specifically the idea that creative thinking leads from strength-based positive approaches to
inquiry and action, as expressed in the Appreciative Inquiry (AI) model (Emery & Flora, 2012).
Moreover, a broader, more balanced, and integrative consideration of assets—not just built, but
also natural and social capital—can prompt more adaptive thinking. Communities rely on goods
and services provided by built, natural, and social capital in varying degrees and at different times.
Capital typologies differ; Green and Haines (2012) categorize community capital as physical,
human, social, financial, environmental, political, and cultural. We draw our simpler classification

30
from the Millennium Ecosystem Assessment literature (Millennium Ecosystem Assessment, 2005)
and particularly from Mulder, Costanza, and Erickson (2006), leaving out human capital
(“personal growth and development”), and define three key categories as follows:
1. Built Capital: Things built by humans for rather specialized purposes, and with significant
ecological footprints. Examples include bridges, buildings, dams, and machinery.
2. Natural Capital: Environmental features that yield a flow of ecosystem services and tangible
natural resources. Examples include forests, wetlands, mangroves, soil, sand dunes,
agriculture, and fossil fuels.
3. Social Capital: Networks and associations of human relationships based on mutual trust,
common interest, or particular skills. Examples include service providers, regular festivals
and gatherings, clubs, and faith-based organizations.
These categories are not exclusive. A park, for example, might be considered a source of ecosystem
services, but if it is engineered for a special purpose (as in a baseball field), it might be considered
“built capital.” If it functions as a gathering place (as in a farmers’ market), it might be considered
“social capital.” The classification allows us to see how the quality of life provided by one type of
asset or capital might be provided by a different type under changed conditions after a disruption.
Workshop Activities
Prof. Dan Abramson and LEAP member Nancy Woods introduced the workshop purpose and
background.
The workshop comprised three primary activities, explained in detail in the following sections:
1) Asset mapping
2) Zone mapping
3) Disaster preparedness resource matching game
Activity 1: Asset Mapping
Participants sat in small groups at tables according to where they lived so that neighbors sat near
one another. Groups were prompted with the following questions:
• What values or assets make your community unique?
• What are Laurelhurst’s strengths as a neighborhood?
• What characteristics of the neighborhood contribute to everyday quality of life?
Participants were encouraged to think broadly about what might constitute a community strength
or asset. The Community Capitals Framework (Emery & Flora 2006) was used as a prompt for
participants to consider natural, cultural, human, social, political, financial and built capital in the
exercise.
Each table worked with a large map of the neighborhood that included space for both mapping
(drawing) and listing assets and values. Each person was asked to quickly write down their “top
three” ideas on sticky notes to get the activity started. Then, using pens and markers, groups spent
about 20 minutes discussing community assets and values and recording them either on the map
31
(for spatial assets/values) or on the list (for non-spatial assets/values).
Participants recorded Laurelhurst values and assets by drawing on neighborhood maps (photos
by Amy Fouke).
Assets listed and mapped during the exercise fell into the following broad categories:
• Shops, restaurants and services: Independent, small businesses in “business district” on
Sand Point Way; University Village; grocery stores (PCC, Metropolitan Market, QFC);
City People’s, Katterman’s Pharmacy, Sand Point Grill, hardware store, gym, good
restaurants
• Parks, nature, open space and recreation: Burke Gilman trail; Laurelhurst Community
Center (sports facilities, views, youth summer programs, meeting place, nature access);
community-developed “Saving Urban Nature” pocket park (NE 47
th
& 47
th
NE);
Magnusson Park nearby; Center for Urban Horticulture (offers birding, public open
space, nature access, education, public meeting space, library, walking); green
neighborhood; natural beauty
• Institutions: Beach Club, churches, private school/pre-schools, hospital in neighborhood,
fire station, NOAA nearby, UW hospital, Children’s Hospital (helipad), ties to UW
(“education pride”)
• Transportation: Light rail nearby (with just “ok” bus access), lots of bikes, road network
(traffic at Montlake Cut mentioned as a negative aspect of neighborhood), water and
boats
• Neighborhood activities and communication outlets: Crime watch, block parties,
newsletter, community blog, NextDoor, Constant Comment, social media (e.g., “Buy
Nothing”)
• Social character: many generations live here, sense of community, people know their
neighbors, neighbors are helpful and caring; “dogs on leashes” behavior, social ties,
static/stable neighbors, feels safe, quiet
• Political/financial/knowledge resources: some residents involved in/have former
experience in politics, many very politically active people (engaged in social issues and
school funding), financial resources, owner-occupied homes, highly educated community,
medical professionals, UW professors/retirees, health care and engineering “know-how”

32
• Built environment: multiple-family dwellings, accessory dwelling units, well-spaced-
out houses, walkable area, gardens in the neighborhood, beautiful neighborhood,
beautiful homes, visibility, no tall buildings, waterfront/water access with street end
public access to waterfront in multiple locations
Although values tended to be more difficult to map than assets, several important neighborhood
values were noted: cross-generational interaction; value of education; access to water and nature;
sense of community; willingness to connect via social activities (block parties, welcoming new
homeowners, “sidewalk friends”); ability to rely on trusted neighbors for communicating
important information.
Asset mapping discussion themes
Several themes emerged during the group discussions as assets and values were mapped. They are
presented here with suggestions for potential follow-up action items by LEAP:
1) Coordination with local institutions
The groups discussed the role that several identified community institutions might play in
a disaster scenario, including schools, churches, the hospital and the community center.
Specific roles mentioned included:
• Laurelhurst Community Center could support evacuation processes and logistics
during a disaster
• Seattle Children’s Hospital might be a source of medical support in a disaster,
including use of the helipad for evacuation
• St. Stephen’s Episcopal Church could potentially act as a neighborhood hub to
provide shelter, power and communication in the case of a disaster
Potential LEAP action items:
• Coordinate (or continue to coordinate, as appropriate) with Laurelhurst Community
Center, Seattle Children’s Hospital and St. Stephen’s Episcopal Church to understand
how (and to what extent) those institutions are able to support the community in the
case of a disaster
2) Transportation and connectivity
Participants emphasized that they value the walkability of their neighborhood, including
access to the Burke-Gilman and other trails. They discussed the proximity to downtown
and the light rail as assets. They suggested that major neighborhood streets (47
th
Ave NE,
NE 45
th
St., NE 41
st
St.) might support evacuation and delivery of medical aid in the case
of a disaster. If cut off or isolated in a disaster situation, boats or kayaks could potentially
be used for transportation.
Potential LEAP action items:
• Understand whether there are designated evacuation routes or strategies for the
neighborhood and how to support community understanding of any designated routes
or recommended actions (coordinate with relevant departments at the City of Seattle)
• Further investigate how boats might be potentially useful for establishing connectivity
with nearby areas or used as rescue conveyances in the case of a disaster

33
3) Disaster skills communication and training
Participants appreciated the skills and knowledge resources of Laurelhurst residents (e.g.,
engineering, health care expertise) that could be very helpful in the case of a disaster if
known and coordinated. It was noted that the role of cluster captains will be very important
for maintaining coordination during a disaster via walkie-talkie (or other communication
devices).
Potential LEAP action items:
• Increase neighborhood skills and knowledge by continuing to support trainings (e.g.,
first aid)
• Create cluster-based “skills inventories” that could be used to understand what
knowledge and skills are available locally and in what areas the community may need
more education or training
4) Engaging local businesses
Participants highlighted several businesses within or near the neighborhood they perceive
as assets: a pharmacy, a hardware store, local restaurants, grocery stores and University
Village. They noted Laurelhurst itself does not have a business core, but there are many
shops and businesses within walking distance. Participants suggested that neighborhood
shops and restaurants could provide logistics, food, or other basic needs for the community
in a disaster.
Potential LEAP action items:
• Engage with area businesses; support disaster preparedness efforts of local employers
5) Leveraging attachment to place
Place attachment, which refers to strength and basis of feelings for a specific place, was a
common theme in several of the workshop conversations about values and assets.
Neighborhood characteristics such as access to water and Laurelhurst’s unique, hilly
topography with views to green spaces evoke the natural beauty of rural areas. These are
important features of the neighborhood that cannot be found in parts of the city dominated
by tall buildings. Likewise, the calmness and quietness of Laurelhurst provide a reprieve
from the noisier and more stressful “urban” areas of the city. Residents enjoy the unique
experience of walking through Laurelhurst offered by its organic, curvilinear streets and
the opportunities this degree of walkability creates to meet and greet neighbors on the
sidewalk.
Potential LEAP action items:
• Organize neighborhood walks or tours to build social capital among neighbors and to
help people get to know the neighborhood better with a focus on unique, place-based
assets.
Activity 2: Zone Mapping
LEAP member Louise Luthy provided background on the intent and importance of creating

34
neighborhood “zones.” LEAP is in the process of organizing the entire neighborhood into
approximately 20-household clusters for the purposes of sharing information that might be useful
in the case of a disaster. Each cluster has a designated captain or captains who are responsible for
disseminating information to cluster members and organizing the cluster’s own internal
information and disaster preparedness resources. Because there are a relatively large number of
clusters across the neighborhood (98 in total), LEAP is interested in creating “zones” that comprise
multiple clusters to help provide another level of efficiency and organization between the clusters
and LEAP itself. The workshop activity provided an opportunity to ask community members,
based on their own knowledge of the neighborhood, what criteria should determine how clusters
are grouped together to form zones.
Participants were given the following questions as a prompt:
1) How many clusters should be in a zone? How large should a zone be?
2) What characteristics should define a zone? (Topography? Transportation networks?
Existing social connections? Land use? Distribution of assets/resources? Information
about hazards?)
In small groups at tables, participants were asked to outline potential zones by drawing on large
maps of the neighborhood showing LEAP’s already-designated clusters. Groups were given
additional maps showing local hazards and neighborhood topography to help inform their
discussion and mapping.
Groups outline zones on maps of LEAP’s neighborhood cluster system.
The groups discussed several factors that could be considered when deciding where zones should
be located and how they should be organized:
• Personal relationships and social interaction: When determining how to divide zones,
participants considered which neighbors they interact with regularly, which can create an
intangible “feeling of connection.” Areas in which people tend to interact when walking
(or walking their dogs), holding block parties, or sharing information (e.g., people that
share an alley and communicate about parking, construction, etc.) could help to inform
how the zones are created. Creating zones that connect already-connected block groups

35
could also help to foster new social connections between and among clusters. One group
suggested that already-established social connections should override any natural or
physical boundaries when outlining zones.
• Residential character and density: Participants suggested that areas characterized by
similar densities and development styles (single family homes vs. apartments/condos)
should be grouped together in zones.
• Zone size: Groups discussed the ideal size of zones for efficient organization and
management, suggesting that each zone should contain approximately 100-120 people or
4-6 clusters.
• Access: One group suggested zones might be formed based on common access because
people might already know one another from habitually using the same travel and access
routes. Physical accessibility between clusters could help to facilitate inter-cluster
sharing and support.
• Topographic and spatial boundaries: Some neighborhood features create barriers
between potential clusters, including topography (divisive ridgelines or location of the
clusters with respect to a hill/slope), street type (boulevards, busy thoroughfares, etc.),
housing typology (multi-family, single-family), orientation of houses (houses facing each
other vs. houses facing away from one another) and presence of a parcel with a
commercial or institutional use. Depending on topography, residents of some blocks tend
to be “alley-dwellers” – to know their neighbors across the alley better than those across
the street, while others, vice versa, are “street-dwellers”.
• Resident knowledge: Multiple groups found it was easiest to determine how zones
should be organized in the areas nearby where they live. It was more difficult to
determine how zones should be organized in areas of the neighborhood with which they
were less familiar. This suggests that geographically-based focus groups may be useful
for outlining zone boundaries.
Activity 3: Disaster Preparedness Resource Matching game
The final activity involved a disaster preparedness card game in which groups worked as teams to
creatively match skills and resources with hypothetical challenges that might arise in the case of a
disaster. University of Washington Ph.D. student Katie Idziorek explained the game and rules to
the participants. Each group received a deck of game cards containing cards for “skills” as well as
one for “equipment and supplies.” The content of the skills and equipment cards was based on a
Seattle Neighborhoods Actively Prepare (SNAP)
1
Neighborhood Block Watch Skills and
Information questionnaire. A third deck of cards contained a set of “disaster challenges” based on
scenarios that might arise in the case of an earthquake.
1
https://www.seattle.gov/emergency-management/prepare/prepare-your-neighborhood/seattle-neighborhoods-actively-prepare
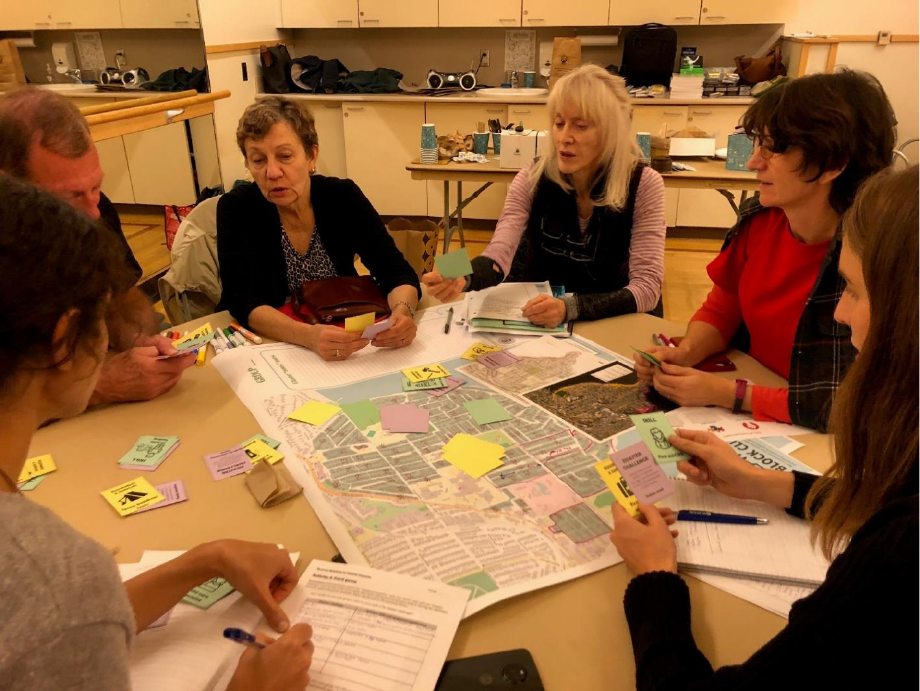
36
One group considers how to solve a “disaster challenge” by pooling together the skills and
resources on their cards.
Content of cards:
• Skills cards: First aid/CPR, childcare specialist, search and rescue, crisis
counseling/psychologist, damage assessment, disaster feeding, HAM radio operator,
plumber, carpenter, electrician, firefighter, health care provider
• Equipment and supplies cards: first aid and medical, spare bedding/tents, chain saw,
generator, portable lights, camp grill/stove, walkie talkie, long ladder, crowbar/axe, strong
rope
• Disaster challenge cards: widespread power outage, building damage, medical
emergency/injury, communication need, transportation need, family separation, food/water
need, fire, shelter need, sanitation need, landslide, missing person, medication need
Continuing to work in small groups at tables, participants each drew a card from each of the three
stacks: skills, equipment/supplies and disaster challenge. Taking turns, participants posed their
disaster challenge to the table, and group members worked together to use their skills and
equipment cards to help solve the challenge. Participants were encouraged to be creative in their
matching of disaster needs with resources.

37
Teams were prompted to discuss the following questions during the game activity:
1) How would you use your group’s cards to solve each of the disaster challenges?
2) How many of the challenges do you feel your group was able to adequately solve (i.e., you
have all the skills and equipment/supplies needed to realistically solve the challenge)?
3) Did anything surprise you in this activity? What was your group’s most creative solution?
What was the most difficult challenge to solve, and why?
At the end of the card game, teams were awarded disaster preparedness “prizes” (first aid
handbooks, emergency blankets and headlamps) based on their ability to solve the most challenges
or to develop the most creative solution.
Disaster challenge
Group response (skills/resources cards in
bold)
After an earthquake, there is no longer running
water and your cluster has run out of food
Use a walkie talkie to call for help; use extra
water stored by some cluster members; for
food, pick vegetables from the community
garden and hunt rabbits within the
neighborhood
Your cluster needs to communicate with areas
outside the neighborhood to arrange for the
delivery of critical supplies and “normal”
communications systems are not working after
an earthquake
Use a bicycle for transportation to reach areas
outside the neighborhood
Some people within your cluster are missing
after an earthquake
Make use of cluster members’ search and
rescue, child care and first aid skills; use a
crowbar to help search damaged buildings for
missing people
Some families in your cluster were separated
during the earthquake
Use a ham radio to establish communication
with outside areas
Examples of hypothetical disaster scenarios and the groups’ responses.
After the game, teams were asked to consider the following two questions:
1) What additional skills or equipment/supplies beyond those on the cards you drew would
have been helpful in solving the disaster challenges?
2) Thinking back to the first activity of the evening, which of Laurelhurst’s existing values
and assets would help in solving the kinds of problems presented by the disaster
challenges? What additional assets or values might be useful to develop to help solve these
kinds of problems?
Workshop summary
As participants discussed the questions posed during and after the resource matching activity,
38
several broad themes emerged that could potentially help to inform future LEAP actions and
initiatives, including some that overlap with or complement the themes discussed in the asset
mapping exercise:
• Preparation through training: Some participants discussed having previous (childhood)
experience with evacuation drills at school and suggested this kind of preparation could be
very useful. Groups mentioned several specific skills development/training topics that might
be helpful for boosting Laurelhurst residents’ confidence in disaster response protocol,
including:
o Earthquake drills
o Psychological support/psychological first aid for survivors
o Medical first aid training
o Fire response training
o Waste disposal protocol
o Water treatment protocol
• Vulnerability due to loss of power: Several participants expressed extreme concern about
the loss of electricity and communication abilities during and/or after a disaster and agreed
that generators are critical to resilience. Other alternative power sources mentioned included
portable chargers, extra fuel, solar cells or other solar-powered equipment.
• Health and sanitation: Groups were unsure how to deal with issues of sanitation and water
treatment in the event of an earthquake. Hygiene supplies (“toilets and trash”), water
purification equipment and first aid kits were mentioned as important items to have on hand.
• Transportation and communication: Communication tools (e.g., ham radio, walkie talkies,
drones) emerged as critical items for preparedness. Transportation also emerged as a primary
need following a disaster. All-terrain vehicles (ATVs) or bicycles might be more easily used
than cars if roads are damaged in an earthquake.
• Neighborhood- or cluster-level inventories: Many participants emphasized the need for a
skills/tools registry, so they can be aware of what neighborhood resources are available to
mobilize in an emergency response effort (for example, items such as boats or camping
equipment could be inventoried). A skills inventory might document who knows how to
provide medical care, or who has knowledge of plumbing or carpentry. Another form of
inventory or registry might record special medical care needs.
• Community-building: In addition to the disaster skills and equipment needs outlined above,
some groups suggested that holding more social events would help neighbors get to know
one another better, facilitating the kinds of social connections that can be very important in
disaster situations.
39
APPENDIX 2: PILOT SURVEY QUESTIONNAIRE
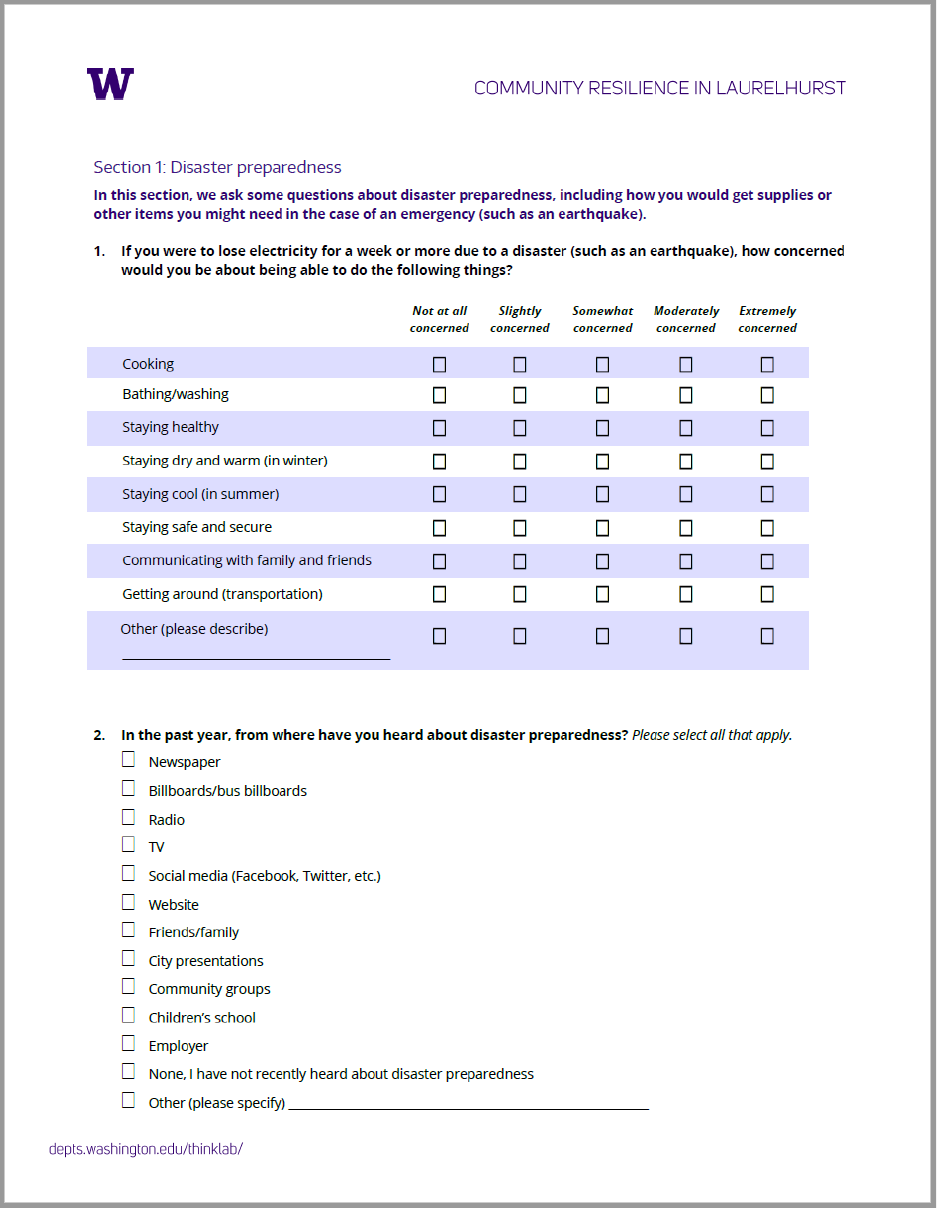
40
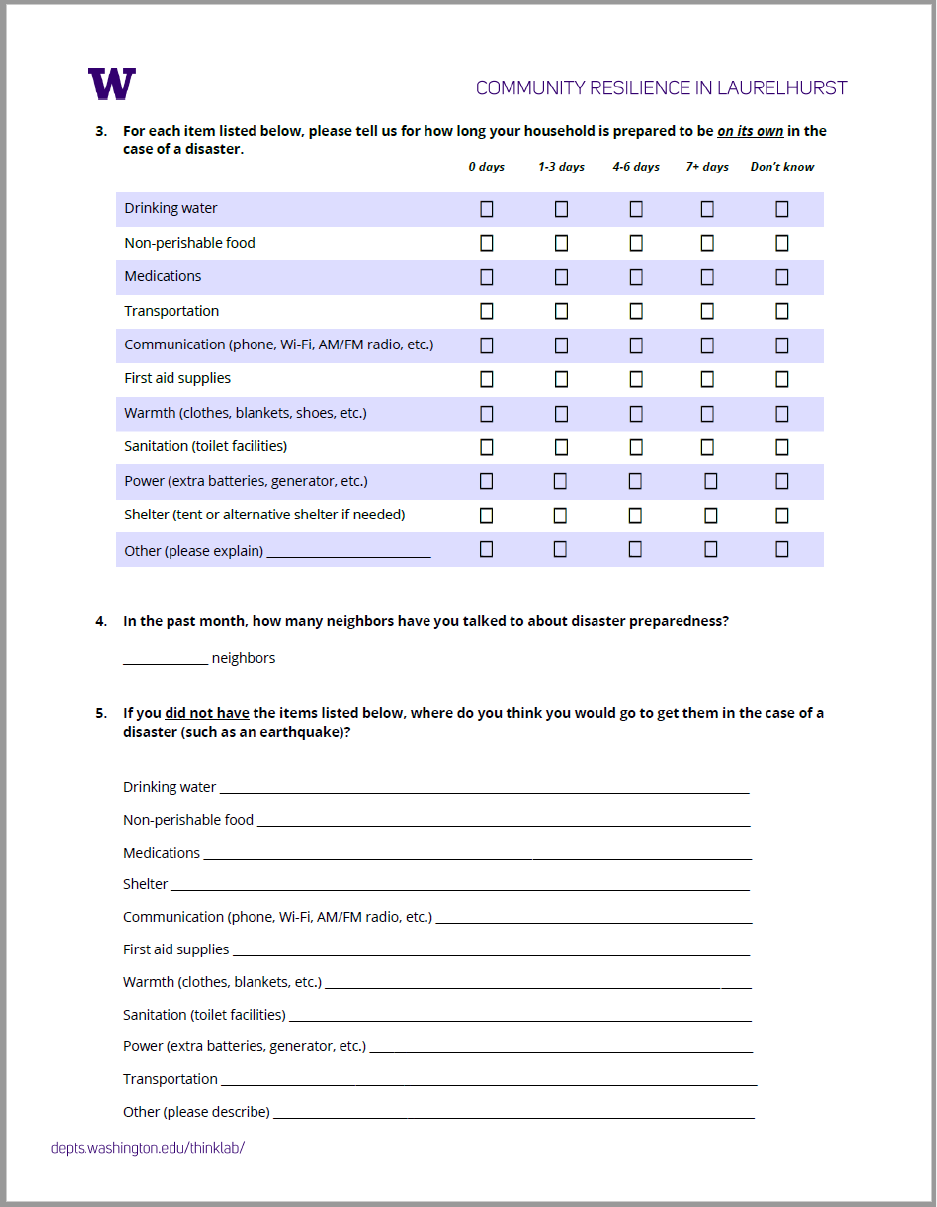
41
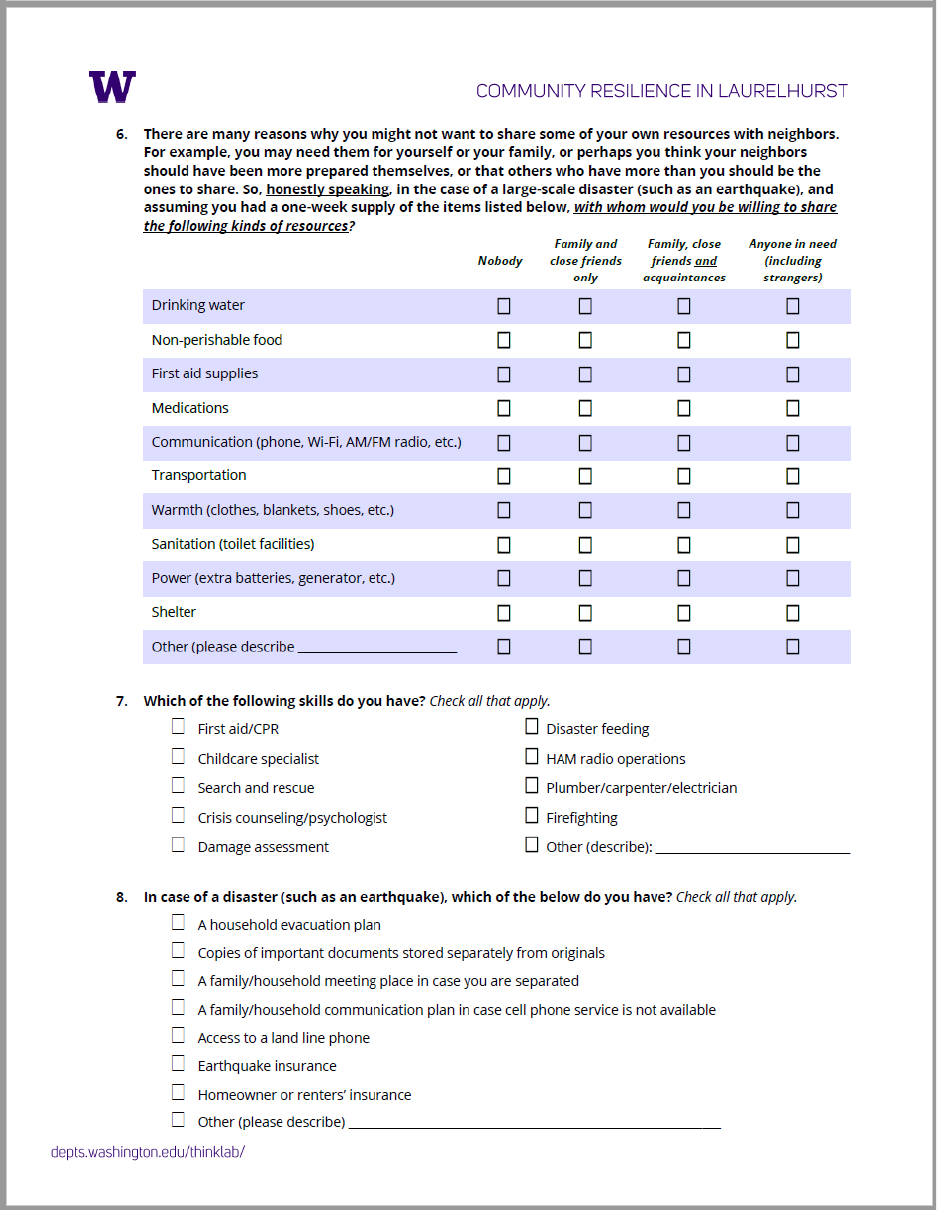
42
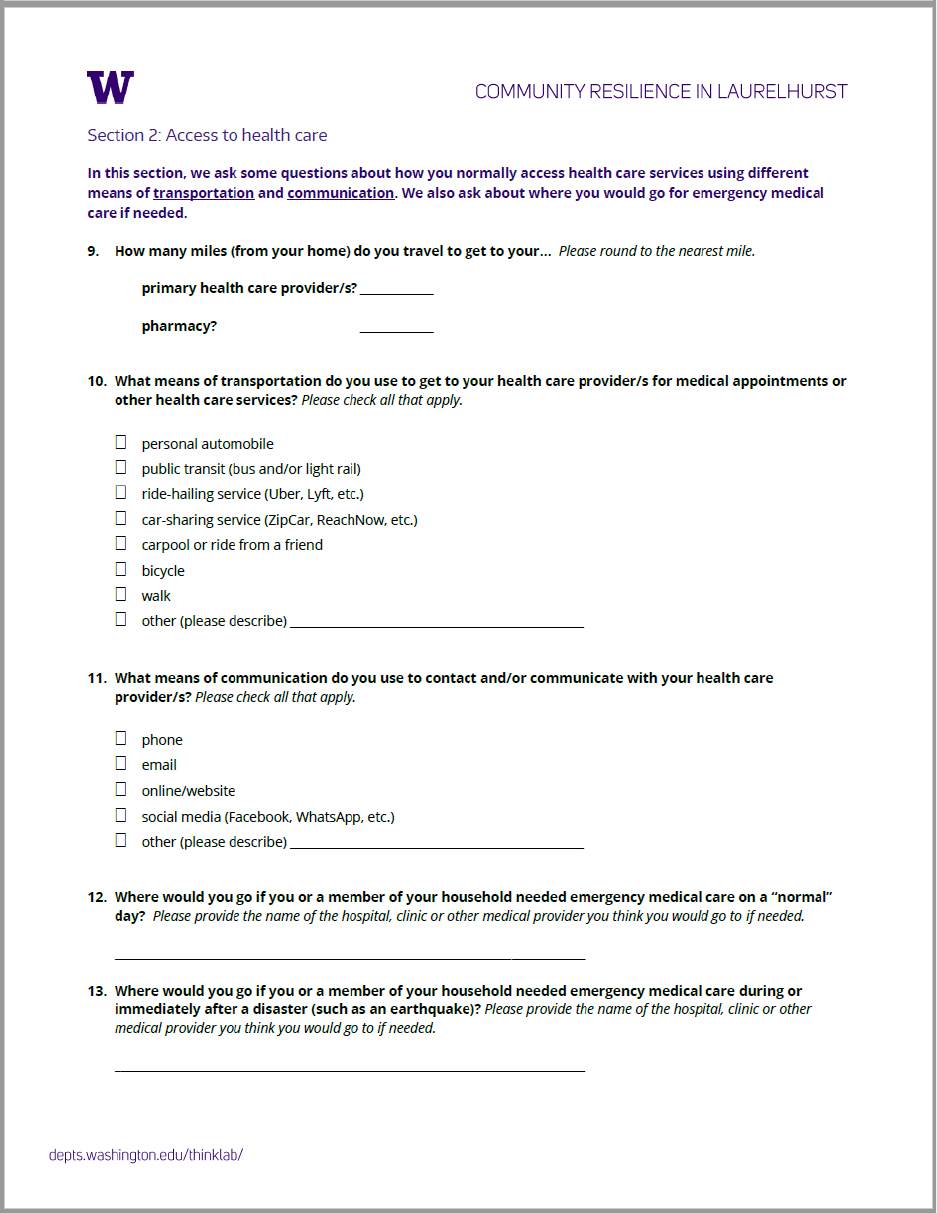
43
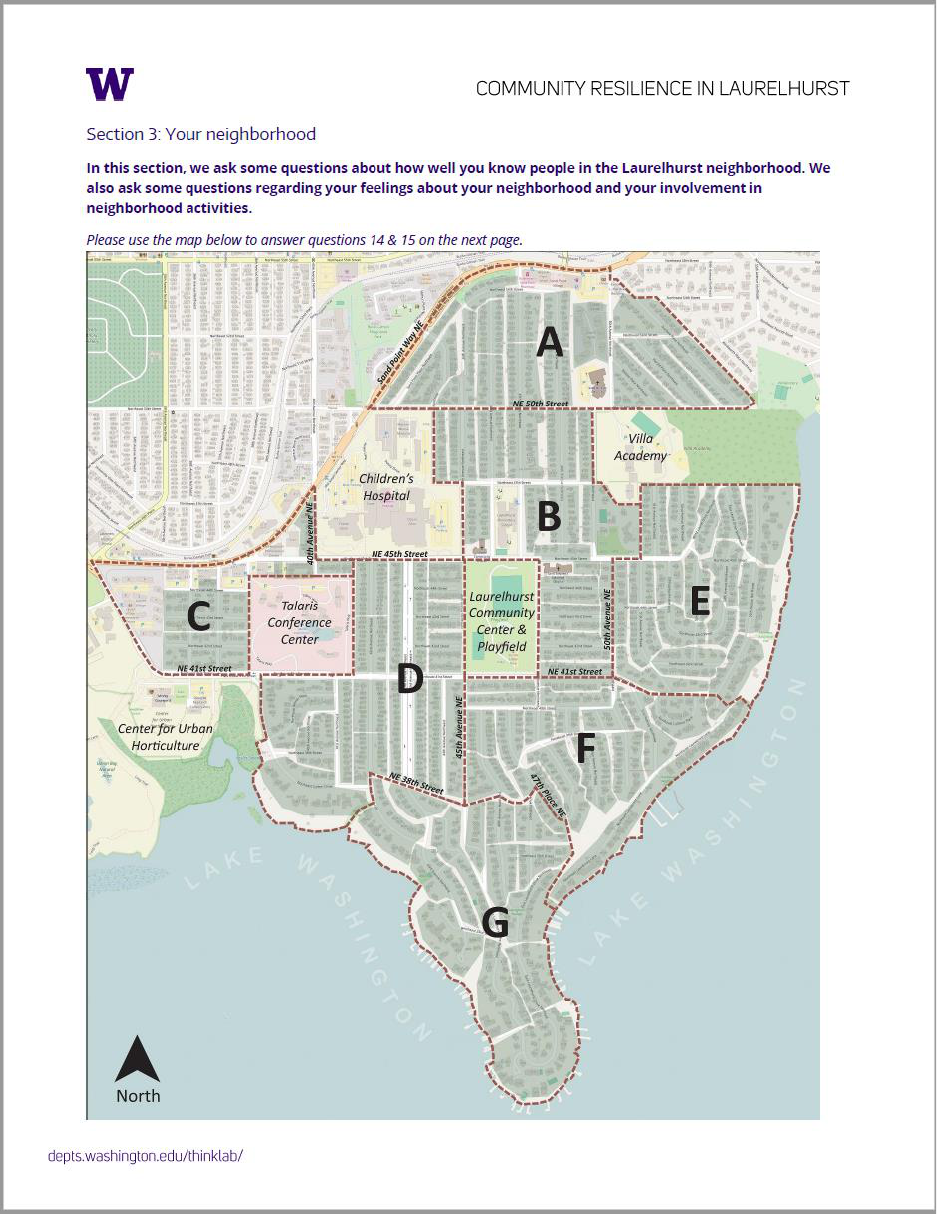
44
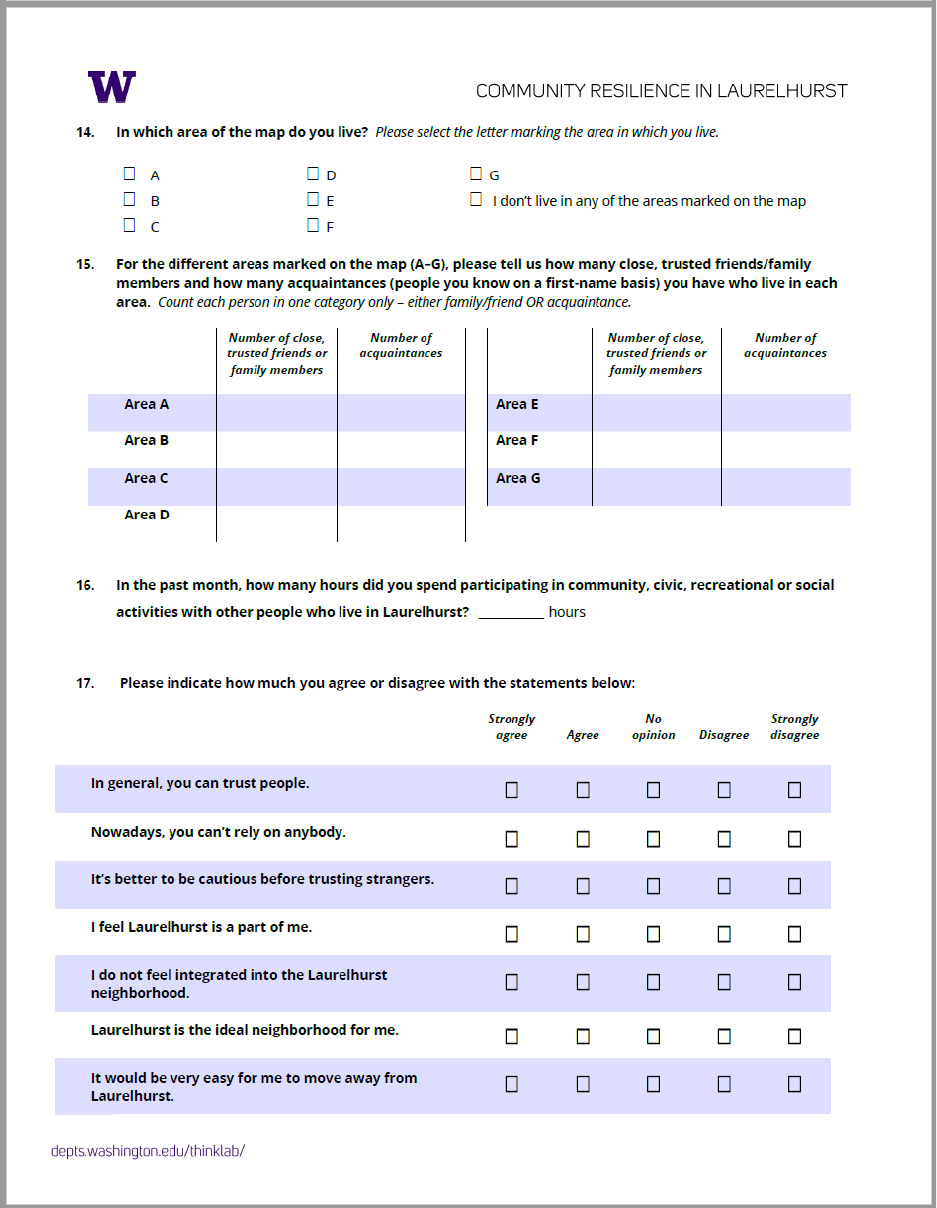
45
46
47
48
49
