
Patient Experience Journal Patient Experience Journal
Volume 7 Issue 3 Article 24
2020
Factors associated with patient rating of physician Factors associated with patient rating of physician
communication effectiveness and satisfaction in musculoskeletal communication effectiveness and satisfaction in musculoskeletal
care care
Amirreza Fatehi
Department of Surgery and Perioperative Care, Dell Medical School – The University of Texas at Austin
Amanda Gonzalez MD
Department of Surgery and Perioperative Care, Dell Medical School – The University of Texas at Austin
David Bandell
Department of Surgery and Perioperative care, Dell Medical School, University of Texas at Austin
Joost Kortlever
Department of Surgery and Perioperative care, Dell Medical School, University of Texas at Austin
Léon Rijk
Department of Surgery and Perioperative Care, Dell Medical School – The University of Texas at Austin
See next page for additional authors
Follow this and additional works at: https://pxjournal.org/journal
Part of the Orthopedics Commons
Recommended Citation Recommended Citation
Fatehi A, Gonzalez A, Bandell D, Kortlever J, Rijk L, Ring D. Factors associated with patient rating of
physician communication effectiveness and satisfaction in musculoskeletal care.
Patient Experience
Journal
. 2020; 7(3):209-222. doi: 10.35680/2372-0247.1427.
This Research is brought to you for free and open access by Patient Experience Journal. It has been accepted for
inclusion in Patient Experience Journal by an authorized editor of Patient Experience Journal.

Factors associated with patient rating of physician communication effectiveness Factors associated with patient rating of physician communication effectiveness
and satisfaction in musculoskeletal care and satisfaction in musculoskeletal care
Cover Page Footnote Cover Page Footnote
This article is associated with the Policy & Measurement lens of The Beryl Institute Experience
Framework. (http://bit.ly/ExperienceFramework). You can access other resources related to this lens
including additional PXJ articles here: http://bit.ly/PX_PolicyMeasure
Authors Authors
Amirreza Fatehi, Amanda Gonzalez MD, David Bandell, Joost Kortlever, Léon Rijk, and David Ring
This research is available in Patient Experience Journal: https://pxjournal.org/journal/vol7/iss3/24

Patient Experience Journal
Volume 7, Issue 3 – 2020, pp. 209-222
Patient Experience Journal, Volume 7, Issue 3 – 2020
© The Author(s), 2020. Published in association with The Beryl Institute
Downloaded from www.pxjournal.org 209
Research
Factors associated with patient rating of physician communication
effectiveness and satisfaction in musculoskeletal care
Amirreza Fatehi, Dell Medical School, The University of Texas at Austin, amir_fatehi@yahoo.com
Amanda Gonzalez, MD, Dell Medical School, The University of Texas at Austin, amandainezgonzalez@gmail.com
David Bandell, Dell Medical School, The University of Texas at Austin, d.ba[email protected]
Joost Kortlever, Dell Medical School, The University of Texas at Austin, joost.kortlever@austin.utexas.edu
Léon Rijk, Dell Medical School, The University of Texas at Austin, rijk.leon@gmail.com
David Ring, Dell Medical School, The University of Texas at Austin, [email protected]texas.edu
Abstract
Effective communication is associated with adherence to healthy habits. This study sought factors associated with
communication effectiveness and satisfaction with musculoskeletal specialty care in order to inform efforts to improve
communication effectiveness using measurement, feedback, and coaching. After a new or return upper extremity
specialist visit, 146 adult patients completed a survey recording demographics, measures of catastrophic thinking in
response to nociception, symptoms of depression, and symptoms of anxiety, and they rated communication
effectiveness (5 questions answered on a 4-point Likert scale) and satisfaction with the visit (slider with anchors of 0 and
100). Patients also provided text answers to 4 questions addressing strengths and opportunities for improved
communication. We assessed the association of experience measures (communication and overall satisfaction) with
patient characteristics. Ratings of “clinician listens carefully” were higher in older patients. Higher rating of "clinician
explains in an understandable way" was associated with fewer symptoms of depression. Higher rating of "clinician
showed respect" was associated with fewer symptoms of depression and less catastrophic thinking. Higher rating of
"clinician used models" was associated with older age. Men had higher overall satisfaction scores. In Factor analysis, the
scree plot of eigenvalues showed that the 5 communication questions and the single satisfaction question load onto a
single factor. The finding that age and psychological factors are associated with patient experience – which seems to
reduce statistically to a single underlying construct – emphasizes a potential to attend to mental health in efforts to
improve patient experience.
Keywords
Patient satisfaction, patient experience, patient-physician communication, healthcare, psychosocial, communication
satisfaction, mental health, upper extremity
Introduction
Effective relationships with patients and effective
communication strategies are associated with better
adherence to recommended care, greater agency and self-
efficacy regarding one’s health, and better health.
1,2
Attempts to optimize value in care (improved health for
resources used) can lead to difficult discussions about test
and treatment options that may be a challenge for all
clinicians, even those with highly effective communication
strategies.
3
For instance, not prescribing antibiotics for a
virus or not ordering an MRI for low back pain. Routine
measurement and feedback-tailored strategizing and
training could improve communication effectiveness,
optimizing both value and patient experience.
4
Prior studies found that more highly rated communication
correlates with greater satisfaction, fewer symptoms of
anxiety, and a less negative affect.
5–8
The aim of this study
was to identify factors associated with communication
effectiveness and satisfaction with musculoskeletal care in
order to inform routine measurement of these factors for
quality improvement initiatives. Our primary null
hypothesis is that there are no factors independently
associated with “clinician listens carefully” in
musculoskeletal care. The secondary null hypotheses are:
There are no factors independently associated with patient
rating of “clinician use of models, drawings or information
on a computer or handheld device,” ”clinician explains
things in an understandable way,” “clinician showed
respect of what patient had to say” and “clinician spent
enough time with patient,” and satisfaction with the visit.
We also collected text advice regarding: what the clinician
did well in terms of communication; clinician
communication in comparison to patient expectations;
opportunities to improve clinician patient communication;

Communication effectiveness and satisfaction, Fatehi et al.
210 Patient Experience Journal, Volume 7, Issue 3 – 2020
and things we can do to improve their satisfaction with
care. As a tertiary (unplanned) inquiry we used factor
analysis to determine if these five communication
questions and the single satisfaction question load onto a
single factor.
Method and Materials
This study was approved by our Institutional Review
Board (IRB). We invited 161 adult patients visiting 6 upper
extremity speciality offices in an urban US city for a new
or return outpatient visit to participate by answering
questions on a web-based HIPAA compatible survey using
REDCap (Research Electronic Data Capture). A research
assistant invited patients to participate in the study at the
end of their visit. The inclusion criteria were: 1) Age 18
years or greater; and 2) English or Spanish fluency and
literacy. Exclusion criteria was cognitive deficiencies.
After reading a research letter, completing the
questionnaires constituted informed consent. One
hundred and forty-six patients (91%) participated and 15
declined (9%). After the visit, patients completed
questionnaires on an electronic tablet provided by a
research assistant. Subjects completed a demographic
questionnaire including age, gender, race, education level,
work status, marital status, insurance status, visit type and
way of referral.
Subjects also completed several questionnaires. The PCS-
4 (Pain Catastrophizing Scale) is a 4-item measure of
worst-case thinking in response to nociception (the
pathophysiology of actual or potential tissue damage).
Every question is scored on a 5-point Likert scale and the
total scores range from 0 to 16 with zero (no catastrophic
thinking) and 16 (maximum catastrophic thinking). The
PHQ-2 (Patient Health Questionnaire) is a 2-item measure
of symptoms of depression over the past two weeks with a
range of 0 to 6. The GAD-2 (General Anxiety Disorder) is
a 2-item measure of symptoms of anxiety in the past 2
weeks. The total score ranges from 0 to 6.
As our dependent variables, we used the 5 questions
addressing communication effectiveness from the
Clinician and Group Consumer Assessment of Healthcare
Providers and Systems (CG CAHPS) questionnaire, a
standardized tool to measure patient perceptions of care in
an office setting. The following five questions were rated
on the following scale: A. Never, B. Sometimes, C.
Usually, or D. Always and as a convention to include the
top two scores in experience measures,
10–12
all of which
have high ceiling effects, when the measure is
dichotomized, we put always and usually together versus
never/sometimes.
1. How often does the clinician listen carefully?
2. How often does the clinician explain things in an
understandable way?
3. How often did the clinician showed respect for what
the patient had to say?
4. How often did the clinician spend enough time with
the patient?
5. How often does the clinician use of models, drawings,
or information on a computer or handheld device?
As our other dependent variable, we asked patients to rate
their satisfaction with the visit on a slider with anchors of
0 (completely unsatisfied) to 100 (completely satisfied). We
also asked patients four questions and recorded their text
responses:
1. What did the clinician do well in terms of
communication?
2. How did the clinician's communication compare to
your expectations?
3. What opportunities for improved communication did
you identify?
4. In terms of Satisfaction, is there anything we can do to
improve your satisfaction with care?
Statistical Analysis
An a priori power analyses indicated that a sample of 135
subjects would provide 80% statistical power, with alpha
set at 0.05, for a regression with three predictors if one of
the factors would account for 5% or more of the
variability in “clinician listens carefully”, and our complete
model would account for 15% of the overall variability. In
order to account for 5% incomplete responses, we
enrolled 146 patients (Table 1).
Demographics, education, work status, insurance type,
method of referral, new or return visit, PCS-4, PHQ-2,
and GAD-2 were our independent variables, and the five
communication questions and satisfaction scale were
dependent variables. First, a descriptive analysis of the
demographics, PCS-4, PHQ-2, GAD-2, overall satisfaction
and their mean, range and percentages was performed.
Answers for the five communication effectiveness
questions were dichotomized into sometimes/usually
group versus always group and the "use of models"
answers were dichotomized into "yes” versus no" due to
strong ceiling effects. Nobody chose the option “never.”
Associations between nominal with dichotomous variables
were tested using Chi-square and Fisher Exact Tests. The
association between nominal variables and satisfaction
(non-normal continuous) variable was tested by Kruskal-
Wallis test.
We used Mann-Whitney tests to measure the association
between continuous non-normal variables and
dichotomous variables. Spearman ranked correlation
coefficient was used to test correlation between non-

Communication effectiveness and satisfaction, Fatehi et al.
Patient Experience Journal, Volume 7, Issue 3 – 2020 211
Table 1. Patient and clinical characteristics
Variables
N = 146
Age in years
52 ± 16 (18-86)
Woman
56% (81)
Race/Ethnicity
White
73% (106)
Non White
27% (40)
Marital status
Married
60% (87)
Single
24% (35)
Divorced/Separated/Widowed
16% (24)
Level of education
High school or less
23% (34)
2-year college
23% (34)
4-year college
25% (37)
Post-college degree
28% (41)
Work status
Employed
63% (92)
Other (student, retired, homemaker, unable to work)
37% (54)
Insurance
Private insurance/ military
67% (98)
Medicare
21% (30)
Medicaid/No health insurance/Other
12% (18)
Patient
New
36% (53)
Return
64% (93)
Way of referral
General Practitioner
40% (58)
Own initiative
39% (57)
Other specialist
21% (31)
PHQ-2 total
0 (0-2)
GAD-2 total
0 (0-1)
PCS4-total
3 (1-7)
What did the clinician do well in terms of communication?
Excellent explanation
58% (85)
Excellent communication
25% (36)
Other
17% (25)
How did the clinician's communication compare to your expectations?
Bad
0.7% (1)
Good
20% (28)
Very good
15% (20)
Excellent
64% (87)
What opportunities for improved communication did you identify?
None
87% (127)
Longer visit duration
4% (6)
More explanation
5% (8)
Other
4% (5)
Is there anything we can do to improve your satisfaction with care?
None
87% (127)
Shorter waiting time
4% (5)
Longer visit time
3% (4)
Other
6% (10)
CQ1 (clinician listens carefully)
Sometimes/usually
10% (15)
Always
90% (131)
CQ 2 (clinician explains in an understandable way)
Sometimes/usually
9% (13)
Always
91% (133)
CQ 3 (clinician showed respect)
Usually
8% (11)
Always
92% (135)
CQ 4 (clinician spent enough time)
Sometimes/usually
12% (18)
Always
88% (128)
CQ 5 (providers use of models was helpful)
Yes definitely / somewhat
56% (83)
No/ doctor didn't use models
44% (63)
CQ 6 (rate of satisfaction 0-100)
96 (88-100)
Continuous variables as mean ± standard deviation (range) or median (interquartile range [IQR]); Discrete variables as percentage (number). PHQ-2= Patient Health
Questionnaire; GAD-2=Generalized Anxiety Disorder; PCS-4=Pain Catastrophizing Scale.

Communication effectiveness and satisfaction, Fatehi et al.
212 Patient Experience Journal, Volume 7, Issue 3 – 2020
normal continuous variables. An alpha level of 0.05 was
used to determine a statistical significance. Variables with
p < 0.1 were included in a multiple logistic regression for
binary dependent variables and linear regression for
continuous variables. We performed a factor analysis to
see if the construct of communication effectiveness and
satisfaction load on a single factor.
Results
In bivariate analysis, ratings of “clinician listens carefully”
were higher with older age, people referred by a general
practitioner, fewer symptoms of depression, and less
catastrophic thinking, and lower among people referred by
another specialist (Table Appendix A.1). Accounting for
potential confounders older age (p=0.02, OR=1.05,
SE=0.02) and referral by another specialist (p=0.048,
OR=0.17 SE=0.15) were retained in the final multivariable
model (Table 2). Because symptoms of depression and
catastrophic thinking were strongly correlated (Spearman
Rho = 0.5, p-value<0.001), we performed a sensitivity
analysis by running the model once with only depression
and again with only pain catastrophizing score and neither
of them were significant. Their influence appears to be
relatively limited.
Higher rating of "clinician explains in an understandable
way" correlates with fewer symptoms of depression in
both bivariate (p value=0.007) and multivariable regression
(p=0.01, OR=0.6 SE=0.19) (Tables Appendix A.2 and 2).
Higher rating of "clinician showed respect" correlates with
fewer symptoms of depression (p=0.007) and lower PCS-4
score (0.009) in bivariate analysis, but in logistic regression
neither factor was significant) (Tables Appendix A.3 and
2).
There were no factors associated with higher rating of
"clinician spent enough time" (Table Appendix A.4).
Higher rating of "clinician used models" was associated
with older age (p=0.026) in bivariate and also multivariable
regression (p=0.04, odds ratio=1.024 SE=0.01) (Tables
Appendix A.5 and 2).
Higher satisfaction was associated with men in bivariate
(p=0.001) and multivariable analysis (p=0.004, SE=1.37,
beta-regression coefficient=4.1) (Table Appendix A.6 and
2).
Table 2. Multivariable logistic and linear regression analysis of factors associated with the dependent variables
Dependent variable
Retained variable
Odds ratio (OR) (95% Confident
interval)
Standard
error
P value
Q 1 (clinician listen
carefully)
Age in years
1.05 (1.0 to 1.1)
0.02
0.02
Way of referral
General Practitioner
Reference value
Own initiative
0.37 (0.07 to 2.0)
0.3
0.26
Other specialist
0.17 (0.03 to 0.98)
0.15
0.048
Q 2 (clinician explains
in an understandable
way)
PHQ-2 total
0.6 (0.4 to 0.9)
0.19
0.01
Insurance status
Private insurance/ military
Reference value
Medicare
>1000
>1000
0.99
Medicaid/No health
insurance/Other
0.8 (0.2 to 3.4)
0.76
0.72
Q 3 (showed respect)
Age in years
1.0 (1.0 to 1.1)
0.02
0.13
PHQ-2 total
0.8 (0.5 to 1.2)
0.24
0.23
PCS4-total
0.9 (0.8 to 1.1)
0.09
0.17
Q 5 (use of models was
helpful)
Age in years
1.01 (1.0 to 1.1)
0.01
0.04
PHQ-2 total
0.8 (0.6 to 1.1)
0.13
0.11
Communication effectiveness and satisfaction, Fatehi et al.
Patient Experience Journal, Volume 7, Issue 3 – 2020 213
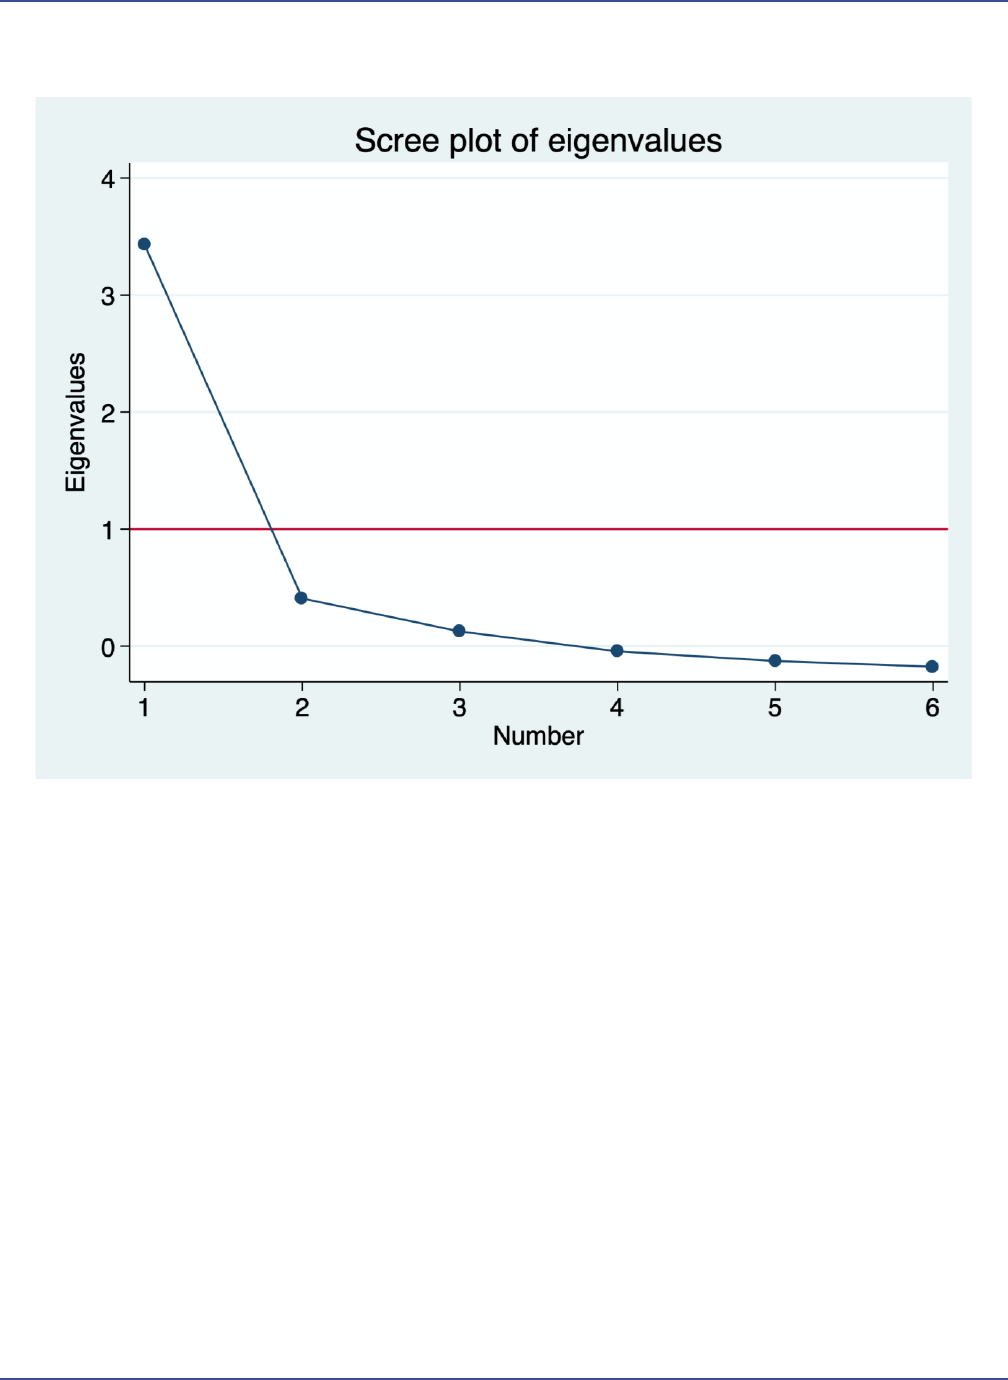
In Factor analysis, the scree plot of eigenvalues shows that
the 5 communication questions and satisfaction question
form one single factor (Figure 1).
Verbatim responses to the question about what the
clinician did well included “good explanation” (54%),
“listened” (9.6%), “clear” (6.8%), and “made me feel
comfortable” (6.2%). Regarding met expectations,
opportunities for improvement, and “how can we
improve”, there were just a few comments such as “slow
down”, “less rushed”, and “written instructions”. One
clearly dissatisfied patient answered all questions indicating
they just wanted a specific test ordered (Table1).
Discussion
Effective communication strategies are associated with
satisfaction, adherence to care and outcomes in prior
studies. A better understanding of the key aspects of
communication that contribute to patient experience could
inform efforts to improve. This study attempted to
discern the personal and illness factors associated with
patient experience of effective communication measured
by the CG-CAHPS questionnaire.
This study can be considered in the context of its
limitations. The small number of people that declined
participation might be part of the small and important
group with less satisfaction, which might influence the
results. The external validity for this study is limited
because we enrolled English-speaking patients with
musculoskeletal illness, visiting male, white orthopedic
surgeons. In our opinion, the findings may generalize to
other types of specialty care. There is evidence that
clinician gender, ethnicity, and specialty and patient
language and race affect satisfaction.
13,14
One might expect
communication effectiveness to increase with return visits
because the patient-clinician relationship is better
established, but we didn’t find such a relationship. Another
limitation was that the order of questionnaire completion
was not randomized. In addition, the total length of
questionnaires, and the similarities of some of the
questions might contribute to survey fatigue that might
have affected the results. There is also a potential for
inflated correlations since all the data was gathered using
Figure 1: The scree plot of eigenvalues for the 5 communication questions and the satisfaction question

Communication effectiveness and satisfaction, Fatehi et al.
214 Patient Experience Journal, Volume 7, Issue 3 – 2020
REDCap surveys on a tablet (common method variance).
We design our studies to limit this and given the length of
our survey (approximately 7-10 minutes), we think there
was limited fatigue. Prior studies showed no difference
between paper and web-based tablet for most of the
questionnaires we use.
15,16
Given the evidence that people
answer mental health questions differently on tablet-based
surveys,
17,18
we anticipate limited influence of it. As a
survey study, common source bias is possible, but we have
tried to decrease its impact by collecting responses
anonymously.
The observation that age, referral source, symptoms of
depression, and catastrophic thinking correlated with
“clinician listens carefully” in bivariate analysis is
consistent with prior evidence that experience measures
are determined in part by personal factors.
19–23
The
observation that only age and referral by another specialist
were included in the logistic regression analyses is difficult
to interpret. These results are similar to other reports that
show that age correlates with patient ratings of the extent
to which the doctor listened to them.
21
Older age
correlates with higher satisfaction in some
21,24
but not all
studies.
25
The observation that patients referred by other
specialists rated clinicians lower in listening might be due
the complexity of their problem or perhaps due to
frustration with persistent troubling symptoms which
motivated them to see another specialist.
The observation that fewer symptoms of depression were
correlated with higher ratings of “clinician explains in an
understandable way” might reflect the relationship of
concentration and mood. There is also evidence that
greater symptoms of depression are associated with less
alignment of patient and clinician understanding of the
illness, which can make an explanation feel less
understandable. These findings are similar to other studies
that found that symptoms of depression correlated with
“clinician listens carefully”
26
and more satisfaction in
patients with better subjective health
21,27,28
and better
functional status.
24
The observation that symptoms of depression and
catastrophic thinking correlated with “clinician showed
respect” in bivariate analysis is consistent with prior
studies finding a link between cognitive error
(misconception) and feeling less respect.
21,23,26
Neither
factor was retained the logistic regression analyses which is
consistent with prior studies that had difficulty identifying
factors independently and notably correlated with
experience measures.
19,20
Experience measures correlate
highly with one another, but not as strongly with illness
and personal factors.
The observation that age was correlated with “provider
use of models was helpful” suggests that older patients
appreciate the use of models and other educational
measures more than younger patients. In another study,
using models didn’t show any association with perceived
empathy. The duration of the visit was longer when using
a model.
29
The observation that male sex correlated with higher
overall satisfaction seems spurious. The results across
studies are inconsistent and a meta-analysis
22
found no link
between gender and patient experience.
The themes identified in the text responses (good
explanation, listened, clear, and made me feel comfortable,
less rushed, written instructions) reflect a healthy
relationship and effective communication. In the verbatim
questions good explanation was the most significant
satisfactory aspect of communication for patients which
was similar to another cross-sectional study of 1100
patients with diabetes using a qualitative analysis of 180
verbatim comments about doctor-patient interactions
which showed that patients feel that doctors don’t explain
in details had a significant association with satisfaction.
30
The observation that in factor analysis communication
questions and satisfaction scale formed a single factor
suggests that they may be measuring a single underlying
construct. Future studies should plan for the high
intercorrelation of experience measures. One experience
measure should not be used to account for variation in
another. A conceptual distinction between distinct
patients reported experience measures (PREMs) such as
communication effectiveness, perceived empathy, and
satisfaction may prove unhelpful.
31
Instead, it may be
possible to ask just one or two questions that assess the
quality of the patient-clinician relationship that can direct
the improvement efforts of care units to establish better
relationships and improve patient experience.
Conclusion
The observation that symptoms of depression have some
correlation with lower patient ratings of their care
experience directs us to develop strategies to anticipate
and ameliorate this. Training of clinicians to anticipate and
train for the interaction of mental health and physical
symptoms in speciality care has the potential to improve
patient experience. The observation that communication
effectiveness and satisfaction measures load onto a single
factor suggests that they measure a single underlying
construct that—based on other similar studies—we feel
can be conceptualized as “relationship,” reaffirming that
building trust and taking a genuine interesting people are
key aspects of the patient experience.

Communication effectiveness and satisfaction, Fatehi et al.
Patient Experience Journal, Volume 7, Issue 3 – 2020 215
References
1. Haskard Zolnierek KB, DiMatteo MR. Physician
Communication and Patient Adherence to Treatment:
A Meta-analysis. Med Care. 2009;47(8):826-834.
doi:10.1097/MLR.0b013e31819a5acc
2. Ha JF, Longnecker N. Doctor-Patient
Communication: A Review. Ochsner J. 2010;10(1):38-
43.
3. Clever SL, Jin L, Levinson W, Meltzer DO. Does
doctor-patient communication affect patient
satisfaction with hospital care? Results of an analysis
with a novel instrumental variable. Health Serv Res.
2008;43(5 Pt 1):1505-1519. doi:10.1111/j.1475-
6773.2008.00849.x
4. Ranjan P, Kumari A, Chakrawarty A. How can
Doctors Improve their Communication Skills? J Clin
Diagn Res JCDR. 2015;9(3):JE01-04.
doi:10.7860/JCDR/2015/12072.5712
5. van Osch M, van Dulmen S, van Vliet L, Bensing J.
Specifying the effects of physician’s communication
on patients’ outcomes: A randomised controlled trial.
Patient Educ Couns. 2017;100(8):1482-1489.
doi:10.1016/j.pec.2017.03.009
6. Locke MC, Wilkerson EC, Mistur RL, Nisar M, Love
WE. 2015 Arte Poster Competition First Place
Winner: Assessing the Correlation Between Patient
Anxiety and Satisfaction for Mohs Surgery. J Drugs
Dermatol JDD. 2015;14(9):1070-1072.
7. Takayama T, Yamazaki Y, Katsumata N. Relationship
between outpatients’ perceptions of physicians’
communication styles and patients’ anxiety levels in a
Japanese oncology setting. Soc Sci Med 1982.
2001;53(10):1335-1350. doi:10.1016/s0277-
9536(00)00413-5
8. Verheul W, Sanders A, Bensing J. The effects of
physicians’ affect-oriented communication style and
raising expectations on analogue patients’ anxiety,
affect and expectancies. Patient Educ Couns.
2010;80(3):300-306. doi:10.1016/j.pec.2010.06.017
9. Graugaard PK, Eide H, Finset A. Interaction analysis
of physician-patient communication: the influence of
trait anxiety on communication and outcome. Patient
Educ Couns. 2003;49(2):149-156. doi:10.1016/s0738-
3991(02)00074-5
10. Huizinga MM, Bleich SN, Beach MC, Clark JM,
Cooper LA. Disparity in Physician Perception of
Patients’ Adherence to Medications by Obesity Status.
Obes Silver Spring Md. 2010;18(10):1932-1937.
doi:10.1038/oby.2010.35
11. Abu Al Hamayel N, Brooks J, Wang H, et al. Patient
Satisfaction of Care in the Treatment of Vaso-
Occlusive Crises: A Comparison of Emergency
Department and Infusion Centers in the Escaped
Study. Blood. 2018;132(Supplement 1):314-314.
doi:10.1182/blood-2018-99-111544
12. AlBahri AF, Arora T, Omar OM, Taheri S. Electronic
Device Use and Academic Performance in
Adolescents. Pediatrics. 2018;141(1
MeetingAbstract):230-230.
doi:10.1542/peds.141.1_MeetingAbstract.230
13. Renouf T, Alani S, Whalen D, et al. City mouse,
country mouse: a mixed-methods evaluation of
perceived communication barriers between rural
family physicians and urban consultants in
Newfoundland and Labrador, Canada. BMJ Open.
2016;6(5):e010153. doi:10.1136/bmjopen-2015-
010153
14. Menendez ME, Loeffler M, Ring D. Patient
Satisfaction in an Outpatient Hand Surgery Office: A
Comparison of English- and Spanish-Speaking
Patients. Qual Manag Health Care. 2015;24(4):183-189.
doi:10.1097/QMH.0000000000000074
15. Hohwü L, Lyshol H, Gissler M, Jonsson SH, Petzold
M, Obel C. Web-Based Versus Traditional Paper
Questionnaires: A Mixed-Mode Survey With a Nordic
Perspective. J Med Internet Res. 2013;15(8).
doi:10.2196/jmir.2595
16. Fanning J, McAuley E. A Comparison of Tablet
Computer and Paper-Based Questionnaires in
Healthy Aging Research. JMIR Res Protoc. 2014;3(3).
doi:10.2196/resprot.3291
17. Guattery JM, Dardas AZ, Kelly M, Chamberlain A,
McAndrew C, Calfee RP. Floor Effect of PROMIS
Depression CAT Associated With Hasty Completion
in Orthopaedic Surgery Patients. Clin Orthop.
2018;476(4):696-703.
doi:10.1007/s11999.0000000000000076
18. Bernstein DN, Atkinson J, Fear K, et al. Determining
the Generalizability of the PROMIS Depression
Domain’s Floor Effect and Completion Time in
Patients Undergoing Orthopaedic Surgery. Clin
Orthop. 2019;477(10):2215-2225.
doi:10.1097/CORR.0000000000000782
19. Epstein AM, Taylor WC, Seage GR. Effects of
patients’ socioeconomic status and physicians’ training
and practice on patient-doctor communication. Am J
Med. 1985;78(1):101-106. doi:10.1016/0002-
9343(85)90469-3
20. White-Means SI, Osmani AR. Racial and Ethnic
Disparities in Patient-Provider Communication With
Breast Cancer Patients: Evidence From 2011 MEPS
and Experiences With Cancer Supplement. Inq J Med
Care Organ Provis Financ. 2017;54:46958017727104.
doi:10.1177/0046958017727104
21. Moore PJ, Sickel AE, Malat J, Williams D, Jackson J,
Adler NE. Psychosocial factors in medical and
psychological treatment avoidance: the role of the
doctor-patient relationship. J Health Psychol.
2004;9(3):421-433. doi:10.1177/1359105304042351
22. Hall JA, Dornan MC. Patient sociodemographic
characteristics as predictors of satisfaction with
medical care: a meta-analysis. Soc Sci Med 1982.

Communication effectiveness and satisfaction, Fatehi et al.
216 Patient Experience Journal, Volume 7, Issue 3 – 2020
1990;30(7):811-818. doi:10.1016/0277-
9536(90)90205-7
23. Fatehi A, Gonzalez A, Ring DC, Queralt M.
Psychosocial Factors Are Associated with Electronic
Portal Registration. Clin Orthop. Published online April
21, 2020. doi:10.1097/CORR.0000000000001278
24. Jackson JL, Chamberlin J, Kroenke K. Predictors of
patient satisfaction. Soc Sci Med 1982. 2001;52(4):609-
620. doi:10.1016/s0277-9536(00)00164-7
25. McFarland DC, Johnson Shen M, Holcombe RF.
Predictors of Satisfaction With Doctor and Nurse
Communication: A National Study. Health Commun.
2017;32(10):1217-1224.
doi:10.1080/10410236.2016.1215001
26. Vranceanu A-M, Ring D. Factors associated with
patient satisfaction. J Hand Surg. 2011;36(9):1504-
1508. doi:10.1016/j.jhsa.2011.06.001
27. Rahmqvist M. Patient satisfaction in relation to age,
health status and other background factors: a model
for comparisons of care units. Int J Qual Health Care J
Int Soc Qual Health Care. 2001;13(5):385-390.
doi:10.1093/intqhc/13.5.385
28. Nguyen Thi PL, Briançon S, Empereur F, Guillemin
F. Factors determining inpatient satisfaction with care.
Soc Sci Med 1982. 2002;54(4):493-504.
doi:10.1016/s0277-9536(01)00045-4
29. Portalatín EL, Carrazana LF, Colon R, Abreu R,
Rivera D, Lojo L. Orthopaedic Surgeon
Communication Skills: Perception of Empathy and
Patient Satisfaction Through the Use of Anatomic
Models. J Am Acad Orthop Surg Glob Res Rev.
2018;2(11):e071. doi:10.5435/JAAOSGlobal-D-18-
00071
30. Jalil A, Zakar R, Zakar MZ, Fischer F. Patient
satisfaction with doctor-patient interactions: a mixed
methods study among diabetes mellitus patients in
Pakistan. BMC Health Serv Res. 2017;17(1):155.
doi:10.1186/s12913-017-2094-6
31. LaVela SL, Gallan AS. Evaluation and measurement
of patient experience. Patient Exp J. 2014;1(1):28-36.
doi: 10.35680/2372-0247.1003
:11.

Communication effectiveness and satisfaction, Fatehi et al.
Patient Experience Journal, Volume 7, Issue 3 – 2020 217
Appendix
Table A.1. Bivariate analysis of communication satisfaction question 1
Clinician
Q1 (listens carefully)
Sometimes/
usually
Always
p value
Age in years
41 ± 12
53 ± 16
<0.01
Sex
Woman
9
56
Man
6
75
0.27
Race/Ethnicity
White
10
96
Non White
5
35
0.55
Marital status
Married
7
80
Single
5
30
Divorced/Separated/Widowed
3
21
0.44
Level of education
High school or less
1
33
2-year college
2
32
4-year college
5
32
Post-college degree
7
34
0.15
Work status
Employed
10
82
Other (student, retired, homemaker, unable to work)
5
49
0.76
Insurance
Private insurance/ military
11
87
Medicare
1
29
0.26
Medicaid/No health insurance/Other
3
15
Patient
New
6
47
0.75
Return
9
84
Referral
General practitioner
2
56
Own initiative
7
50
0.03
Other specialist
6
25
PHQ-2 total
2 (0-3)
0 (0-1)
0.03
GAD-2 total
0 (0-2)
0 (0-1)
0.65
PCS4-total
5 (3-11)
3 (0-7)
0.04
PHQ-2=Patient Health Questionnaire, GAD-2=Generalized Anxiety Disorder; PCS-4=Pain Catastrophizing Scale.

Communication effectiveness and satisfaction, Fatehi et al.
218 Patient Experience Journal, Volume 7, Issue 3 – 2020
Appendix (cont’d.)
Table A.2. Bivariate analysis of communication satisfaction question 2
Clinician
Q2 (explains in an understandable way)
Sometimes/ usually
Always
p value
Age in years
45 ± 14
52 ± 16
0.12
Sex
Woman
6
59
Man
7
74
0.90
Race/Ethnicity
White
9
97
Non White
4
36
0.75
Marital status
Married
7
80
Single
3
32
Divorced/Separated/Widowed
3
21
0.72
Level of education
High school or less
1
33
2-year college
2
32
4-year college
3
34
Post-college degree
7
34
0.20
Work status
Employed
9
83
Other (student, retired, homemaker, unable to work)
4
50
0.77
Insurance
Private insurance/ military
10
88
Medicare
0
30
0.07
Medicaid/No health insurance/Other
3
15
Patient
New
5
48
Return
8
85
0.86
Referral
General practitioner
5
53
Own initiative
3
54
0.23
Other specialist
5
26
PHQ-2 total
2 (0-3)
0 (0-1)
<0.01
GAD-2 total
0 (0-2)
0 (0-1)
0.42
PCS4-total
4 (2-10)
3 (0-7)
0.27
PHQ-2= Patient Health Questionnaire; GAD-2=Generalized Anxiety Disorder; PCS-4=Pain Catastrophizing Scale.

Communication effectiveness and satisfaction, Fatehi et al.
Patient Experience Journal, Volume 7, Issue 3 – 2020 219
Appendix A (cont’d.)
Table A.3. Bivariate analysis of communication satisfaction question 3
Clinician
Q 3 (showed respect)
Usually
Always
p value
Age in years
44 ± 13
52 ± 16
0.08
Sex
Woman
6
59
Man
5
76
0.54
Race/Ethnicity
White
9
97
Non White
2
38
0.73
Marital status
Married
6
81
Single
3
32
Divorced/Separated/Widowed
2
22
0.83
Level of education
High school or less
1
33
2-year college
2
32
4-year college
3
34
Post-college degree
5
36
0.56
Work status
Employed
7
85
Other (student, retired, homemaker, unable to work)
4
50
0.96
Insurance
Private insurance/ military
7
91
Medicare
1
29
0.23
Medicaid/No health insurance/Other
3
15
Patient
New
5
48
Return
6
87
0.53
Referral
General practitioner
2
56
Own initiative
4
53
0.10
Other specialist
5
26
PHQ-2 total
2 (0-3)
0 (0-1)
<0.01
GAD-2 total
1 (0-2)
0 (0-1)
0.16
PCS4-total
5 (3-11)
3 (0-7)
<0.01
PHQ-2= Patient Health Questionnaire; GAD-2=Generalized Anxiety Disorder; PCS-4=Pain Catastrophizing Scale.

Communication effectiveness and satisfaction, Fatehi et al.
220 Patient Experience Journal, Volume 7, Issue 3 – 2020
Appendix (cont’d.)
Table A.4. Bivariate analysis of communication satisfaction question 4
Clinician
Q 4 (spent enough time)
Sometimes/ usually
Always
p value
Age in years
48 ± 15
52 ± 16
0.37
Sex
Woman
10
55
Man
8
73
0.32
Race/Ethnicity
White
11
95
Non White
7
33
0.26
Marital status
Married
11
76
Single
5
30
Divorced/Separated/Widowed
2
22
0.83
Level of education
High school or less
2
32
2-year college
2
32
4-year college
5
32
Post-college degree
9
32
0.13
Work status
Employed
12
80
Other (student, retired, homemaker, unable to work)
6
48
0.80
Insurance
Private insurance/ military
12
86
Medicare
3
27
0.86
Medicaid/No health insurance/Other
3
15
Patient
New
8
45
Return
10
83
0.44
Referral
General practitioner
5
53
Own initiative
8
49
0.47
Other specialist
5
26
PHQ-2 total
1 (0-3)
0 (0-2)
0.14
GAD-2 total
0 (0-1)
0 (0-1)
0.51
PCS4-total
4 (3-9)
3 (0-7)
0.23
PHQ-2= Patient Health Questionnaire; GAD-2=Generalized Anxiety Disorder; PCS-4=Pain Catastrophizing Scale.

Communication effectiveness and satisfaction, Fatehi et al.
Patient Experience Journal, Volume 7, Issue 3 – 2020 221
Appendix (cont’d.)
Table A.5. Bivariate analysis of communication satisfaction question 5
Clinician
Q 5 (use of models was helpful)
Yes definitely/
somewhat
No/
doctor
didn't use
models
p value
Age in years
49 ± 16
55 ± 14
0.02
Sex
Woman
38
27
Man
45
36
0.74
Race/Ethnicity
White
63
43
Non White
20
20
0.35
Marital status
Married
46
41
Single
21
14
Divorced/Separated/Widowed
16
8
0.44
Level of education
High school or less
20
14
2-year college
20
14
4-year college
19
18
Post-college degree
24
17
0.89
Work status
Employed
54
38
Other (student, retired, homemaker, unable to work)
29
25
0.61
Insurance
Private insurance/ military
58
40
Medicare
13
17
Medicaid/No health insurance/Other
12
6
0.21
Patient
New
31
22
Return
55
38
0.93
Referral
General practitioner
32
26
Own initiative
32
25
Other specialist
19
12
0.85
PHQ-2 total
0 (0-2)
0 (0-1)
0.06
GAD-2 total
0 (0-1)
0 (0-1)
0.58
PCS4-total
4 (3-9)
3 (0-7)
0.38
PHQ-2= Patient Health Questionnaire; GAD-2=Generalized Anxiety Disorder; PCS-4=Pain Catastrophizing Scale.

Communication effectiveness and satisfaction, Fatehi et al.
222 Patient Experience Journal, Volume 7, Issue 3 – 2020
Appendix ((cont’d.)
Table A.6. Bivariate analysis of factors associated with satisfaction scale
Clinician
Q 6 (rate satisfaction 0-100)
p value
Age in years
r= 0.08
0.37
Sex
Woman
93 (87-97)
Man
97 (93-100)
0.001
Race/Ethnicity
White
96 (90-100)
Non White
95 (86-100)
0.38
Marital status
Married
96 (89-100)
Single
96 (87-100)
0.44
Divorced/Separated/Widowed
94 (90-97)
Level of education
High school or less
96 (90-100)
2-year college
96 (92-100)
4-year college
95 (88-100)
Post-college degree
95 (88-100)
0.89
Work status
Employed
96 (87-100)
Other (student, retired, homemaker, unable to work)
96 (92-100)
0.45
Insurance
Private insurance/ military
95 (87-100)
Medicare
96 (92-100)
0.33
Medicaid/No health insurance/Other
97 (92-100)
Patient
New
95 (85-100)
Return
96 (92-100)
0.14
Referral
General practitioner
96 (90-100)
Own initiative
96 (88-100)
0.74
Other specialist
94 (85-100)
PHQ-2 total
r= 0.02
0.85
GAD-2 total
r=0.02
0.80
PCS4-total
r= 0.02
0.79
CQ1 (listens carefully)
r= 0.53
<0.01
CQ 2 (explains in an understandable way)
r= 0.41
<0.01
CQ 3 (showed respect)
r= 0.53
<0.01
CQ 4 (spent enough time)
r= 0.50
<0.01
CQ 5 (use of models was helpful)
r= -0.13
0.10
