Life Cycle Analysis of Paper Products
1
Dr. Richard A. Venditti
Department of Forest Biomaterials
North Carolina State University
Raleigh, NC 27695-8005
Richard Venditti, Professor, Sabbatical Leave Jan-July 2011, Duke University, Center on
Global Change, Room 109 Phytotron, Duke email: rav16@duke.edu, office 919 681
7180, cell 919 649-4017
Permanent Address: Dept of Forest Biomaterials, North Carolina State University,
Biltmore Hall Rm 1204, 2820 Faucette Drive, Raleigh NC 27695-8005, (919) 515-6185,
richard_ve[email protected], website: go.ncsu.edu/venditti

Outline
• Introduction to LCA
• LCA of Paper
• North American Printing and Writing Grade LCA’s
• Allocation methods in LCA’s
• Recommendations
2

Sustainability?
• How do we supply societies needs without harming the
environment or future generations’ ability to meet their
needs?
– People – Planet - Profit
• We have many options to meet our demands.
• How to choose the “best” option?
• Life cycle assessment (LCA) helps to inform our choices.
• LCA has objective and subjective parts!!!
3

What is a Life Cycle Assessment ?
Life Cycle Assessment (LCA) is a tool to assess the potential
environmental impacts of products, systems, or services at all stages
in their life cycle [ISO 14001:2004].
Types of LCA
•Cradle to Gate: raw materials to finished good (no use or end
life considerations)
•Cradle to Grave: Considers everything from harvesting
materials to the disposal of the finished goods
4

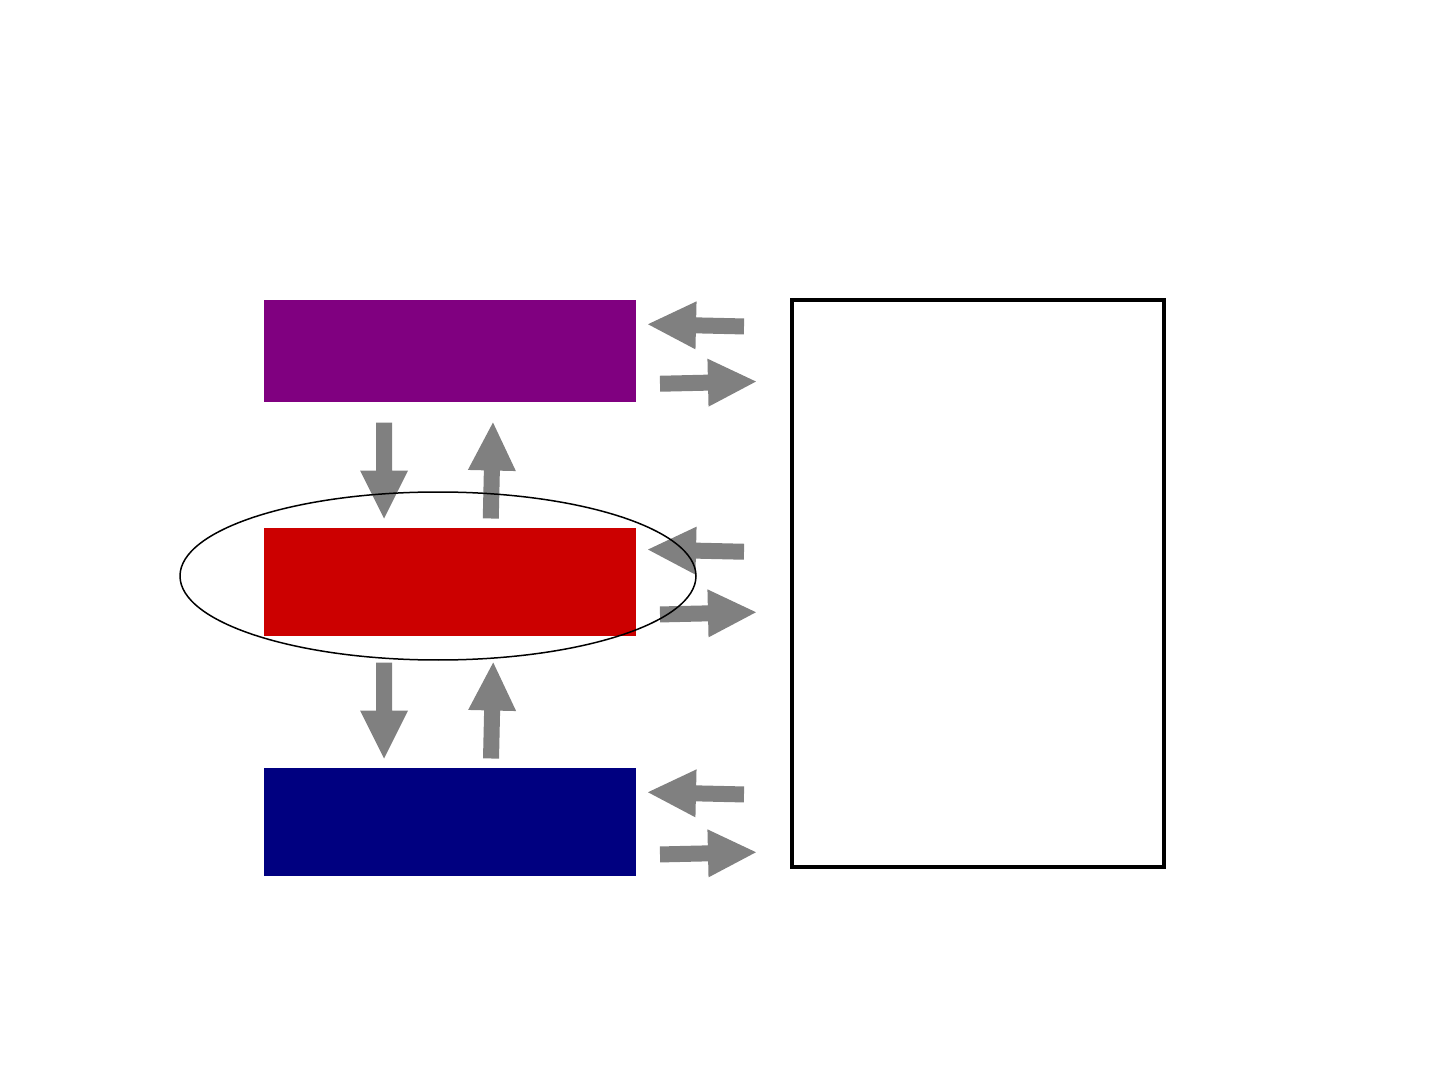
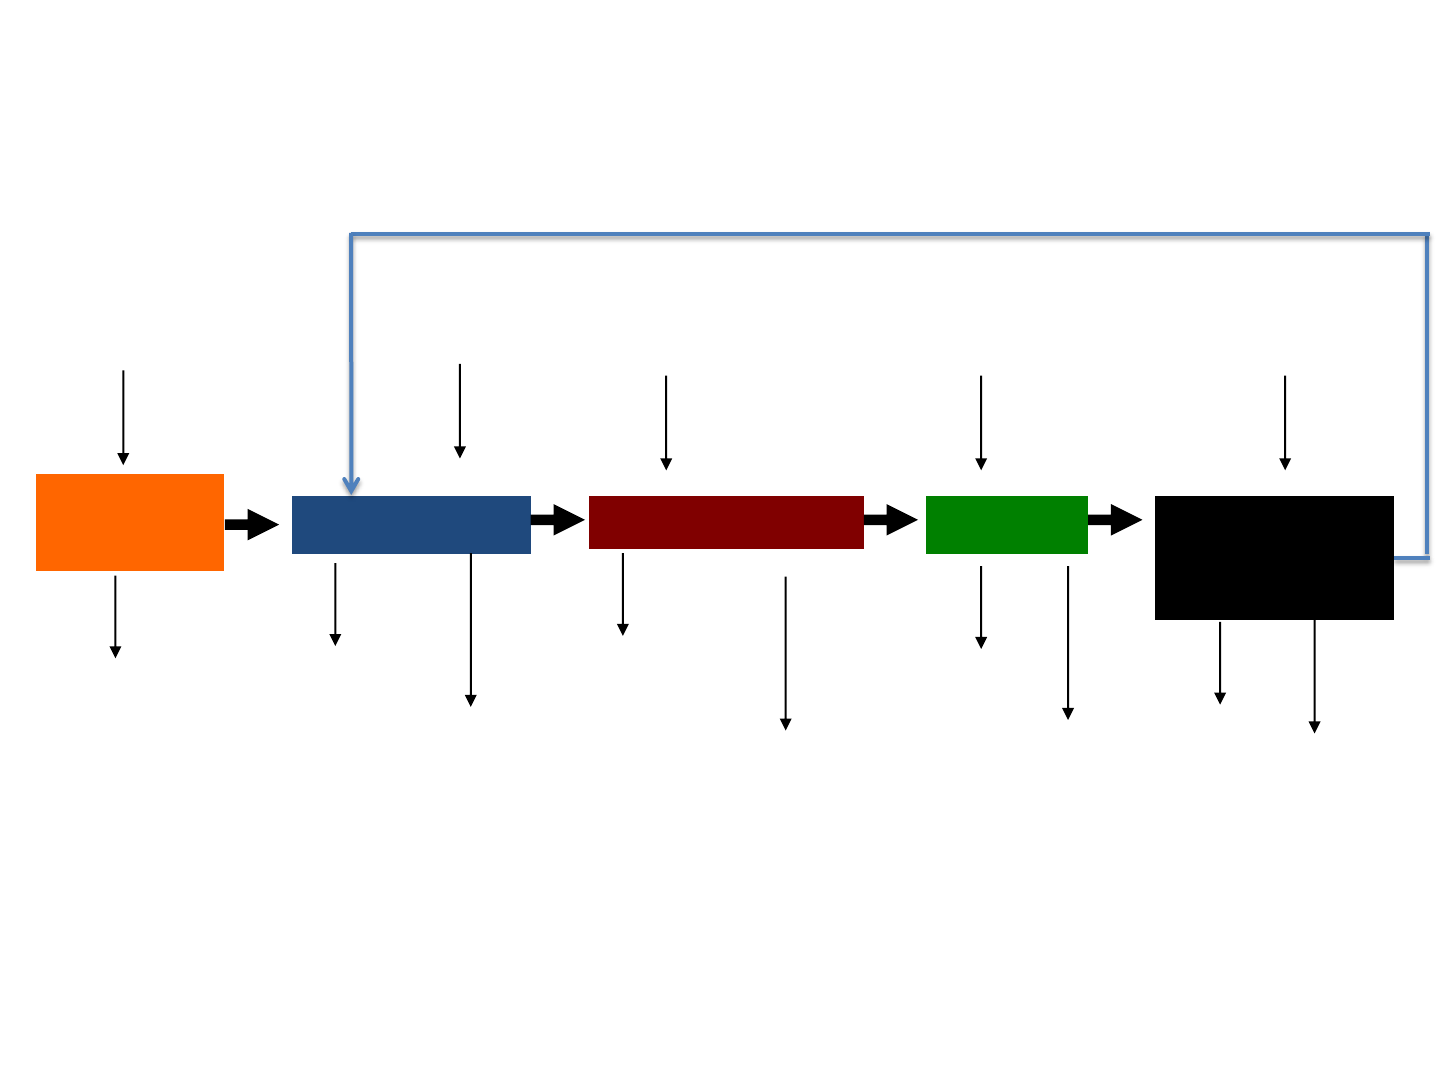
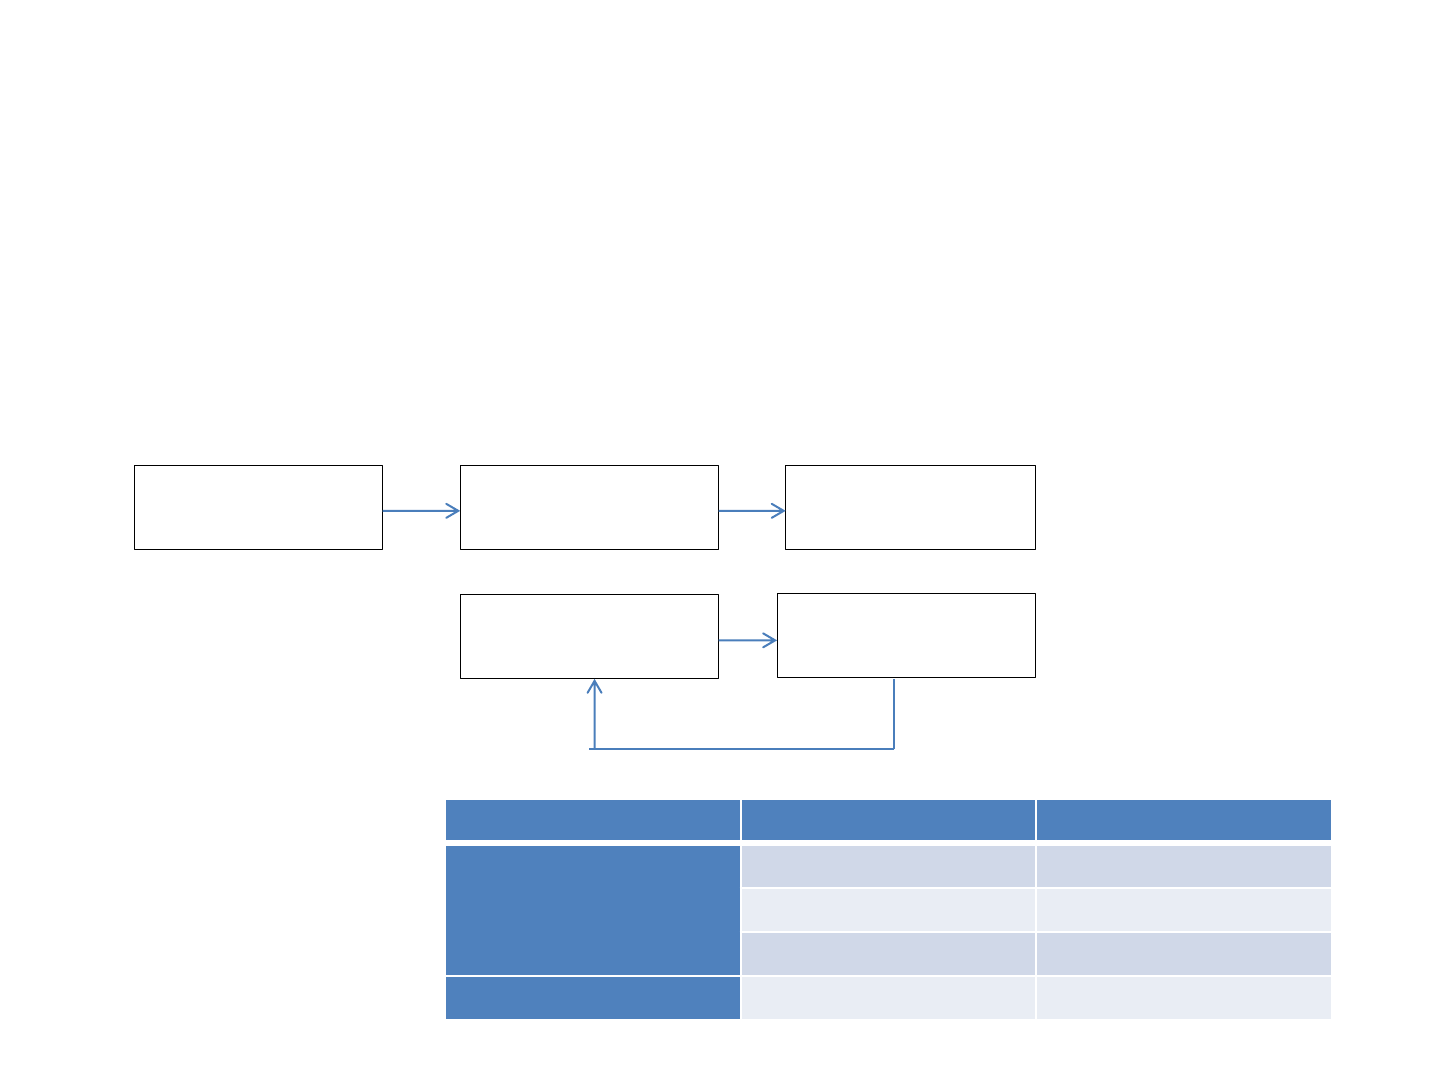
Example LCA Process
5
Production
Transportation
Use Disposal
Recycle
Energy
Energy Energy Energy
Waste
Waste
Waste
Waste
Emissions to
air and water
Emissions to
air and water
Emissions to
air and water
Emissions to
air and water
Recycled Materials
Raw
Materials
Energy
Waste
Why is an LCA Important?
• Helps ensure compliance with government regulations
• Helps decrease the environmental impact of a given product
- Identifies ways to improve sustainability
- Identifies ways to “green” all aspects of product’s life
• Can reshape company strategy
• Can help marketing
- Can reshape company image
- Develop product advantage of competition
6

Important Aspects of Life Cycle
Assessment
Interpretation
Impact Assessment
Inventory Analysis
Goal and Scope
Definition
7

Defining Goals
• Should state the intent of the study
– Intended application
– Intended use
– Intended audience
• Should also include reason for the study
8
Defining Scope
• Define functional unit of product
– Example: 100 disposable paper cups vs 1 glass container washed 99 times
• Help establish system boundaries for the LCA
• Determine data collection methods
9
Important Aspects of Life Cycle
Assessment
Interpretation
Impact Assessment
Inventory Analysis
Goal and Scope
Definition
10

Inventory Analysis:
• Definition of the process (flowsheet)
• Definition of all mass and energy inputs to
the process
11
Inventory Analysis: What Needs to be Included?
• All relevant stages of the life of a product
12
Production
Transportation
Use Disposal
Recycle
Energy
Energy Energy Energy
Waste
Waste
Waste
Waste
Emissions to
air and water
Emissions to
air and water
Emissions to
air and water
Emissions to
air and water
Recycled Materials
Raw
Materials
Energy
Waste

Inventory Analysis:
• Foreground data – data specific to the model at hand
• Background data – generic data that can be found in available
databases (examples, generic transportation or electricity)
• Tracking of who is in control of consumption/emissions:
– Scope 1: owned production
– Scope 2: purchased energy sources, like electricity
– Scope 3: non-owned operations such as raw materials production,
transportation in non owned vehicles, or non-owned operations
13
Inventory Analysis:
Example
• Example product: copy paper
• Raw Materials
– Wood, water, various chemicals, energy
– Chemical and Energy Recovery
• Manufacturing
– Machinery, processes, packaging material
• Transportation and Distribution
– Storage of paper in warehouses, selling of it via wholesalers/retailers
• Use
– Products associated with the use of copy paper
• Disposal
– Waste products, Recycling, landfilling
– Energy recovery
14

Important Aspects of Life Cycle
Assessment
Interpretation
Impact Assessment
Inventory Analysis
Goal and Scope
Definition
15
Impact Assessment
16
Definition:
Impact assessment is the process of identifying the future
consequences of a current or proposed action. (cbd.int/impact)
It is used to ensure that projects, programs and policies are
economically viable, socially equitable and environmentally
sustainable. (cbd.int/impact)
Developed with target audience in mind.
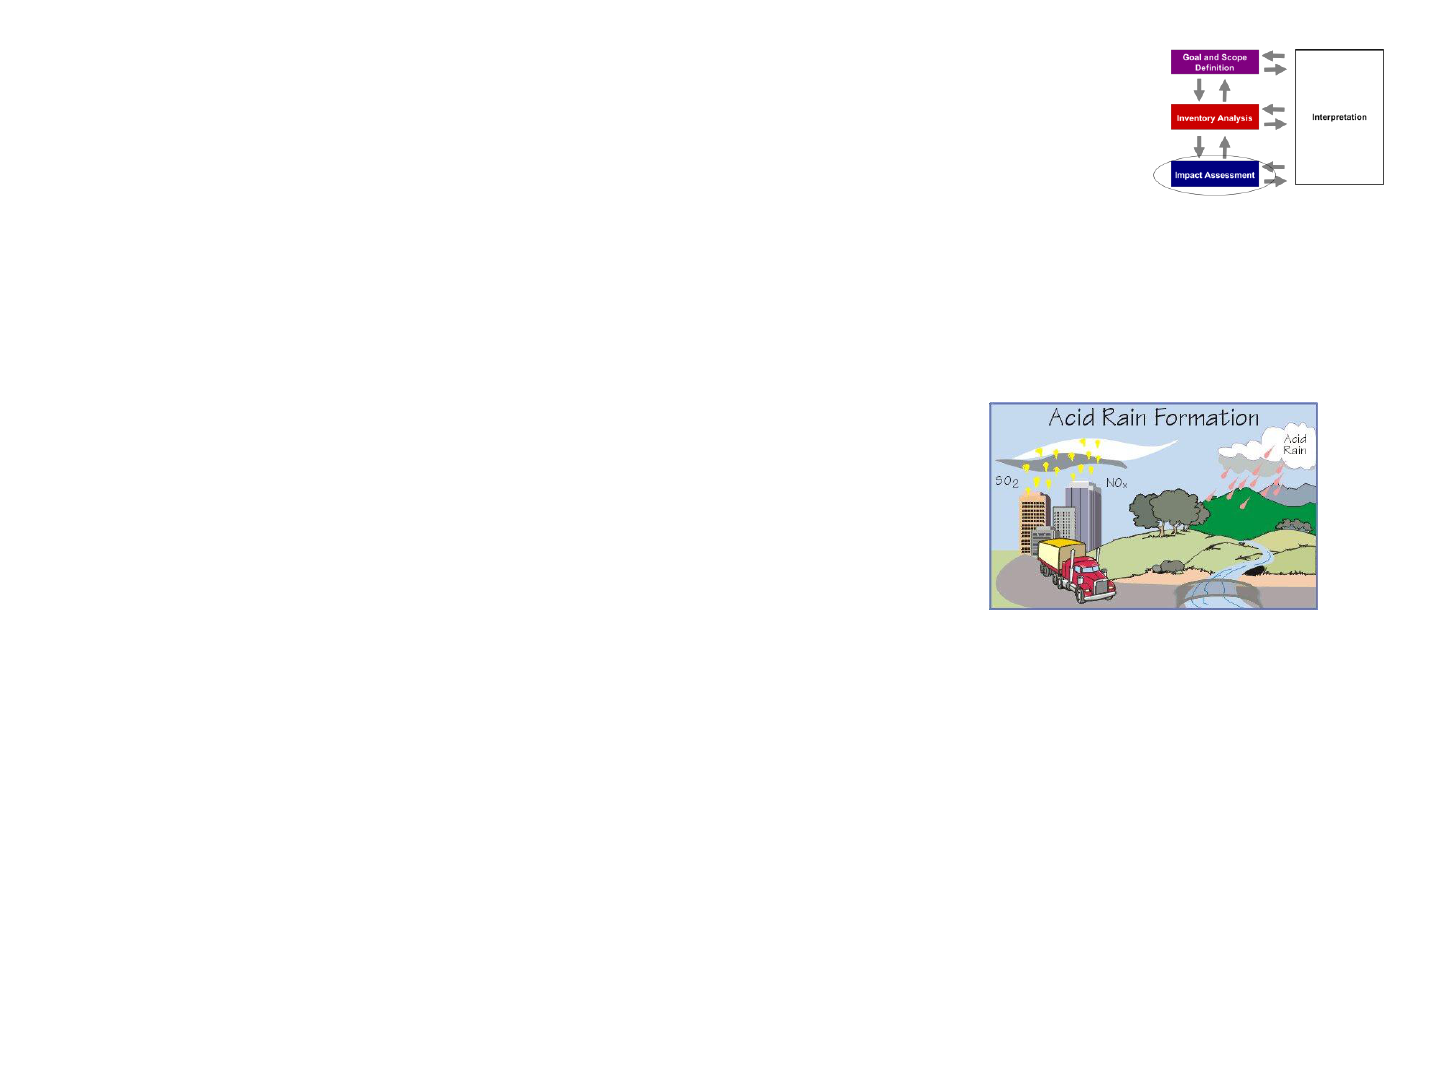
Example: Environmental Indices
for given impact categories
17
1. I
GW
– global warming
2. I
SF
– smog formation
3. I
OD
– ozone depletion
4. I
AR
– acid rain
5. I
INH
– human inhalation
6. I
ING
– ingestion toxicity
7. I
CINH
-human carcinogenic inhalation
8. I
CING
– carcinogenic ingestion toxicity
9. I
FT
– fish toxicity

Impact Assessment: ISO Standard
• Characterization factors: determine the relative
contribution of an LCI output to the impact category
• For instance, 1 kg CH4 contributes to global warming 26
times 1 kg of CO2
• If, characterization factor for CO2 =1
• Then, characterization factor for CH4 =26
• From the inventory analysis,
– GWP = 1* kg CO2 + 26*kg CH4
18
Carbon Footprint:
Impact Assessment Method
• Partial life cycle analysis
• A picture of the overall greenhouse gas impact (not
just CO2) of a product over its lifecycle (cradle-to-
grave).
• Reports the net amount of GHG’s for a defined
process, in units of kgCO2(equiv)/basis
19
Revision Year CO
2
equivalents for CH
4
CO
2
equivalents for N
2
O
1996 21 310
2001 23 296
2006 25 298
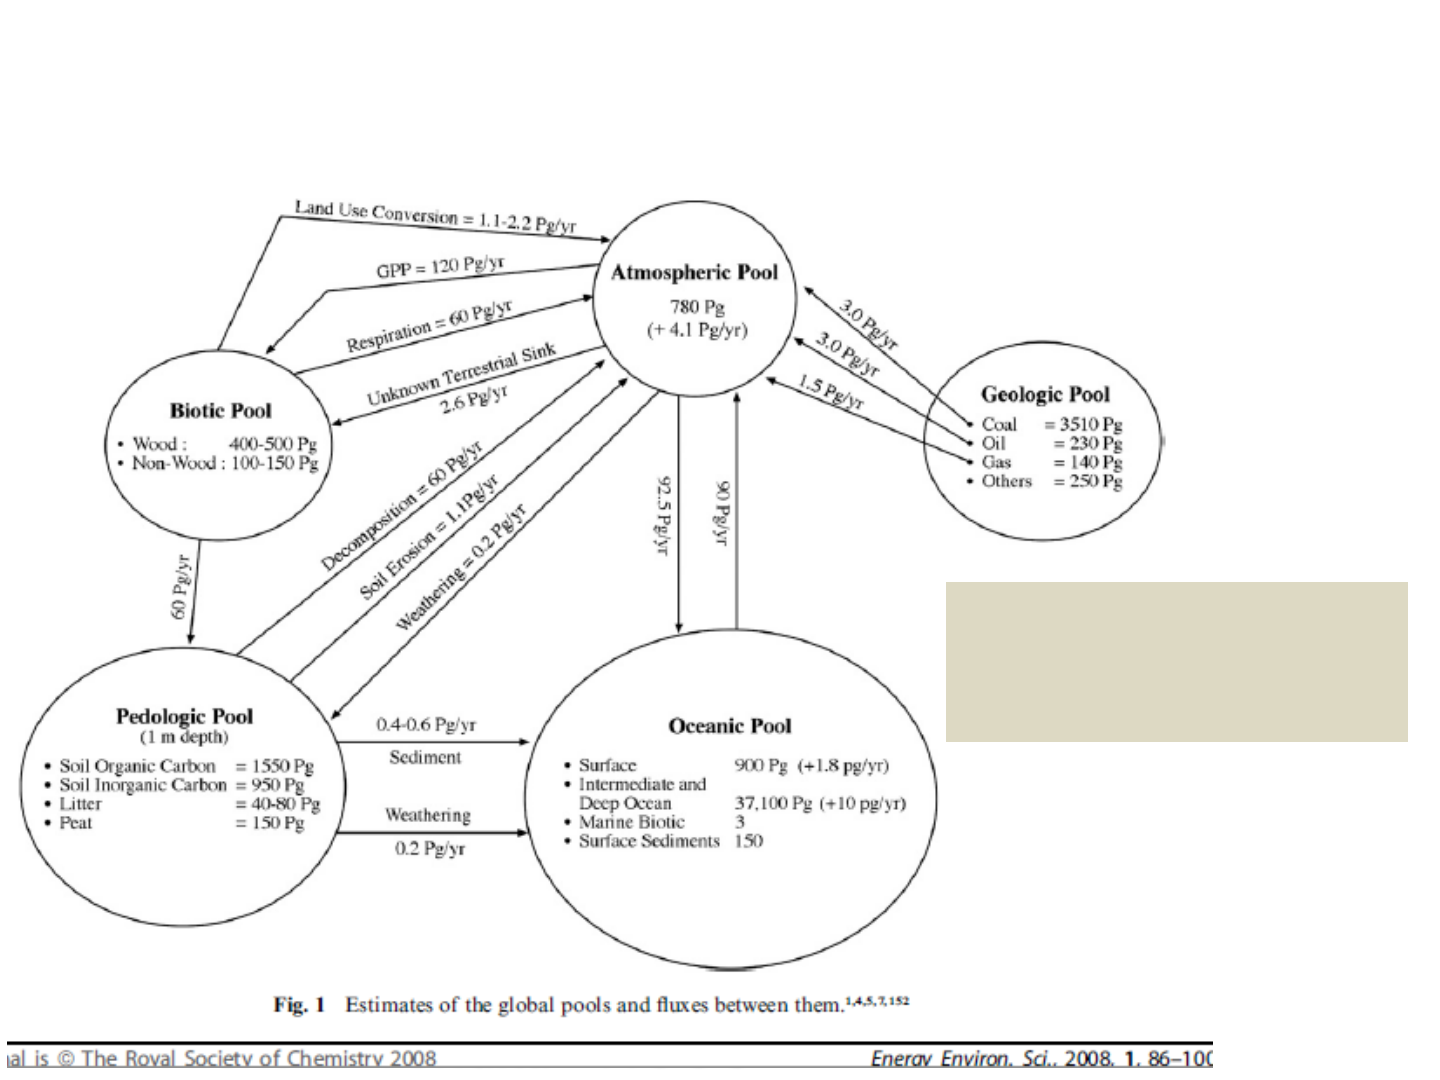
Global Carbon Cycle and Forests?
• Lal, 2008
4.1 Pg C /yr
4.1 billion tonne C / yr
14.7 billion tonne CO2 / yr
40 WW Paper Industries
Paper Production 0.15 billion tonne C/yr
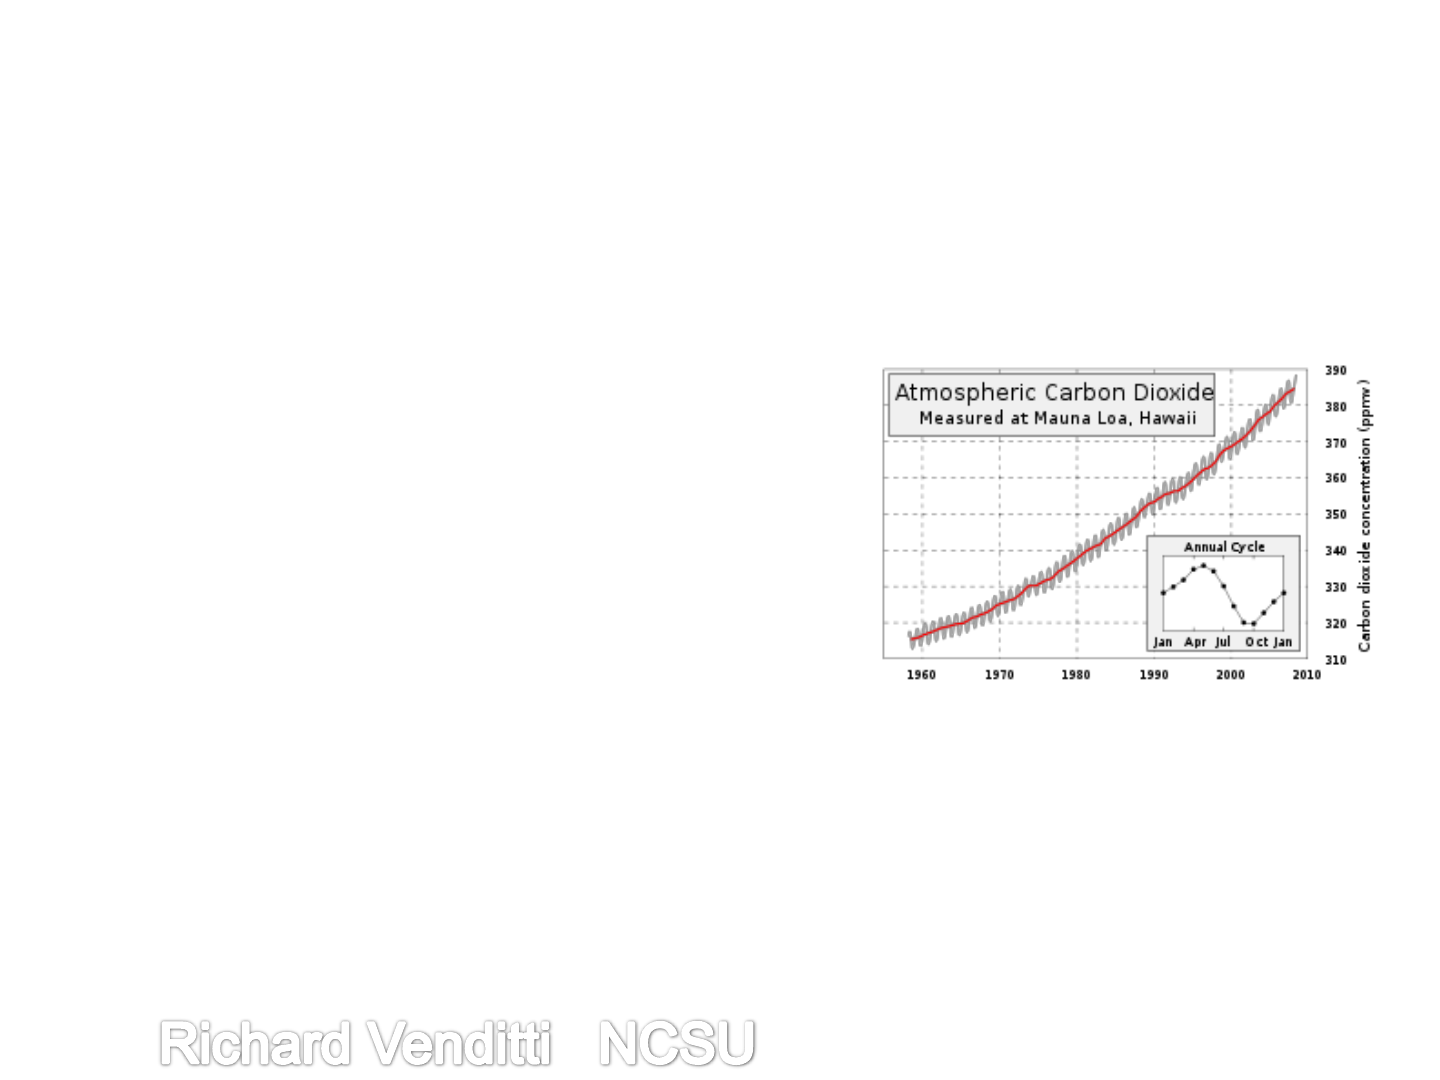
Global Carbon Cycle and Forests?
• Atmospheric concentration of CO2 has
increased by 31% since 1750 (to 390
from 280 ppm) and by 1.5 ppm/yr for
1980-2000 (IPCC 2001)
• Forests are significant in global GHG
(Landsberg & Gower, 1997):
– Cover 65% of the total land
– Contain 90% of the total vegetation
carbon
– 80% of total soil carbon in terrestrial
ecosystems
– Assimilate 67% of the total CO2 removed
from the atmosphere by all terrestrial
ecosystems

Carbon Footprint:
Impact Assessment Method
• Typically, a carbon footprint does not consider biogenic (from
living processes) carbon nor does it consider CO2 emissions
from the burning or decay of the biogenic material (they
balance each other)
• Biogenic material decay/burning that produces methane or N2O
must be considered
22
Tree Growth
100% Decay to CO2 and methane
Tree Growth
Burn to Produce CO2 only Net zero C footprint
+ C footprint
Carbon Footprint:
Impact Assessment Method
• Non renewable resources (coal, oil) are considered since they
have been formed over very long time scales and are not being
formed over time scales of interest
• Materials, transportation, energy often have associated with
them carbon emissions
• Long term storage of carbon away from the atmosphere is
considered a negative C footprint contribution
• When one product with a lower C footprint replaces another
with larger C footprint, an avoided C input to the atmosphere is
claimed, a negative C footprint contribution
23
Tree Growth
Burn to replace coal based electricity
Tree Growth
Book stored in library for long time
- C footprint
- C footprint

Important Aspects of Life Cycle
Assessment
Interpretation
Impact Assessment
Inventory Analysis
Goal and Scope
Definition
24
Interpretation: ISO Standard
25
Goal and
Scope
Interpretation:
1. ID Significant issues
2. Evaluation of
completion, sensitivity,
consistency, other..
3. Conclusions,
recommendations,
limitations
Impact
assessment
Inventory
analysis
Direct
Applications:
Product or
process
development
Public policy
Marketing
Strategic Planning
Other….

Outline
• Introduction to LCA
• LCA of Paper
• North American Printing and Writing Grade LCA’s
• Allocation methods in LCA’s
• Recommendations
26

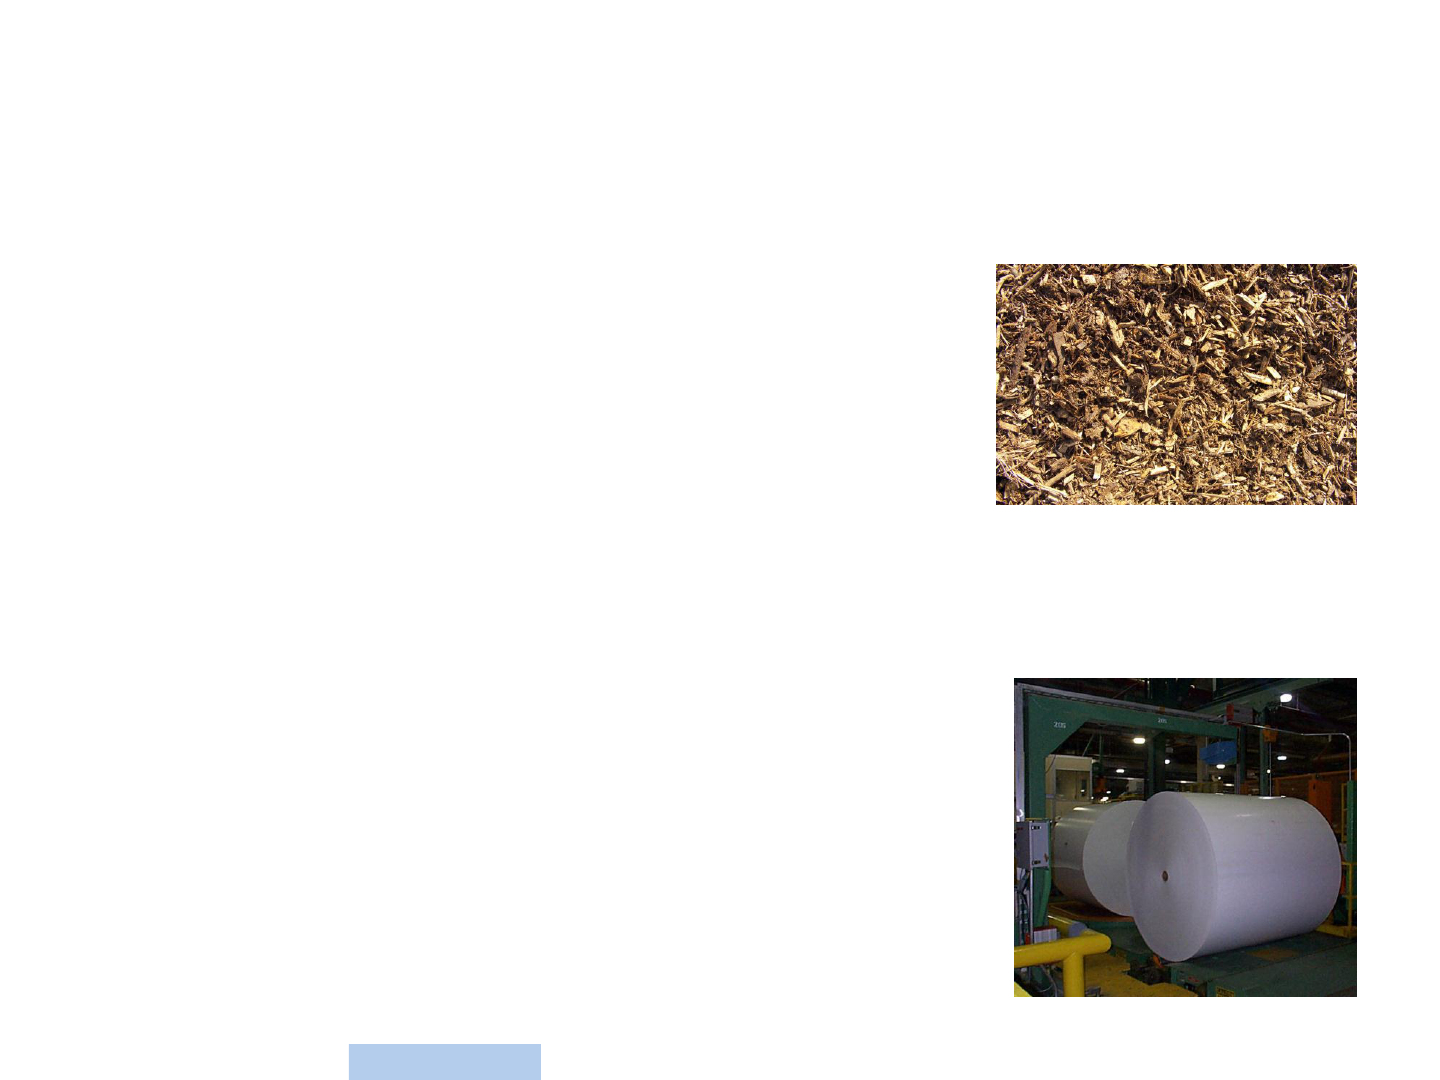
27
Life Cycle Analysis
for Pulp and Paper Products
• Paper is a measure of the quality of life of a society
• Paper is mainly derived from renewable resources
• Complex furnish and manufacturing
• Extremely efficient manufacturing processes using a
majority of renewable fuels
• Paper manufacturing has air/water/solid emissions
• Paper has several co-products manufactured
• A recyclable product (open loop)
• Paper is the major component in landfills and when
degrades anaerobically forms methane
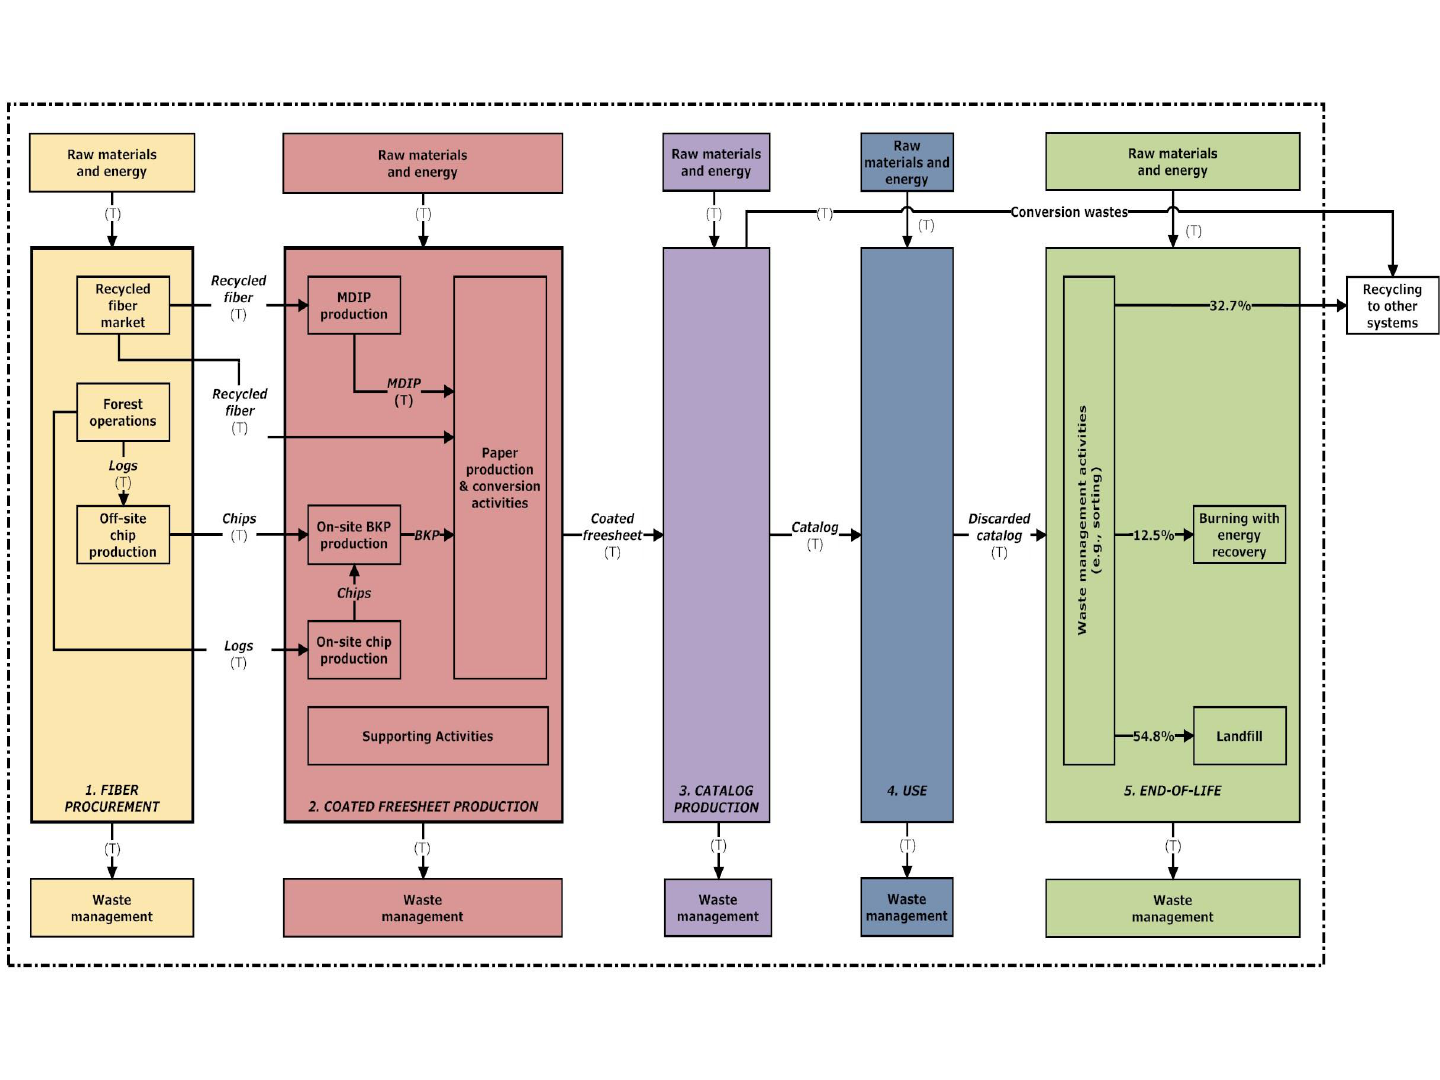
Life Cycle Analysis of Paper: Catalog System Boundary
28
Life Cycle Analysis of Paper: Catalog
29
Table Error! No text of specified style in document.-1. LCIA Results per Functional Unit (TRACI Method, IPCC) –
Catalogs
Impact
category
Unit/
catalog
Total
1-
2-
3-
4-
5-
Storage
use and
landfill
Fiber
procurement
Coated
freesheet
production
Production
of catalogs
Transport
and use
End-
of-life
Global warming
(GW)
kg CO
2
eq.
4.89E-01
5.4%
43.6%
15.7%
1.2%
37.7%
-3.4%
Acidification
(AC)
H
+
moles
eq.
1.67E-01
7.6%
67.4%
21.1%
1.1%
2.9%
N/A
Carcinogenics
(CAR)
kg
benzene
eq.
8.43E-03
0.6%
66.6%
4.2%
0.0%
28.6%
Non-
carcinogenics
(NCAR)
kg toluene
eq.
8.78E+01
0.5%
11.5%
2.4%
0.1%
85.4%
Respiratory
effects (RES)
kg PM
2.5
eq.
6.52E-04
3.5%
77.9%
15.6%
0.3%
2.6%
Eutrophication
(EU)
kg N eq.
8.85E-04
1.9%
19.0%
6.2%
0.2%
72.8%
Ozone depletion
(OD)
kg CFC-11
eq.
1.88E-08
2.8%
66.2%
21.2%
0.4%
9.4%
Ecotoxicity
(ECO)
kg 2,4-D
eq.
2.86E+00
0.9%
14.7%
6.1%
0.1%
78.2%
Smog (SM)
kg NOx
eq.
2.10E-03
7.7%
36.4%
48.7%
1.8%
5.3%
Fossil fuel
depletion (FF)
MJ surplus
3.94E-01
9.3%
52.4%
29.8%
2.6%
5.9%
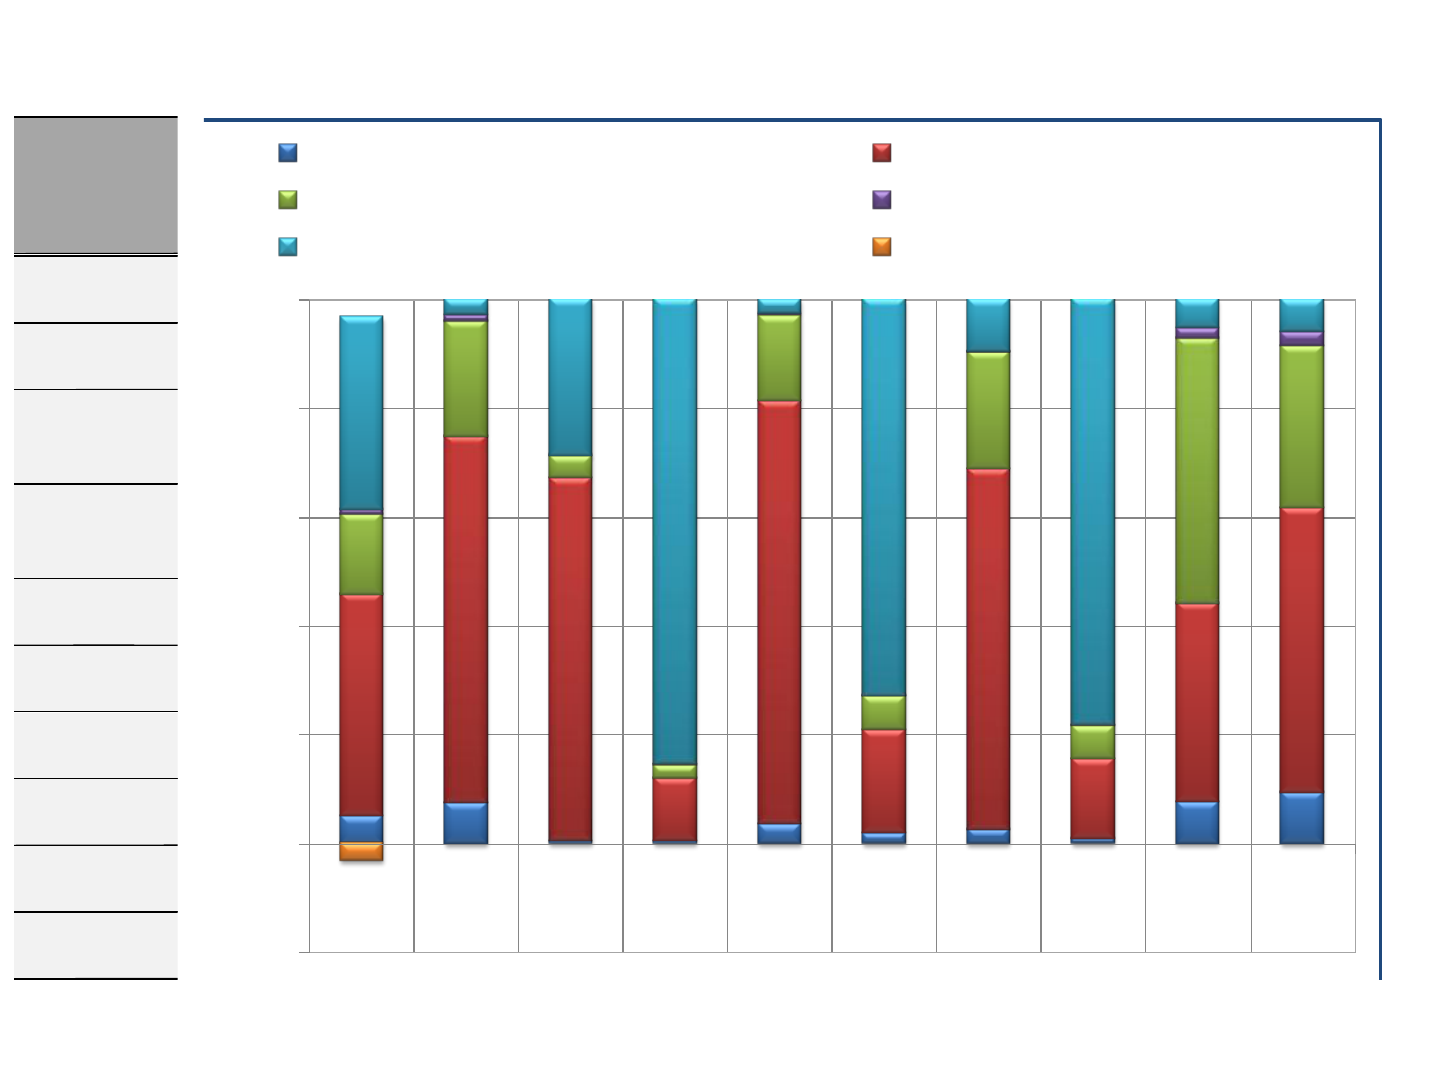
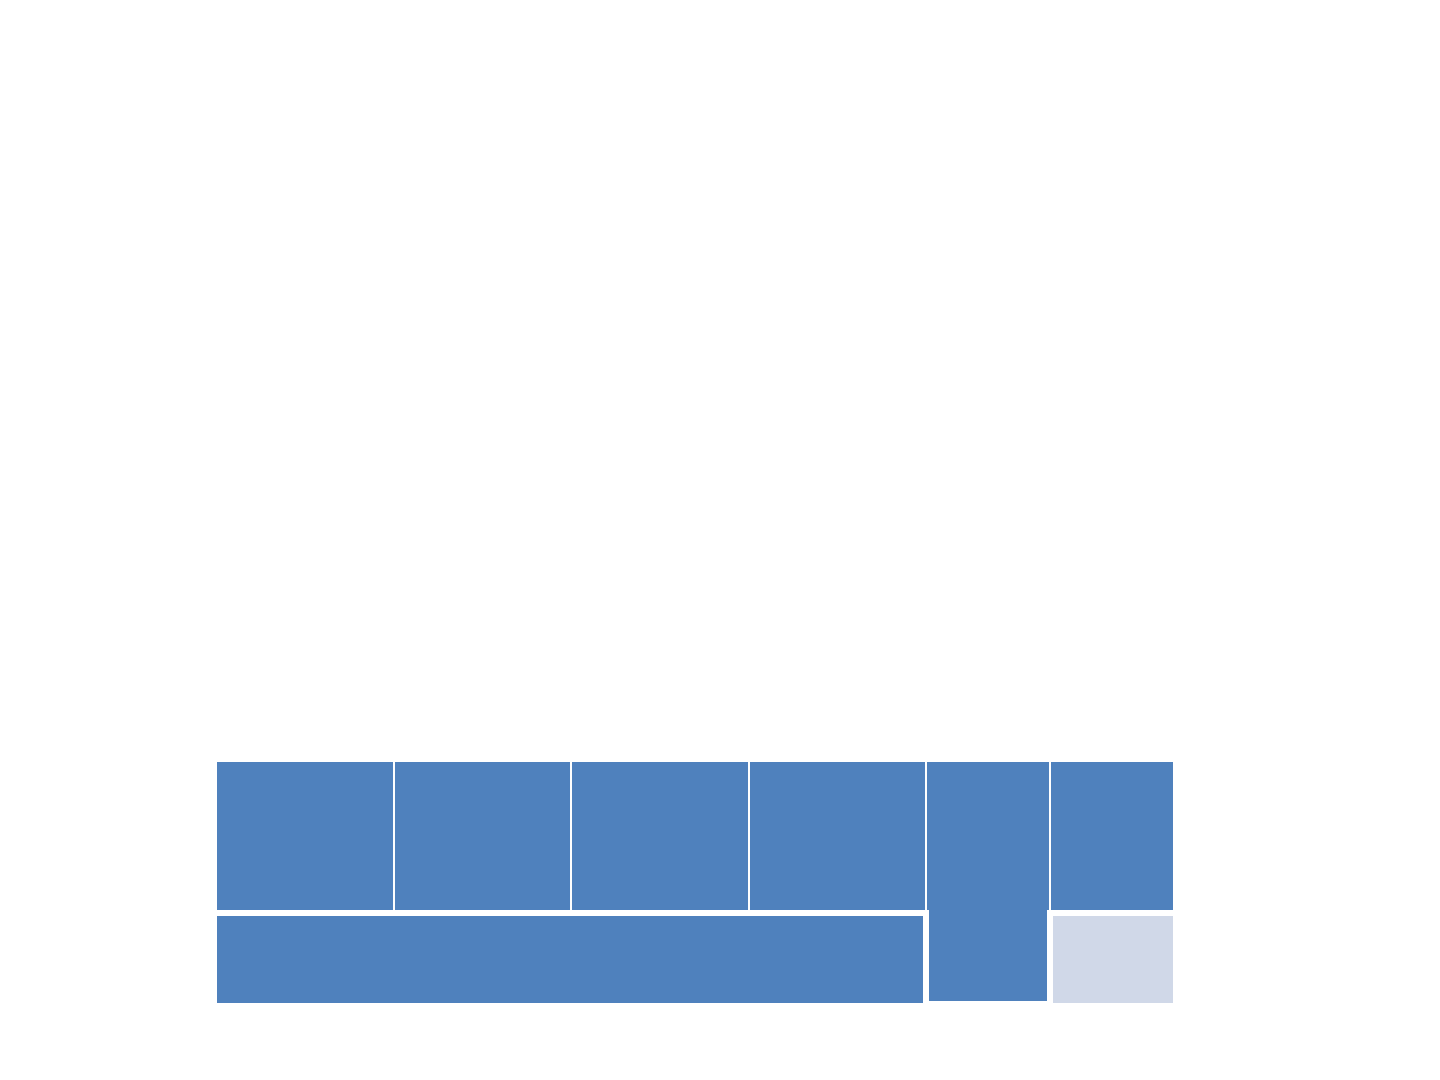
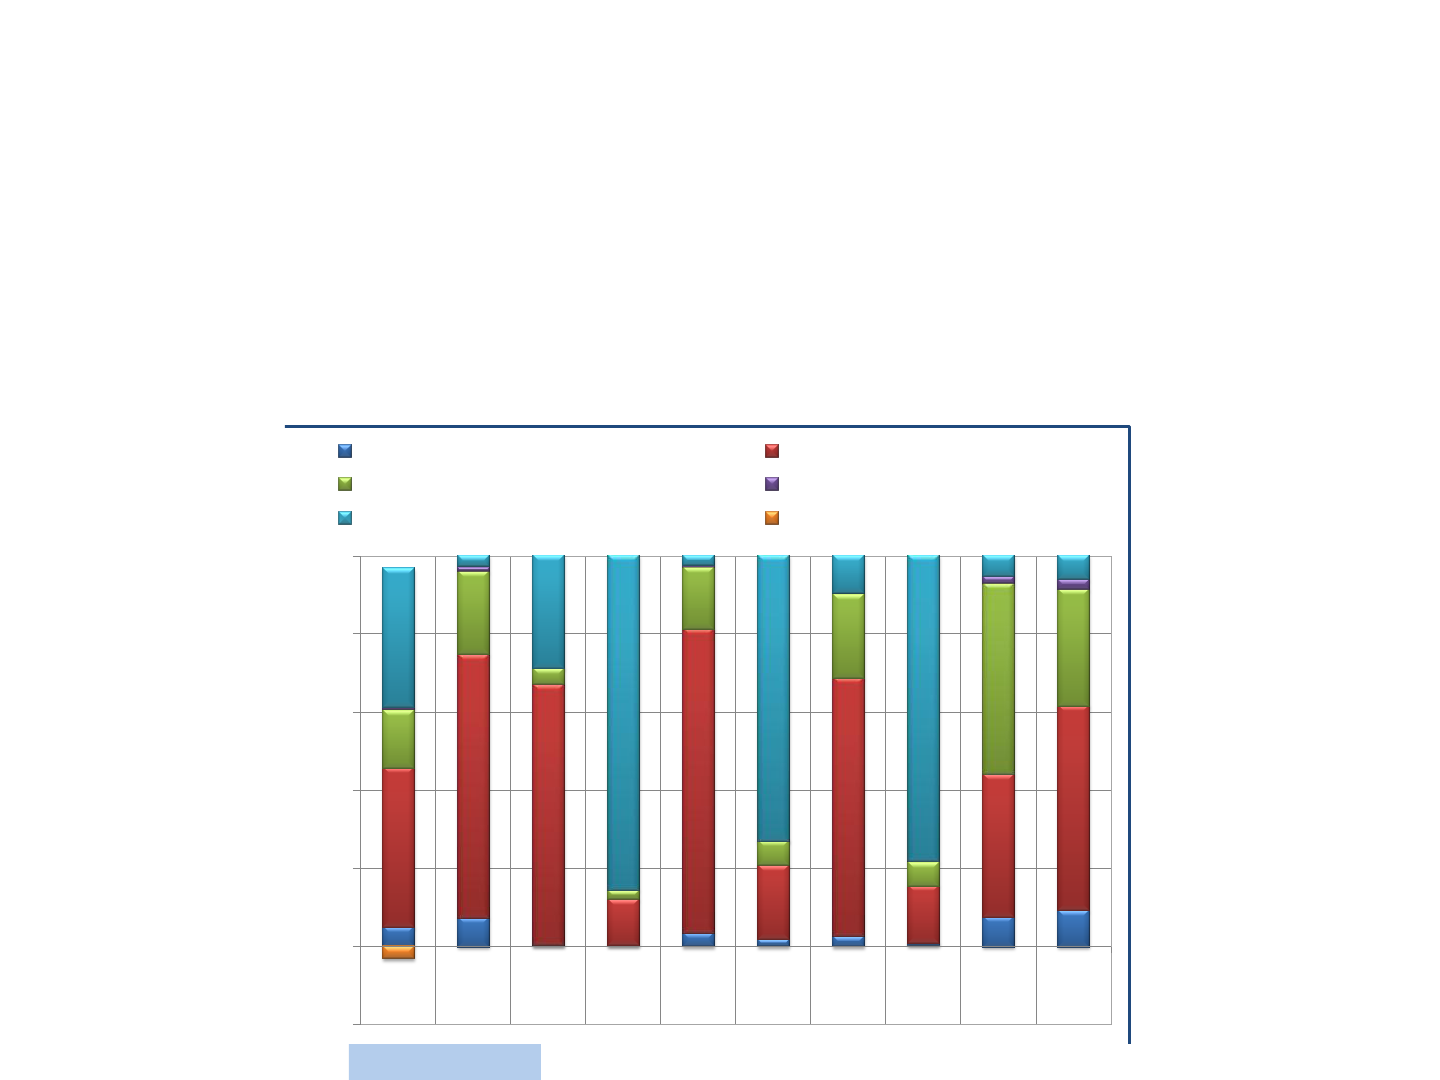
Figure Error! No text of specified style in document.-1. Cradle-to-Grave Contribution analysis – Catalogs Made
Primarily from Coated Freesheet
-20%
0%
20%
40%
60%
80%
100%
GW
AC
CAR
NCAR
RES
EU
OD
ECO
SM
FF
1- Fiber procurement
2- Coated freesheet production
3- Production of catalogs
4- Transport and use of catalogs
5- End-of-life
Storage in use and landfill
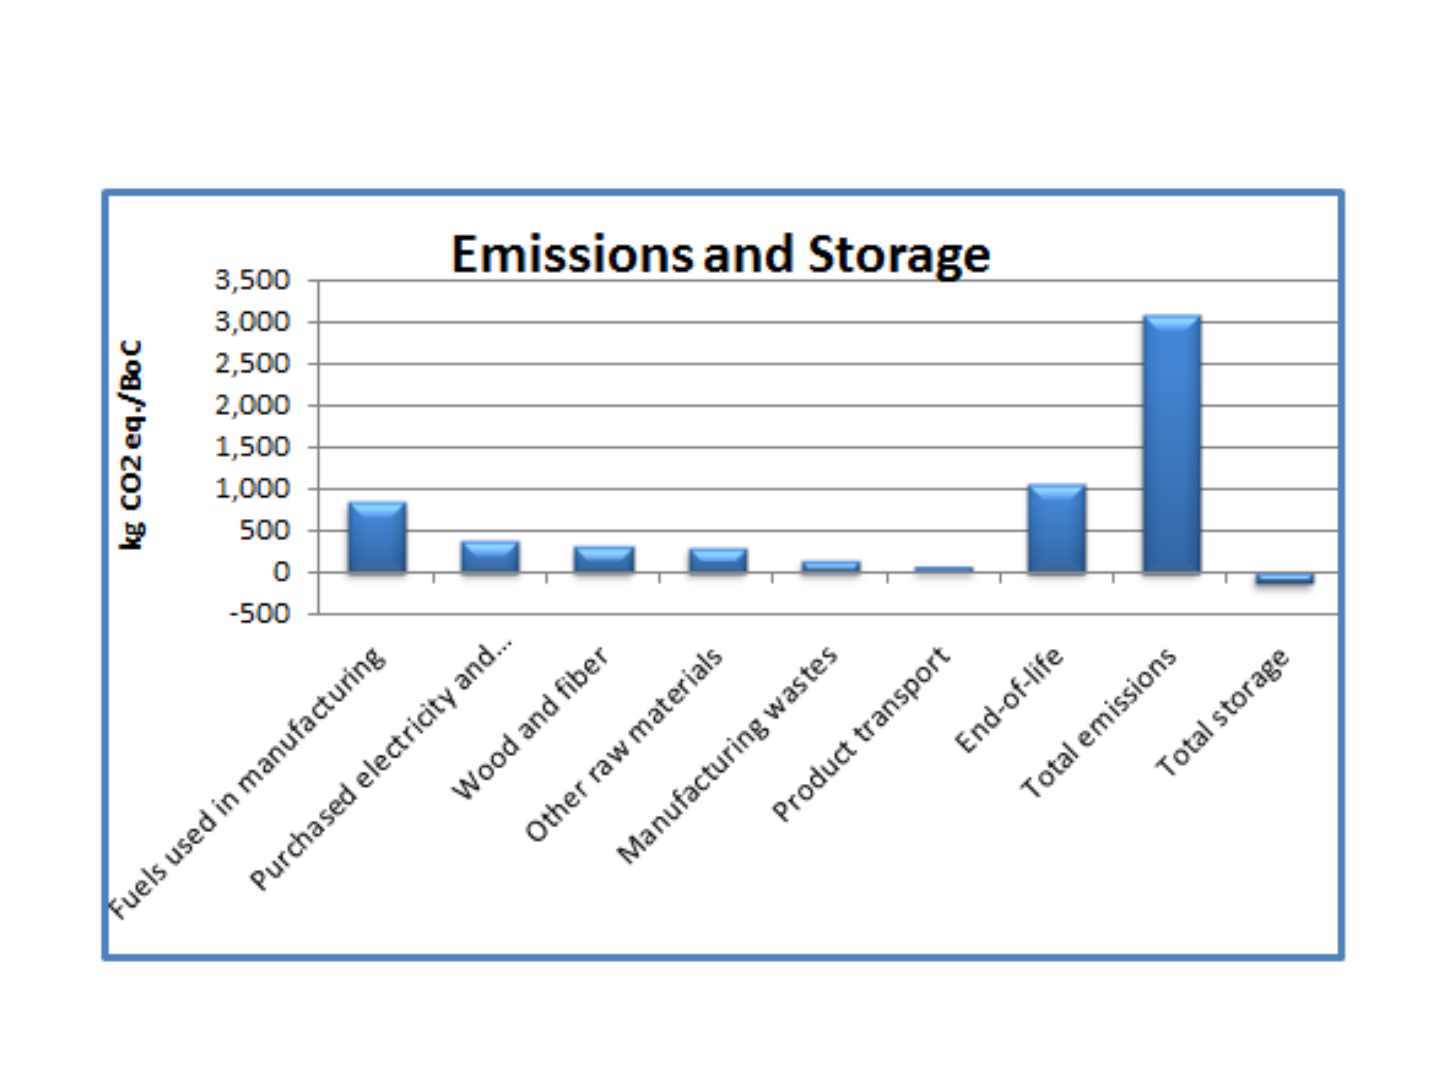
Life Cycle Analysis of Paper: Catalog: Carbon Footprint
30

Outline
• Introduction to LCA
• LCA of Paper
• North American Printing and Writing Grade LCA’s
• Allocation methods in LCA’s
• Recommendations
31

32
Major NA LCA Studies on
Printing and Writing Grades
• Paper Task Force White Paper No. 3 Lifecycle environmental
comparison: virgin paper and recycled paper based systems.
Originally published Dec. 19, 1995, updated February 2002 (Paper
Task Force, 2002)
• The Heinz Center: Following the Paper Trail: The Impact of
Magazine and Dimensional Lumber Grade Production on GHG
Emissions: A Case Study, 2006. (Heinz, 2006)
• National Council for Air and Stream Improvement, Inc. Life Cycle
Assessment of North American Printing and Writing Paper Products
(NCASI, 2010)
•
Paper Task Force (Paper Calculator):
• Data circa 1994
• Synthetic, simplistic separation of virgin and recycled systems
• Mainly indicates preferred disposal method
• Has been extensively mis-marketed and mis-used to promote the use
of recycled fibers in specific products
33
Raw Material
Acquisition (300)
Paper Production (3000) Landfill/Incinerate Virgin
Paper (2500)
Deinking and Paper
Production (3350)
Collection of Recycled
Paper (230)
Net GHG Emissions
Virgin Office Paper
Landfill 6700 (3.4)
Incineration 2500 (1.3)
Waste Management 5800 (2.9)
Recycled Office paper Collect/Process 3580 (1.8)
Paper Task Force (Paper Calculator):
• Producers of manufactured paper products are using national
averages of the industry to represent their product. However, the
range of environmental burdens are very large and using averages to
represent specific products is misleading.
34
-1000
-500
0
500
1000
1500
2000
2500
C50D50EDED D(EO)DED OD(EO)D Industry Average
CO2 from Fossil Fuels, lb/AD ton
Bleaching Sequence
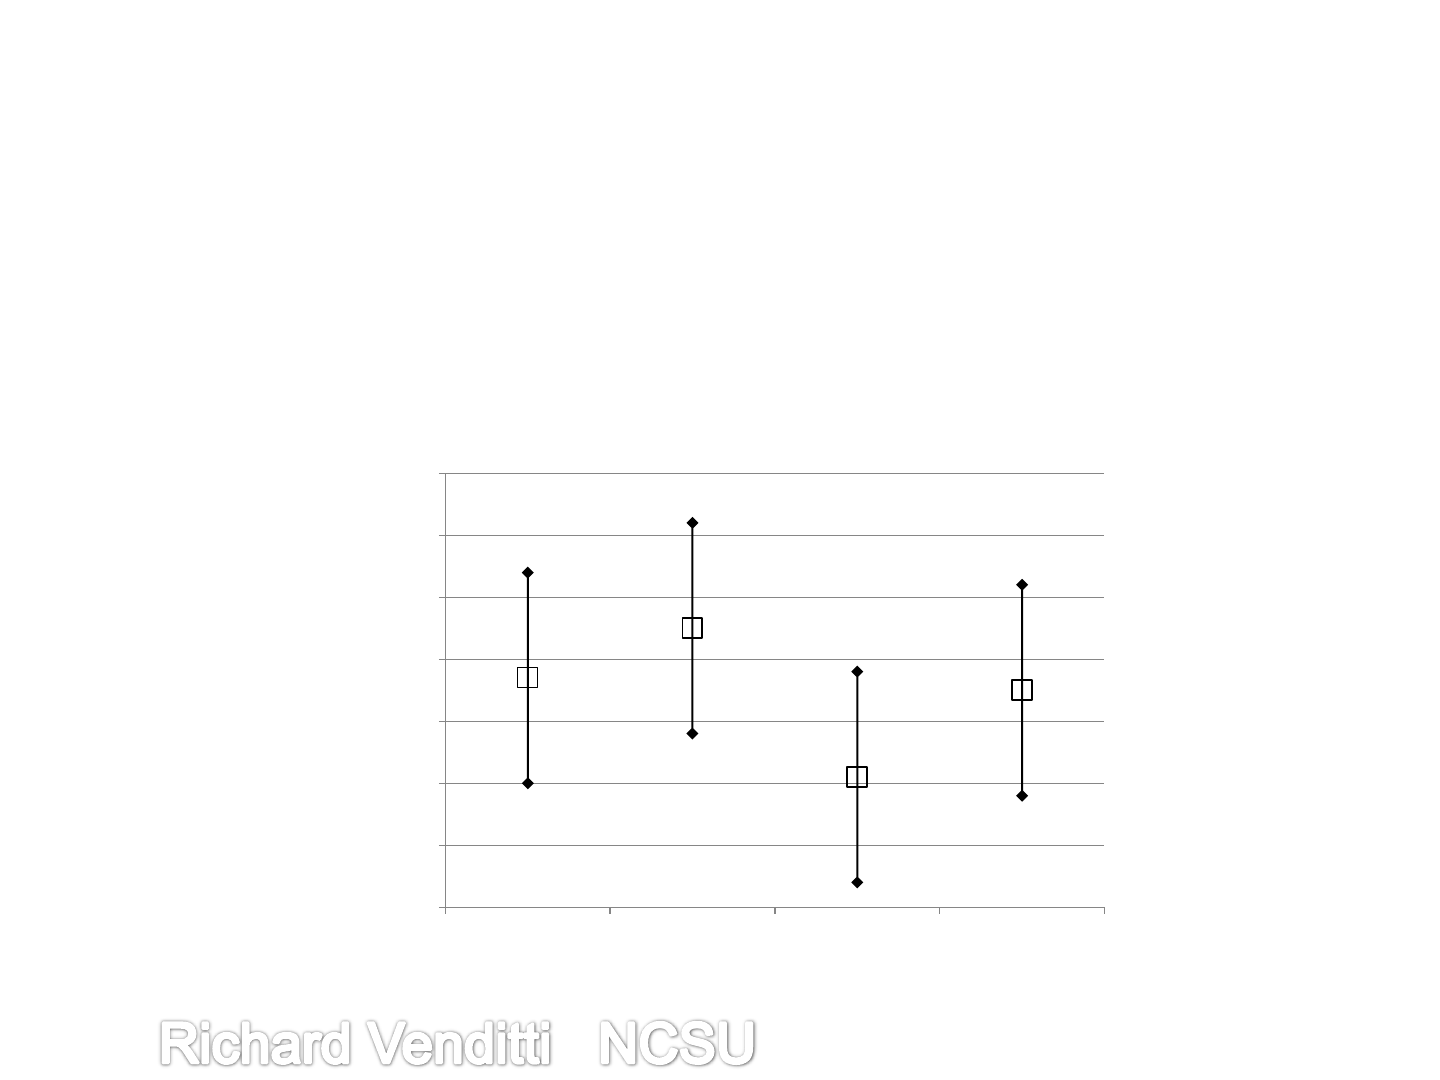
Paper Task Force (Paper Calculator):
35
-2000
-1000
0
1000
2000
3000
4000
5000
Bleached Kraft Pulp Uncoated free
sheet paper
Coated free sheet
paper
Lightweight coated
groundwood virgin
paper
Lightweight coated
paper
Deinked Recovered
Fiber
CO2 from Fossil Fuels, lb/AD ton
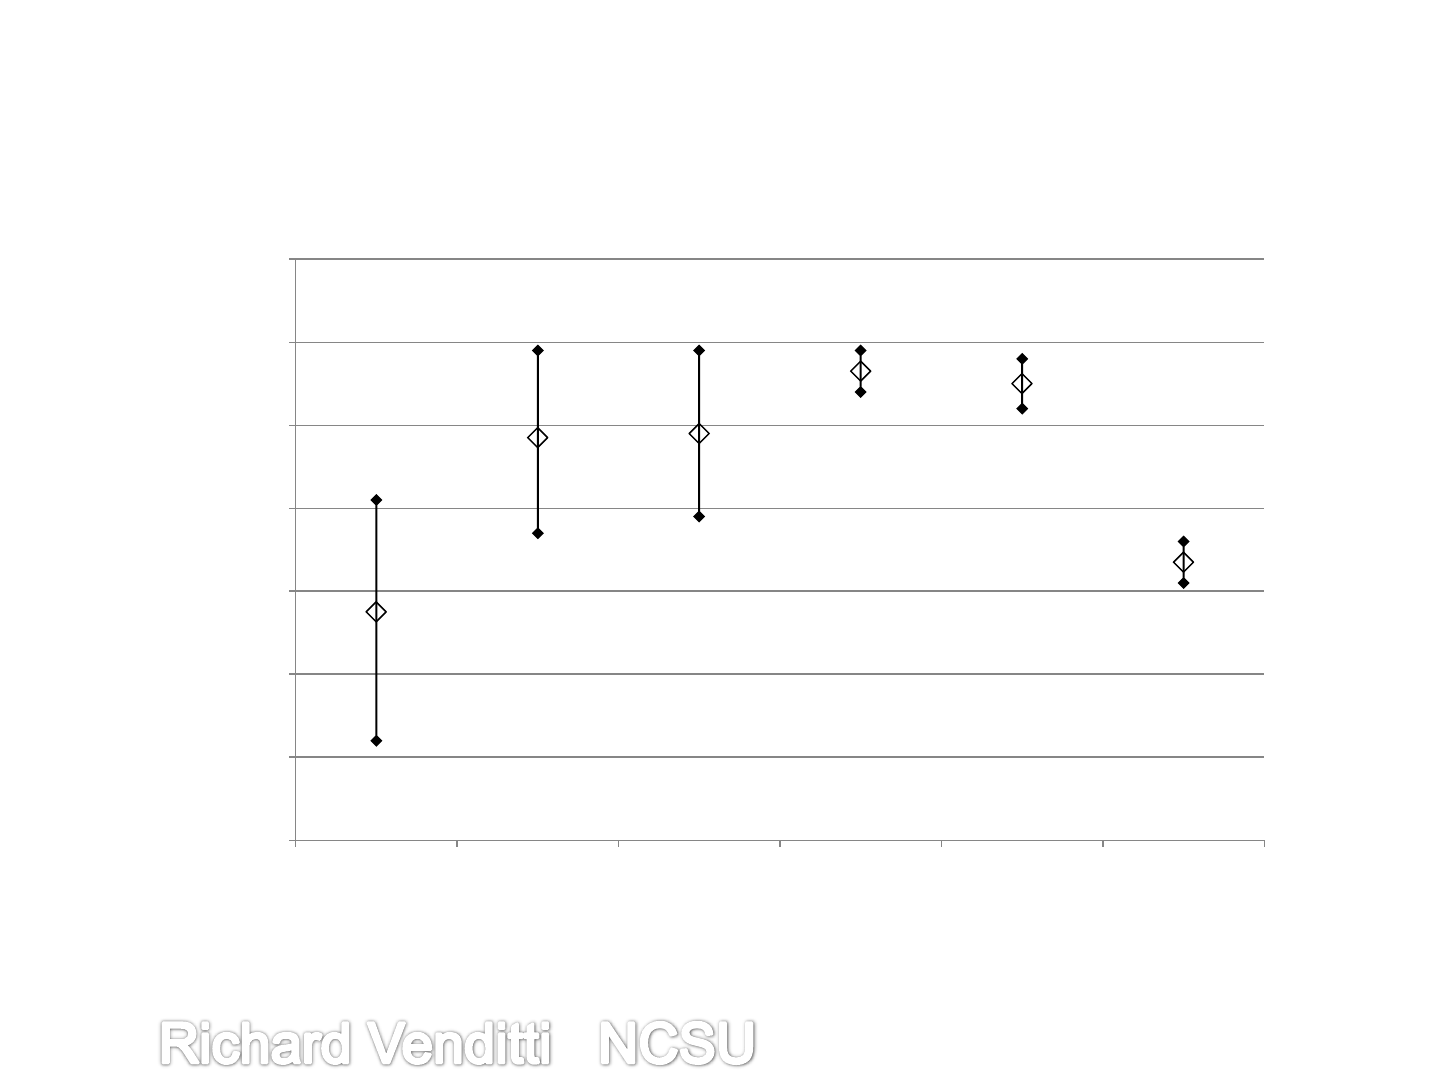
Paper Task Force (Paper Calculator):
• Producers of manufactured paper products are using the results to
indicate that more recycled fiber content in a specific product is better,
however, this is not necessarily true
• It is good to recycle in general
• However, in general, it is most efficient to recycle paper products to
lower valued and not higher valued products
• Example:
36
0
0.1
0.2
0.3
0.4
0.5
0.6
0.7
0 5 10 15 20 25 30
Number of
Uses
Cut off
method
Net GHG, kg CO2eq/kg catalog
Utilization Rate (%)
The Heinz Center: Following the Paper
Trail: The Impact of Magazine
• Data circa 2001
• A scope 1 (owned) and 2 (purch power) study for Carbon Footprint
• Omits scope 3 (non-owned) considerations
• Does not follow LCA procedures/fails to document adequately
• Underestimates carbon footprint
37
Forest
Management
and Harvesting
Transport
Paper
Manufacturing
Transport to
Printers and
Printing and to
Distribution
Centers
Final Fate:
Landfill
Recycle
Incinerate
InStyle
(1.11)
Purchased Power
Time
(1.17)
Table 2. Activities in the net GHG Life Cycle tracked in the Heinz Center
Study for the InStyle and Time magazines (ton CO2e/ton product listed)
National Council for Air and Stream Improvement
(NCASI)
• Most modern study
• Robust, scope 1-3 LCA of printing and writing grades
• Follows ISO procedures
• Complex allocation methods for virgin vs recycling products
38
Figure Error! No text of specified style in document.-1. Cradle-to-Grave Contribution analysis – Catalogs Made
Primarily from Coated Freesheet
-20%
0%
20%
40%
60%
80%
100%
GW
AC
CAR
NCAR
RES
EU
OD
ECO
SM
FF
1- Fiber procurement
2- Coated freesheet production
3- Production of catalogs
4- Transport and use of catalogs
5- End-of-life
Storage in use and landfill
Comparison of Three Studies:
39
Study:
ISO
14040
3
rd
Party Review
Published in a
Peer Reviewed
Journal
Clarity of Data
Impact
Assessment
Uncertainty
Analysis
Sensitivity
Analysis
Allocation methods
Paper
Task
Force
No.
Reviewed by outside
experts. Comments
not provided in the
report.
No.
Extensive
presentation of
the inventory
data.
Net GHG.
None.
None.
Synthetic separation
of virgin and recycled
paper products.
Inconsistent
application of open
loop recycling.
Heinz
No.
None.
No.
Did not define
what data was
included. Data
in inventory
results not
presented.
Only GHG
emissions
reported.
None.
Weaknesses in
study
discussed.
Not done.
Results for
individual
printing
operations
were
presented.
None used for
recycling. Unclear
assumptions on
coproduct allocation
methods.
NCASI
Yes
External peer review
panel. Panelists
comments and the
responses to the
comments appear in
the report
No.
Extensive
flowsheeting of
processes and
lists of data
appear in
report.
SimaPro
software
running
TRACI.
Conducted
with respect to
inventory data.
Sensitivity on
process
conditions,
allocations
methods,
impact
assessment
method,
others
Co
-product and
recycling allocation
methods used.

Comparing Difft LCA’s
• Very Difficult:
• Example, coated paper:
– PTF: .8-1.8 ton CO2e/ton product
– Heinz: 1.11-1.17
– NCASI: 2.36-3.45
– VTT Study (Finland): 1.0-1.6
– Springer/Stora/Canfor (Europe): 0.4-1.9
• Geographical differences, assumptions, data,
calculation methods, scope, …………….
40

Outline
• Introduction to LCA
• LCA of Paper
• North American Printing and Writing Grade LCA’s
• Allocation methods in LCA’s
• Recommendations
41

Allocation Methods in LCA:
• Allocation: the partitioning of environmental
burdens between two related products
• Controversial:
– ISO methods recommend that allocation is avoided
– ISO does not provide allocation rules, practitioner must decide the
rules and justify their use
– ISO requests that the sensitivity of the LCA results are evaluated
with respect to the allocation methods
• Bottom line: allocation method can determine which
related product in a life cycle is preferred
42

Two Main Allocation Situations:
• Co-products Allocation: a single process produces
multiple products,
– Burdens can be partitioned by mass flows, monetary
values….
– Example for paper production: paper, TOFA, turpentine
– Emissions from pulping are partitioned to the paper, TOFA,
and turpentine using a stated rule
43

Two Main Allocation Situations:
• Recycling Allocation: a virgin product is recycled or
re-used in a subsequent life
– There exists operations that are required by the virgin and
the recycled products (shared operations)
– Example shared operations: virgin raw material production,
final disposal
– Many ways to allocate the burdens of the common
operations
• Open loop recycling allocation is the most
controversial issue in LCA currently!!!!
44

Allocation methods to share burdens reflect
improved environmental efficiency.
• Example: want to understand the burdens of
containing groceries during transport
• Reduce: don’t use a bag, 0 burden/trip
• Re-use (production of bag = 1 burden)
– Use bag once, 1 burden/trip
– Use bag twice, 0.5 burden/trip
• Recycle (to recycle costs 0.4 burdens)
– Then for using the bag and recycling once:
( 1 + 0.4 ) / 2 trips = 0.7 burdens/trip
– (data for example only, not meant to represent an actual
process)
45
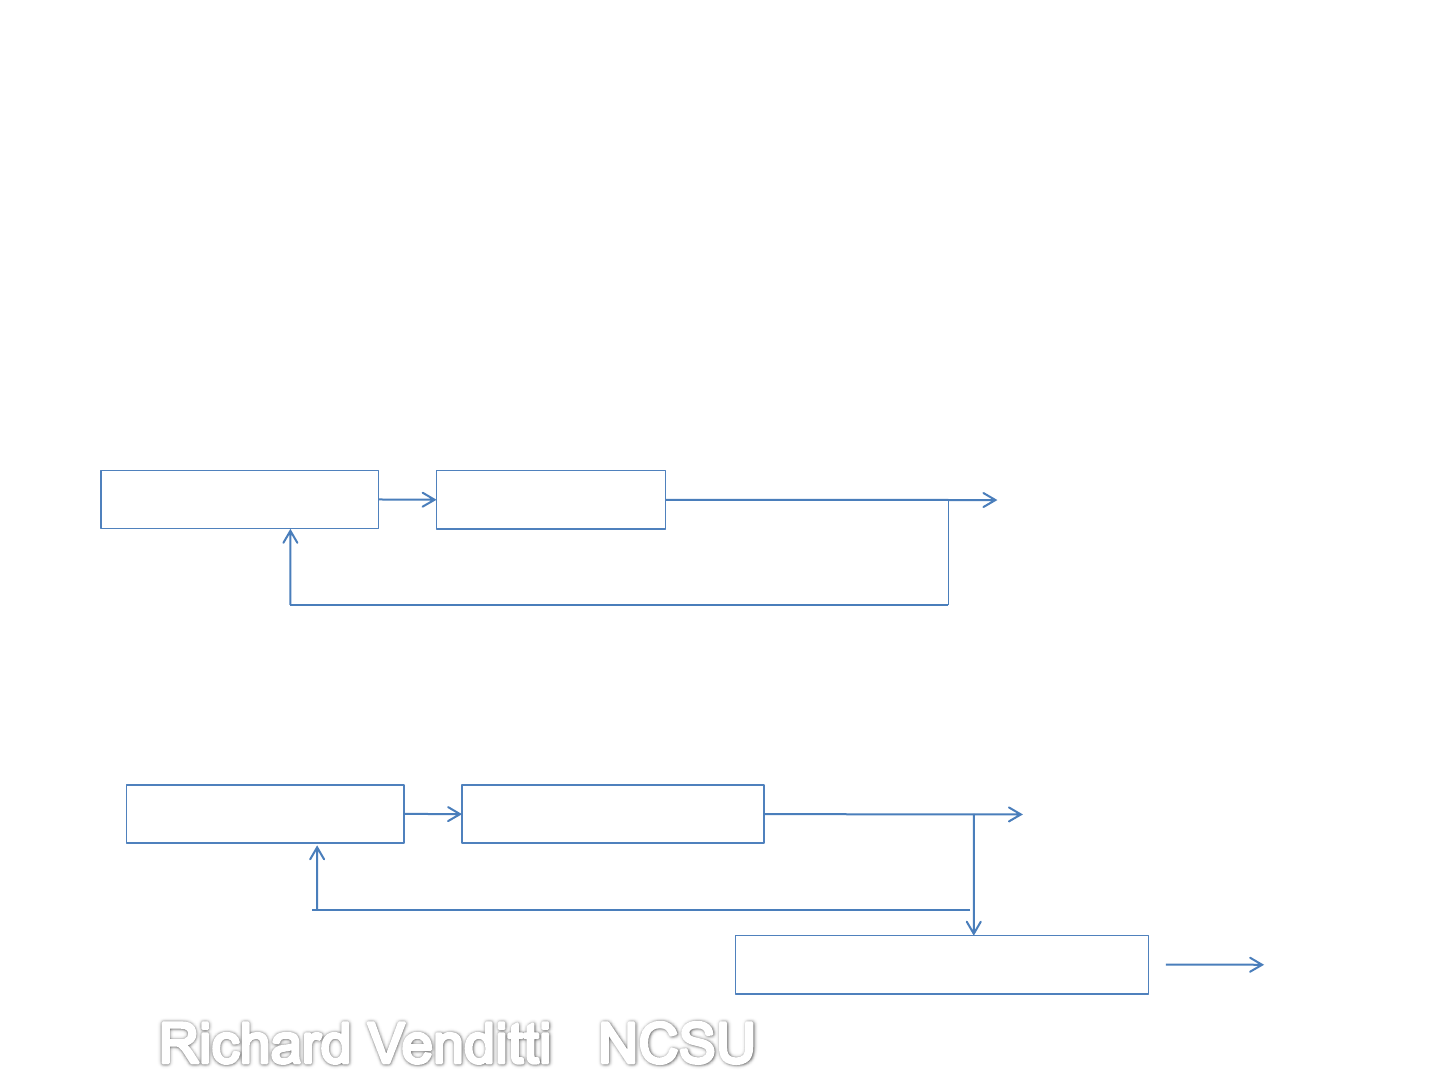
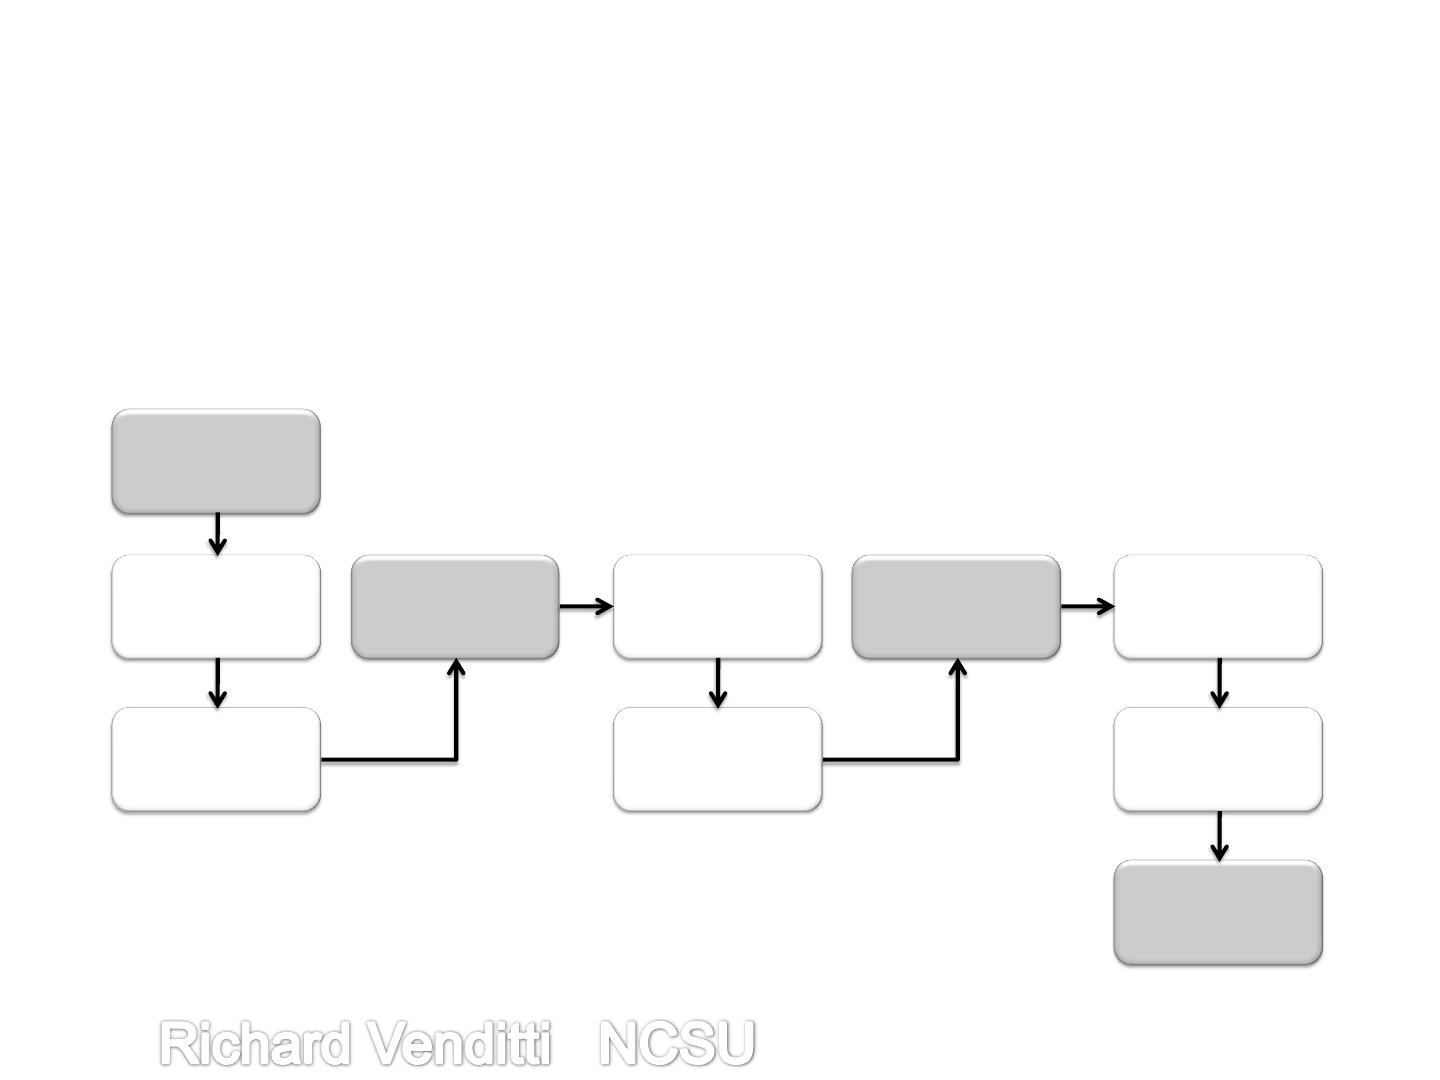
Closed and Open Loop Recycling:
• Closed loop: material or products are returned to
the same system after use and used for the same
purpose again (Baumann, Tillman, 2004)
• Open loop: a product is recycled into a different
product
46
Production of P
Use Product
Disposal
Production of P
Use of Product A
Disposal
Production of Product B
Disposal
Recover
Recover
Allocation Methods in LCA:
• Example: virgin paper recycled twice and then
disposed. Closed loop recycling example P1=P2=P3.
47
Primary material
production
(V
1
)
Production of
Product P1
(P
1
)
Use of
Product P1
(U
1
)
Recycling of
Product P1
(R
1
)
Production of
Product P2
(P
2
)
Use of
Product P2
(U
2
)
Recycling of
Product P2
(R
2
)
Production of
Product P3
(P
3
)
Use of
Product P3
(U
3
)
End of life
(W
3
)
Allocation Methods in LCA:
• Example: virgin paper recycled twice and then
disposed. Closed loop recycling example.
48
Raw Matl
Virgin Prod
Collect/transp
Recycle
Process
Collect/transp
Recycle
Process
Waste
Mgmt
V1 P1 R1 P2 R2 P3 W3
Shared
Operation
Potentially
Shared
Operation
Potentially
Shared
Operation
Not Shared
Operation
Potentially
Shared
Operation
Not Shared
Operation
Shared
Operation
CO2e
Lb/ton
product
300 3000 230 3350 230 3350 2500
CO2e
ton/ton
product
.15 1.50 .12 1.68 .12 1.68 1.25
Table 7. Net GHG of office paper from various life cycle stages from the Paper Task Force (2002, pg. 132), waste management is 80/20 landfill/incinerate.
Allocation Methods in LCA:
• Choice of allocation method determines whether
virgin or recycled products are promoted:
49
0
1000
2000
3000
4000
5000
6000
7000
Cutoff MLWMBR 50/50 Closed Loop
Recycling
Quality Loss RMAGWT
Virgin Burden Recycled Burden
Net GHG, lb CO2eq/ton
Paper Task Force
Shared Burden
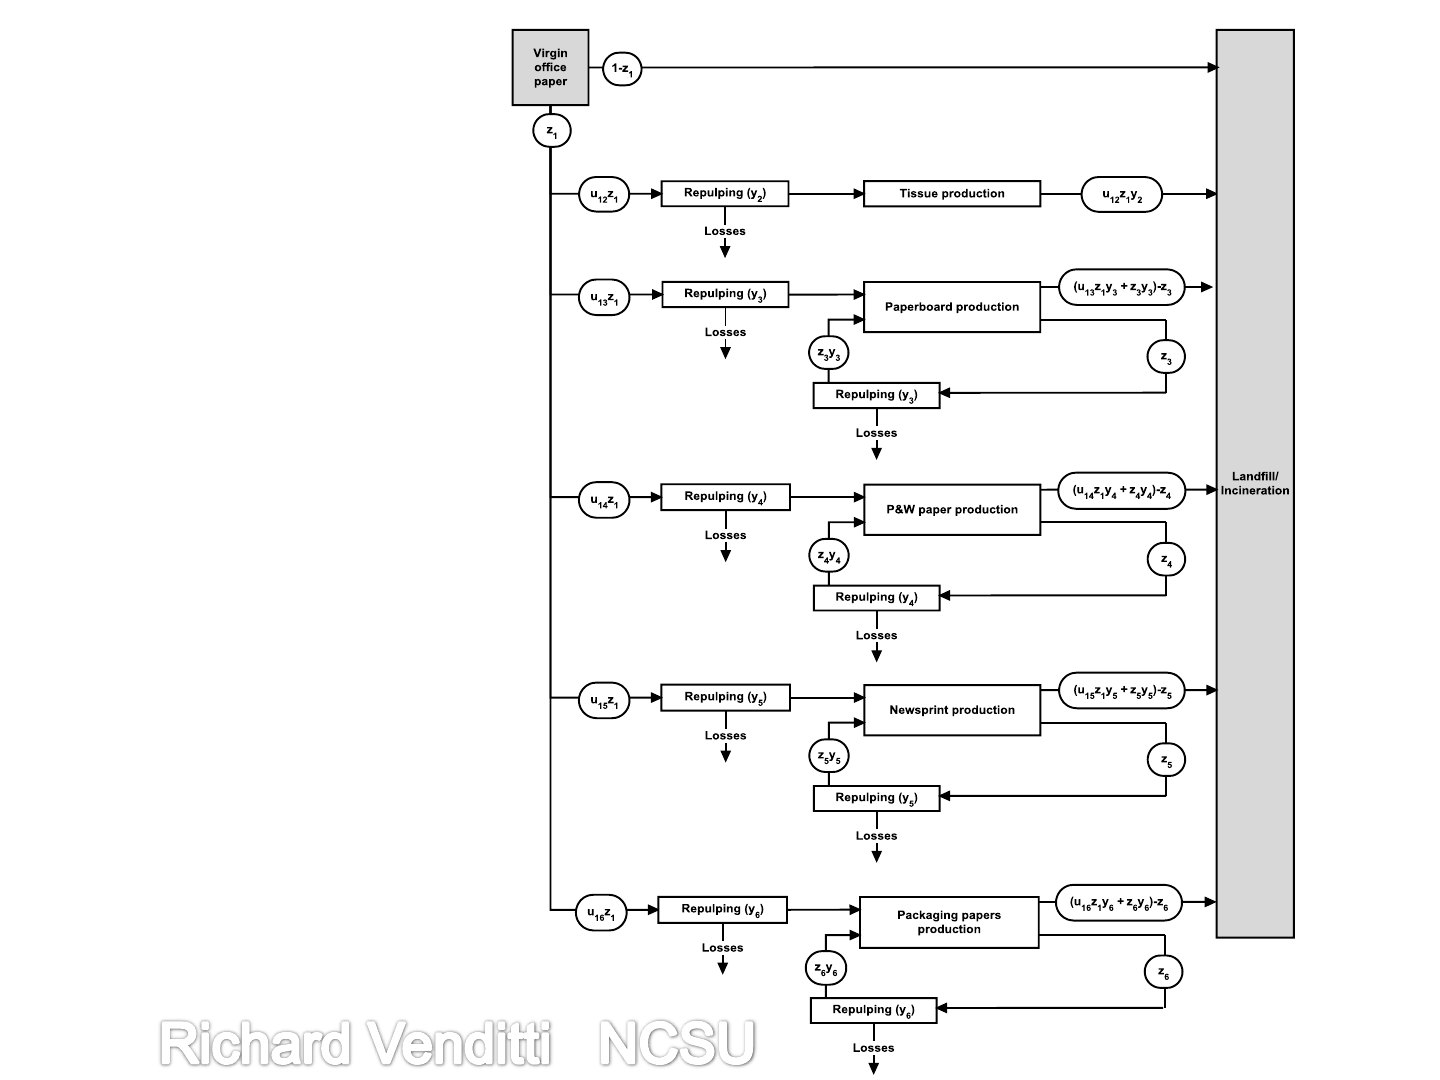
Paper Recycling:
An Open Loop
• Paper products are
recycled into other
products with
different yields upon
recycling, closed
loop recycling not a
good model
50

Allocation Methods in LCA:
• Cut off method: no shared burdens
• Virgin product carries all virgin production burden
• Recycled products aren’t assigned any virgin burdens
• Promotes recycling relative to disposal
• Doesn’t acknowledge the value of recyclable materials
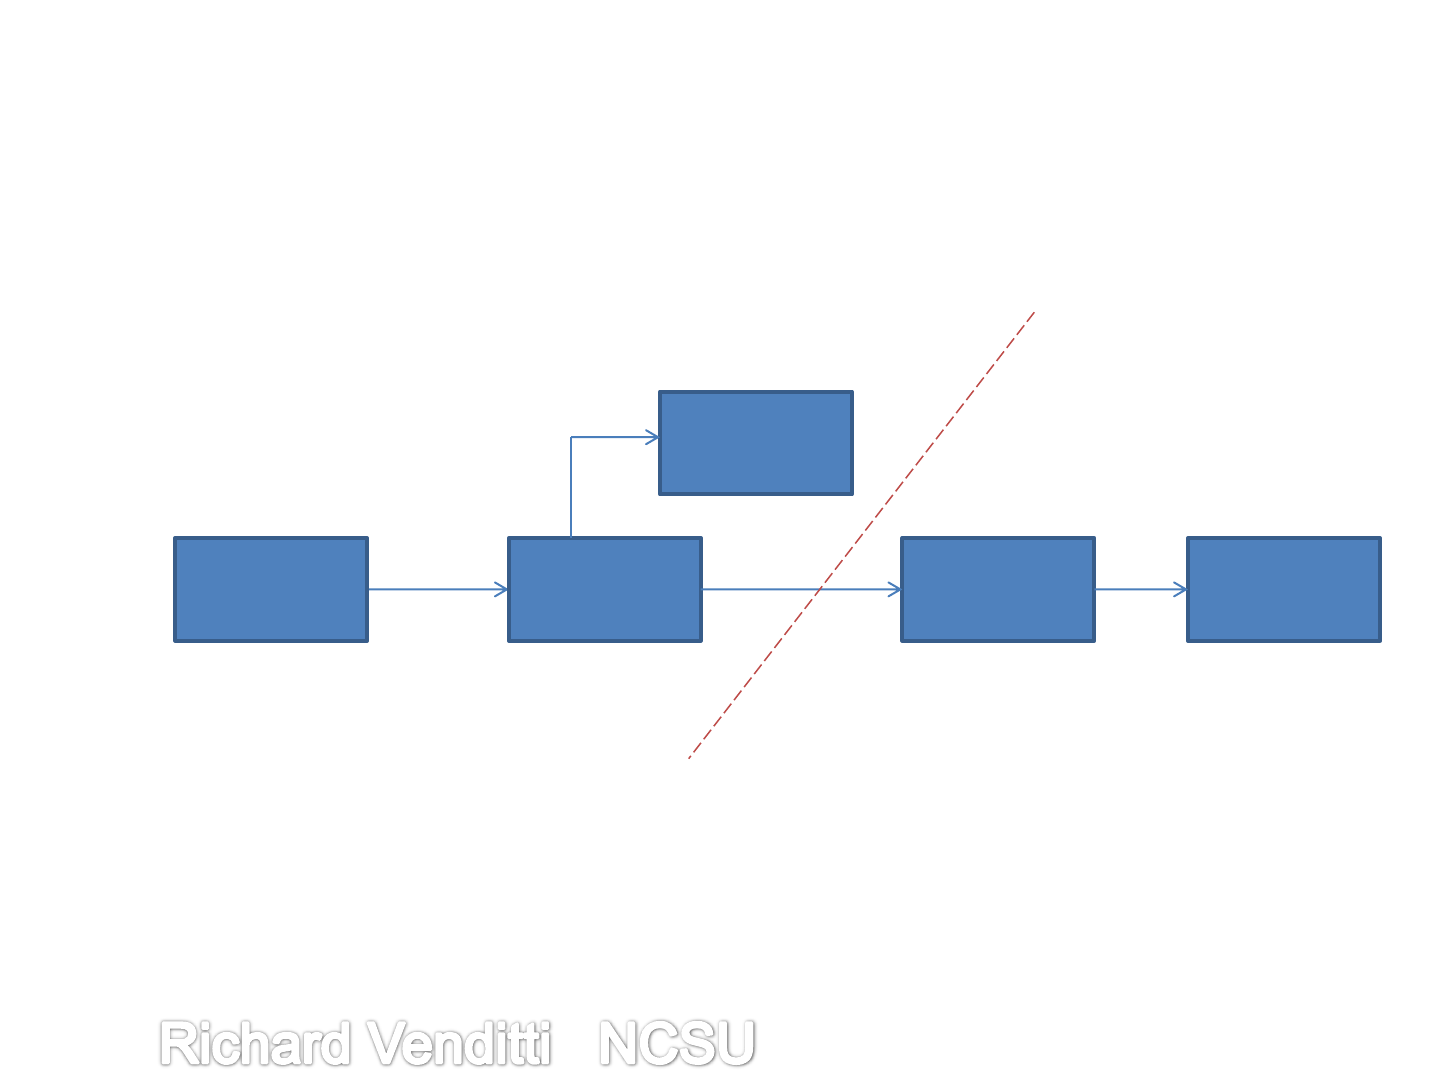
Allocation Methods in LCA:
• Flow sheet of cut off method.
52
GWP =30
Raw
Materials
Disposal
Product 2
Disposal
Product 1
Manuf
Product 2
Manuf.
Product 1
GWP =50
GWP =70 GWP =40
GWP =70
Product 1 Burden = 30 +50 + 70 = 150
Product 2 Burden = 40 + 70 = 110
Cut off Point

Allocation Methods in LCA:
• Number of subsequent uses recycling allocation
method: burdens associated with virgin material
production are shared by all lives of the materials
• Acknowledges benefit to making recyclable materials
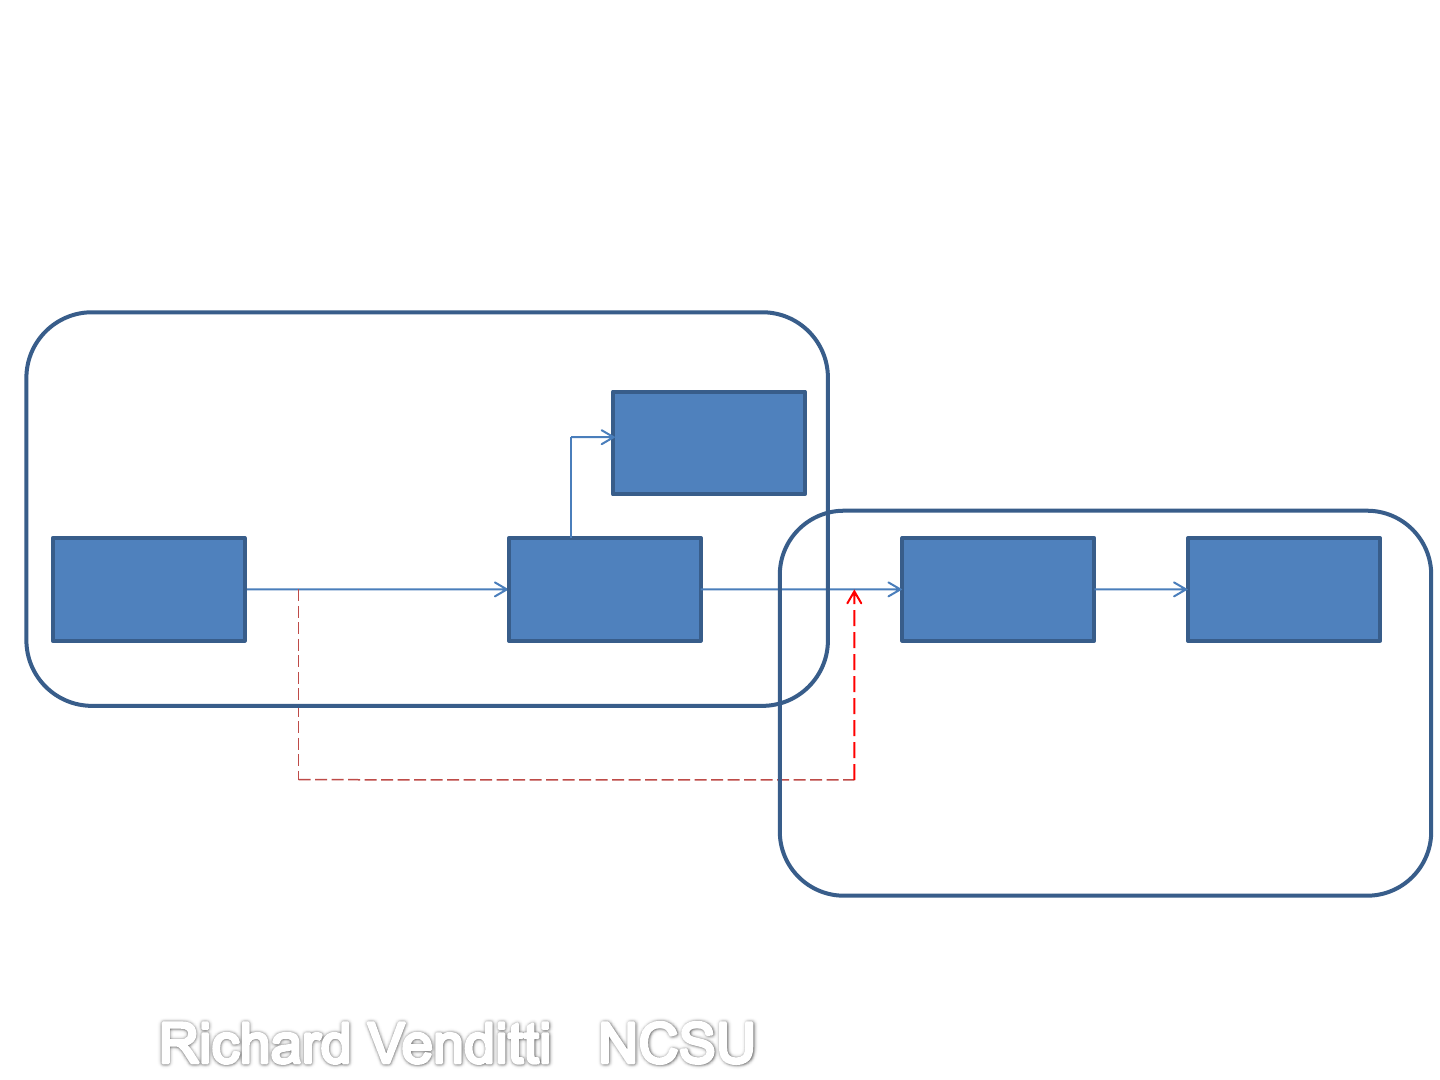
Allocation Methods in LCA:
• Number of uses method. Share common burdens.
54
GWP =30
Raw
Materials
Disposal
Product 2
Disposal
Product 1
Manuf
Product 2
Manuf.
Product 1
GWP =50
GWP =70 GWP =40
GWP =70
Product 1 Burden = 30 -15 +50 + 70 = 135
Product 2 Burden = 15 + 40 + 70 = 125
GWP =15
Transferred shared burden
GWP =15

Allocation Methods Comparison:
• Used FEFPro carbon footprint tool for paper products
• Determined carbon footprint for both number of uses
and cut off method as a function of
– Recovery rate of product
– Utilization rate of recycled fibers in product
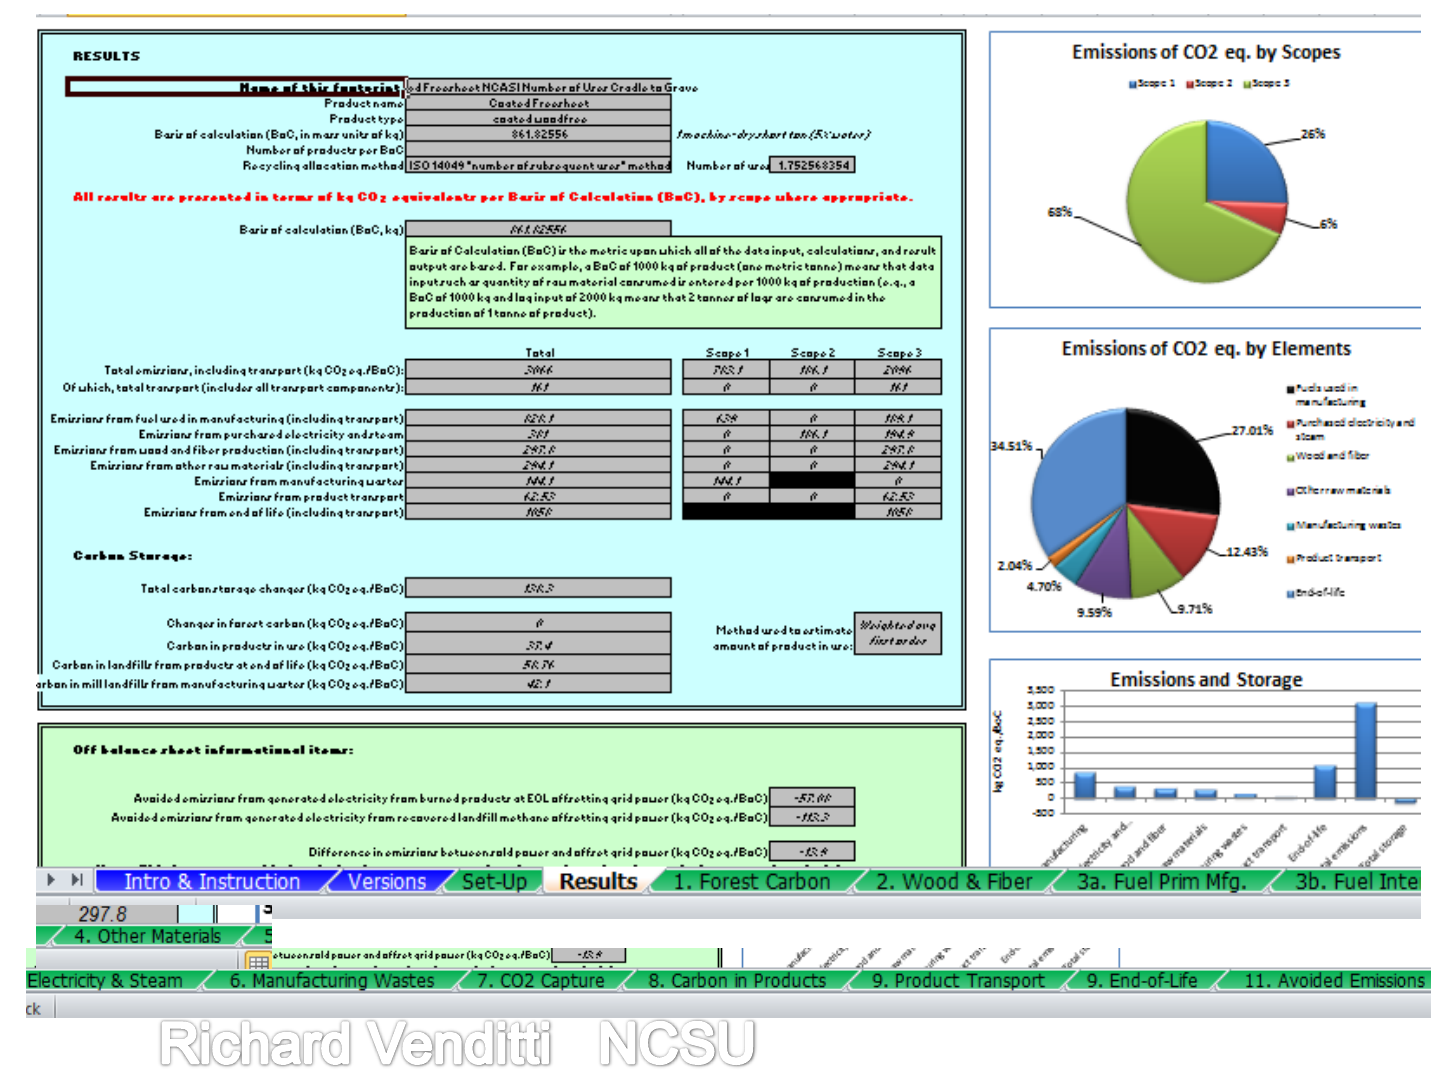
FEFPro:
Allocation Methods Comparison:
• Recovery Rate:
– Increased RR decreases carbon footprint
– Number of uses carbon footprint much less than cutoff
0.000
0.100
0.200
0.300
0.400
0.500
0.600
0.700
0 20 40 60 80 100
Cut off Number of Uses
Recovery Rate (%)
Net GHG, kg CO2eq/kg catalog
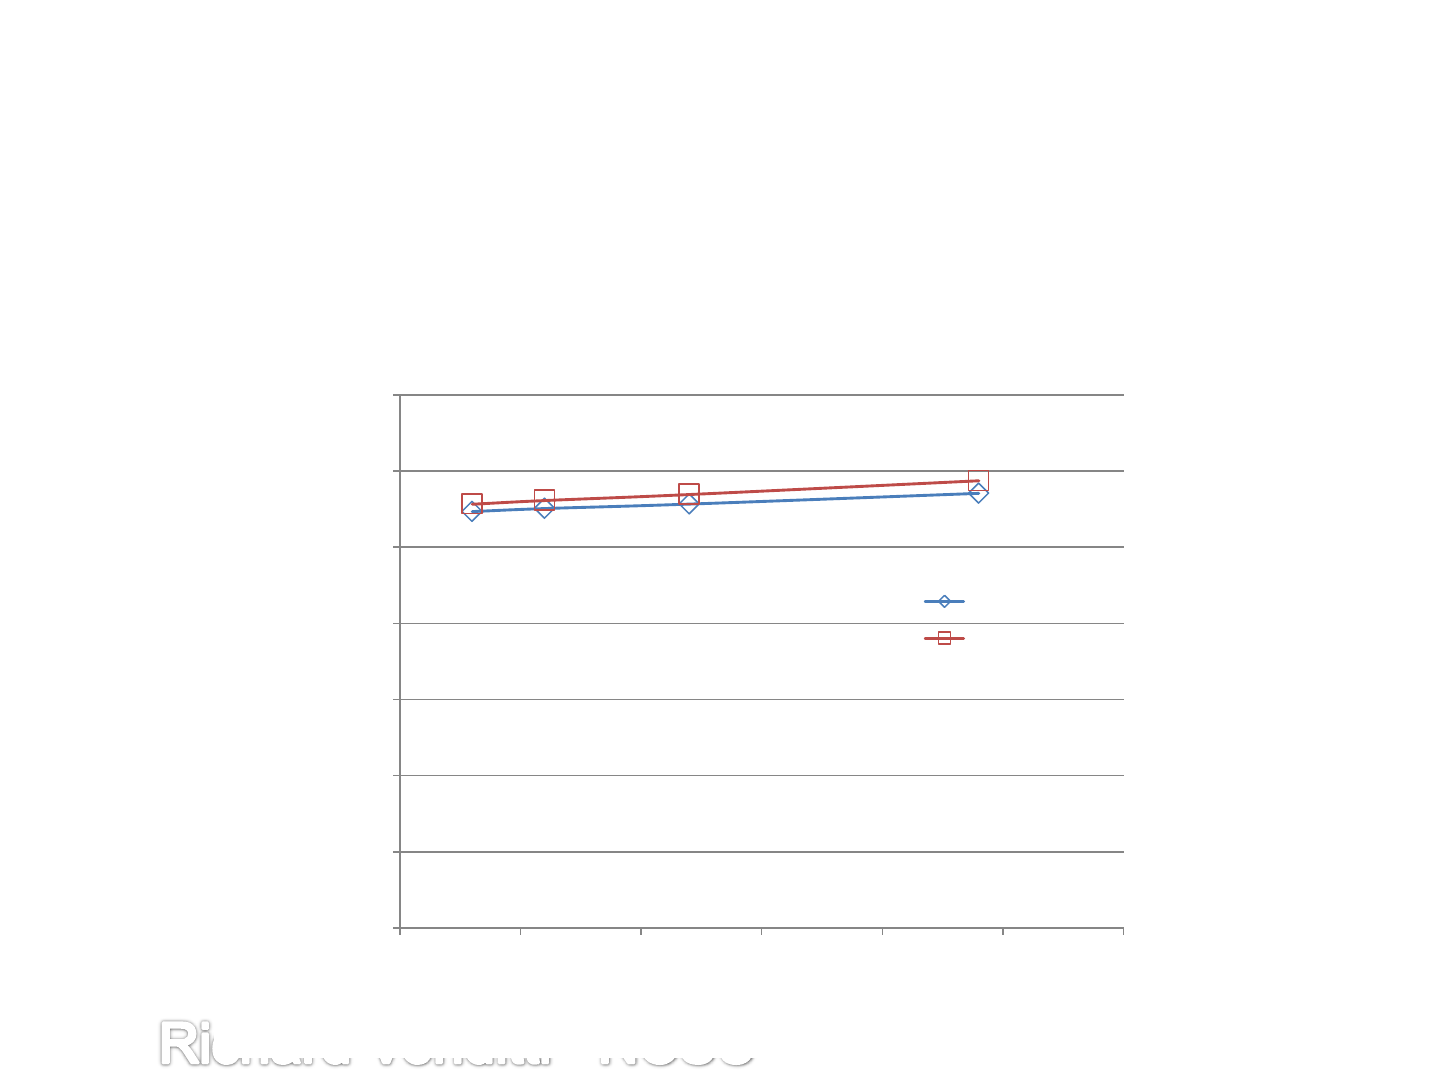
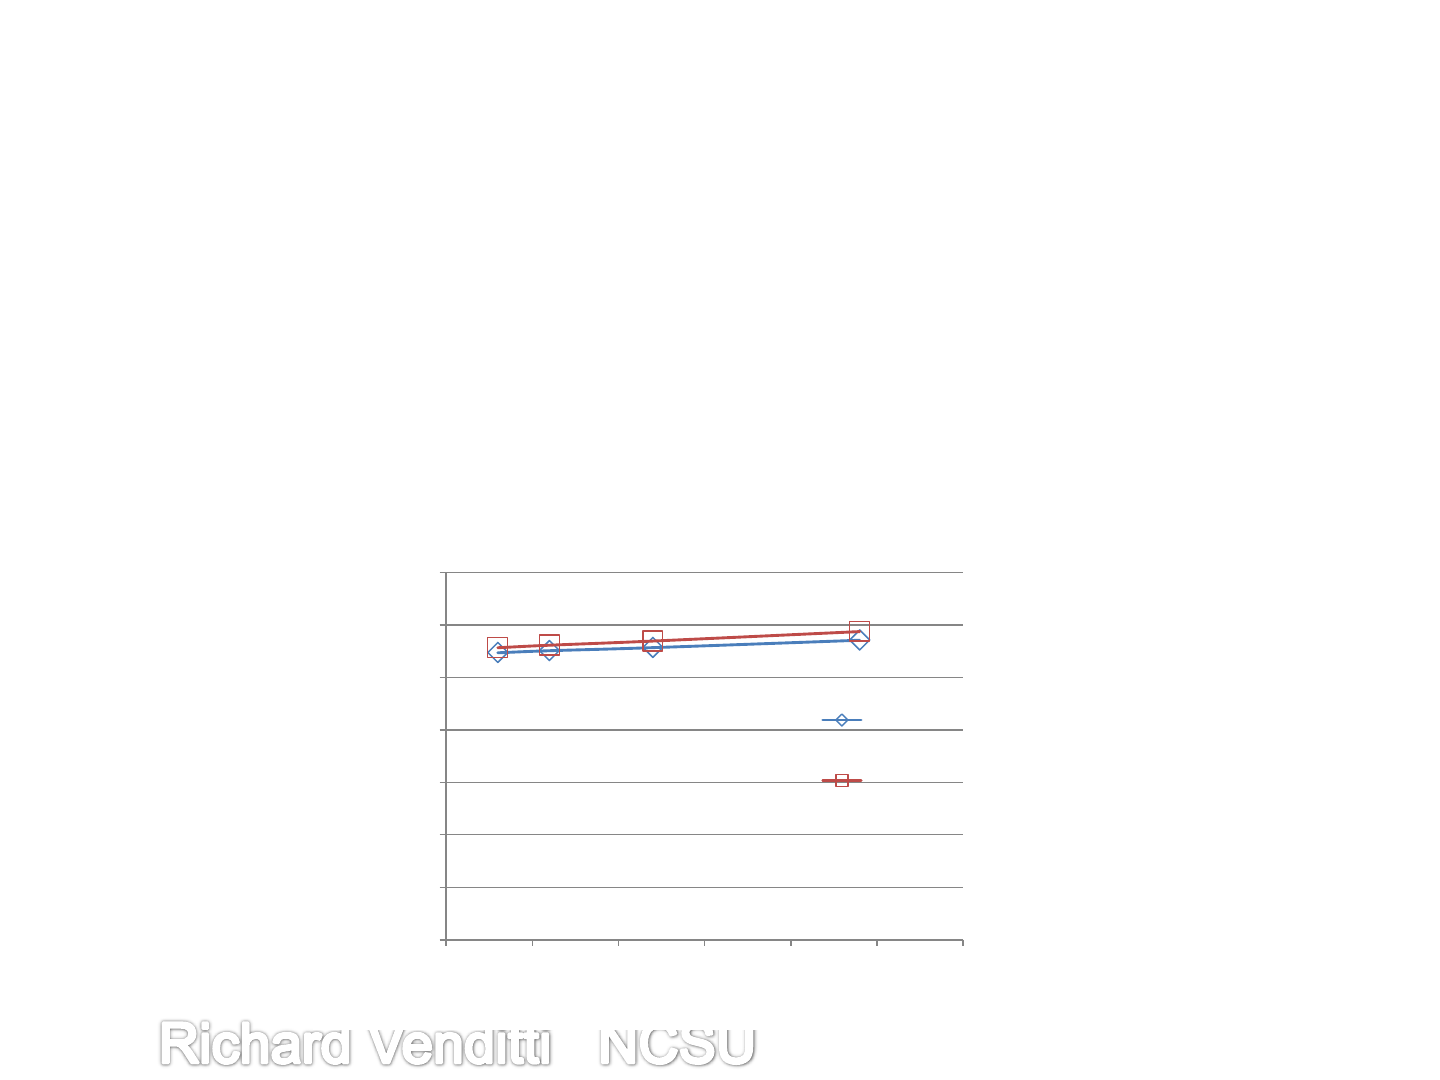
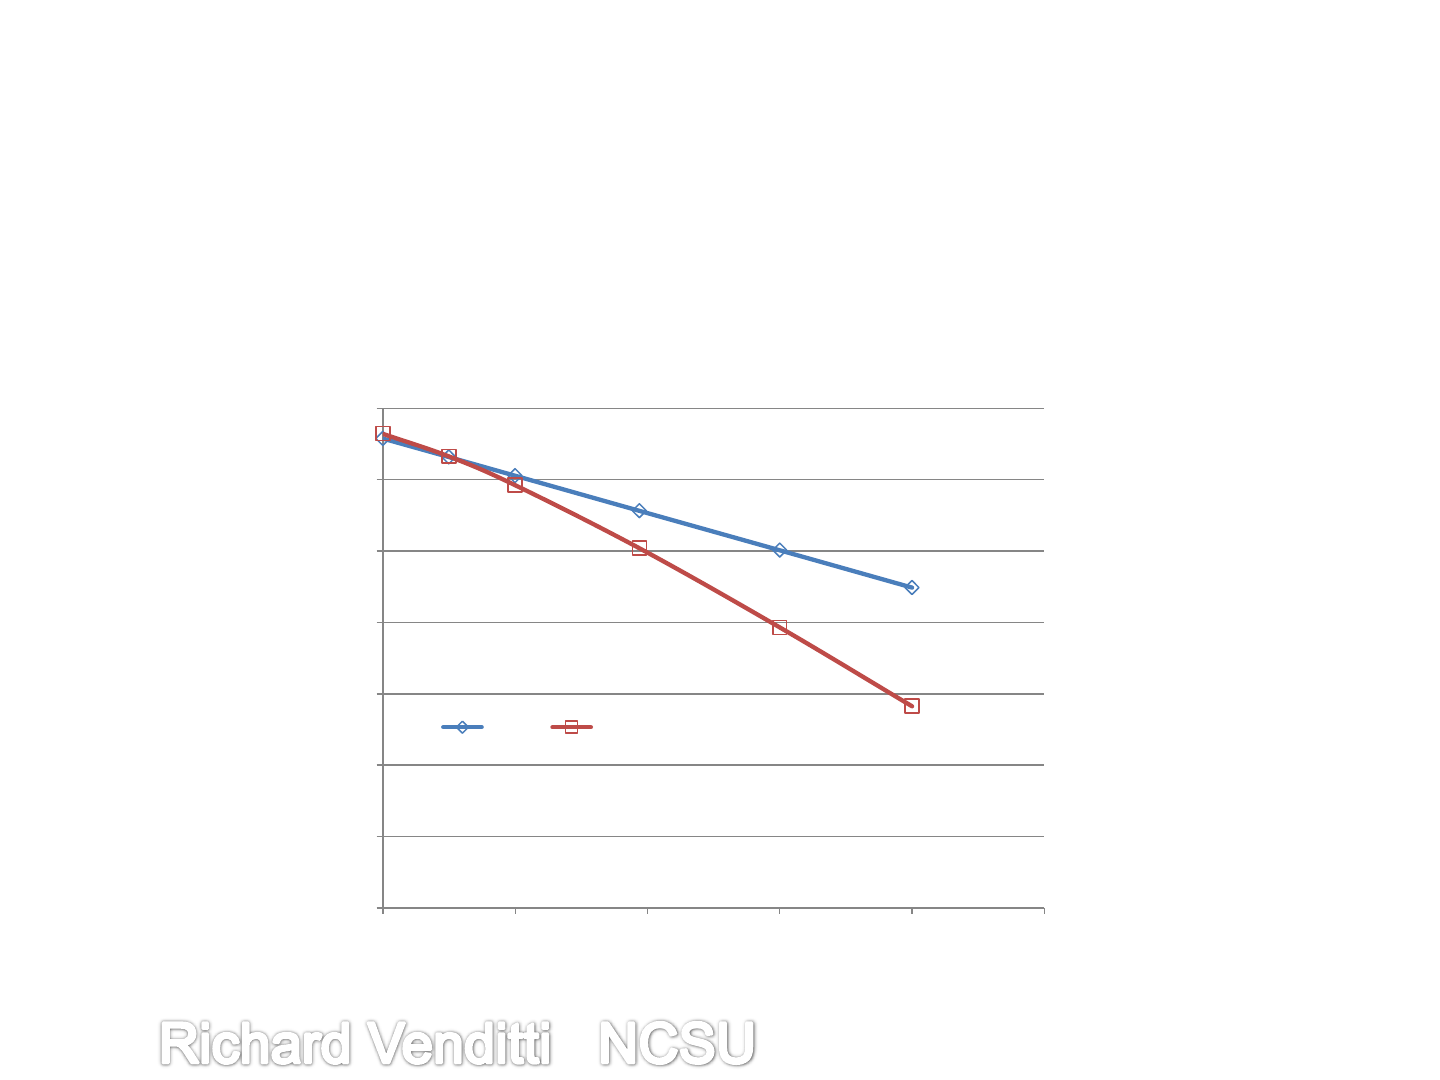
Allocation Methods Comparison:
• Utilization Rate:
– UR does not significantly impact carbon footprint
– Number of uses carbon footprint similar to cutoff
0
0.1
0.2
0.3
0.4
0.5
0.6
0.7
0 5 10 15 20 25 30
Number of Uses
Cut off method
Net GHG, kg CO2eq/kg catalog
Utilization Rate (%)

Outline
• Introduction to LCA
• LCA of Paper
• North American Printing and Writing Grade LCA’s
• Allocation methods in LCA’s
• Recommendations
59

Recommendations:
• The comparisons of different LCA studies can be extremely
difficult.
• The authority and reasonableness of LCA studies are not
consistent.

Recommendations:
• When considering two related products in the same life cycle
such as virgin or recycled materials, the choice of available
allocation methods can determine whether virgin or recycled
material is promoted.
• The number of uses method is an appropriate model for the life
cycle analysis of paper products, which is most reasonably
modeled as an open loop recycling process.

Recommendations:
• As based on data in this paper, the recovery of used paper for
manufacture of new materials or use in incineration to create
energy is more desirable than landfilling.
• With respect to the utilization of recovered paper in specific
products, the data in this paper demonstrate that a blanket
statement that all paper products should maximize use of
recovered paper is not substantiated.
• Increased recycling of paper products and the design of paper
products that are recyclable is environmentally beneficial.

Recommendations:
• Industry average data are useful for an industry to benchmark
its overall performance.
• The use of industrial averages of environmental impacts to
promote a specific paper product relative to other similar paper
products is not reasonable.
