
Rochester Institute of Technology Rochester Institute of Technology
RIT Digital Institutional Repository RIT Digital Institutional Repository
Books
2011
Life cycle analysis in the printing industry: a review Life cycle analysis in the printing industry: a review
Justin Bousquin
Marcos Esterman
Sandra Rothenberg
Follow this and additional works at: https://repository.rit.edu/books
Recommended Citation Recommended Citation
Bousquin, Justin; Esterman, Marcos; and Rothenberg, Sandra, "Life cycle analysis in the printing industry:
a review" (2011). Accessed from
https://repository.rit.edu/books/93
This Full-Length Book is brought to you for free and open access by the RIT Libraries. For more information, please
contact [email protected].

Life Cycle Analysis
in the Printing
Industry: A Review
By
Justin Bousquin
Graduate Student, E. Philip Saunders
College of Business
Marcos Esterman, Ph.D.
Assistant Professor, Kate Gleason
College of Engineering
Sandra Rothenberg, Ph.D.
Associate Professor, E. Philip Saunders
College of Business
Rochester Institute of Technology
A Research Monograph of the
Printing Industry Center at RIT
No. PICRM-2011-05

i
© 2011 Printing Industry Center at RIT— All rights reserved.
A Research Monograph of the
Printing Industry Center at RIT
Rochester, NY
January 2011
PICRM-2011-05
By
Justin Bousquin
Graduate Student, E. Philip Saunders College of Business
Rochester Institute of Technology
Marcos Esterman, Ph.D.
Assistant Professor, Kate Gleason College of Engineering
Rochester Institute of Technology
Sandra Rothenberg, Ph.D.
Associate Professor, E. Philip Saunders College of Business
Rochester Institute of Technology
Life Cycle Analysis in the
Printing Industry: A Review

Bousquin, Esterman & Rothenberg (PICRM-2011-05)
ii
With Thanks
e research agenda of the Printing Industry Center at RIT and
the publication of research ndings are supported by the
following organizations:
bc

Life Cycle Analysis in the Printing Industry: A Review
1
Table of Contents
Abstract ........................................................................................................................... 3
Introduction ................................................................................................................... 3
Methodology .................................................................................................................. 5
Analysis ................................................................................................................... 5
Scope of Study ........................................................................................................ 5
Findings ........................................................................................................................10
Goal and Scope .................................................................................................... 10
Context ............................................................................................................10
Scope ................................................................................................................ 11
Print Consumables .........................................................................................22
Life Cycle Inventory ............................................................................................25
Data Sources ...................................................................................................25
Life Cycle Impact Assessment ......................................................................27
Conclusions and Further Research ...........................................................................31
References .....................................................................................................................32
Appendix A: Life Cycle Stage Data ...........................................................................40
Appendix B: Referenced Certications and Standards ..........................................42
Appendix C: Impact Categories and Data Used in Studies ....................................43
Table of Contents

Bousquin, Esterman & Rothenberg (PICRM-2011-05)
2

Life Cycle Analysis in the Printing Industry: A Review
3
Abstract
Abstract
Life Cycle Assessment (LCA) is the leading tool for estimating environmental eects of
products and processes. Despite this wide use, LCA analysis remains problematic and
limited. Within the printing industry, one of the primary problems is non-standardized
assumptions and practices. is makes it dicult, if not impossible, to compare the
life cycle impacts of products. is paper will compare LCA studies performed within
the printing industry in order to identify common practices, limitations, areas for
improvement, and opportunities for standardization. is comparison is focused on the
data sources and methodologies used in the particular studies.
Introduction
Printing is an ubiquitous part of our lives, ranging from the printing of personal
documents and photos, to the documents we use to communicate in business and the
mass production of advertisements, marketing, and magazines. Given the pervasiveness
of print, it is not surprising that many organizations are interested in the environmental
impacts associated with printing through its life cycle. ese include impacts such as
deforestation, toxic pollution, water consumption, energy consumption, solid waste
production, and air pollution. For example, 42% of the world’s harvested industrial
wood is used to make paper (World Resources Institute, United Nations Environment
Programme, United Nations Development Programme, & e World Bank, 1998).
Within the forest products industry, the pulp and paper industry uses 84% of the energy
consumed by the forest products industry (U.S. Energy Information Administration
[EIA], 2006). A Manufacturing Energy Consumption Survey (MECS) conducted by
the U.S. Energy Information Association ranked the industry as a whole as the third
largest industrial consumer of energy, ranked only behind the petroleum and chemicals
industries (EIA, 2006). Given these impacts, a clearer understanding of the life cycle
environmental impacts of printing would naturally be of interest.
Life Cycle Assessment (LCA) had its early beginnings in the printing arena, with a
focus on packaging; the rst internal LCAs were performed by Coca-Cola in the early
1970s (Graedel, 1998). Early LCA databases focused on packaging to improve materials
choice. Since then, LCAs have been performed by almost every major print equipment
provider on a range of devices (Lexmark, 2010; Koehler, Latko, & Stocum, 2010; Ord,
Canonico, Strecker, & Chappell, 2009; Ricoh Group, 2009; Canon Inc., 2010). While
LCA is a widely used tool, it still has its drawbacks, such as expansive data requirements
and high associated costs (Reap, Roman, Duncan, & Bras, 2008a). One potential
mechanism to reduce these problems is to develop LCA standards. Initial attempts
to standardize LCA processes have been made by the International Organization for
Standardization ([ISO], 2006a, 2006b) and the Society of Environmental Toxicology
and Chemistry (Beaufort-Langeveld, Bretz, van Hoof, Hischier, & Tanner, 2003). ese
codications are meant to establish basic guidelines while remaining broad enough to

Bousquin, Esterman & Rothenberg (PICRM-2011-05)
4
Introduction
be applicable to a wide variety of practitioners.
e Electronic Product Environmental Assessment Tool (EPEAT) has taken a dierent
approach (IEEE 1680). Realizing that each industry has certain areas of major impact
and assumptions specic to that industry which would carry little weight elsewhere,
it has established product-specic standards. e U.S. ENERGY STAR certication
program is another widely recognized certication program that has led to the wide
acceptance of industry-specic Typical Electricity Consumption (TEC) procedures,
which has helped to standardize energy use calculations (U.S. Environmental Protection
Agency [EPA], 2006, 2008).
In addition to the standardization of impact assessment methods, there are also
commonly used standards that quantify specic life cycle impact categories. For
example, the Intergovernmental Panel on Climate Change is frequently cited for 50-
and 100-year greenhouse gas (GHG) equivalent carbon dioxide (CO
2
e) calculations
(Intergovernmental Panel on Climate Change [IPCC], 2006), as is the British Standards
Institution’s Publicly Available Specication 2050 (PAS 2050) on GHG emissions
(British Standards Institution [BSI], 2008).
Despite these standards and certication programs, there is still a great deal of
uncertainty and disagreement about the interpretation of the many LCA studies in the
printing industry. In this paper, several LCA studies are compared in order to identify
common practices, limitations, and areas for improvement and standardization.
Life Cycle Analysis in the Printing Industry: A Review
5
Methodology
Methodology
Analysis
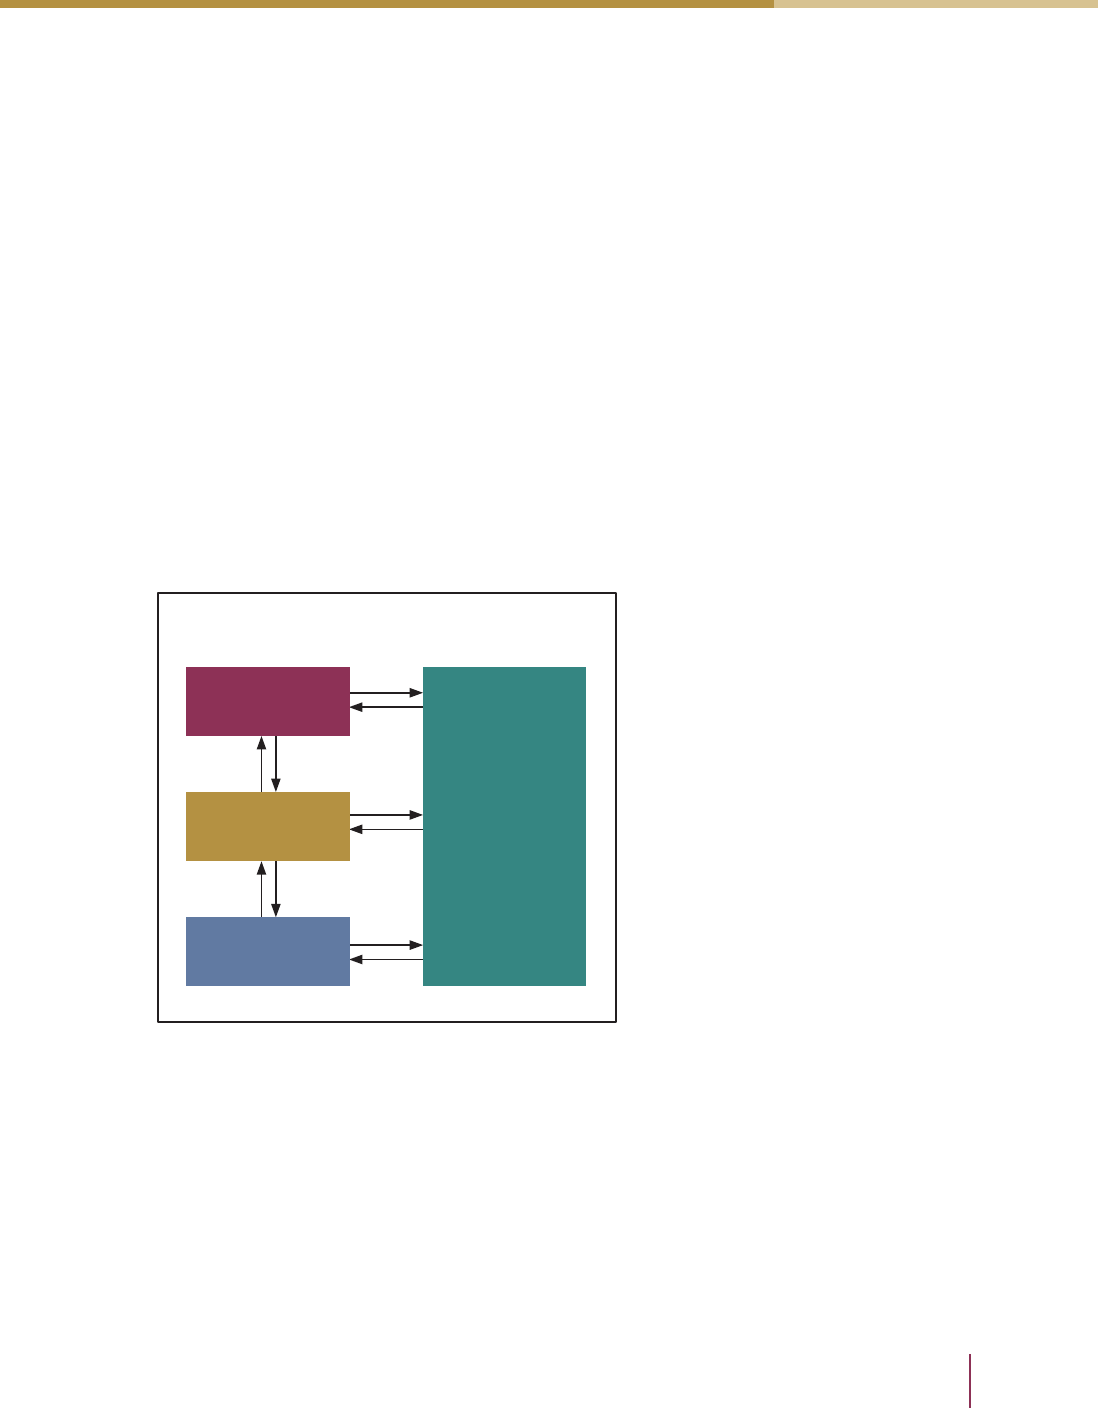
e life cycle assessment framework specied by ISO 14040 is shown in Figure 1.
e categories shown in the framework will serve as the basis for conducting the
comparisons that follow, which are the goal and scope, the inventory analysis, the
impact analysis, and the interpretation of the results. e comparison of goal and scope
includes the study context, the delineation of the functional unit, denition of the
system boundaries, and determination of the printer system items under consideration.
It is important to note dierences between traditional LCAs and decision tools
such as Score Cards, hybrid LCA, and Streamlined LCA (SLCA). Inventory analysis
includes both Life Cycle Inventory (LCI) and Life Cycle Inventory Allocation (LCIA).
Comparison in this phase is focused on the data sources used and on the methodologies
used in these particular studies. e comparison of impact assessment will focus largely
on the particular impact categories selected and how they relate to the original goal and
scope of their study. Lastly, the weighting of impact categories and a comparison of how
these results were interpreted will be discussed, followed by a short discussion on the
importance of the critical review.
Figure 1. Life cycle assessment framework from ISO 14040
Scope of Study
Since the focus of this research is the printing industry, the studies were selected
because they either included imaging equipment or were highly relevant to imaging
equipment. e term “imaging equipment” is dened in the energy-using products
(EuP) preparatory studies as “commercially available product which was designed for
the main purpose of producing a printed image (paper document or photo) from a
digital image through a marking process” (Stobbe, 2007, p. 12). Table 1 summarizes the
Life cycle assessment framework
Goal and scope
definition
Inventory
analysis
Impact
assessment
Interpretation
Bousquin, Esterman & Rothenberg (PICRM-2011-05)
6
Methodology
studies; they are described in greater detail below. It should be noted that while pulp
and paper production are clearly an important contributor to the life cycle impacts
of printing, explicit studies of these industries are not included in this review since
their impacts are typically accounted for in the studies reviewed in this work. For the
interested reader, paper and pulp industry LCAs such as those by Dias, Arroja, and
Capela (2007) and Miner (2010) provide excellent reviews of paper and pulp industry
LCA analyses.
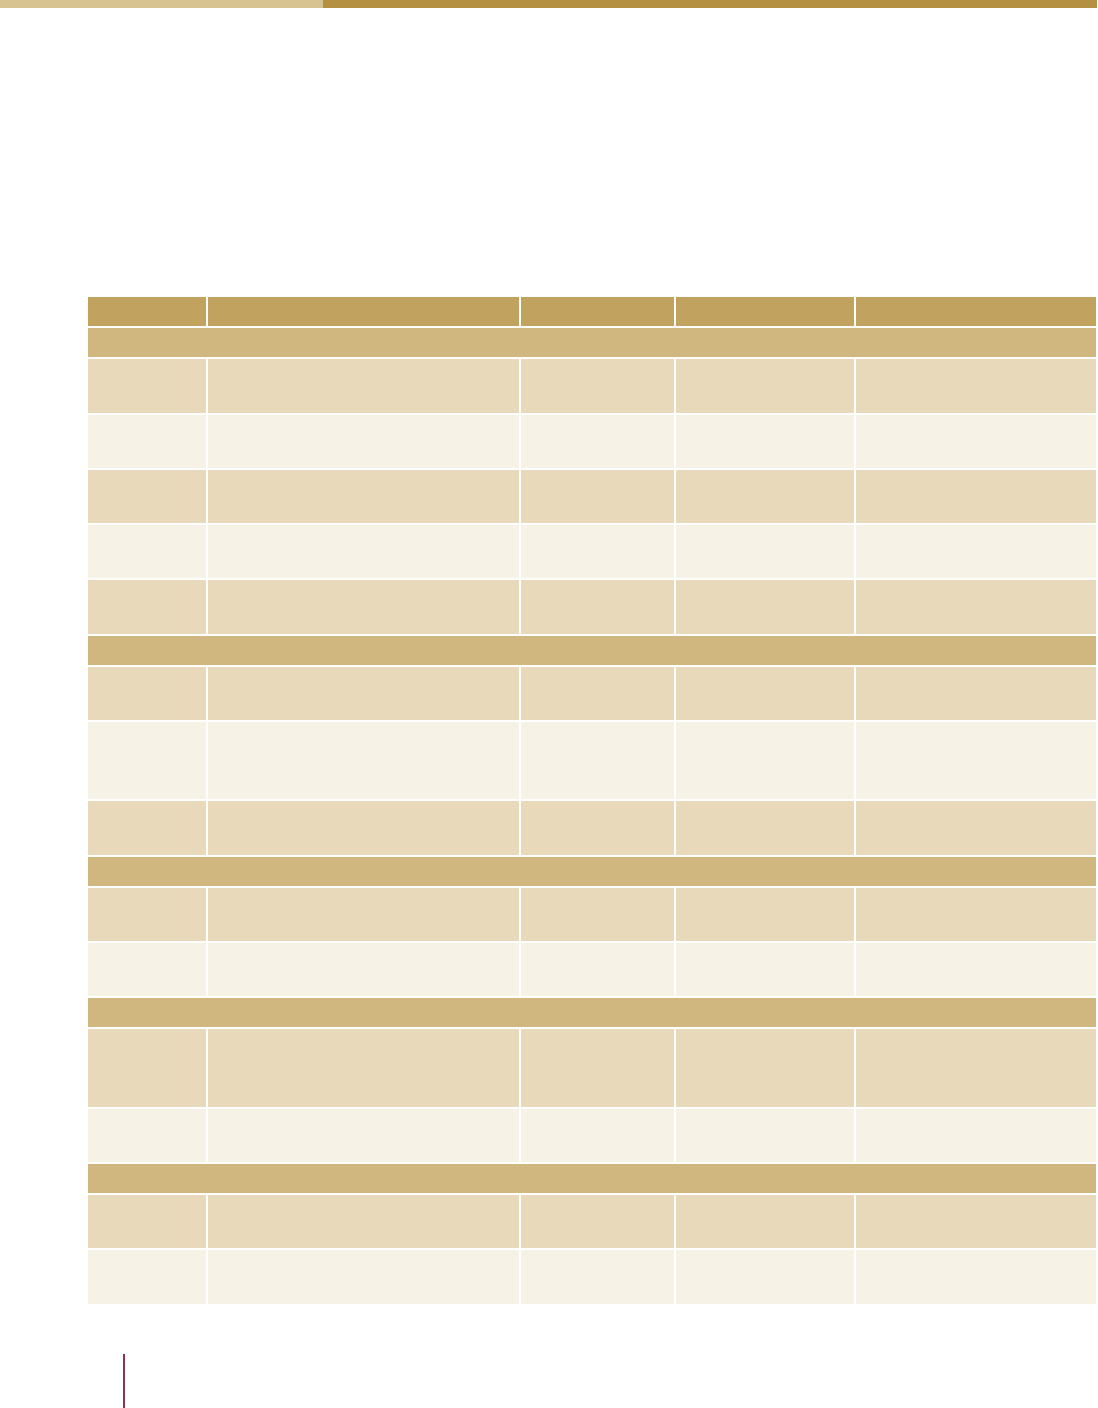
Table 1. Studies analyzed
Category/# Short title Author & Year Product Purpose
Printers
[1]
Product Environmental Metrics
for Printers
Ord et al. 2009 Printers Internal design tool
[2] Solid Ink LCA
Koehler et al.
2010
Solid ink and ink
jet printers
Comparative LCA
[3]
Eco-efficiency Gains From Re-
manufacturing
Kerr & Ryan
2001
Photocopier
remanufacture
Comparative LCI: Reuse
vs. new
[4]
Extended Producer Responsibil-
ity for Waste Electronics
Mayers et al.
2005
HP printers
Comparative LCA: End-
of-life
[5]
EuP Preparatory Studies “Imag-
ing Equipment”
Stobbe 2007
EP & IJ printers,
copiers and MFDs
Industry baseline LCA
Cartridges
[6] LCA Toner Cartridge C4127X
Berglind &
Eriksson 2002
HP cartridge
C4127X
Comparative LCA:
Remanufacture
[7]
LaserJet Cartridge Life Cycle
Refresh Study
Four Elements
Consulting
2008
HP LJ 10A and
remanufactured
cartridges
Comparative LCA:
Remanufacture
[8]
Life Cycle Inventory of Toner for
Xerographic Processes
Ahmadi et al.
2003
Toner LCI of toner
Print products
[9]
Life Cycle Carbon Footprint of
the National Geographic
Boguski 2009 Magazine Carbon footprint
[10]
LCA: Flexographic and Rotogra-
vure Printing
Veith & Barr
2008
Packaging
materials printing
Comparative LCA
Design methodologies/Tools
[11]
Methodology for the Evaluation
of Product Sustainability at the
Design and Development Stage
Silva et al.
2006
Not applicable
Design stage
sustainability scoring
[12]
Development of a Green Score-
card
Ebner et al.
2009
Printers
Design directional
indicator
Consumer “calculators”
[13]
HP Carbon Footprint Calculator
for Printing
Hewlett-
Packard 2009
Personal and
office printers
Cost and carbon
calculator
[14] Xerox Sustainability Calculator Xerox 2008
Personal and
office printers
Compare baseline and
optimized print scenarios

Life Cycle Analysis in the Printing Industry: A Review
7
Methodology
A subset of studies include commercially available consumer and business products:
1. Hewlett-Packard’s (HP) Imaging and Printing Group (IPG) reported on the
development process undertaken to establish the initial internal metrics that
will guide design, chart progress, and set environmental goals for their printer
products (Ord et al., 2009).
2. e Xerox Solid Ink LCA white paper serves as a quick overview of a
comparison study performed on a color solid ink multifunction printer and a
comparable color laser multifunction printer (Koehler et al., 2010).
3. “Eco-Eciency Gains from Remanufacturing” (Kerr & Ryan, 2001)
investigates whether remanufacturing could reduce the resource intensity of
a product system. is study was not intended to assess the overall life cycle
environmental impacts of a photocopier or the remanufacture of such products;
however, LCA processes and delineations were adhered to.
4. Life cycle assessment and costing are used to explore some of the possible
environmental impacts that may result due to the mass-based recovery and
recycling targets established under the European Union’s (2003a) Waste
Electrical and Electronic Equipment (WEEE) directive, based on a case study of
HP printer recycling in the United Kingdom (Mayers, France, & Cowell, 2005).
Specic environmental objectives and standards for treatment and recycling
processes are suggested as an alternative to this mass-based approach.
5. e EuP Preparatory Studies on imaging equipment are the result of extensive
research conducted by the Fraunhofer IZM consortium with the collaboration
of industry and stakeholders (Stobbe, 2007). e study is rather extensive, going
into much greater detail than typical LCAs on denitions of products, markets,
assumptions, trends, and opportunities for improvement and policy. As a
result, the study may serve as an important resource for printing industry LCA
practitioners.
LCA studies of print consumables such as ink, toner, and cartridges were included as
another subset. e remanufacture and reuse of toner cartridges has garnered particular
interest and debate. ese studies included:
6. One of the rst LCAs to assess the environmental impact of cartridge
remanufacture and reuse for laser printers was Berglind and Eriksson (2002).
e environmental impact of an original HP C4127X toner cartridge and
its disposal according to HP’s process at the time was compared to the
remanufacture and reuse of the same cartridge at Tepro Rebuild Products AB.
7. Four Elements Consulting revisited the 2004 First Environment LCA study,
which again compared a popular HP Laser Jet print cartridge to the average
compatible remanufactured one. is version of the study updated data related
to the production/remanufacturing practices, end-of-life trends, and product

Bousquin, Esterman & Rothenberg (PICRM-2011-05)
8
Methodology
quality and reliability (Four Elements Consulting, 2008). e most signicant
update was from data gathered during a 2007 Quality Logic reliability
comparison study. is study examined dierences in print quality page
acceptance between original and remanufactured toner cartridges. e reason
this is an important consideration is that paper consumption dominates the
environmental impact of the printing process, and increases in reprinting due
to unacceptable print quality increases this consumption.
8. e study by Ahmadi, Williamson, eis, and Powers (2003) presents results
of a Life Cycle Inventory (LCI) of toner used in the xerographic process.
Specifying a print system consumable for study only to the point of inventory
allows for greater depth of data collection, and results can potentially be
included in the use phase of future printer LCA studies if approached correctly.
In addition to the commercially available consumer and business products, two studies
were included that examined commercial printing applications. ese commercial
printing process comparisons were included to highlight similarities and dierences
with the environmental issues faced by this sector of the printing industry.
9. Although there are published assessments of newspapers, books, and other
magazines (e.g., Gower et al., 2006), only that of the National Geographic is
included in this study as it includes the print process in its supply chain. is
study serves as an excellent example of how increased collaboration upstream
and downstream can improve data relevancy. National Geographic, Verso
Paper, and Quad Graphics all provided high quality data to account for GHG
emissions throughout the life cycle of the magazine (Boguski, 2010). is
allowed for the most signicant improvement opportunities to be identied
within paper manufacturing and printing.
10. DuPont’s LCA compares two commercial print processes—exography and
rotogravure. e study is meant to provide insight for the value chain and to
support customer decision making (Veith & Barr, 2008). Markets for these two
print processes have been increasingly overlapping with quality improvements
in exographic technology, making them more comparable.
ough this review focused on LCAs, there is industry interest in streamlining tools
and making them more eective for design and/or the decision-making process. Design
practitioners face even greater diculties with data uncertainty, as oen the assessment
must be performed before any signicant development of the product and in the
presence of scarce data (Ben-Haim, 2006; Duncan, Bras, & Paredis, 2008). erefore,
several tools that are simplied for decision making and that only examine one impact
category—such as the green scorecard or carbon footprint calculators—were also
included, provided that a life cycle approach was taken in the study.

Life Cycle Analysis in the Printing Industry: A Review
9
Methodology
11. A study by Silva, Jawahir, Dillion, and Russell (2006) develops a qualitative
streamlined “Sustainability Scoring” method for design stage decisions. Six
elements are dened: Environmental impact, societal impact, functionality,
resource utilization and economy, manufacturability, and recyclability/
re-manufacturability, within which ten sub-elements are selected and weighted
for evaluation. e study compares how design practitioners and consumers
place dierent levels of importance on these elements.
12. Xerox’s Green Scorecard is neither a design tool nor a substitute for LCA; rather,
it is meant to guide selection of eco-eciency research opportunities in digital
printing. It is based on quantied input data for six criteria and was validated
using LCA results (Ebner, Chang, Knapp, Deyoung, & Latko, 2009).
Oce and consumer customers are interested in knowing how their printers are
impacting the environment and how they can reduce this impact. Some device
manufacturers now oer online calculators where users can input certain criteria
and receive suggestions on ways to reduce their environmental impact. Two online
calculators comprised the h and nal subset of studies included:
13. e HP Carbon Footprint Calculator for printing gives users a use-phase
estimate of the electricity cost and corresponding CO
2
e emissions that result
from the production of that electricity (Hewlett-Packard Development
Company [HP], 2009). e cost and carbon footprint of the paper used is also
estimated. e footprint results can be converted into equivalent miles or km
driven in an automobile, putting the results into perspective for users.
14. e Xerox Sustainability Calculator is not based on specic brands or models;
rather, it is meant to compare customer baselines with an optimized print
option (Xerox Corporation, 2008). Xerox representatives are available to oer
customers actual optimization scenarios with more varied input variables.
Bousquin, Esterman & Rothenberg (PICRM-2011-05)
10
Findings
Findings
Goal and Scope
Context
e goal of a particular Life Cycle Assessment (LCA) is essential to identify and assess
impacts to be examined, omissions that need to be made, and other basic underlying
assumptions. e descriptions of the studies identied in the prior section briey
described the goal of each study, but the context within which the study was conducted
is equally important, as it also plays a role in the decision-making process (Wenzel,
1998). Organization aliation and the intended use of the studies are two characteristics
that have been used in this paper to identify the context of these studies. Organizational
aliation refers to the sector from which the practitioner who conducted the LCA
came from, namely academia, industry external (consultant), or industry internal. e
second characteristic refers to the intended audience, which is either “Internal Design,”
“External Marketing”, or to establish a general “Baseline” for comparison of two or more
alternative technologies. ese results are summarized in Table 2 and Table 3.
While the results in Table 3 cannot be considered representative of all studies, it should
be noted that academic studies were primarily conducted to establish baselines or for
internal design purposes. In addition, no studies that were conducted by external
consultants were used for internal design purposes, while the majority of the studies
that were conducted for external marketing were reviewed by academia or a consultant.
Table 2. Study context
Study # Organization affiliations Practitioner Audience
[1] Hewlett-Packard Industry Internal Internal – Design
[2] Xerox (RIT Review) Industry Internal External – Marketing
[3]
Lund University, Melbourne Institute of
Technology, Fuji-Xerox
Academia Internal – Design
[4] University of Surrey (HP Data) Academia Baseline
[5] Fraunhofer IZM Academia Baseline
[6] Kalmar, Black and Write Academia Baseline & Marketing
[7] Hewlett-Packard, Four Elements Consulting Industry External Baseline & Marketing
[8] Clarkson University (Xerox Data) Academia Baseline
[9]
Harmony Environmental, National
Geographic, Verso Paper, Quad Graphics
Industry External Baseline & Marketing
[10] DuPont, Five Winds International (Review) Industry Internal Baseline & Marketing
[11] University of Kentucky, Lexmark Academia Internal – Design
[12] Xerox Industry Internal Internal – Design
[13] Hewlett-Packard Industry Internal External – Marketing
[14] Xerox, consultants Industry External External – Marketing

Life Cycle Analysis in the Printing Industry: A Review
11
Findings
Table 3. Summary of study context
Affiliation
Intended audience
Internal – Design External – Marketing Baseline
Academia 2 1 4
Industry Internal 2 3 1
Industry External 0 3 2
Scope
e scope of the LCA is an early decision with great signicance. As noted by Reap et
al. (2008a), “Foundational decisions about the basis of comparison (functional unit),
bounds of the study, and physical relationships between included processes largely
dictate the representativeness and, therefore, the value of an LCA” (p. 290). is section
of the paper will compare the functional unit and system boundaries decisions made in
the studies identied in the prior section.
Functional Unit
e functional unit is essential, as it denes the output by which products will be
compared. All of the analysis parameters are, therefore, normalized to it. ISO denes
the functional unit as the “quantied performance of a product system for use as a
reference unit” (ISO 14044:2006), and it is “necessary to ensure comparability of LCA
results” (ISO 14040:2006). Dening a functional unit is made more complex by the
multitude of functions a particular product can perform for a consumer. For example,
multifunctional devices (MFD) combine scanning, faxing, copying, and printing
into one machine rather than multiple machines. Intuitively, one would assume that
this would be environmentally benecial, reducing the materials requirement and
minimizing the energy consumptions while idle. In addition, the factors that aect the
purchase decision, such as aesthetics or size, must also be accounted for when dening
the functional unit.
A short description of the functional unit dened in each study in presented in Table
4. Given that the studies examine closely related products, one might conclude that
the functional units dened would also be closely related and would not inhibit cross-
comparisons. ere are many specic characteristics that must be consistent, however,
or the results will not be comparable. For example, the printing speed, typically
designated as prints per minute (PPM), is sometimes omitted, yet it is directly related
to energy consumption (Stobbe, 2007). Other factors which contribute to the increased
consumption of paper should also not be overlooked, as the cumulative consumption
of paper over the useful life of the printer becomes very important. Table 5 outlines
the dierent assumptions for device useful period used in comparisons. Allowing
for comparisons of alternatives that lead to reduced consumption of paper oen
requires functional units that are exibly dened to include both paper and other
communications media. For example, in Xerox’s Green Scorecard, a comparison can be
made on the basis of units of information being conveyed (Ebner et al., 2009).
Bousquin, Esterman & Rothenberg (PICRM-2011-05)
12
Findings
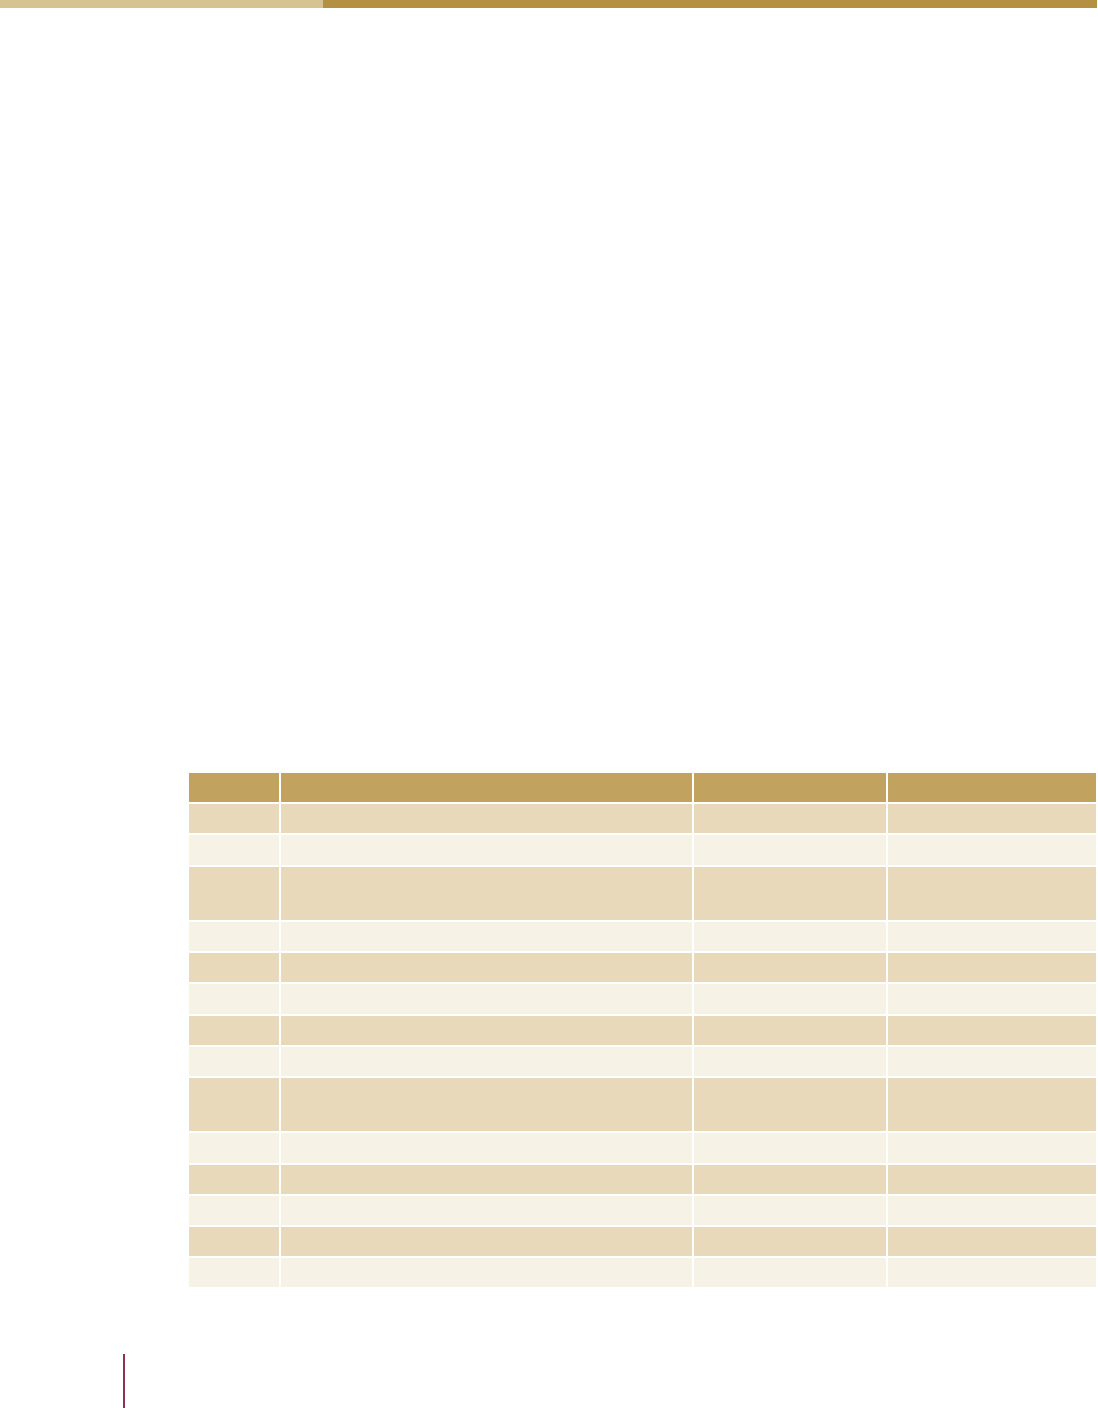
Table 4. Study functional unit comparison
Study # Product(s) Purpose Stated functional unit
[1] Printer devices Internal design tool
Per image printed. Considers expected life of
print system and images printed per month.
[2] Solid ink vs. ink jet printer Comparative 25,000 prints/month over a four-year life.
[3]
Manufactured vs.
remanufactured copiers
Comparative
12 million copies over a maximum period of
10 years for each life cycle.
(1)
[4] 3,250 imaging devices
Comparative
(End-of-life)
21.6 tonnes printer waste.
[5]
Electrophotographic and
ink jet printers, copiers and
multifunctional devices
Baseline
Average daily use pattern (pages/job,
number of jobs and idle time, on- and off-
mode time).
[6] Cartridge remanufacture Comparative
“30,000 copies with 5% average coverage.”
The duration is 1 year.
(2)
[7] Cartridge remanufacture Comparative
Printing of 100 usable monochrome one-
sided pages. Consistent with Quality Logic
study. 6,000 pages in accordance with ISO.
(3)
[8] Toner Baseline
One metric ton of toner produced - enough
to produce an average of 22 million images
on A4 with 6% coverage.
[9] Magazine Baseline One magazine, avg weight of 349 g.
[10]
Flexographic and rotogravure
packaging print processes
Comparative Area of imaged plate or printed substrate.
[11] No product evaluated
Design tool
development
parameters
Over 5 functional years.
(4)
[12] Printers (non- specific) Design tool
A unit of information: A4 impression of
average area coverage (5-6% per color). 10
million units of information.
[13] Personal and office printers
Cost and CO
2
e
calculator
Variable, pages printed per year and printer
life.
[14] Personal and office printers
Compare baseline
and optimized print
scenarios
Number of images per month; results are
annualized.
(1) Study compared life cycles of manufactured vs. remanufactured devices, but these were the use-phase
assumptions that could have been used as a possible functional unit.
(2) Allows comparison of new cartridge versus a remanufactured cartridge which can be relled 3 times in
a year assuming a 30,000 page yield and 10,000 page monthly use volume.
(3) ISO/IEC 19752.
(4) Not directly stated in study. Evaluates alternatives during design, no comparison performed.

Life Cycle Analysis in the Printing Industry: A Review
13
Findings
Table 5. Device useful period (InfoTrends data as shown in Stobbe, 2007)
Device Life cycle
(1)
Retirement period
(2,3)
Electrophotographic printer (monochrome) 2-3 years 3-5 years
Electrophotographic printer (color) 2-3 years 4-5 years
Copier (monochrome) 2-4 years 4-5 years
Copier (color) 2-3 years 4 years
Ink jet printer 2-3 years 3-5 years
Facsimile machine 2 years 4 years
(1) Life Cycle is the period of time where the device is expected to be in use.
(2) Retirement period is the number of years between production and disposal, as devices are slowly retired.
(3) e number of devices is considered to gradually decrease by 1/3 each year over this retirement period.
An alternative to using years is to measure the number of images or documents over
the life of the equipment. is option has the advantage of allowing easier comparison
of machines with higher and lower outputs. One commonly cited number is that
the typical oce employee prints 10,000 pages per year (Australian Government
Department of Families, Housing, Community Services and Indigenous Aairs
[FaHCSIA], 2007). e EuP recognized a need for market and usage pattern data and
addressed these issues in their initial report. Table 6 summarizes some of these data,
based on an InfoTrends report. ese results were based on a large pool of units but
were averaged to the printer unit rather than per employee.
Table 6. Printer usage patterns (InfoTrends data as shown in Stobbe, 2007)
Imaging equipment
Average output
2005 (1 year)
(1)
Device composition
(2,3)
Number of units
Electrophotographic printer
26,360 pages/unit
(2197 pages/month)
12% color 88% B&W 16,654
Electrophotographic copier
16,218 pages/unit
(1352 pages/month)
6% color 94% B&W 6,351
Ink jet printer
876 pages/unit
(73 pages/month)
3% MFD 97% printer 90,172
Ink jet copier
1,440 pages/unit
(120 pages/month)
34% MFD 66% copier 20,131
(1) Page output was averaged over the total number of units for the year.
(2) Electrophotographic equipment included both color and black and white.
(3) Ink jet equipment included some multifunctional devices.
With these usage data in mind, a closer comparison of the assumptions behind the
functional units used in the studies is insightful. Table 7 shows the studies which have
functional units that are dependent on, or include, a page output. When considering
page outputs, it is important also to consider the type of printer and its speed (PPM).
When considered with the usage period, a direct comparison is facilitated.

Bousquin, Esterman & Rothenberg (PICRM-2011-05)
14
Findings
Table 7. Printer usage assumptions*
Study # PPM
(1)
Printer type Pages Pages/Month
Average
coverage
Time period
(2)
[6] 17 LaserJet 30,000 2,500 5%
1 yr
(3 cartridges)
[7] 25 LaserJet 100 Not available Not available Not available
[2] 50 Color laser MFD 1,200,000 25,000 5-6% 4 yrs (1 device)
[3]
100
(3)
65
(4)
5100 B&W copier
DC 265 B&W copier
12,000,000 100,000 Not available 10 yrs max
(6)
[8] 135 B&W copier
(5)
22,000,000 611,111 6% 3+ yrs
(6)
[12] User input User input 10,000,000 Not available 5-6% User input
[1] User input User input User input Not available Not available User input
[13] User input User input
User input
(10,000)
(7)
Not available
(833)
(7)
Not available
User input
(5 yrs)
(7)
[14] User input User input User input Not available Not available
Results
annualized
* “Not Available” data are those that were not provided in the publications or reports. “User Input” data are
variable data that the tool user must enter at the beginning of the assessment.
(1)Printer speed is indicated by prints per minute (PPM).
(2)Time periods are either the time limitations on the study or the expected useful life of the devices being
studied.
(3)Xerox 5100 Copier specications.
(4)Xerox Document Centre 265 Digital Copier specications.
(5)Xerox (1997) Product Safety Data Sheet.
(6)Limit on imaging device useful life.
(7)ese are the default settings used.
e monthly outputs in Table 6 are small compared to those used in the studies (see
Table 7). Stobbe (2007) did not include the images per minute (IPM) for these device
results. However, several other electrophotographic printers and copiers in the EuP
study used assumptions of 30 IPM and 26 IPM, respectively. ese print rates are
comparable to those in studies 6 and 7.
HP’s carbon calculator has a variable functional unit set by the user (HP, 2009). e
functional unit terms, years of device operation, and number of pages printed per year
can be set to match the users’ perceived actual usage parameters. In many cases the
users may not know their actual usage patterns, so defaults of 10,000 prints per year
and a ve-year useful life are used. Upper limitations are placed on the annual pages
corresponding to the number of pages that could be printed at the device’s speed over 8
hrs/day, 5 days/week, for 52.2 weeks/year.
Another important consideration is the push for paperless communications. Providing
the user with paperless options allows the print or digital decision to be made on a case-

Life Cycle Analysis in the Printing Industry: A Review
15
Findings
by-case basis depending on the user’s needs and preferences. e importance of this
trend is that it creates a need for functional units which allow for comparisons between
these two forms of communications. By employing approaches such as “information per
unit of paper mass,” these types of comparisons will be enabled, allowing such studies to
remain relevant when compared to new media (Hischier & Reichart, 2003).
System Boundaries
To label an assessment tool as a “life cycle assessment” inherently suggests that the entire
life cycle of the product will be examined for environmental impacts. For the purposes
of this paper, life cycle “stages” refers to the cradle-to-grave process, from the acquisition
of the raw materials through production, use, and eventual end-of-life disposition
(reuse, remanufacture, recycle, disposal). Accurately quantifying all ows in and out of
the product system would be extremely costly and time-intensive. In consideration of
these concerns, system boundaries are set to distinguish which impacts will be included.
Inappropriate boundary selection poses a risk that LCA results will not suciently
reect reality, leading to incorrect interpretations (Graedel, 1998).
Most of the studies examined, including the design decision tools, do consider inputs
from all stages of the product life cycle. is does not mean, however, that all inputs
from each stage are accounted for. In addition, the depth to which the environmental
impacts for these inputs are accounted for is also varied. Reap et al. (2008a) described
four approaches for addressing boundary selection problems: qualitative or semi-
quantitative approaches, quantitative approaches guided by data availability, quantitative
process-based approaches that use more rened cuto criteria, and input-output-based
approaches. ese four approaches are evident to some extent in the selected studies.
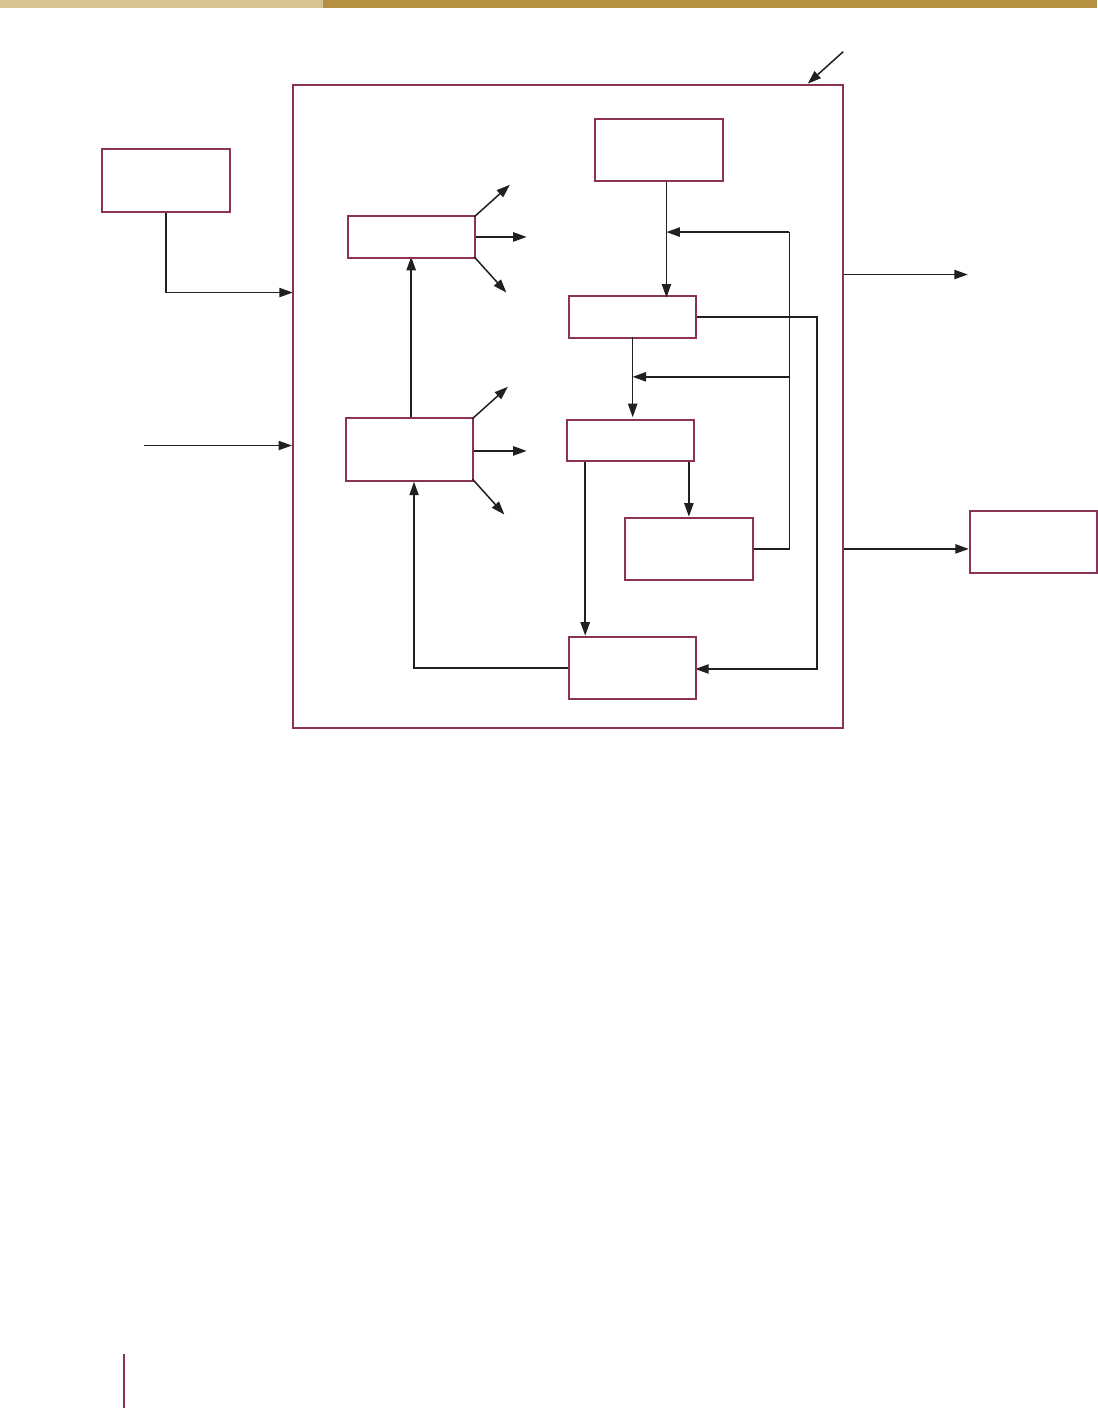
e main life cycle stage delineations used in this paper have been taken from ISO
14040:2006 and are shown in Figure 2. Two modications were made in adopting Figure
2 for this analysis as seen in Table 8 and Appendix A. Packaging has been separated
from the production stage since it was an important consideration in some studies,
particularly those focusing on consumables. Likewise, transportation was separated out
because several studies focused on reuse and remanufacture, where equipment must
be collected and transported to be remanufactured. Both transportation and packaging
are included in multiple stages, meaning that inclusion isn’t always directly stated. A
case could be made for separating out energy supply, considering the signicance of
the impact associated with this component; however, all of the studies included this
component to some degree.
Bousquin, Esterman & Rothenberg (PICRM-2011-05)
16
Findings
Figure 2. System environment with the five main life cycle stages
(adapted from ISO 14040:2006)
In addition to the system boundaries, which represent the breadth of the data in
the respective studies, the quality of the data is also of importance. e National
Geographic life cycle carbon footprint study serves as an example of how multiple
parts of the supply chain can collaborate to develop a better assessment, collecting data
with greater breadth, depth and accuracy (Boguski, 2010). Harmony Environmental
Consulting assisted in combining a study Verso Paper had previously conducted with
a new study from Quad Graphics and National Geographic (Boguski, 2010). Another
criticism of LCA is that the quantitative data used is limited spatially and temporally. All
data used in the National Geographic carbon footprint study was specic to a two-year
span of time, and regional data were weighted to the percentage of activities that
actually took place there.
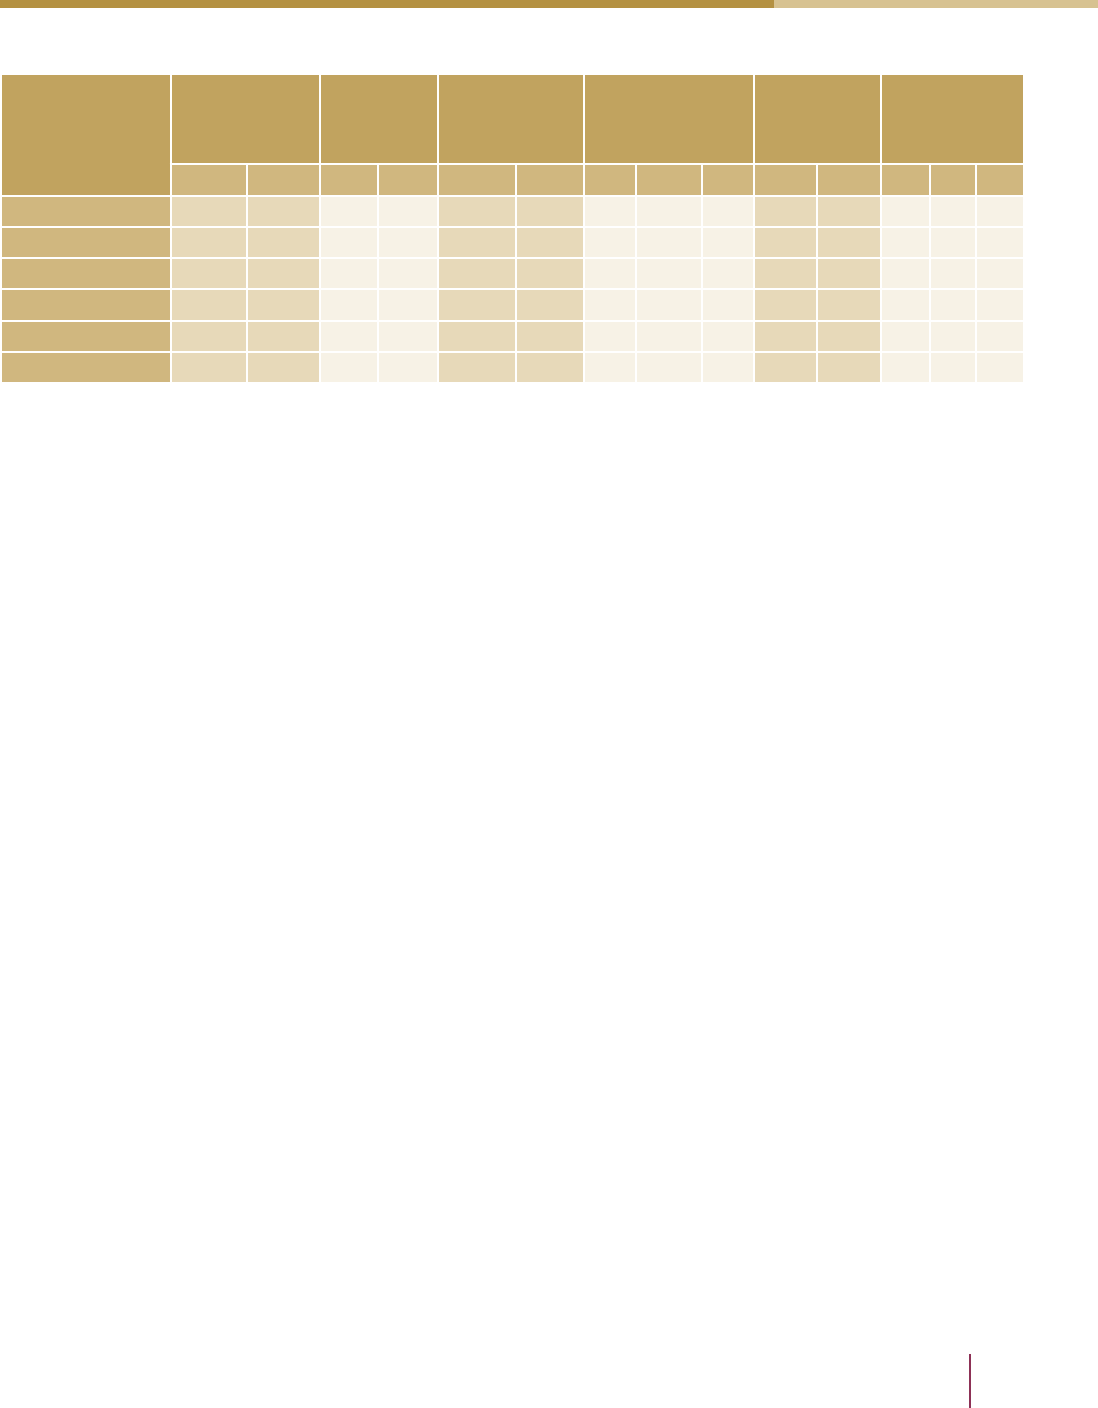
For each study, a short description of data collected during each stage of the life cycle
is shown in tabular format in Appendix A. From this table a loose grading system of A
to E, similar to that used in Boguski (2010), was used to evaluate the level of detail at
which each life cycle stage was explored. Some studies were missing parts of production,
such as assembly, or were simply basing impacts on bill-of-material masses. e results
of this grading eort are shown in Table 8.
System environment
Other
systems
Elementary
flows
Product flow
Raw material
acquisition
Other
systems
Waste
treatment
Energy
supply
Transport
Production
Use
Recycling/
Reuse
Elementary
flows
Product flow
System boundary
Life Cycle Analysis in the Printing Industry: A Review
17
Findings
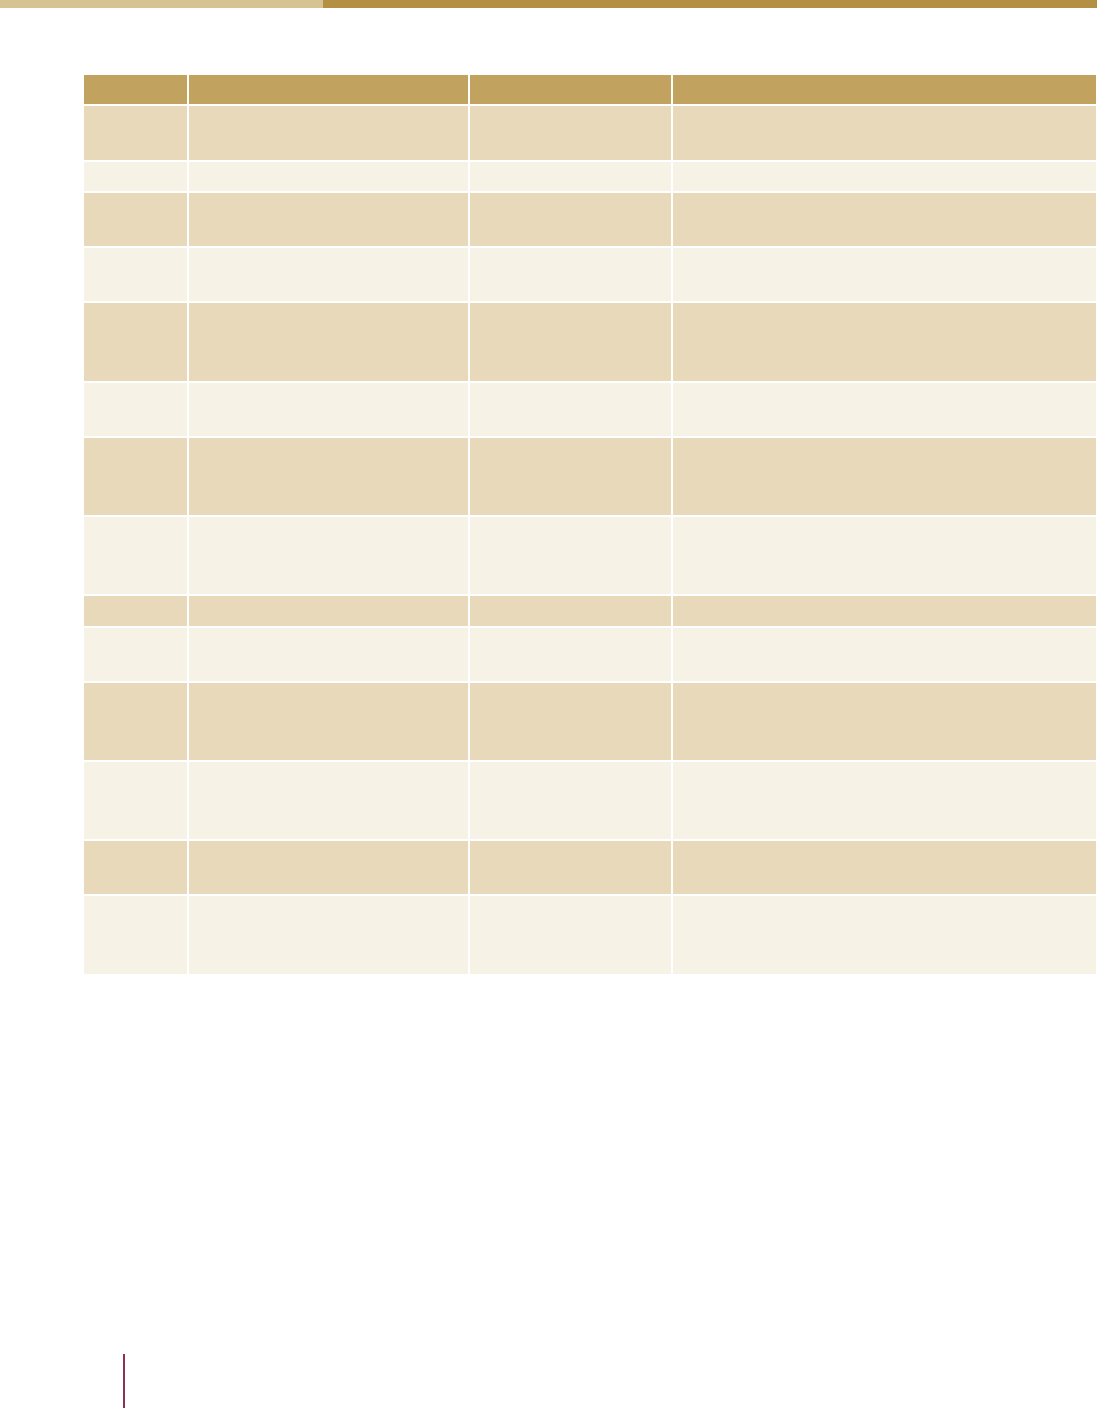
Table 8. Graded life cycle stage data
Stage
Cartridge
Remanufacture
Baseline
Academia
Comparative Design Tools Calculators
Baseline
Industry
[6] [7] [5] [4] [10] [2] [11] [12] [1] [13] [14] [3] [9] [8]
Raw Materials B B C C B B B C B D C C A B
Production B C C E B B E C B C C C A A
Transportation B B B E C B E B C D D C B B
Use B B B E A B B B C B C E E B
End-of-life B B B B C B B B C D C B B B
Packaging B B C B D B B C E D B D E C
Explanation of Grades:
A - Primary data measured on site during the phase. All relevant aspects seem to have been accounted for.
B - Database data or literature-referenced data. May be missing part of a process.
C - Incomplete data or estimates, but still representative of some impacts in this stage.
D - Stage was not included in study scope.
E - NA, was excluded due to lack of applicability to study goals.
ere are no denite trends concerning life cycle stage omissions. Transportation
and packaging were lacking high-quality data or ignored in many of the studies. Raw
materials acquisition was missing in the greatest number of studies, likely because the
practitioners faced diculties in obtaining upstream data. When it was included, the
typical approach to raw materials acquisition and component manufacture by suppliers
was to retrieve database impact attributes based on masses from a bill of materials
obtained by disassembling the product, as can be seen in Appendix A.
Also, it is dicult for practitioners to determine adequate upstream cutos, as many
times there are unknown processes involved in the production of component materials.
Surprisingly, considering the diculty in accurately estimating it, the end-of-life stage
was the most populated. is is partly due to the focus of design tools on reuse and
recyclability. Given the diculty in estimating actual end-of-life practices, none of the
core studies could be given an “A” for this stage. Trends in each stage are discussed in the
following sections.
Materials Acquisition Stage
Accounting for the raw materials and energy use that occur upstream in the supply
chain is very important. Commercial printing’s greatest manufacturing cost is the
paper used (First Research, 2009) and the majority of the environmental impact also
comes from paper. e pulp and paper industry accounts for a large percentage of
the total energy used, surpassing even the aluminum industry (EIA, 2006). Many
paper suppliers have conducted LCAs, but according to one device manufacturer
are unwilling to disseminate that proprietary information to their customers (device

Bousquin, Esterman & Rothenberg (PICRM-2011-05)
18
Findings
manufacturer, personal communication, August 10, 2010). In cases where suppliers
don’t have environmental metrics data, there is concern that the cost to procure such
data will be forced upon them (Original Equipment Manufacturer [OEM], personal
communication, August 10, 2010). Even if the supplier is willing to supply the LCA
practitioner with results data, the lack of a standardized method to account for all
attributes would mean that the results could not be compared interchangeably between
dierent suppliers, and assumptions might unknowingly be changed from stage to
stage of the LCA. For example, a supplier might account for carbon sequestration of a
managed forestry (under PAS 2050), yet the practitioner might not account for carbon
release at the end-of-life, since it will not be greater than the amount of CO
2
sequestered
(Koehler et al., 2010).
Many LCAs are criticized for uncertainties or inaccuracies surrounding impacts from
component manufacture processes, as oen the materials used can be identied but
not the exact processes used. One of the studies specically stated that the “greatest
source of error is the lack of data on component manufacturing and assemblage of the
cartridge” (Four Elements Consulting, 2008). Again, this supports a need for greater
dissemination of data upstream in the supply chain.
More open interaction with suppliers can have many environmental and cost-savings
benets. For example, managing reverse ows of materials and packaging can decrease
costs and emissions from transportation (Vachon & Klassen, 2006). If the supplier was
even willing to link environmental management systems, more accurate environmental
data could be linked to internal LCA data sets from suppliers in real time, making data
collection more accurate as well as less costly and time inhibitive (Moon, Chung, Eun,
& Chung, 2003). For many parts of the printer manufacturing industry, this is not
possible as parts are sourced from multiple OEMs at dierent times (OEM, personal
communication, August 10, 2010).
Production
e production and manufacturing stage, while likely having a relatively low impact
in the overall LCA, is typically the best populated stage. However, this is not the case
in many of these studies. Boguski (2010) went as far as to include overhead operating
impacts such as development and marketing sta and travel. is is not typically
expected of an LCA but acts as a reminder that the number of impact sources seems
almost limitless if some cuto criteria are not implemented. e two studies which
were missing this stage were either focused on end-of-life (Mayers et al., 2005) or it was
simply omitted because other aspects were thought to have greater impact (Silva et al.,
2006).
Use Phase
In nearly all of the studies examined, the electricity and paper used during the use
phase were said to have had the most signicant impacts for the imaging device. Due
to the importance of the use phase, an increased importance is placed upon user

Life Cycle Analysis in the Printing Industry: A Review
19
Findings
characteristics, habits, and settings. As a result, sustainability services such as print
optimization have gained popularity (Rothenberg, 2007). Surprisingly, these services
come from companies such as Xerox, which actually relies on paper sales for their
prots. is trend started with oce equipment but seems to be increasingly more
relevant for consumer printers (OEM, personal communication, August 10, 2010).
Inclusion of the “Individual Product Comparison” option in HP’s carbon calculator
also may be a sign of increasing relevance for individual consumers, as it allows for
comparison of many of the types of printers this market segment purchases.
Options such as N-up and duplex printing also reduce the impact of print signicantly.
When using such strategies, it is important to have supporting usage data so that these
are accurately accounted for. For example, the level to which duplexing is expected
to reduce paper use is debated, since many documents printed are less than one page
in length according to Lyra Research (Stobbe, 2007). Xerox estimates that about 20%
of documents are printed double-sided (Ebner et al., 2009). Several of the print use
patterns and assumptions that have already been described are dicult to estimate since
“use patterns are of course highly diverse,” and “there are no basic or comprehensively
representative use patterns even for one and the same device” (Stobbe, 2007).
End-of-life
End-of-life is another stage of the life cycle where large discrepancies exist in LCA
practices, and the printing industry is no exception. A major contributor is that waste
management diers by locality, and not all options can be taken into account; therefore
analysis for a given product can lead to very dierent results depending on the type
of waste management used (Shen & Patel, 2008). ere have been several attempts to
determine where such disagreement stems from (Finnveden & Ekyall, 1998; Villanueva
& Wenzel, 2007). For the printing industry, recycling rates and the impact of dierent
methods can cause signicant dierences in outcomes, mainly due to the impact of
paper (Counsell & Allwood, 2007). is has led some sectors of the industry to focus on
de-inking to increase recyclability (Steward, Tsoi, & Coles, 2008). Ahmadi et al. (2003)
reported that 34% more energy is needed in the de-inking process than in the ber
recovery process when exploring end-of-life for toner. When certain unusual woods
such as groundwood are used for paper production or when the wood is processed, the
paper does not degrade completely—an interesting consideration for carbon impacts. In
these instances the paper actually has a negative net eect, as the undegraded wood in
landlls sequesters carbon (Boguski, 2010). One viable way to approach such dierences
is to perform sensitivity analyses.
Remanufacturing and reuse is another area of debate for the printing industry. All of
the design tools examined in this work have included some form of remanufacturing
in their analyses. Components of printers oen have a longer useful life than the
printer itself, allowing for reincorporation into machines with newer technology (Kerr
& Ryan, 2001). is is more benecial than reuse of the same machine, as the trends
in environmental improvement for consumer electronics such as increased energy
Bousquin, Esterman & Rothenberg (PICRM-2011-05)
20
Findings
eciency can potentially negate the impact reduction realized from decreased raw
materials acquisition due to reuse. It also means that future needs must be predicted
to some extent to ensure that components designed for reuse can actually meet new
market needs (Östlin, Sundin, & Bjrkman, 2009). Quality issues from remanufacture
of toner cartridges are still under debate and are discussed below.
Inconsistent treatment of end-of-life assumptions can be seen within the studies
(see Table 9). Some studies addressed this issue by using sensitivity analyses (e.g.,
Mayers, France, & Cowell, 2005). Denitions of “remanufactured” and “recycled” are
also expected to be highly variable between studies. When looking at the end-of-life
assumptions for cartridges, even those that are not remanufactured are recycled to
a high degree. is is also the case for the imaging equipment studies, with baseline
landll assumptions of only 1-2%. Region is an important characteristic of these two
imaging equipment studies, as they were conducted in the European Union where the
WEEE directive for imaging equipment end-of-life is in eect. e paper end-of-life
assumptions may indicate that the use of the printed paper plays an important role if it
may require long-term archiving. It is interesting to note that the highest recycling rate
assumption is seen for packaging paper.
Table 9. End-of-life assumptions for devices and components
Category/
Study #
Purpose Product or component
Remanu-
factured
Recycled
Waste to
energy
Land-
filled
Cartridges
[2]
Solid ink vs.
LaserJet
LaserJet cartridges 10% 25% -- 65%
[6]
Comparative:
Cartridge
HP OEM cartridge -- 19% -- 81%
Tepro remanufactured
cartridge
(1)
100%, 3
times
-- -- --
[7]
Comparative:
Cartridge
Remanufactured cartridge
84%, 1
time
4% -- 12%
HP OEM cartridge
(2)
-- 59% 41% --
Imaging Equipment
[4]
Baseline: Various
devices
4 disposal scenarios for
3,250 imaging devices
weighing 21.6 tonnes total
32% 46% 21% 1%
32% 46% -- 22%
32% 41% -- 27%
32% -- -- 68%
[5]
Baseline: Various
devices
V1 & V2: EP copier
(3)
1% 58% 39% 2%
V3 & V4: EP printer
(4)
1% 52% 45% 2%
V5 & V6: IJ MFD
(5)
1% 47% 50% 2%
Paper
[8] Baseline: Toner Toner on paper
(6)
Archived:
22%
43% -- 35%
[9] Baseline: Magazine Printed magazine
(7)
Archived:
60%
-- 8% 32%
[10] Packaging printing Gravure process - Paper -- 80% -- 20%

Life Cycle Analysis in the Printing Industry: A Review
21
Findings
Category/
Study #
Purpose Product or component
Remanu-
factured
Recycled
Waste to
energy
Land-
filled
Other
[8] Baseline: Toner Toner waste (10%)
(8)
66% -- -- 34%
[10] Packaging printing
Flexographic process -
plate waste
(9)
-- -- 90% 10%
Gravure process - metals -- 95% -- 5%
[2]
Comparative: Solid
ink vs. LaserJet
Product and component
packaging
(10)
-- 70% -- 30%
Gray shaded cells are populated with data from a sensitivity analysis that was part of this study.
(1) Aer being reused 3 times, the cartridges are sent to Holland for further reuse or disposal.
(2) Used once then disposed of.
(3) V1: Electrophotographic Copier MFD, monochrome, 26 IPM
V2: Electrophotographic Copier MFD, color, 26 IPM
(4) V3: Electrophotographic Printer SFD, monochrome, 32 IPM
V4: Electrophotographic Printer SFD, color, 32 IPM
(5) V5: Ink Jet Printer MFD, personal (low utilization)
V6: Ink Jet Printer MFD, workgroup (moderate use)
(6) Transfer eciency of xerographic copying is approximately 90%.
(7) Municipal waste (US).
(8) 10% of toner is cleaned from the belt and collected in the waste bin.
(9) 10% process waste.
(10) 60% of this packaging content was assumed to be recycled and 40% virgin material.
Five of the studies were not included in Table 9 for various reasons including: lack
of examples of devices being tested on the tool (study 11), end-of-life assumptions
for devices not being included (studies 1, 12, and 14), or the end-of-life stage was
outside the study scope (study 13). Study 18 examined the reduction in materials when
equipment was remanufactured. However, this study did not provide baseline data
with which to compare this reduction. For the Document Centre 265 Digital Copier
(modular) and Xerox 5100 Copier (non-modular), landll waste was reduced 45% and
37%, respectively.
Transportation
With increased globalization, transportation due to outsourcing can contribute
to environmental impact. In many cases this is low-hanging fruit, as reduction of
transportation also has an associated cost savings. Verso was able to reduce greenhouse
gas emissions that contribute to climate change by up to 90% while reducing transport
costs by up to 50% (Rowzie, 2008). Seven of the studies did not include data on
transportation, most likely because the diculty of collecting these data outweighed the
relatively small impact when compared to the impact of energy use and paper.

Bousquin, Esterman & Rothenberg (PICRM-2011-05)
22
Findings
Packaging
Inclusion of packaging may seem unimportant, but this inclusion can be signicant to
the results of some studies, especially when it is included for consumables (Koehler et
al., 2010). It seems that the impact of packaging, such as that used to ship the printer
itself, is minimal, but that of the packaging used for consumables can add up over
the useful life to have a signicant impact. Five of the studies omitted packaging data
completely in their assessment.
Print Consumables
Transportation and packaging are not the only data that are sometimes omitted. As
discussed with the functional unit, paper and print speed are two considerations oen
necessary for consistent comparability of printer LCA data. Yet paper is sometimes
removed from comparative assessments under the assumption that the dierences
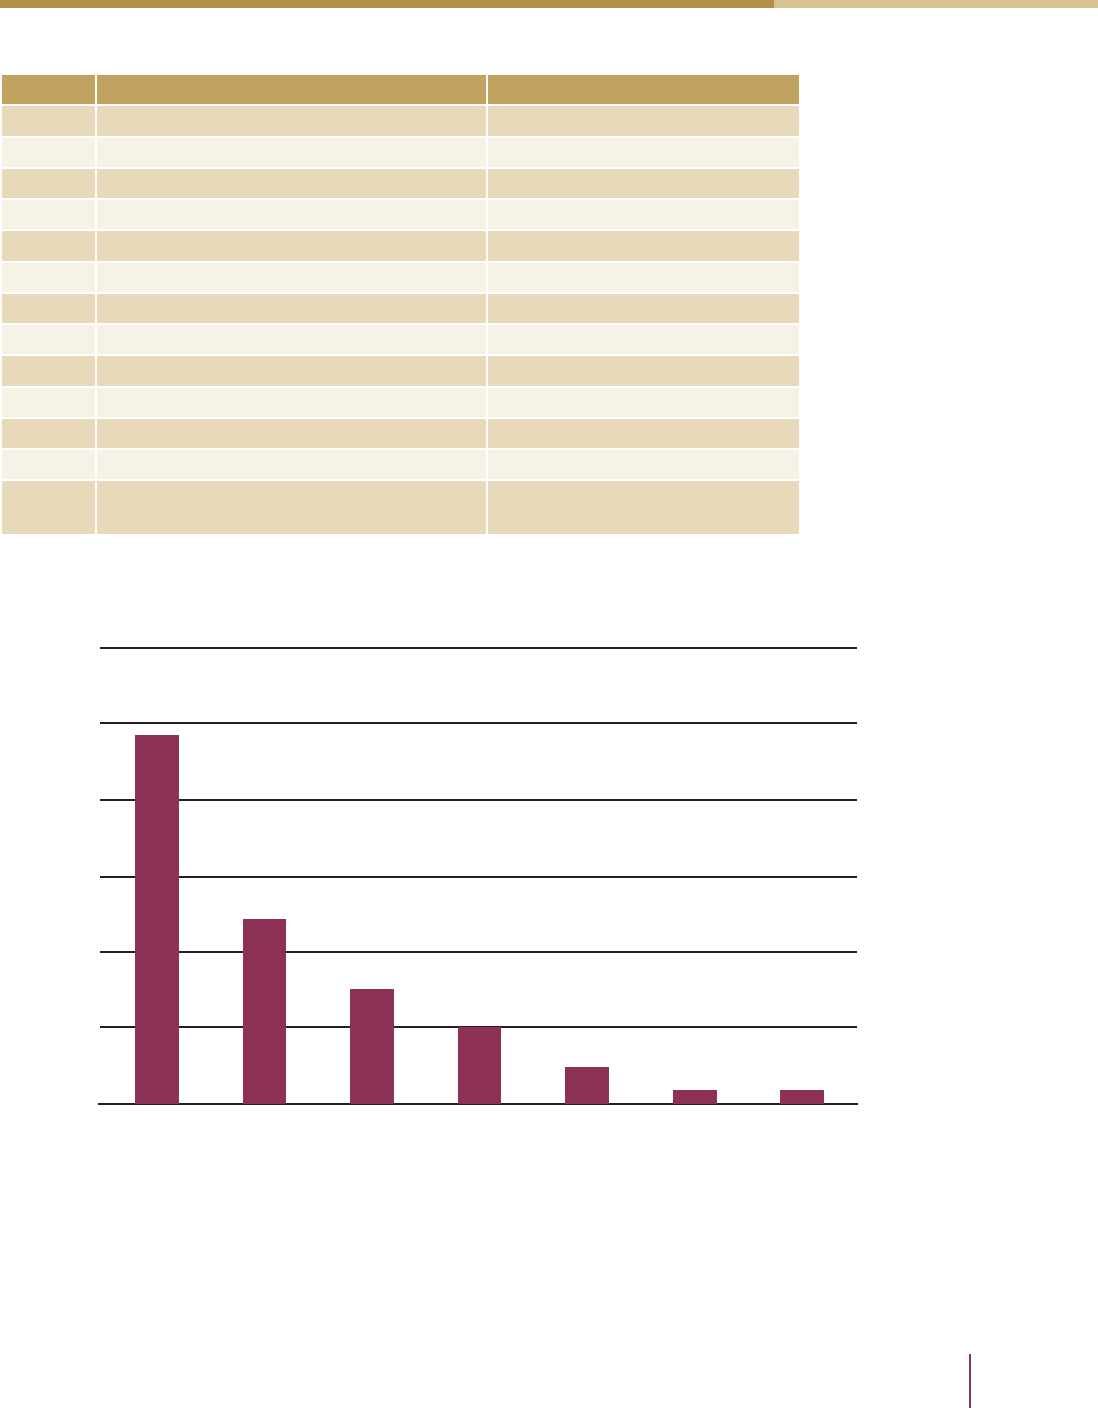
between the products will not have an impact on paper (see Table 10). Figure 3 displays
the typical relative impact of dierent aspects of printers as reported by Ebner et al.
(2009). Removing paper from the assessment will make other dierences more notable
as a percent of total impact. is should only be done for comparative LCAs where the
eect of paper is the same for both products; the functional unit includes print volumes
and equivalent print rates are being compared. Even in these cases, best practice still
would be to display results with and without paper as a sensitivity analysis.
Print speed (PPM) has a direct relationship to energy consumption during the use
phase, meaning a higher PPM is correlated to higher use-phase energy demands
(Stobbe, 2007). is is important to consider when analyzing data from a study such
as Koehler et al. (2009), which examines printers at 50 PPM that are among the most
energy-demanding. One factor that has not yet been explored with print speed is to
what degree misprints are aected.
Life Cycle Analysis in the Printing Industry: A Review
23
Findings
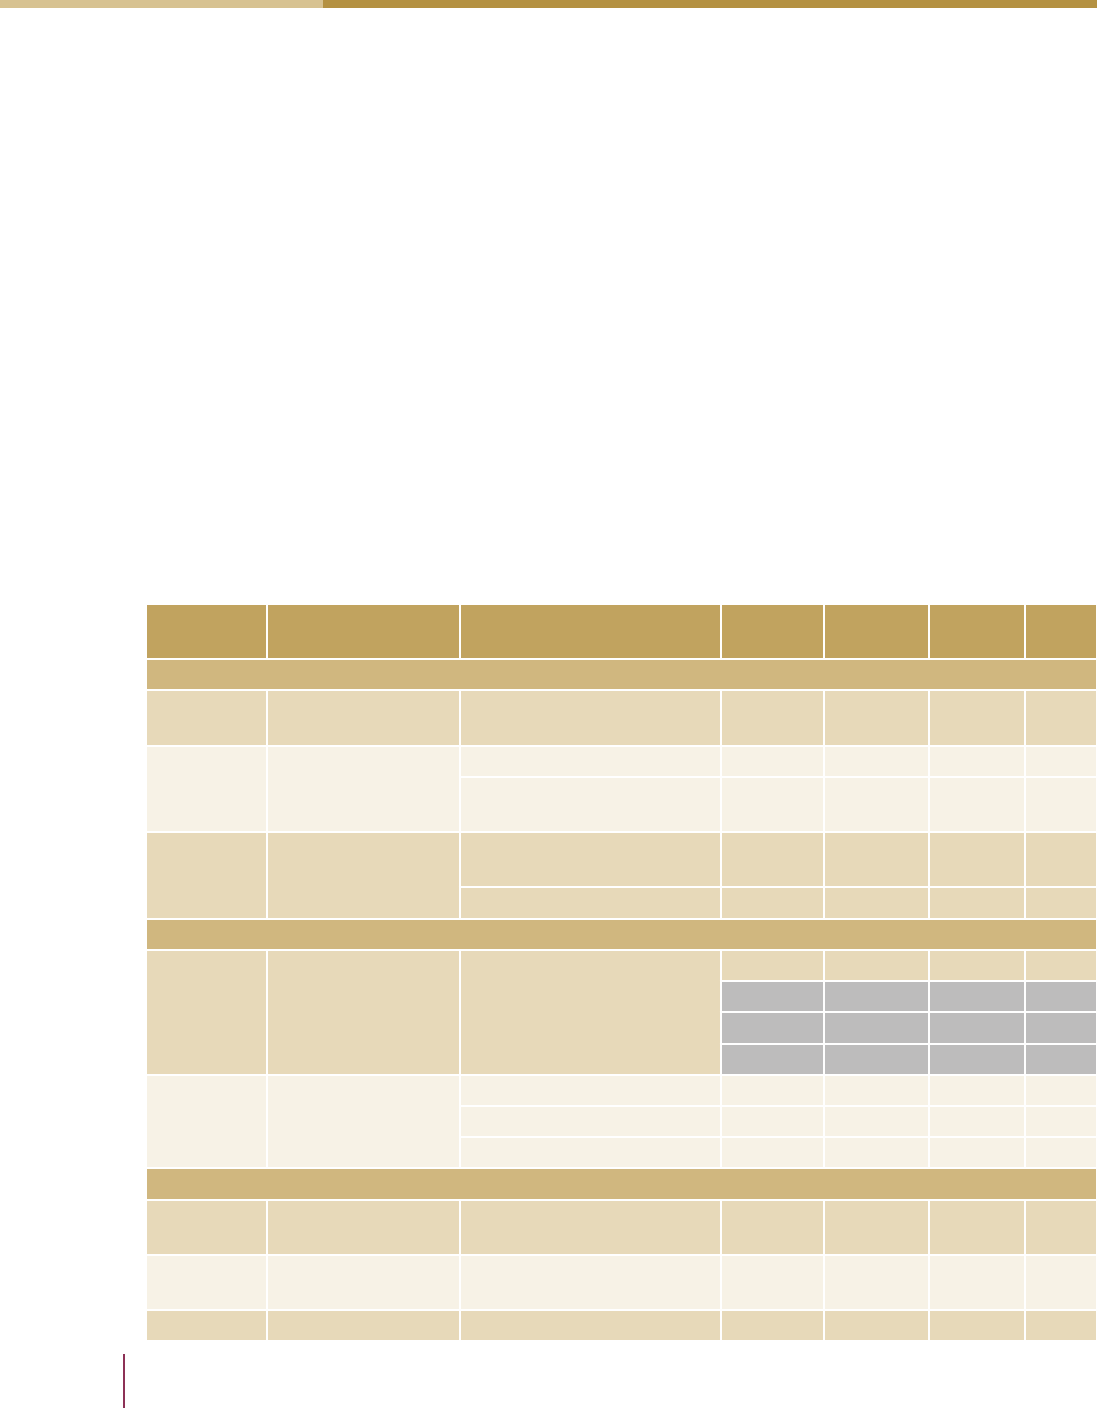
Table 10. Study inclusion/exclusion of paper and print speed
Study # Paper Print Speed
[1] IPCC, excludes fiber source User input
[6] Included in sensitivity analysis Constant
[2] Assumed to be equivalent Solid ink: 50 PPM; Laser: 51 PPM
[14] Excluded Laser: Input; Ink jet: Excluded
[8] Outside functional unit Outside function
[12] Included, adjusted for duplexing User input
[10] All substrates included, 8% & 35% paper Not included
[4] Outside scope Outside function
[3] Omitted to highlight End-of-Life 100
(1)
& 65
(2)
[7] Essential to conclusion Outside function
[11] Omitted by designers and users Omitted
[9] Included, from Verso LCA Outside function
[13]
Energy from paper and pulp production
relative to user paper input
Based on brand and model
selection
(1) Xerox 5100 Copier specications
(2) Xerox Document Center 265 Digital Copier specications
Figure 3. Relative energy and GHG impacts for aspects of office imaging devices
Note: CRUs are “Customer Replaceable Units” such as cartridges (Ebner et al., 2009)
Paper
simplex
Arbitrary units
60,000
Aspect of office imaging device
Paper
duplex
Use-phase
electricity
CRUs Transport Printer Packaging
50,000
40,000
30,000
20,000
10,000
0

Bousquin, Esterman & Rothenberg (PICRM-2011-05)
24
Findings
When paper will be included, it is important to specify the type, size, and ink/toner
coverage. e standard assumption is that users print on A4 (8.5 in. by 11 in.) paper
with an average coverage of 5% monochrome and 20% color, with 5% each for black,
magenta, cyan, and yellow. It is also likely that the actual average coverage is higher than
this, considering the increase in graphics being printed (Stobbe, 2007).
Cartridges
It is dicult to deal with the life cycle of cartridges without getting into a discussion
of their remanufacture. Some companies have made claims in sustainability reports
of environmental impact reductions due to their cartridge remanufacture programs.
Lexmark recently made claims of an up to 60% carbon footprint decrease for
remanufactured cartridges (Lexmark, 2010). Others indicated that remanufactured
cartridges in reality have a negative impact due to reduced print quality (Four Elements
Consulting, 2008). Despite the fact that the studies are not in agreement, the EuP
estimates that only 10% to 15% of cartridges are remanufactured (Stobbe, 2007). In
addition, Berglind and Eriksson (2002) concluded that cartridges account for a small
fraction of the environmental impact of the printing system, leaving remanufacturing
only advantageous under certain circumstances. If this is true, it seems that “neither
original nor remanufactured cartridges have a distinct environmental advantage (First
Environment, 2004)” (Öko-Institut & Fraunhofer IZM, 2007c, p. 23).
Ink and Toner
Estimates of ink, toner, and cartridge consumption are consistent with yield-testing
requirements set forth in ISO/IEC 24712:2007. Much of the chemically active
elements of a printing system reside within the toner and ink formulations. It is
clearly an important area of focus, primarily due to the fact that these components
have the potential to contribute to emissions and airborne particulates, they impact
the recyclability of the substrate, and they are derived from process-intensive
manufacturing. One of the studies performed an LCA on the toner life cycle including
its use and recycling from paper at end-of-life (Ahmadi et al., 2003). Other studies
focused on the print consumables’ packaging, reducing the environmental impact
through safer adhesives, improving materials selection, and increasing the recyclability
(Loh, Canonico, Degher, & Moore, 2004). In commercial printing there is a greater
focus on inks and solvents due to their volatility. Volatile Organic Compounds (VOCs)
and their air emissions have become a major concern for commercial print shops in
relation to employee health. is issue exists with oce printers on a smaller scale, as
they also are a source of particulate matter, ozone, and VOCs (Morawska et al., 2009). In
one study, total VOCs ranged from 0.2µg /copy for an ink jet printer to 7.0µg /copy for a
LaserJet (Lee, Lam, & Fai, 2001).

Life Cycle Analysis in the Printing Industry: A Review
25
Findings
Life Cycle Inventory
Life cycle inventory (LCI) analysis denes and quanties the ow of materials and
energy into, through, and out of a product system (ISO 14040:2006). Many of the life
cycle inventory issues have been discussed in the scope analysis. For example, the
selection of the system boundaries dictates the elements and data to be included and
modeled in the analysis. Data requirements and availability issues could arguably be
included in all sections. In this section, the issues related to data will mainly revolve
around identifying uncertainty and some of the ways practitioners have tried to address
these issues.
By this phase of the LCA study, the practitioner has determined what will and will not
be included, but there is still an issue of how to allocate the impact data to the inventory
data. Much like dilemmas with life cycle costing methods, there are processes that
benet multiple stages of the life cycle and/or multiple products, and these burdens
must be properly allocated. For example, if paper is recycled at end-of-life, what share of
the original burden of materials acquisition should be allocated to the original LCA and
which should be allocated to the next function of that paper? is allocation dilemma
is not specic to the printing industry, and practitioners should attempt to follow
standards such as ISO wherever possible. When not possible, the practitioner should
use sensitivity analysis to determine how important the allocation is to the results or
state that it is unknown and use the most easily justied allocation method (Ekvall &
Finnveden, 2001).
Two sources of preventable data quality issues typically occur: those due to data gaps
and those due to use of proxy or generic data (Reap, Roman, Duncan, & Bras, 2008b).
Many of the studies in this work included sensitivity analyses that used dierent
assumptions for uncertain parameters such as recycling rates. Data quality and
uncertainty issues are not unique to the printing industry and represent a major issue
that LCA has yet to completely overcome.
A substantial barrier to adoption of LCA metrics has been the cost of collecting
necessary data (packaging label printer, personal communication, August 10, 2010).
When an LCA is performed, practitioners oen note the diculty of obtaining accurate
data. In fact, ve studies specically note that this diculty impacted their results.
Data Sources
It is worth noting the commonly used databases and methodologies, as well as the
standards and certications upon which industry LCAs and decision tools are based.
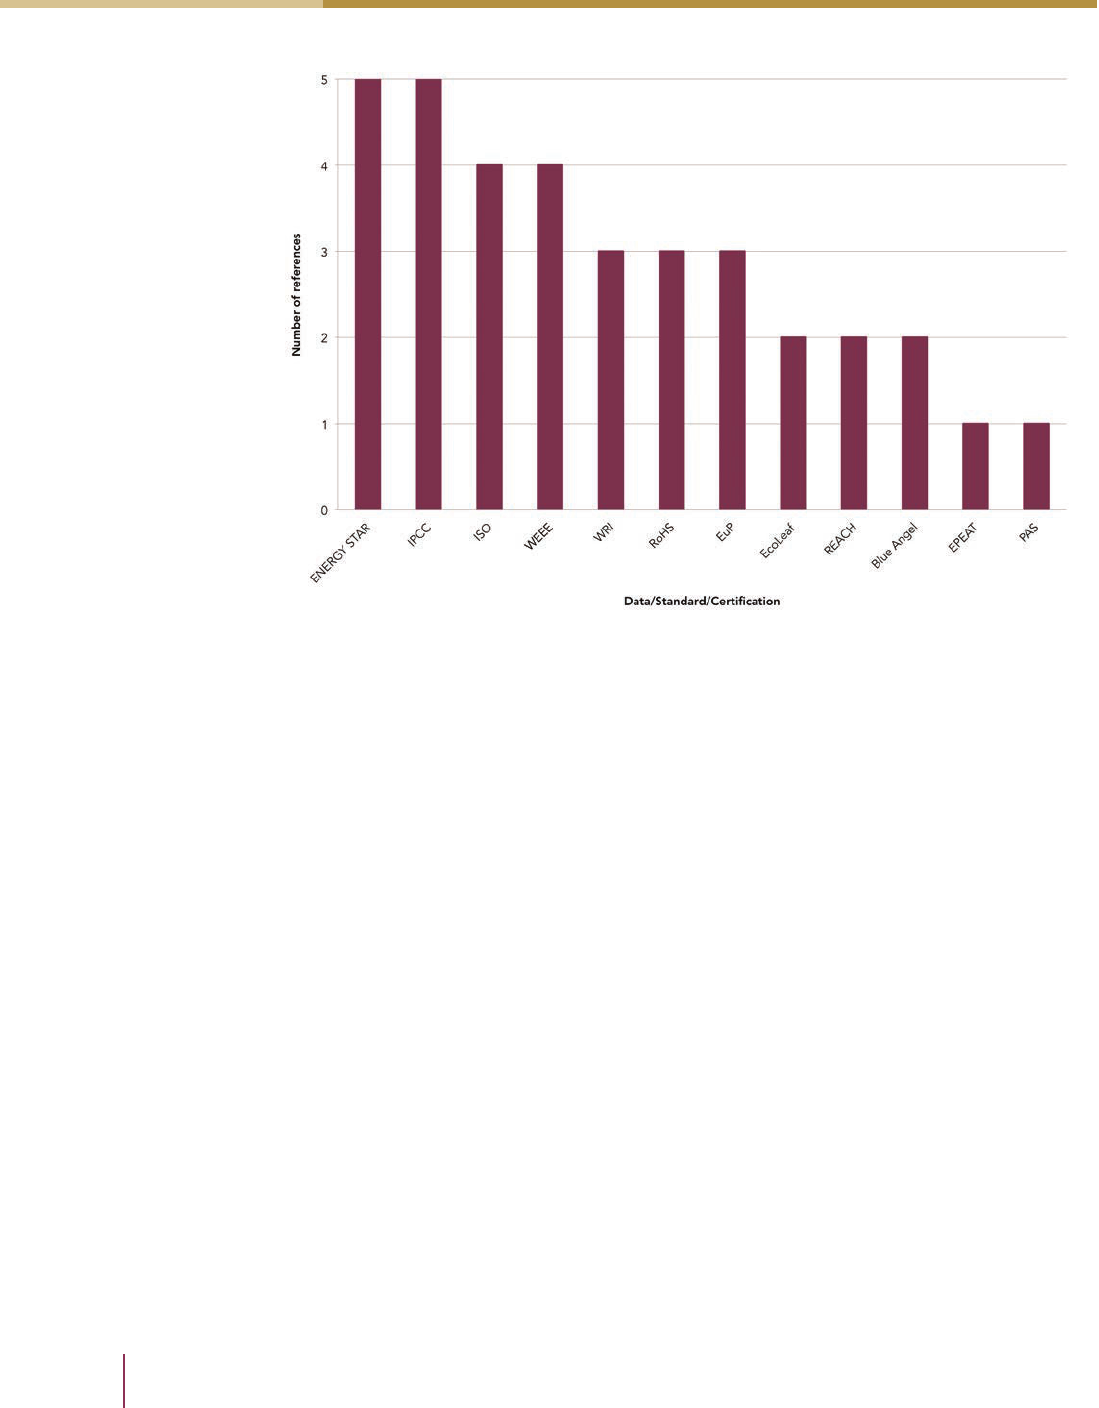
Figure 4 shows the most commonly cited certications and standards with the number
of studies that referenced them. (Appendix B has two tables: one showing which studies
cited which resource in Figure 4, and the other listing literature that was cited by the
studies for data.)
Bousquin, Esterman & Rothenberg (PICRM-2011-05)
26
Findings
Figure 4. Referenced data, standards, and certification sources within studies
e ENERGY STAR standard and database are used frequently in these studies. e
standard set forth in Typical Electricity Consumption (TEC) is necessary because of
the complexity of energy consumption with varied rates and modes. is standard also
is specic to imaging equipment. Many companies seek TEC certication for their
products, so products being studied by the LCA may already have had TEC determined.
e consistency and high usage rate also have helped to make the associated ENERGY
STAR database very useful. e database helps to identify trends and baselines for
studies such as the EuP, and it provides data on competitors’ products for inclusion
in tools like HP’s Carbon Footprint Calculator. Energy is an important component of
use-stage environmental impact and this information is therefore very useful.
IPCC is also cited frequently for the standard treatment of Global Warming Potentials
(GWP) over a period of time such as 100 years (IPCC, 2006). All but two of the studies
determined impacts for GWP, as this is one of the few impact categories with a clear set
of guidelines. It was surprising, however, that PAS 2050 was not cited more frequently,
since it is a very specic set of guidelines used to calculate carbon footprint. e
relatively low mention of EPEAT also was somewhat surprising given its relevance to
consumer electronics. is may change, as upcoming standards for imaging equipment
(IEEE 1680.2) are expected for November 2010. is new standard will likely include
criteria for consumables (i.e., paper and ink) and indoor air quality in addition to the
former 1680 criteria. Likewise, the EuP will probably be used even more as an industry
average indicator in the future considering the large amount of data it analyzed.

Life Cycle Analysis in the Printing Industry: A Review
27
Findings
e National Council for Air and Stream Improvement (NCASI) was not referenced for
paper impact calculations in any of the studies; however, their recent Forest Industry
Carbon Assessment Tool (FICAT) is likely to be a useful resource. Lastly, certications
such as EcoLeaf (Japan Environmental Management Association for Industry, 2002)
in Japan and RoHS/REACH/WEEE in Europe obtain recognition from companies
that operate in their regions but are less likely to be as useful for other regions. It also
is important to note that these regulatory certications are already being surpassed.
Design tools may still use them as starting points, but LCAs are unlikely to incorporate
them quantitatively.
Life Cycle Impact Assessment
Life cycle impact assessment (LCIA) converts the inventory data collected during the
inventory analysis into environmental impact estimates using a two-step process of
classication and characterization (ISO 14040:2006). is is a complex and somewhat
subjective process, which is the reason such care has been taken to identify where data
has come from. “It is clear that this is a complex process, thus the impact component of
the LCA has always been very subjective” (Ahmadi et al. 2003). e solution has been
to utilize impact assessment soware which adheres to published methods and oen
includes multiple databases. e discussion of data in this section will focus mainly on
specic data sets, data quality, and the pros and cons of alternative methodologies.
Methodologies
ere are already reviews and evaluations of dierent published methodology tools
available which are not specic to the printing industry (Pennington, Norris, Hoagland,
& Bare, 2000). When life cycle inventory data representing raw materials and processes
are converted into environmental impact categories, the results are considered
midpoints, such as energy use or CO
2
e (Bare, Hofstetter, Pennington, & Udo de Haes,
2000). Endpoints require an additional step where impact categories are aggregated
through weighting factors (examples: Eco-Indicator 99, EPS 2000, IMPACT 2002, EDIP,
see Bengtsson & Steen, 2000). e further a study gets toward an endpoint, the more
inuence that methodology has. Some studies choose to present results as endpoints,
and others just as inventories of impacts, such as the 2003 study by Ahmadi et al.
Impact Categories
Life cycle publications that intended to dierentiate products based on their
environmental impacts tend to focus on three or four main impacts instead of
presenting an end-result weighted score or a more complete set of impacts (Reap et
al., 2008b). is can be seen with many of the LCAs meant for external audiences
reviewed in this work. Practitioners selectively limit the number of impact categories so
as to avoid overwhelming the reader with information that is relatively less important.
Even though Koehler et al. (2010) were using a soware tool (SimaPro 7) which, by
default, includes multiple impact categories, the researchers decided to limit the results
to GHGs, energy use, and solid waste. e danger here is that impact categories have
to be normalized to determine signicance relative to one another. An impact on
Bousquin, Esterman & Rothenberg (PICRM-2011-05)
28
Findings
human toxicity may be very small and an impact on GHG may be very large, but the
importance of human toxicity might be such that this impact is actually more important
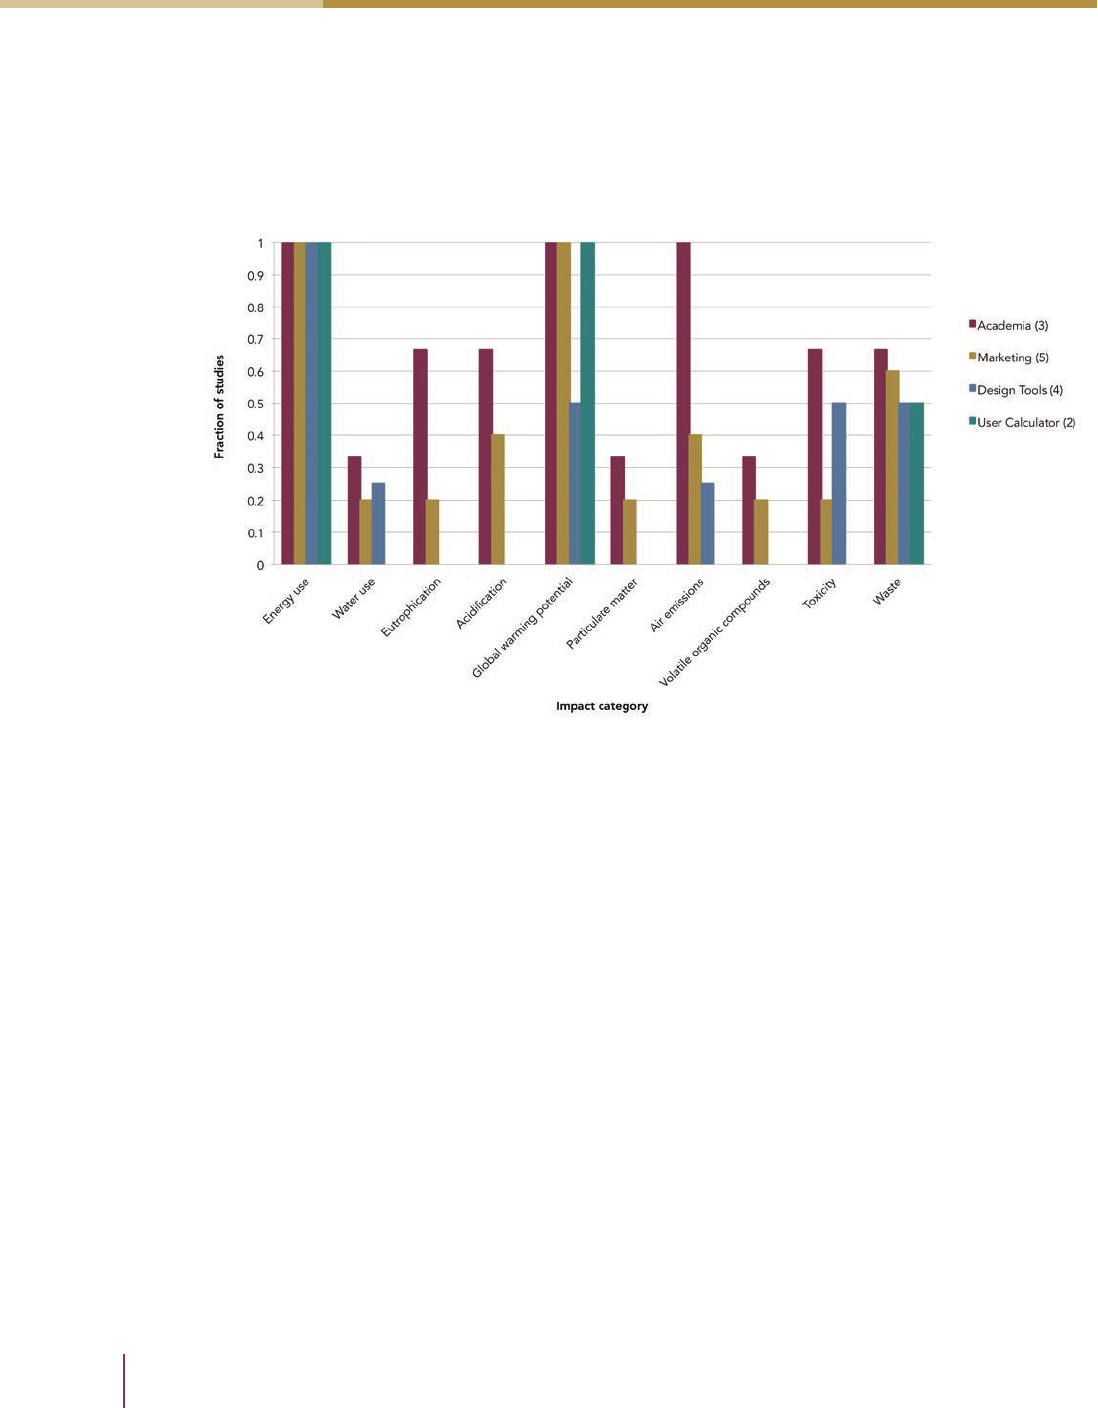
than the GHG impact. Studies performed in academia are more likely to include all
impact category results, even if they are very small or not relevant. Figure 5 shows
impact categories by study audience based on data shown in Appendix B.
Figure 5. Study inclusion or exclusion of impact categories based
on intended audience
Global warming was the leading impact category of the studies (excluding energy use).
is is likely due to the importance placed on CO
2
emissions in recent years. ere is
also a universally accepted standard in place: IPCC GWP. Other emissions have far less
emphasis in consumer markets; however, VOCs are very important to the commercial
printing industry, and there are some standards for determining emission such as
ECMA-328 (ECMA International, 2009).
Several reasons for omitting impact categories include a lack of standards (Ekvall, 1999),
lack of data, the belief that the category is irrelevant, or lack of consideration within
the methodology being used (Reap et al., 2008b). Several standards, unlike GHG, lack
“harmonized” and consistent methodologies for terrestrial and aquatic toxicology in
LCA (Pennington et al., 2000), and incomplete databases are inhibitive and have caused
a concerning gap (Shen & Patel, 2008).
Impacts of toxicity and human health typically get less attention, even though this
would seem to be a priority impact (Reap et al., 2008b). is is partially due to the
regulations already in place for chemicals and outputs that would be a threat to human

Life Cycle Analysis in the Printing Industry: A Review
29
Findings
health. Resource depletion does not receive much attention in the studies, with the
exception of energy use. Energy use is typically treated as a midpoint rather than an
impact category, as it contributes to other impacts such as GWP. It was assessed here as
an impact category because many studies do not dierentiate between the end points
to which energy use is allocated. Again, the impact with a standardized data collection
and allocation methodology—in this case energy use—is presented more frequently.
e inclusion of energy use could also be an eect of its more immediate economic
implications.
Waste receives a lot of attention considering the high level of uncertainty in end-of-
life data. is is consistent with LCAs outside of the printing industry. Ekvall (1999)
presents some methodologies specic to paper end-of-life and recycling.
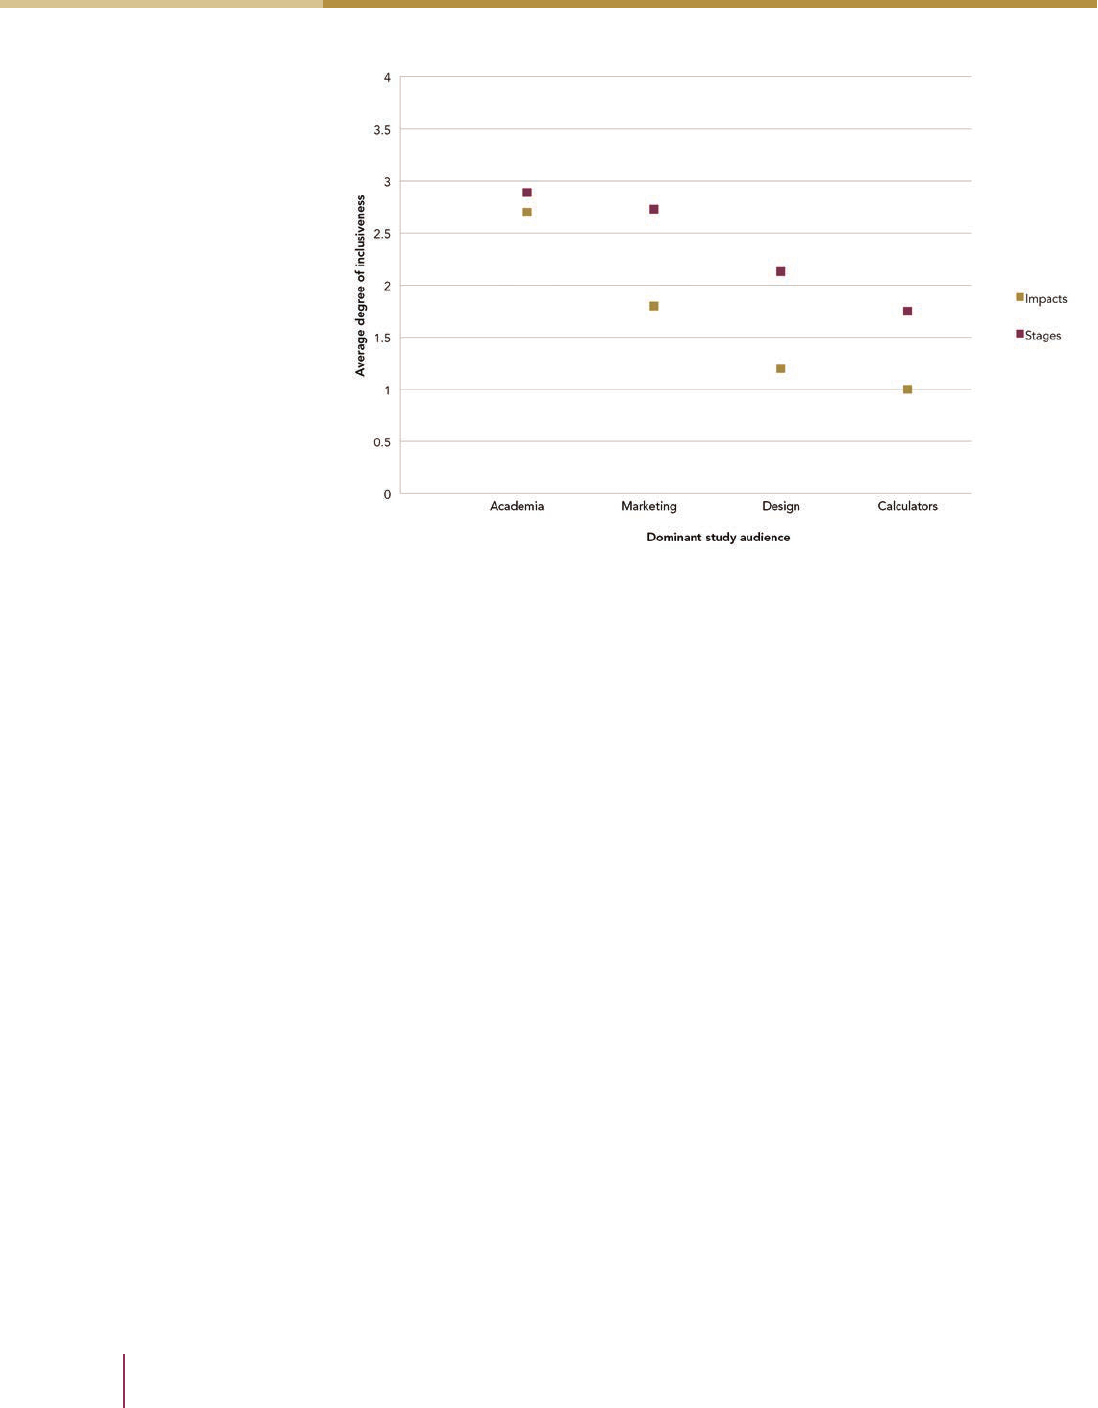
Breadth and Depth of Assessment
In an attempt to summarize much of what has been reported up to this point, a breadth
and depth assessment process was developed. First, it was of interest to determine if
there were dierences between the study context with respect to breadth and depth. e
dominate study audience was selected to represent this context for comparison. In order
to assess the breadth of the assessment, the stage data evaluations from Table 8 were
averaged across context groups. Similarly, to assess depth the impact category inclusion
data from Figure 5 were averaged for each of context groups.
For impact categories, a score of 1 - 4 was assigned for the number of studies including
each category, and then these scores were averaged. For stage data, the grades from
Table 8 were given numerical scores ranging from A = 4 to D = 1. Grades of E were
omitted from the average, as these were excluded from the study for specic reasons
rather than data collection diculties. Impact categories could be skewed; however, all
context groups (with the exception of academia) had categories that were included and
excluded in all studies within the group. is can be seen in greater detail in Figure 6.
Bousquin, Esterman & Rothenberg (PICRM-2011-05)
30
Findings
Figure 6. Breadth and depth of assessments in studies
Academia was the most inclusive of both stage data and impact categories. is is
not surprising given the focus on establishing baseline data and presenting replicable
results. Studies performed for external marketing purposes had the same level of stage
data but ranged from 2.3 to 3 on a 4-point scale. It was interesting that studies for
external marketing were more inclusive than those for internal design. is may suggest
that internal design tools have been streamlined beyond the point desired for external
communications but not to the point where they inhibit good decision-making. Not
surprising is that impacts typically included for external marketing—carbon emissions,
and waste—are typically included in customer calculators. e use stage is explored to
the greatest extent in both of these categories of study, but there do not seem to be any
other stage data similarities.
Reporting and Critical Review
Performing LCAs internally has the advantage of keeping data proprietary (print shop,
personal communications, August 10, 2010). Several major companies have performed
LCAs and published improvement results for marketing purposes (Lexmark, 2010) or
within their sustainability reports (Ricoh Group, 2009; Canon Inc., 2010). However,
the actual quantitative results and the complete assessment have not been published,
ensuring that proprietary information will not be disclosed.
Recognizing the desire to retain proprietary information but also balancing the need to
keep transparency and accountability has led to ISO’s requirements on reporting and
critical external review (ISO 14040:2006). is is important considering the limited

Life Cycle Analysis in the Printing Industry: A Review
31
Findings
data disseminated in many LCA reports to protect industry proprietary data. Having
a review performed within academia or by an outside consultant can help reassure
consumers that data were accurately analyzed. ese external partnerships with
consultants and academia can have other added benets, especially for smaller-scale
enterprises that lack competencies or scale. Not all LCA reports go through this process
however, and as mentioned previously, oen a company will report results in a news
release or sustainability report.
Conclusions and Further Research
A great deal of activity is occurring in environmental impact assessment within the
printing industry. It is clear that a great deal of eort and expense has been put into
these assessments. While each of these analyses has served specic purposes, the
printing industry has expressed the need to be able to make meaningful comparisons
across studies. e analysis performed in this work has not only conrmed the
inability to make cross-comparisons across studies, but has also identied sources of
discrepancies and variability.
Some of the important observations made in this work, as well as implications for future
work, are summarized below:
• Both design decision tools and full LCA have a role in a company’s
environmental sustainability program.
• An approach to standardization needs to include the standardization of
measurement methods. is is evident from the prevalent use of GWP
100-years and ENERGY STAR energy consumption standards cited. By
following this approach for other categories, more cross-study comparisons will
be facilitated.
• Like most LCAs, those performed in the printing industry still lack reliable
data for the early life cycle and end-of-life of paper since these are dicult to
agree on. Some uncertainty issues can be solved by increasing data and data
transparency through the inclusion of metadata or reviews.
• Products have diverse functional values beyond simple document production,
and these need to be considered in addition to LCA results when making design
decisions. Standardization of the functional unit and its included assumptions
has a high potential to increase quantitative comparability across studies.
At the same time, caution must be taken not to use “paper” to dene the
imaging device’s function, allowing for the inclusion of alternative media in the
comparison.
• Assumptions that are not standardized lead to diculties in comparisons
between studies. Some of the most signicant assumptions are those on usage

Bousquin, Esterman & Rothenberg (PICRM-2011-05)
32
Conclusions and Further Research
behaviors. One approach has been to limit the inclusion of use-phase impacts
like paper. is fails to account for any dierences that may occur during
this phase, however, which may be very signicant. Consumer behavior has
potential to be the greatest environmental impact reducer (i.e., by reducing
misprints or the necessity of printing altogether). e only way to quantify
these dierences is to gather extensive usage data. A sensitivity analysis should
also be included with these behavior data as they are highly variable. Non-LCA
decision tools have an advantage in this respect as many of them can simply
input qualitative data.
• Consumables should continue to be examined closely. Ink and toner
advancements and alternatives have potential to make improvements in less
popular impact categories. One such example is the use of soy-based inks (Tolle,
Evers, Vigon, & Sheehan, 2000). e key to reducing the impact of paper will be
wasting less of it and making it more recyclable.
References
Ahmadi, A., Williamson, B. H., eis, T. L., & Powers, S. E. (2003). Life cycle inventory
of toner produced for xerographic processes. Journal of Cleaner Production, 11,
573-582.
American Forest and Paper Association. (2009). Paper and packaging: Facts about paper.
Available from http://www.afandpa.org/
Australian Government Department of Families, Housing, Community Services
and Indigenous Aairs. (2007). Sustainability report 2005–2006. Retrieved
from http://www.fahcsia.gov.au/about/publicationsarticles/corp/sustainability/
Documents/2006/default.htm
Azar, J. (2001, June). Environmental health and safety leadership at Xerox. Paper
presented at the Symposium on Sustainability, Clarkson University, Potsdam, NY.
Bare, J., Hofstetter, P., Pennington, D., & Udo de Haes, H. (2000). Midpoints versus
endpoints: e sacrices and benets. [Life cycle impact assessment workshop
summary]. International Journal of Life Cycle Assessment, 5(6), 319-326.
Beaufort-Langeveld, A., Bretz, R., van Hoof, G., Hischier, R., Jean, P., & Tanner, T.
(2003). Code of life cycle inventory practice. Pensacola, FL: Society of Environmental
Toxicology and Chemistry.
Ben-Haim, Y. (2006). Info-gap decision theory: Decisions under severe uncertainty (2nd
ed.). San Diego, CA: Academic Press.
Bengtsson, M., & Steen, B. (2000). Weighting in LCA - Approaches and applications.
Environmental Progress, 19(2), 101-109.

Life Cycle Analysis in the Printing Industry: A Review
33
References
Berglind, J., & Eriksson, H. (2002). Lifecycle assessment of toner cartridge HP C4127X:
Environmental impact from a toner cartridge according to dierent recycling
alternatives. (Final exam work, University of Kalmar, Kalmar, Sweden). Retrieved
from http://www.etira.org/images/content/2003%2520LCA%2520Toner%2520Cartr
idge%2520Swedish%2520University.doc
Boguski, T. K. (2010). Life cycle carbon footprint of the National Geographic magazine.
International Journal of Life Cycle Assessment, 15, 635-643.
Bosi, M. (2000). An initial view on methodologies for emission baselines: Electricity
generation case study. Paris, France: International Energy Agency. Retrieved from
http://www.iea.org/papers/2000/elgen.pdf
British Standards Institution. (2008). PAS 2050: Specication for the assessment of the
life cycle greenhouse gas emissions of goods and services. Retrieved from http://shop.
bsigroup.com/en/Browse-by-Sector/Energy--Utilities/PAS-2050/
Canon Inc. (2010). Canon sustainability report: 2010. Retrieved from http://www.canon.
com/environment/report/pdf/report2010e.pdf
Centre for Environmental Studies, University of Leiden. (2001). CML 2 baseline method
(2000). Retrieved from http://www.pre.nl/simapro/impact_assessment_methods.
htm#CML2
LCAiT: LCA inventory tool (4.0) [Computer soware]. Göteborg, Sweden: CIT Ekologik.
Counsell, T. A. M., & Allwood, J. M. (2007). Reducing climate change gas emissions
by cutting out stages in the life cycle of oce paper. Resources, Conservation and
Recycling, 49(4), 340-352.
Dias, A., Arroja, L., & Capela, I. (2007). Life cycle assessment of printing and writing
paper produced in Portugal. e International Journal of Life Cycle Assessment,
12(7), 521-528.
Duncan, S., Bras, B., & Paredis, C. (2008). An approach to robust decision making
under severe uncertainty in life cycle design. International Journal of Sustainable
Design, 1(1), 45-59.
Ebner, F., Chang, S., Knapp, J., Deyoung, V., & Latko, W. (2009, May). Development of
a green scorecard to identify research projects for eco-ecient print engines. Paper
presented at the IEEE International Symposium on Sustainable Systems and
Technology, Tempe, AZ. Retrieved from http://www.computer.org/portal/web/csdl/
doi/10.1109/ISSST.2009.5156693
ECMA International. (2009). Standard ECMA-328: Determination of chemical emission
rates from electronic equipment. Retrieved from http://www.ecma-international.org/
publications/standards/Ecma-328.htm
Ecobilan Group (1998). TEAM: Tools for environmental analysis and management (3.0)
[Computer soware].

Bousquin, Esterman & Rothenberg (PICRM-2011-05)
34
References
Ekvall, T. (1999). Key methodological issues for life cycle inventory analysis of paper
recycling. Journal of Cleaner Production, 7, 281-294.
Ekvall, T., & Finnveden, G. (2001). Allocation in ISO 14041 - A critical review. Journal
of Cleaner Production, 9, 197-208.
Environmental Defense Fund (1995). Paper task force report: Tips for selecting, buying
and reducing paper. New York, NY: Author.
European Federation of Corrugated Board Manufacturers, Groupment Ondulé,, & Kra
Institute. (2000). European database for corrugated board life cycle studies. Brussels,
Belgium: Author.
European Union. (2003a). Directive 2002/96/EC of the European Parliament and of the
Council of 27 January 2003 on waste electrical and electronic equipment (WEEE)
- Joint declaration of the European Parliament, the Council and the Commission
relating to Article 9. Retrieved from http://eur-lex.europa.eu/LexUriServ/
LexUriServ.do?uri=CELEX:32002L0096:EN:NOT
European Union. (2003b). Directive 2002/95/EC of the European Parliament and of
the Council of 27 January 2003 on the restriction of the use of certain hazardous
substances in electrical and electronic equipment [RoHS]. Retrieved from http://
eur-lex.europa.eu/LexUriServ/LexUriServ.do?uri=CELEX:32002L0095:EN:NOT
European Union. (2006). Directive 2006/121/EC of the European Parliament and of
the Council of 18 December 2006 amending Council Directive 67/548/EEC on the
approximation of laws, regulations and administrative provisions relating to the
classication, packaging and labelling of dangerous substances in order to adapt it to
Regulation (EC) No 1907/2006 concerning the Registration, Evaluation, Authorisation
and Restriction of Chemicals (REACH) and establishing a European Chemicals
Agency. Retrieved from http://www.reach-compliance.eu/english/legislation/docs/
launchers/launch-2006-121-EC-06.html
Federal Ministry for the Environment, Nature Conservation and Nuclear Safety. (2010).
e Blue Angel [Der Blaue Engel]. Available from http://www.blauer-engel.de/en/
Finnveden, G. (1994). Characterisation methods for depletion of energy and material
resources. In H.A. Udo de Haes, A.A. Jensen, W. Klöppfer, & L.-G. Lindfors (Eds.),
Integrating impact assessment into LCA: Proceedings of the LCA Symposium held at
the fourth SETAC-Europe Congress (p. 61-65). Brussels, Belgium: SETAC-Europe.
Finnveden, G., & Ekvall, T. (1998). Life cycle assessment as a decision-support tool—
e case of recycling versus incineration of paper. Resources, Conservation and
Recycling, 24(3-4), 235-256.
First Environment, Inc. (2004). LaserJet cartridge environmental comparison: A life
cycle study of the HP 96A print cartridge vs. its remanufactured counterpart in the
United Kingdom. Retrieved from http://www.rstenvironment.com/assets/pdf/HP_
LCA_12Pg_Summary_UK.pdf

Life Cycle Analysis in the Printing Industry: A Review
35
References
First Research, Inc. (2009, April). Industry prole: Commercial printing. Retrieved from
http://www.rstresearch.com/IndustryAnalysis/commercialprinting.html
Four Elements Consulting (2008). LaserJet cartridge life cycle environmental impact
comparison refresh study: HP LaserJet 10A print cartridge vs. remanufactured brands
in North America. Seattle, WA: Author.
Goedkoop, M., & Spriensma, R. (2000). e eco-indicator 99: A damage oriented method
for life cycle impact assessment: Methodology report. Amersfoort, e Netherlands:
Product Ecology (PRé) Consultants B.V.
Gower, S., McKeon-Ruediger, A., Reitter, A., Bradley, M., Rein, D., Tollefson, T., ...
Jarvis, R. (2006). Following the paper trail: e impact of magazine and dimensional
lumber production on greenhouse gas emissions. A case study. Washington, DC: e
Heinz Center for Science, Economics, and the Environment.
Graedel, T. E. (1998). Streamlined life-cycle assessment. Upper Saddle River, NJ: Prentice
Hall.
Guinée, J. B., Heijungs, R., van Oers, L.F.C.M., van de Meent, D., Vermeire, T., &
Rikken, M. (1996). LCA impact assessment of toxic releases, Generic modelling of
fate, exposure and eect for ecosystems and human beings with data for about 100
chemicals. e Hague: Ministry of Housing, Spatial Planning and Environment
(VROM).
Hewlett-Packard Development Company. (2009). HP carbon footprint calculator for
home and business computing products. Available from http://www.hp.com/large/
psg/toolassumptions.pdf
Hischier, R., & Reichart, I. (2003). Multifunctional electronic media-traditional media.
e International Journal of Life Cycle Assessment, 8(4), 201-208.
Humbert, S., Margni, M., & Jolliet, O. (2005). Impact 2002+: User guide. Lausanne,
Switzerland: Swiss Federal Institute of Technology Lausanne [Ecole Polytechnique
Federale De Lausanne]. Retrieved from http://www.sph.umich.edu/riskcenter/
jolliet/IMPACT2002+/IMPACT2002+_UserGuide_for_v2.1_Dra_October2005.
pdf
IEEE 1680 Family of standards for electronic products.
IEEE 1680.2 Standard for environmental assessment of imaging equipment
Intergovernmental Panel on Climate Change. (1996). Revised guidelines for national
greenhouse gas inventories. Hayama, Kanagawa: Author.
Intergovernmental Panel on Climate Change. (2006). Guidelines for national greenhouse
gas inventories. Hayama, Kanagawa: Author.
ISO 14040:2006, Environmental management – Life cycle assessment - Principles and
framework.

Bousquin, Esterman & Rothenberg (PICRM-2011-05)
36
References
ISO 14044:2006, Environmental management – Life cycle assessment – Requirements
and guidelines.
ISO/IEC 19752:2004, Information technology -- Method for the determination of toner
cartridge yield for monochromatic electrophotographic printers and multi-function
devices that contain printer components.
ISO/IEC 24712:2007, Colour test pages for measurement of oce equipment
consumable yield.
Japan Environmental Management Association for Industry. (2002). Guidelines for the
tntroduction of the ECO-LEAF environmental label. Tokyo, Japan: Author. Retrieved
from http://www.jemai.or.jp/english/ecoleaf/pdf/EcoleafGuideline_ver.1.pdf
Jiménez-González, C., Kim, S., & Overcash, M. (2000). Methodology for developing
gate-to-gate life cycle inventory information. e International Journal of Life Cycle
Assessment, 5(3), 153-159.
Jolliet, O. (1994). Critical surface-time: An evaluation method for LCA. In Udo de Haes,
H.A. (Ed.)., Integrating impact assessment into LCA (pp.133-142). Brussels, Belgium:
Society of Environmental Toxicology and Chemistry (SETAC) - Europe.
Jolliet, O. (1996). Impact assessment of human and eco-toxicity in life cycle assessment.
In Udo de Haes, H.A. (Ed.)., Towards a methodology for life cycle impact assessment
(pp. 49-61). Brussels, Belgium: Society of Environmental Toxicology and Chemistry
(SETAC) - Europe.
Jolliet, O., & Crettaz, P. (1997). Fate coecients for the toxicity assessment of air
pollutants. e International Journal of Life Cycle Assessment, 2(2), 104-110.
Kemna, R., Elburg, M., Li, W., & Holsteijn, R. (2005). MEEuP methodology report:
Methodology study eco-design of energy using products. Del, e Netherlands: Van
Holsteijn en Kemna (VHK) for the European Commission.
Kerr, W., & Ryan, C. (2001). Eco-eciency gains from remanufacturing a case study of
photocopier remanufacturing at Fuji Xerox Australia. Journal of Cleaner Production,
9, 75-81.
Koehler, D., Latko, W., & Stocum, A. (2010). Life cycle assessment of a solid ink
multifunction printer compared with a color laser multifunction printer, Total lifetime
energy investment and global warming impact. Stamford, CT: Xerox Corporation.
Lee, S. C., Lam, S., & Fai, H. K. (2001). Characterization of VOCs, ozone, and PM10
emissions from oce equipment in an environmental chamber. Building and
Environment, 36, 837-842.
Lexmark. (2010). Lexmark LCA cartridge study demonstrates benet of responsible
printing behaviors [Press release]. Retrieved from http://www1.lexmark.com/
content/en_us/about_us/newsroom/news_releases/lexmark_study_demonstrates_
printing_behaviors.shtml

Life Cycle Analysis in the Printing Industry: A Review
37
References
Loh, L., Canonico, S., Degher, A., & Moore, R. (2004). Integrating environmental
product design into HP inkjet printing supplies. Proceedings of the 2004
International IEEE Conference on the Asian Green Electronics (AGEC), 86-91. doi:
10.1109/AGEC.2004.1290875
Mayers, C. K., France, C. M., & Cowell, S. J. (2005). Extended producer responsibility
for waste electronics: An example of printer recycling in the United Kingdom.
Journal of Industrial Ecology, 9(3), 20.
Miner, R. (2010). Impact of the global forest industry on atmospheric greenhouse gases.
Rome, Italy: Food and Agriculture Organization of the United Nations.
Moon, J., Chung, K., Eun, J., & Chung, J. (2003). Life cycle assessment through on-line
database linked with various enterprise database systems. e International Journal
of Life Cycle Assessment, 8(4), 226-234.
National Renewable Energy Laboratory. (2004). U.S. life cycle inventory database
[Database]. Retrieved from http://www.nrel.gov/lci/
Ord, J., Canonico, S., Strecker, T., & Chappell, E. (2009). Product environmental metrics
for printers. ACM SIGMETRICS Performance Evalaution Review, 37(4), 79-83. doi:
10.1145/1773394.1773408
Östlin, J., Sundin, E., & Björkman, M. (2009). Product life cycle implications for
remanufacturing strategies. Journal of Cleaner Production, 17(11), 999-1009.
Pennington, D., Norris, G., Hoagland, T., & Bare, J. (2000). Environmental comparison
metrics for life cycle impact assessment and process design. Environmental Progress,
19(2), 83-92.
Product Ecology Consultants. (2006). SimaPro LCA soware (7.0) [Computer soware].
Quality Logic. (2007). Reliability comparison study: HP LaserJet toner cartridges vs.
remanufactured brands. Retrieved from http://www.qualitylogic.com/assets/pdfs/
consumables/Reliability_Comparison_Study-Mono_Toner-%20HP_vs_NA_
Reman_Brands_11-07.pdf
Reap, J., Roman, F., Duncan, S., & Bras, B. (2008a). A survey of unresolved problems in
life cycle assessment. Part 1: Goal and scope and inventory analysis. International
Journal of Life Cycle Assessment, 13, 290-300.
Reap, J., Roman, F., Duncan, S., & Bras, B. (2008b). A survey of unresolved problems
in life cycle assessment. Part 2: Impact assessment and interpretation. International
Journal of Life Cycle Assessment, 13, 374-388.
Ricoh Group. (2009). 2009 Ricoh Group Sustainability Report (Environment). Retrieved
from http://www.ricoh.com/environment/report/index2009.html
Rothenberg, S. (2007). Sustainability through servicizing. MIT Sloan Management
Review, 48(2), 83-89.

Bousquin, Esterman & Rothenberg (PICRM-2011-05)
38
References
Rowzie, K. (2008, October). Driving sustainability throughout the supply chain - Verso
Paper. Pulp & Paper, October 2008, 21-23.
Shen, L., & Patel, M. (2008). Life cycle assessment of polysaccharide materials: A review.
Journal of Polymers and the Environment, 16(2), 154-167.
Silva, N. D., Jawahir, I. S., Dillion, O., & Russell, M. (2006). A new comprehensive
methodology for the evaluation of product sustainability at the design and
development stage of consumer electronic products. Paper presented at the 13th CIRP
International Conference on Life Cycle Engineering, Leuven, Belgium. Retrieved
from http://www.mech.kuleuven.be/lce2006/083.pdf
SLS Consulting, Inc. (2008). e environmental impacts of the mail: Initial life cycle
inventory model and analysis. Retrieved from www.the-dma.org/government/
LCIreport.pdf
Steward, F., Tsoi, J. C. S., & Coles, A.-M. (2008). Innovation and sustainability in
print-on-paper: A comparison of nanoparticle and deinking niches as emergent
sociotechnical networks. Journal of Cleaner Production, 16(8-9), 957-966.
Stobbe, L. (2007). EuP preparatory studies “Imaging equipment” (Lot 4): Final reports
on tasks 1 through 8. Berlin, Germany: Fraunhofer IZM. Available from http://
ecoimaging.org/nalised_documents.php
Swiss Center for Life Cycle Inventories. (2007). Ecoinvent data (2.0) [Database].
Available from http://www.ecoinvent.org/home/
Tolle, D. A., Evers, D. P., Vigon, B. W., & Sheehan, J. J. (2000). Streamlined LCA of
soy-based ink printing. e International Journal of Life Cycle Assessment, 5(6),
374-384.
U.S. Energy Information Administration. (2006). 2006 energy consumption by
manufacturers--Data tables. Retrieved from http://www.eia.doe.gov/emeu/mecs/
mecs2006/2006tables.html
U.S. Environmental Protection Agency. (2006). ENERGY STAR qualied imaging
equipment typical electricity consumption (TEC) test procedure. Retrieved from
http://www.eu-energystar.org/downloads/specications/20060422/TEC%20Test%20
Procedure%204-21-06.pdf
U.S. Environmental Protection Agency. (2008). ENERGY STAR program requirements
for imaging equipment (version 1.1). Retrieved from http://www.energystar.gov/ia/
partners/prod_development/revisions/downloads/img_equip/Imaging_Equipment_
Specication_Final_V1.1.pdf
U.S. Environmental Protection Agency. (2010). ENERGY STAR qualied oce
equipment [Database]. Retrieved from http://www.eu-energystar.org/en/database.
htm

Life Cycle Analysis in the Printing Industry: A Review
39
References
Vachon, S., & Klassen, R. D. (2006). Green project partnership in the supply chain:
e case of the package printing industry. Journal of Cleaner Production, 14(6-7),
661-671.
Veith, S., & Barr, S. (2008). Life cycle assessment: Flexographic and rotogravure printing
comparison & exographic plate imaging technologies. Wilmington, DE: DuPont
Packaging Graphics.
Villanueva, A., & Wenzel, H. (2007). Paper waste - Recycling, incineration or
landlling? A review of existing life cycle assessments. Waste Management, 27(8),
S29-S46.
Wenzel, H. (1998). Application dependency of lca methodology: Key variables and their
mode of inuencing the method. International Journal of Life Cycle Assessment, 3(5),
281-288.
World Resources Institute, United Nations Environment Programme, United Nations
Development Programme, & e World Bank. (1998, May). World resources 1998-
1999: Environmental change and human health. Retrieved from http://www.wri.org/
publication/world-resources-1998-99-environmental-change-and-human-health
World Resources Institute. (2004). World Resources Institute annual carbon dioxide
(CO
2
) inventory report calendar year 2003. Washington, DC: Author. Retrieved from
http://pdf.wri.org/2003_co2_report_nal.pdf
Xerox Corporation. (2008). Xerox sustainability calculator fact sheet. Stamford, CT:
Author.
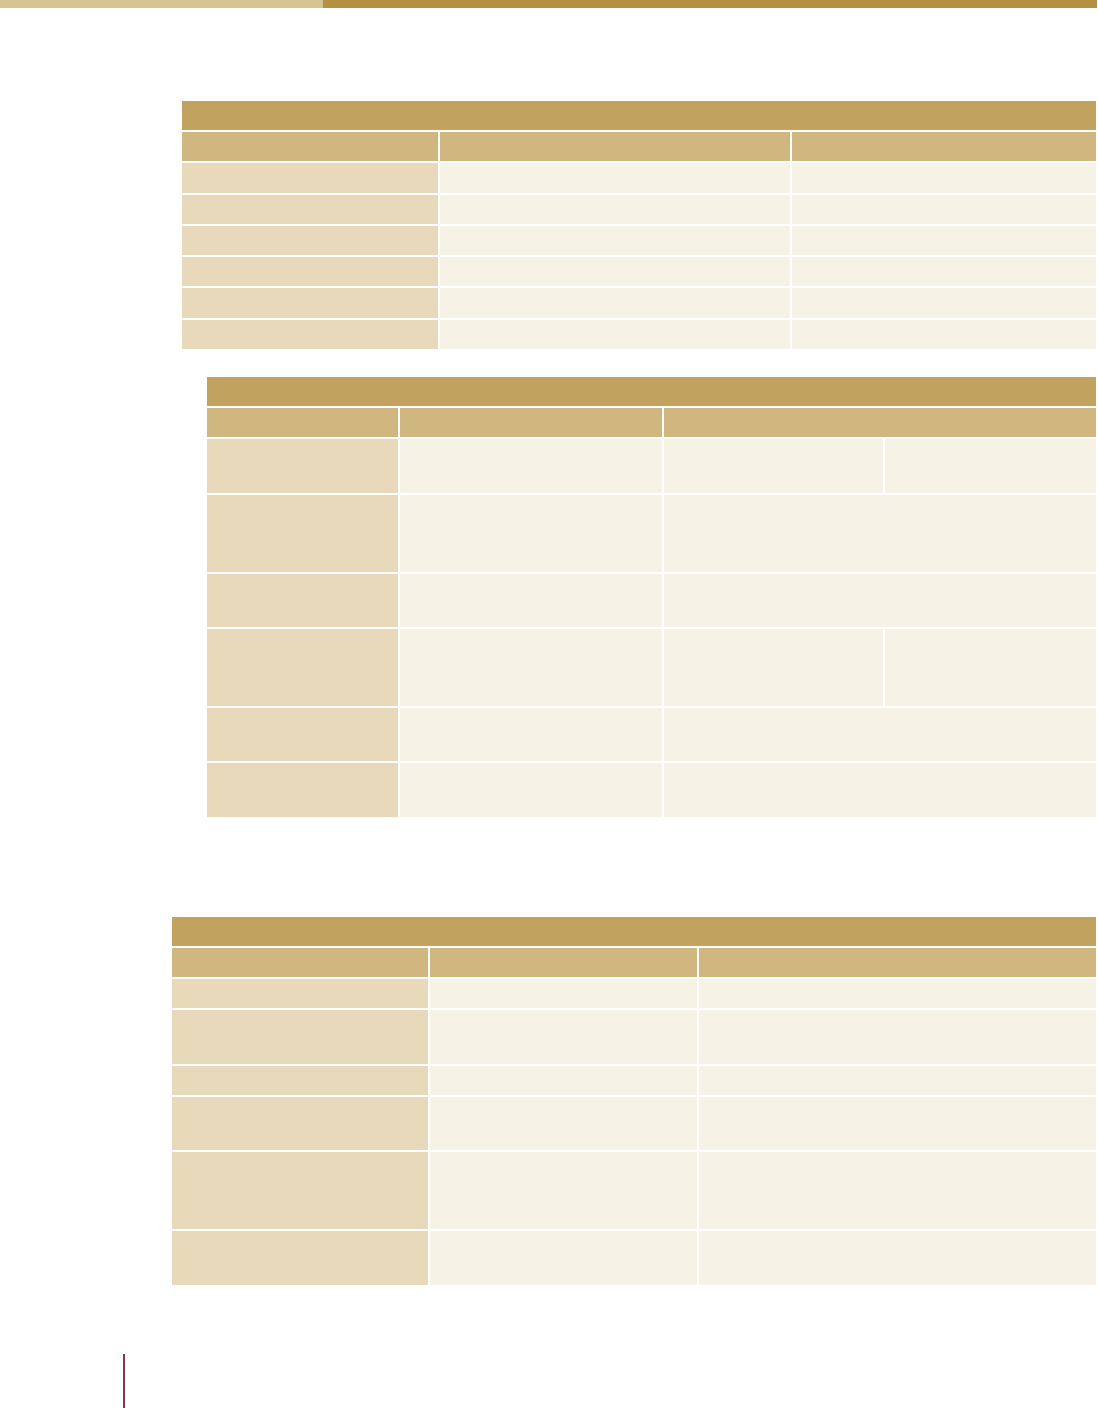
Bousquin, Esterman & Rothenberg (PICRM-2011-05)
40
Appendix A: Life Cycle Stage Data
Appendix A: Life Cycle Stage Data
Academic Studies to Establish Baseline Data
Life Cycle Stage [5] Stobbe 2007 [4] Mayers 2005
Raw Materials Acquisition Excluded Reuse considered
Production Based on materials, omit assembly Excluded
Transportation Based on mass and volume Excluded
Use With and without paper Excluded
End-of-life Does not include reuse, leasing, etc. Focus of study. Reuse included.
Packaging Included in Misc. when available Included in collection
Cartridge Remanufacture
Life Cycle Stage [6] Berglind 2002 [7] Four Elements 2008
Raw Materials
Acquisition
Materials production from
various sources
99.5% of materials
listed
25% of materials
recycled
Production
Assembly and restoration/
refilling
No supply chain data. Proxies to cartridge
parts were used for injection molding, steel,
and aluminum processes.
Transportation
Distance estimated for all
phases
Distribution only, 1,500 miles for R10A, 5,150
miles for HP10A.
Use
46.7 kg paper, 63 kWh
energy, and 373g toner
426 Watts, 24ppm,
6,000 pages
101 pages (†)
426 Watts, 24ppm,
5877 pages
114 pages(†)
End-of-life
Compares two alternatives,
but otherwise the same
82% Landfill
18% Weight-to-Energy
Packaging
European database for
corrugated board (‡)
28g polyethylene, 355g corrugated cardboard,
142g pulp end caps.
(†) Printed pages necessary to obtain 100 acceptable quality prints (Quality Logic, 2007)
(‡) European Federation of Corrugated Board Manufacturers [FEFCO], Groupment Ondulé,, & Kra
Institute, 2000.
Comparative LCA
Life Cycle Stage [10] Veith 2008 [2] Koehler 2010
Raw Materials Acquisition Excluded Excluded
Production
Manufacture of the
photopolymer plates
Manufacture of printer and consumables
Transportation Excluded Transport of consumables
Use
Imaging, plate mounting,
and printing
Use of the device
End-of-life Process wastes included
Service activities and device end-of-life
excluded. Cartridges: 10% remanufactured
& 25% recycled.
Packaging Excluded
Packaging of consumables: 60% recycled.
End-of-life: 70% recycled.
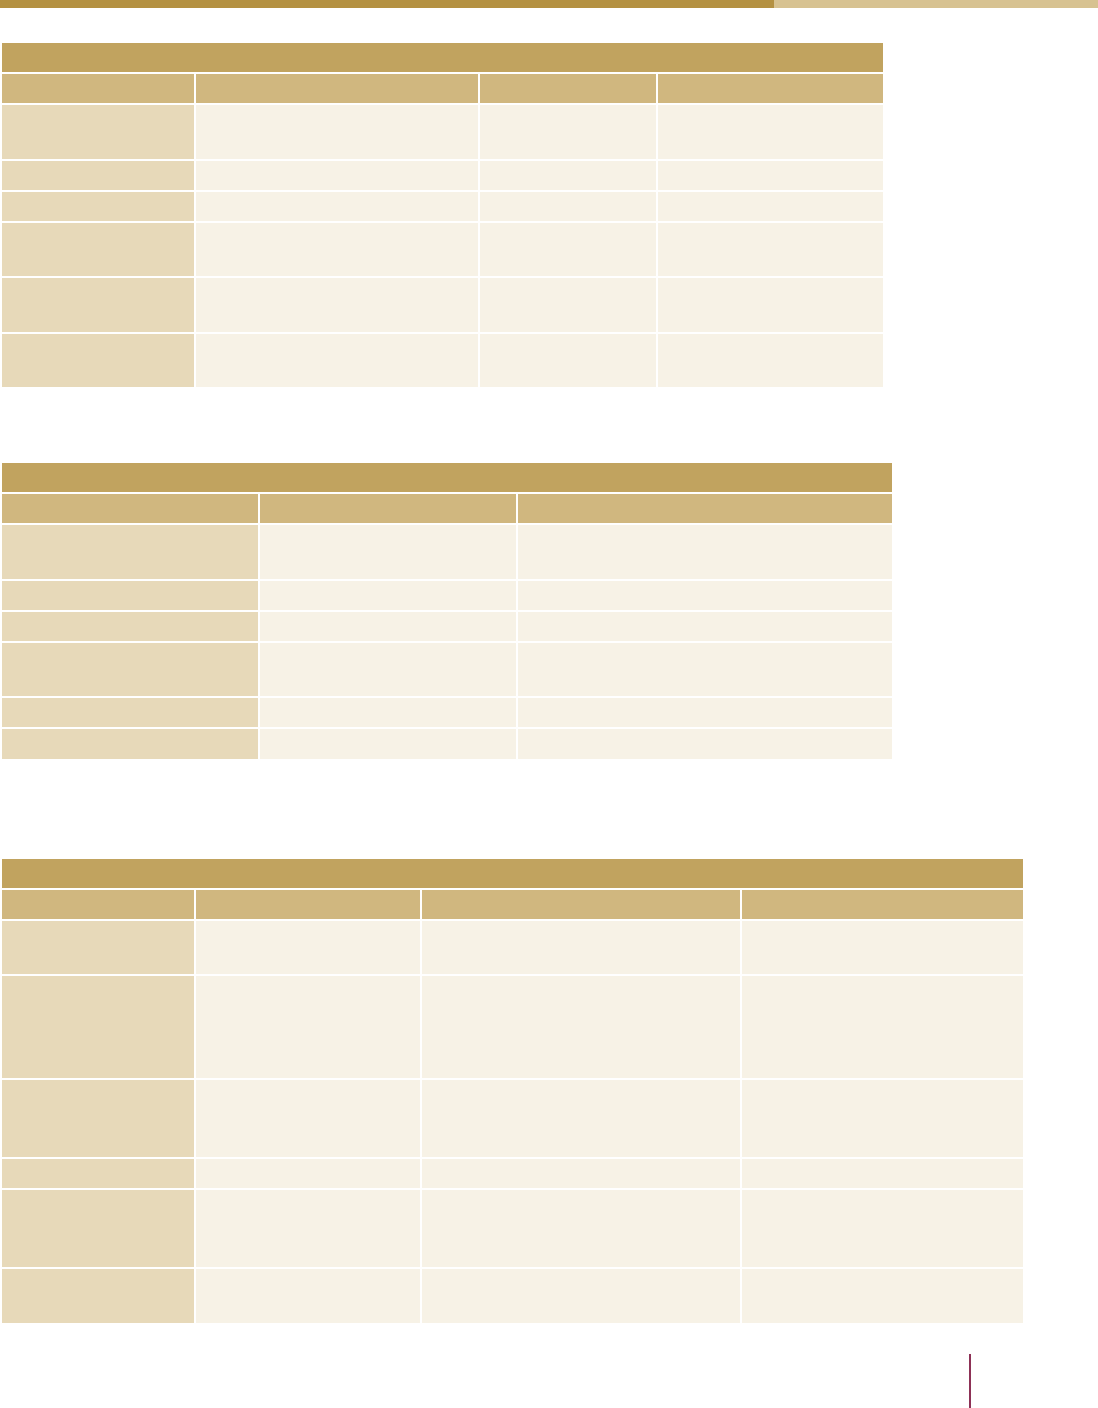
Life Cycle Analysis in the Printing Industry: A Review
41
Appendix A: Life Cycle Stage Data
Tools for Design/Decision
Life Cycle Stage [11] Silva 2006 [12] Ebner 2009 [1] Ord 2009
Raw Materials
Acquisition
Material mass, and toxicity
(Eco-Indicator 99)†
Material reuse 32 material masses
(Ecoinvent database)‡
Production Excluded Materials toxicity IPCC 2007
Transportation Excluded Excluded Up to assembly
Use Average power consumption.
CO
2
emissions during use.
Energy and air
quality
Based on energy
estimator
End-of-life Functional life, upgrade
option and recyclability.
Percent of mass
recyclable
Expected life is input.
Ease of recycling.
Packaging Material and quantity Hulk packaging
mass
Excluded
† Goedkoop & Spriensma, 2000
‡ Swiss Center for Life Cycle Studies, 2007
Consumer Calculators
Life Cycle Stage [13] HP 2009† [14] Xerox 2008
Raw Materials Acquisition Excluded
Energy & GHG results by stage
EuP Data
Production Paper & pulp Energy & GHG results by stage
Transportation Excluded Excluded
Use
Energy (TEC)
Paper (Ecoinvent)‡
Energy & GHG results by stage
End-of-life Excluded Solid waste results for each stage
Packaging Excluded Consumables packaging
† Excluded stages may contribute CO
2
e impacts based on the Ecoinvent database, but these aspects of the
scope is not addressed in the study.
‡ Swiss Center for Life Cycle Studies, 2007
Printers/Printing Processes
Life Cycle Stage [3] Kerr 2001 [10] Boguski 2009 [8] Ahmadi 2003
Raw Materials
Acquisition
Measured materials
consumption avoided
Primary data forestry/wood
harvest from paper supplier.
Carbon black, magnetite &
resin components
Production
Energy saving due to
remanufacture
Primary data from pulp and
paper mill operations, printer
operations, content development
and even advertising activities.
Toner manufacturing from
materials
Transportation Excluded
Domestic and international
distribution (USPS data †)
Raw materials to toner
manufacturer, toner to
customer, toner waste recycle
Use Excluded Consumer use/reuse Consumer use
End-of-life
Measured avoided
waste disposal
Domestic and international
practices weighted
Toner recycle, de-inking of
paper, toner on paper to
landfill
Packaging Excluded Pallets and packaging
Included in toner
manufacturing
† SLS Consulting, 2008
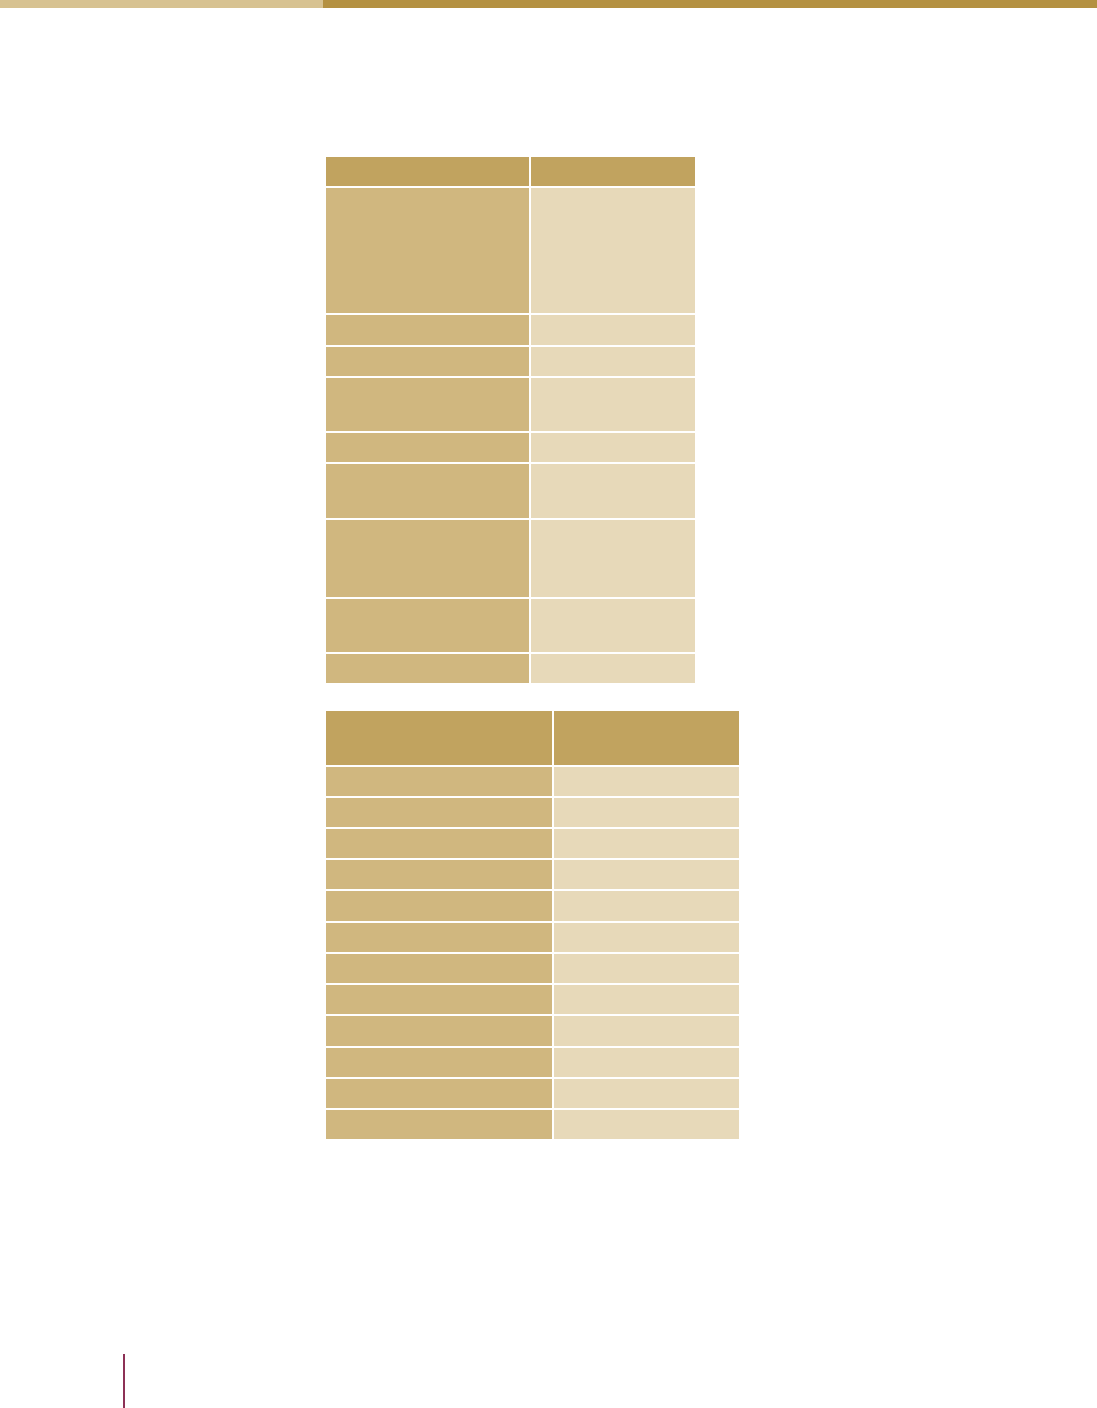
Bousquin, Esterman & Rothenberg (PICRM-2011-05)
42
Appendix B: Referenced Certifications and Standards
Appendix B: Referenced
Certifications and Standards
Data/Standard Studies
ENERGY STAR
Stobbe 2007
Ebner 2009
Koehler 2010
HP 2009
Xerox 2008
MEEuP EcoReport Stobbe 2007
EcoBilan Mayers 2005
American Forest &
Paper Association
Ahmadi 2003
EcoInvent Ord 2009
WRI
Ord 2009
HP 2009
IPCC
Ord 2009
Mayers 2005
Boguski 2009
SimaPro 7
Koehler 2010
Veith 2008
LCAiT Berglind 2002
Standard/Certification
Number of studies
referenced
ENERGY STAR 5
IPCC 5
ISO 4
WEEE 4
WRI 3
RoHS 3
EcoLeaf 2
EuP 3
REACH 2
Blue Angel 2
EPEAT 1
PNAS 1
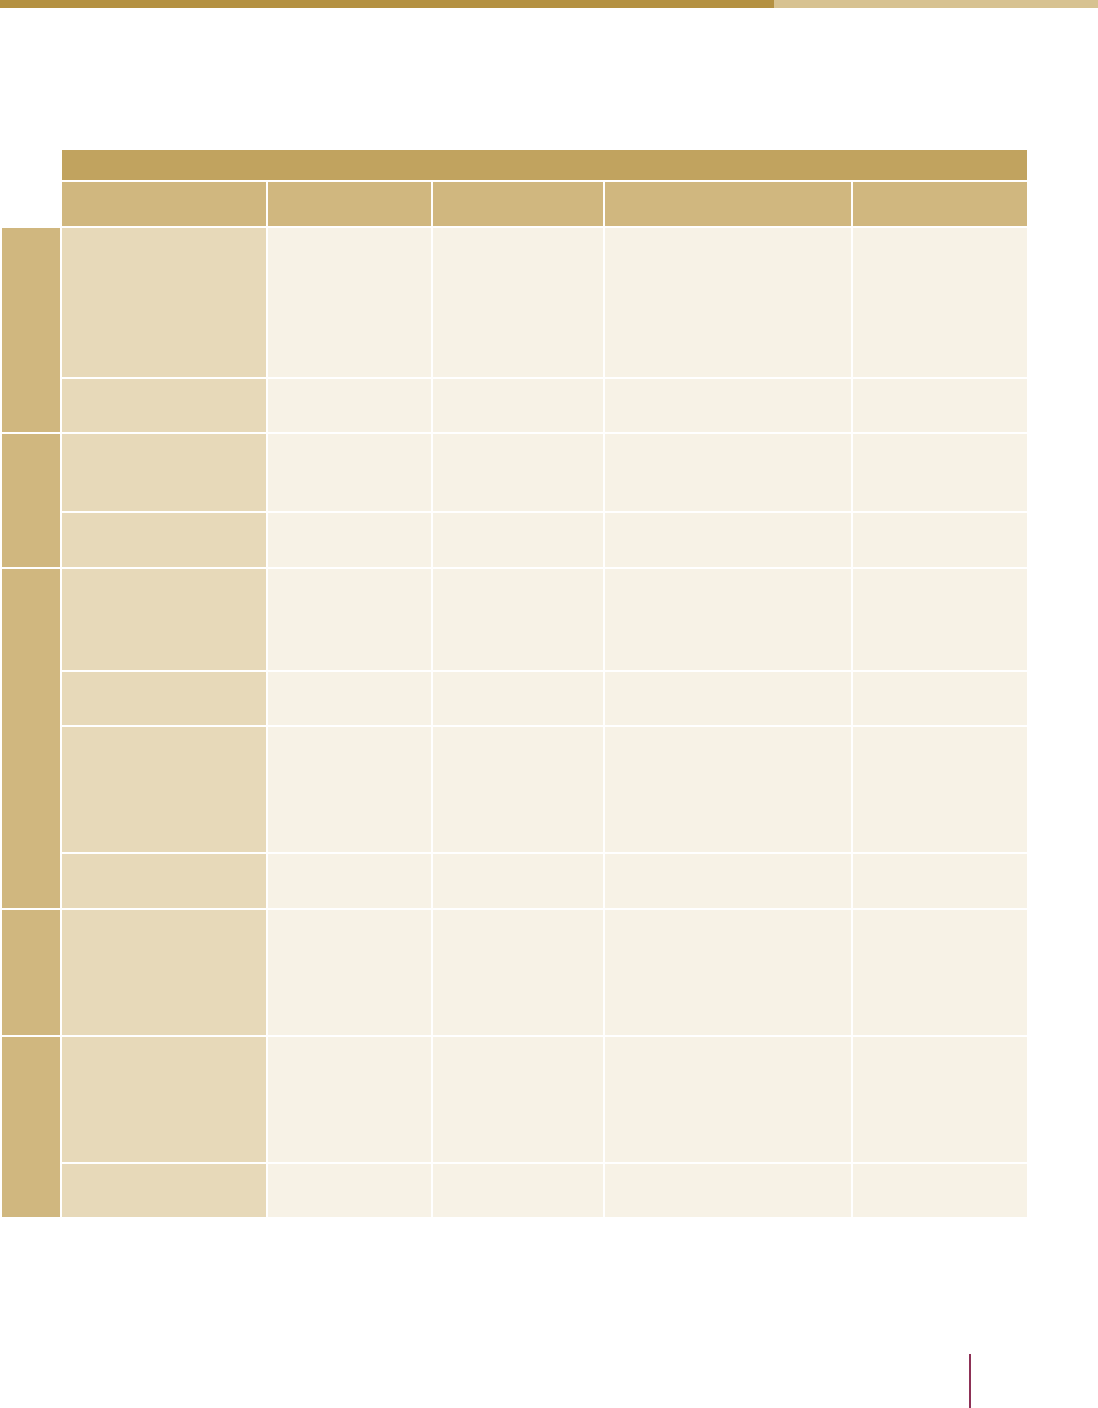
Life Cycle Analysis in the Printing Industry: A Review
43
Appendix C: Impact Categories and Data Used in Studies
Appendix C: Impact Categories and Data
Used in Studies
Academia Studies*
Impact Category [5] Stobbe 2007 [4] Mayers 2005 [8] Ahmadi 2003 [6] Berglind 2002
Resources
Energy
ENERGY STAR
database (US
Environmental
Protection
Agency [EPA],
2010)
Non-renewable
resources:
Finnveden, 1994
Energy use emissions
calculated from EDF
(1995) Fossil Fuel
Calculated based
on usages
Water
MEEuP
EcoReport†
-- Wastewater --
Emissions
Eutrophication
MEEuP
EcoReport†
Centre for
Environmental
Studies (2001)
-- --
Acidification (SO
2
e)
MEEuP
EcoReport †
Ecobilan Group
(1998)
SO
2
and NOx --
Air Emissions
Global Warming
Potential
MEEuP
EcoReport †
100 years
IPCC (1996) and
Ecobilan (1998)
20, 100 & 500
year cases
Electricity CO
2
GWP 100-years
Particulate Matter,
dust
MEEuP
EcoReport †
-- Particulates --
Persistent Organic
Pollutants (POP),
Ozone Depletion
& Photochemical
Oxidant Formation
POP & ozone
depletion:
MEEuP
EcoReport†
Photochemical
oxidant
formation &
ozone depletion:
Ecobilan (1998)
--
NOx – LCAiT
software
Volatile Organic
Compounds
MEEuP
EcoReport†
--
VOCs (Jiménez-Gonzalez,
Kim & Overcash, 2000)
--
Toxicity
Polycyclic Aromatic
Hydrocarbons,
Heavy Metals and
other
MEEuP
EcoReport†
Jolliet & Crettaz
1997; Jolliet
1994, 1996;
Guinée et al.
1996
-- --
Waste
Waste (non-
hazardous/land fill)
MEEuP
EcoReport†
--
66% toner recovered
(Azar, 2001)
43% paper recycled
(American Forest & Paper
Association, 2009)
Waste Generation
– LCAiT software
Waste (hazardous/
incinerated)
MEEuP
EcoReport†
-- -- --
* Study 5 (Silva, 2006) is not included here, as it does not attribute any data to its midpoints
† Kemna, Elburg, Li, & Holsteijn, 2005
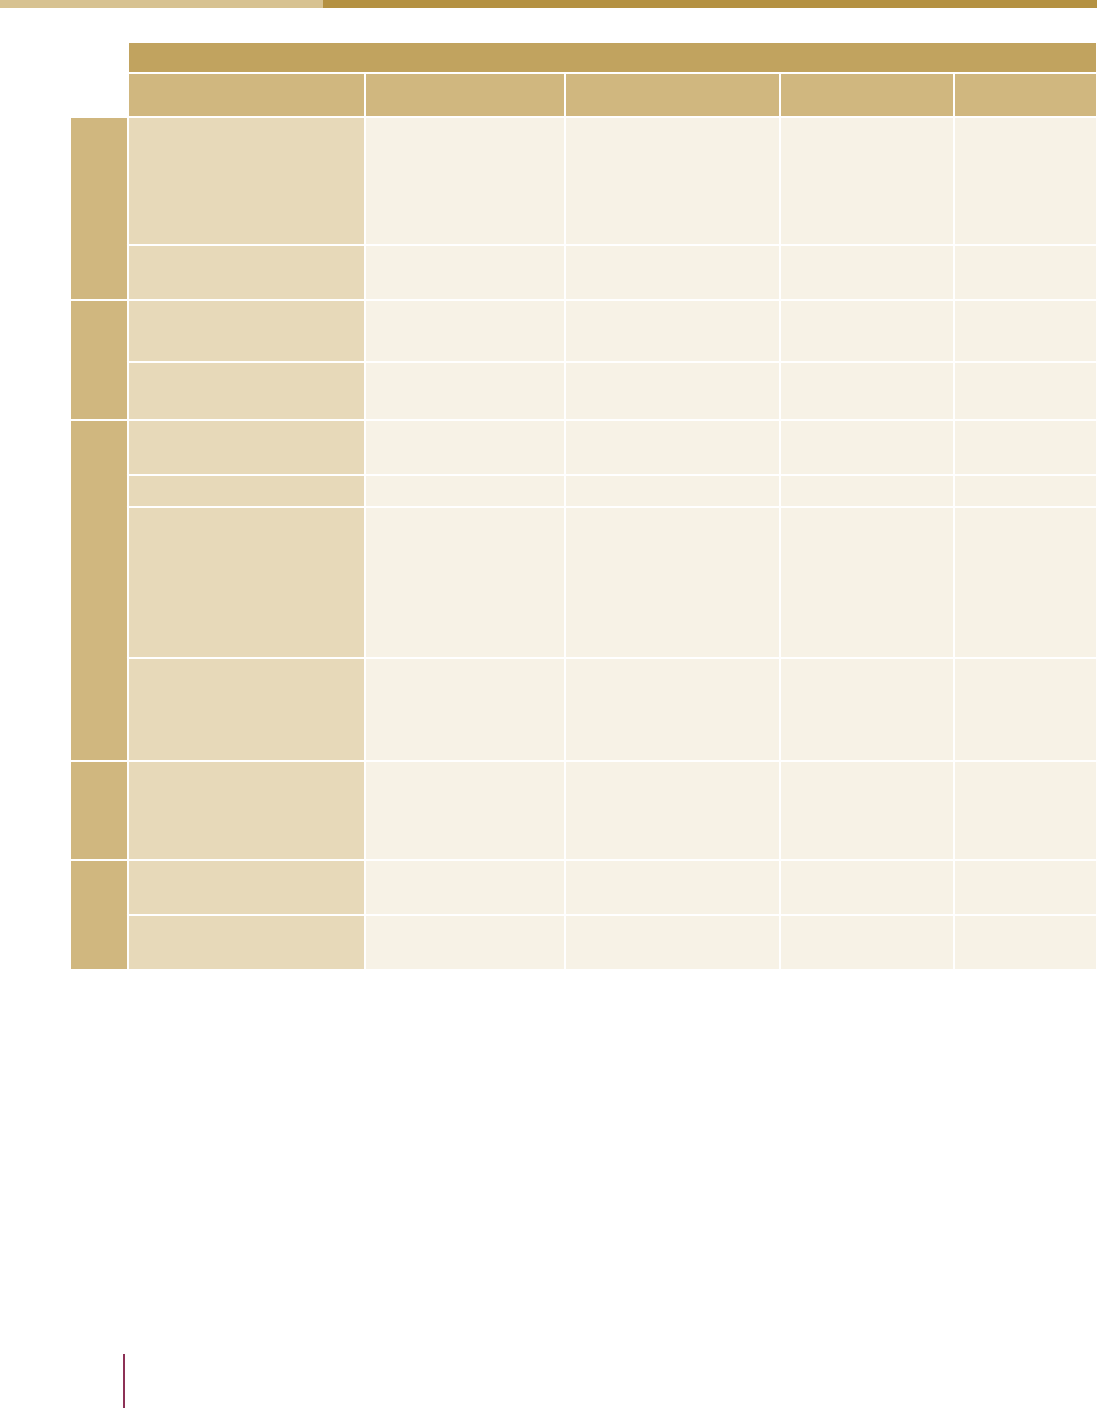
Bousquin, Esterman & Rothenberg (PICRM-2011-05)
44
Appendix C: Impact Categories and Data Used in Studies
Design Decision Tool
Impact Category [1] Ord 2009 [12] Ebner 2009 [11] Silva 2006 [3] Kerr 2001
Resources
Energy
Ecoinvent database.
Emissions factors
from World
Resources Institute
[WRI] (2004)
ENERGY STAR
TEC-based internal
estimates (EPA, 2007)
Average power
consumption
Not
Quantified
Water -- -- --
Not
Quantified
Emissions
Eutrophication -- -- -- --
Acidification (SO
2
e) -- -- -- --
Air Emissions
Global Warming
Potential 100 Years
IPCC (1996) used to
convert to CO
2
e
-- --
Not
Quantified
Particulate Matter, dust -- -- -- --
Persistent Organic
Pollutants (POP),
Ozone Depletion &
Photochemical Oxidant
Formation
--
Based on Blue Angel
(Federal Ministry for
the Environment,
Nature Conservation
and Nuclear Safety,
2010)
-- --
Volatile Organic
Compounds
--
Based on RoHS
(European Union [EU],
2003b) & REACH
(EU, 2006)
-- --
Toxicity
Polycyclic Aromatic
Hydrocarbons, Heavy
Metals and other
-- -- RoHS (EU, 2003b) --
Waste
Waste (non-hazardous/
land fill)
-- --
Recyclability and
disposal options
Not
Quantified
Waste (hazardous/
incinerated)
-- -- -- --
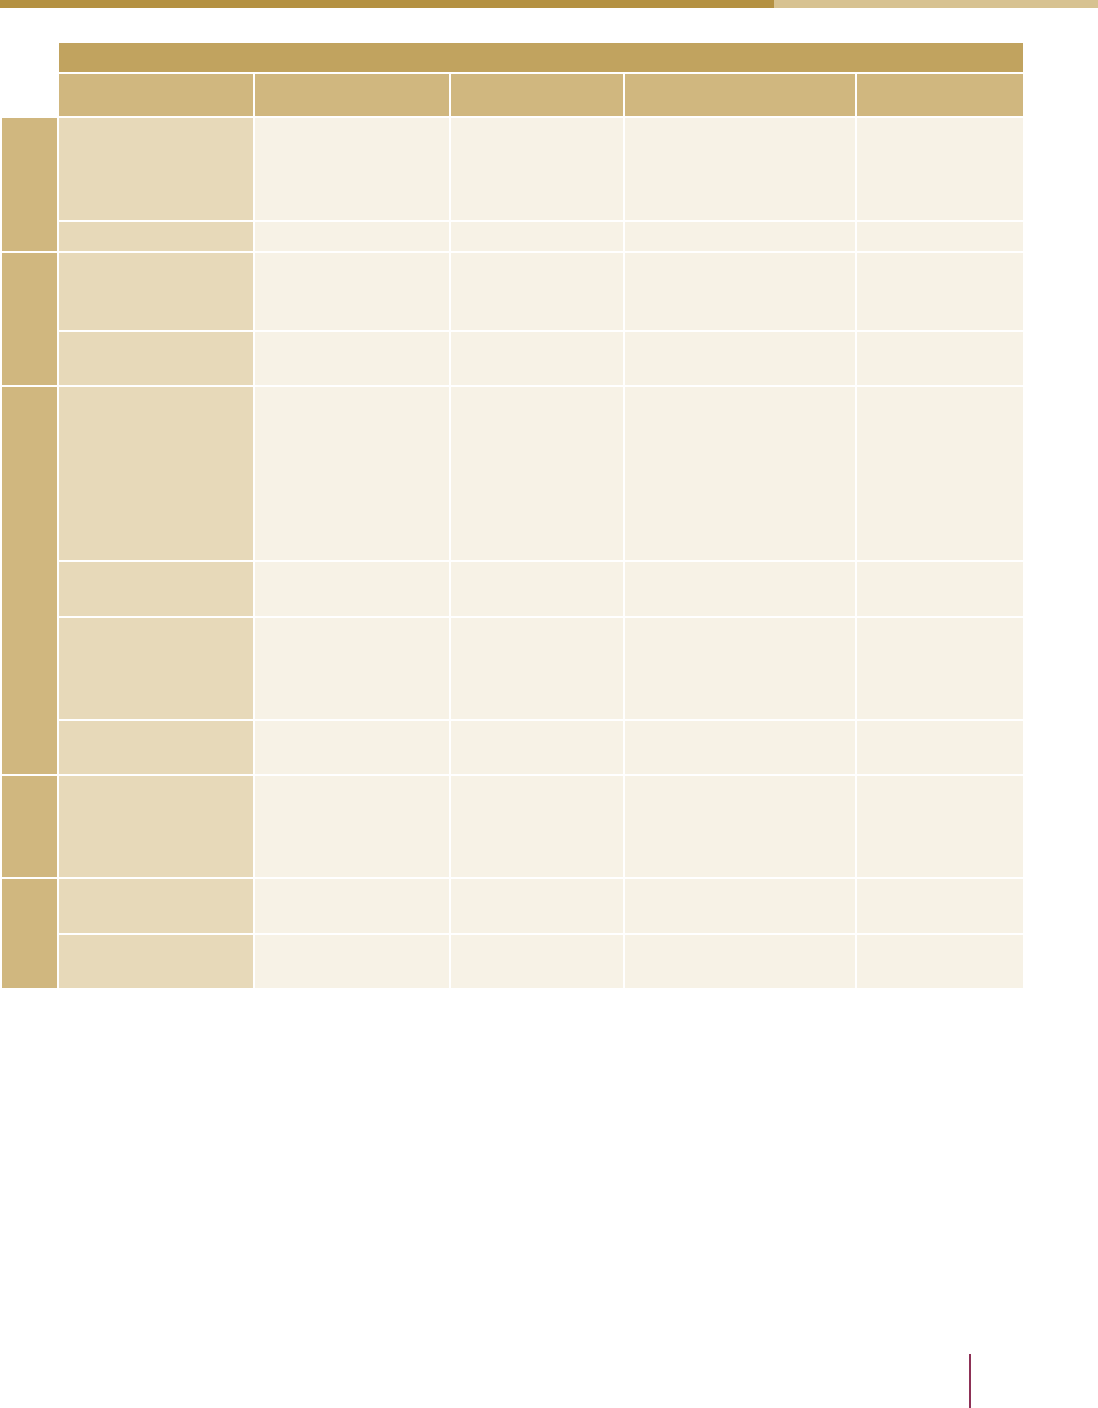
Life Cycle Analysis in the Printing Industry: A Review
45
Appendix C: Impact Categories and Data Used in Studies
External Communications (Marketing)
Impact Category [9] Boguski 2009 [2] Koehler 2010 [7] Four Elements 2008 [10] Veith 2008
Resources
Energy
Fuel and electricity
for a variety of
locations and
transportations
ENERGY STAR
TEC (EPA, 2007)
EcoIndicator 99
(Goedkoop et al., 2000)
and inventory results
SimaPro 7
(Product Ecology
Consultants
[PRé], 2006)
Water
Emissions
Eutrophication
IMPACT 2002
(Humbert, Margni, &
Jolliet, 2005)
Acidification (SO
2
e)
IMPACT 2002 (Humbert
et al., 2005)
Air Emissions
Global Warming
Potential
IPCC (1996)
SimaPro 7 (PRé,
2006) “industry
average” data
used when direct
manufacturing
data not
available
IPCC (1996) IPCC (1996)
Particulate Matter,
dust
Ozone, Persistent
Organic Pollutants,
Photochemical
Smog
Photochemical Smog
Potential (Centre for
Environmental Studies,
2001)
Volatile Organic
Compounds
Toxicity
Polycyclic Aromatic
Hydrocarbons,
Heavy Metals and
other
Vinyl Chloride, IMPACT
2002 (Humbert et al.,
2005)
Waste
Waste (non-
hazardous/land fill)
Waste (hazardous/
incinerated)
Post consumer
waste generation
Inventory result
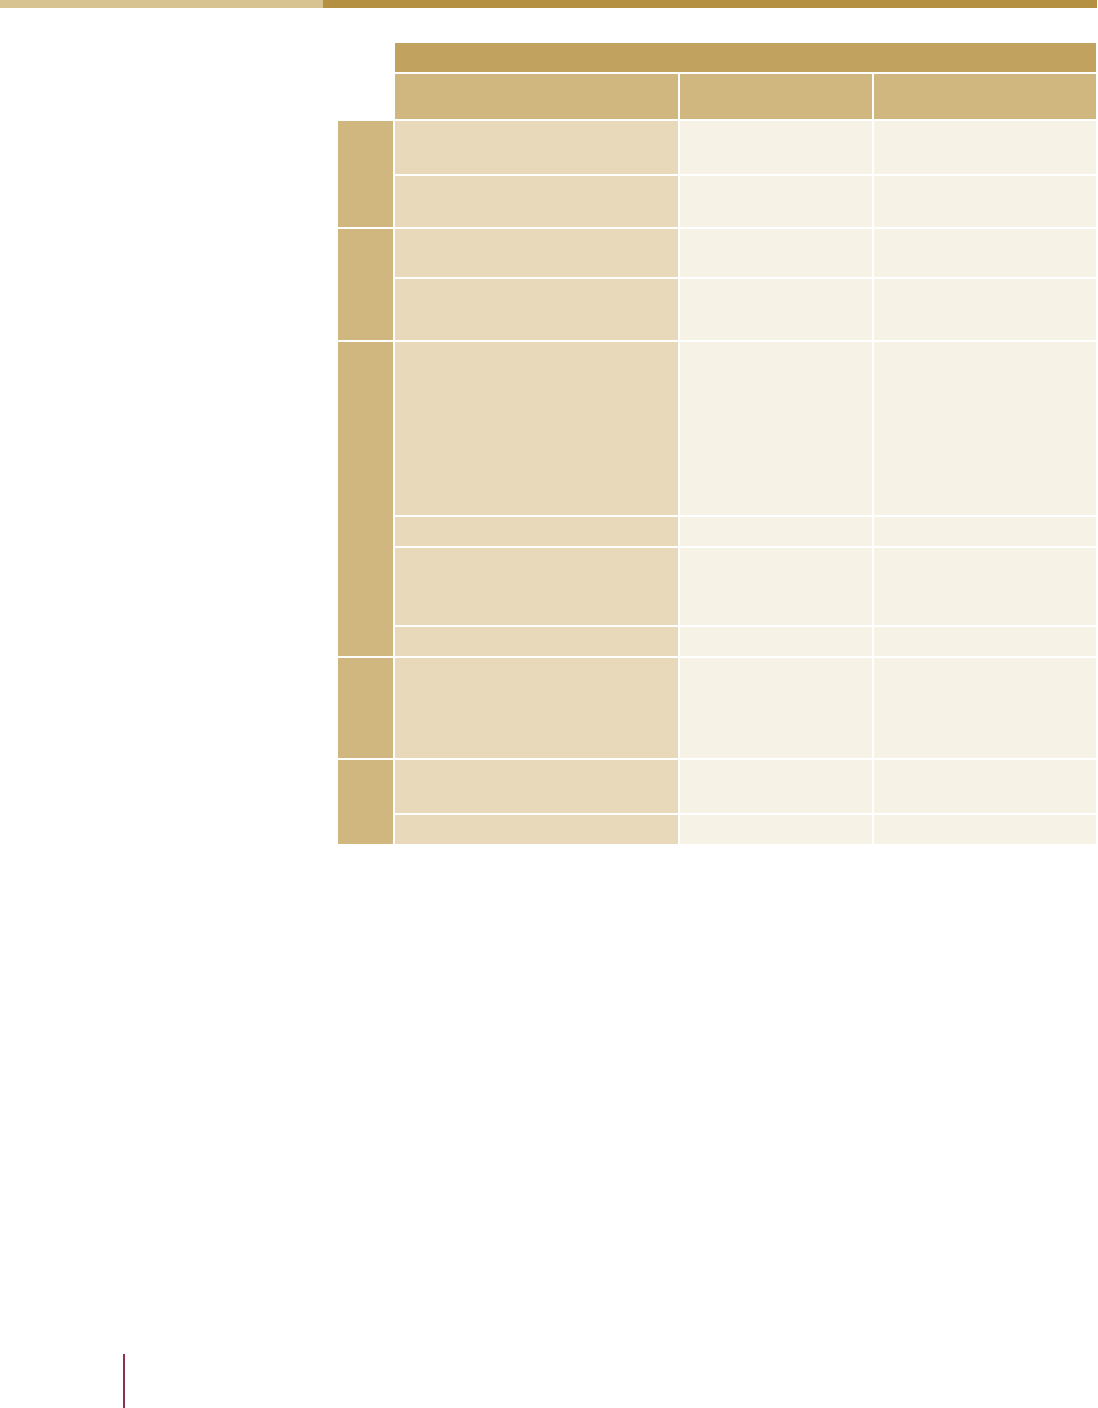
Bousquin, Esterman & Rothenberg (PICRM-2011-05)
46
Appendix C: Impact Categories and Data Used in Studies
External Calculators
Impact Category [13] HP 2009 [14] Xerox 2008
Resources
Energy
ENERGY STAR TEC
(EPA, 2007)
ENERGY STAR (EPA,
2008)
Water -- --
Emissions
Eutrophication -- --
Acidification (SO
2
e) -- --
Air Emissions
Global Warming Potential
WRI (2004) 100
year GWP
EuP (Stobbe, 2007),
International Energy
Agency (Bosi, 2000),
U.S. LCI database
(National Renewable
Energy Laboratory,
2004)
Particulate Matter, dust -- --
Persistent Organic Pollutants,
Ozone Depletion and
Photochemical Smog
-- --
Volatile Organic Compounds -- --
Toxicity
Polycyclic Aromatic
Hydrocarbons, Heavy Metals
and other
-- --
Waste
Waste (non-hazardous/land
fill)
--
Based on primary data
or industry average
Waste (hazardous/incinerated) -- --

Rochester Institute of Technology
College of Imaging Arts and Sciences
55 Lomb Memorial Drive
Rochester, NY 14623
Phone: (585) 475-2733
http://print.rit.edu
