FOR MORE INFORMATION
Chaat Butsunturn, 415-391-7900 x1214
OR Amanda Roberts, 202-535-7800 x1114
ACSI: Drop in National Customer Satisfaction Reaches Seven Quarters
Customer Satisfaction Declines Across Nondurable Products
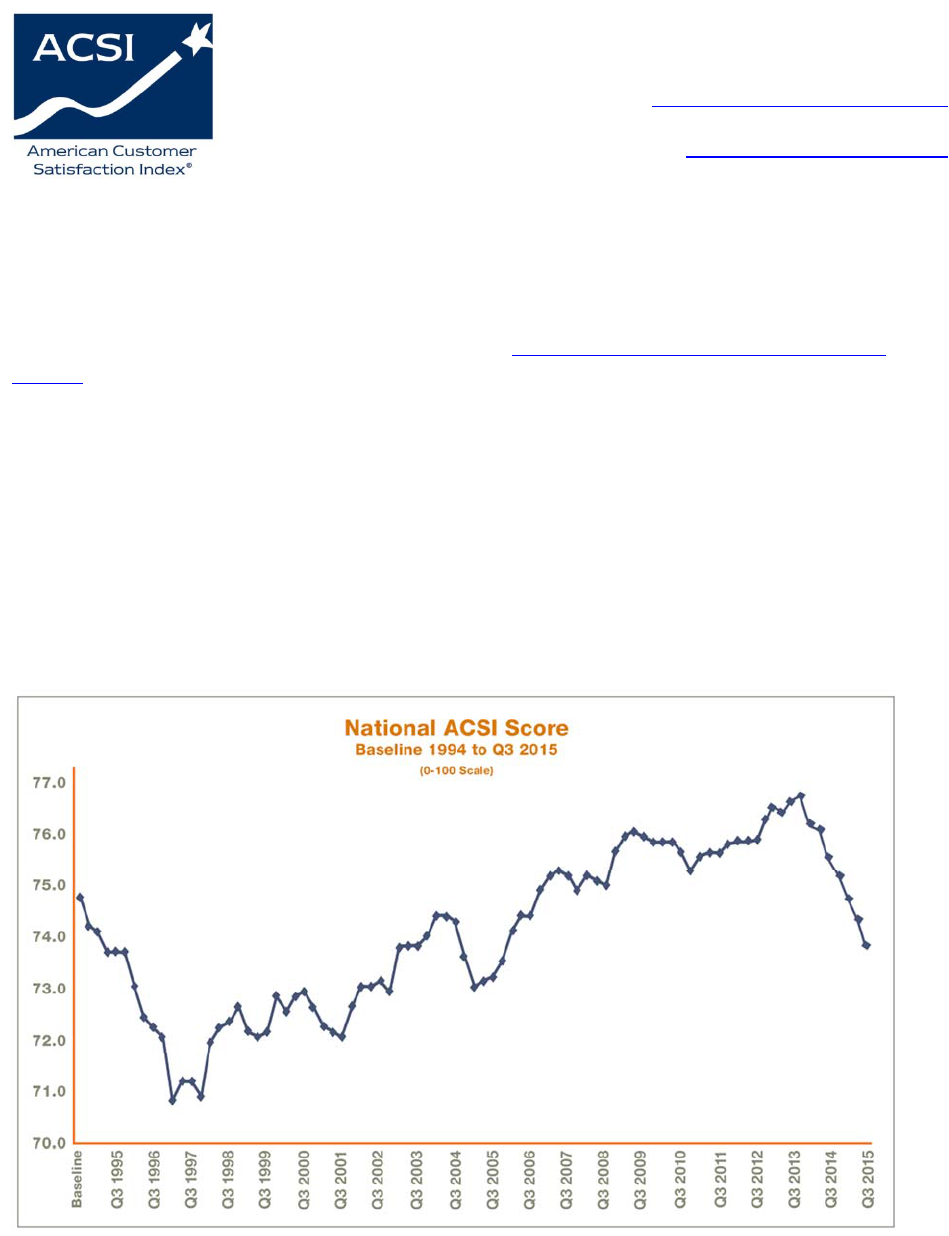
ANN ARBOR, Mich., (December 15, 2015) – The American Customer Satisfaction Index
(ACSI) measure of overall customer satisfaction in the U.S. economy falls for a seventh
consecutive quarter. The national ACSI score, measured in the third quarter of 2015, dips 0.7
percent to 73.8 on a 100-point scale. Since peaking in the fourth quarter of 2013, the national
ACSI has fallen 3.9 percent, the longest stretch of deteriorating total customer satisfaction since
1996 to 1997.
“Without a turnaround in customer satisfaction, it’s hard to be optimistic about consumer
spending growth,” says Claes Fornell, ACSI Chairman and founder. “The effect of languishing
buyer satisfaction is usually due to a downward shift in demand curves, which shows up in weak
consumer spending. Consumer demand is picking up, but not at a rate necessary to propel robust
economic growth.”

The prospects for a surge in consumer spending necessary to provide a jolt to the economy seem
highly unlikely. Though the economy added 211,000 jobs in November, the job participation rate
so far this year is just below 63 percent and has not improved much in several years. Growth of
the labor force itself is weak. Furthermore, job growth may be less of a response to increasing
demand than to poor productivity.
The ACSI model predicts consumer spending growth of about 2.6 percent to 2.7 percent for the
fourth quarter of 2015. This may well be the new “normal” growth rate, but it is only about half
of what it was in the late 1990s. Since consumer spending represents about 70 percent of the
economy, there is no reason to expect that the economy will grow at a better clip.
Nondurable Products
Customer satisfaction drops across all measured industries in the manufacturing/nondurable
goods sector. Though overall inflation is low, food and beverage prices have increased, which is
contributing to lower customer satisfaction with nondurable products. Nearly all companies score
lower now compared with a year ago.
“Because of higher prices, consumers are spending a bit more on food items, and it is not clear if
the continued weak wage increases and lower gas prices leave household disposable income
intact,” says Fornell. “If not, there is less to spend on everything else.”
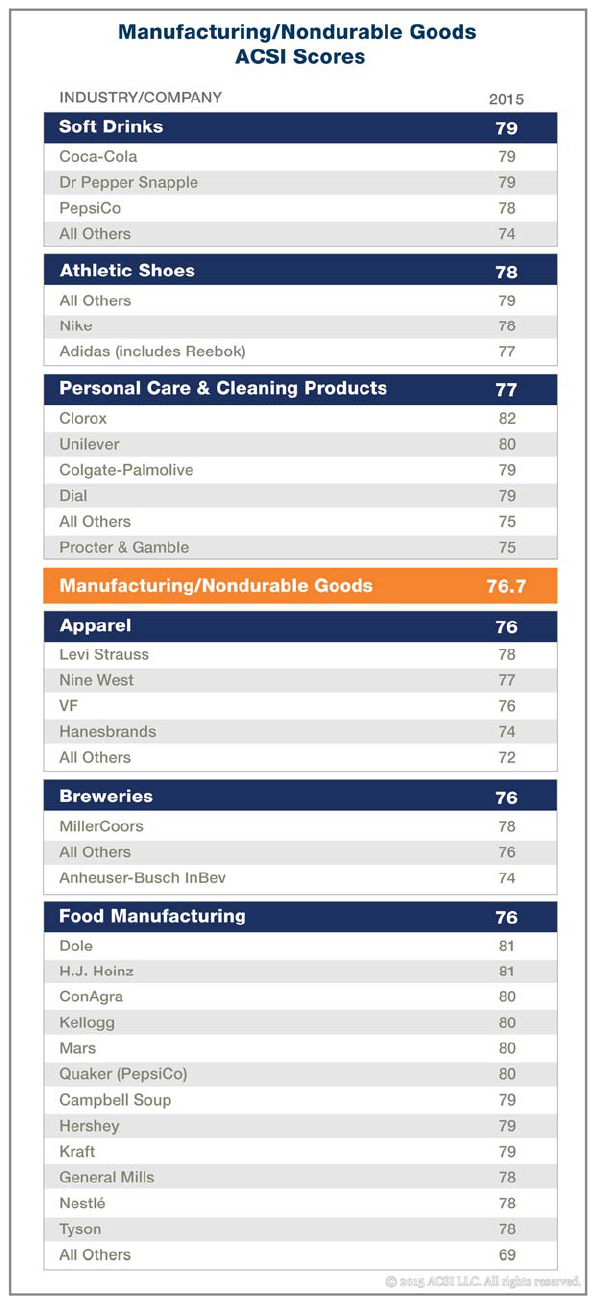
Food Manufacturing – At the top of food manufacturing, Dole ties longtime ACSI leader H.J.
Heinz with a score of 81. Most of the industry is tightly grouped between 78 and 81. ConAgra,
Kellogg, Mars and PepsiCo’s Quaker brand are deadlocked at 80. Campbell Soup, Hershey and
Kraft register 79, followed by General Mills, Nestlé and Tyson at 78. As a whole, food
manufacturing drops 3.8 percent to 76, largely as a result of a 10-percent plunge in the combined
score of smaller food companies that make up the “all others” category at 69.
Beverages – The soft drink industry is under pressure from the changing palette of consumer
tastes. As the bottled water market continues to surge and sweetened beverages fall out of favor,
soft drink manufacturers are adjusting their portfolios. Soft drink companies fall 3.7 percent to
79, the lowest score ever. Coca-Cola and Dr Pepper Snapple share the lead at 79, followed by
PepsiCo at 78. The group of smaller soft drink makers trails with a score of 74.
Brewers also are undergoing a major transformation as company consolidation continues. The
beer industry comes in at an ACSI score of 76 after a 3.8-percent drop. MillerCoors leads with a
score of 78, followed by the group of smaller breweries and microbrews at 76. Anheuser-Busch
InBev rounds out the category at 74.
Personal Care and Cleaning Products – Customer satisfaction with everyday household items
like soap, shampoo, detergents and other cleaning products declines 6.1 percent to an ACSI score
of 77. Clorox (82) remains the top-scoring company for a fifth straight year. Unilever repeats at
80 and is one of only three companies in the sector to maintain its score. Not a single
nondurables company improves its customer satisfaction this year. Colgate-Palmolive and Dial
tie at 79, while Procter & Gamble shares last place with the smaller companies group (both 75).

Apparel and Athletic Shoes – Aside from Unilever, Nike and Adidas are the only nondurable
manufacturers to hold customer satisfaction steady this year. Nike scores 78, while Adidas
remains stable at 77. But the two largest athletic shoe companies are slightly behind the “all
others” category (79), which includes Under Armour and Skechers. A decline for the smaller
manufacturers pulls down the industry’s customer satisfaction by 2.5 percent to 78.
The apparel industry registers an ACSI score of 76, following a slip of 2.6 percent. Levi Strauss
regains its perch at the top of the category with a score of 78. Nine West Holdings, which
includes Jones New York brands, is next at 77. VF, which owns a range of brands such as
Wrangler, JanSport and The North Face, comes in at the industry average (76), while
Hanesbrands scores 74. The category of all smaller companies brings up the tail at 72, the lowest
customer satisfaction level in apparel.
The third quarter national ACSI score is based on 14,042 customer surveys. The
manufacturing/nondurable goods scores are based on 4,986 customer surveys collected in the
third quarter of 2015.
Follow the ACSI on Twitter at @theACSI and Like us on Facebook.

No advertising or other promotional use can be made of the data and information in this release
without the express prior written consent of ACSI LLC.
About ACSI
The American Customer Satisfaction Index (ACSI) is a national economic indicator of customer
evaluations of the quality of products and services available to household consumers in the
United States. The ACSI uses data from interviews with roughly 70,000 customers annually as
inputs to an econometric model for analyzing customer satisfaction with more than 300
companies in 43 industries and 10 economic sectors, including various services of federal and
local government agencies.
ACSI results are released throughout the year, with all measures reported on a scale of 0 to 100.
ACSI data have proven to be strongly related to a number of essential indicators of micro and
macroeconomic performance. For example, firms with higher levels of customer satisfaction
tend to have higher earnings and stock returns relative to competitors. Stock portfolios based on
companies that show strong performance in ACSI deliver excess returns in up markets as well as
down markets. At the macro level, customer satisfaction has been shown to be predictive of both
consumer spending and GDP growth.
ACSI and its logo are Registered Marks of the University of Michigan, licensed worldwide
exclusively to American Customer Satisfaction Index LLC with the right to sublicense.
###
