

32 UK Customer Satisfaction Index | January 2023UK Customer Satisfaction Index | January 2023
I’m often asked by organisations what they need
to do to improve customer satisfaction - what are
the key things the high performing organisations
do that others don’t ? Our research, and
engagement with organisations and leaders
shows that that customer service and business
performance outcomes are impacted by a range
of long-term drivers, not just service initiatives
- leadership and organisational culture are key,
rather than one off activities or short term
investments. That’s why in this report we’ve set
out some of the essential elements and enablers
of a service culture and recommendations about
how to develop them.
I hope that this UKCSI – and full range of
products, services and research The Institute
provides - will help you interpret a complex and
evolving environment, support you in achieving
sustainable customer service and business results
as well as galvanise you into action!
Average levels of financial well-being do not
appear to have changed significantly compared
to 2021: perhaps we are yet to see the full
impact of inflation and economic pressures on
personal finances. But there is evidence of a
distinct polarisation in levels of financial well-
being. In our research, around 45% of customers
described their financial well-being as “good” or
“very good” and 15% felt it was “poor” or very
poor.” Around a quarter of customers believe
their debt will rise in the next six months: many
of these customers are concerned about the
consequences for their purchasing capacity and
financial well-being.
Despite a widespread priority to economise on
spending, more than a third of customers would
be willing to pay more to guarantee excellent
service and this continues to rise.
This UKCSI reports that 16.5% of customers
experienced a problem with an organization,
around the same level as a year ago but 2.9
percentage points more than in January 2020,
the last UKCSI published before the Covid-19
pandemic. We should all be concerned about
this level of problems: it damages customer
satisfaction, impedes organisations’ performance
and profitability and has significant implications
for the productivity of the UK economy.
The key differences between the highest
performing organisations and the rest span all
dimensions of customer satisfaction, not just
complaint handling and pricing, but crucially
from a customer’s view the level of emotional
connection and the level of trust they might have.
Companies with higher levels of satisfaction: make
their customers feel reassured, design experiences
around customers and keep promises.
All aspects of customer experience – efficiency
in transactional experiences, problem-solving,
innovation, ethical standards, and impact, and
genuinely focusing on customers’ personal needs
– are interlinked and require focus. The leading
organisations know this and will continue to
invest as a business imperative.
As we emerge from the Covid-19 pandemic
and face into challenges of rising costs and
skills shortages, this feels like a critical inflection
point. Organisations need to determine what
their customer experience will look like, which
customers they serve, how customer needs and
behaviours are evolving and how to respond.
Collectively, the decisions that organisations
make will determine whether we create a
stronger service nation - with the economic
benefits that come from that - or continue to
be fixated on immediate crises and problems.
Crucially, organisations need to focus more
on developing the capabilities for sustainable,
long-term performance, even as they
address immediate challenges of operational
performance and resourcing.
The January 2023 UK Customer Satisfaction
Index shows a slight decline in average customer
satisfaction of 0.7 points to 77.7 (out of 100). But
I am concerned this overall average score masks
deeper issues that could threaten organisations’
performance, long term profitability and the quality
of customer experience, in 2023 and beyond.
Looking at the latest results, we see that more
companies have declined than improved. In 2021
and 2022, customer satisfaction with complaint
handling showed a steady improvement but this
has now stalled and other areas of customer
satisfaction that are predictive of business
performance, such as measures of a company’s
emotional connection with its customers, their
customer ethos and ethics, have also declined.
We are seeing a greater polarisation in customer
satisfaction performance, with some companies
pulling away from the pack and others alas falling
considerably behind. Overall, this is not good for
the UK’s standing and we need to address this
decline to ensure we can really transform our
trading position as a country as well as lift the
spirits of customers and employees alike.
We know customer attitudes and behaviours
have changed in the last six months and will
continue to evolve: not only are people thinking
more carefully about spending due to the cost-of-
living crisis, by reducing their level of spending,
shopping around more to find the best deals
and making fewer impulse or large purchases;
there are longer term changes in behaviour
that embody trends towards more mindful
consumption and environmental sustainability.
Foreword
Joanna Causon Chief Executive

5UK Customer Satisfaction Index | January 20234 UK Customer Satisfaction Index | January 2023
Executive summary
Part 1 The state of customer satisfaction in the UK
Part 2 Customer satisfaction and business performance
Part 3 How the rising cost of living is impacting customer needs
and behaviours
Part 4 Recommendations: building a culture of service excellence
UKCSI Key facts
Organisations in the UKCSI
About the UKCSI
UKCSI sector reports
Breakthrough research from The Institute
About The Institute
Contents
6
24
46
60
78
96
97
98
99
100
102

7UK Customer Satisfaction Index | January 2023
Executive
Summary
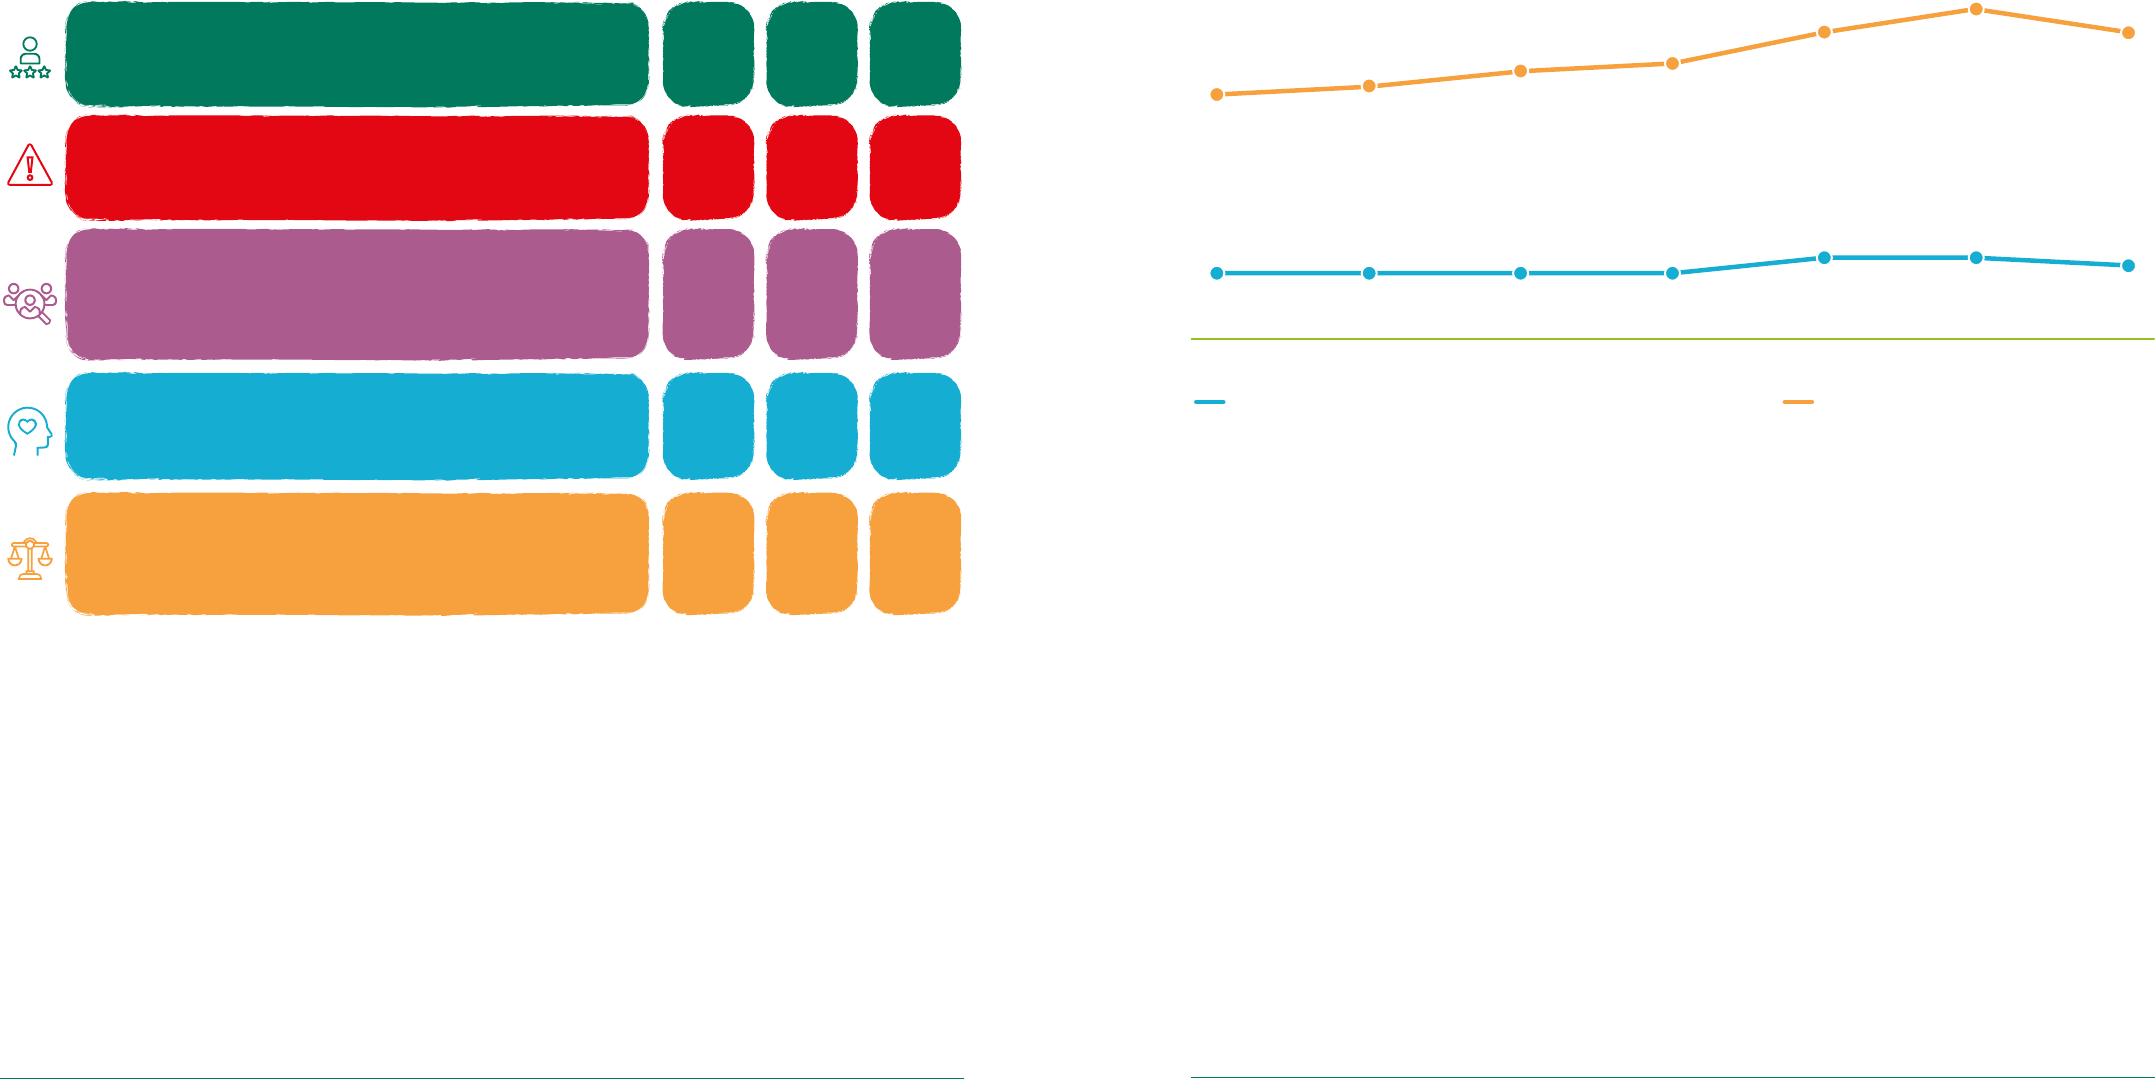
The January 2023 UK Customer Satisfaction Index
(UKCSI) is 77.7 (out of 100), a decline of 0.7 points
compared to both the July 2022 and January 2022 surveys
The UKCSI is a national benchmark of customer satisfaction covering 281 organisations or organisation
types across 13 sectors. The UKCSI score is based on how customers rate organisations across 26
measures covering satisfaction with transactional experiences as well as broader relationship needs.
Much of the improvement in overall customer satisfaction through 2021 and 2022 was fuelled by
stronger satisfaction with complaint handling. However, the improvement in complaint handling appears
to have stalled and satisfaction has declined slightly across all dimensions of customer satisfaction. This
suggests that further sustained growth in customer satisfaction will require increased focus and action in
all dimensions of customer satisfaction.
Jul-21 Jan-22 Jan-23Jul-22Jan-21Jul-20Jan-20Jul-19Jan-19Jul-18Jan-18Jul-17Jan-17Jul-16Jan-16Jul-15Jan-15Jul-14Jan-14Jul-13Jan-13Jul-12Jan-12Jul-11Jan-11Jul-10Jan-10Jul-09Jan-09
77.4
78.4 78.4
76.9 77.0
76.8
77.1
77.7
77.9
78.1
78.2
77.8
77.4
77.0
76.2
76.0
76.3
77.1
77.9
78.2
78.0
77.4
77.3
76.7
75.6
75.2
74.1
72.0
77.7
98 UK Customer Satisfaction Index | January 2023UK Customer Satisfaction Index | January 2023
Experience
Measures the quality of customers’ experiences and
interactions with organisations
Dimension (score out of 100)
Jan
2023
Ethics
Reputation, openness and transparency and the extent
to which an organisation is deemed to “do the right thing”
Customer Ethos
Extent to which customers perceive that organisations
genuinely care about customers and build the experience
around their customers’ needs
Complaint Handling
How organisations respond and deal with problems and
complaints
Emotional Connection
The extent to which an organisation engenders feelings
of trust and reassurance
78.7
75.8
77.0
63.3
76.8
Jan
2022
79.3
76.8
77.8
65.8
77.8
Year-on-
year
change
-0.6
-1.0
-0.8
-2.5
-1.0
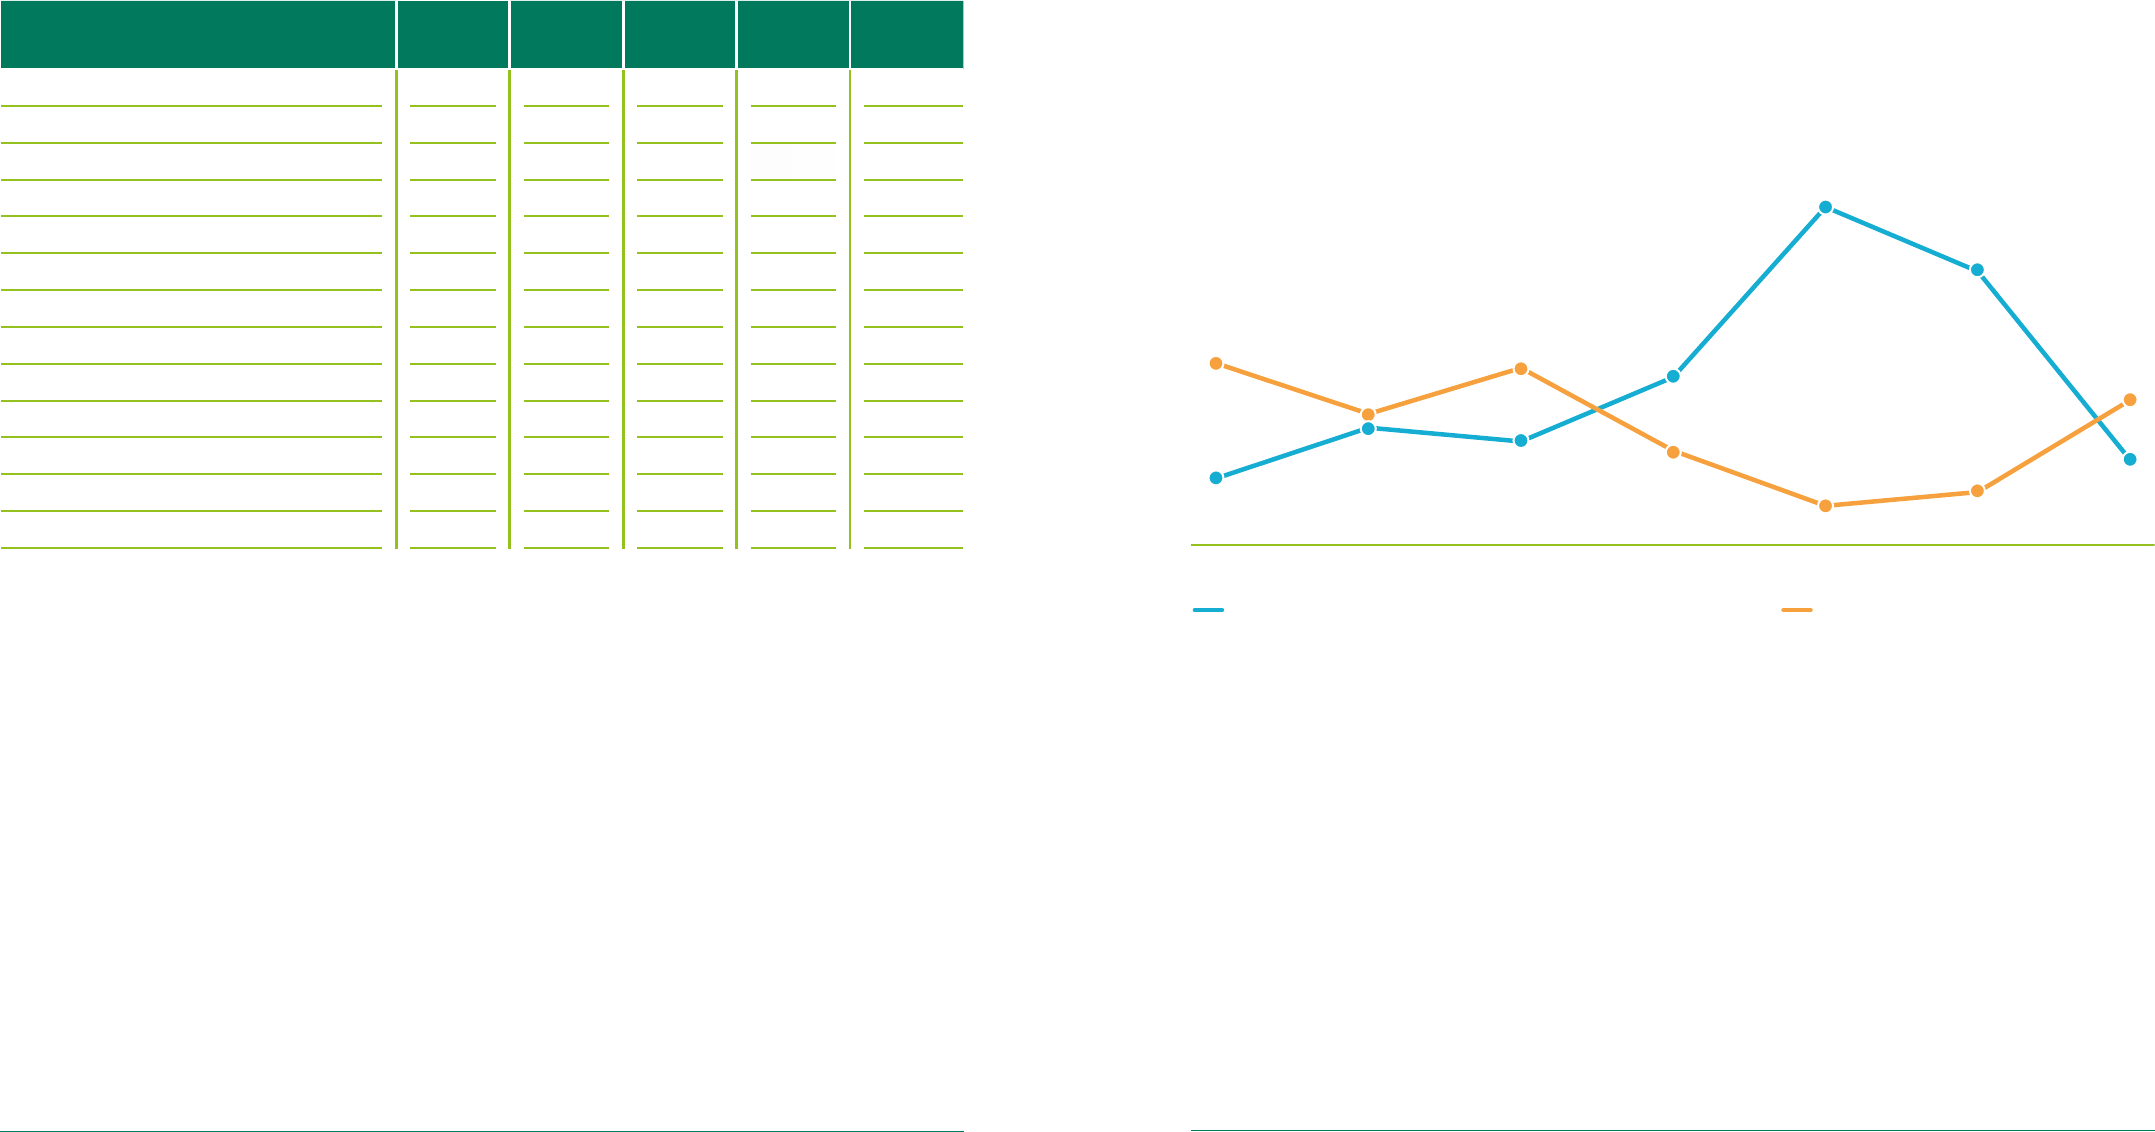
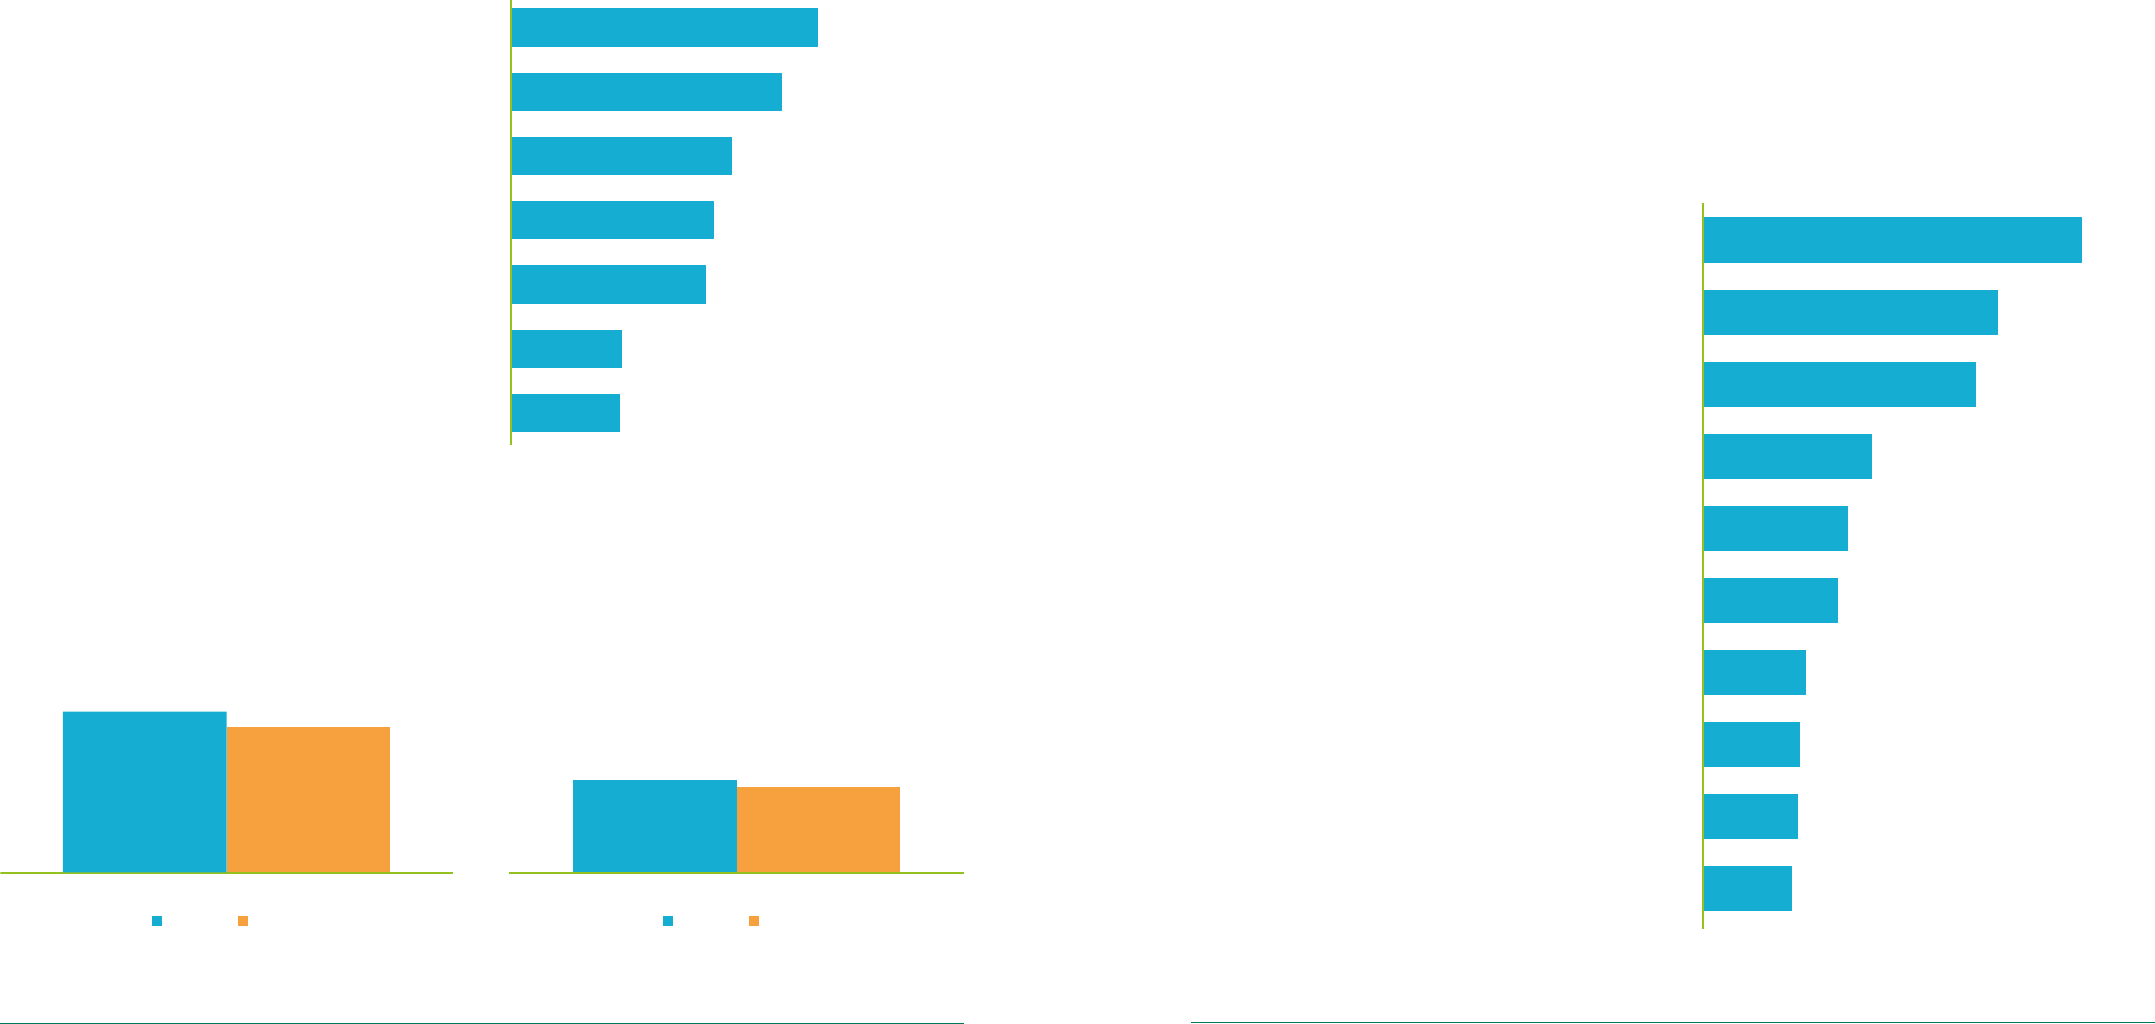
16.5% of customers experienced a problem with an
organisation, around the same level as January 2022
but 2.9 percentage points more than January 2020
% customers experiencing a problem with an organisation and satisfaction with complaint handling
5.8 5.8
5.7
6.0
6.5 6.6
6.3
13.6
14.1
14.6
14.9
16.4
17.3
16.5
Jan-20 Jul-20 Jan-21 Jul-21 Jan-22 Jul-22
Jan-23
Average satisfaction with
handling of the complaint (1 - 10)
% of customers who recently experienced
a problem with an organisation
The leading causes of problems experienced by customers are quality or reliability, suitability and
availability of goods and services. The extent of problems has significant implications not just for
customer satisfaction, but for organisations’ productivity, costs and profitability.
1110 UK Customer Satisfaction Index | January 2023UK Customer Satisfaction Index | January 2023
5 of the 13 sectors measured in the UKCSI – Public
Services (Local and National), Services, Transport and
Utilities - have dropped by at least 1 point compared to
January 2022
Jan-23 Jul-22 Jan-22 Change from
Jan-22 to
Jan-23
Change from
Jul-22 to
Jan-23
Retail (Non-food)
81.7 81.9 81.5 0.2 -0.2
Tourism
80.9 80.7 80.4 0.5 0.2
Leisure
80.8 81.8 81.7 -0.9 -1.0
Retail (Food)
80.5 81.7 81.0 -0.5 -1.2
Banks & Building Societies
80.3 80.3 80.2 0.1 0.0
Automotive
80.1 81.0 80.7 -0.6 -0.9
Insurance
80.0 80.8 80.5 -0.5 -0.8
Services
76.3 76.7 77.4 -1.1 -0.4
Telecommunications & Media
75.8 76.6 76.3 -0.5 -0.8
Public Services (National)
75.1 75.3 76.9 -1.8 -0.2
Transport
74.1 75.8 75.1 -1.0 -1.7
Public Services (Local)
72.2 72.3 73.4 -1.2 -0.1
Utilities
71.7 74.1 74.5 -2.8 -2.4
In the other 8 sectors, customer satisfaction has have moved, up or down, by less than 1 point.
Average customer satisfaction in the Utilities sector is 71.7 (out of 100), a drop of 2.8 points compared
to January 2022 and its lowest score since January 2015.
Within the Utilities sector, average satisfaction with Energy companies is 70.3, a decline of 3.8 points
compared to a year ago. They biggest fall in customer satisfaction was for pricing, down 0.9 points
compared to January 2022, to 6.0 (out of 10). Average levels of trust and an organisation making you
feel reassured decreased by 0.5 points (out of 10).
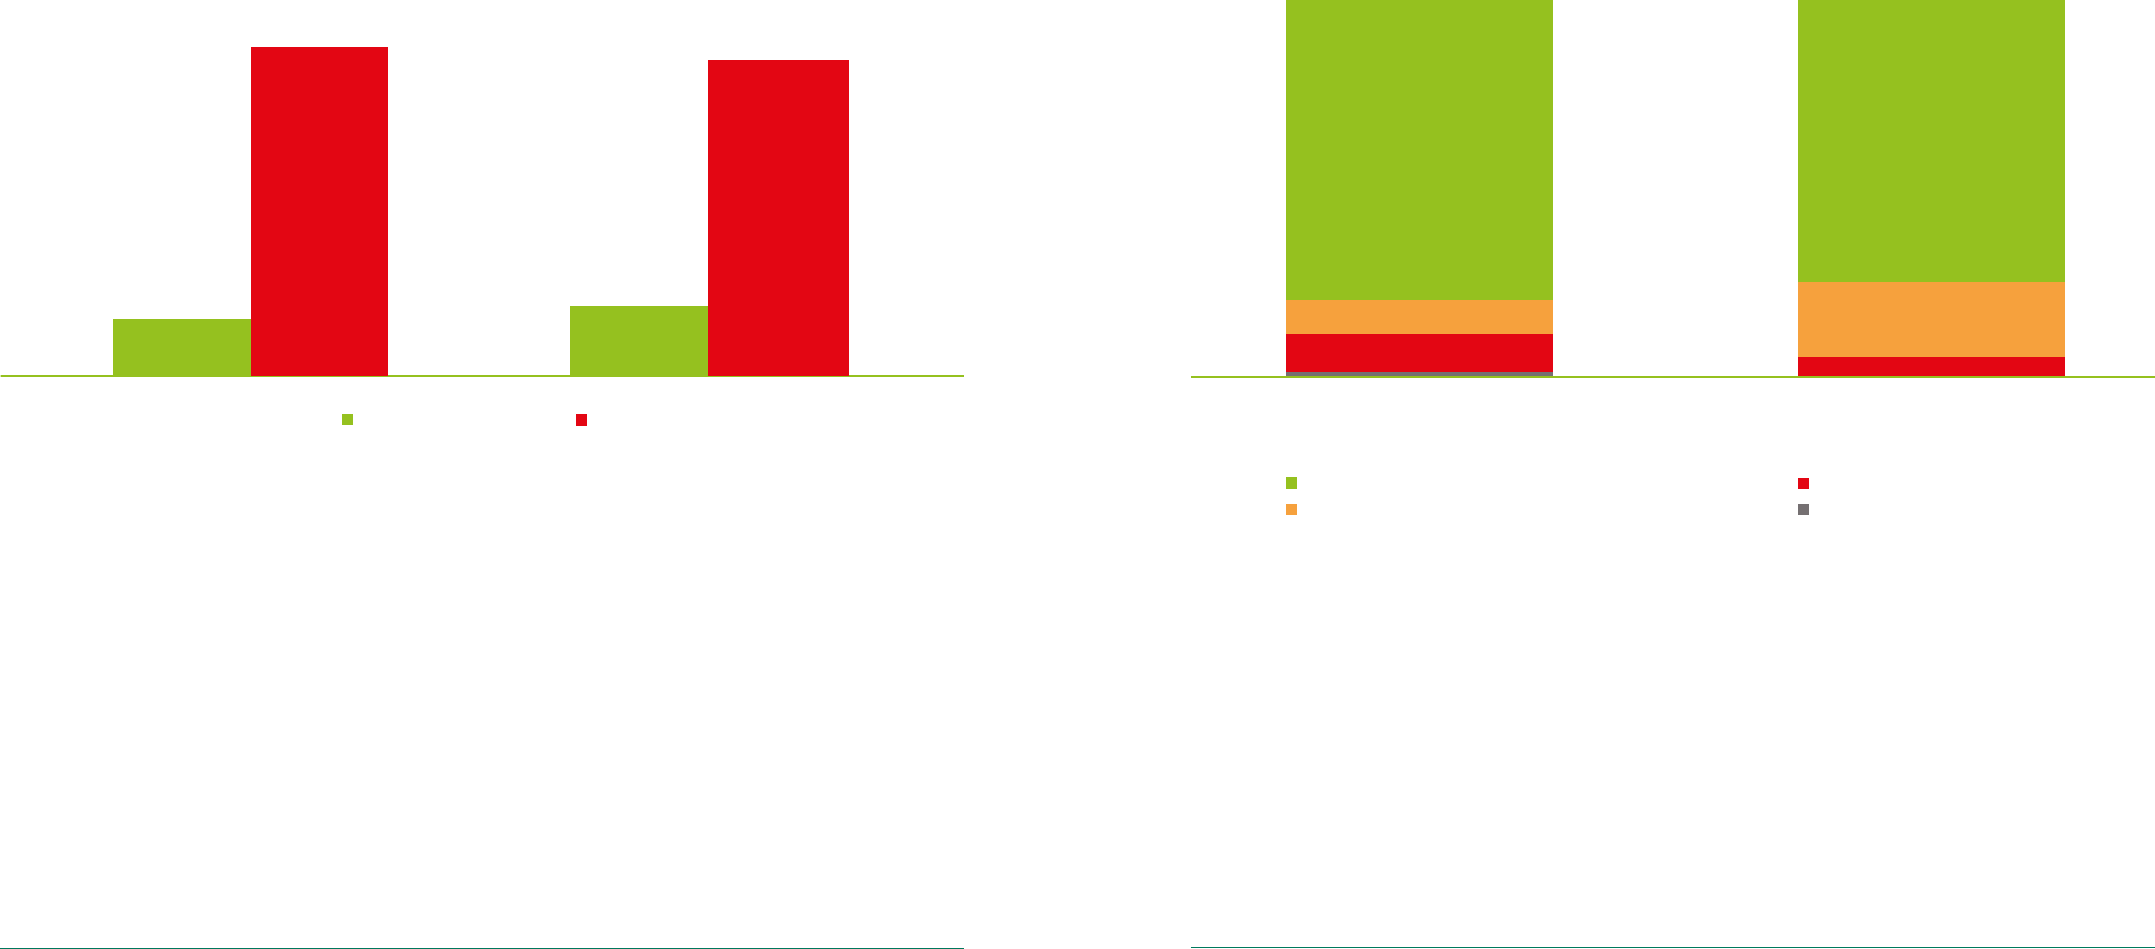
Almost half of the organisations that have declined
by at least 2 points compared to a year ago are in the
Transport and Utilities sectors
In the January 2023 UKCSI, 37 organisations (13% of the total receiving a UKCSI score) have improved
by at least 2 points compared to a year ago, the lowest number since January 2020. 63 organisations
(22% of those receiving a UKCSI score) have fallen by 2 points or more.
10%
18% 16%
26%
52%
42%
13%
28%
20%
27%
14%
6%
8%
22%
Jan-20 Jul-20 Jan-21Jul-21 Jan-22 Jul-22 Jan-2
3
% of organisations whose UKCSI has
improved yoy by at least 2 points
% organisations whose UKCSI score has
declined yoy by at least 2 points
% of organisations that have improved or fallen by at least 2 points compared to the previous year
q Fall in UKCSI score by less than one point q Fall in UKCSI score by more than 1 point

1312 UK Customer Satisfaction Index | January 2023UK Customer Satisfaction Index | January 2023
Key differences between the top 50 organisations and
the rest include measures of complaint handling, price
and cost, emotional connection and customer ethos
Measure (on a scale of 1 - 10 except where indicated) Top 50 organisations Other organisations Gap
UKCSI 83.3 77.0 6.3
Speed of resolving your complaint 7.4 6.2 1.2
The handling of the complaint 7.5 6.3 1.2
The attitude of staff (complaints) 7.6 6.6 1.0
Price / cost 8.2 7.4 0.8
XX designs the experience around its customers 8.2 7.5 0.7
XX makes you feel reassured 8.3 7.6 0.7
XX cares about their customers 8.2 7.5 0.7
You trust XX 8.3 7.6 0.7
XX keeps their promises 8.3 7.6 0.7
% customers experiencing a problem 12.0% 16.5% 4.5% points
% experiences right first time 86.5% 79.8% 6.7% points
Key differentiators of the top 50 organisations in the UKCSI (scores out of 10 unless stated)
10 highest rated organisations
Jan-23
Rank
Organisation Sector Jan-23
Score
Jan-22
Score
Jan-22
Rank
Change
in score
Jan-22 to
Jan-23
1
rst direct
Banks & Building Societies 86.2 85.7 2 0.5
2
John Lewis
Retail (Non-food) 85.6 84.7 7 0.9
3
UK Power Networks
Utilities 85.4 85.4 4 0.0
4=
Tesco Mobile
Telecommunications & Media 85.2 83.7 22 1.5
4=
M & S (food)
Retail (Food) 85.2 84.2 11 1.0
6
Starling Bank
Banks & Building Societies 85.1
NO DATA NO DATA NO DATA
7
Next
Retail (Non-food) 85.0 81.4 63 3.6
8=
Suzuki
Automotive 84.6 84.0 17 0.6
8=
M & S
Retail (Non-food) 84.6 84.0 17 0.6
10
Amazon.co.uk
Retail (Non-food) 84.4 83.8 21 0.6
p Increase in UKCSI score of at least one point
In the Retail (Food) sector, an environment of rising
costs and changing customer behaviours has shaped
the relationship between customer satisfaction and
business performance
Kantar’s research* reported that take-home
grocery sales grew by 5.9% year on year in the
12 weeks preceding 27 November 2022, driven
by an increase in store visits compared to the
previous year as well as the rise in inflation.
Sales of own label products grew by 11.7% year
on year but sales of premium products also rose,
by 6.1%. These contrasting trends in buying
behaviour are reflected in the UKCSI. 16.7% of
customers expressed a preference for lowest
cost, no frills service, up by 1.3 percentage
points compared to a year ago. But 31.9% of
Retail (Food) customers indicated that they
prefer excellent service, even if it means paying
more, up by 2.7 percentage points compared to
January 2022**.
Aldi’s sales increased by 24% but in September
2022 the company reported a drop in profits
because of increased supplier, staff and Covid-
related costs. These issues may also have
affected Aldi’s customer satisfaction. Over
the past 3 years, Aldi’s UKCSI average score is
82.8, more than 2 points higher than the sector
average. However, in the January 2023 UKCSI,
Aldi received a score of 81.0, down by 2.7 points
compared to a year ago.
Lidl’s sales rose by 22%, giving it a market share
of 7.4%. Over the past 3 years, the average
level of customer satisfaction with Lidl has been
slightly lower than the sector average, by 0.9
points. But compared to January 2020, Lidl is
one of the sector’s most improved organisations
for customer satisfaction and in the January
2023 UKCSI Lidl’s customer satisfaction rating
of 81.0 (out of 100) is for the first time slightly
higher than the Retail (Food) average, 80.5.
Morrisons sales fell year on year by 4.7% and its
UKCSI score of 76.2 is the lowest of
any food retailer in the January 2023. Morrisons
may have been particularly exposed to
inflationary pressures because it has its own
manufacturing operations and around half of its
food is produced in-house.
*
Source: Kantar World Panel
**
Customers were asked to score the balance of price and service they would prefer to accept. A score of 8 -10 implies a preference for excellent service, even if it
costs more. A score of 1 – 3 is interpreted as a preference for low-cost, no-frills service.
1514 UK Customer Satisfaction Index | January 2023UK Customer Satisfaction Index | January 2023
In the banking sector, there appears to be a long-term
relationship between customer satisfaction and net
current account gains
The performance of the 12 organisations that have appeared in both the UKCSI and the Current Account
Switch Service Dashboard* between 2014 and 2022 shows that organisations averaging a UKCSI score
at least 1 point above the sector recorded an average of 240,279 net current account gains, compared
to 173,838 net losses for organisations average a UKCSI score that is 1 point or more below the sector
average.
* Current Account Switch Service Dashboard 2014 - 2022
Banks & Building Societies
with UKCSI within 1 point
( +/- ) of sector average
Banks & Building Societies with
a UKCSI at least 1 point above
sector average
240,279 -152,136
Banks & Building Societies
with a UKCSI at least 1 point
below sector average
-173,838
Net current account gains Net current account losses Net current account losses
Net current account gains and losses 2014 - 2022
In this UKCSI we examine the impact of the rising cost of living on customer behaviours and needs and
the implications for organisations.
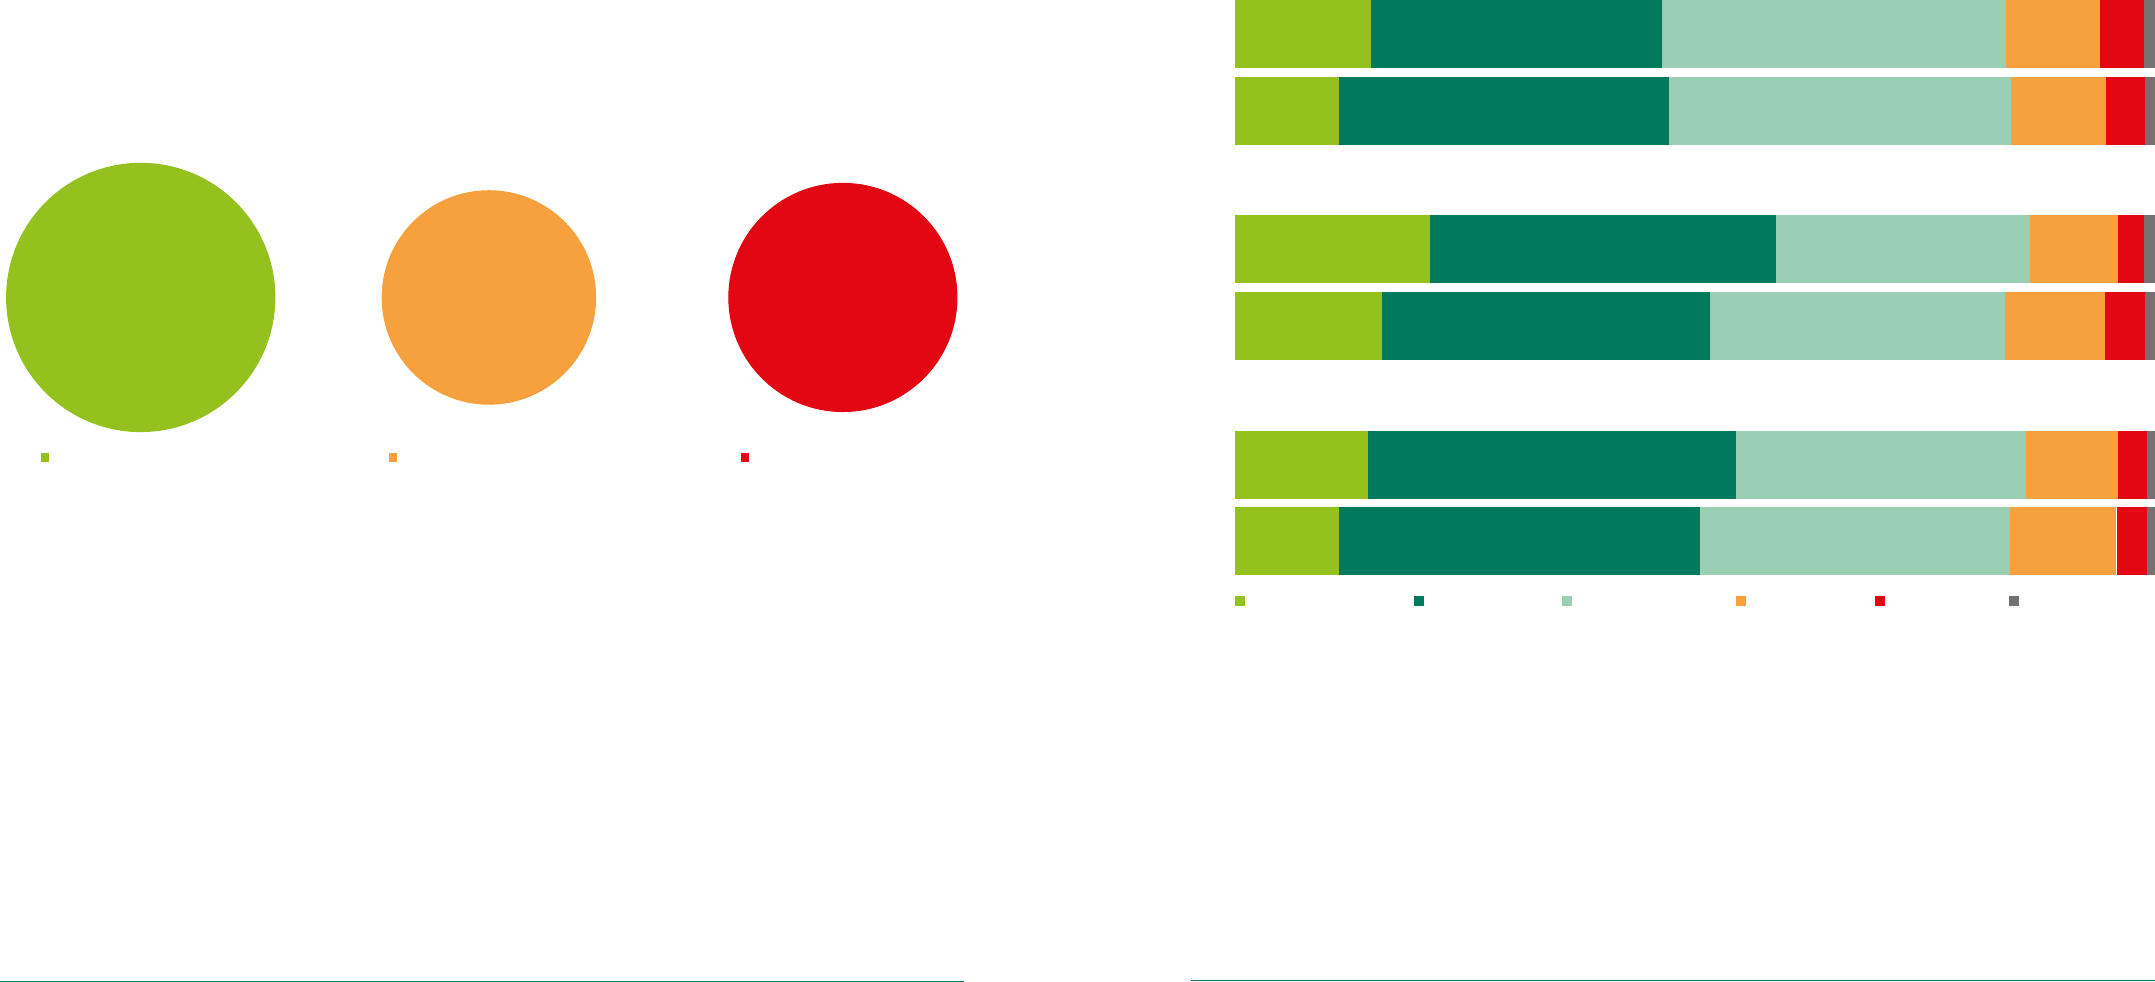
15% of customers described their nancial well-being
as poor or very poor, a similar number to January 2021,
when it was 14.5%
But the average state of mental well-being appears to have improved: 59% of people describe their
mental well-being as good or very good, compared to 52% in the January 2021 UKCSI.
How would you describe your current level of well-being?
Very good Good Average Poor Very poor Prefer not to say
Your nancial well-being
14.6% 31.8% 37.5% 10.2% 4.8%
202
3
Jan
202
1
Jan
11.3% 35.9% 37.3% 10.3% 4.2%
Your physical well-being
14.4% 40.1% 31.5% 10.0% 3.2%
Jan
202
3
Jan
202
1
11.3% 39.3% 33.7% 11.7% 3.2%
Your mental well-being
20.9% 38.0% 27.5% 9.5% 3.1%
Jan
202
3
Jan
202
1
16.0% 35.7% 32.1% 10.9% 4.3%
1716 UK Customer Satisfaction Index | January 2023UK Customer Satisfaction Index | January 2023
Many customers' spending
behaviour has become
more mindful and
cautious
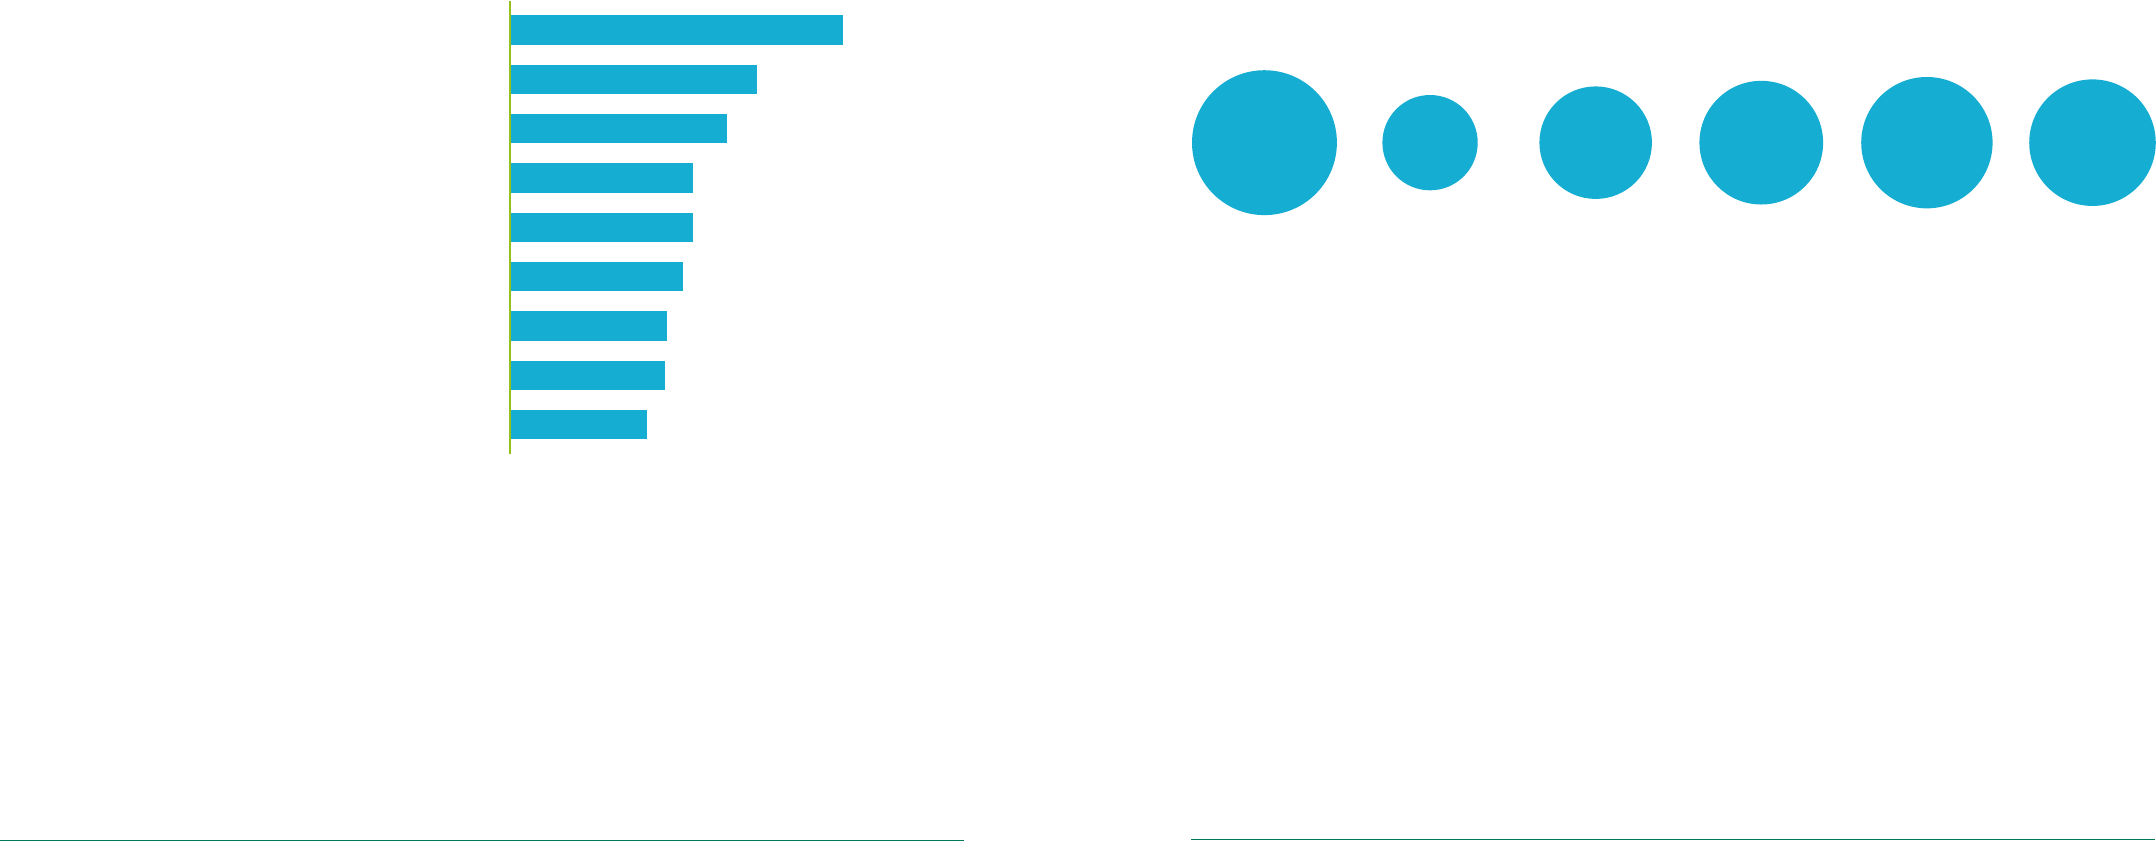
How have your spending habits changed in the last 6 months?
Alongside the January 2023 UKCSI, The Institute
conducted an additional survey of 1,001 customers
to assess further attitudes and behaviours
concerned with spending and personal debt.
35% of people have sold items to generate income.
This behaviour perhaps reflects growing concern
for recycling and sustainability as well as financial
pressures caused by the rising cost of living.
27% have cancelled a subscription service and
25% have used a third party company for “buy
now, pay later” services.
29% of customers have increased their access
to credit either by requesting an overdraft, or
applying for a credit card, or increasing their
credit limit.
24.5%
20.0%
18.3%
17.6%
10.0%
9.8%
7.2%
27.8%
I've thought more carefully about
what I spend money on
I've tried to reduce what I'm spending
- because I have less to spend
I've shopped around more to make
sure I'm getting the best deals
I've tried to reduce what I'm spending
- so that I can save more
I've made fewer impulse purchases
I've bought more online
I've avoided making big expensive purchases
(car, home improvements)
I've chosen to spend money with companies I trust
6.2%
I've chosen to spend money with
local, independent companies
3.8%I've chosen to spend more with ethical companies
8%
9%
9%
9%
12%
13%
16%
25%
27%
35%
Chose to use an organisation because they offer more
exible payment options (e.g. pay in instalments)
Spoken to an organisation about agreeing new
terms of more exibility with payments
Used credit to pay for household bills
Applied for an additional credit card
Requested or increased my overdraft
Directly asked an organisation for a discount
on the product or service I was buying
Increased the credit limit on my credit card
Used a third-party company for 'buy now pay later' services
Cancelled a subscription service
Sold items to generate income
Changes in customer behaviour in response to the rising cost of living:
have you done any of the following in the last 6 months?
The latest research in the UKCSI suggests that the main ways in which customer behaviours have responded
to the rise in the cost of living are to think more carefully about spending, reduce their level of spending,
shop around more to find the best deals and make fewer impulse purchases.
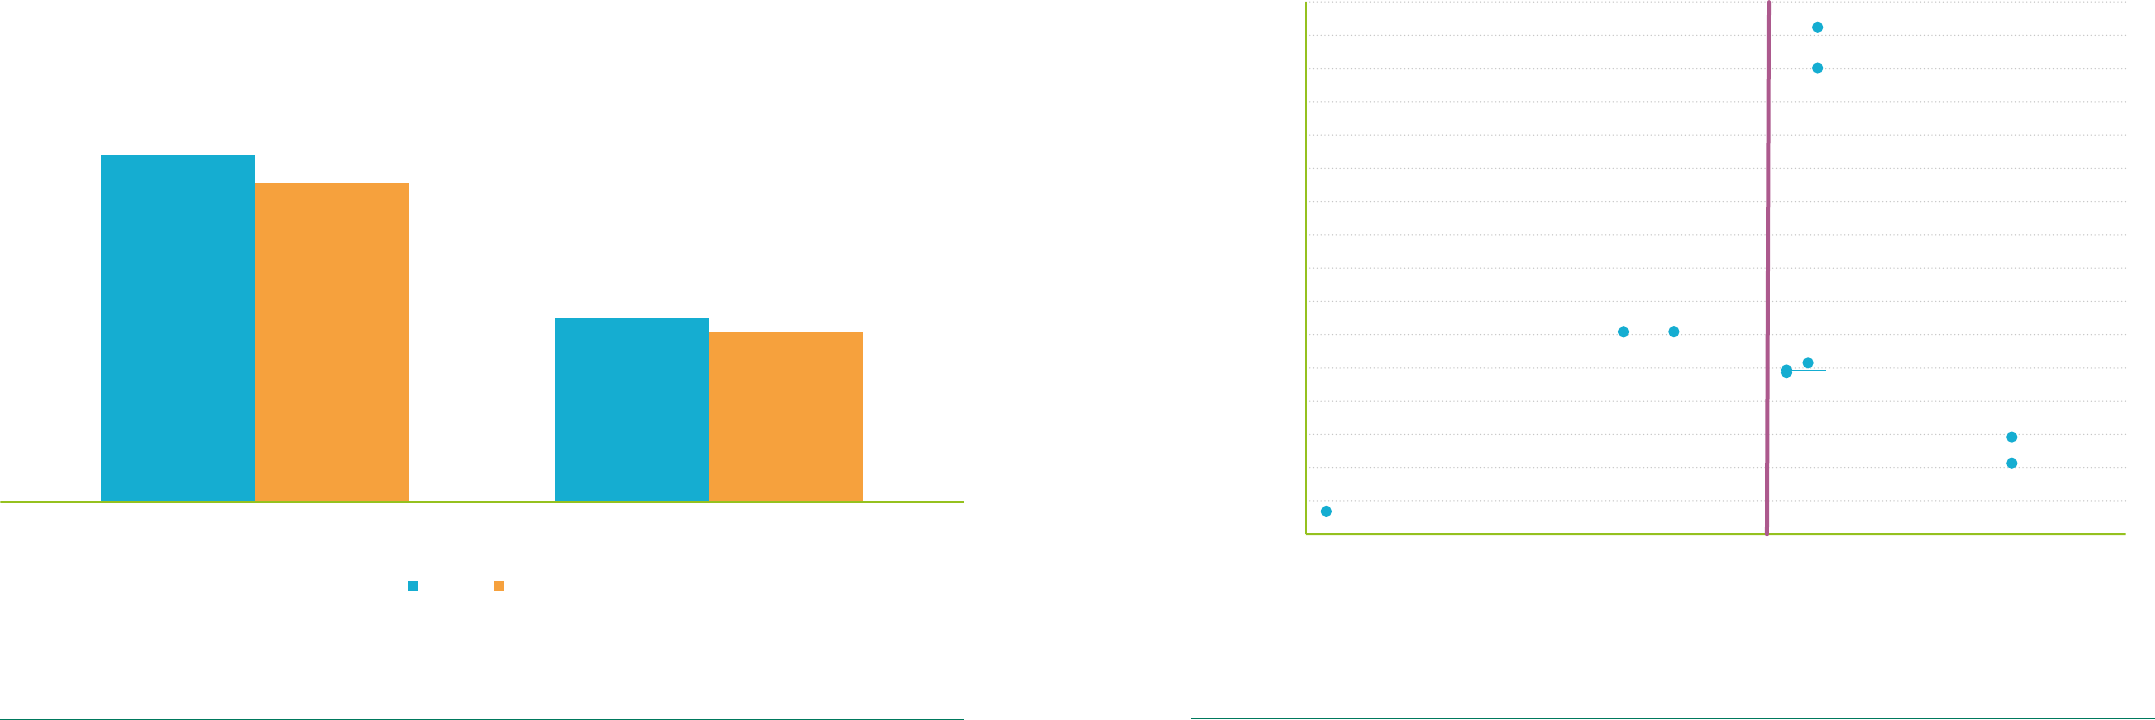
34.7%
34.0%
UK all-sector average
12.4%
11.4%
UK all-sector average
Jan-23 Jan-22Jan-23 Jan-22
% of customers who prefer excellent
service, even if it costs more
% customers who prefer lowest cost,
no-frills service
*
Customers were asked, to score the balance of price and service they would prefer to accept. A score of 8 -10 implies a preference for excellent service, even if it
costs more. A score of 1 – 3 is interpreted as a preference for low-cost, no-frills service.
Despite the growing priority to economise, 34.7% of customers would be prepared to pay more to
guarantee excellent service*.

1918 UK Customer Satisfaction Index | January 2023UK Customer Satisfaction Index | January 2023
28% of customers expect to use a credit card to pay for
household bills such as utilities and food in the next 6
months
Gives me more exibility
to manage my money
I get rewards such as cash back or
points for using my credit card
I use credit cards when
I run out of money
I prefer to use my credit card
when transacting online
(fraud or security concerns)
As a % of all
customers surveyed
58%
49%
37%
33%
17%
14%
11%
9%
The main reasons for using a credit card in this context are greater flexibility in managing personal
finances and taking advantage of rewards such as cashback or points. But 37% of customers who
expect to use a credit card to pay for utilities and food (11% of all customers surveyed) will do so
because they have run out of money.
26% of customers believe their personal debt will
increase in the next 6 months
Will decrease a little
Will decrease a lot
Will increase a lot
Will increase a little
Will stay the same
Don't know
Not applicable -
I don't have any debt
8% 18% 26% 10% 3% 5% 30%
How do you think your level of debt will change in the next 6 months?
Amongst customers who believe their level of debt
will increase in the next 6 months, 72% are concerned
about the impact on their purchasing capacity and
nancial well-being
11% of these customers fear they will be unable to afford everyday essentials and a further 16% will
need to cut back on non-essential items. In addition, 45% of customers whose level of debt is likely to
rise agree that it “gives me some concern".
Perspectives of customers who believe their level of debt will increase in the next 6 months:
how do you feel about your level of personal debt (e.g. mortgage, overdraft, credit card)?
28% 16% 45% 11%
I can manage comfortably
It means I am not able to afford non-essentials It gives me some concern
It means I am not able to afford everyday essentials
2120 UK Customer Satisfaction Index | January 2023UK Customer Satisfaction Index | January 2023
15% of all customers surveyed have directly asked a
company for help or advice to deal with the rising cost
of living. 18% have been approached by a company
offering help and advice for the same reason
The leading types of assistance given by companies are advice on using products and services more
efficiently, discounts and flexible payment options. Companies tend to be more likely to offer advice about
using products and service more efficiently than they are to offer other kinds of advice related to cost savings.
80% of customers who asked a company for help to
manage the cost of living said that, as a result of their
contact, their trust in that company had increased
Similarly, 75% of people who have been contacted by a company offering help or advice affirmed that
their level of trust in that organisation has risen.
10%
1%
5%
9% 20%
80%
75%
I asked a company for help and advice to
manage the cost of living
A company approached me to give help or
advice to manage the cost of living
I trust them more
Did not change the way I feel about the organisation
I haven't received a response yet
I trust them less
Impact of companies giving customers help or advice to manage the cost of living
Yes No
15%
85%
18%
82%
Have you directly asked a company for help
and/or advice to help you deal with the
rising cost of living?
Has a company proactively approached
you to give help or advice to deal
with the cost of living?
2322 UK Customer Satisfaction Index | January 2023UK Customer Satisfaction Index | January 2023
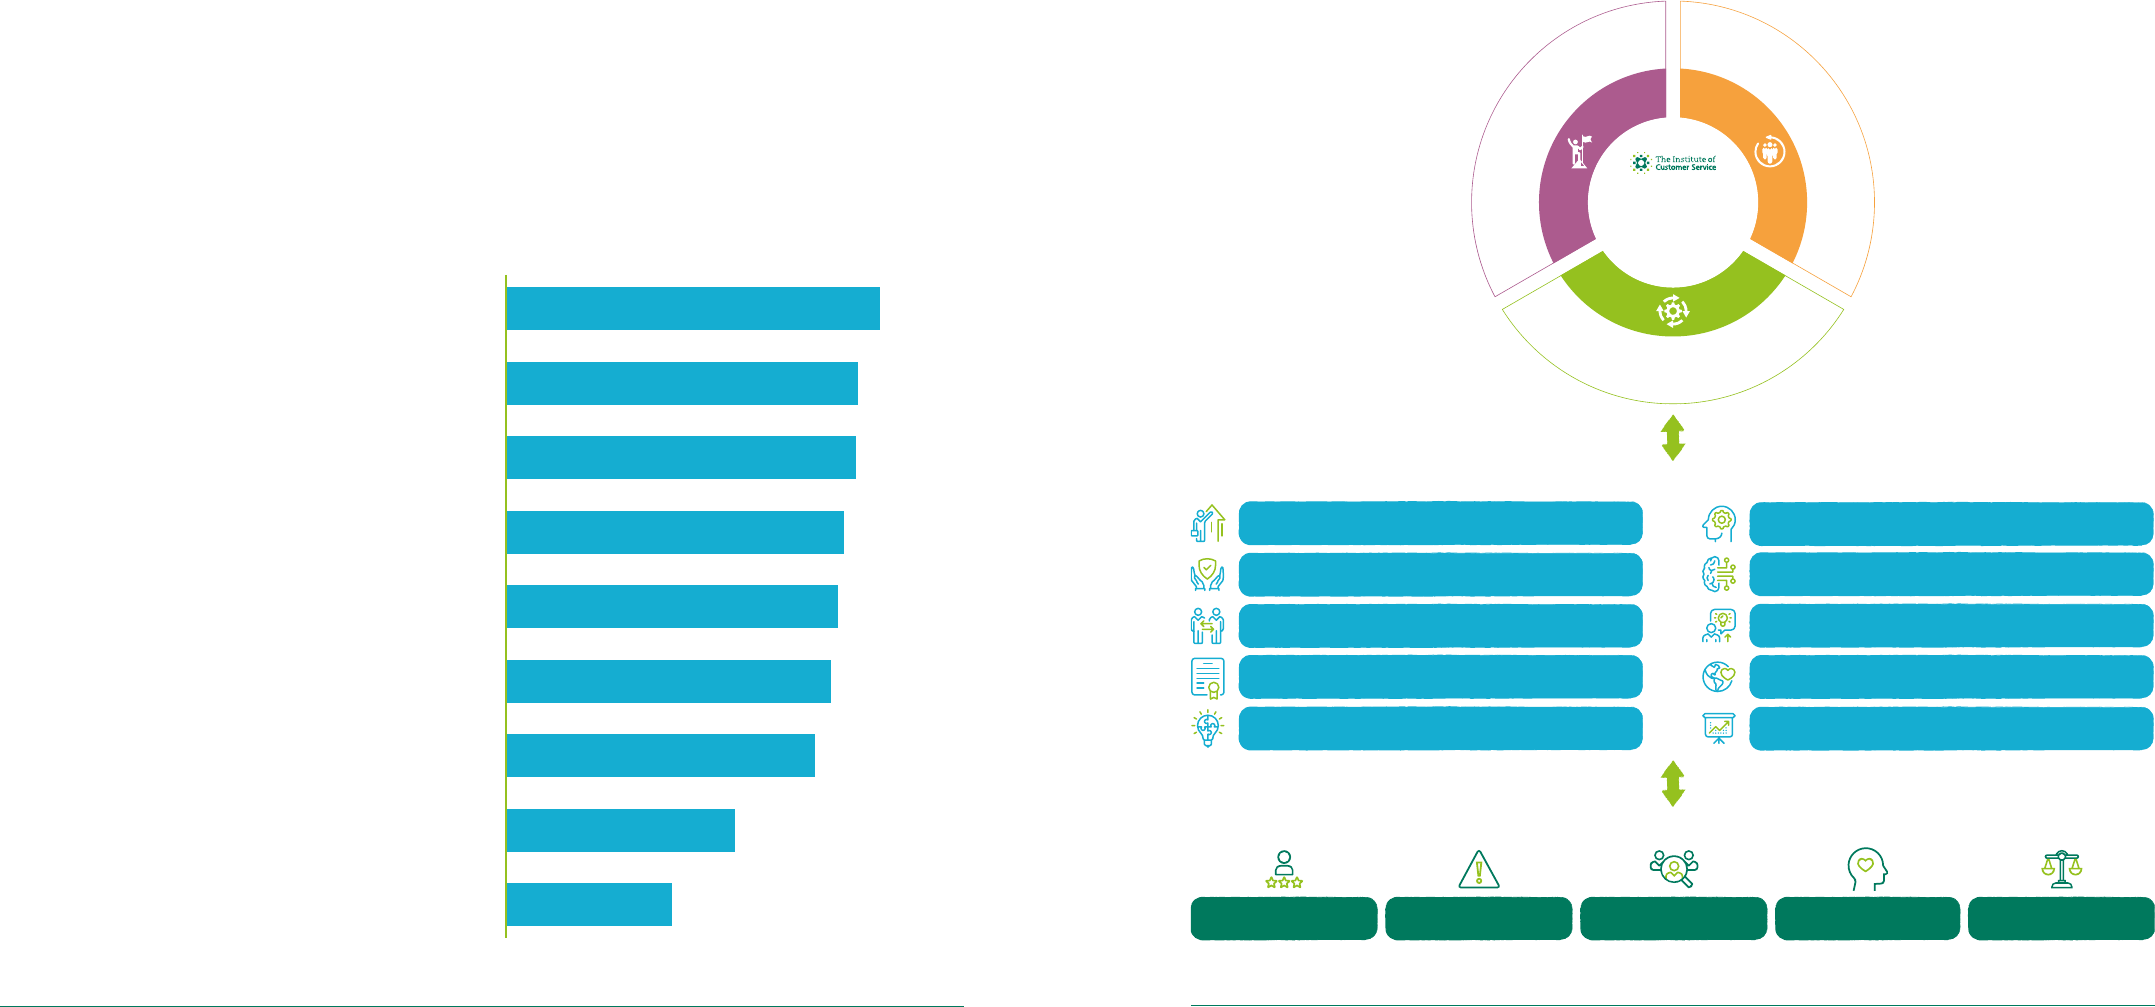
Most customers believe regulators, government and
companies need to do more to help alleviate the
impact of the rising cost of living
70% of customers strongly agree that regulators should limit the amount companies can charge for essential
services and 64% say that government should provide more financial support to customers in need.
More than 60% of people believe that companies should hold prices for essential products and services,
be proactive in giving advice to help customers make savings and reduce costs in their business
operations. In addition, 66% of respondents strongly agree that shareholders and investors should be
prepared to accept lower profits.
70%
66%
66%
64%
62%
61%
58%
43%
31%
Regulators should limit the amount that companies
are allowed to charge for essential services
Shareholders and investors should be
prepared to accept lower prots
Companies should hold prices for
essential products and services
Government should provide extra
nancial support for people in need
Companies should be proactive in giving information and advice
about how customers can make savings on what they spend
Companies should make savings in their business
operations so they can minimise the need to increase prices
Companies should operate low tariffs a social tariff on
essential services for people who are struggling nancially
Customers should be allowed to defer payment on
essential services, which they will repay at a later date
Customers who can afford to, should pay a bit
more for essential products and services
Customers' perspectives on how organisations should
support customers during the cost of living crisis
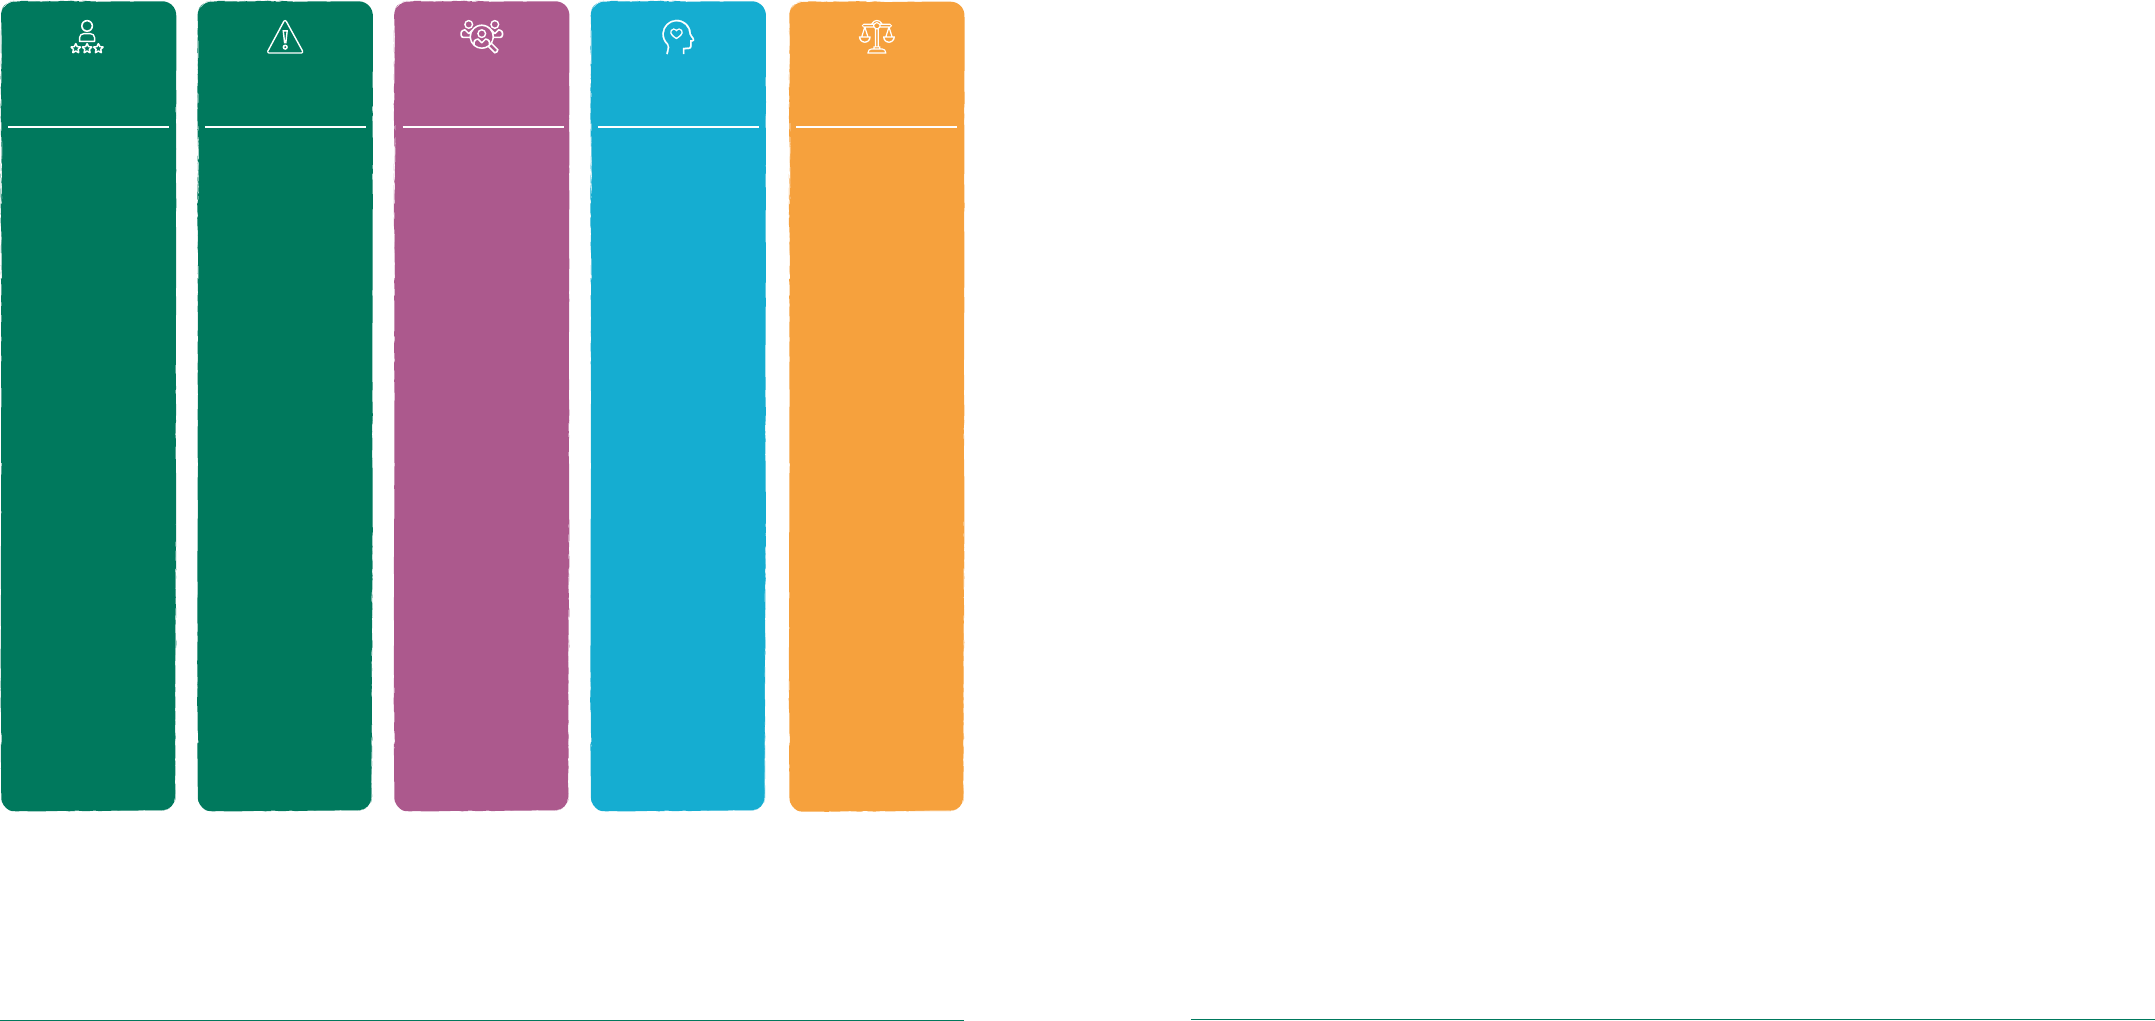
Building a culture of
service excellence
Our research, and engagement with organisations and leaders, suggests that customer service and
business performance outcomes are more the product of organisational culture than of specific activities
or investments. The January 2023 UKCSI concludes by highlighting recommendations to develop the key
enablers of a culture of service excellence.
Competence, reliability and dependability
Leadership, purpose and a long-term focus
Proactive customer engagement
Governance
Innovation and agility
Developing the right blend of technology and people
Employee skills, behaviours and engagement
Using insight to improve customer experience
A positive impact on society
Measuring the right things
Experience Complaint Handling Customer Ethos Emotional ConnectionEthics
The Service Experience Model
The Service Experience Model
Enablers of a Service Culture
Enablers of a Service Culture
UKCSI Dimension of Customer Satisfaction
UKCSI Dimension of Customer Satisfaction
S
t
r
a
t
e
g
y
&
L
e
a
d
e
r
s
h
i
p
O
p
e
r
a
t
i
o
n
a
l
D
e
l
i
v
e
r
y
C
u
l
t
u
r
e
&
E
n
g
a
g
e
d
P
e
o
p
l
e
Reputation
Performance
Growth
Protability
Trust
2524 UK Customer Satisfaction Index | January 2023UK Customer Satisfaction Index | January 2023
The state of
customer
satisfaction
in the UK
1
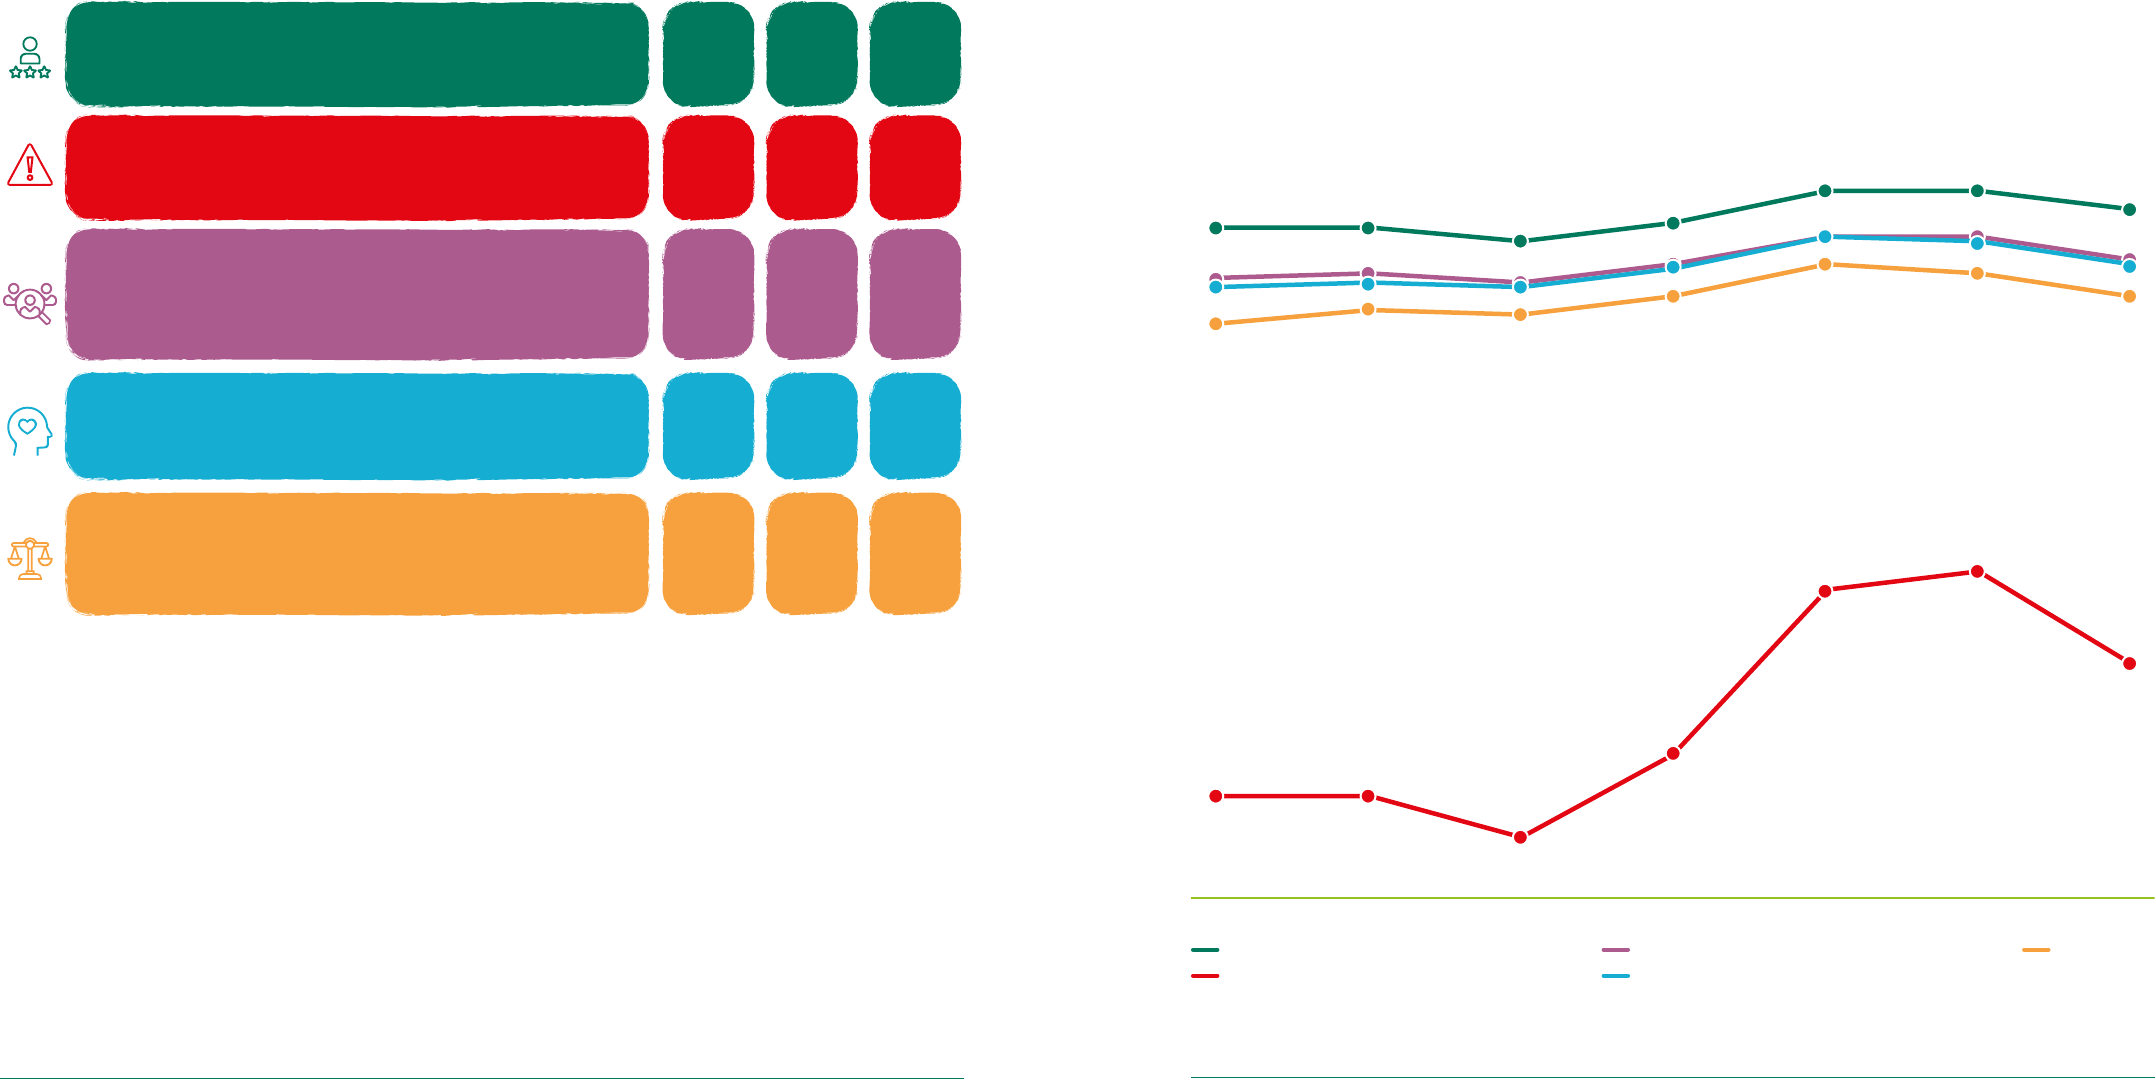
The January 2023 UK Customer Satisfaction Index
(UKCSI) is 77.7 (out of 100), a decline of 0.7 points
compared to both the July and January 2022 surveys
Compared to
January 2022, customer
satisfaction has fallen in
all 5 dimensions, with the
biggest decline evident for
complaint handling.
Jul-21 Jan-22 Jan-23Jul-22Jan-21Jul-20Jan-20Jul-19Jan-19Jul-18Jan-18Jul-17Jan-17Jul-16Jan-16Jul-15Jan-15Jul-14Jan-14Jul-13Jan-13Jul-12Jan-12Jul-11Jan-11Jul-10Jan-10Jul-09Jan-09
77.4
78.4 78.4
76.9 77.0
76.8
77.1
77.7
77.9
78.1
78.2
77.8
77.4
77.0
76.2
76.0
76.3
77.1
77.9
78.2
78.0
77.4
77.3
76.7
75.6
75.2
74.1
72.0
77.7
The UKCSI is a national benchmark of customer satisfaction covering 281 organisations or organisation
types across 13 sectors. The UKCSI score is based on how customers rate organisations across 26
measures which are summarised in 5 dimensions of customer satisfaction. Compared to January 2022,
customer satisfaction has fallen in all 5 dimensions measured in the UKCSI, with the biggest decline
evident for complaint handling.
Index scores out of 100
2726 UK Customer Satisfaction Index | January 2023UK Customer Satisfaction Index | January 2023
Experience
Measures the quality of customers’ experiences and
interactions with organisations
Dimension (score out of 100)
Jan
2023
Ethics
Reputation, openness and transparency and the extent
to which an organisation is deemed to “do the right thing”
Customer Ethos
Extent to which customers perceive that organisations
genuinely care about customers and build the experience
around their customers’ needs
Complaint Handling
How organisations respond and deal with problems and
complaints
Emotional Connection
The extent to which an organisation engenders feelings
of trust and reassurance
78.7
75.8
77.0
63.3
76.8
Jan
2022
79.3
76.8
77.8
65.8
77.8
Year-on-
year
change
-0.6
-1.0
-0.8
-2.5
-1.0
The improvement in satisfaction with complaint
handling seen in 2021 and 2022 has stalled
January 2023 UKCSI:
dimensions of customer
satisfaction
Looking back over the past 3 years, most customer satisfaction index measures have been relatively
stable, though there have been more pronounced movements in customer satisfaction with individual
organisations. Much of the improvement in overall customer satisfaction through 2021 and 2022 was
fuelled by stronger satisfaction with complaint handling. However, the improvement in complaint
handling appears to have stalled and other areas of customer satisfaction have also fallen. This suggests
that further sustained growth in customer satisfaction will require increased focus and actions in all
dimensions of customer satisfaction.
78.1
78.0
77.7
78.3
79.3 79.4
78.7
58.8
58.8
57.4
60.2
65.8
66.4
63.3
74.9
75.2
75.2
75.8
76.8
76.6
75.8
76.0
77.6
76.4
77.7
77.0
76.5
76.2
76.8
77.8
Jan-20 Jul-20 Jan-21 Jul-21 Jan-22 Jul-22
Jan-23
Customer EthosExperience
Emotional ConnectionComplaint Handling
Ethics
76.2
76.1
76.7
77.8
76.8
Customer satisfaction dimensions 2020-2023
Index scores out of 100

2928 UK Customer Satisfaction Index | January 2023UK Customer Satisfaction Index | January 2023
16.5% of customers experienced a problem with an organisation, around the same number as a year
ago (16.4%) and slightly lower than in July 2022 (17.3%). However, the current level of problems is
2.9 percentage points more than it was in January 2020, the last UKCSI published before the Covid-19
pandemic.
% customers experiencing a problem with an organisation and satisfaction with complaint handling
The distribution of problems by type of issue is similar to that recorded for January 2022. However,
compared to January 2021 there has been a 9.9 percentage point increase in the number of problems
concerned with quality or reliability of goods and services. The extent of problems has significant
implications not just for customer satisfaction, but for organisations’ productivity, costs and profitability.
Types of problems experienced by customers
(% refers to the frequency with which each issue was cited in relation to a problem. For some problems
multiple issues are cited)
5.8 5.8
5.7
6.0
6.5 6.6
6.3
13.6
14.1
14.6
14.9
16.4
17.3
16.5
Jan-20 Jul-20 Jan-21 Jul-21 Jan-22 Jul-22 Jan-23
Average satisfaction with
handling of the complaint (1 - 10)
% of customers who recently experienced
a problem with an organisation
The number of customers experiencing a problem with
an organisation is around the same level as a year ago
but higher than it was before the Covid-19 pandemic
The leading causes of problems experienced by
customers are quality or reliability, suitability and
availability of goods and service
Jan-20 Jan-21 Jan-22 Jan-23
Quality or reliability of goods/services 33.8% 31.8% 41.2% 41.7%
Suitability of goods/services
(e.g. didn`t do what you expected)
22.7% 20.4% 25.1% 24.1%
Availability of goods/services
(e.g. couldn`t find what you wanted)
17.5% 19.5% 23.4% 22.2%
Late delivery or slow service 22.5% 21.9% 19.4% 20.9%
Staff competence 23.5% 20.2% 18.5% 20.0%
Staff attitude 17.5% 17.4% 15.1% 16.4%
Cost 11.9% 11.7% 11.2% 10.8%
XX not keeping its promises and commitments 17.3% 16.9% 13.9% 15.6%
3130 UK Customer Satisfaction Index | January 2023UK Customer Satisfaction Index | January 2023
5 sectors - Public Services (Local and National), Services,
Transport and Utilities - have dropped by at least 1
points compared to January 2022
Utilities
Transport
Tourism
Telecommunications & Media
Services
Retail (Non-food)
Retail (Food)
Public Services (National)
Public Services (Local)
Leisure
Insurance
Banks & Building Societies
Automotive
80.7
80.2
80.5
81.7
73.4
76.9
81.0
81.5
77.4
76.3
80.4
75.1
74.5
81.0
80.3
80.8
81.8
72.3
75.3
81.7
81.9
76.7
76.6
80.7
75.8
74.1
80.1
80.3
80.0
80.8
72.2
75.1
80.5
81.7
76.3
75.8
80.9
74.1
71.7
Jan-23
Jul-22
Jan-22
Customer satisfaction by sector: Jan 2022 – Jan 2023
Change in customer
satisfaction by sector,
compared to January 2022
5 sectors down by
less than 1 point
Automotive
Insurance
Leisure
Retail (Food)
Telecomms &
Media
3 sector up by less
than 1 point
Banks & Building
Societies
Retail
(Non-food)
Tourism
1 sector down by
more than 2 points
Utilities
4 sectors down by
between 1 and 1.8 points
Public Services
(Local)
Public Services
(National)
Services
Transport
Index scores out of 100
Highest rated sectors in the January 2023 UKCSI
q Fall in UKCSI score by less than one point q Fall in UKCSI score by more than 1 point
Jan-23 Jul-22 Jan-22 Change from
Jan-22 to
Jan-23
Change from
Jul-22 to
Jan-23
Retail (Non-food)
81.7 81.9 81.5 0.2 -0.2
Tourism
80.9 80.7 80.4 0.5 0.2
Leisure
80.8 81.8 81.7 -0.9 -1.0
Retail (Food)
80.5 81.7 81.0 -0.5 -1.2
Banks & Building Societies
80.3 80.3 80.2 0.1 0.0
Automotive
80.1 81.0 80.7 -0.6 -0.9
Insurance
80.0 80.8 80.5 -0.5 -0.8
Services
76.3 76.7 77.4 -1.1 -0.4
Telecommunications & Media
75.8 76.6 76.3 -0.5 -0.8
Public Services (National)
75.1 75.3 76.9 -1.8 -0.2
Transport
74.1 75.8 75.1 -1.0 -1.7
Public Services (Local)
72.2 72.3 73.4 -1.2 -0.1
Utilities
71.7 74.1 74.5 -2.8 -2.4

3332 UK Customer Satisfaction Index | January 2023UK Customer Satisfaction Index | January 2023
Average customer satisfaction in the Utilities sector is
71.7 (out of 100), a drop of 2.8 points compared to January
2022
This is the sector’s lowest score since July 2015, when it was 71.4.
Within the Utilities sector, average satisfaction with Energy companies is 70.3, a decline of 3.8 points
compared to a year ago. The biggest fall in customer satisfaction was for pricing, down 0.9 points
compared to January 2022, to 6.0 (out of 10). Average levels of trust and an organisation making you
feel reassured decreased by 0.5 points (out of 10). The number of experiences rated as being right first
time declined by 4.4 percentage points to 68.4%.
Average satisfaction with Water companies fell by 1.1 points to 74.8. Most of the 26 measures that
make up the UKCSI fell slightly (by 0.1 – 0.2 points out of 10) compared to a year ago. Average
satisfaction with the speed of resolving a complaint declined by 0.4 points to 7.0 (out of 10).
Energy
Water
73.4
71.3
71.2
71.7
72.2
73.1
74.1
73.2
70.3
74.5
73.4
73.8 74.0
73.8
74.6
75.9
76.1
74.8
Jan-19 Jul-19 Jan-20 Jul-20 Jan-21 Jul-21 Jan-22 Jul-22
Jan-23
Average customer satisfaction with Energy and Water organisations
Average customer satisfaction with Public Services
organisations fell by at least 1 point compared to a year
ago
Customer satisfaction with Public Services
(National) sector organisations dropped by 1.8
points to 75.1.
Average satisfaction for Public Services (Local)
organisations fell by 1.2 points to 72.2. The
decrease in satisfaction was significantly
influenced by a 3.6 point drop for GP surgery /
health centre to 70.2, the lowest score recorded
for this category. Your housing association, your
local Fire Service and your local Police Service also
received average customer satisfaction ratings at
least 1 point below their January 2022 levels.
Average satisfaction for organisations in
the Services sector is 76.3, down 1.1 points
compared to January 2022. Around three
quarters of customer responses in this sector
refer to either automotive or postal / courier
services. The biggest fall in satisfaction is for
postal / courier services, down by 1.4 points to
74.0.
Index scores out of 100
3534 UK Customer Satisfaction Index | January 2023UK Customer Satisfaction Index | January 2023
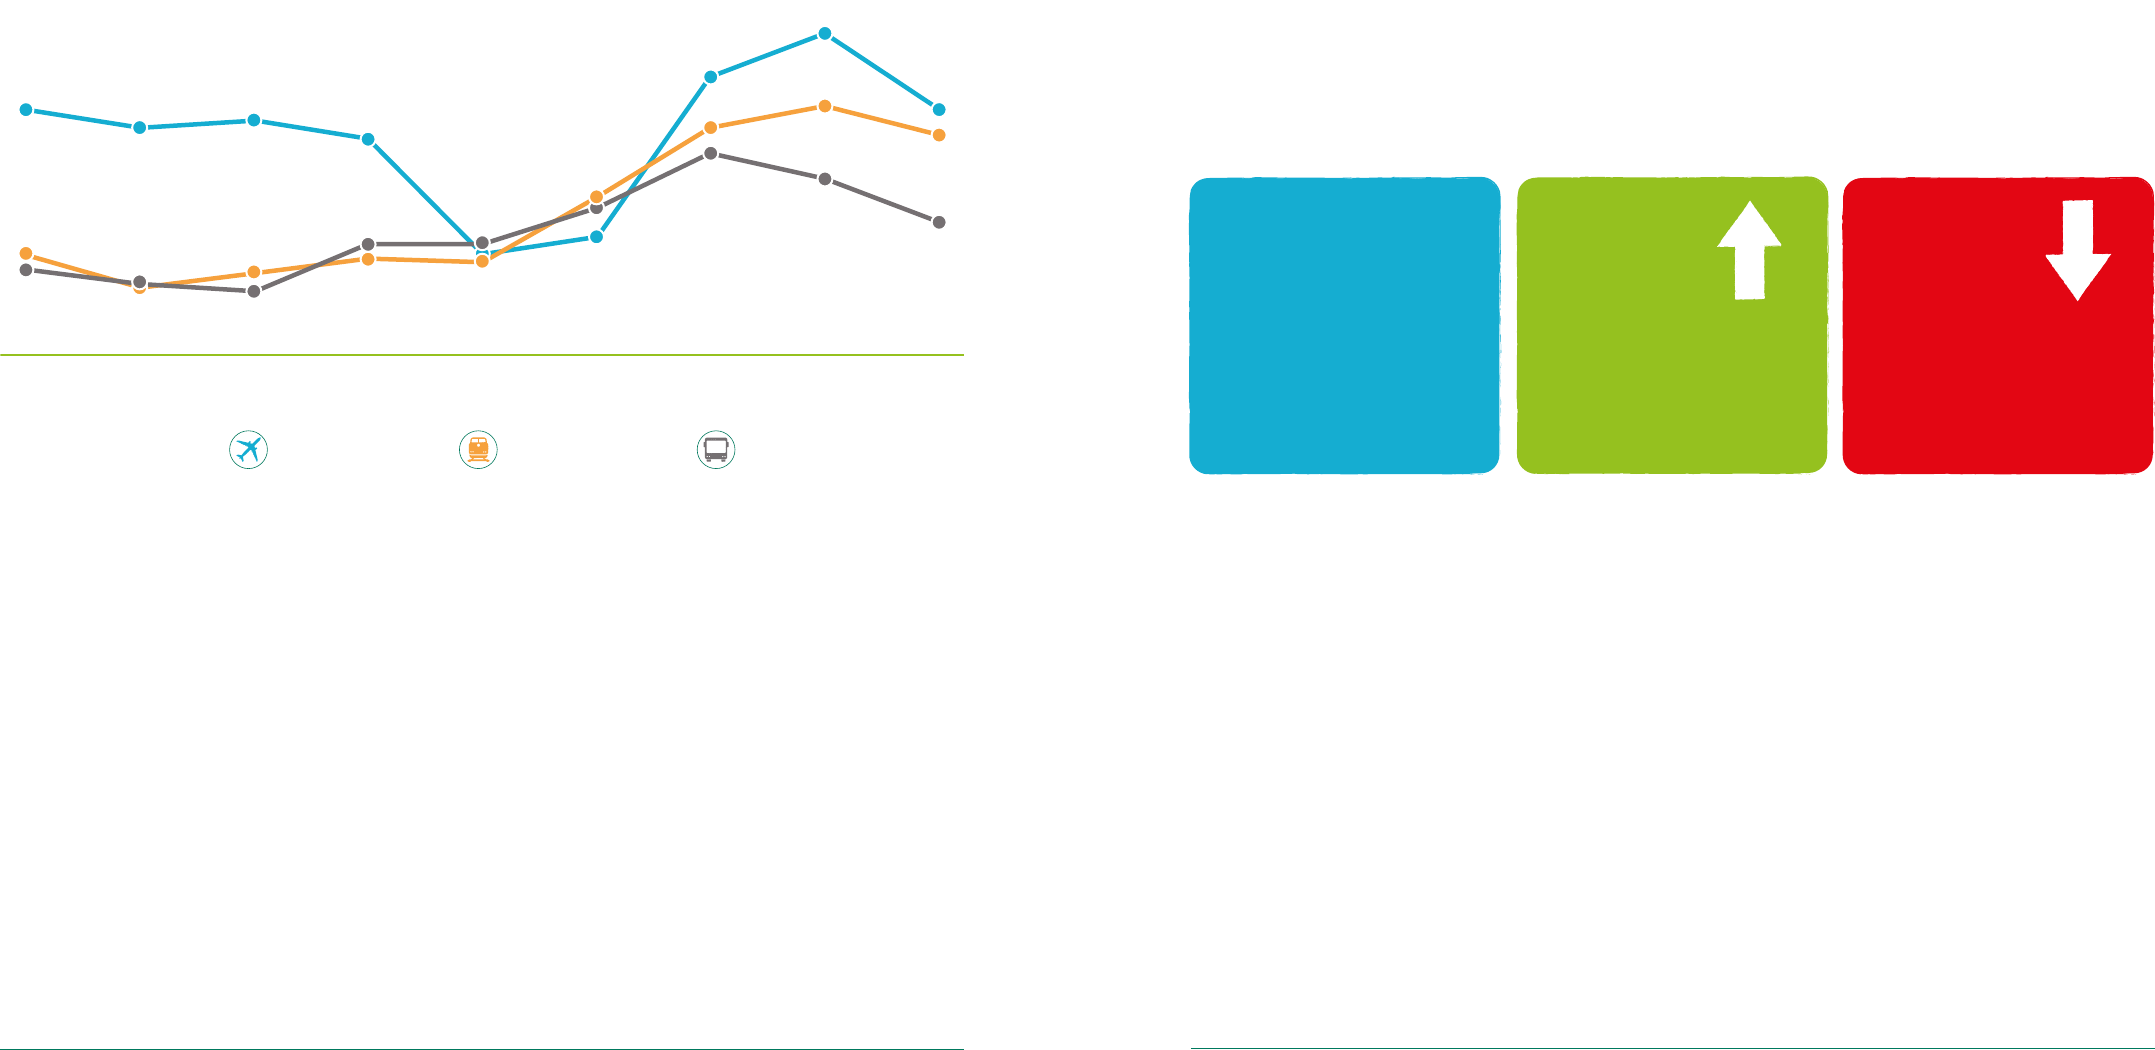
In the Transport sector,
the improvements
recorded in recent UKCSI
reports have stalled
Across the sector as a whole average customer satisfaction is 74.1, down 1 point compared to January
2022.
75.4
74.7
75.0
74.3
69.8
70.5
76.6
78.3
75.4
69.9
68.6
69.2
69.7
69.5
72.1
74.7
75.5
74.4
69.3
68.8
68.5
70.3
70.2
71.6 73.7
72.8
71.1
Jan-19 Jul-19 Jan-20 Jul-20 Jan-21 Jul-21 Jan-22 Jul-22
Jan-23
Rail / Train
Coach / BusAir
Customer satisfaction with Transport organisations
The UKCSI results are based on two sets of data: the first set of data was collected in March and April
2022; the second set was collected in September and October 2022. In the most recent data, there are
signs that customer satisfaction is under growing pressure.
Customer satisfaction with Rail companies is 74.4, slightly lower, by 0.3 points than in January 2022.
However, average satisfaction for experiences recorded in September and October 2022 is 3.2 points
lower than for those in the preceding April and March, influenced in particular by lower scores for
satisfaction with complaint handling.
Customer satisfaction with Airlines is 75.4, a decline of 1.2 points compared to January 2022. Average
satisfaction for experiences recorded in September and October 2022 is 4.7 points lower than for those
in April and March, partly caused by a sharp drop in satisfaction for complaint handling.
8 sectors have moved by less than 1 point compared to January 2022. Customer satisfaction in the
Banks and Building Societies, Retail (Non-food) and Tourism sectors is broadly unchanged compared to a
year ago: each sector has improved slightly, by between 0.1 and 0.5 points.
Average customer satisfaction in the Automotive, Insurance, Leisure, Retail (Food) and
Telecommunications and Media sectors is similar to the levels recorded in January 2022: each sector has
declined slightly, by less than 1 point. However, compared to July 2022, average satisfaction with Retail
(Food) and Leisure organisations has fallen by 1.2 points and 1 point respectively.
281
Organisations
and organisation
types in the
UKCSI
Organisations
have improved
yoy by at least
two points
37
63
Organisations
have fallen by at least
2 points compared to
January 2022
In the January 2023 UKCSI, 37 organisations (13% of the total receiving a UKCSI score) have improved
by at least 2 points compared to the previous year, the lowest number since January 2020. 63
organisations (22% of those receiving a UKCSI score) have fallen by 2 points or more.
Index scores out of 100

3736 UK Customer Satisfaction Index | January 2023UK Customer Satisfaction Index | January 2023
10%
18% 16%
26%
52%
42%
13%
28%
20%
27%
14%
6%
8%
22%
Jan-20 Jul-20 Jan-21Jul-21 Jan-22 Jul-22 Jan-2
3
% of organisations whose UKCSI has
improved yoy by at least 2 points
% organisations whose UKCSI score has
declined yoy by at least 2 points
% of organisations that have improved or fallen by at least 2 points compared to the previous year
Almost half of the organisations that have declined
by at least 2 points compared to a year ago are in the
Transport and Utilities sectors
In the Utilities sector the gap between the highest and lowest rated organisation is 21.1 points, more
than any other sector. The gap between the highest and lowest scoring organisations is the least
pronounced in the Tourism, Automotive, Insurance and Retail (Food) sectors.
Sector Total number of
organisations
Number of
organisations
that have
improved by 2
points or more
Number of
organisations
that have moved
by less than 2
points
Number of
organisations
that have
dropped by 2
points or more
Gap between
highest
and lowest
organisation
Automotive
27 3 18 6 8.5
Banks & Building Societies
19 2 14 1 10.0
Insurance
26 6 12 7 8.6
Leisure
27 3 15 3 14.3
Public Services (Local)
7 0 6 1 18.5
Public Services (National)
13 1 5 5 14.2
Retail (Food)
12 1 9 1 9.0
Retail (Non-food)
24 3 17 2 15.4
Services
19 2 13 3 17.1
Telecommunications & Media
14 0 11 3 16.4
Tourism
21 6 13 1 7.8
Transport
38 7 15 14 15.3
Utilities
34 3 11 16 21.1
3938 UK Customer Satisfaction Index | January 2023UK Customer Satisfaction Index | January 2023
Jan-23
Rank
Organisation Sector Jan-23
Score
Jan-22
Score
Jan-22
Rank
Change
in score
Jan-22 to
Jan-23
26=
Trivago
Tourism 82.8 83.4 29 -0.6
28=
Home Bargains
Retail (Non-food) 82.6 83.4 29 -0.8
28=
Nationwide
Banks & Building Societies 82.6 83.7 22 -1.1
30=
Costco
Retail (Non-food) 82.5 81.7 52 0.8
30=
Sky Mobile
Telecommunications & Media 82.5 82.7 38 -0.2
30=
Apple
Retail (Non-food) 82.5 83.4 29 -0.9
33
Tesco
Banks & Building Societies 82.4 78.9 140 3.5
34=
Kia
Automotive 82.3 81.7 52 0.6
34=
giffgaff
Telecommunications & Media 82.3 82.3 40 0.0
36=
Subway
Leisure 82.2 79.3 129 2.9
36=
Hyundai
Automotive 82.2 81.8 49 0.4
38=
Now TV
Leisure 82.1 81.5 59 0.6
38=
Jet2
Transport 82.1 84.1 13 -2.0
38=
Ikea
Retail (Non-food) 82.1 80.6 85 1.5
41=
Monzo Bank
Banks & Building Societies 82.0
NO DATA NO DATA NO DATA
41=
H&M
Retail (Non-food) 82.0 80.9 79 1.1
43=
Caffe Nero
Leisure 81.9 81.8 49 0.1
43=
SAGA Insurance
Insurance 81.9 85.5 3 -3.6
43=
Expedia
Tourism 81.9 80.3 97 1.6
43=
Merseyrail
Transport 81.9
NO DATA NO DATA NO DATA
47
Hoseasons
Tourism 81.8 77.1 183 4.7
48=
Bank of Scotland
Banks & Building Societies 81.7 81.5 59 0.2
48=
Nationwide Insurance
Insurance 81.7 80.4 94 1.3
48=
Toby Carvery
Leisure 81.7 82.2 42 -0.5
48=
Co-op Insurance
Insurance 81.7 75.7 208 6.0
48=
Audi
Automotive 81.7 80.5 89 1.2
Jan-23
Rank
Organisation Sector Jan-23
Score
Jan-22
Score
Jan-22
Rank
Change
in score
Jan-22 to
Jan-23
1
rst direct
Banks & Building Societies 86.2 85.7 2 0.5
2
John Lewis
Retail (Non-food) 85.6 84.7 7 0.9
3
UK Power Networks
Utilities 85.4 85.4 4 0.0
4=
Tesco Mobile
Telecommunications & Media 85.2 83.7 22 1.5
4=
M & S (food)
Retail (Food) 85.2 84.2 11 1.0
6
Starling Bank
Banks & Building Societies 85.1
NO DATA NO DATA NO DATA
7
Next
Retail (Non-food) 85.0 81.4 63 3.6
8=
Suzuki
Automotive 84.6 84.0 17 0.6
8=
M & S
Retail (Non-food) 84.6 84.0 17 0.6
10
Amazon.co.uk
Retail (Non-food) 84.4 83.8 21 0.6
11
Timpson
Services 84.2 85.3 5 -1.1
12=
Hotels.com
Tourism 84.1 80.1 98 4.0
12=
Jet2holidays.com
Tourism 84.1 84.6 8 -0.5
14
Greggs
Leisure 84.0 84.3 9 -0.3
15
Northern Powergrid
Utilities 83.9
NO DATA NO DATA NO DATA
16
Marriott
Tourism 83.8 81.7 52 2.1
17
Amazon Prime Video
Leisure 83.7 82.8 37 0.9
18
Green Flag
Services 83.6 84.2 11 -0.6
19
The Co-operative Bank
Banks & Building Societies 83.4 83.7 22 -0.3
20
AA Insurance
Insurance 83.3 81.1 71 2.2
21
booking.com
Tourism 83.1 83.0 35 0.1
22=
Superdrug
Retail (Non-food) 82.9
NO DATA NO DATA NO DATA
22=
Metro Bank
Banks & Building Societies 82.9 83.0 35 -0.1
22=
Waitrose
Retail (Food) 82.9 83.5 27 -0.6
22=
Ocado
Retail (Food) 82.9 80.6 85 2.3
26=
Premier Inn
Tourism 82.8 81.7 52 1.1
The top
50 organisations
p Increase in UKCSI score of at least one point p Increase in UKCSI score of less than one point q Fall in UKCSI score p Increase in UKCSI score of at least one point p Increase in UKCSI score of less than one point q Fall in UKCSI score

4140 UK Customer Satisfaction Index | January 2023UK Customer Satisfaction Index | January 2023
13 of the top 50 organisations are from the
Retail (Non-food) or Retail (Food) sectors. John
Lewis, M & S (Food and Non-food) Next and
Amazon are amongst the 10 highest rated
organisations. Next is amongst the top 10
highest rated organisations for the first time
since January 2020.
8 Banks or Building Societies appear in the top
50 organisations. first direct is the highest rated
organisation in the January 2023 UKCSI, with
a score of 86.2. Starling Bank has received a
UKCSI score for the first time since July 2021 and
is amongst the 10 highest rated organisations.
Monzo Bank appears in the UKCSI for the first
time.
Despite the overall decline in customer
satisfaction in Transport and Utilities, each of
these sectors has two representatives in the
top 50 organisations. Jet2 is the highest rated
organisation in the Transport sector although
its UKCSI score is 2 points lower than it was a
year ago. Merseyrail is the highest rated train
company: its UKCSI score of 81.9 is 7.5 points
higher than the average of all train companies in
the UKCSI.
UK Power Networks and Northern Powergrid are
the highest rated organisations in the Utilities
sector: both are electricity distribution network
operators.
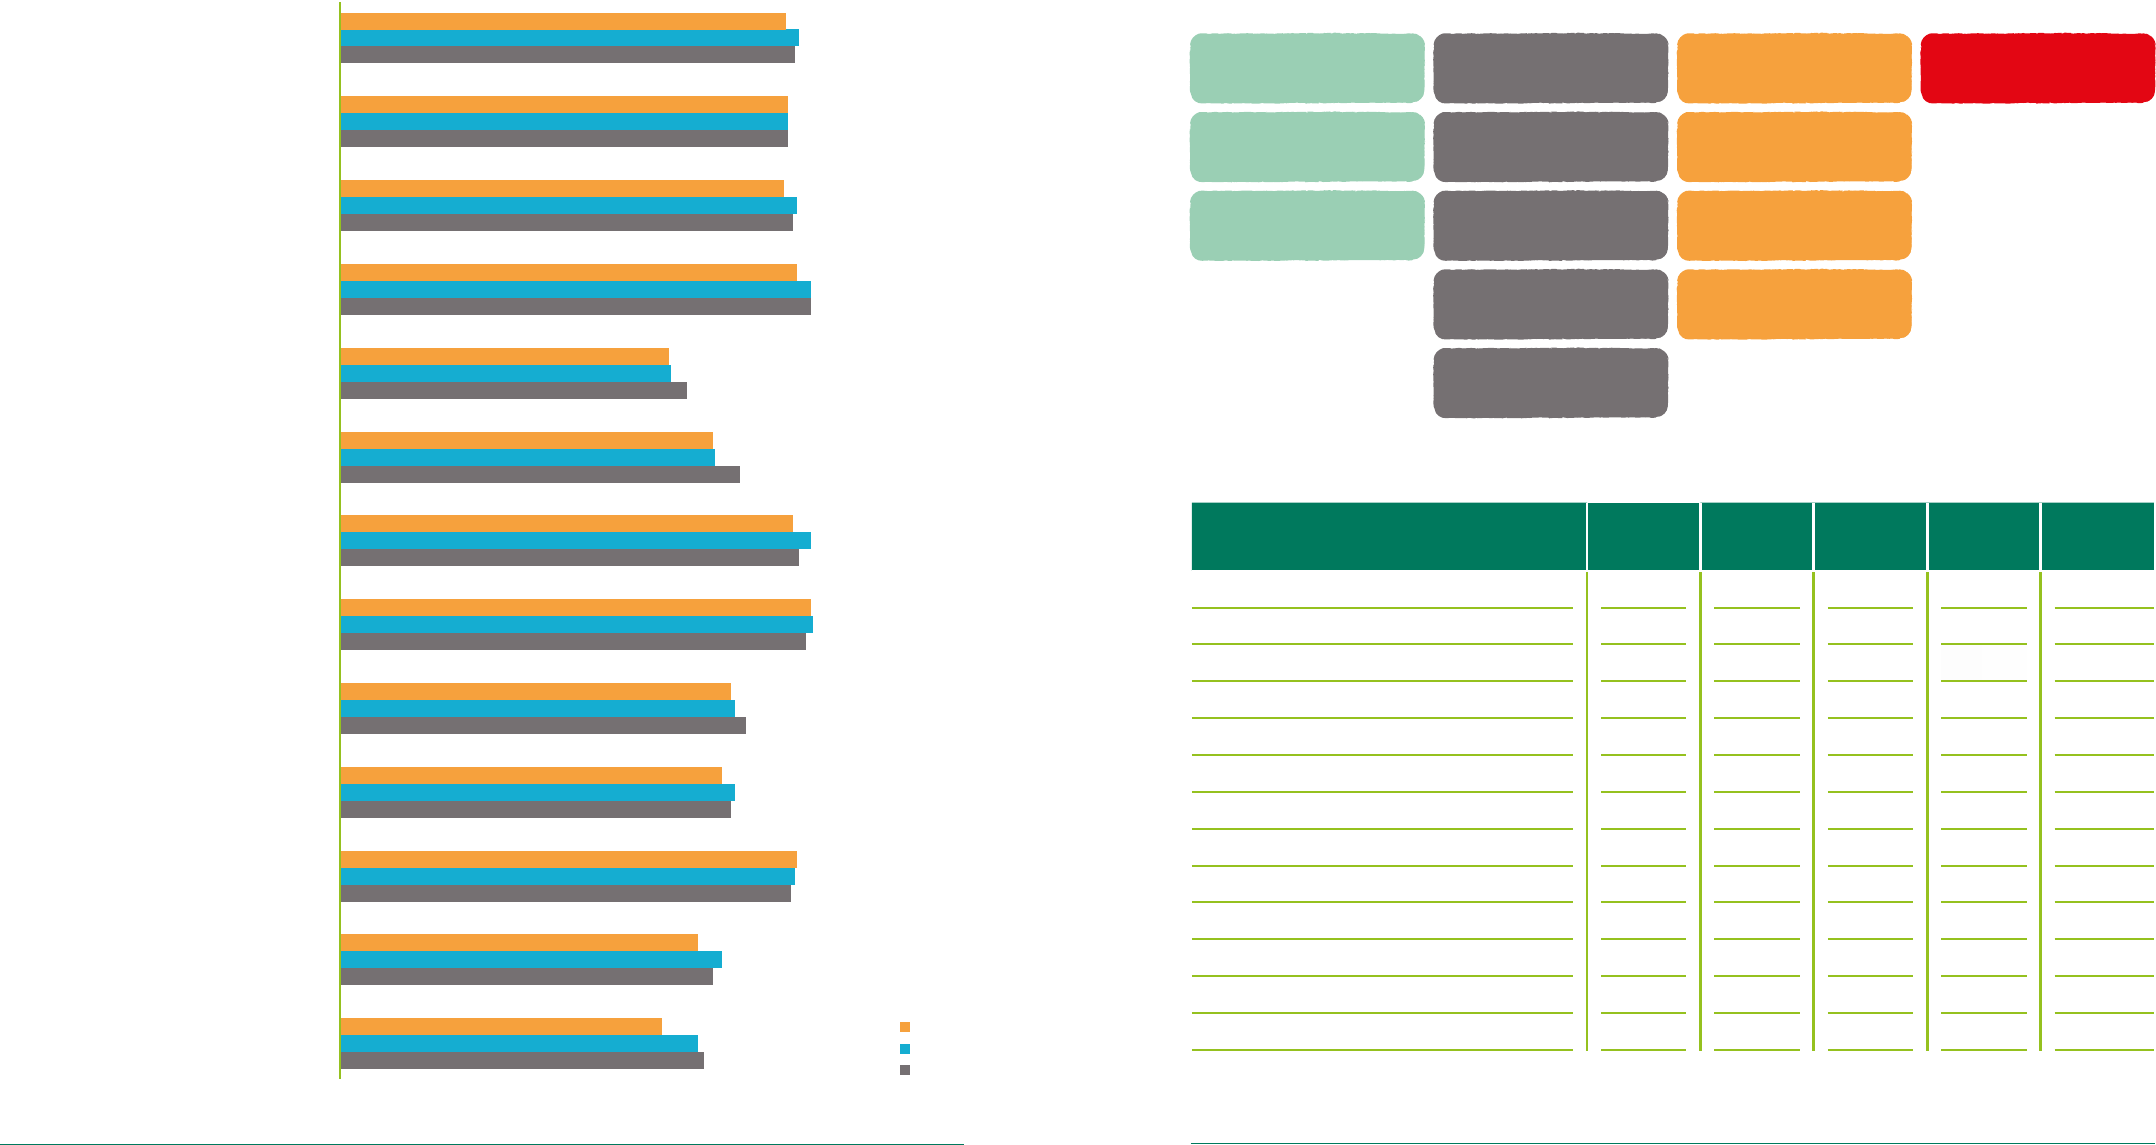
Key differences between the top 50 organisations and
the rest include satisfaction with complaint handling,
price and cost and measures of emotional connection
and customer ethos
The biggest gaps between the top 50 organisations and others are for satisfaction with complaint
handling, price / cost and the number of experiences rated as being right first time. There are also
notable differences between the top 50 organisations and other organisations for Emotional Connection
measures of trust and making customers feel reassured and Customer Ethos measures such as an
organisation designing experiences around its customers, caring about its customers and keeping
promises.
Measure (on a scale of 1 - 10 except where indicated) Top 50 Other organisations Gap
UKCSI 83.3 77.0 6.3
Proportion of customers giving a 9 or 10 out of 10
for overall satisfaction
37.4% 26.2% 11.2% points
Speed of resolving your complaint 7.4 6.2 1.2
The handling of the complaint 7.5 6.3 1.2
The attitude of staff (complaints) 7.6 6.6 1.0
Price / cost 8.2 7.4 0.8
XX designs the experience around its customers 8.2 7.5 0.7
XX makes you feel reassured 8.3 7.6 0.7
XX cares about their customers 8.2 7.5 0.7
You trust XX 8.3 7.6 0.7
XX keeps their promises 8.3 7.6 0.7
% customers experiencing a problem 12.0% 16.5% 4.5% points
% experiences right first time 86.5% 79.8% 6.7% points
Key differentiators of the top 50 organisations in the UKCSI
4342 UK Customer Satisfaction Index | January 2023UK Customer Satisfaction Index | January 2023
Top rated organisations
by customer satisfaction
dimension
An organisation’s UKCSI score is based on how customers rate it across 26 measures which are
summarised in 5 dimensions of customer satisfaction.
UKCSI dimensions
rst direct
Amazon.co.uk
John Lewis
Tesco Mobile
Starling Bank
Next
UK Power
Networks
Amazon
Prime Video
M & S (food)
Suzuki
Amazon
Prime Video
Afnity Water
UK Power
Networks
Netix
Tesco
(Banks & Building
Societies)
Northern
Powergrid
SP Energy
Networks
AA Insurance
Wessex Water
C2C
Suzuki
rst direct
UK Power
Networks
Next
M & S (food)
Tesco Mobile
Timpson
M & S
(Retail Non-food)
Now TV
John Lewis
John Lewis
UK Power
Networks
M & S (food)
Starling Bank
Suzuki
Next
Northern
Powergrid
Marriott
Tesco Mobile
rst direct
M & S (food)
UK Power
Networks
Starling Bank
John Lewis
rst direct
Next
Tesco Mobile
Marriott
Jet2holidays.com
Suzuki
Experience
Complaint
Handling
Customer
Ethos
Emotional
Connection
Ethics
UK Power Networks is amongst the highest rated
organisations on all 5 dimensions of customer
satisfaction.
first direct, John Lewis, Tesco Mobile, Next,
M & S (food) and Suzuki are amongst the highest
rated organisations on 4 dimensions: Experience;
Customer Ethos; Emotional Connection and
Ethics.
The Complaint Handling dimension features
a wider spread of organisations amongst the
top performers than the other dimensions. For
Complaint Handling, only organisations for
whom at least 10 complaints were recorded
receive a published score. This means that,
whereas for the Experience, Customer Ethos,
Emotional Connection and Ethics dimensions
every organisation receives a score, organisations
generating particularly low levels of complaints
may not receive published ratings for satisfaction
with complaint handling.

4544 UK Customer Satisfaction Index | January 2023UK Customer Satisfaction Index | January 2023
20 most improved
organisations
20 most improved organisations
over one year
UKCSI
score Jan
2022
UKCSI
score Jan
2023
YOY
Change
Compared
to sector
average
Sector
Co-op Insurance
75.7 81.7 6.0 1.7 Insurance.5
Wessex Water
74.4 80.4 6.0 8.7 Utilities.1
Ryanair
63.3 69.0 5.7 -5.1 Transport.4
ScotRail / ScotRail Trains
70.5 75.4 4.9 1.3 Transport
Hoseasons
77.1 81.8 4.7 0.9 Tourism
Seat
76.8 81.5 4.7 1.4 Automotive
Legal and General
74.7 79.2 4.5 -0.8 Insurance
Prudential
76.4 80.9 4.5 0.9 Insurance
Thameslink
68.5 72.9 4.4 -1.2 Transport
Grand Central
76.1 80.2 4.1 6.1 Transport
Hotels.com
80.1 84.1 4.0 3.2 Tourism
Fiat
73.5 77.2 3.7 -2.9 Automotive
Next
81.4 85.0 3.6 3.3 Retail (Non-food)
Tesco (Bank)
78.9 82.4 3.5 2.1 Banks & Building Societies
Sainsbury's (Insurance)
77.8 81.1 3.3 1.1 Insurance
Holiday Inn
78.2 81.4 3.2 0.5 Tourism
Subway
79.3 82.2 2.9 1.4 Leisure
Burger King
77.2 80.1 2.9 -0.7 Leisure
Butlins
75.6 78.3 2.7 -2.6 Tourism
Mitsubishi
75.6 78.3 2.7 -1.8 Automotive
Organisation is at least 1 point higher than the sector average Organisation is at least 1 point lower than the sector average
A diverse range of sectors is represented
amongst the 20 most improved organisations
compared to January 2022.
The Transport, Tourism and Insurance sectors
each account for 4 of the 20 most improved
organisations, compared to January 2022. 3
of the most improved organisations are in the
Automotive sector and 2 are Leisure companies.
Across these 20 organisations the biggest
improvements are for the number of experiences
rated as being right first time, a fall in the
number of customers experiencing a problem
with an organisation and satisfaction with
complaint handling.
10 of the 20 most improved organisations have
received a UKCSI score that is at least 1 point
higher than their sector average but only one
organisation - Grand Central – was also higher
than its sector average in January 2022.
Next is the most improved organisation in the
Retail (Non-food) sector and has received its
highest UKCSI score since January 2020.

4746 UK Customer Satisfaction Index | January 2023UK Customer Satisfaction Index | January 2023
Customer
satisfaction
and business
performance
2
In this section we examine evidence of the relationship between customer satisfaction and business
performance in the Retail (Food) and Banks and Building Societies sectors.
In the Retail (Food) sector, customer satisfaction for
experiences recorded in September and October 2022 is 2
points lower than for those recorded in March and April
2022
In an environment described by a senior executive as a “gathering storm”, rising supplier, energy,
transport and staff costs and changing customer behaviours are affecting organisations’ performance
and profitability. We examine evidence of the relationship between customer satisfaction and financial
performance in the Retail (Food) sector, drawing on the latest UKCSI results, Kantar’s analysis of the UK
grocery market and interim financial statements from some of the sector’s leading players
Average customer satisfaction in the Retail (Food) sector is 80.5 (out of 100), slightly lower, by 0.5
points, than in January 2022. However, there appears to be a more pronounced drop in customer
satisfaction in the most recent UKCSI data. The January 2023 UKCSI is based on two sets of fieldwork,
collected in March and April 2022 and in September and October 2022. Average satisfaction for
customer experiences recorded in September and October 2022 (79.5) is 2 points lower than for those
recorded in March and April 2022 (81.5). The decline in satisfaction is most evident for customers'
perceptions about an organisation’s emotional connection, customer ethos, as well as the quality of
experiences.
81.0
81.5
81.7
79.5
80.5
Jan 2022
UKCSI
July 2022
UKCSI
Jan 2023
UKCSI
Satisfaction with
experiences recorded
21 March - 14 April 2022
Satisfaction with
experiences recorded
5 September - 3 October 2022
Customer responses
that make up the Jan 2023 UKCSI
Index scores out of 100
Customer satisfaction in the Retail (Food) sector
4948 UK Customer Satisfaction Index | January 2023UK Customer Satisfaction Index | January 2023
Retail (Food) January 2023 UKCSI = 80.5
Annual sales growth for the 12 weeks to 27 November 2022
Source: Kantar Worldpanel
Aldi
Ocado
Co-op
Food
Waitrose
Sainsbury's
Iceland
Tesco
ASDA
Morrisons
Lidl
-6%
-4%
-2%
0%
2%
4%
6%
8%
10%
12%
14%
16%
18%
20%
22%
24%
26%
76 77 78 79 80 81 82 83 84
UKCSI score
Customer satisfaction and sales growth: the Retail (Food) sector*
Sales of both own brand and premium products lines
have increased year on year
Kantar’s research on the UK grocery market
1
reported that take-home grocery sales increased
by 5.9% year on year in the 12 weeks preceding
27 November 2022, the fastest level of growth
since March 2021. The increase in sales is likely
to have been influenced by a revival in the
number of in store shopping trips compared to
the previous year as well as the rise in inflation.
Sales of own label products grew by 11.7%
year on year, with sales of the cheapest product
lines increasing by 46.3%. At the same time,
sales of premium products also rose, by 6.1%.
These contrasting trends in buying behaviour
are reflected in the UKCSI. 16.7% of customers
expressed a preference for lowest cost, no frills
service, up by 1.3 percentage points compared
to a year ago
*
. But 31.9% of customers indicated
that they prefer excellent service, even if it
means paying more, up by 2.7 percentage points
compared to January 2022.
1
Source: Kantar. See www.kantar.com/uki/inspiration/fmcg/2022-wp-hint-of-xmas-relief-for-uk-consumers-as-grocery-inflation-dips-for-first-time-in-21-months
*
Customers were asked, to score the balance of price and service they would prefer to accept. A score of 8 -10 implies a preference for excellent service, even if it
costs more. A score of 1 – 3 is interpreted as a preference for low-cost, no-frills service.
*
Note: M &S (food) is the highest rated organisation in the Retail (Food) sector with a UKCSI score of 85.2. M & S is not included in Kantar's research so does not
appear here.
Contrasting buying and service preferences in the Retail (Food) sector
31.9%
16.7%
29.2%
15.4%
% customers who prefer excellent
service, even if it means paying more
% customers who prefer lowest cost,
no frills service
Jan-23 Jan-22
Against a backdrop of rising cost and changing
customer behaviours the relationship between customer
satisfaction and sales performance is complex
Two of the highest rated food retailers for customer satisfaction in the January 2023 UKCSI - Ocado
and Waitrose – each registered a fall in year on year sales in Kantar’s analysis covering the 12 weeks
preceding 27 November 2022. Organisations within 1 point of the UKCSI sector average tended to show
relatively strong sales growth. This was significantly influenced by Aldi and Lidl’s performance but also
reflects increased sales growth for Sainsbury’s, Tesco, Co-op Food and Iceland. The two organisations
that received a UKCSI score at least 1 point below the sector average have experienced contrasting
fortunes in sales performance: Asda’s sales grew by 6.1% but Morrisons’ sales fell by 4.7%.

5150 UK Customer Satisfaction Index | January 2023UK Customer Satisfaction Index | January 2023
Annual sales growth for the 12 weeks to 27 November 2022
A closer examination of organisations’ results gives indicators about the factors impacting customer
satisfaction and sales performance and how organisations are responding to them.
Aldi and Lidl have
continued to grow and
account for a combined
market share of 16.7%
Aldi’s sales increased by 24%, with market
reaching a record 9.3%. In September 2022
Aldi reported a significant increase in its volume
of customers but a drop in profits because of
increased costs associated with suppliers, staff
and Covid-related expenses
2
. These issues may
also have affected customer satisfaction with
Aldi. Over the past 3 years, Aldi’s UKCSI average
score is 82.8, more than 2 points higher than the
sector average. However, in the January 2023
UKCSI, Aldi received a score of 81.0, down by
2.7 points compared to a year ago. Along with
Lidl, Aldi has the highest customer satisfaction in
the Retail (Food) sector for price / cost (8.4 out
of 10) but it has fallen slightly below the sector
average for satisfaction with product / service
range, quality and reliability.
Lidl’s sales rose by 22% to give it a market share
of 7.4%. Over the past 3 years, the average
level of customer satisfaction with Lidl has
been slightly lower than the sector average,
by 0.9 points. But compared to January 2020,
Lidl is one of the most improved organisations
for customer satisfaction in the sector. In the
January 2023 UKCSI Lidl’s customer satisfaction
rating of 81.0 (out of 100) is for the first time
slightly above the Retail (Food) average, 80.5.
Across many of the 26 measures that make
up the UKCSI customer satisfaction with Lidl is
rated around the same level as the Retail (Food)
average but satisfaction with Lidl’s price / cost,
8.4 (out of 10), is 0.6 points higher than the
sector average.
2
Source: Evening Standard 26 September 2022. Accessed at www.standard.co.uk/business/aldi-supermarket-grocer-inflation-b1028072.html
Food retailers with a UKCSI
score at least 1 point
below the sector average
0.7%
Food retailers with a UKCSI
score within + / - 1 point
of the sector average
10.7%
Food retailers with
a UKCSI score at least 1 poin
t
above the sector average
-1.0%

5352 UK Customer Satisfaction Index | January 2023UK Customer Satisfaction Index | January 2023
Protability has been impacted by competitive pricing,
innovation to attract customers at different price
points and rising staff, energy and supplier costs
M & S is the highest rated Retail (Food)
organisation for customer satisfaction, both in the
January 2023 and over the period January 2020 –
January 2023.
Although M & S is not included in Kantar’s
grocery sales and market share analysis, M & S’
statements in November 2022
3
indicate how
the company is managing an environment of
cost and supply chain pressures and changing
customer behaviours. M & S reported that it had
outperformed the market, both for value and
volume, but operating profit had declined. M & S’s
food sales were up 3% but profits fell by 42%: the
company said it had not passed on the full effect
of an 11% increase in supplier costs; and food
waste rose as consumer demand changed through
the summer. By contrast, as Covid-19 conditions
eased, clothing and homewares profits grew
by over a third and sales by 14%, illustrating the
particular challenges of the Retail (Food) market.
Tesco received a UKCSI score of 80.7, down 1.2
points compared to January 2022 but around the
same level as the sector average, 80.5.
Kantar’s research suggests that Tesco’s sales grew
by 3.9% year on year in the 12 weeks preceding
27 November 2022. Tesco’s interim 2022 /
2023 statement emphasised its strategy to offer
competitive prices through price matching and
helping customers to save money by using its
finest range as an attractive alternative to eating
out
4
. Tesco also announced its biggest single year
investment in colleague pay to help employees
deal with the rising cost of living, and ongoing
plans to work with suppliers to mitigate the
effects of inflation.
Customer satisfaction with Asda is 79.1, around
the same level as a year ago (79.3) and 1.4 points
below the sector average.
Kantar reported that Asda’s sales grew ahead of
the sector, up by 6.1%, maintaining its market
share at 14.0%. Asda reported that it has focused
on value initiatives, expanding its Just Essentials
range and holding prices on 250 products. It has
launched an app which enables additional savings
at the point of purchase. Asda also claims to have
launched over 100 new products to appeal to
customers at different price points
5
. Asda’s future
plans include entry to the retail convenience
market through acquisition of 129 convenience
stores and attached petrol stations from Co-op.
Sainsbury’s UKCSI score is 80.9, similar to
January 2022 (when it was 80.5) and slightly
above the sector average, 80.5.
Kantar reported that Sainsbury’s sales increased by
4.3% in the 12 weeks up to 27 November 2022.
Sainsbury’s interim results published in September
2022 highlighted its investment in keeping prices
low to defend market share; innovation, new
product launches and store enhancements; and
increasing colleagues’ pay to support them in
delivering high standards of service
6
.
Morrisons has a UKCSI score of 76.2, down
by 1.1 points compared to January 2022 and
4.3 points below the sector average: this is the
lowest customer satisfaction of any food retailer
in the January 2023.
In Kantar’s analysis, Morrisons sales fell year
on year by 4.7% and its market share by 1
percentage point. Morrisons appears to have
lost market share to the benefit of Aldi and Lidl.
Some analysts also commented that Morrisons
has been particularly exposed to inflationary
pressures because it has its own manufacturing
operations and around half of its food is
produced in-house
7
.
3
Source: The Guardian 9 November 2022. Accessed at www.theguardian.com/business/2022/nov/09/m-and-s-faces-gathering-storm-as-joint-venture-with-ocado-
makes-loss-marks-and-spencer#:~:text=Profits%20at%20M%26S's%20food%20business,demand%20changed%20over%20the%20summer.
4
Source: Tesco Interims announcement 2022 / 23. Published 5 October 2022
5
Source: Asda’s update on its Q3 trading performance. Accessed at https://corporate.asda.com/newsroom/2022/11/11/asda-returns-to-positive-like-for-like-sales-in-
q3-and-steps-up-support-for-customers-affected-by-the-cost-of-living-crisis
6
Source: Sainsbury’s Interim Results for the 28 weeks ended 17 September 2022. Published 3 November 2022
7
Source: FT 28 September 2022. Accessed at www.ft.com/content/228627fa-d701-422d-9ec4-b0d79c5209a4
5554 UK Customer Satisfaction Index | January 2023UK Customer Satisfaction Index | January 2023
Polarisation and diversity
of customer behaviours
are likely to become more
evident in 2023
Whilst many customers seek to reduce their spending and some suffer genuine hardship, there will
also be growth opportunities in both value and premium product range markets. Many customers are
looking to organisations to deliver competitive pricing but it is also clear that customers attach high
priority to quality, a range of appropriate products and in-store experiences.
For Retail (Food) organisations the outlook is very challenging. Cost pressures – especially energy,
transport, packaging, food materials and staff – will continue to be significant. Some analysts believe
that inflation will begin to ease in 2023 but this is likely to be contingent on global weather, harvests,
the situation in Ukraine and the strength of sterling.
What should the Retail (Food) organisation you dealt with improve*?
18.8%
14.0%
12.3%
10.4%
10.3%
9.8%
8.8%
8.8%
7.8%
Availability of product / service
Product / service range
More friendly / helpful staff
Have more staff available
More knowledgeable staff
Better website navigation
Quality of product / service
Easier to contact the right person to help me
Reliability of product / service
Maintaining customer satisfaction, performance and profitability in this environment will require
heightened levels of leadership, employee engagement, risk management and operational delivery.
Organisations will need to review continually their operational processes and collaborative relationships
with suppliers to identify innovation and productivity gains and implement them with agility. Employee
engagement will be critical, not just to retain key people but to develop the skills and capabilities that
generate customer satisfaction and business improvement. Organisations will need to be clear about the
customer segments they are focusing on and carefully track their customers' evolving and diverse needs
and behaviours.
In the Banks and Building Societies the volume of
current account switching has grown in the last year
The latest available data from the Current Account Switching Service
8
dashboard reported 413,885
current account switches between April and September 2022, an increase of 5% on the same period in
2021 and 76% higher than during the first Covid-19 lockdown in 2020.
Volumes of current account switching 2019 - 2022
Oct 19 - March 20 Apri 20 - Sept 20 Oct 20 - March 21 April 21 - Sept 21 Oct 21 - March 22 April 22 - Sept 22
542,626 234,767 327,249 395,345 445,866 413,885
8
See Current Account Switch Service Dashboard Issue 36
When considering the net current account gains for individual banks alongside their customer satisfaction
scores for the corresponding UKCSI report (July 2022), there does not appear to be an obvious link
between levels of customer satisfaction and net current account gains.
Banks and Building Societies receiving a UKCSI score at least 1 point better than the July 2022 sector
average registered an average of 748 net current gains, compared to 754 for organisations whose UKCSI
score was 1 point or more below the sector average. Santander’s UKCSI score was almost the same as the
sector average (0.3 points below) but it suffered the highest rate of net current account losses, - 20,220. It
should be noted that Starling Bank and Monzo, two of the leading performers for customer satisfaction in
the January 2023 UKCSI, both gained substantial numbers of current accounts but are not included in this
analysis because they did not receive sufficient customer responses to appear in the July 2022 UKCSI.
*
Customers were asked to identify the top three things the organisation they dealt with should do, in order to improve its service. The chart shows the number
of times each issue was identified as a priority for improvement. The full list of issues is included in the sector resource pack provided to organisational Institute
members alongside the UKCSI sector report.

5756 UK Customer Satisfaction Index | January 2023UK Customer Satisfaction Index | January 2023
According to the Current Account Switching
Service dashboard, the main reasons cited by
customers for preferring their new account are
online banking (cited by 48% of respondents),
customer service (41%) and ease of using an
organisation’s mobile banking / banking app
(38%). 25% of people preferred their new current
account because it gave a better interest rate.
Nationwide and Natwest may have attracted
customers with the help of incentive offers,
whereas neither Barclays nor TSB were offering
cash incentives to new customers
9
.
From summer 2022, and perhaps in response
to the volume of current account losses,
Santander launched a new cashback incentive
for switching to certain accounts and an increase
on cashback from customers’ electricity and gas
bills. Halifax, HSBC and first direct were also
reported to be offering cash incentives
to new customers.
Customer satisfaction and quarterly current account net gains and losses Customer satisfaction and average current account quarterly net gains
Banks & Building Societies
with UKCSI within 1 point
( +/- ) of sector average
Banks & Building Societies with
a UKCSI at least 1 point above
sector average
Banks & Building Societies
with a UKCSI at least 1 point
below sector average
Net current account gains Net current account losses
748 -20,220 754
Banks & Building Societies average UKCSI July 2022 = 80.3
Nationwide
The Co-operative Bank
Virgin Money
Halifax
NatWest
Lloyds
Barclays
Santander
Bank of Scotland
HSBC*
TSB
RBS
-30,000
-20,000
-10,000
0
10,000
20,000
76 77 79 81 8378 80 82
84
Current Account Net Gains / Losses
UKCSI July 2022
Source: Current Account Switching Service Dashboard Issue 36. Data for organisations covers switches completing 1 April to 30 June 2022
*Note: HSBC switching data includes first direct
9
www.thisismoney.co.uk/money/saving/article-11058907/Switching-current-account-NatWest-Nationwide-winning-battle.html
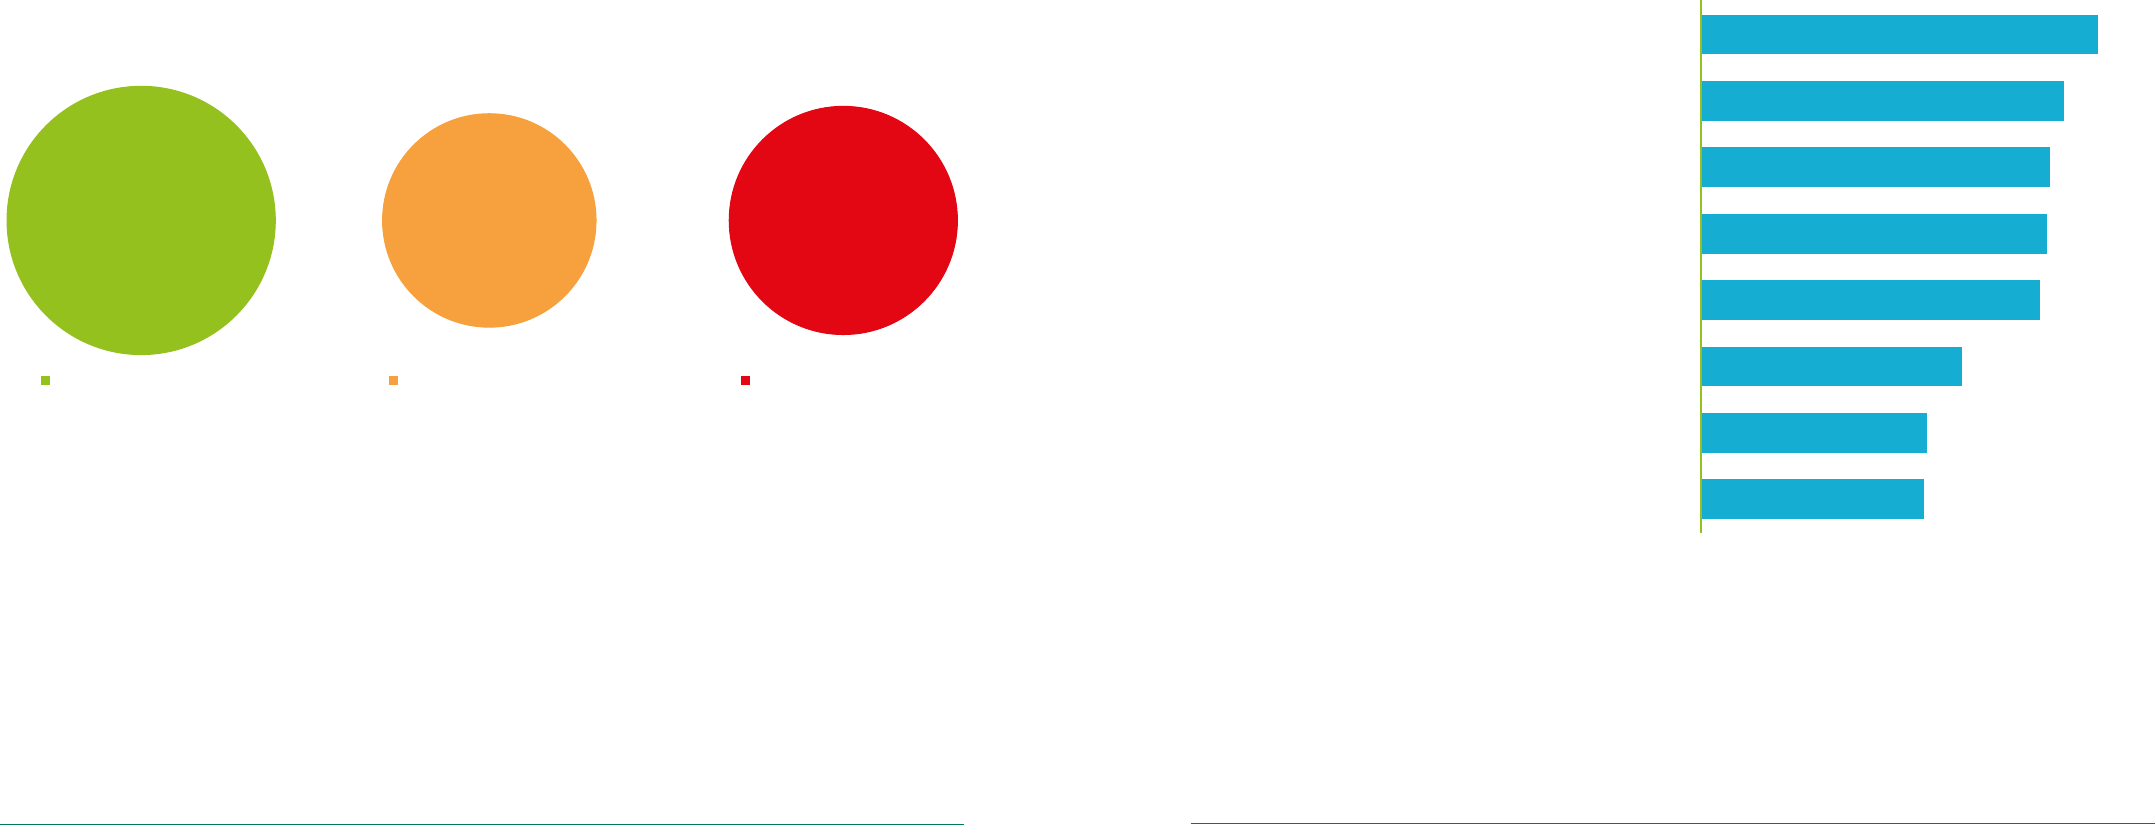
5958 UK Customer Satisfaction Index | January 2023UK Customer Satisfaction Index | January 2023
Across the period 2014 and 2022 there is a link
between customer satisfaction performance and net
current account gains and losses
Customers want banks and building societies to focus
on making it easier to contact the right person to help,
employee skills, knowledge and behaviours and the
quality of digital experiences
Over the longer term, there is compelling evidence of a relationship between customer satisfaction and
net current account gains and losses. The performance of the 12 organisations that have appeared in
both the UKCSI and the Current Account Switching Service Dashboard between 2014 and 2022
10
shows
that organisations averaging a UKCSI score at least 1 point above the sector recorded an average of
240,279 net current account gains, compared to 173,838 net losses for organisations with a UKCSI
score that is 1 point or more below the sector average. The outstanding performer in this respect is
Nationwide. Its UKCSI average score between 2014 and 2022 of 84.0 is 4.8 points above the sector
average over the same period.
Feedback in the January 2023 UKCSI shows that the leading aspects of service that customers believe
their bank or building society should improve are making it easier to contact the right person to help,
staff knowledge, friendliness and helpfulness, better website navigation and greater availability of
branches.
Banks & Building Societies
with UKCSI within 1 point
( +/- ) of sector average
Banks & Building Societies with
a UKCSI at least 1 point above
sector average
240,279 -152,136
Banks & Building Societies
with a UKCSI at least 1 point
below sector average
-173,838
Net current account gains Net current account losses Net current account losses
Net current account gains and losses 2014 - 2022
13.3%
12.2%
11.7%
11.6%
11.4%
8.7%
7.6%
7.5%
Make it easier to contact the right person to help me
More knowledgeable staff
Better website navigation
More friendly / helpful staff
Have more branches/stores available
Better app design
Opening times
Speed of response / resolution
What should your bank or building society improve?*
*
Customers were asked to identify the top three things the organisation they dealt with should do, in order to improve its service. The full list of issues is included in
the sector resource pack provided to organisational Institute members alongside the UKCSI sector report.
10
As cited by Andrew Hagger, personal finance expert at MoneyComms in This is Money, 30 July 2022
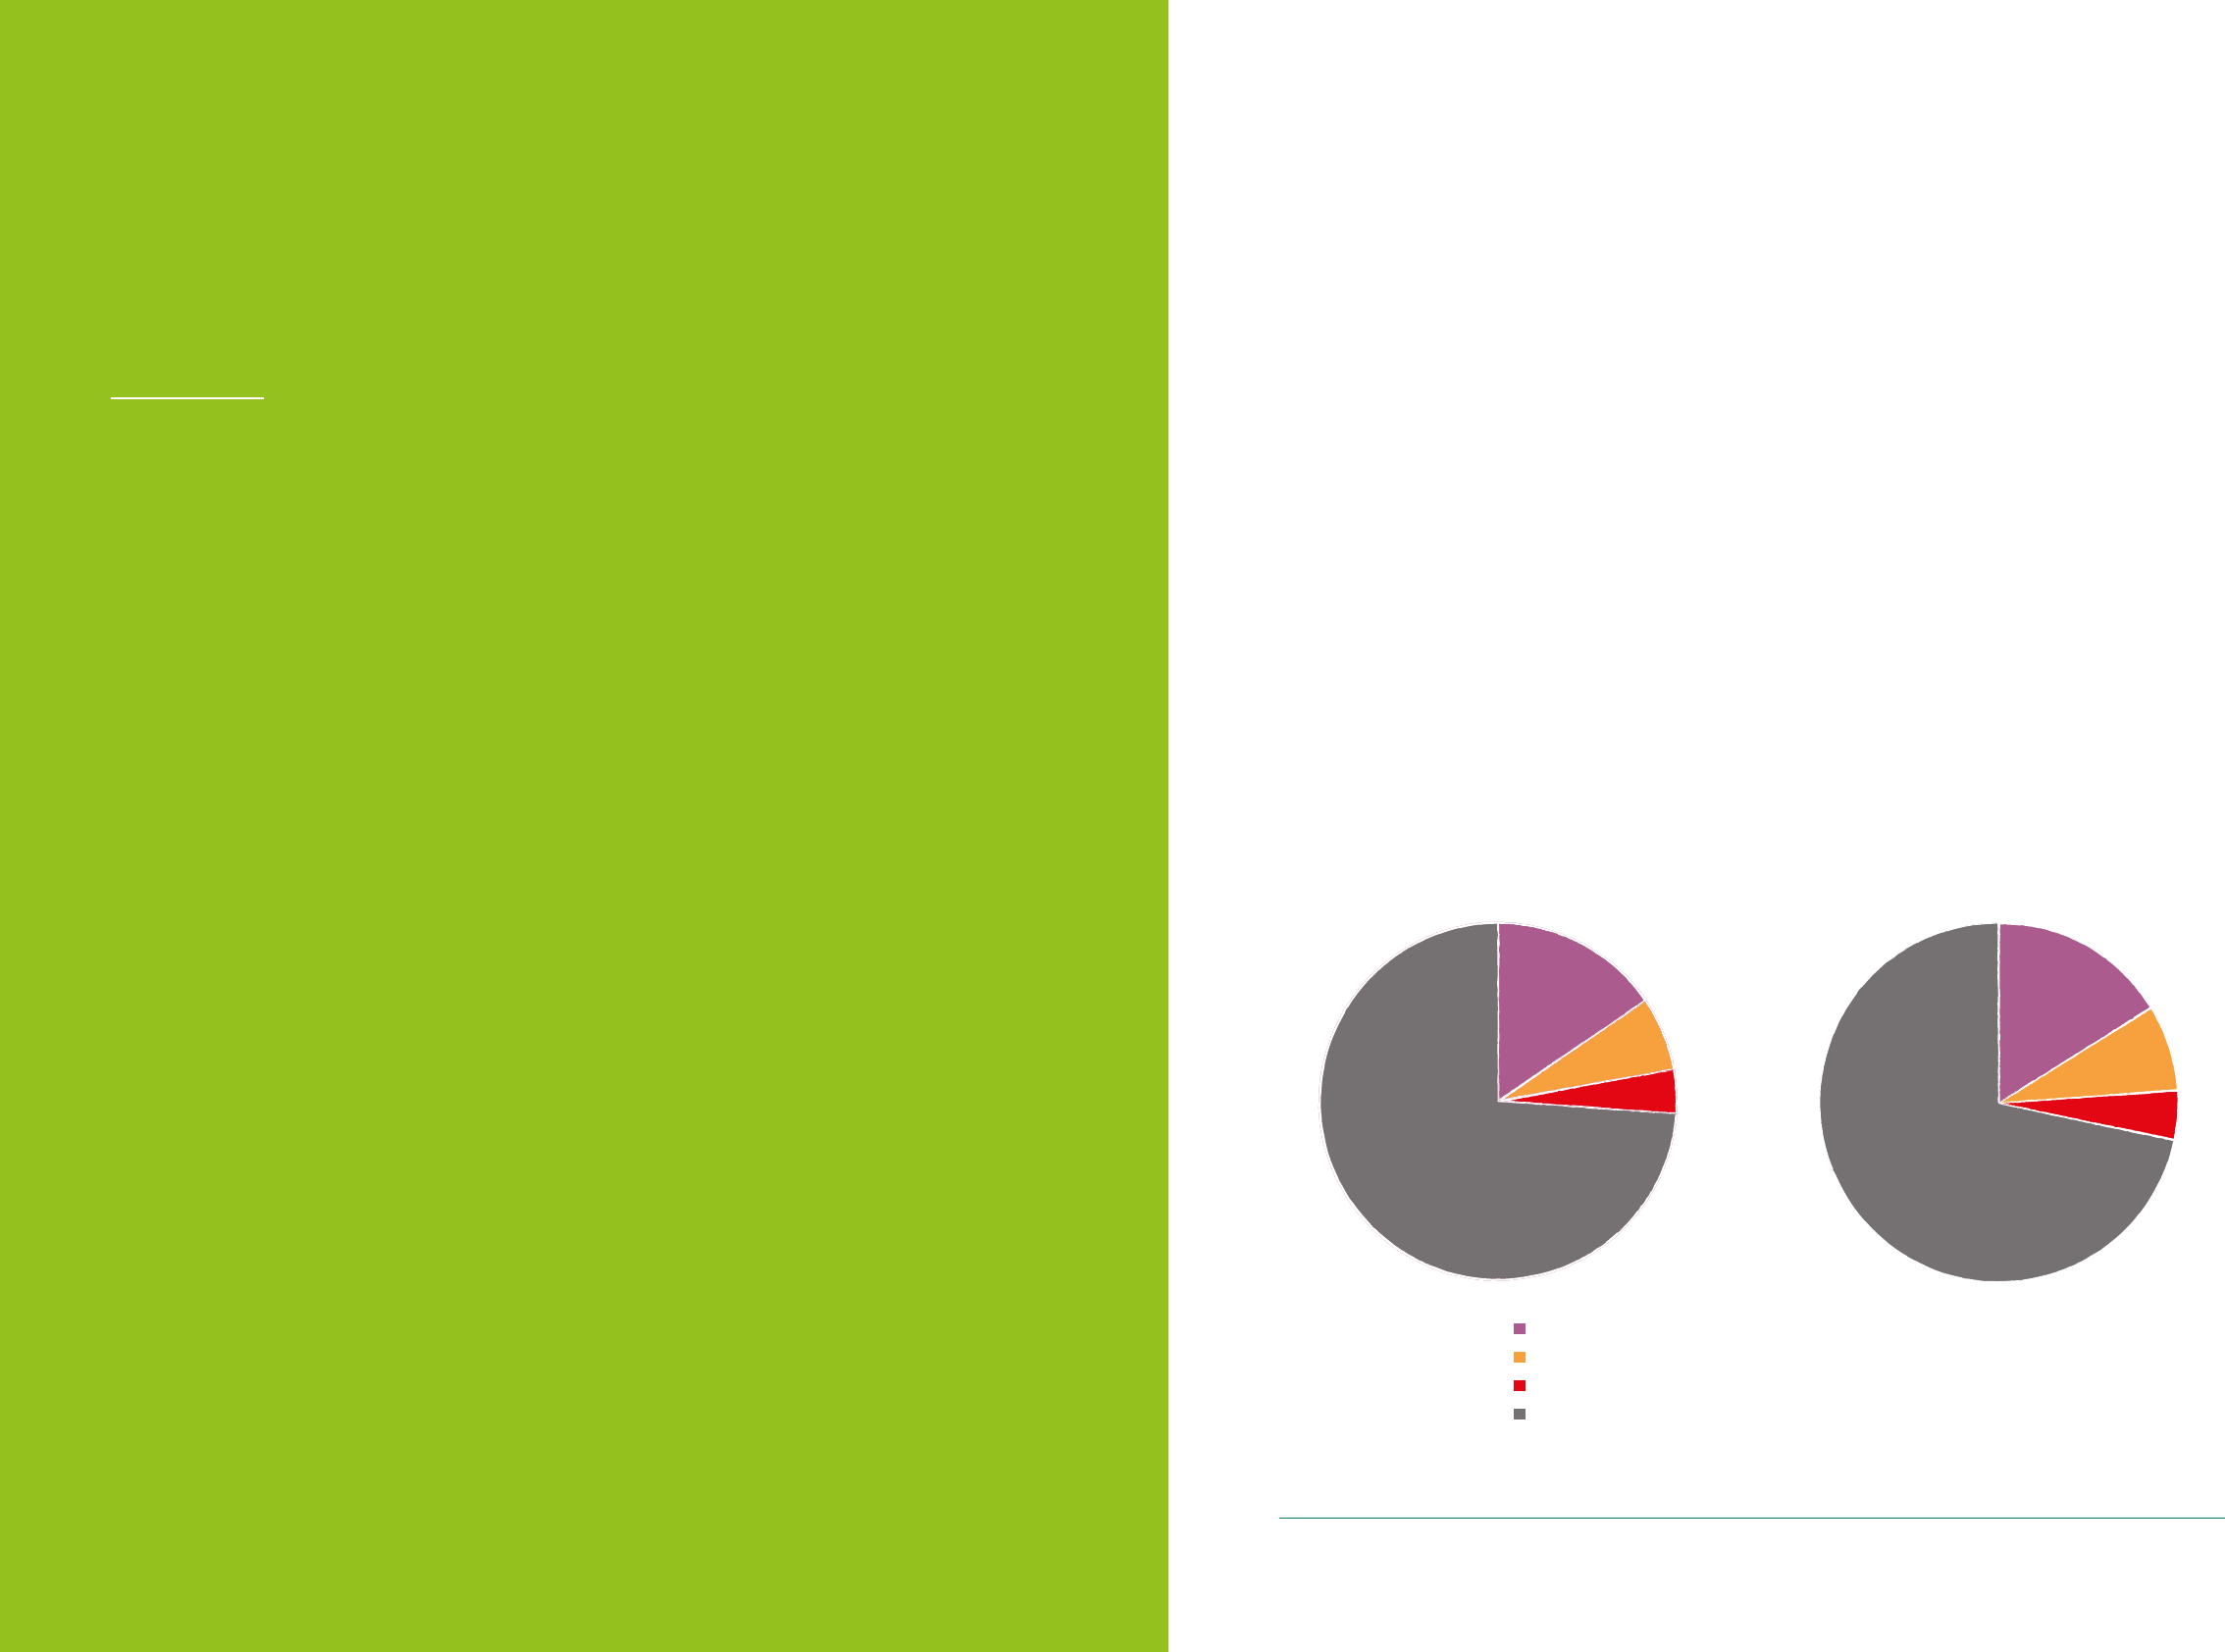
6160 UK Customer Satisfaction Index | January 2023UK Customer Satisfaction Index | January 2023
How the rising
cost of living
is impacting
customer needs
and behaviours
3
The prospect of continued high levels of inflation, higher taxes, falling real incomes and negative GDP
growth mean that 2023 will be challenging and stressful for many individuals, households and organisations.
In this section we examine the impact of the rising cost of living on customer behaviours and needs and
the implications for organisations. Our analysis draws on two sources: extra questions included in the
UKCSI about personal well-being and changes in spending behaviours; and an additional survey of 1,001
customers, conducted alongside the UKCSI, which probes attitudes, behaviours and concerns about
spending and personal debt.
26% of customers described their current well-being as
poor or very poor on at least one dimension of either
nancial, mental or physical health
In recent UKCSI surveys we have asked customers to rate their level of well-being on 3 dimensions –
financial, mental and physical. On each of these dimensions, most customers report their well-being as
very good, good or average. But 26% of customers feel their well-being is poor or very poor on at least
one of the well-being dimensions, similar to the levels reported two years ago, in January 2021.
How would you describe your current
financial, physcial and mental well-being?
How would you describe your current
financial, physical and mental well-being?
How would you describe your current nancial,
physical and mental well-being ?
15.5%
6.7%
4.0%
73.8%
Very poor or poor well-being on 1 of the 3 dimensions
January 2023 January 2021
Very poor or poor well-being on 2 of the the 3 dimensions
Very poor or poor well-being on all 3 dimensions
Other customers
16.4%
7.6%
4.4%
71.7%
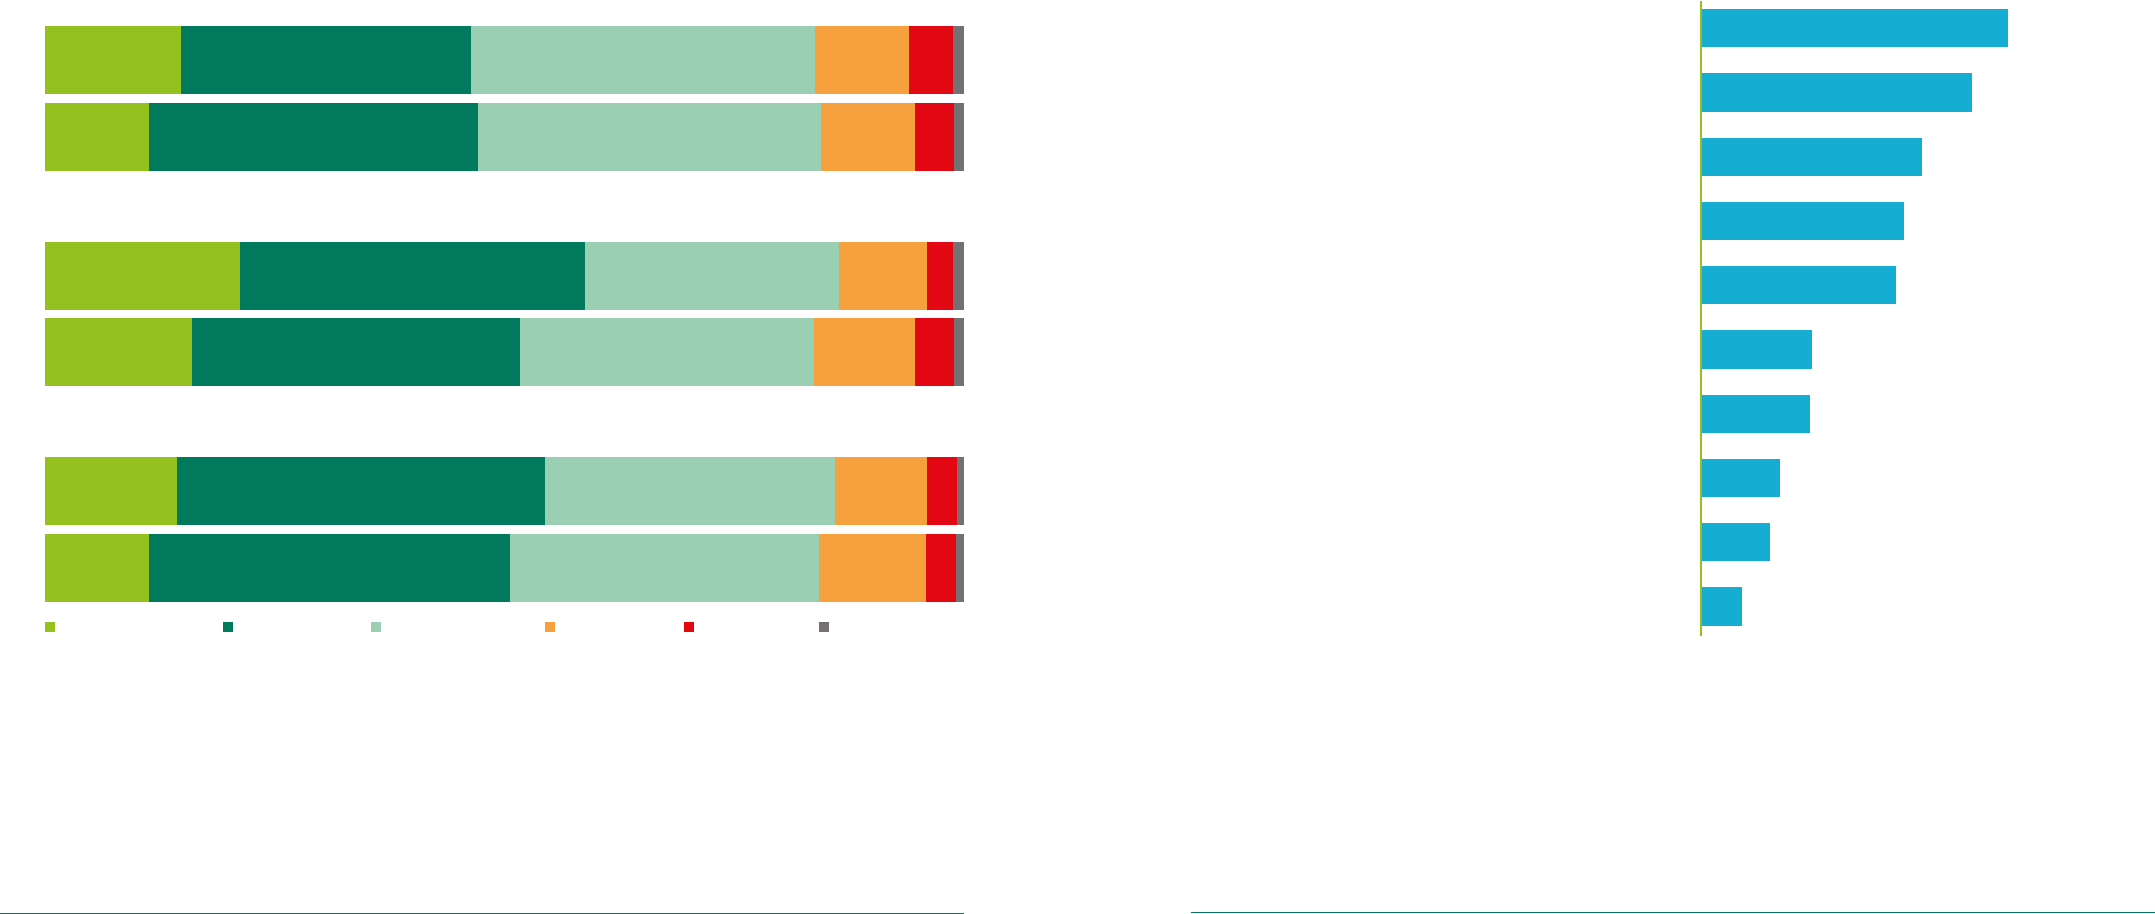
6362 UK Customer Satisfaction Index | January 2023UK Customer Satisfaction Index | January 2023
Compared to January 2021, average levels of mental
well-being appear to have improved but nancial
well-being is at risk
Where each of the dimensions of well-being – financial, mental and physical health – are considered
separately, at least 12% of customers say they are experiencing very poor or poor well-being. Compared
to January 2021, the number of people with low financial well-being has risen slightly, to 15% of
respondents. But the average state of mental well-being appears to have improved: 59% of people
describe their mental well-being as good or very good, compared to 52% in the January 2021 UKCSI.
Many customers' spending behaviour has become
more mindful and cautious
The Institute’s research published in 2022* showed that buying and consumption behaviours have
become more considered and mindful, with significant numbers of customers deliberately buying things
that will last longer, reducing their consumption of physical goods and using local suppliers. The latest
research in the UKCSI suggests that the main ways in which customer behaviours have responded to the
rise in the cost of living are to think more carefully about spending, reduce their level of spending, shop
around more to find the best deals and make fewer impulse purchases.
Very good Good Average Poor Very poor Prefer not to say
Your nancial well-being
14.6% 31.8% 37.5% 10.2% 4.8%
202
3
Jan
202
1
Jan
11.3% 35.9% 37.3% 10.3% 4.2%
Your physical well-being
14.4% 40.1% 31.5% 10.0% 3.2%
Jan
202
3
Jan
202
1
11.3% 39.3% 33.7% 11.7% 3.2%
Your mental well-being
20.9% 38.0% 27.5% 9.5% 3.1%
Jan
202
3
Jan
202
1
16.0% 35.7% 32.1% 10.9% 4.3%
How would you describe your current level of well-being?
24.5%
20.0%
18.3%
17.6%
10.0%
9.8%
7.2%
27.8%
I've thought more carefully about
what I spend money on
I've tried to reduce what I'm spending
- because I have less to spend
I've shopped around more to make
sure I'm getting the best deals
I've tried to reduce what I'm spending
- so that I can save more
I've made fewer impulse purchases
I've bought more online
I've avoided making big expensive purchases
(car, home improvements)
I've chosen to spend money with companies I trust
6.2%
I've chosen to spend money with
local, independent companies
3.8%I've chosen to spend more with ethical companies
How have your spending habits changed in the last 6 months?
*
Customer Behaviours: Evolution or Watershed, Institute of Customer Service, 2022
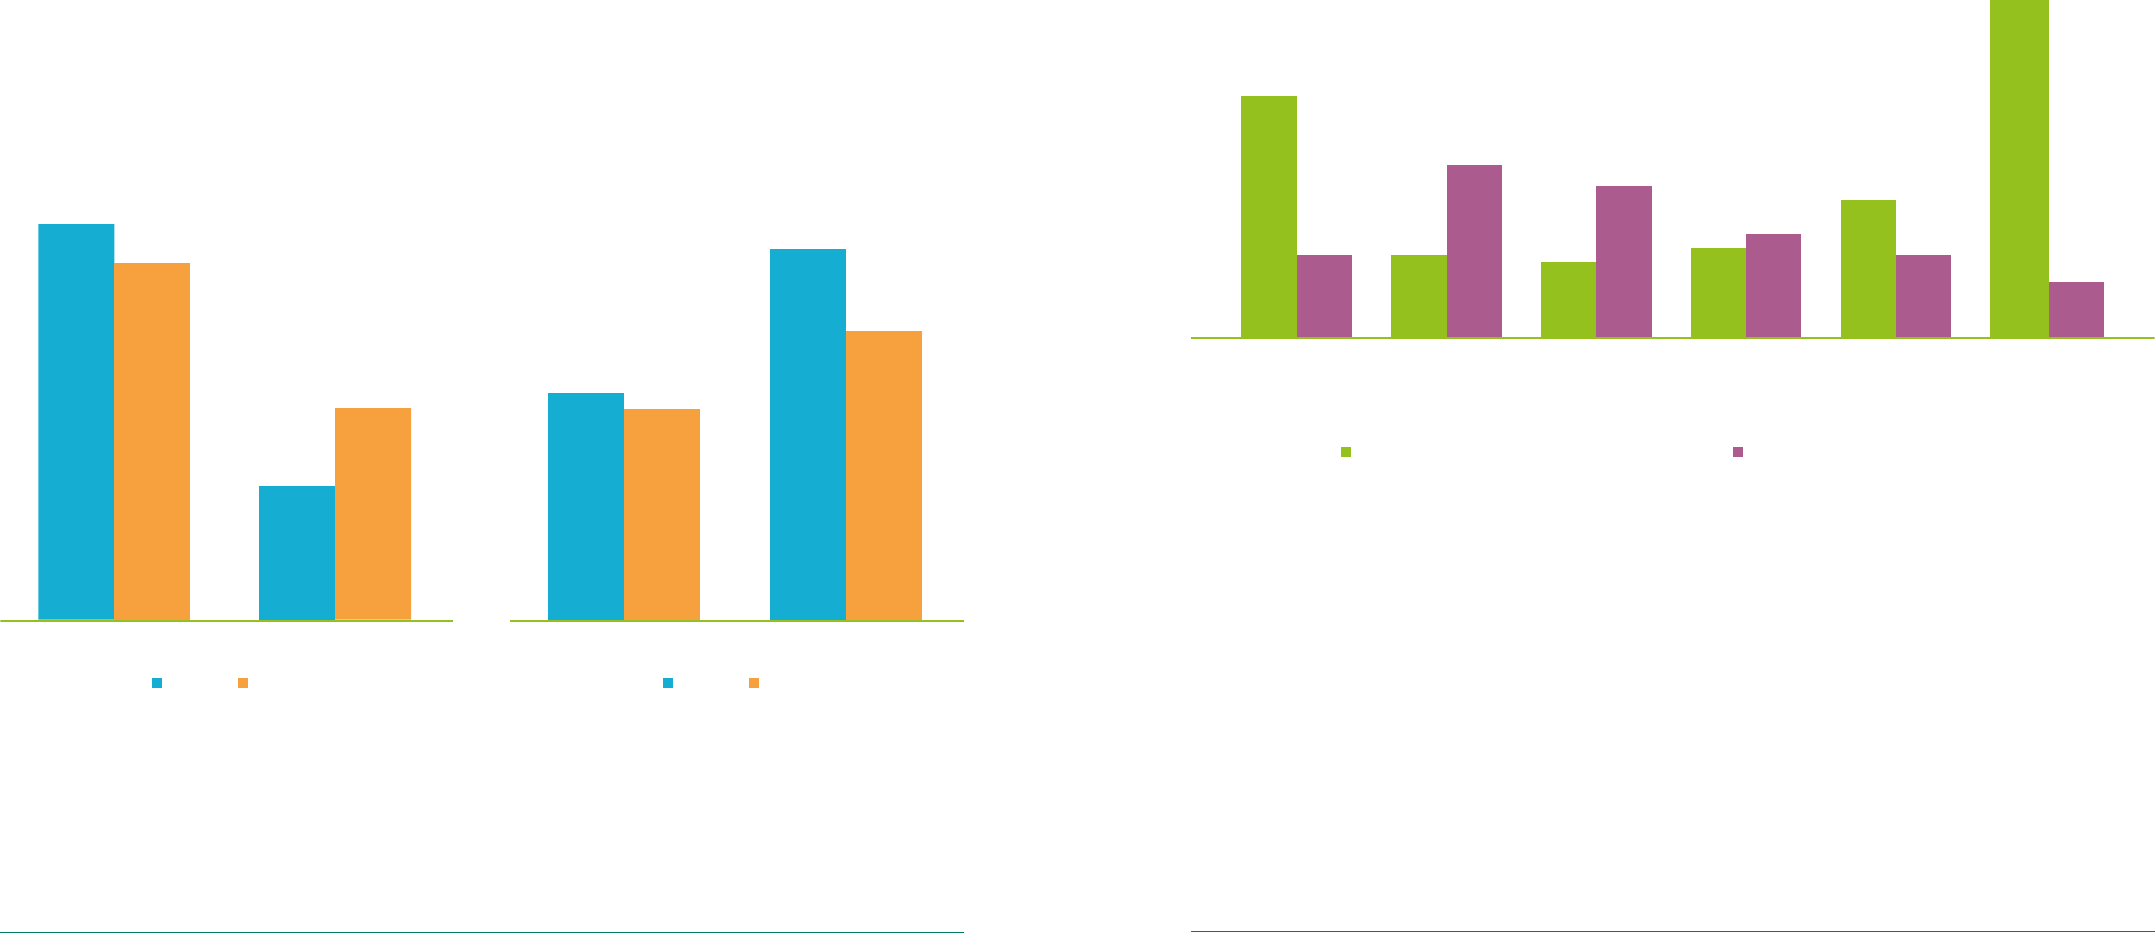
6564 UK Customer Satisfaction Index | January 2023UK Customer Satisfaction Index | January 2023
Despite the growing priority to economise, 34.7%
of customers would be prepared to pay more to
guarantee excellent service*
This level is around the same as a year ago (34%) but is 5 percentage points more than in January 2021.
By contrast, 12.4% of customers would be willing to sacrifice quality of customer service to receive the
lowest possible price, compared to 11.4% a year ago. This increase is most apparent in the Utilities
sector, where 20.2% of customers prefer no-frills, low cost service, up from 15.7% in January 2022.
34.7%
29.6%
34.0%
31.1%
UK all-sector average Utilities
Jan-23 Jan-22
12.4%
20.2%
11.4%
15.7%
UK all-sector average Utilities
Jan-23 Jan-22
% of customers who prefer excellent
service, even if it costs more
% customers who prefer lowest cost,
no-frills service
Service preferences are
often linked to nancial
well-being
The varying service preferences for excellent service, even if costs more, or lowest cost, no-frills service,
are present amongst customers in all income groups but the relative strength of service preferences is
often linked to financial well-being.
34.7%
11.6%
11.0%
12.8%
20.4%
48.9%
12.4%
24.9%
21.5%
14.7%
12.0%
7.6%
All customers Very poor
nancial
well-being
Poor nancial
well-being
Average
nancial
well-being
Good nancial
well-being
Very good
nancial
well-being
% of these customers who prefer
excellent service, even if it costs more
% of these customers who prefer
low-cost, no frills service
Service preferences and financial well-being
Customers who describe their financial well-being as “very good” are much more likely than other
customers to prefer excellent service, even if it means paying more. Customers who feel their financial
well-being is “poor” or “very poor” are more likely than other customers to seek lowest cost, no-frill
service options. This suggests a risk that disparities in service experiences fuel greater inequality and
polarisation across society. As a result, there is likely to be growing pressure from regulators to ensure all
customers experience acceptable levels of care from organisations that provide essential services.
*
Customers were asked, to score the balance of price and service they would prefer to accept. A score of 8 -10 implies a preference for excellent service, even if it costs more. A score of 1 – 3
is interpreted as a preference for low-cost, no-frills service.
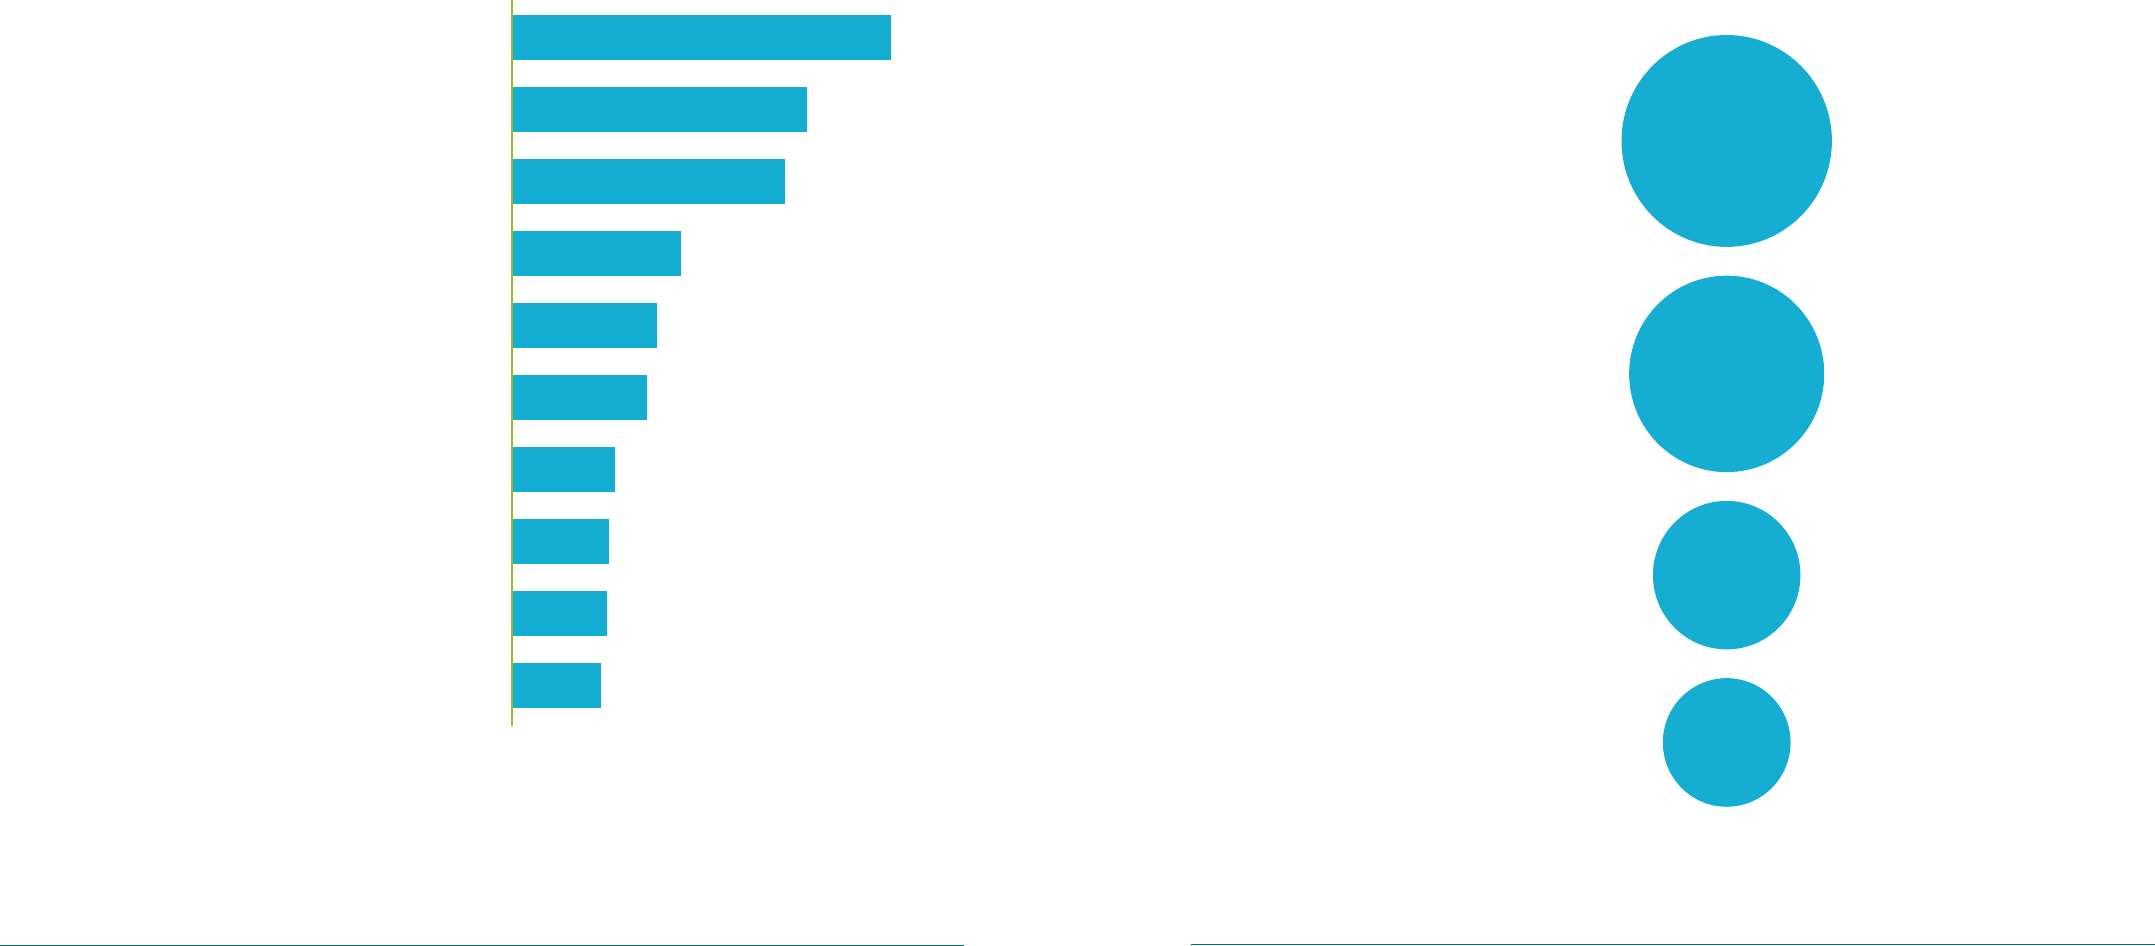
6766 UK Customer Satisfaction Index | January 2023UK Customer Satisfaction Index | January 2023
At least a quarter of customers have sold items, or
cancelled a subscription service or used a third party
“buy now, pay later” service in the last 6 months
Alongside the January 2023 UKCSI, The Institute conducted an additional survey of 1,001 customers to
probe further about attitudes, behaviours and concerns about spending and personal debt.
8%
9%
9%
9%
12%
13%
16%
25%
27%
35%
Chose to use an organisation because they offer more
exible payment options (e.g. pay in instalments)
Spoken to an organisation about agreeing new
terms of more exibility with payments
Used credit to pay for household bills
Applied for an additional credit card
Requested or increased my overdraft
Directly asked an organisation for a discount
on the product or service I was buying
Increased the credit limit on my credit card
Used a third-party company for 'buy now pay later' services
Cancelled a subscription service
Sold items to generate income
Changes in customer behaviour in response to the rising cost of living:
have you done any of the following in the last 6 months?
35% of people have sold items to generate income, often through channels such as eBay or Facebook
Marketplace. This behaviour perhaps reflects growing concern for recycling and sustainability as well
as financial pressures caused by the rising cost of living. 27% have cancelled a subscription service and
25% have used a third party company for “buy now, pay later” services.
29% of customers have increased their access to credit
either by requesting an overdraft, applying for a credit
card, or increasing their credit limit
57% of customers who have increased their credit facility (17% of all customers surveyed) did so in
order to manage everyday household bills and expenses including utilities and food costs. 49% of
people who increased their credit (14% of all customers surveyed) used it for unexpected but essential
expenses, such as a boiler or car repair.
As a % of all
customers surveyed
To manage everyday
household bills and expenses
(e.g. utilities, food bills etc.)
For emergency or
unexpected purchases
(boiler, car expenses etc.)
Home improvements
Leisure
17%
14%
8%
6%
57%
49%
28%
21%
Why have you increased the amount of credit you use?
This question was asked of the 29% of customers
surveyed who have increased their credit by
requesting an overdraft, applying for a credit card,
or increasing their credit limit.
6968 UK Customer Satisfaction Index | January 2023UK Customer Satisfaction Index | January 2023
28% of customers expect to use a credit card to pay for
household bills such as utilities and food: 37% of them
will do so because they have run out of money
Yes
28%
No
59%
Don’t
know
12%
Looking ahead over the next 6 months, do you expect to use a credit card to pay for
household bills such as utilites and food?
The main reasons for using a credit card to pay
for household bills such as utilities and food are
greater flexibility in managing personal finances
and taking advantage of rewards such as
cashback or points.
However, 37% of customers who expect to use
a credit card to pay for utilities and food (11%
of all customers surveyed) will do so because
they have run out of money.
Gives me more exibility
to manage my money
I get rewards such as cash back or
points for using my credit card
I use credit cards when
I run out of money
I prefer to use my credit card
when transacting online
(fraud or security concerns)
As a % of all
customers surveyed
58%
49%
37%
33%
17%
14%
11%
9%
Why do you expect to do use a credit card to pay for household bills
such as utilities and food shopping?
This question was asked if the 28% of customers surveyed who expect to use credit card to pay for
household bills such as utilities and food shipping.

7170 UK Customer Satisfaction Index | January 2023UK Customer Satisfaction Index | January 2023
26% of customers believe
their personal debt will
increase in the next 6
months
8% predict that their personal debt will increase “a lot” and 18% “a little” in the next 6 months.
A similar number, 26%, feel their level of debt will be stable. 13% expect they will have less debt whilst
30% hold no personal debt.
Will decrease a little
Will decrease a lot
Will increase a lot
Will increase a little
Will stay the same
Don't know
Not applicable -
I don't have any debt
8% 18% 26% 10% 3% 5% 30%
How do you think your level of debt will change in the next 6 months?
6% of customers said that their expected level of debt in the next 6 months will mean they cannot
afford essential everyday products and services. 10% feel they will be unable to afford non-essential
products and services whilst a further 27% admit that their expected level of debt causes them “some
concern”. On the other hand, 26% of customers surveyed feel they can manage their debt comfortably.
How do you feel about your level of personal debt (e.g mortage, overdraft, credit card)
Amongst customers who believe their level of debt
will increase in the next 6 months, 72% are concerned
about the impact on their purchasing capacity and
nancial well-being
11% of these customers fear they will be unable to afford everyday essentials and a further 16% will
need to cut back on non-essential items. In addition, 45% of customers whose level of debt is likely to
rise agree that it “gives me some concern".
28% 16% 45% 11%
I can manage comfortably
It means I am not able to afford non-essentials It gives me some concern
It means I am not able to afford everyday essentials
Perspectives of customers who believe their level of debt will increase in the next 6 months:
how do you feel about your level of personal debt (e.g. mortgage, overdraft, credit card)?
As well as asking about changing personal finances and debt, the survey of 1,001 customers conducted
alongside the UKCSI asked customers if they have approached, or been contacted by organisations,
about help or advice to manage the rising the cost of living.
Prefer not to say
30%26% 10% 27% 6% 1%
I don't have any debt
I can manage comfortably
It means I am not able to afford non-essentials
It gives me some concern
It means I am not able to afford everyday essentials
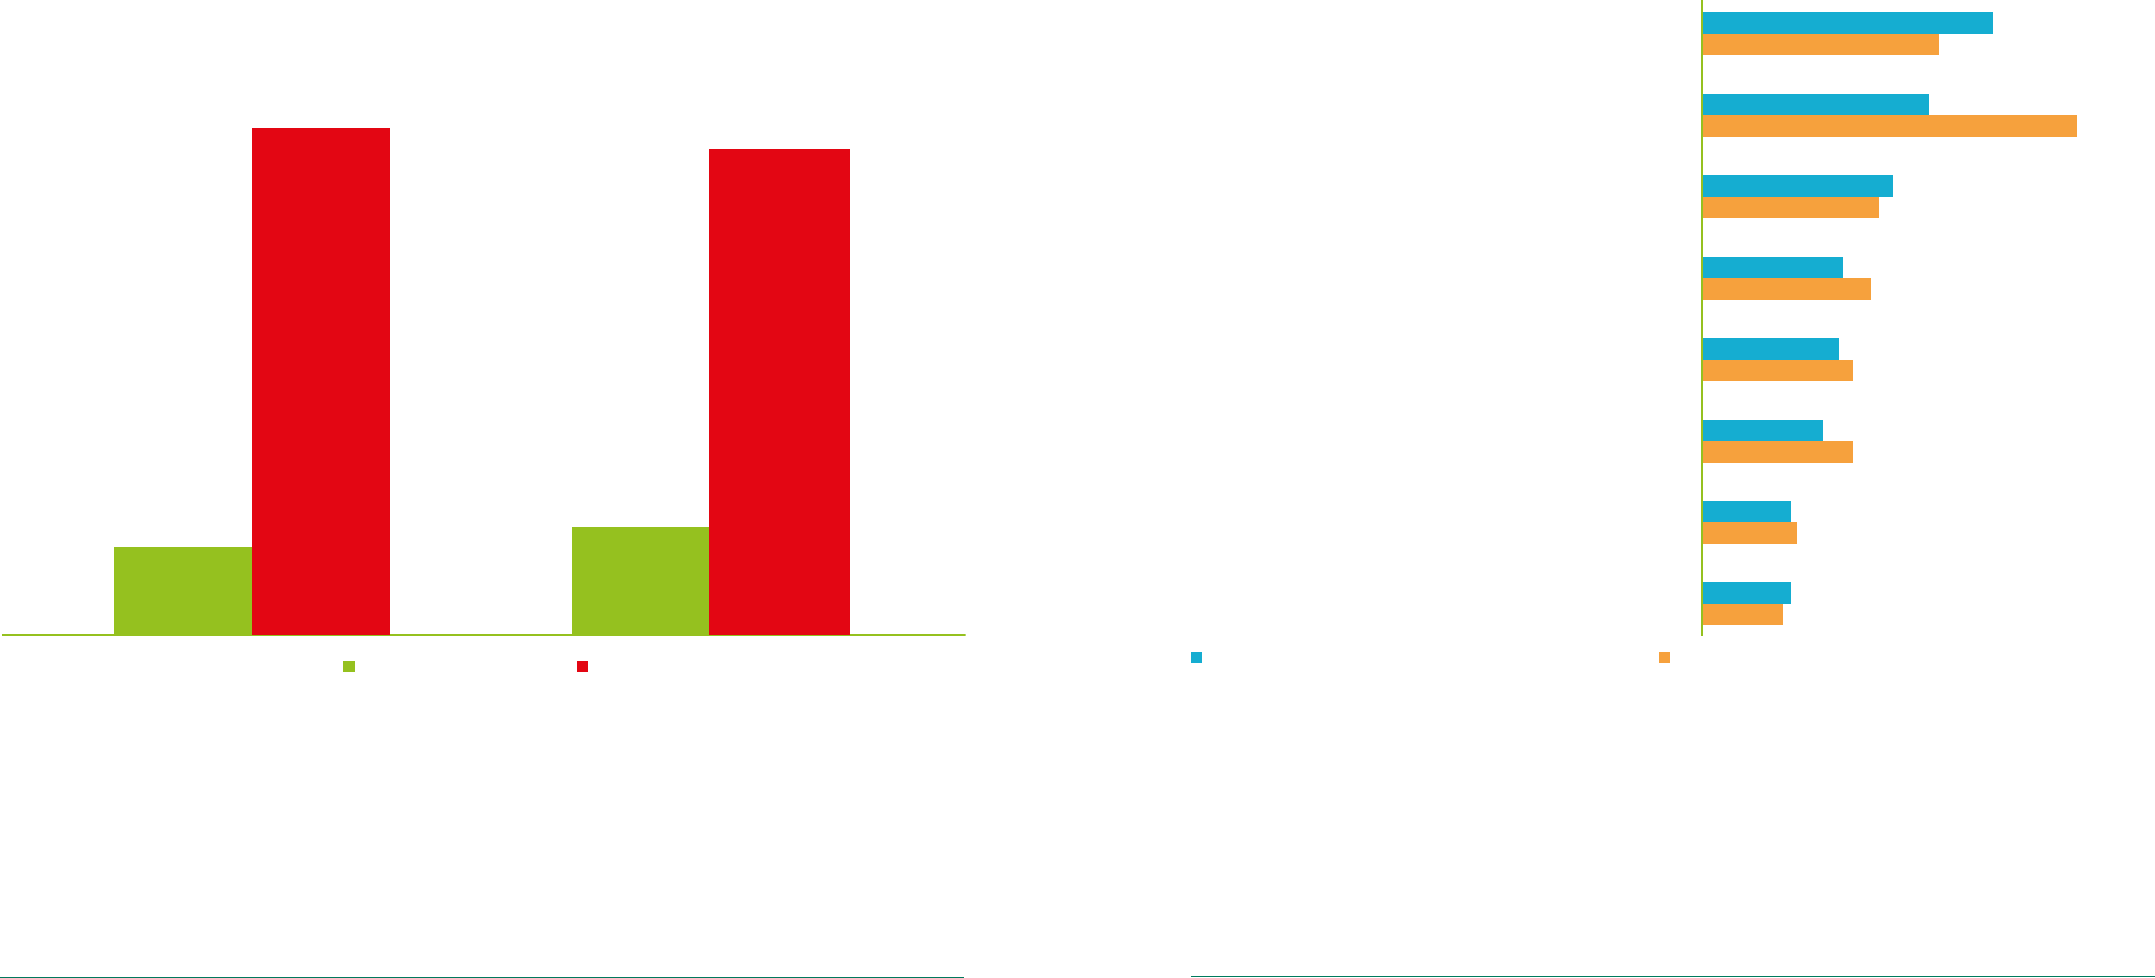
7372 UK Customer Satisfaction Index | January 2023UK Customer Satisfaction Index | January 2023
15% of all customers surveyed have directly asked a
company for help or advice to deal with the rising cost
of living. 18% have been approached by a company
offering help and advice for the same reason
Yes No
15%
85%
18%
82%
Have you directly asked a company for help
and/or advice to help you deal with the
rising cost of living?
Has a company proactively approached
you to give help or advice to deal
with the cost of living?
The leading types of assistance given by companies are advice on using products and services more
efficiently, discounts and flexible payment options. Companies tend to be more likely to offer advice
about using products and service more efficiently than they are to offer other kinds of advice related
to cost savings.
8%
6%
5%
4%
4%
3%
2%
2%
7%
11%
5%
5%
4%
4%
3%
2%
Discount on products/services that are important to me
Advice about how to use their
products/services more efciently
Flexibility over payment options
Advice about how to make my overall
household budget go further
Information about different price options
for their products and services
Information about other organisations that can
help people deal with the cost of living
More understanding of my personal situation
Special offers to help me save money
I asked a company for help and advice about this
A company approached me to give help or advice about this
Help and advice given by companies to manage the cost of living
(As a % of all 1,001 customers surveyed in an additional survey conducted alongside the UKCSI)
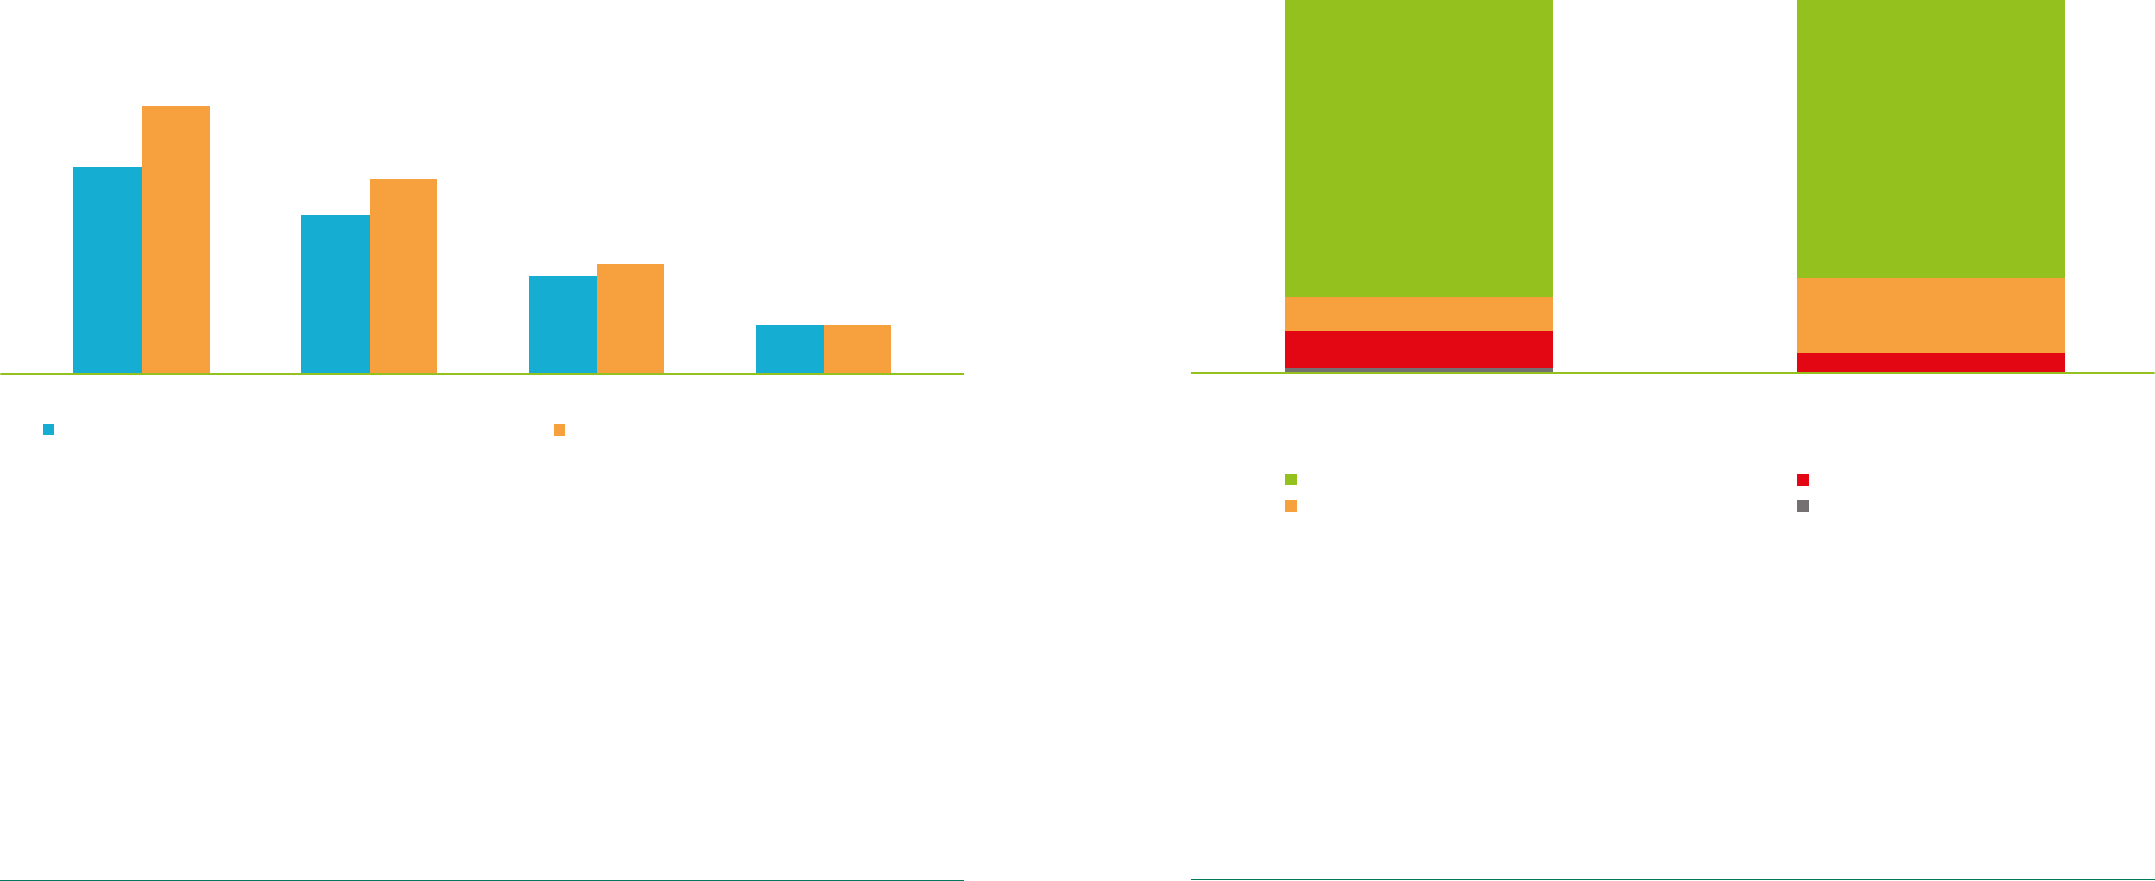
7574 UK Customer Satisfaction Index | January 2023UK Customer Satisfaction Index | January 2023
Customers are more likely to have made or received contact about help with rising living costs from
a Utilities company than from a company in the Telecommunications and Media, Retail (Non-food) or
Travel sectors.
% customers asked a company in this
sector for help to deal with the cost of living
% of customers who have been approached
by a company in this sector with help or
advice to deal with the cost of living
8%
6%
4%
2%
10%
7%
4%
2%
Utilities Telecoms Retail - non food Travel
Customers who have asked a company for help, or been proactively approached by a
company, to help manage the cost of living
8% of customers said they have asked a Utilities company for help or advice to deal with the rising cost
of living and 10% have been approached by one of their Utilities providers offering help and advice.
However, this suggests that 90% of customers have not received any contact from a Utilities company
offering help or advice about the rising cost of living. It is of course possible that some customers
have missed or forgotten communications they have received from an organisation. Nevertheless,
this evidence suggests that many organisations will need to make a more focused and sustained
engagement effort if they genuinely want to help their customers manage rising living costs.
80% of customers who asked a company for help to
manage the cost of living said that, as a result of their
contact, their trust in that company had increased
Similarly, 75% of people who have been contacted by a company offering help or advice affirmed that
their level of trust in that organisation has risen.
10%
1%
5%
9% 20%
80%
75%
I asked a company for help and advice to
manage the cost of living
A company approached me to give help or
advice to manage the cost of living
I trust them more
Did not change the way I feel about the organisation
I haven't received a response yet
I trust them less
Impact of companies giving customers help or advice to manage the cost of living

7776 UK Customer Satisfaction Index | January 2023UK Customer Satisfaction Index | January 2023
Most customers believe regulators, government and
companies need to do more to help alleviate the
impact of the rising cost of living
Our survey about customers’ attitudes and
behaviours in the context of the rising cost of
living concludes by asking what actions are
necessary to provide appropriate support for
customers.
70% of customers strongly agree that regulators
should limit the amount companies can
charge for essential services and 64% say that
government should provide more financial
support to customers in need.
More than 60% of people believe that
companies should hold prices for essential
products and services, be proactive in giving
advice to help customers make savings and
reduce costs in their business operations. In
addition, 66% of respondents strongly agree
that shareholders and investors should be
prepared to accept lower profits.
70%
66%
66%
64%
62%
61%
58%
43%
31%
Regulators should limit the amount that companies
are allowed to charge for essential services
Shareholders and investors should be
prepared to accept lower prots
Companies should hold prices for
essential products and services
Government should provide extra
nancial support for people in need
Companies should be proactive in giving information and advice
about how customers can make savings on what they spend
Companies should make savings in their business
operations so they can minimise the need to increase prices
Companies should operate low tariffs a social tariff on
essential services for people who are struggling nancially
Customers should be allowed to defer payment on
essential services, which they will repay at a later date
Customers who can afford to, should pay a bit
more for essential products and services
Customers' perspectives on how organisations should
support customers during the cost of living crisis
Key takeouts: customer
attitudes and behaviours
in the context of the
rising cost of living
• There is a polarisation in customers’
sentiment about their financial well-being:
15% of people describe their financial well-
being as poor or very poor; 46.4% say it is
very good or good; and 37.5% of people
describe their financial well-being as average
• The main ways that customer behaviours
have responded to the rise in the cost of
living are to think more carefully about
spending, reduce their level of spending,
shop around more to find the best deals and
make fewer impulse purchases
• Reflecting the growing concern for recycling
and sustainability, as well as financial
pressures, 35% of customers have sold items
to generate income in the last 6 months
• A t least a quarter of customers have sold
items, or cancelled a subscription service or
used a third party “buy now, pay later”
service to deal with the rising cost of living
• 26% of customers believe their personal debt
will increase in the next 6 months. 72% of
these customers are concerned about the
impact this will have on their purchasing
capacity and financial well-being
• 15% of customers surveyed have directly
asked a company for help or advice to deal
with the rising cost of living. 80% of these
customers said that, as a result of their
contact, their trust in that company had
increased
• 18% have been approached by a company
offering help and advice to deal with the
rising cost of living. 75% of these customers
said that, as a result of their contact, their
trust in that company had increased
• The leading types of assistance given by
companies are advice on using products
and services more efficiently, discounts and
flexible payment options
• 70% of customers strongly agree that
regulators should limit the amount companies
can charge for essential services
• 66% strongly agree that shareholders and
investors should be prepared to accept lower
profits
• More than 60% of people believe that
companies should hold prices for essential
products and services, be proactive in giving
advice to help customers make savings and
reduce costs in their business operations.
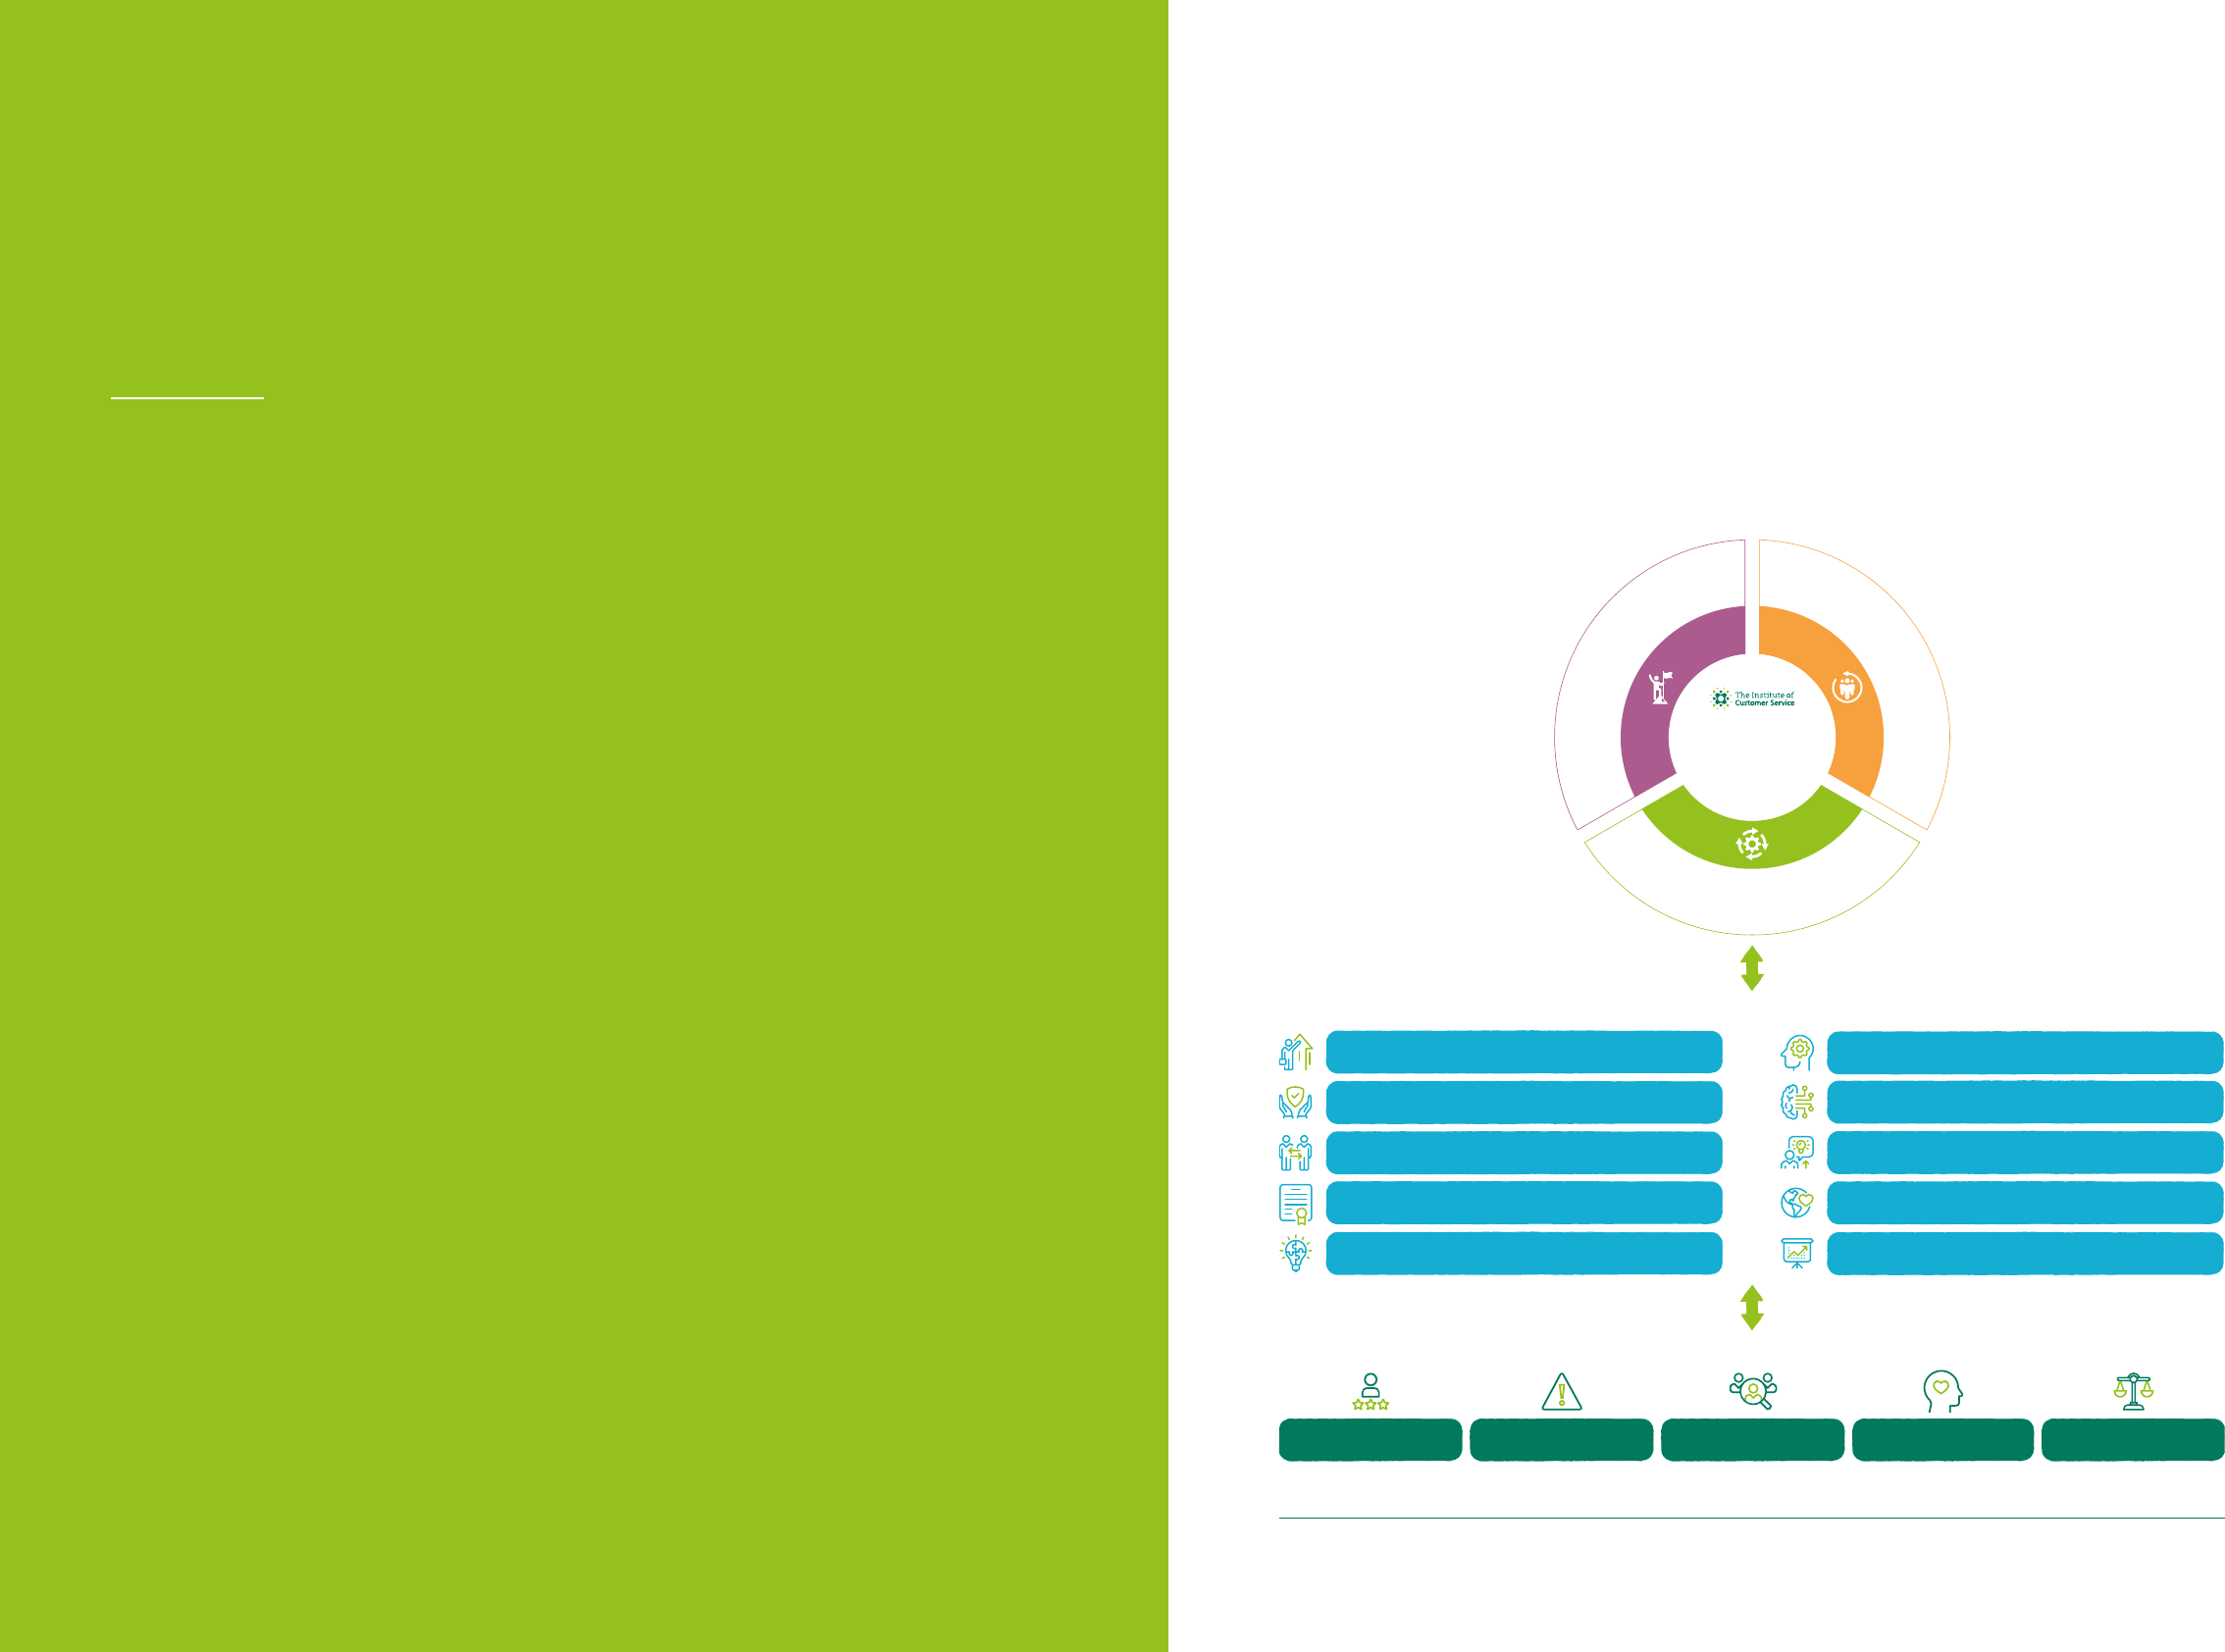
7978 UK Customer Satisfaction Index | January 2023UK Customer Satisfaction Index | January 2023
Recommendations:
building a culture
of service excellence
4
Competence, reliability and dependability
Leadership, purpose and a long-term focus
Proactive customer engagement
Governance
Innovation and agility
Developing the right blend of technology and people
Employee skills, behaviours and engagement
Using insight to improve customer experience
A positive impact on society
Measuring the right things
Experience Complaint Handling Customer Ethos Emotional ConnectionEthics
The Service Experience Model
The Service Experience Model
Enablers of a Service Culture
Enablers of a Service Culture
UKCSI Dimension of Customer Satisfaction
UKCSI Dimension of Customer Satisfaction
S
t
r
a
t
e
g
y
&
L
e
a
d
e
r
s
h
i
p
O
p
e
r
a
t
i
o
n
a
l
D
e
l
i
v
e
r
y
C
u
l
t
u
r
e
&
E
n
g
a
g
e
d
P
e
o
p
l
e
Reputation
Performance
Growth
Protability
Trust
Building a culture
of service excellence
Our research, and engagement with organisations and leaders, suggests that customer service and
business performance outcomes are more the product of organisational culture than of specific activities
or investments. The January 2023 UKCSI concludes by highlighting recommendations to develop the key
enablers of a culture of service excellence.

8180 UK Customer Satisfaction Index | January 2023UK Customer Satisfaction Index | January 2023
1) Leadership, purpose and a
long-term focus
Leadership, organisational purpose and
maintaining a long-term focus are essential
elements of a customer service culture.
In a customer service context, purpose means
being clear about why the organisation exists,
which customers it serves, the value the
organisation creates for its customers and the
difference it makes: an organisation’s purpose
needs to be clear, relevant, engaging and
authentic. Organisations that have defined and
demonstrate a clear purpose are more likely to
generate high levels of employee engagement,
productivity, trust and customer satisfaction
leading to long-term success. Purpose is
especially important in challenging circumstances
in which organisations need to make difficult
decisions about priorities and where to focus.
A clear purpose that is understood across the
organisation can help leaders in aligning people,
stakeholders and resources to respond effectively
to disruptive change.
Realising the financial benefits of superior
customer satisfaction requires consistency and a
long-term focus. Organisations that consistently
earn higher levels of satisfaction than others
in their sector also tend to achieve stronger
levels of ebitda and revenue per employee. An
organisation’s customer experience therefore
needs to be seen as an asset and a source of
value, rather than just as a cost centre.
Leaders set the tone for their organisation,
influencing how managers and employees
interpret the organisation’s purpose and strategy,
short and long-term priorities and the level of
focus on customer service. Recent research from
The Institute* suggests that leaders need a broad
and heightened range of skills, knowledge and
behaviours to understand the challenges their
organisations face and engage effectively with
customers, employees, shareholders and other
stakeholders.
* See Work with a Purpose: building a shared vision of the future (2021)
Key recommendations for
leaders and organisations
• Articulate an organisational purpose that is
clear, relevant, engaging and authentic - for
customers and employees
• Define a clear strategy and customer
service objectives and ensure they are
communicated across the organisation
• Align different parts of your organisation,
and suppliers and partners to deliver the
organisation’s purpose
• Give appropriate weight to customers’
interests in investment decisions
• Set clear accountability for customer service,
with specific customer objectives and
incentives for leaders across the organisation
• Measure, benchmark and report on
customer satisfaction across key elements of
the customer experience
• Use customer insight to inform strategy
development
• Recruit leaders who demonstrate honesty,
trustworthiness and integrity
Key behaviours for leaders
• Demonstrate empathy and emotional
connection with a diverse range of
employees
• Ability to engage and communicate
effectively across a range of channels and
settings
• Trust employees to deliver and hold them to
account for performance and outcomes
• Build knowledge and awareness of the
impact of emerging technologies
• Communicate honestly with employees
about the impact of emerging technologies
and complex environmental factors on the
organisation’s strategy, customer experience
and jobs

8382 UK Customer Satisfaction Index | January 2023UK Customer Satisfaction Index | January 2023
2) Employee skills,
behaviours and
engagement
Skilled and engaged employees are central to
delivering excellent service. Notwithstanding the
growth in digital customer experiences, around
half of the customer experiences recorded in
the UKCSI are conducted in person or over
the phone. In addition, employees are also
centrally involved in many email, webchat or
messaging customer experiences. The growth
in automation and digitisation of simple or
routine transactions means that customers’
experiences with employees are increasingly
concerned with complex or sensitive issues,
requiring enhanced levels of communication,
problem-solving, technical or commercial
skills. Employees with expertise in specialist
technical roles require relationship management
skills to work effectively with customers and
colleagues. New hybrid roles have emerged
that combine customer experience, relationship
management, insight, commercial awareness
and technical skills. In a customer service
context, line managers or team leaders coaching
have a particularly significant role in coaching
the behaviours and competences that enable
consistently high levels of service.
Employees’ empathy and communication
skills are crucial in responding sensitively to a
customer’s personal situation and context. It is
also important that an organisation’s policies
and processes are responsive to customers'
individual circumstances and that employees
are empowered to demonstrate flexibility and
discretion where appropriate.
Key skills and capabilities
• Enhanced communication and relationship
management skills
• Problem solving, managing complex issues
• Ability to engage with customers across
different channels
• Complaint handling and resolution of
complex issues
• Managing and coaching teams and individuals
• Ability to use digital tools and applications
effectively and coach customers to use them
• Design of digital applications that enable
better customer experiences
• Design of customer experience journeys in
an omnichannel context
• Specialist technical skills, for example in
infrastructure maintenance, cybersecurity,
risk management and logistics
Key behaviours
• Empathy, emotional intelligence, the ability
to make a personal connection
• A commitment to the organisation’s values
• Personal resilience and effectiveness
• Trustworthiness
• Capacity to broaden skills and learn
• Collaboration and commitment to others

8584 UK Customer Satisfaction Index | January 2023UK Customer Satisfaction Index | January 2023
Key actions to develop
employee engagement
• Ensure all employees understand the
organisation’s purpose and their role in
delivering it
• Support employees in developing their
career through access to professional
development pathways including training
and qualifications
• Focus on developing the skills and
capabilities of first line managers
• Enable regular, authentic and relevant
communication between senior leaders and
employees
• Provide opportunities for employees to have
a say on issues that affect them
• Recognise outstanding contribution and
performance, especially for employees in
frontline service roles
Key actions to promote
employee well-being
• Explore greater flexibility and personalisation
of employee benefits, whilst maintaining
fairness for all
• Ensure that hybrid working arrangements
consider the needs of all employees
• Ensure employees are aware of available
support for mental health and well-being
including information resources and
counselling
• Encourage managers to carry out regular
well-being check-ins with employees, as well
as reviewing performance and development
• Develop a consistent policy and approach to
dealing with hostile customer behaviour
• Record and measure examples of anti-social
or threatening customer behaviour
For most organisations, existing employees will be the key source of required skills and capabilities,
especially in a tight employment market. This means that the quality of training and development,
employee induction, engagement and well-being are essential enablers of a service culture.
Measure employee engagement, publicise the results
and take appropriate actions based on employee feedback
3) Competence, reliability
and dependability
Competence, reliability and dependability – the
ability consistently to deliver the organisation’s
customer proposition – are the cornerstones
of customer satisfaction and trust. Getting
things right first time is one of the most obvious
but important ways of improving customer
satisfaction, reducing problems and rework.
Organisations’ ability to deliver consistently
has been stretched by skills shortages, supply
chain disruption, rising costs and in some
cases industrial action. Achieving consistency
and quality of performance often relies on
relationships with suppliers and partners,
anticipation and management of risks, as well as
the organisation’s core capabilities and resources.
Key recommendations
for organisations
• Define the core capabilities required
to deliver the organisation’s customer
proposition
• Measure consistency in quality and
performance of products and services
• Define the customer journey for key
experiences and measure how well it is
delivered
• Deliver consistency of experience across
different channels
• Be transparent about product and service
capabilities, pricing, terms and conditions
• Select suppliers and partners that share and
support the organisation’s customer ethos
• Identify the root causes of problems and
issues and develop plans to address them
• Ensure all service channels are appropriately
resourced
• Regularly review strategic and operational
risks and vulnerabilities

8786 UK Customer Satisfaction Index | January 2023UK Customer Satisfaction Index | January 2023
4) Developing the right
blend of technology
and people
Digital experiences and artificial intelligence have
become more important to customer service.
Even though many sectors have seen a revival of
in person customer service, the number of digital
customer experiences is usually more than it was
before the onset of Covid-19.
Customers’ expectations of the quality of
organisations’ digital customer experience have
increased. But customers often express a need
to speak to a customer service employee for
issues that are complex, sensitive, urgent or have
a high personal importance. Customer feedback
in the UKCSI invariably cites “making it easy
to contact the right person to help me” as the
leading issue organisations should improve. For
many customers, their biggest fear when dealing
with an organisation is the inability to speak to a
person when it is needed.
Technology can enable significant benefits
in business performance, cost savings and
customer experience, especially in back office
processes, analytics and routine transactions.
But there is a risk that organisations sometimes
overestimate the capacity of digital technologies
to deal effectively with the variety of customer
experiences and personal situations. Technology
deployment in a service context is usually most
successful when it is underpinned by a clear
customer service purpose and complements,
rather than replaces, human intervention.
The Institute’s research* has shown that a
significant minority of customers are at risk
of digital exclusion because they lack skills,
confidence, financial resources or have a
disability or health condition that makes it
difficult to deal with organisations using
technology or digital channels. Organisations
that deliver essential services have a particular
responsibility to consider the needs of vulnerable
people and ensure that all their customers can
access service in appropriate ways.
* See A Connected World ? Ensuring the right blend of people and technology for customer service, Institute of Customer Service, 2022
Key recommendations
for organisations
• Define the customer experience benefits and
impact of technology deployment
• Focus on the quality of the customer
experience design and journey: map
hand-offs or transfers between channels,
especially between digital channels and
direct employee intervention
• Test and learn: continuously review customer
journey design and decision trees to identify
issues, or opportunities to simplify and
improve experiences
• Involve customers in testing of technologies
and applications
• Train and encourage employees to coach
customers in adoption of new applications
• Ensure customers can easily speak to a
customer service adviser in situations
that have a high personal importance or
sensitivity
• Integrate systems and data to support
customer experience objectives
• Evaluate the ethical and reputational
implications of technology deployment
Actions to address the risk
of digital exclusion
• Design and test customer experience
journeys explicitly taking into account
the needs of vulnerable people and
customers who have limited access to digital
technologies
• Maintain a range of channel options
including contact centre operations and
where relevant a physical branch / office
presence
• Develop specialist knowledge and expertise
to support vulnerable customers
• Identify customers who are at risk of
vulnerability or exclusion
• Work with specialist third parties to improve
customer service for vulnerable people
• Develop processes for authorisation of
trusted third parties to act on behalf of
a vulnerable customer
• Create or participate in digital outreach
programmes to increase the skills and
confidence of customers who may be at risk
of digital exclusion

8988 UK Customer Satisfaction Index | January 2023UK Customer Satisfaction Index | January 2023
5) Proactive customer
engagement
In the next year, it is likely that more customers
will experience financial challenges and will
require help or advice to help deal with changed
personal circumstances. Evidence in this UKCSI
shows that when organisations have proactively
contacted customers with help and advice to
deal with the rising cost of living it has resulted
in increased levels of customer trust. Proactive
communication with customers is most effective
when it is relevant, timely, genuinely benefits
customers and is not seen as intrusive.
There is a growing realisation in some
organisations that genuine personalisation
relies more on understanding and responding
to a customer’s particular situation and
context than on predicting future customer
behaviour. Our research has shown a diversity
of attitudes about organisations’ use of data to
personalise experiences: some customers are
confident about sharing their data in return for
personalised offers and recommendations; others
are reluctant to share any of their data and are
wary about how it will be used.
Key recommendations
for organisations
• Be clear and transparent about prices, terms
and conditions and changes to these
• Give relevant, practical advice and
recommendations to help customers make
the right choice and get the most from
products and services
• Communicate offers that will benefit
customers, especially for essential purchases
• Provide clear information about the best
way to contact the organisation and to
access service
• Give clear information that helps customers
make environmentally sustainable or ethical
buying decisions
• Give advance notice of service disruption or
delays
• Ensure the tone of communications is direct,
straightforward and respectful
• Set realistic expectations when keeping
customers informed about the progress
of an issue
• Give customers the opportunity to provide
feedback and raise concerns about their
experiences with your organisation
*
See A Connected World ? Ensuring the right blend of people and technology for customer service, Institute of Customer Service (2022)
6) Using insight to
improve customer
experience
There have been significant shifts in customer
attitudes and behaviours in the last 2 years.
Expectations about organisations’ effective use of
technology and data, environmental sustainability
and ethical standards have increased. Many
customers have become more considered and
mindful, deliberately buying things that will last
longer, reducing their consumption of physical
goods, or spending more on health and well-being.
Evidence in this report shows that more customers
are cutting back their spend, thinking carefully
about purchases and are concerned about rising
prices. There is also a growing polarisation
between customers with relative financial security
and those who are worried about their future
financial well-being. But for most customers -
whatever their financial circumstances - quality
of service, competitive prices, trustworthiness,
responsiveness and being able to interact with
an organisation in a convenient way will be
key factors influencing their choices about
organisations, products and services.
In this environment, it will be critical for
organisations to understand how customer
needs, priorities and behaviours are evolving,
how service models need to change and where
to deploy resources to achieve impact.

9190 UK Customer Satisfaction Index | January 2023UK Customer Satisfaction Index | January 2023
Key recommendations for organisations
• Encourage a culture where business
improvement activities, new product
and service development and changes
to customer experience are based on
customer evidence and reference the
impact on customer satisfaction
• Understand customers’ objectives and
priorities in their relationship with your
organisation
• Assess the relative importance of a range
of customers’ priorities and the trade-offs
they are prepared to make between
different priorities
• Get feedback from customers about what
the organisation does well and what it
should improve
• Assess the impact of external events and
environment on consumer needs and
behaviour
• Communicate customer insight to leaders
and internal stakeholders with relevance
and impact
• Highlight examples where customer feedback
or insight has been used to generate better
customer satisfaction, new opportunities
or savings
• Use customer insight to deepen leaders
and employees’ understanding of customer
priorities and behaviours and challenge
preconceived stereotypes
• Develop a customer feedback strategy that
is aligned the organisation’s objectives and
addresses the issues that are important
to customers
7) Governance
Good corporate governance is fundamental to
trust, effective management and supervision
of organisations and to the overall health
and prosperity of the economy. Corporate
governance is more than just meeting legal and
regulatory obligations: it affects relationships
with shareholders, employees, partners and
regulators. Customers’ perceptions about
business conduct, ethics and transparency
increasingly influence their attitudes towards
organisations, and buying behaviours.
A growing range of issues - environmental
sustainability, employee working conditions,
voice and engagement, diversity and inclusion,
data security and transparency, the application
of artificial intelligence, risk management and
resilience - have become more prominent
considerations in corporate governance. As a
result, evidence about an organisation’s culture
is likely to become important to investors and
shareholders as an indicator of the ability to
respond to the challenging environment and
maintain short and long-term performance.
Key recommendations
for organisations
• Ensure there is specialist expertise
on the board covering vital issues of
customer service, employee engagement,
environmental sustainability, diversity, data
security and transparency, the application of
artificial intelligence and, risk management
• Ensure sufficient board time is given
to reviewing customer satisfaction and
employee engagement
• Ensure there is senior-level accountability
for an organisation’s customer service
performance
• Ensure that the organisation has defined
standards and governance relating to data
management and security, the application
of artificial intelligence and other emerging
technologies
• Give appropriate weight to customers’
interests in making investment decisions

9392 UK Customer Satisfaction Index | January 2023UK Customer Satisfaction Index | January 2023
8) A positive impact
on society
There is a growing realisation that the range
and scale of long-term challenges that society
faces – environmental sustainability, improving
productivity and skills, infrastructure, access to high
quality health, education and social care, issues
of economic inequality – cannot be addressed
effectively by government or regulators alone.
Increasingly, customers look to organisations to
play an active role in finding solutions to long-term
societal and economic challenges. There are also
significant potential benefits for organisations
in working collaboratively to improve provision
of skills, apprenticeships and raising levels of
education, health and well-being.
From the perspective of customers, the way
organisations treat their employees, the
commitment to environmental sustainability and
support for and engagement in local communities
are key indicators of an organisation’s ethics
and impact on society. Indeed, the perception
that employees are not treated fairly is a leading
ethical reason to stop using an organisation*.
In order to build trust, reputation and customer
satisfaction organisations need to view their
impact on society not as a discretionary set of
activities but integral to their purpose and way of
doing business.
In some cases, there may be expectations from
customers that organisations take a stand on
sensitive and potentially contentious social issues.
Engagement on social issues is likely to be seen
as authentic and relevant when it is clearly linked
to, and supports, the organisation’s purpose and
customer proposition.
Key actions for organisations
• Help develop education, skills, infrastructure
and capacity in communities in which the
organisation operates
• Identify opportunities to collaborate with charities.
other organisations or stakeholders to increase the
impact of social and community engagement
• Treat employees fairly, for example ensuring
that all employees receive a living wage
• Demonstrate a commitment to environmental
sustainability across your organisation’s operations,
products and services and supply chain
• Demonstrate a credible commitment to
diversity and inclusion by ensuring that the
organisation’s employees and leadership team
reflects the make-up of its customers and the
communities it serves
• Develop collaborative supplier relationships
that enable suppliers to make a fair return
on investment
• In particular for organisations that provide
essential services: demonstrate care for
vulnerable customers in designing products,
services and customer experiences
• Make investment decisions that take into
account ethical criteria
• Ensure the organisation pays a fair amount
of tax
*
See Work with a Purpose: building a shared vision of the future, Institute of Customer Service, 2021

9594 UK Customer Satisfaction Index | January 2023UK Customer Satisfaction Index | January 2023
10) Measuring
the right things
Choice of performance measures matters
because it influences focus and decision-making
across an organisation. A pre-requisite for
developing a service culture is understanding
what matters to customers and how the
organisation performs on these attributes.
The dimensions of customer satisfaction
measured by the UKCSI provides a framework
based on research into customers’ priorities; and
organisations may develop a set of measured
based on insight about their own customers’
priorities. It is also relevant to measure
customers’ perception about the extent to
which the organisation delivers, or lives up to, its
purpose and values.
Increasingly, it will be critical to find credible
ways of measuring the link between customer
satisfaction and financial performance. This can
be challening, as a range of different factors
affect financial performance and there may be
a lag between changes in customer experience
and financial results.
Key recommendations
for organisations
• Define clear customer service objectives and
ensure they are communicated across the
organisation
• Understand the attributes of customer
experience that are most important to your
customers and measure your performance
against them
• Assess customer perception about
the extent to which, or how well, the
organisation fulfils its purpose and values
• Assess measures covering efficiency or
volume output of key transactions and
processes alongside customers’ perceptions
of quality
• Benchmark customer satisfaction with peers
or with organisations outside the sector
• Future customer behaviours such as
likelihood to recommend, buy more
products and services or remain a customer
• Extent of problems experienced by
customers, complaints, and their causes
• Employee engagement and employees’
perception about the organisation’s
commitment to customer service
9) Innovation
and agility
Developing capabilities and a mindset
of innovation and agility is vital so that
organisations can respond to evolving customer
needs, competitive or environmental challenges
and improve performance and productivity. In
a context of rising costs, skills shortages, supply
chain issues and weak economic growth it is
even more important to improve processes,
reduce unnecessary cost and effort and make the
right decisions about where to invest time and
resources. The challenge is to develop a culture
that encourages idea generation, combined
with ways of working that rapidly evaluate and
operationalise the best ideas.
Key recommendations
for organisations
• Recruit employees from diverse backgrounds,
testing for intellectual curiosity as well as
attitude, experience and technical expertise
• Encourage employees to propose ideas to
improve service, generate savings or new
opportunities
• Develop a “fail fast” approach to assess
feasibility and avoid committing time and
resources to unviable projects
• Develop a customer experience design
framework to assess the impact of new ideas
• Promote use of collaboration tools that enable
employees to share knowledge and speed up
projects and business improvement activity
• Investigate the benefits of methodologies to
improve project management and business
improvement, such as Agile, Six Sigma or Kano
• Seek ideas and examples of innovation from
organisations outside your sector
• Review emerging technologies and assess
their relevance to your sector or business
model
• Seek feedback from customers about how
the organisation should improve

9796 UK Customer Satisfaction Index | January 2023UK Customer Satisfaction Index | January 2023
UKCSI
Key facts
Number of years UKCSI has run.
The UKCSI is published twice a year, normally in
January and July.
Number of sectors the UKCSI covers, 11 in the
private sector as well as the local and national public
sectors. The Institute also publishes sector reports
with a detailed breakdown of scores by sector and
organisation.
Number of unique responses included in January
2023, from over 10,000 customers. Customers are
geographically and demographically representative
of the UK population and participate in the survey
through an online panel. Customers are asked to
provide a score for organisations based on their most
recent interaction.
Number of responses per sector, except for Transport
and Utilities, which have 6,000 responses each.
Number of individual organisations and organisation types
which received a UKCSI rating. 267 named organisations
which have exceeded a minimum sample size are scored in
the 13 sector reports. In addition, scores are given for 14
generic providers including “your local Council”, “your local
restaurant/takeaway” etc.
14
13
45,000
3,000
281
Organisations
included in the
January 2023 UKCSI
Automotive
Audi
BMW
Citroen
Dacia
Fiat
Ford
Honda
Hyundai
Jaguar
Kia
Land Rover
Lexus
Mazda
Mercedes-Benz
Mini
Mitsubishi
Nissan
Peugeot
Renault
Seat
Škoda UK
Suzuki
Tesla
Toyota
Vauxhall
Volkswagen
Volvo
Banks & Building Societies
Bank of Scotland
Barclays
first direct
Halifax
HSBC
Lloyds
M & S
Metro Bank
Monzo Bank
Nationwide
NatWest
RBS
Sainsbury's
Santander
Starling Bank
Tesco
The Co-operative Bank
TSB
Virgin Money
Insurance
AA Insurance
Admiral
Aviva
AXA
BUPA
Churchill
Co-op Insurance
Direct Line
Esure
Halifax
Hastings Direct Insurance
Legal and General
Lloyds
LV=
M & S (insurance)
More Than
Nationwide Insurance
Petplan
Privilege
Prudential
RAC
SAGA Insurance
Sainsbury's
Tesco
Virgin Money
Zurich
Leisure
Amazon Prime Video
Burger King
Caffe Nero
Cineworld
Costa Coffee
Deliveroo
Domino's Pizza
Greggs
Harvester
JD Wetherspoon
Just Eat
KFC
McDonald's
Nando's
Netflix
Now TV
Odeon
Pizza Express
Pizza Hut
Pret A Manger
Spotify
Starbucks
Subway
Toby Carvery
Vue Cinema
your local independent coffee
shop
your local restaurant/takeaway
Public Services (Local)
GP surgery / health centre
Library
your Housing Association
your local Ambulance Service
your local Council
your local Fire Service
your local Police Service
Public Services (National)
Companies House
Disclosure and Barring Service
DVLA
HM Land Registry (registers the
ownership of land and property in
England and Wales)
HM Passport Office
HMRC (Inland Revenue)
Jobcentre Plus
National Highways
Natural Resources Wales
NHS / hospital service
Post Office
The Environment Agency
The university I attend
Retail (Food)
Aldi
ASDA
Co-op Food
Iceland
Lidl
M & S (food)
Morrisons
Ocado
Sainsbury's
Tesco
Waitrose
your local farmers' market/farm
shop
Retail (Non-food)
Amazon.co.uk
Apple
Argos
B&Q
Boots UK
Costco
Currys/PC World
Ebay
H&M
Holland & Barrett
Home Bargains
Ikea
John Lewis
M & S
Matalan
Next
Pets at Home
Poundland
Primark
Specsavers
Sports Direct
Superdrug
TK Maxx
Wilko
Services
AA
Autoglass
British Gas Home Services
DHL
DPD
Green Flag
Halfords autocentre
Hermes / Evri
Hertz
Homeserve
Kwik Fit
RAC
Royal Mail / Parcelforce
Timpson
Uber
Western Union
Yodel
your local solicitor
your local tradesman e.g. builder,
electrician, painter & decorator,
plumber
Telecommunications & Media
BT
EE (including T-Mobile or Orange)
giffgaff
O2
Plusnet
Sky
Sky Mobile
TalkTalk
Tesco Mobile
Three
Utility Warehouse
Virgin Media
Virgin Mobile
Vodafone
Tourism
Airbnb
booking.com
British Airways Holidays
Butlins
Center Parcs
easyJet Holidays
Expedia
Haven Holidays
Hilton
Holiday Inn
Hoseasons
Hotels.com
Jet2holidays.com
Marriott
On the Beach
P&O Cruises
Premier Inn
Travelodge
Trivago
TUI
Virgin Holidays
Transport
Arriva - Bus group
Avanti West Coast
British Airways
Brittany Ferries
C2C
CrossCountry
East Midlands Railway
easyJet
Eurotunnel
First Group - bus companies
Gatwick Express
Grand Central
Great Northern
Great Western Railway
Greater Anglia
Heathrow Express
Jet2
London North Eastern Railway
London Northwestern Railway
London Underground
Manchester Metrolink
Merseyrail
National Express
Northern / Northern Trains
P&O Ferries
Ryanair
ScotRail / ScotRail Trains
South Western Railway
Southeastern (train operating
company)
Southern
Stagecoach (Bus)
Thameslink
The Trainline.com
TransPennine Express
Transport for Wales
TUI Airways
Virgin Atlantic
West Midlands Railway
Utilities
Affinity Water
Anglian Water
Bristol Water
British Gas
Bulb
Dwr Cymru (Welsh Water)
E.ON (energy)
EDF Energy
Electricity North West
Northern Powergrid
Northumbrian Water
npower
Octopus Energy
OVO Energy
Power NI
Scottish and Southern Electricity
Networks
Scottish and Southern Energy (SSE)
Scottish Gas
Scottish Power
Scottish Water
Severn Trent Water
Shell Energy
South East Water
South Staffordshire Water
South West Water
Southern Water
SP Energy Networks
Thames Water
UK Power Networks
United Utilities (water)
Utilita
Utility Warehouse
Wessex Water
Yorkshire Water

9998 UK Customer Satisfaction Index | January 2023UK Customer Satisfaction Index | January 2023
UKCSI sector
reports*
* Two sector reports are available as a membership benefit to The Institute’s Trusted Advisory Network
members; one report for Discovery Roadmap members. For Pathway members, discounts apply.
Sector reports are available for purchase by non members at www.instituteofcustomerservice.com
13 reports are available with sector-specic insight and recommendations
• Customer satisfaction performance of leading organisations on over 25 customer experience metrics
• Channel use and satisfaction
• Drivers of complaints and satisfaction with complaint handling
• Links between satisfaction and future buying behaviours
• Recommendations and opportunities to improve
Sector resource packs
• Key sector and organisational measures in
spreadsheet format
• Sector satisfaction by age, region, gender
• Key issues organisations should improve
• Satisfaction by product type in the Banking,
Insurance and Telecommunications &
Media sectors
Sub-sector customer experience measures
• Leisure (Quick Service Restaurants;
Entertainment)
• Transport (Air; Rail; Coach / Bus)
• Retail Non-food (Fashion retailers)
• Utilities (Energy; Water)
Automotive
Banks & Building Societies
Insurance
Leisure
Public Services (Local)
Public Services (National)
Retail (Food)
Retail (Non-food)
Services
Telecommunications & Media
Tourism
Transport
Utilities
A barometer of customer satisfaction
in the UK since 2008
The UKCSI (UK Customer Satisfaction Index)
provides insight into the state of customer
satisfaction in the UK for 13 key sectors. The
UKCSI is published twice a year, in January and
July. Each UKCSI incorporates two sets of data to
create a rolling measure of customer satisfaction.
The January 2023 UKCSI includes responses from
surveys conducted between 21 March to 14 April
2022 and 5 September to 3 October 2022.
45,000 customer responses
The UKCSI is based on an online survey of over
10,000 consumers, who are representative of
the UK adult population by region, age and
gender. The January 2023 UKCSI comprises
45,000 responses, 3,000 from each sector except
for Transport and Utilities which include 6,000
responses each. Customers are asked to rate their
experience of dealing with a specific organisation
in the previous three months. Customers rate only
one organisation per sector. Each customer can
complete the survey for up to five different sectors.
Over 25 metrics of the quality of customers’
interactions and relationship with organisations
Customers rate the quality of their experiences
and relationship with organisations on over 25
metrics including employee professionalism,
product / service quality, ease of dealing with
an organisation, timeliness, complaint handling
and attitudes towards trust, reputation, an
organisation’s customer ethos and ethical
behaviour.
Metrics reflect the priorities identified by
customers, as well as attributes that show
a strong relationship with overall customer
satisfaction. The UKCSI also includes measures of
customer effort and a Net Promoter Score (NPS).
Customers rate organisations on a scale of 1 – 10
except for the question “how likely would you be
to recommend xx to friends and family”, which
is a scale of 0 – 10.
281 organisations received a UKCSI rating
These include 267 named organisations and 14
generic providers including “your local Council”,
“your local restaurant/takeaway” etc. Customers
select an organisation to rate from a randomised
list of leading and emerging players in each
sector which is reviewed before each UKCSI.
Customers can also select an organisation to rate
that is not on the list. Organisations which exceed
a minimum sample size are given a score and are
named within one of the 13 sector reports.
How the UKCSI is calculated
Index scores are expressed as a number out of
100. The UKCSI score for each organisation is
the average of all of its customers’ satisfaction
scores, multiplied by ten, with a weighting
applied reflecting the priority score for each
measure. The sector score is the mean average
of all responses for that sector, multiplied by ten.
The overall UKCSI is based on the mean average
of each sector’s score.
* See Experiences, Emotions and Ethics: refreshing the customer priorities that underpin the UK Customer Satisfaction Index, available at
www.instituteofcustomerservice.com/research. It is free to Institute organisational members and available for purchase by non members.
About the
UKCSI
101100 UK Customer Satisfaction Index | January 2023UK Customer Satisfaction Index | January 2023
Breakthrough
research from The
Institute
Customer Behaviours:
Evolution or Watershed?
• Examines how customer expectations and behaviours have evolved in the last
2 years and how they will change in the future
• Assesses if there are customer segments that can be defined around key
behaviours
• Identifies key actions and recommendations to help organisations respond
effectively to evolving customer expectations and behaviours.
A Connected World? Ensuring the right blend
of people and technology for customer service
• Investigates customer perspectives on using technology to interact with
organisations, potential applications to improve service, the risk of digital
exclusion and how organisations should address it
• Examines how organisations are combining human and technology-based
experiences in the context of customer service
• Highlights 10 key enablers to deploy technology and achieve business
performance and customer service objectives.
To find out more about The Institute’s research programme, contact us at:
T: 0207 260 2620
Who Do You Trust? Improving trust through customer service
• Highlights the key factors that influence customers’ trust, or can reduce trust
in organisations
• Introduces a model of customer trust based on 7 dimensions
• Defines actions and enablers for organisations to build trust in their
relationships with customers, employees, suppliers and key stakeholders.
Work with a Purpose:
Building a shared vision of the future
• Examines impact and learnings from Covid-19
• Identifies skills and capabilities organisations will need to achieve sustainable
customer experience and business performance
• Assesses what employees want from work and how organisations will need
to engage with and support their employees
• Highlights key factors that will influence work culture and practice and
implications for job design, skills and training, organisational culture,
structures and measurement.

T: 020 7260 2620
January 2023
instituteofcustomerservice.com
ISBN 978-1-913314-96-5
About The Institute of Customer Service
The Institute of Customer Service is the UK’s
independent, professional body for customer
service.
Our purpose is to enable organisations to achieve
tangible business benefits through excellent
customer service aligned to their business goals
and to help individuals maximise their career
potential and employability by developing their
customer service skills.
We provide tools and services to support
continuous customer service improvement and a
framework for our members to share and learn
from each other.
We are independent – setting standards so that
our customers can improve their customers’
experiences and their business performance.
The Institute is the secretariat for the All Party
Parliamentary Group on Customer Service.
Key Activities
• Research and reports on the latest customer
service trends and thinking
• Publication of the UK Customer Satisfaction
Index (UKCSI) twice a year
• Benchmarking customer experience to identify
areas for improvement, drawing on the views
of both customers and employees
• Bespoke customer insight and research
• Training and accreditation programmes for
customer service professionals
• Professional qualifications for individuals at all
stages of their career
• Public policy development.
For further information please visit
www.instituteofcustomerservice.com
