June 25, 2024
AMERICAN CUSTOMER SATISFACTION INDEX
ACSI
®
Restaurant and Food Delivery
Study 2024
Restaurant Satisfaction Increases as Inflation
Forces Competition to Retain Customers;
Food Delivery Debuts in ACSI With Customers
Focused on Fees
As consumers face increasingly dicult decisions about food spending, restaurant chains
that can dierentiate themselves in terms of quality and value will have a competitive
advantage. The 1% customer satisfaction gain to an ACSI score of 79 for fast food restaurants
is encouraging, as Chick-fil-A leads the way among individual chains for the tenth consecutive
year. The 4% gain for full-service restaurants to 84 is impressive, as companies need to retain
their loyal customers during periods of economic uncertainty. Consumers continue to show
a preference for steaks as LongHorn Steakhouse and Texas Roadhouse tie for the top spot
among full-service restaurants.
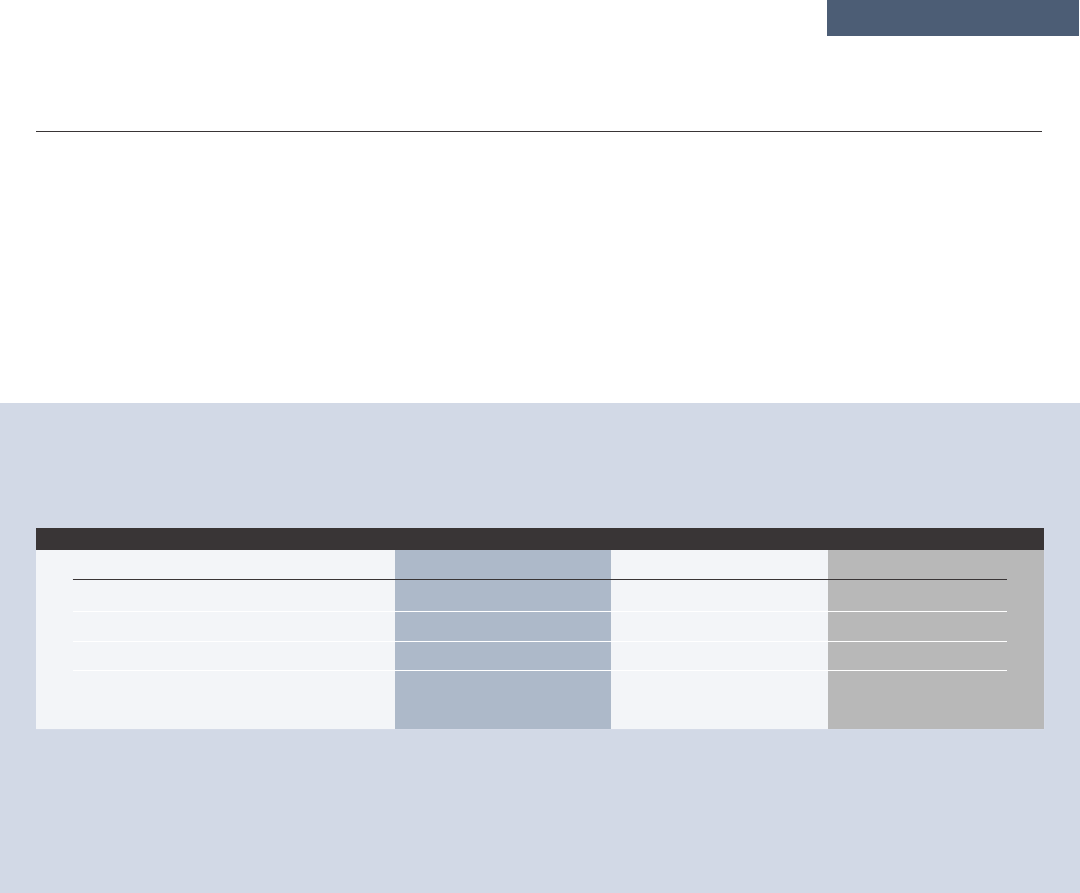
FULLSERVICE
RESTAURANTS
+%
FOOD DELIVERY
WWW.THEACSI.ORG INFO@THEACSI.ORG ©2024 AMERICAN CUSTOMER SATISFACTION INDEX LLC. ALL RIGHTS RESERVED. 1
FAST FOOD
RESTAURANTS
+%

WWW.THEACSI.ORG INFO@THEACSI.ORG ©2024 AMERICAN CUSTOMER SATISFACTION INDEX LLC. ALL RIGHTS RESERVED. 2
Inflation is weighing heavily on the industry as same-store restaurant sales growth slowed in the second half of 2023 despite
higher quarterly growth in the first half of the year. While U.S. Census Bureau data show growth in restaurant spending
outpacing inflation, rising prices are reducing restaurant visits for those with household incomes under $75,000. ACSI data
indicate that both full-service and fast food restaurant customers are skewing a bit more toward higher income levels and
college graduates. Additionally, customers are being forced to make decisions between groceries and restaurants. Full-service
restaurant inflation has been roughly two times that of groceries in the past year, while fast food and fast casual restaurants
have raised prices at about three times the rate of groceries. All considered, customers are increasingly viewing dining out as a
luxury.
Along the same lines, the newly measured food delivery industry shows customers being concerned about fees for this service
above and beyond rising restaurant meal prices.
ACSI results are based on surveys conducted over a 12-month period ending in March 2024. ACSI scores are reported on a 0 to
100 scale.
Key Takeaways
FULL-SERVICE RESTAURANTS
• Customer satisfaction with full-service restaurants climbs 4% to 84, placing the industry at the top of the Index overall and
helping to explain the overall growth in restaurant spending despite some consumers cutting back.
• Customers continue to show preferences for steaks with LongHorn Steakhouse and Texas Roadhouse both gaining 4% to tie for
the industry lead at 85.
• As lower-income consumers cut back on restaurant spending, brands such as Olive Garden and Chili’s are focusing on their
value propositions, and in turn satisfaction rises 4% to 83 and 80, respectively.
• Consumers who are still eating out are likely enjoying value-oriented deals oered by many dierent chains.
FAST FOOD RESTAURANTS
• The fast food industry’s ACSI score ticks up 1% to 79. Among major chains, Chick-fil-A leads for the tenth consecutive year,
despite a 2% decline to 83.
• Following the leader, competition is tight with KFC unchanged at 81 and four brands at 80: ACSI newcomer Culver’s, Panera
(+5%), Arby’s (+4%), and Starbucks (+3%).
• Order accuracy and mobile performance receive high scores as improving technology may be increasing accuracy in filling
customer orders.
FOOD DELIVERY
• Food delivery premieres in the ACSI with an industry score of 73, well below the customer satisfaction levels of full-service and
fast food restaurants.
• Uber Eats (74) outpaces the other reported major brands, DoorDash (73) and Grubhub (71). The group of smaller food delivery
services leads the field (79).
• Customers using food delivery for convenience have higher satisfaction, on average, than those ordering out of necessity.
Customers in the latter group give lower ratings on value-related measures.
Study Findings
Customer satisfaction is a driving force that impacts the financial outlook of individual firms and the health of the U.S. economy
at large. New results from the American Customer Satisfaction Index (ACSI®) provide customer satisfaction benchmarks for three
industries: full-service restaurants, fast food restaurants, and food delivery. The ACSI also captures consumer opinions about
critical elements of the customer experience, tailored individually to each measured industry.

WWW.THEACSI.ORG INFO@THEACSI.ORG ©2024 AMERICAN CUSTOMER SATISFACTION INDEX LLC. ALL RIGHTS RESERVED. 3
FULL-SERVICE RESTAURANTS
ACSI results again show consumer preferences for steaks as LongHorn Steakhouse and Texas Roadhouse both gain 4% to
85, tying for the top spot among full-service restaurants. LongHorn demonstrates its commitment to customer satisfaction by
running counter to the shrinkflation trend and providing more value to diners. The chain is also working to maintain a quality-
focused culture. Meanwhile, Texas Roadhouse is focusing on keeping prices low, despite inflation, while investing heavily in
stang to maintain team continuity.
Olive Garden climbs 4% to an ACSI score of 83, successfully focusing on operational quality and keeping prices lower than many
competitors. Still, the chain faces some risk as lower-income consumers cut back on restaurant spending. Chili’s also improves
4% to 80. The chain benefits from a combination of high perceived value through their “3 for Me” menu and service strength
through employee retention. Chili’s value proposition has led to speculation about whether eating at Chili’s can be less expensive
than some fast food outlets.
Although still well behind the leaders, IHOP shows impressive progress, jumping 8% to 78. Menu changes that bring more variety
are receiving a favorable response from customers. Last year’s category leader, Outback Steakhouse, drops 4% to 80. Outback
appears to be challenged by a slowdown in spending by lower-income consumers consistent with ACSI findings regarding their
customers’ price sensitivity.
AMERICAN CUSTOMER SATISFACTION INDEX:
FULL-SERVICE RESTAURANTS
0-100 Scale
Source: ACSI Restaurant and Food Delivery Study 2024. © 2024 American Customer Satisfaction Index LLC. All rights reserved.
Charts extracted from this study for media use must include a statement identifying the study of origin and the publisher as the American Customer Satisfaction Index LLC.
No advertising or other promotional use can be made of the data and information in this study without the express prior written consent of ACSI.
2023 ACSI
81
82
82
81
80
82
77
83
79
79
72
79
78
77
77
2024 ACSI
84
85
85
84
83
82
80
80
79
79
78
78
78
76
76
% CHANGE
4%
4%
4%
4%
4%
0%
4%
-4%
0%
0%
8%
-1%
0%
-1%
-1%
COMPANY
Full-Service Restaurants
LongHorn Steakhouse (Darden)
Texas Roadhouse
All Others
Olive Garden (Darden)
Cracker Barrel
Chili’s
Outback Steakhouse
Applebee’s (Dine Brands)
Bualo Wild Wings (Inspire Brands)
IHOP (Dine Brands)
Red Lobster
The Cheesecake Factory
Denny’s
Red Robin

WWW.THEACSI.ORG INFO@THEACSI.ORG ©2024 AMERICAN CUSTOMER SATISFACTION INDEX LLC. ALL RIGHTS RESERVED. 4
AMERICAN CUSTOMER SATISFACTION INDEX:
FULL-SERVICE RESTAURANTS
Customer Experience Benchmarks Year-Over-Year Industry Trends
0-100 Scale
Source: ACSI Restaurant and Food Delivery Study 2024. © 2024 American Customer Satisfaction Index LLC. All rights reserved.
Charts extracted from this study for media use must include a statement identifying the study of origin and the publisher as the American Customer Satisfaction Index LLC.
No advertising or other promotional use can be made of the data and information in this study without the express prior written consent of ACSI.
2024 2023
Accuracy of food order
Courtesy and helpfulness of waitsta
Beverage quality (taste, temperature)
Food quality (taste, temperature, freshness of ingredients)
Restaurant layout and cleanliness
Variety of beverages on menu
Speed with which food order was received at table
Variety of food on menu
Website satisfaction
Quality of mobile app
Reliability of mobile app (minimal down time, crashes, lags)
92
90
89
89
89
88
87
87
87
85
85
88
86
86
86
85
83
83
84
85
87
87
Customers indicate better performance across most aspects of the full-service restaurant experience, appreciating restaurants’
eorts to satisfy customers despite inflation. Providing an outstanding customer experience will be even more critical for
consumers feeling pressured to cut back on discretionary spending. Full-service restaurant respondents for this study have
somewhat higher income levels and college graduation rates than in 2023, supporting reporting that lower-income consumers
are eating in restaurants less frequently.

WWW.THEACSI.ORG INFO@THEACSI.ORG ©2024 AMERICAN CUSTOMER SATISFACTION INDEX LLC. ALL RIGHTS RESERVED. 5
AMERICAN CUSTOMER SATISFACTION INDEX:
FAST FOOD RESTAURANTS
0-100 Scale
2023 ACSI
78
82
85
81
77
NM
76
78
78
80
78
78
76
75
77
77
72
74
74
75
75
71
73
74
69
2024 ACSI
79
83
83
81
80
80
80
80
79
79
79
78
77
77
77
77
76
76
75
74
74
73
72
72
71
% CHANGE
1%
1%
-2%
0%
4%
NA
5%
3%
1%
-1%
1%
0%
1%
3%
0%
0%
6%
3%
1%
-1%
-1%
3%
-1%
-3%
3%
COMPANY
Fast Food Restaurants
All Others
Chick-fil-A
KFC (Yum! Brands)
Arby’s (Inspire Brands)
Culver’s
Panera Bread
Starbucks
Domino’s
Papa Johns
Pizza Hut (Yum! Brands)
Five Guys
Burger King (RBI)
Chipotle
Dunkin’ (Inspire Brands)
Panda Express
Sonic (Inspire Brands)
Wendy’s
Little Caesars
Dairy Queen
Subway
Taco Bell (Yum! Brands)
Jack in the Box
Popeyes (RBI)
McDonald’s
NM = Not Measured
NA = Not Available
Source: ACSI Restaurant and Food Delivery Study 2024. © 2024 American Customer Satisfaction Index LLC. All rights reserved.
Charts extracted from this study for media use must include a statement identifying the study of origin and the publisher as the American Customer Satisfaction Index LLC.
No advertising or other promotional use can be made of the data and information in this study without the express prior written consent of ACSI.
FAST FOOD RESTAURANTS
Chick-fil-A drops 2% to an ACSI score of 83 but still leads among individual fast food chains for the tenth consecutive year. This
long-term success is reflected in revenue, as the chain’s non-mall locations had an average revenue of $9.4 million in 2023 (more
than double that of McDonald’s while being open one day less per week). Total U.S. sales growth for Chick-fil-A was nearly 15%
last year. KFC finishes second at 81 (unchanged), appearing to hold on to highly loyal customers as competitors cut into their
domestic market share.
There is a four-way tie for third place at 80 between ACSI newcomer Culver’s, Panera (+5%), Arby’s (+4%), and Starbucks (+3%).
Culver’s continues to open locations at a consistent rate while also growing revenue per location. Among the company’s changes
are a switch from Pepsi to Coke and the rollout of new thick-cut bacon. Panera has responded to cost-conscious customers with
its Value Duets menu, enjoying higher trac and an improved value proposition. An encouraging sign for Starbucks is growth of
its mobile order and payment revenue, which should be helped by the coming expansion of its mobile order option beyond just
loyalty program members. Arby’s enjoys higher satisfaction as customers appear to respond well to the chain’s menu variety and
tweaks to value meals, which may be reflected in much stronger value perceptions this year.

WWW.THEACSI.ORG INFO@THEACSI.ORG ©2024 AMERICAN CUSTOMER SATISFACTION INDEX LLC. ALL RIGHTS RESERVED. 6
AMERICAN CUSTOMER SATISFACTION INDEX:
FAST FOOD RESTAURANTS
Customer Experience Benchmarks Year-Over-Year Industry Trends
0-100 Scale
Source: ACSI Restaurant and Food Delivery Study 2024. © 2024 American Customer Satisfaction Index LLC. All rights reserved.
Charts extracted from this study for media use must include a statement identifying the study of origin and the publisher as the American Customer Satisfaction Index LLC.
No advertising or other promotional use can be made of the data and information in this study without the express prior written consent of ACSI.
2024 2023
Accuracy of food order
Quality of mobile app
Reliability of mobile app (minimal down time, crashes, lags)
Beverage quality (taste, temperature)
Courtesy and helpfulness of sta
Food quality (taste, temperature, freshness of ingredients)
Restaurant layout and cleanliness
Speed of check-out or delivery
Website satisfaction
Variety of beverages on menu
Variety of food on menu
86
86
85
84
84
84
83
83
83
82
82
85
84
84
83
83
83
82
82
83
80
80
Order accuracy (86), mobile quality (86), and mobile reliability (85) receive high scores as improving technology may be in-
creasing accuracy in filling customer orders. In fact, mobile quality exceeds that of full-service chains. Fast food restaurants also
receive high benchmarks for sta courtesy and both food and beverage quality (all 84), although sit-down chains outperform fast
food on these measures.
As noted for full-service restaurants, pressure for some consumers to reduce discretionary spending will require restaurants to
provide an exceptional customer experience to maintain their loyalty. As with full-service restaurants, fast food respondents for
the 2024 study have somewhat higher income levels and college graduation rates compared to the prior year, consistent with
reporting that lower-income consumers are eating out less frequently.
WWW.THEACSI.ORG INFO@THEACSI.ORG ©2024 AMERICAN CUSTOMER SATISFACTION INDEX LLC. ALL RIGHTS RESERVED. 7
FOOD DELIVERY
Restaurant delivery services grew rapidly during the pandemic. The food delivery industry continues to expand as many
consumers learn to appreciate the convenience of enjoying restaurant food at home without having to leave home for carryout.
The food delivery industry debuts in the ACSI with a score of 73 that is significantly lower than both full-service restaurants (84)
and fast food restaurants (79). Uber Eats at 74 edges out the other reported brands, DoorDash (73) and Grubhub (71). At 79, the
group of smaller food delivery services outpaces all three major competitors.
Satisfaction varies based on the customer’s reason for using the service. Those looking for convenience (for example, work
schedule, spending time with family, avoiding cooking or grocery shopping) are more satisfied than those ordering due to need
(for example, health, not having a vehicle or not wanting to drive). While these groups show similar scores for the ordering
process, those using delivery services out of necessity are more frustrated with pricing.
AMERICAN CUSTOMER SATISFACTION INDEX:
FOOD DELIVERY
0-100 Scale
2023 ACSI
NM
NM
NM
NM
NM
2024 ACSI
73
79
74
73
71
% CHANGE
NA
NA
NA
NA
NA
COMPANY
Food Delivery
All Others
Uber Eats
DoorDash
Grubhub
NM = Not Measured
NA = Not Available
Source: ACSI Restaurant and Food Delivery Study 2024. © 2024 American Customer Satisfaction Index LLC. All rights reserved.
Charts extracted from this study for media use must include a statement identifying the study of origin and the publisher as the American Customer Satisfaction Index LLC.
No advertising or other promotional use can be made of the data and information in this study without the express prior written consent of ACSI.

WWW.THEACSI.ORG INFO@THEACSI.ORG ©2024 AMERICAN CUSTOMER SATISFACTION INDEX LLC. ALL RIGHTS RESERVED. 8
AMERICAN CUSTOMER SATISFACTION INDEX:
FOOD DELIVERY
Customer Experience Benchmarks 2024
0-100 Scale
Source: ACSI Restaurant and Food Delivery Study 2024. © 2024 American Customer Satisfaction Index LLC. All rights reserved.
Charts extracted from this study for media use must include a statement identifying the study of origin and the publisher as the American Customer Satisfaction Index LLC.
No advertising or other promotional use can be made of the data and information in this study without the express prior written consent of ACSI.
Mobile app satisfaction
Website satisfaction
Food and restaurant ordering options
Ordering process
Payment options
Alerts and notifications while waiting
Courtesy of delivery person
Process for rating the delivery person
Process for tipping the delivery person
Speed of delivery
Accuracy of quoted delivery times
Ease of understanding fees
Order accuracy
Food temperature
Loyalty or reward program
Fairness of food prices
Fairness of pre-tip taxes and service fees
82
81
80
77
75
73
69
80
80
78
77
75
71
69
76
76
75
Customers give the highest ratings to the mobile apps (82) and websites (81) used to place orders. While the ordering process
overall receives a score of 80, those that order via websites (77) are less satisfied than those that order using mobile apps (80).
Part of that dierence represents the score gap for alerts and notifications while waiting, where mobile apps perform better.
The cost of food delivery is a concern in terms of the fairness of food prices (69) and pre-tip taxes and service fees (69). There is
a risk of perceptions getting worse as lack of fee transparency gets more attention from consumers and politicians. DoorDash has
been promoting its eorts to lower fees, which could create an advantage.

AMERICAN CUSTOMER SATISFACTION INDEX (ACSI®):
Customer Satisfaction Benchmarks by Industry
0-100 Scale
WWW.THEACSI.ORG INFO@THEACSI.ORG ©2024 AMERICAN CUSTOMER SATISFACTION INDEX LLC. ALL RIGHTS RESERVED. 9
Full-Service Restaurants
Athletic Shoes
Soft Drinks
Breweries
Food Manufacturing
Personal Care and Cleaning Products
Cell Phones
Household Appliances
Nonhospital Care
Televisions
Banks
Financial Advisors
Life Insurance
Online Retailers
Personal Computers
Search Engines and Information
Apparel
Automobiles
Credit Unions
Fast Food Restaurants
Online Investment
Specialty Retailers
Supermarkets
Video Streaming Service
Consumer Shipping
Drugstores
General Merchandise Retailers
Property and Casualty Insurance
Airlines
Car Rentals
Health Insurance
Online Travel Agencies
Wireless Phone Service
Energy Utilities
Gas Stations
Hotels
Hospitals
U.S. Postal Service
Food Delivery
Social Media
Internet Service Providers
Subscription TV Service
80
83
79
84
83
82
81
80
81
79
79
81
82
75
76
80
77
80
81
79
77
77
80
82
80
79
76
76
79
79
75
79
77
76
74
75
74
71
70
73
76
Source: ACSI Restaurant and Food Delivery Study 2024. © 2024 American Customer Satisfaction Index LLC. All rights reserved.
Charts extracted from this study for media use must include a statement identifying the study of origin and the publisher as the American Customer Satisfaction Index LLC.
No advertising or other promotional use can be made of the data and information in this study without the express prior written consent of ACSI.
73

WWW.THEACSI.ORG INFO@THEACSI.ORG ©2024 AMERICAN CUSTOMER SATISFACTION INDEX LLC. ALL RIGHTS RESERVED. 10
Methodology
The ACSI Restaurant and Food Delivery Study 2024 is based on 14,604 completed surveys. Customers were chosen at random
and contacted via email between April 2023 and March 2024 for the restaurant industries and between November 2023 and
March 2024 for food delivery. Customers are asked to evaluate their recent experiences with the largest companies in terms of
market share, plus an aggregate category consisting of “all other”—and thus smaller—companies in those industries.
ACSI survey data are used as inputs to the Index’s cause-and-eect econometric model, which estimates customer satisfaction
as the result of the survey-measured inputs of customer expectations, perceptions of quality, and perceptions of value. The
ACSI model, in turn, links customer satisfaction with the survey-measured outcomes of customer complaints and customer
loyalty. ACSI clients receive confidential industry-competitive and best-in-class data on all modeled variables and customer
experience benchmarks.
About ACSI
The American Customer Satisfaction Index (ACSI®) is a national economic indicator of customer evaluations of the quality
of products and services available to household consumers in the United States. The ACSI uses data from roughly 200,000
responses annually as inputs to an econometric model for analyzing customer satisfaction with approximately 400 companies in
about 40 industries and 10 economic sectors, including various services of federal and local government agencies. ACSI results
are released throughout the year, with all measures reported on a scale of 0 to 100.
ACSI data have proven to be strongly related to several essential indicators of micro and macroeconomic performance. For
example, firms with higher levels of customer satisfaction tend to have higher earnings and stock returns relative to competitors.
Stock portfolios based on companies that show strong performance in ACSI deliver excess returns in up markets as well as down
markets. At the macro level, customer satisfaction has been shown to be predictive of both consumer spending and GDP growth.
Contact Information
For more information regarding this study; the full-service restaurant, fast food restaurant, and food delivery industries;
and how the ACSI can help your company harness the power of customer satisfaction to improve your bottom line,
visit www.theacsi.org or contact:
ACSI LLC | 3916 Ranchero Drive | Ann Arbor, MI 48108
Phone: (734) 913-0788 | E-mail: [email protected]
No advertising or other promotional use can be made of the data and information in this study
without the express prior written consent of ACSI LLC.
ACSI and its logo are Registered Marks of American Customer Satisfaction Index LLC.
