NCHS Data Brief
■
No. 242
■
April 2016
U.S. DEPARTMENT OF HEALTH AND HUMAN SERVICES
Centers for Disease Control and Prevention
National Center for Health Statistics
Daily Water Intake Among U.S. Men and Women, 2009–2012
Asher Rosinger, Ph.D., M.P.H., and Kirsten Herrick, Ph.D., M.Sc.
Key ndings
Data from the National
Health and Nutrition
Examination Survey,
2009–2012
●
Among U.S. adults, men
consumed an average of 3.46
liters (117 ounces) of water per
day, and women consumed 2.75
liters (93 ounces) per day.
●
Men aged 60 and over
consumed less water (2.92
liters) than men aged 20–39
(3.61 liters) and 40–59 (3.63
liters). Similarly, women aged
60 and over consumed less
water (2.51 liters) than women
aged 20–39 (2.78 liters) and
40–59 (2.9 liters).
●
Non-Hispanic white men and
women consumed more water
daily than non-Hispanic black
and Hispanic men and women.
●
Water intake increased with
physical activity level for both
men and women.
●
Among men, 30% of total
water consumed was plain
water (with the remainder
from other foods and liquids)
compared with 34% for
women.
Water is an essential nutrient for life (1). Institute of Medicine (IOM)
recommendations from 2004 set adequate levels for total water intake from all
foods and liquids at 3.7 liters (125 ounces) for men and 2.7 liters (91 ounces)
for women (2). Consuming inadequate amounts of water increases the risk of
dehydration, kidney stones, and poorer cognitive performance (3,4). Differences
in water intake have been reported by age, race and Hispanic origin, and
physical activity (5,6). This report provides updated estimates of mean daily
total water intake for U.S. men and women aged 20 and over in 2009–2012.
Keyword: National Health and Nutrition Examination Survey
Did total water intake per day vary by age group for men and
women during 2009–2012?
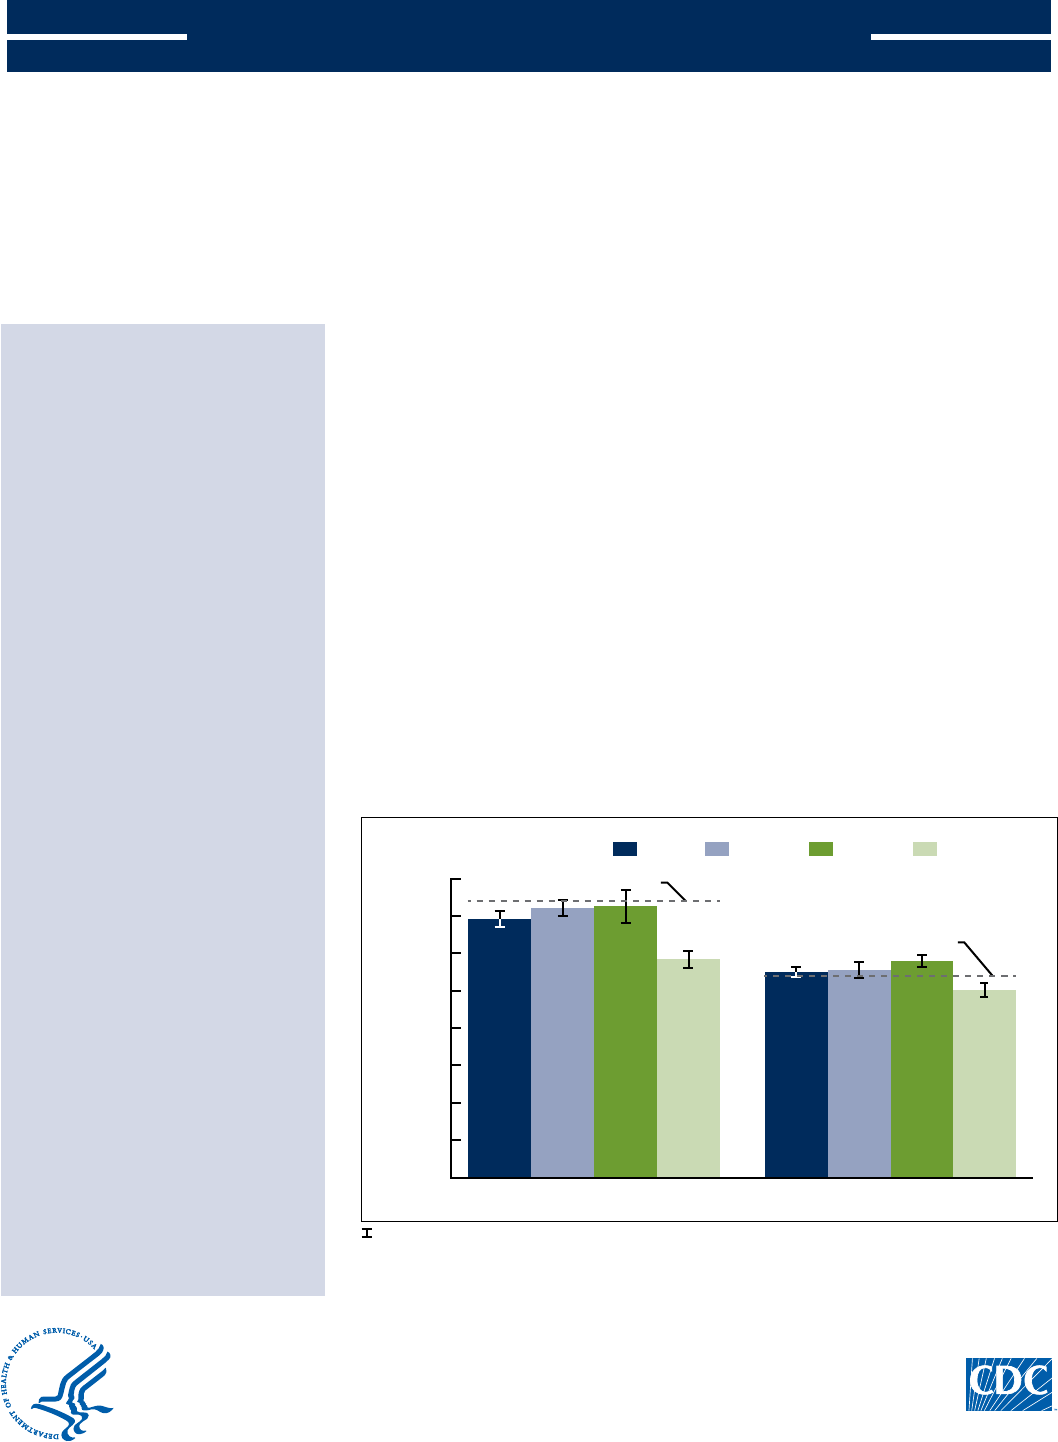
Men consumed an average of 3.46 liters (L) or 117 ounces of water from all foods and
liquids per day, while women consumed an average of 2.75 L or 93 ounces (Figure 1).
WomenMen
Adequate intake (3.7 liters)
Adequate intake (2.7 liters)
3.46
1
3.61
1
3.63
2.92
2.75
1
2.78
1,2
2.90
2.51
Figure 1. Mean total water intake per day among adults aged 20 and over, by sex and age group:
United States, 2009–2012
95% confidence interval.
1
Significantly different from those aged 60 and over, p < 0.01.
2
Significantly different from those aged 20–39, p < 0.05.
NOTE: Access data table for Figure 1 at: http://www.cdc.gov/nchs/data/databriefs/db242_table.pdf#1.
SOURCE: CDC/NCHS, National Health and Nutrition Examination Survey, 2009–2012.
Total water intake (liters)
0.00
0.50
1.00
1.50
2.00
2.50
3.00
3.50
4.00
60 and over40–5920–39Total
NCHS Data Brief
■
No. 242
■
April 2016
■ 2 ■
Total water intake was lowest among both men and women aged 60 and over compared with
younger age groups. Men aged 20–39 (3.61 L) and 40–59 (3.63 L) consumed signicantly more
water per day than men aged 60 and over (2.92 L). Women aged 20–39 consumed 2.78 L of total
water per day, while those aged 40–59 consumed signicantly more (2.90 L), and those aged 60
and over consumed signicantly less (2.51 L).
On average, men aged 20–39 and 40–59 consumed water at about the recommended adequate
intake level of 3.7 L, while those aged 60 and over consumed 0.78 L less water than the
recommended adequate intake. Women aged 20–39 consumed water at about the adequate intake
level of 2.7 L, while women aged 40–59 consumed 0.2 L more than the adequate intake, and
women aged 60 and over consumed 0.19 L less than the recommended adequate intake.
Were there differences in mean total water intake per day by race and
Hispanic origin among men and women?
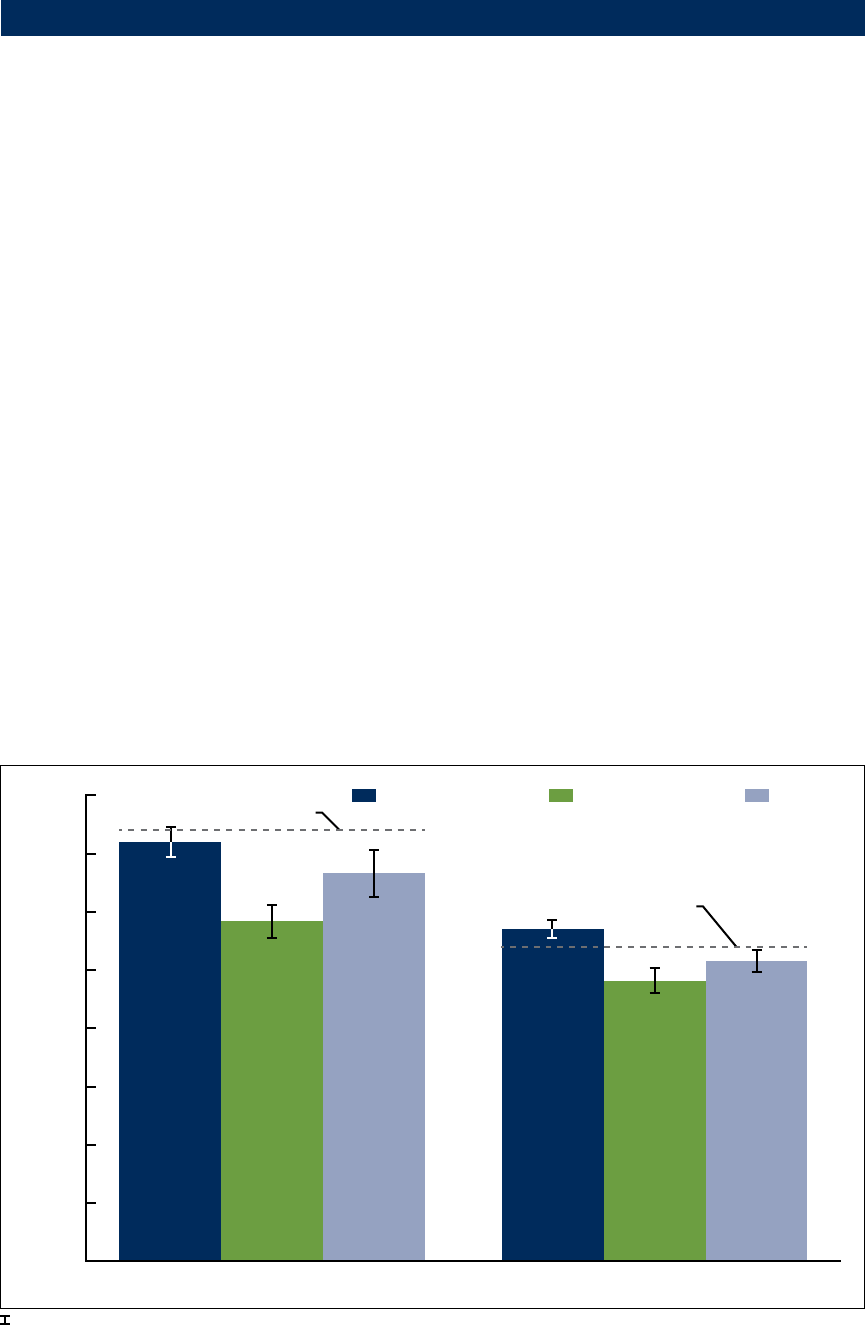
Non-Hispanic white men (3.60 L) and women (2.85 L) had the highest water intake, followed by
Hispanic men (3.33 L) and women (2.58 L), and non-Hispanic black men (2.92 L) and women
(2.41 L) (Figure 2).
Compared with adequate intake levels, non-Hispanic black men and women consumed 0.78 L and
0.29 L less than the IOM recommendations. Hispanic men and women had average water intakes
0.37 L and 0.12 L below their respective adequate intake levels. Non-Hispanic white men did not
differ signicantly from the adequate intake, while non-Hispanic white women consumed 0.15 L
more water than the adequate intake.
Figure 2. Mean total water intake per day among adults aged 20 and over, by sex and race and Hispanic origin:
United States, 2009–2012
95% confidence interval.
1
Significantly different from non-Hispanic black, p < 0.05.
2
Significantly different from Hispanic, p < 0.05.
NOTE: Access data table for Figure 2 at: http://www.cdc.gov/nchs/data/databriefs/db242_table.pdf#2.
SOURCE: CDC/NCHS, National Health and Nutrition Examination Survey, 2009–2012.
Total water intake (liters)
HispanicNon-Hispanic blackNon-Hispanic white
0.00
0.50
1.00
1.50
2.00
2.50
3.00
3.50
4.00
WomenMen
1,2
3.60
1,2
2.85
2
2.41
2.58
2
2.92
3.33
Adequate intake (3.7 liters)
Adequate intake (2.7 liters)
NCHS Data Brief
■
No. 242
■
April 2016
■ 3 ■
Were there differences in mean total water intake per day by physical
activity level among men and women?
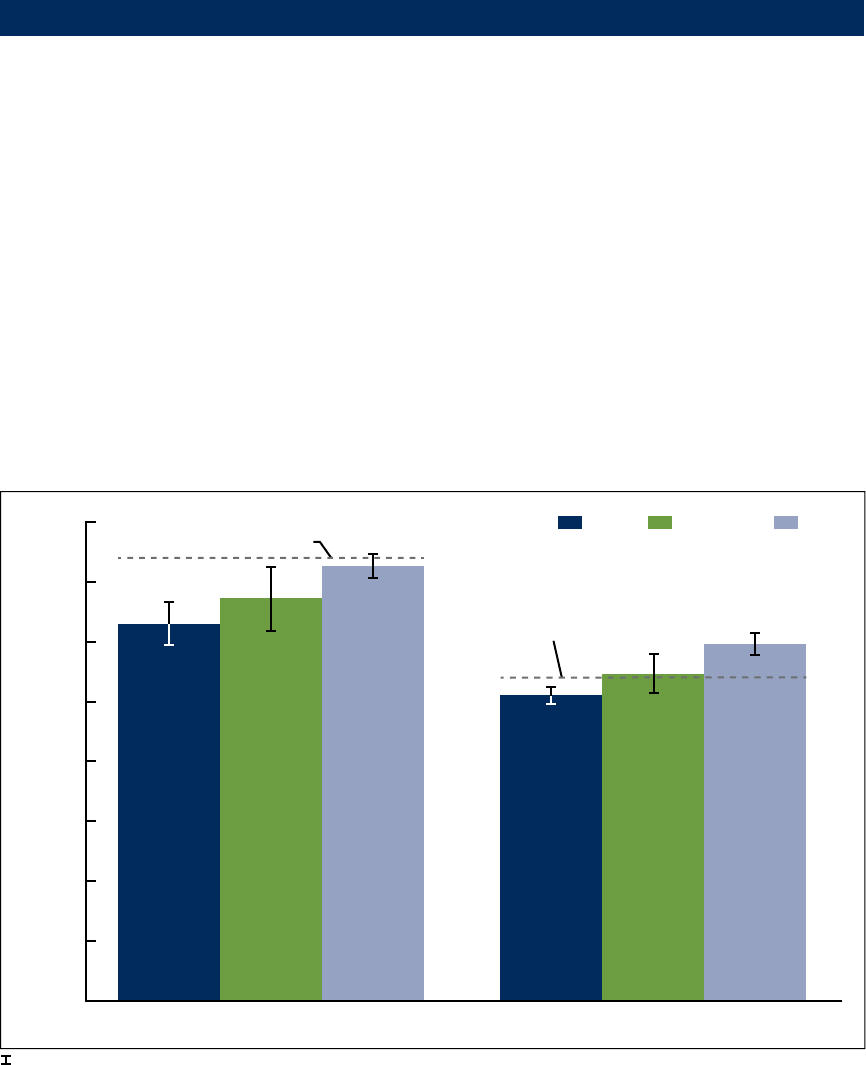
As physical activity level increased, mean total water intake per day increased for both men
and women. Men with low physical activity had the lowest total water intake per day (3.15 L),
followed by moderately active (3.36 L) and highly active (3.63 L) men (Figure 3). Similarly,
women with low physical activity had the lowest total water intake per day (2.55 L), followed by
moderately active (2.73 L) and highly active (2.98 L) women.
Men with low and moderate physical activity levels consumed an average total water intake
lower than the recommended adequate intake, while highly active men did not differ from the
recommendation. Highly active women consumed more total water than the recommended intake
for women, while women with low activity consumed slightly less than the recommendation, and
moderately active women did not differ from the recommendation.
Figure 3. Mean total water intake per day among adults aged 20 and over, by sex and physical activity level:
United States, 2009–2012
Total water intake (liters)
HighModerateLow
95% confidence interval.
1
Linear trend by physical activity status, p < 0.01.
NOTE: Access data table for Figure 3 at: http://www.cdc.gov/nchs/data/databriefs/db242_table.pdf#3.
SOURCE: CDC/NCHS, National Health and Nutrition Examination Survey, 2009–2012.
0.00
0.50
1.00
1.50
2.00
2.50
3.00
3.50
4.00
WomenMen
Adequate intake (3.7 liters)
Adequate intake (2.7 liters)
1
3.15
1
2.55
2.98
2.73
3.36
3.63
NCHS Data Brief
■
No. 242
■
April 2016
■ 4 ■
Were there differences between men and women in how much plain water
contributed to total water intake?
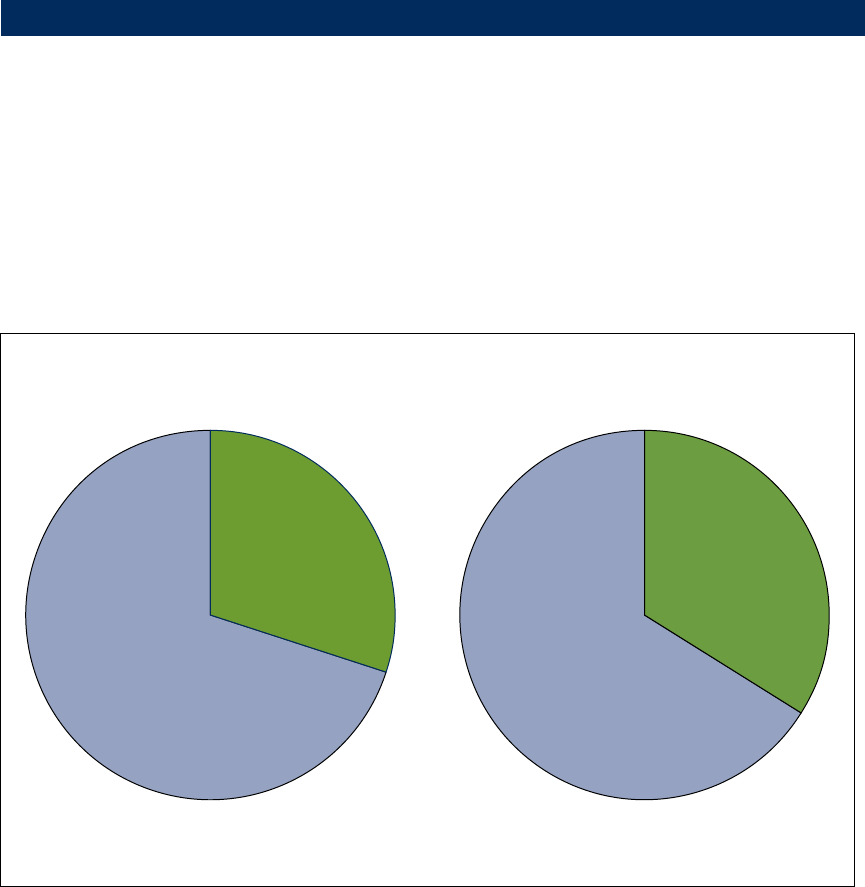
Men and women differed in how much plain water contributed to their total daily water intake.
Plain water contributed 30% of total water intake men consumed per day (Figure 4). The
remaining 70% of their water consumption came from other dietary foods and liquids. For
women, plain water made up 34% of total water intake, with the remaining 66% coming from
other dietary foods and liquids.
Figure 4. Plain water as percentage of total water intake among adults aged 20 and over, by sex: United States,
2009–2012
1
Significantly different from women, p < 0.01.
NOTE: Access data table for Figure 4 at: http://www.cdc.gov/nchs/data/databriefs/db242_table.pdf#4.
SOURCE: CDC/NCHS, National Health and Nutrition Examination Survey, 2009–2012.
Men Women
Plain water
1
30%
Other dietary water
70%
Other dietary water
66%
Plain water
34%

NCHS Data Brief
■
No. 242
■
April 2016
■ 5 ■
Summary
Overall in 2009–2012, the daily average total water intake from all foods and liquids among
U.S. adults aged 20 and over was 3.46 L for men, with 30% coming from plain water, and 2.75
L for women, with 34% coming from plain water. Total water intake was lower among men and
women aged 60 and over than among younger adults. Non-Hispanic black men and women had
the lowest average total water intake, similar to results from previous studies (5). For U.S. adults
aged 20 and over, total water intake increased with physical activity level.
Men’s average total water intake per day was approximately 0.25 L less than the recommended
adequate intake, whereas women’s intake was approximately the same as the adequate intake. On
average, men and women aged 60 and over, non-Hispanic black men and women, Hispanic men
and women, men and women with low physical activity, and men with moderate physical activity
consumed less than the adequate daily intake. Previous studies have shown that adults aged 60
and over are among the most vulnerable to dehydration (4,7). This report found that men aged 60
and over consumed 2.92 L, roughly 0.8 L less than the adequate intake, and women aged 60 and
over consumed 2.51 L, approximately 0.2 L less.
Denitions
Physical activity level: Summary of reported time spent in the previous week in moderate and
vigorous activities from biking or walking, work, and leisure activities. Low physical activity is
dened as less than 150 minutes of moderate or vigorous physical activity per week (8). Moderate
physical activity is dened as between 150 minutes and 300 minutes of moderate or vigorous
physical activity per week. High physical activity is dened as 300 minutes or more of moderate
or vigorous physical activity per week.
Total water intake: Determined by the 24-hour dietary recall interview in which respondents list
all foods and liquids consumed in the previous 24-hour period from midnight to midnight. Plain
water intake and moisture content calculated from foods and beverages is then summed in grams,
the equivalent of milliliters.
Data source and methods
Data from the National Health and Nutrition Examination Surveys (NHANES) for survey
years 2009–2010 and 2011–2012 were used for these analyses. NHANES is a cross-sectional
survey designed to monitor the health and nutritional status of the civilian noninstitutionalized
U.S. population (9). It is conducted by the Centers for Disease Control and Prevention’s (CDC)
National Center for Health Statistics. The survey combines in-home interviews conducted in the
participants’ homes and standardized physical examinations conducted in mobile examination
centers (MEC). For this report, data were collected through an in-person 24-hour dietary recall
interview in the MEC. Dietary recalls cover intake during the day (24 hours, midnight to
midnight) prior to the standardized physical examination in the MEC (10).
The NHANES sample is selected through a complex, multistage probability design. In
2009–2010 and 2011–2012, non-Hispanic black and Hispanic persons, among other groups,
were oversampled to obtain reliable estimates for these population subgroups. Race and Hispanic

NCHS Data Brief
■
No. 242
■
April 2016
■ 6 ■
origin categories reect individuals reporting only one race; those reporting “other” races and
more than one race are included in the total but are not reported separately.
Data were analyzed using the day 1 dietary sample weights to account for the days of the week,
differential probabilities of selection, nonresponse, and noncoverage. The standard errors of
total water intake were estimated using Taylor series linearization, a method that incorporates
the sample design. Ninety-ve percent condence intervals were used to assess whether
each subpopulation’s water intake on a given day included the adequate intake. Pregnant and
breastfeeding women were excluded from the analysis.
Differences between groups were evaluated using a univariate t statistic at the p < 0.05
signicance level. Test for trends by physical activity level was evaluated using linear regression,
and the signicance was set at p < 0.05. All differences reported are statistically signicant
unless otherwise indicated. Statistical analyses were conducted using Stata version 13.1 (College
Station, T.X.).
About the authors
Asher Rosinger is with CDC’s Epidemic Intelligence Service, assigned to the National Center for
Health Statistics (NCHS), Division of Health and Nutrition Examination Surveys. Kirsten Herrick
is also with NCHS’ Division of Health and Nutrition Examination Surveys.
References
1. Kleiner SM. Water: An essential but overlooked nutrient. J Am Diet Assoc 99(2):200–6.
1999.
2. Institute of Medicine. Dietary reference intakes for water, potassium, sodium, chloride, and
sulfate. Washington, DC: National Academies Press. 2004. Available from: http://www.nap.edu/
read/10925/chapter/1.
3. Grandjean AC, Grandjean NR. Dehydration and cognitive performance. J Am Coll Nutr
26(5 Suppl):549S–554S. 2007.
4. Popkin BM, D’Anci KE, Rosenberg IH. Water, hydration, and health. Nutr Rev 68(8):439–58.
2010.
5. Kant AK, Graubard BI, Atchison EA. Intakes of plain water, moisture in foods and beverages,
and total water in the adult US population—nutritional, meal pattern, and body weight correlates:
National Health and Nutrition Examination Surveys 1999–2006. Am J Clin Nutr 90(3):655–63.
2009.
6. Sebastian RS, Enns CW, Goldman JD. Drinking water intake in the U.S.: What we eat in
America, NHANES 2005–2008. Food Surveys Research Group Dietary Data Brief no 7. U.S.
Department of Agriculture. 2011.
7. Stookey JD. High prevalence of plasma hypertonicity among community-dwelling older
adults: Results from NHANES III. J Am Diet Assoc 105(8):1231–9. 2005.
8. HHS. Physical activity guidelines for Americans. 2008. Available from: http://www.health.
gov/paguidelines/pdf/paguide.pdf.

NCHS Data Brief
■
No. 242
■
April 2016
■ 7 ■
9. National Center for Health Statistics. National Health and Nutrition Examination Survey.
Questionnaires, datasets, and related documentation. Available from: http://www.cdc.gov/nchs/
nhanes/nhanes_questionnaires.htm.
10. National Center for Health Statistics. National Health and Nutrition Examination Survey:
Dietary interview component. Available from:
http://www.cdc.gov/nchs/data/nhanes/nhanes_09_10/dietaryrecall_f.pdf.
NCHS Data Brief
■
No. 242
■
April 2016
FIRST CLASS MAIL
POSTAGE & FEES PAID
CDC/NCHS
PERMIT NO. G-284
Suggested citation
Rosinger A, Herrick K. Daily water intake
among U.S. men and women, 2009–2012.
NCHS data brief, no 242. Hyattsville, MD:
National Center for Health Statistics. 2016.
Copyright information
All material appearing in this report is in
the public domain and may be reproduced
or copied without permission; citation as to
source, however, is appreciated.
National Center for Health
Statistics
Charles J. Rothwell, M.S., M.B.A., Director
Nathaniel Schenker, Ph.D., Deputy Director
Jennifer H. Madans, Ph.D., Associate
Director for Science
Division of Health and Nutrition
Examination Surveys
Kathryn S. Porter, M.D., M.S., Director
Ryne Paulose-Ram, Ph.D., Associate
Director for Science
For e-mail updates on NCHS publication
releases, subscribe online at:
http://www.cdc.gov/nchs/govdelivery.htm.
For questions or general information
about NCHS:
Tel: 1–800–CDC–INFO (1–800–232–4636)
TTY: 1–888–232–6348
Internet: http://www.cdc.gov/nchs
Online request form: http://www.cdc.gov/info/
ISSN 1941–4927 Print ed.
ISSN 1941–4935 Online ed.
DHHS Publication No. 2016–1209
CS263806
U.S. DEPARTMENT OF
HEALTH & HUMAN SERVICES
Centers for Disease Control and Prevention
National Center for Health Statistics
3311 Toledo Road, Room 5419
Hyattsville, MD 20782–2064
OFFICIAL BUSINESS
PENALTY FOR PRIVATE USE, $300
For more NCHS Data Briefs, visit:
http://www.cdc.gov/nchs/products/databriefs.htm.
